Sustainable Engineering Issues and Approaches - · PDF fileSustainable Engineering: Examples...
40
1 Sustainable Engineering Issues and Approaches Chris Hendrickson
Transcript of Sustainable Engineering Issues and Approaches - · PDF fileSustainable Engineering: Examples...
1
Sustainable Engineering Issues and Approaches
Chris Hendrickson
2
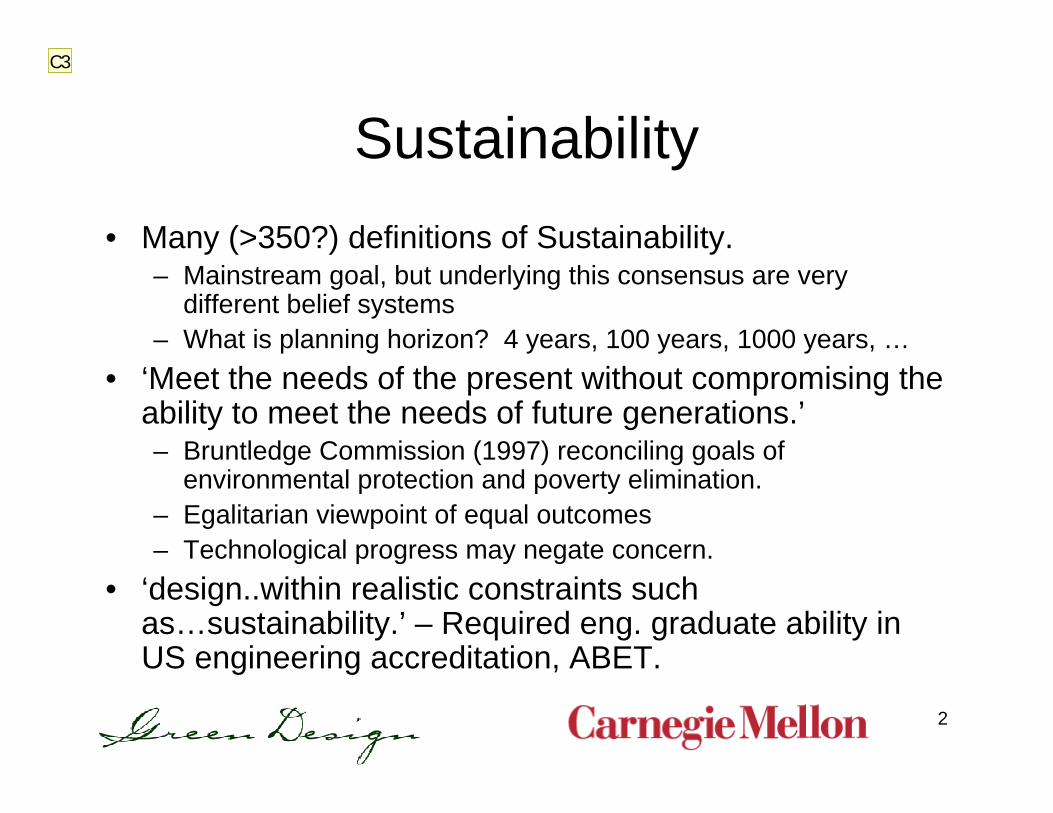
Sustainability• Many (>350?) definitions of Sustainability.
– Mainstream goal, but underlying this consensus are very different belief systems
– What is planning horizon? 4 years, 100 years, 1000 years, …• ‘Meet the needs of the present without compromising the
ability to meet the needs of future generations.’– Bruntledge Commission (1997) reconciling goals of
environmental protection and poverty elimination. – Egalitarian viewpoint of equal outcomes– Technological progress may negate concern.
• ‘design..within realistic constraints such as…sustainability.’ – Required eng. graduate ability in US engineering accreditation, ABET.
C3

Slide 2
C3 1. Bruntledge ReportChris Hendrickson, 8/23/2006
3
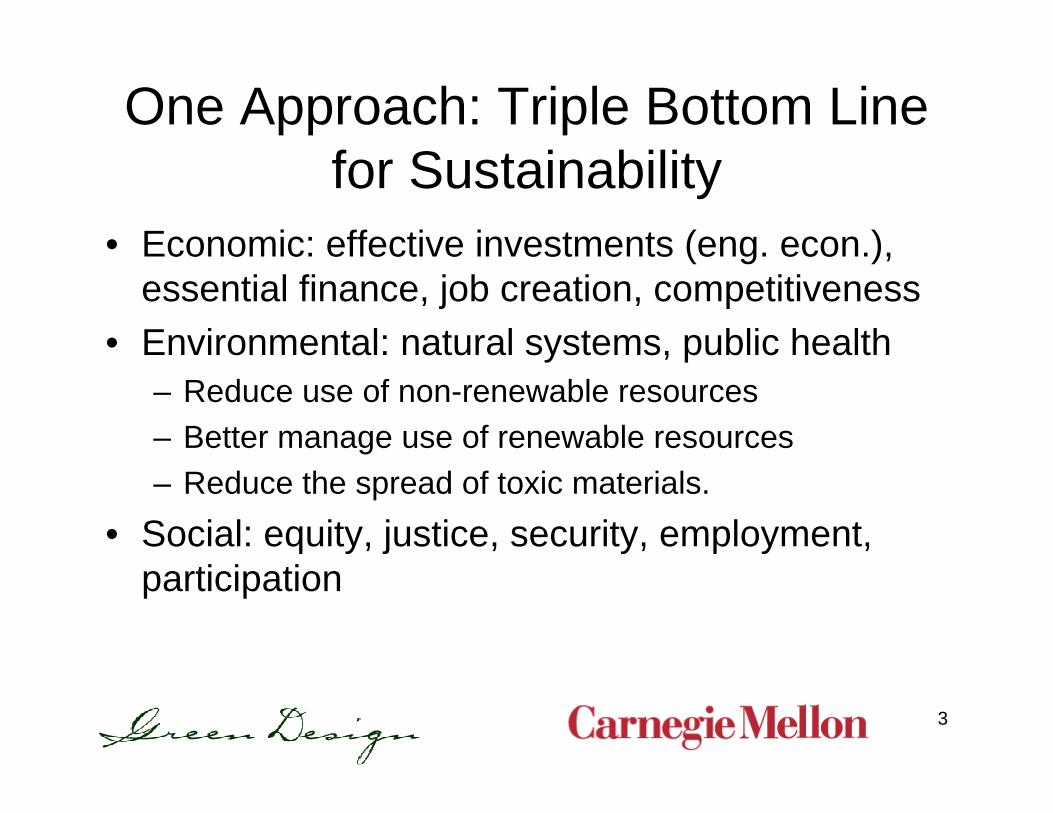
One Approach: Triple Bottom Line for Sustainability
• Economic: effective investments (eng. econ.), essential finance, job creation, competitiveness
• Environmental: natural systems, public health– Reduce use of non-renewable resources– Better manage use of renewable resources– Reduce the spread of toxic materials.
• Social: equity, justice, security, employment, participation
4
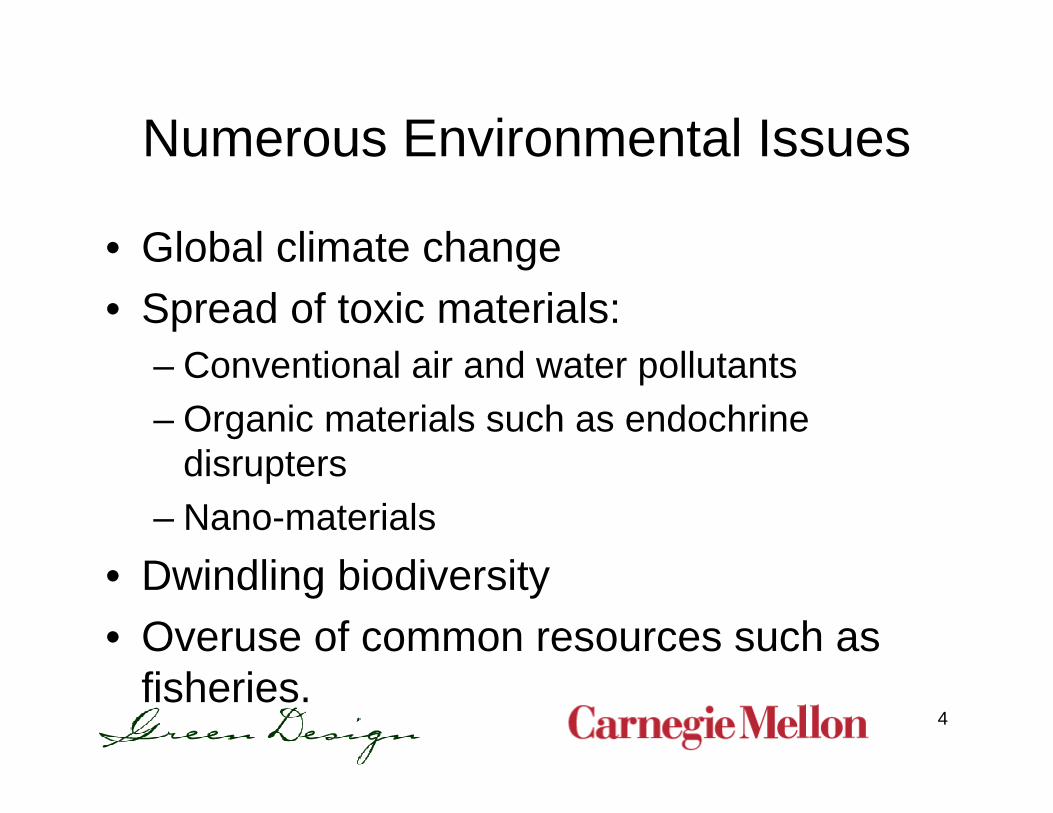
Numerous Environmental Issues
• Global climate change• Spread of toxic materials:
– Conventional air and water pollutants– Organic materials such as endochrine
disrupters– Nano-materials
• Dwindling biodiversity• Overuse of common resources such as
fisheries.

5
Grinnell Glacier, 1900-1998, Montana
Source: usgs

6
Triple Bottom Line Assessment Analytical Difficulties
• Multi-objective problem – many dimensions of impact.
• Valuation problems for many items.• Priorities differ among stakeholders (such
as stockholders…)• Trade-off and dominance analysis
relevant.• Role of precautionary principle – do not
risk irreparable harm.
7
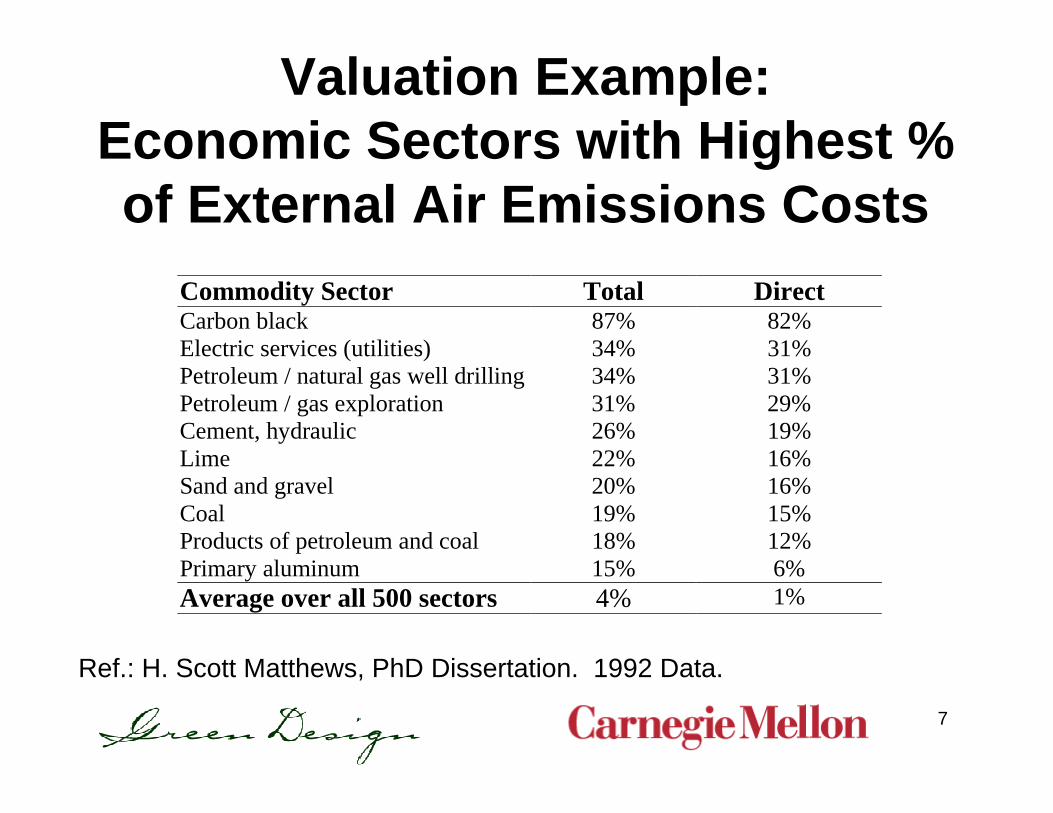
Valuation Example: Economic Sectors with Highest % of External Air Emissions Costs
Commodity Sector Total DirectCarbon black 87% 82%Electric services (utilities) 34% 31%Petroleum / natural gas well drilling 34% 31%Petroleum / gas exploration 31% 29%Cement, hydraulic 26% 19%Lime 22% 16%Sand and gravel 20% 16%Coal 19% 15%Products of petroleum and coal 18% 12%Primary aluminum 15% 6%Average over all 500 sectors 4% 1%
Ref.: H. Scott Matthews, PhD Dissertation. 1992 Data.
8
Sustainability Metric Examples
• Environmental: Greenhouse Gas Emissions, Primary Energy Use, Land Disruption.
• Social: Employment, Income, Government Revenue
• Financial: Profits, Export Potential, Import Penetration
• Source: Balancing Act: A Triple Bottom Line Analysis of the Australian Economy

9
Sustainable Engineering: Examples of Heuristics
• Energy reduction over lifecycle (correlation with many environmental indicators)
• Reduce packaging and other material waste over lifecycle
• Reduced use of toxics

10
Example: Power Tool Datalogger
Connectionto an LED fordata transmission
power supply
Connections to sensors

11
Datalogger Triple Bottom Line
• Permits profitable re-manufacturing to replace loss making recycling.
• Develops information on tool use.• Reduces material use overall.• Creates new low-cost tool option.• No privacy issues raised (unlike autos!)• Must balance cost of datalogger versus
benefits – return rate of used power tools is critical.

12
Coming Sustainable Engineering Information Technology
• Structural health monitoring.• Toll collection and infraction identification.• Operational monitoring and improvement.• Multi-tasking: wireless communications.• Quality and security monitoring.• Etc.
Power Tool Datalogger Primitive by Comparison

13
Life Cycle Perspective
• Products may exist for a long period of time (e.g. infrastructure)
• Products and services may have substantial (global) supply chain.
• Focusing upon one life cycle phase can be misleading – minimizing design or construction costs can increase life cycle costs, even when discounted.
14
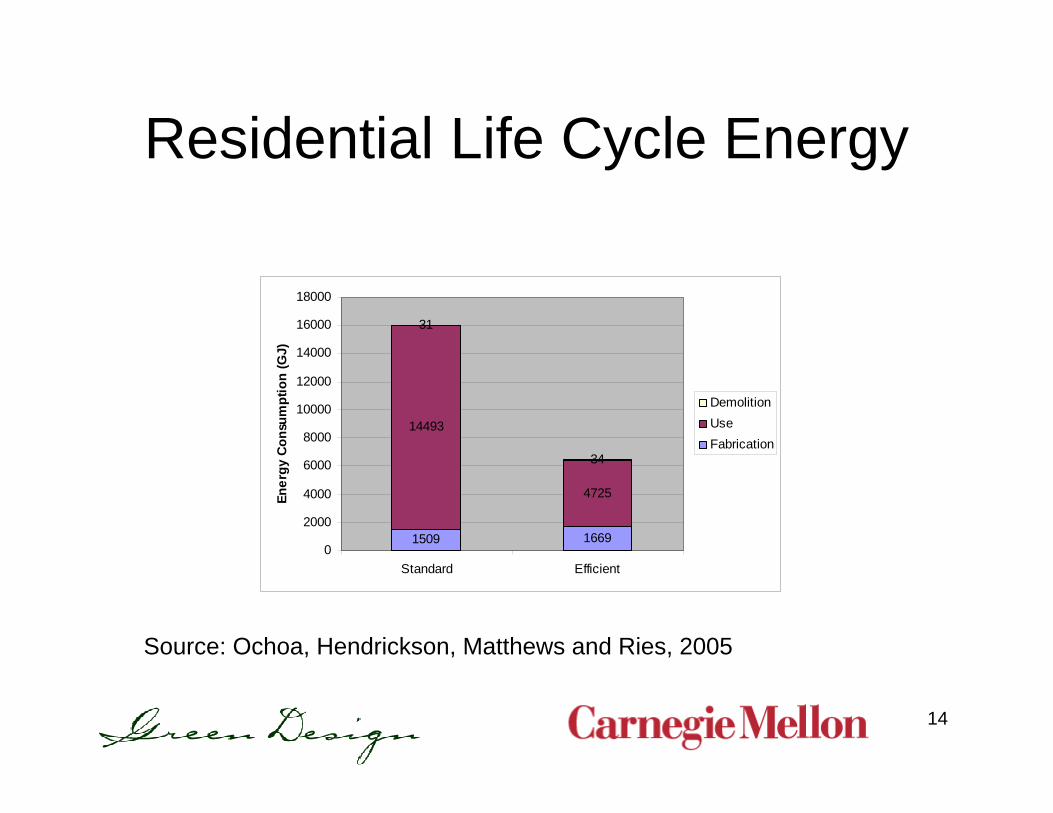
Residential Life Cycle Energy
1509 1669
14493
4725
31
34
0
2000
4000
6000
8000
10000
12000
14000
16000
18000
Standard Efficient
Ener
gy C
onsu
mpt
ion
(GJ)
DemolitionUseFabrication
Source: Ochoa, Hendrickson, Matthews and Ries, 2005
15
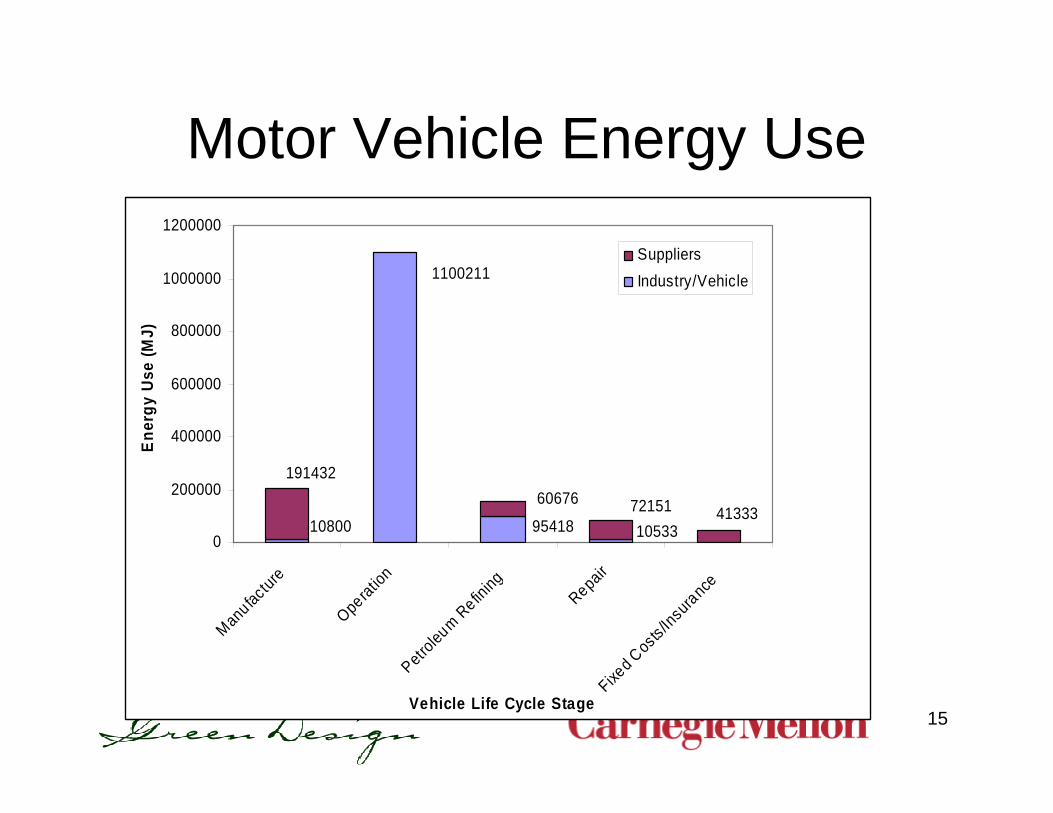
Motor Vehicle Energy Use
1053310800 95418
1100211
413337215160676191432
0
200000
400000
600000
800000
1000000
1200000
Manufac
ture
Operatio
nPetro
leum R
efining
Repair
Fixed C
osts/In
suranc
e
Vehicle Life Cycle Stage
Ene
rgy
Use
(MJ)
SuppliersIndustry/Vehicle

16
Life Cycle AnalysisExtraction to End of Disposal
Need to Account for Indirect Inputs

17
Some Tools (Continued)
• Triple bottom line assessments (multi-objective optimization)
• Life Cycle Analysis• Design heuristics and standards.• Wider range of design alternatives (not a
tactic limited to sustainable engineering, of course…)– New technology (datalogger, new materials)– Alternative approaches (different modes)

18
Example: Producing Electricity in Remote Locations
• 52% of electricity is produced from coal• Coal deposits are generally not close to
electricity demand• The Powder River Basin produces more
that 1/3 of U.S. coal, 350 million tons shipped by rail up to 1,500 miles
• Should PRB coal be shipped by rail?
19
Alternative Shipment Methods
• Coal by rail• Coal by truck or waterways (non-starters!)• Coal to electricity and ship by wire• Coal to gas and ship by pipeline• Coal to gas and ship by wire• Beyond scope of example: move demand,
reduce demand, alternative energy sources

20
Wyoming to Texas Coal Transport

21
0
200,000
400,000
600,000
800,000
1,000,000
1,200,000
1,400,000
1,600,000
1,800,00019
90
1991
1992
1993
1994
1995
1996
1997
1998
1999
2000
2001
2002
2003
Year
Frei
ght (
mill
ion
ton-
mile
s)
TruckRailroad
US Freight Traffic is Increasing
22
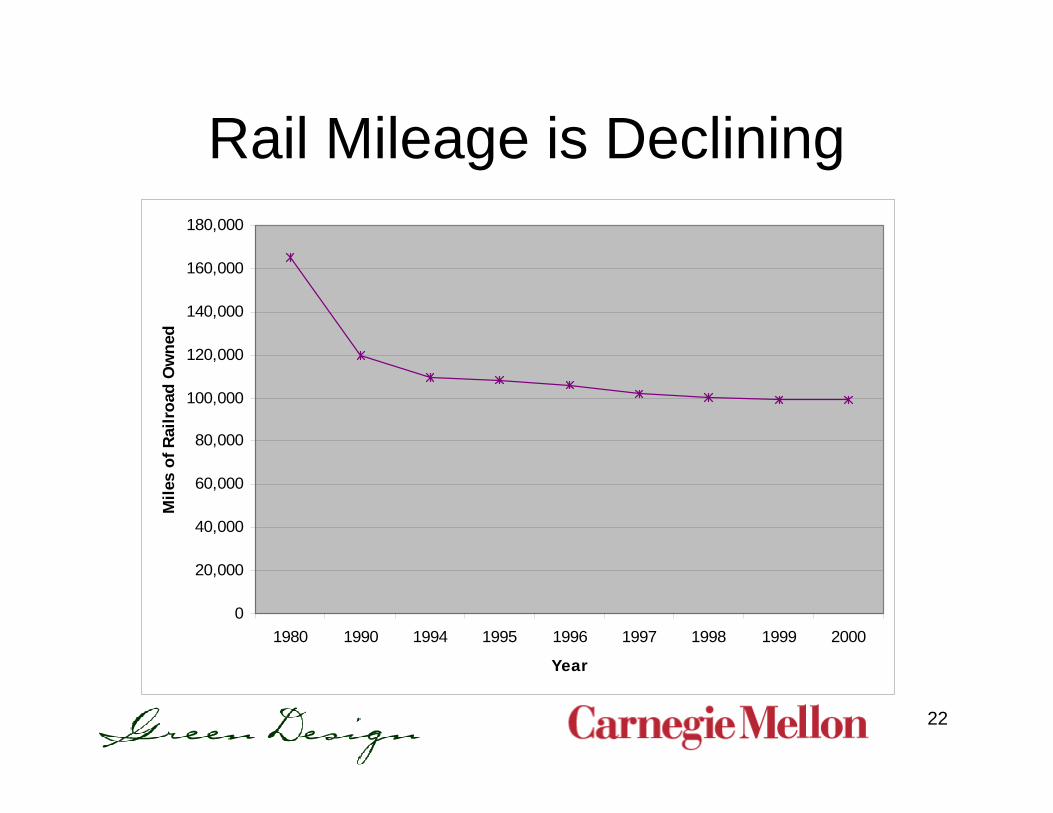
Rail Mileage is Declining
0
20,000
40,000
60,000
80,000
100,000
120,000
140,000
160,000
180,000
1980 1990 1994 1995 1996 1997 1998 1999 2000
Year
Mile
s of
Rai
lroa
d O
wne
d

23
Leading to Heavier Use and Productivity per Rail Mile
0
20
40
60
80
100
120
140
16019
90
1991
1992
1993
1994
1995
1996
1997
1998
1999
2000
2001
2002
2003
2004
Rela
tive
Chan
ge (1
990=
100)
Truck (ton-mi)Railroad (ton-mi)Roadway lane-milesTrack rail-miles

24
Transporting Energy from WY to Texas: All New Infrastructure
0
50
100
150
200
250
300
350
400
450
Capital O&M Fuel Externalities Total
Ann
ual C
ost (
$mill
ion)
Coal by Rail Coal by Wire Coal to Gas by Pipeline Coal to Gas by Wire
Annual Cost ($millions

25
Shipping Energy Conclusions
• If infrastructure exists (rail lines), then it is best to use it.
• For new investment, alternatives to rail can be attractive but involve trade-offs.
26
Some Other Common Tools (Continued)
• Materials flow analysis• Appropriate boundary setting.• Risk and uncertainty analysis.• Life cycle cost analysis.

27
What can be done to promote sustainability?
• Policy• Education• Research• Local Action• Personal Action

28
Some Policy Examples
• Fuel economy requirements and incentives – 25% cut in CO2 emissions proposed in EU.
• Higher density development and Brownfields re-development
• Toxics emissions and water use reporting and regulation.
• Full cost pricing: water, energy, …• Green buildings
29
Sustainability Engineering Education Approaches
• Dedicated Engineering Courses: Two semester sequence for entry level grads or senior undergrads offered through CEE/EPP at Carnegie Mellon.
• Dedicated Non-Engr. Courses: “Environment and Technology” for undergraduate non-engineers.
• Modules: “Introduction to Environmental Engineering” introduces sustainability.
30
Center for Sustainable Engineering
• Arizona State Univ. (Brad Allenby), Carnegie Mellon (Cliff Davidson) and U. Texas, Austin (David Allen) with EPA/NSF Funding
• Benchmarking of existing educational activity.• Development of educational materials• Workshops: 62 faculty & 40 schools at 2006
workshops in Pittsburgh; 7/07 workshops in Austin.
• Website and email list

31
Some Research Examples
• Re-use and recycling of goods.• Alternative fuels and power generation.• Energy efficient buildings.• Carbon sequestration.• New Technology (bio-materials,
information technology, etc.)
32
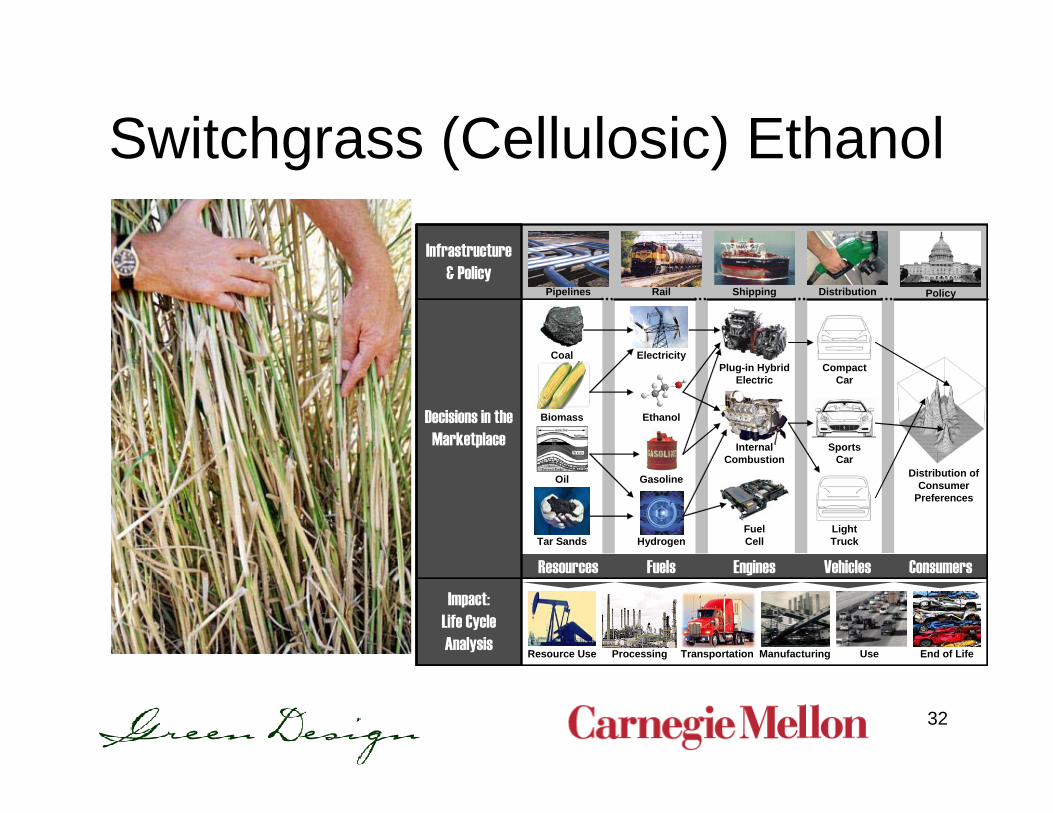
Switchgrass (Cellulosic) Ethanol
Distribution of Consumer
Preferences
Compact Car
Sports Car
Light TruckHydrogen
Gasoline
EthanolBiomass
Oil
Tar Sands
Plug-in Hybrid Electric
Internal Combustion
Fuel Cell
DistributionPipelines
Manufacturing Use End of Life
Rail Shipping
ProcessingResource Use Transportation
Coal Electricity
Vehicles ConsumersEnginesFuelsResources
Infrastructure& Policy
Decisions in the Marketplace
Impact:Life Cycle Analysis
Policy

33
Wairakei Geothermal Plant, New Zealand

34
Local Action: Carnegie Mellon
35
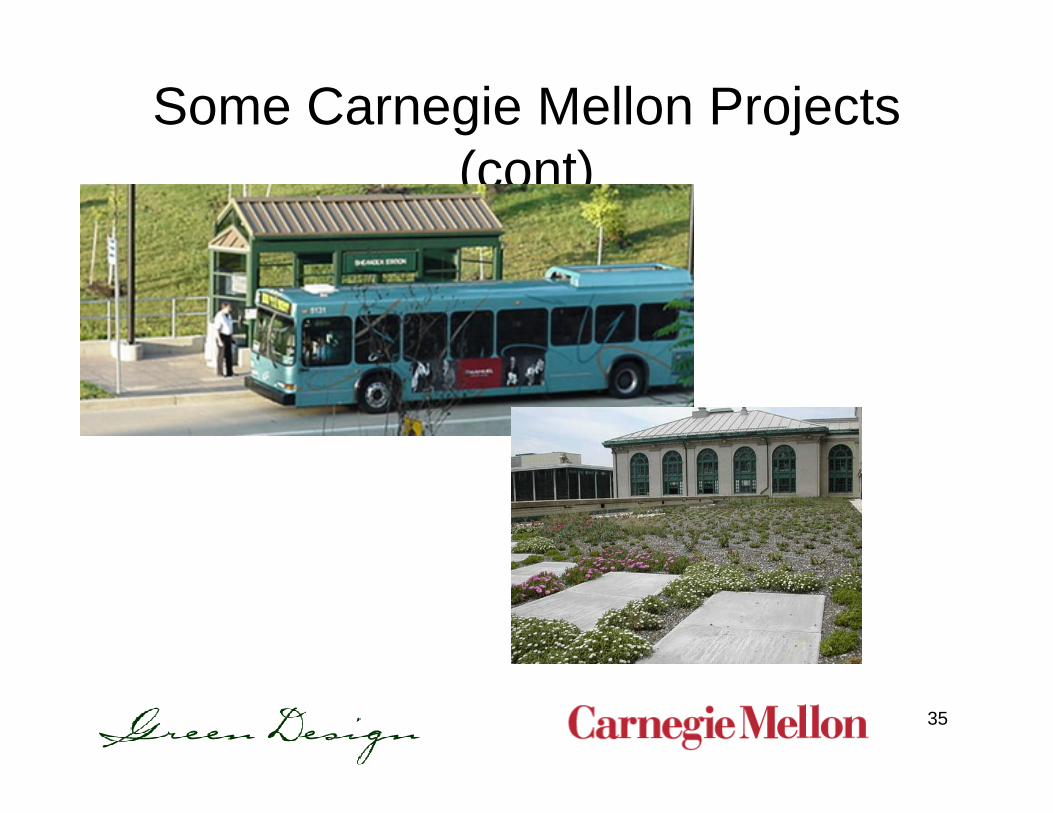
Some Carnegie Mellon Projects (cont)

36
Personal Action
• A wide range of possible responses, including self-sufficient farms.
• Some (relatively) easy actions:– Walk, bike, or ride, don’t drive.– Forgo more material possessions.– Support sustainable policies.

37
What is slowing sustainability?
• Ignorance of methods and the implications of our actions: e.g. climate change debate, ecosystem limits.
• Reaction time: political and social changes slower than technology or economy.
• Difficult trade-offs among competing interests: e.g. wind power nimby

38
Conclusions
• Promoting sustainable engineering is not really startlingly new, but does require some new perspectives.
• Triple bottom line assessment: economic, environmental, social
• Life cycle perspective essential• Challenges should not lead to paralysis.
39
Some Resources• Center for Sustainable Engineering (ASU,
Carnegie Mellon, Texas): http://www.csengin.org/
• Carnegie Mellon Green Design Institute: www.gdi.ce.cmu.edu
• Input-Output Life Cycle Assessment: website at www.eiolca.net. Book: Environmental Life Cycle Assessment of Goods & Services: An Input-Output Approach, 2006. (RFF Discount Code: EGX)