Sustainable Development Model from an economic, social ...
257
Sustainable Development Model from an economic, social, and agroecological perspective in the Amazon Region: A case study of Yantzaza, Ecuador Dissertation for Awarding the Academic Degree Doctor rerum silvaticarum (Dr. rer. silv) Submitted by Econ. Gonzalo Leonardo Izquierdo Montoya Date and Place of Birth: February 2, 1984, Loja, Ecuador Supervisor 1 Prof. Dr. rer. silv. Norbert Weber Technische Universität Dresden, Institute of Forest Economics and Forest Management Supervisor 2 Prof. Dr. rer. silv. Jürgen Pretzsch, Technische Universität Dresden, Institute of International Forestry and Forest Products Supervisor 3 Prof. Dr. rer. silv. Dietrich Darr Rhein-Waal University of Applied Sciences, Faculty of Life Sciences Tharandt, Dresden Date of Submission: July 2017 Faculty of Environmental Sciences
Transcript of Sustainable Development Model from an economic, social ...

Sustainable Development Model from an economic, social, and agroecological perspective in the Amazon Region: A case study of Yantzaza, Ecuador
Dissertation for Awarding the Academic Degree
Doctor rerum silvaticarum (Dr. rer. silv)
Submitted by
Econ. Gonzalo Leonardo Izquierdo Montoya
Date and Place of Birth: February 2, 1984, Loja, Ecuador
Supervisor 1 Prof. Dr. rer. silv. Norbert Weber Technische Universität Dresden, Institute of Forest Economics and Forest Management
Supervisor 2 Prof. Dr. rer. silv. Jürgen Pretzsch, Technische Universität Dresden, Institute of International Forestry and Forest Products
Supervisor 3 Prof. Dr. rer. silv. Dietrich Darr Rhein-Waal University of Applied Sciences, Faculty of Life Sciences
Tharandt, Dresden
Date of Submission: July 2017
Faculty of Environmental Sciences

Initiator of the thesis:
Prof. Dr. agr., Dr. rer. silv. Franz Makeschin Technische Universität Dresden, Institute of soil science and site ecology
i
Declaration:
I, Gonzalo Izquierdo Montoya hereby declare that this PhD thesis entitled “Sustainable Development Model from economic, social, agro ecological perspective in the Amazon Region: A case of study of Yantzaza-Ecuador” is my own original work and all other sources of information used are duly acknowledged. This thesis and any parts of it have never been submitted to any other university for any academic award
Gonzalo Izquierdo Montoya
Dresden, July 2017
ii
Acknowledgements
This research was performed thanks to the data gathering that was carried out in the Province of Zamora Chinchipe, in the south of the Ecuadorian Amazon, i.e. specifically the Yantzaza canton from 2012 to 2013. In addition, other work was executed with the local communities during the outreach and knowledge exchange process in 2015. I would like to thank all the institutions and all the individuals who collaborated in the development of this work and enabled its success.
I dedicate this work to Prof. Dr. Franz Makeschin, who has been unwavering in his support since we first met. His undivided attention, as well as continual help, motivation, life example and supervision and monitoring, along with his vast experience, have enabled us to crystallize the work that exists here as evidence.
I am very grateful to Professor Makeschin for the valuable lessons I obtained at the Institute of soil science and site ecology at the Technical University of Dresden and to the team from this institute who were my colleagues and friends during my stay in Germany for several years. During this time, I had to participate in courses, classes and research activities. At the same institution, I also owe a big thanks to Prof. Dr. Jürgen Pretzsch and the Institute of International Forestry and Forest Products who contributed to my training.
Above all, I would like to thank Dr. Etienne Bahr who, besides being an excellent companion at the Institute, was the person who accompanied me during the whole time of my stay in Germany. He knew how to guide me in both personal and professional matters that many times were difficult and complicated. He was a permanent guide and a person who became my very dear friend.
I also would like to extend a heartfelt thanks to Prof. Dr. Franz Heidhues and to the University of Hohenheim who supported my work, and accepted me in their classrooms to enhance my knowledge and allowed me to learn from their extensive experience. My thanks especially go to Professor Heidhues, who supported me during the early stages of my work by providing wisdom and constructive comments.
In addition, I am very grateful to Prof. Dr. Norbert Weber, who took a remarkable role in overseeing this research work. Prof. Weber, with his experience, succeeded in directing this thesis in an appropriate and dedicated manner. Thanks to him, we were able to achieve the proposed goals and the scope of the project that were determined from the beginning, I reiterate my warmest thanks. In addition, I want to take the opportunity to show my appreciation to the teachers who reviewed this work, Prof. Dr. Jürgen Pretzsch and Prof. Dr. Dietrich Darr. They brought experience and wisdom in reviewing thesis.
I would also like to thank the German Scientific Research Foundation, or DFG (Deutsche Forschungsgemeinschaft), which financed part of this research. It allowed me to continue my Ph.D. program in Germany and also have the opportunity to share my knowledge and experience with researchers from the field related to sustainability issues.
Another group of great importance to thank is the Department of Economics at the Private Technical University of Loja, (UTPL), Ecuador, which is my Alma Mater. I thank them for having trusted me for allowing me to carry out my research activities. My thanks especially go to our former Rector Dr. Luis Miguel Romero and our current Rector Dr. José Barbosa Corbacho, who allowed my dream to come true -- my dream that is not only related to these
iii
Ph.D. studies, but also to the model that our institution has adopted and continues to develop successfully.
It is also important to mention the research group that was formed between the Technical University of Dresden and the Private Technical University of Loja with Etienne Bahr, Karin Potthast, Ute Hamer, Alex Tischer, Diego Chamba, Byron Flores, Ivonne Benitez, Alex Gahona and others.
I cannot forget to mention the people who collaborated in the development of this research, related to the Municipality of Yantzaza, as well as public sector entities and private organizations. My thanks also go to the ECOLAC dairy company, which has helped me to gather together the farmers and allow this work to become a reality.
Finally, and, in a very special way, I thank the native farmers of the diverse rural communities of the Amazon, such as Yantzaza, Chicaña and Los Encuentros, who helped with this work during a period of 4 years. They have given me a unique example from their field. They always provided kind support and they have always been open to working together.
This work has also been the catalyst of a great institutional support program, which was started by the Private Technical University of Loja called "SmartLand". This program is related with the sustainable development of the Ecuadorian Amazon, especially in the south. It also helped with the results of this thesis and with many other projects. In this way, the results did not only remain on paper, but transcended to other areas that really required our support. UTPL has twelve case studies related with this project. Various sectors will be the object of a future study and a kind of transfer of knowledge and permanent technology.
iv
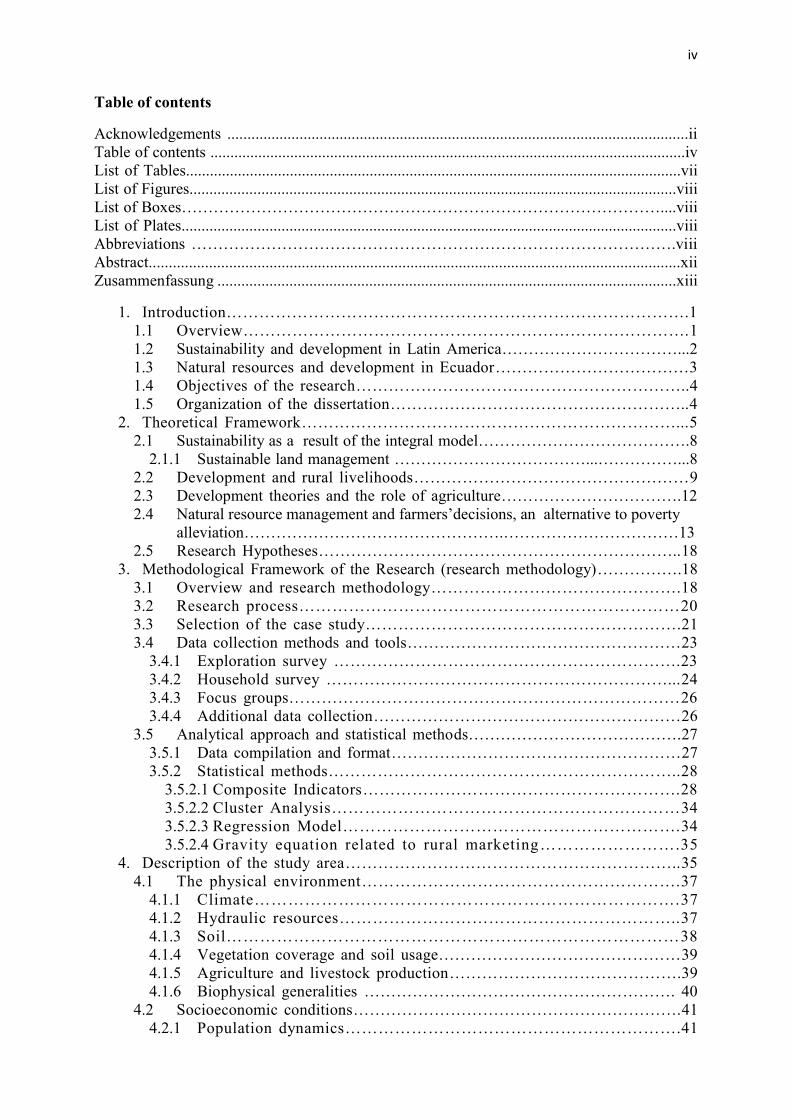
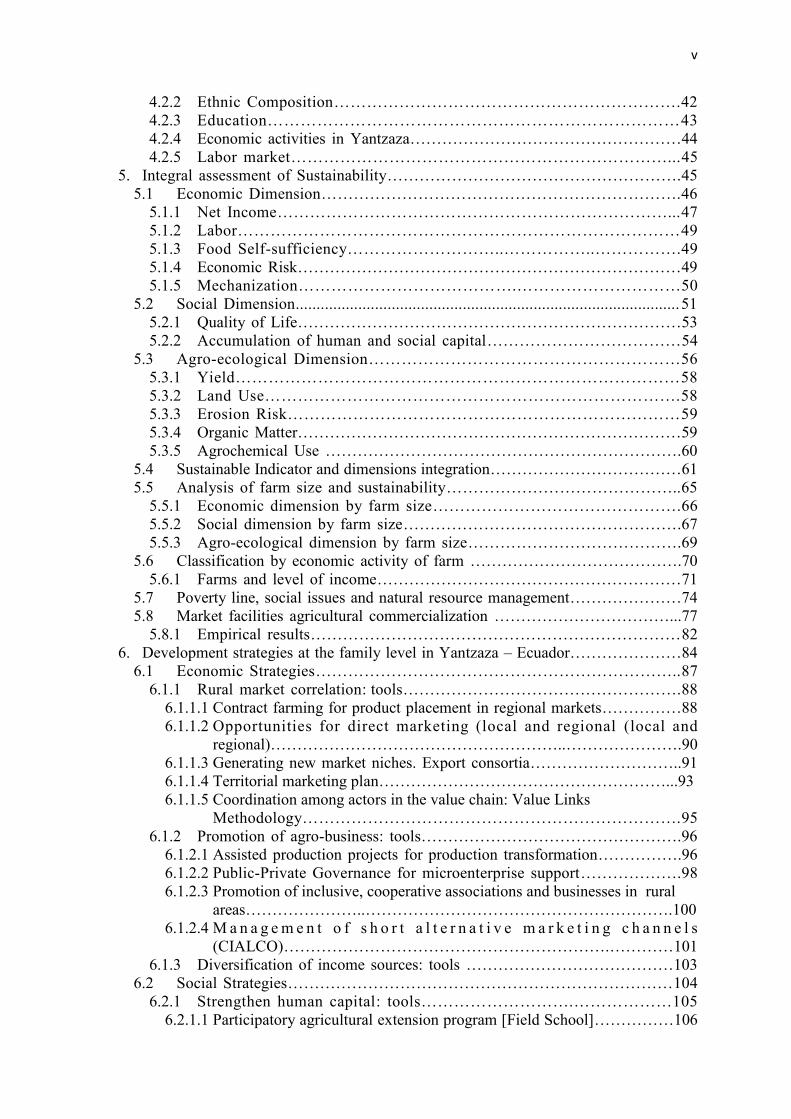
Table of contents
Acknowledgements ...................................................................................................................ii Table of contents .......................................................................................................................iv List of Tables............................................................................................................................vii List of Figures..........................................................................................................................viii List of Boxes………………………………………………………………………………....viii List of Plates............................................................................................................................viii Abbreviations ……………………………………………………………………………….viii Abstract....................................................................................................................................xii Zusammenfassung ...................................................................................................................xiii
1. Introduction………………………………………………………………………….1 1.1 Overview……………………………………………………………………….1 1.2 Sustainability and development in Latin America……………………………...2 1.3 Natural resources and development in Ecuador………………………………3 1.4 Objectives of the research……………………………………………………..4 1.5 Organization of the dissertation………………………………………………..4
2. Theoretical Framework……………………………………………………………...5 2.1 Sustainability as a result of the integral model………………………………….8
2.1.1 Sustainable land management ………………………………...……………...8 2.2 Development and rural livelihoods……………………………………………9 2.3 Development theories and the role of agriculture…………………………….12 2.4 Natural resource management and farmers’decisions, an alternative to poverty
alleviation………………………………………….……………………………13 2.5 Research Hypotheses…………………………………………………………..18
3. Methodological Framework of the Research (research methodology)…………….18 3.1 Overview and research methodology……………………………………….18 3.2 Research process……………………………………………………………20 3.3 Selection of the case study………………………………………………….21 3.4 Data collection methods and tools……………………………………………23
3.4.1 Exploration survey ……………………………………………………….23 3.4.2 Household survey ………………………………………………………...24 3.4.3 Focus groups………………………………………………………………26 3.4.4 Additional data collection…………………………………………………26
3.5 Analytical approach and statistical methods………………………………….27 3.5.1 Data compilation and format………………………………………………27 3.5.2 Statistical methods………………………………………………………..28
3.5.2.1 Composite Indicators………………………………………………….28 3.5.2.2 Cluster Analysis………………………………………………………34 3.5.2.3 Regression Model…………………………………………………….34 3.5.2.4 Gravity equation related to rural marketing…………………….35
4. Description of the study area……………………………………………………..35 4.1 The physical environment………………………………………………….37
4.1.1 Climate………………………………………………………………….37 4.1.2 Hydraulic resources……………………………………………………..37 4.1.3 Soil………………………………………………………………………38 4.1.4 Vegetation coverage and soil usage………………………………………39 4.1.5 Agriculture and livestock production…………………………………….39 4.1.6 Biophysical generalities …………………………………………………. 40
4.2 Socioeconomic conditions…………………………………………………….41 4.2.1 Population dynamics…………………………………………………….41
v
4.2.2 Ethnic Composition……………………………………………………….42 4.2.3 Education…………………………………………………………………43 4.2.4 Economic activities in Yantzaza……………………………………………44 4.2.5 Labor market……………………………………………………………...45
5. Integral assessment of Sustainability……………………………………………….45 5.1 Economic Dimension………………………………………………………….46
5.1.1 Net Income………………………………………………………………...47 5.1.2 Labor………………………………………………………………………49 5.1.3 Food Self-sufficiency………………………..……………..…………….49 5.1.4 Economic Risk………………………………………………………………49 5.1.5 Mechanization………………………………….…………………………50
5.2 Social Dimension............................................................................................51 5.2.1 Quality of Life………………………………………………………………53 5.2.2 Accumulation of human and social capital………………………………54
5.3 Agro-ecological Dimension…………………………………………………56 5.3.1 Yield………………………………………………………………………58 5.3.2 Land Use………………………………………………………………….58 5.3.3 Erosion Risk………………………………………………………………59 5.3.4 Organic Matter………………………………………………………………59 5.3.5 Agrochemical Use ………………………………………………………….60
5.4 Sustainable Indicator and dimensions integration………………………………61 5.5 Analysis of farm size and sustainability……………………………………..65
5.5.1 Economic dimension by farm size……………………………………….66 5.5.2 Social dimension by farm size…………………………………………….67 5.5.3 Agro-ecological dimension by farm size………………………………….69
5.6 Classification by economic activity of farm ………………………………….70 5.6.1 Farms and level of income…………………………………………………71
5.7 Poverty line, social issues and natural resource management…………………74 5.8 Market facilities agricultural commercialization ……………………………...77
5.8.1 Empirical results……………………………………………………………82 6. Development strategies at the family level in Yantzaza – Ecuador…………………84
6.1 Economic Strategies…………………………………………………………..87 6.1.1 Rural market correlation: tools…………………………………………….88
6.1.1.1 Contract farming for product placement in regional markets……………88 6.1.1.2 Opportunities for direct marketing (local and regional (local and
regional)………………………………………………..………………….90 6.1.1.3 Generating new market niches. Export consortia………………………..91 6.1.1.4 Territorial marketing plan………………………………………………...93 6.1.1.5 Coordination among actors in the value chain: Value Links
Methodology…………………………………………………………….95 6.1.2 Promotion of agro-business: tools………………………………………….96
6.1.2.1 Assisted production projects for production transformation…………….96 6.1.2.2 Public-Private Governance for microenterprise support……………….98 6.1.2.3 Promotion of inclusive, cooperative associations and businesses in rural
areas…………………..………………………………………………….100 6.1.2.4 M a n a g e m e n t o f s h o r t a l t e r n a t i v e m a r k e t i n g c h a n n e l s
(CIALCO)…………………………………………………….…………101 6.1.3 Diversification of income sources: tools …………………………………103
6.2 Social Strategies………………………………………………………………104 6.2.1 Strengthen human capital: tools……………………….………………105
6.2.1.1 Participatory agricultural extension program [Field School]……………106

vi
6.2.1.2 Territorial economic information system at provincial level…107 6.2.1.3 Productive integration and logistics……………………………………..109 6.2.1.4 Continuous distance training program for rural farmers………………..110 6.2.1.5 Personal agency program and intrinsic empowerment
(community health developers)…………………………………………..112 6.2.2 Social and institutional link: tools………………………………………113
6.2.2.1 Partnership of Public-Private (Rural Territorial Development Forum, FTDR)…………………………………………114
6.2.2.2 Methodology SUMA for strengthening grassroots organizations………. 115 6.2.2.3 Participatory process methodology of agricultural innovation………..….117
6.3 Environmental and agro-ecological strategies of the area…………………... 118 6.3.1 Boosting territorial systems……………………………………………...…119
6.3.1.1 Promoting a territorial management plan in Yantzaza through the use of participatory methods while including rural communities……119
6.3.2 Improving conservation practices……………………………………….….121 6.3.2.1 Improving the physical-chemical soil characteristics
(conservation practices)………………………………………………….121 6.3.2.2 Improved management of agro-forest systems …………………………124 6.3.2.3 Strengthening water conservation………………………………….…126 6.3.2.4 Training in the preparation of organic fertilizers………………………128
6.3.3 Training producers………………………………………………………….130 6.3.3.1 Promote cooperative projects between universities and research institutes to
transfer knowledge and technologies associated with land management. (SmartLand 2014)…………………………………….………………….130
6.3.3.2 Coordinate a participatory conservation practices plan of natural resources (crop rotation, food safety, harvesting, post-harvest product processing)…………….…………………………………………………133
7. Participatory knowledge and technology transfer methods in the context of integrated natural resource management……….……………………………………134
7.1 Yantzaza’s experiences in participatory research approaches…………………136 7.2 Local Communities as learning organizations. (Yantzaza,
Los Encuentros and Chicaña)..............................................................................144 7.3 Yantzaza as a “learning organization”…………………………………………146
7.3.1 Acquisition of knowledge………………………………………………….146 7.3.2 Dissemination of knowledge………………………………………………147 7.3.3 Utilization of Knowledge…………………………………………………148 7.3.4 External factors………………………………………………………….150
8. Discussion and Conclusions………………………………………………………151 8.1 Recapitulation of major results………………………………………………151 8.2 Research Findings…………………………………………………...................153
8.2.1 Integrated assessment of Sustainability: Findings………………………….153 8.2.2 Strategies for the development of farming systems…………………………157 8.2.3 Linking participatory research with transfer methods……………………158
8.3 How does the current research contribute to the international discussion on Sustainable Development nowadays?.................................................................159
8.4 Suggestions for Further Research……………………………………………162 9. References…………………………………………………………………………163 10. Appendices…………………………………………………………………………195 11. Illustrations………………………………………………………………………..235

vii
List of Tables
Table 3.1: Participatory Learning Action (PLA)………………………………………..21 Table 3.2: In ternat ional framework for the evaluat ion of sustainable land
management……………………………………………………………….29 Table 3.3: Indicators of Sustainability. Definitions and Significance ………………….31 Table 4.1: Soil utilization according to the UMDS of the Municipality of Yantzaza……39 Table 4.2: Principle crops, costs and management………………………………………40 Table 4.3: Yantzaza’s Population……………………………………………………..…41 Table 4.4: Yantzaza canton’s urban and rural population……………………………….42 Table 4.5: Rural population expressed by parishes……………………………………..42 Table 4.6: Population by sex …………………………………………………………….42 Table 4.7: Self identification according to culture and customs………………………..43 Table 4.8: Population’s educational level……………………………………………….44 Table 4.9: Yantzaza canton’s economic activities……………………………………….44 Table 5.1: Pearson correlation coefficients (Economic Dimension)……………………..46 Table 5.2: Economic dimension indicators and its appropriate values
of sustainability………………………………………………………………. 47 Table 5.3: Social dimension indicators and their appropriate values of sustainability ….52 Table 5.4: Pearson correlation coefficients (Social Dimension)……………………….. 53 Table 5.5: Agro-ecological dimension indicators and their appropriate
values of sustainability……………………………………………………….. 57 Table 5.6: Pearson correlation coefficients (Agro-ecological Dimension)……………… 58 Table 5.7: Farm classification by size…………………………………………………..66 Table 5.8: Poverty lines according to international and national criterion……………… 74 Table 5.9: Market facilities and distance………………………………………………..82 Table 5.10: Market access and sale at the market………………………………………..82 Table 6.1: Economic strategies oriented towards rural development of the farming
system in Yantzaza-Ecuador…………………………………………………87 Table 6.2: Contract farming for product placement in regional markets………………..89 Table 6.3: Opprotunities for direct marketing (local and regional)………………………91 Table 6.4: Generating new market niches. Export Consortia……………………………92 Table 6.5: Territorial marketing plan…………………………………………………94 Table 6.6 C o or d i n a t io n am o ng p eo p l e i n t h e v a lu e ch a i n : V a lu e Li n k s
methodology……………………………………..……………………………96 Table 6.7: Productive Projects assisted transformation into production systems ……….97 Table 6.8: Public-Private Governance for microenterprise support…………………….99 Table 6.9: P romot ing inclus ive , coopera t ive assoc i a t ions and bus inesses
in rural areas………………………………………………………………….100 Table 6.10: Manage short alternative marketing channels (CIALCO)………… 102 Table 6.11: Compet i t ive business fund…………………………………….. .10 4 Table 6.12: Social strategies oriented to rural development of the farming system in
Yantzaza-Ecuador………………………………………………………….105 Table 6.13: Participatory agricultural extension program [Field School]………………107 Table 6.14: Territorial economic information system at provincial level………………108 Table 6.15: Productive integration and logistics…………………………………………110 Table 6.16: Continuous distance training program for rural farmers…………………….111 Table 6.17: P e r s o n a l a g e n c y p r o g r a m a n d i n t r i n s i c e m p o w e r m e n t
(community health developers)…………………………………………… 112 Table 6.18: Public-Private partnership (territorial rural development forum, FTDR)……114 Table 6.19: SUMA methodology for strengthening grassroot organizations…………….116 Table 6.20: Participatory processes of agricultural innovation methodology…………118
viii
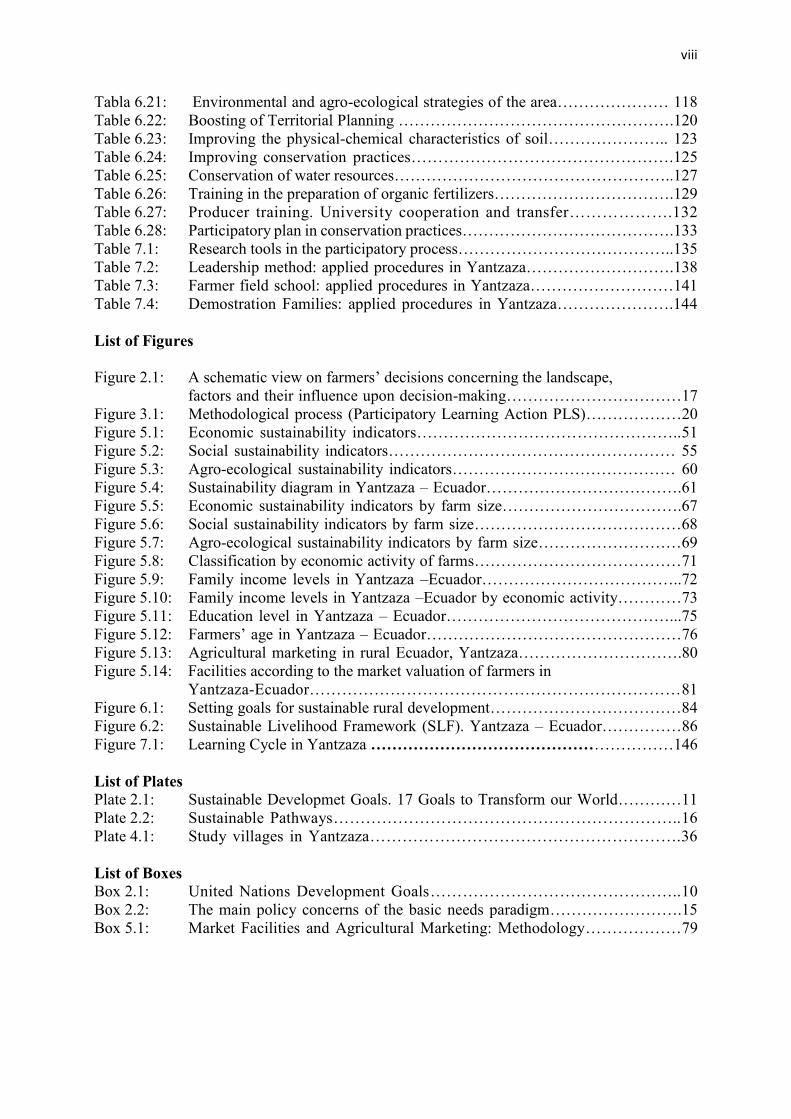
Tabla 6.21: Environmental and agro-ecological strategies of the area………………… 118 Table 6.22: Boosting of Territorial Planning …………………………………………….120 Table 6.23: Improving the physical-chemical characteristics of soil………………….. 123 Table 6.24: Improving conservation practices………………………………………….125 Table 6.25: Conservation of water resources……………………………………………..127 Table 6.26: Training in the preparation of organic fertilizers…………………………….129 Table 6.27: Producer training. University cooperation and transfer……………….132 Table 6.28: Participatory plan in conservation practices………………………………….133 Table 7.1: Research tools in the participatory process…………………………………..135 Table 7.2: Leadership method: applied procedures in Yantzaza……………………….138 Table 7.3: Farmer field school: applied procedures in Yantzaza………………………141 Table 7.4: Demostration Families: applied procedures in Yantzaza………………….144 List of Figures Figure 2.1: A schematic view on farmers’ decisions concerning the landscape,
factors and their influence upon decision-making……………………………17 Figure 3.1: Methodological process (Participatory Learning Action PLS)………………20 Figure 5.1: Economic sustainability indicators…………………………………………..51 Figure 5.2: Social sustainability indicators……………………………………………… 55 Figure 5.3: Agro-ecological sustainability indicators…………………………………… 60 Figure 5.4: Sustainability diagram in Yantzaza – Ecuador……………………………….61 Figure 5.5: Economic sustainability indicators by farm size…………………………….67 Figure 5.6: Social sustainability indicators by farm size…………………………………68 Figure 5.7: Agro-ecological sustainability indicators by farm size………………………69 Figure 5.8: Classification by economic activity of farms…………………………………71 Figure 5.9: Family income levels in Yantzaza –Ecuador………………………………..72 Figure 5.10: Family income levels in Yantzaza –Ecuador by economic activity…………73 Figure 5.11: Education level in Yantzaza – Ecuador……………………………………...75 Figure 5.12: Farmers’ age in Yantzaza – Ecuador…………………………………………76 Figure 5.13: Agricultural marketing in rural Ecuador, Yantzaza………………………….80 Figure 5.14: Facilities according to the market valuation of farmers in
Yantzaza-Ecuador……………………………………………………………81 Figure 6.1: Setting goals for sustainable rural development………………………………84 Figure 6.2: Sustainable Livelihood Framework (SLF). Yantzaza – Ecuador……………86 Figure 7.1: Learning Cycle in Yantzaza …………………………………………………146 List of Plates Plate 2.1: Sustainable Developmet Goals. 17 Goals to Transform our World…………11 Plate 2.2: Sustainable Pathways………………………………………………………..16 Plate 4.1: Study villages in Yantzaza………………………………………………….36 List of Boxes Box 2.1: United Nations Development Goals………………………………………..10 Box 2.2: The main policy concerns of the basic needs paradigm…………………….15 Box 5.1: Market Facilities and Agricultural Marketing: Methodology………………79
ix
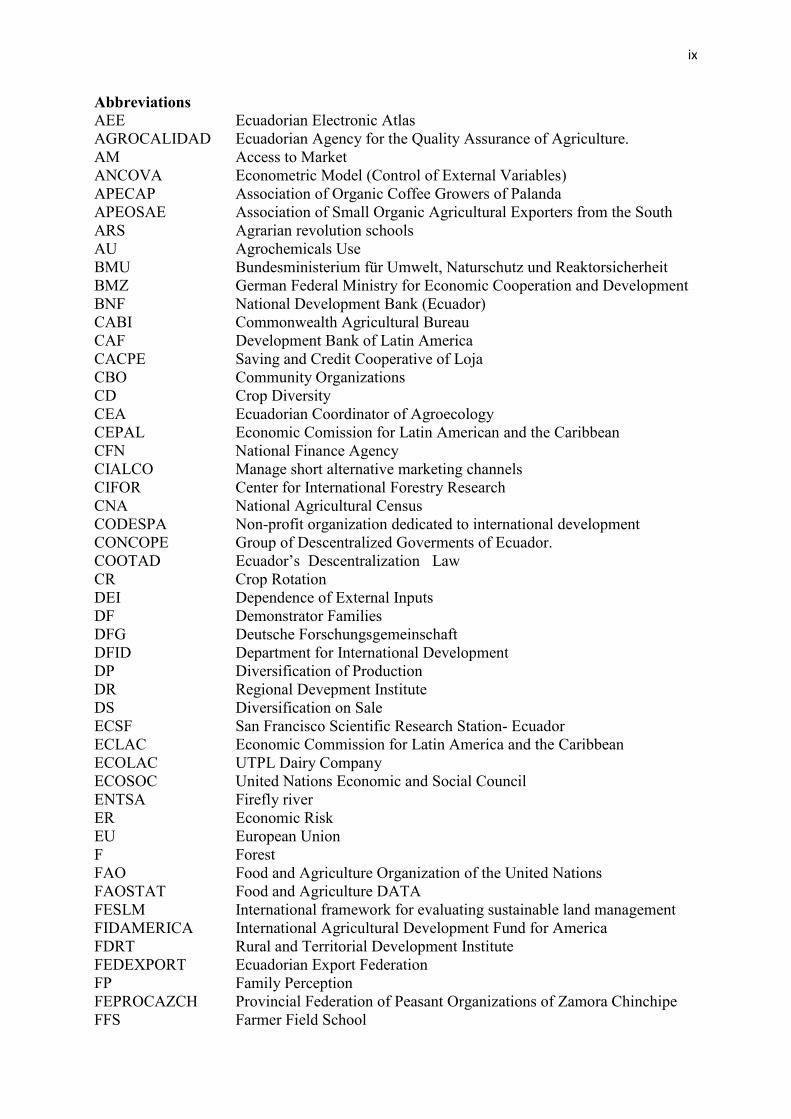
Abbreviations AEE Ecuadorian Electronic Atlas AGROCALIDAD Ecuadorian Agency for the Quality Assurance of Agriculture. AM Access to Market ANCOVA Econometric Model (Control of External Variables) APECAP Association of Organic Coffee Growers of Palanda APEOSAE Association of Small Organic Agricultural Exporters from the South ARS Agrarian revolution schools AU Agrochemicals Use BMU Bundesministerium für Umwelt, Naturschutz und Reaktorsicherheit BMZ German Federal Ministry for Economic Cooperation and Development BNF National Development Bank (Ecuador) CABI Commonwealth Agricultural Bureau CAF Development Bank of Latin America CACPE Saving and Credit Cooperative of Loja CBO Community Organizations CD Crop Diversity CEA Ecuadorian Coordinator of Agroecology CEPAL Economic Comission for Latin American and the Caribbean CFN National Finance Agency CIALCO Manage short alternative marketing channels CIFOR Center for International Forestry Research CNA National Agricultural Census CODESPA Non-profit organization dedicated to international development CONCOPE Group of Descentralized Goverments of Ecuador. COOTAD Ecuador’s Descentralization Law CR Crop Rotation DEI Dependence of External Inputs DF Demonstrator Families DFG Deutsche Forschungsgemeinschaft DFID Department for International Development DP Diversification of Production DR Regional Devepment Institute DS Diversification on Sale ECSF San Francisco Scientific Research Station- Ecuador ECLAC Economic Commission for Latin America and the Caribbean ECOLAC UTPL Dairy Company ECOSOC United Nations Economic and Social Council ENTSA Firefly river ER Economic Risk EU European Union F Forest FAO Food and Agriculture Organization of the United Nations FAOSTAT Food and Agriculture DATA FESLM International framework for evaluating sustainable land management FIDAMERICA International Agricultural Development Fund for America FDRT Rural and Territorial Development Institute FEDEXPORT Ecuadorian Export Federation FP Family Perception FEPROCAZCH Provincial Federation of Peasant Organizations of Zamora Chinchipe FFS Farmer Field School
x
FSS Food Self-Sufficiency FTDR Rural Territorial Development Forum GAD Local Government (Ecuador) GADZH Local Government of Zamora Chinchipe GDP Gross Domestic Product GNI Gross National Income GTZ Deutsche Gesellschaft für Technische Zusammenarbeit HC Health Conditions HC Humus Content HCAP Human Capital and Agricultural Permanence HQ Housing Quality HSC Accumulation of Human Capital and Social Capital HSC Social Structure I Income ICT Information and Communication Technologies IESS Ecuadorian Social Security Institute IF Irradiated Families IFPRI International Food Policy Research Institute IICA Inter-American Institute for Cooperation on Agriculture IIED Institute of Environmental Development ILO International Labor Organization INAMI National Institute of Meteorology in Hydrology INEC National Institute of Statistics and Censuses INIAP National Institute of Agricultural and Livestock Research INTA Nicaraguan Institute of Agricultural Technology IRP Participatory Rural Innovation JRC Joint Research Centre K Potassium L Labor LEPS Popular and Solidarity Economy Law LT Land Tenure LU Land Use M Mechanization MAE Ministry of Environment MAGAP Ministry of Agriculture, Livestock and Fisheries MDG Millennium Development Goals MIDUVI Ministry of Housing MIES Ministry of Economic and Social Insertion MIPRO Ministry of Productivity MS Microsoft Systems MSP Ministry of Public Health N Nitrogen NBB National Basic Basket NI Net Income. NGO Non-Governmental Organization NP Nitrogen Phosphorous NUTMON Statistical software NVB National Vital Basket O Organization OAS Organization of American States OB Observation

xi
OC Overcrowding Conditions OECD Organization for Economic Co-operation and Development OM Organic Matter ONUDI Union Nations for Industrial Development P Phosphorus PASC Production Area of Self-Consumption PDYOT Territorial Development Plan of Yantzaza PLA Participatory Learning Action PNBV National Plan for Good Living PNUD United Nations Development Program’s POTY Land Use Plan of Yantzaza PPF Production Possibility Frontier PRA Participatory Rural Appraisal PRODAR Rural Agribusiness Program QE The Quality of the Environment QL Quality of Life RCT Rational Choice Theory RISE Response-Inducing Sustainability Evaluation (Manual) RRA Rapid Rural Appraisal S Slope SAFE Sustainable Assessment of Farming and the Environment SDG Sustainable Development Goals SECAP National Training Agency SENAGUA National Water Secretariat SENPLADES National Secretariat of Planning and Development SIT Territorial Information System SLF Sustainable Livelihoods Framework SME Associative exports SOC Soil Organic Carbon SPSS Software package used for statistical analysis STATA Stata is a general-purpose statistical software package created in 1985 by StataCorp. SUMA Method for strengthening grassroot organizations TIC Communication Technologies and Information UGT Land Use Plan of Zamora UN United Nations UNCED United Nations Conference on Environment and Development UNL Universidad Nacional de Loja UNICEF United Nations International Children's Emergency Fund UPA Agricultural production unit USD US Dollar UTPL Universidad Técnica Particular de Loja WCED World Commission on Environment and Development WEKA Set of tools that allow us to extract useful information WP Work Packages (SmartLand) WS Workforce Stability WTO World Health Organization Y Yield
xii
Abstract
In recent years, sustainable development has emerged as a topic of great interest and part of the agenda of different countries of the world. The different stakeholders have been concerned about this issue, which has brought extensive international debates and different summits since Rio de Janeiro in 1992. A literature review of this concept indicates some general ideas framed in four dimensions, which are accepted at the international level: the economic, social, environmental and institutional.
There were problems related to the high levels of poverty in rural areas linked to environmental degradation, as well as the confusion that exists within the concept of economic development, e.g. taking into account sustainability and participation. It is also important to consider if these inconsistencies are affecting public policy decisions not only international, but also local ones.
Within this context, the purpose of this study was to develop a practical methodology to evaluate the sustainability of farms through the creation of indicators in South of the Ecuadorian Amazon. For this reason, the Zamora Chinchipe province and Municipality of Yantzaza were chosen. With this methodology, we hope to implement the concept of sustainability as a fundamental element of support for the governance of this area. Our methodology is based on the calculation of twelve indicators with three dimensions of sustainable development (economic, social and environmental). Twenty -eight sub-indicators were used to determine the general indicators.
Our results were able to demonstrate that there is a great heterogeneity of farms. In addition, it shows the serious management problem that exists at the farms by the farmers based on the dimensions studied. Apart from these economic problems, weak social structures and an inadequate management of the agro-ecological reality were observed. All this information can help to improve the existing public policies, with the sole aim of improving the sustainability in the sector.
After becoming familiar with the diagnosis of the area, it was important to generate more homogeneous groups of farms. This allowed us to have a better view of the decisions previously made. Three types of farms were determined: self-sufficiency, business and livestock. On the one hand, this paper aims to develop a sustainable proposal for rural development. And on the other hand, it aims to generate livelihood strategies adopted by farm households.
There were proposed strategies based on three dimensions, thus solving the theoretical problem of the diagnosis. “Twenty-four strategies have been proposed”. Each of them has the detail of intervention and above all strong consolidated institutional support.
All these strategies were transferred to the communities through agricultural extension programs, which were developed in situ. For this, 3 different transfer methods were used according to the reality and dynamics of each parish.
Thus, the results of the transfer have permeated community organizations through the establishment of partnerships and through enhancing existing ones. Also, public institutions have createdprojects that were established withinin the proposed themes. The Private Technical University of Loja has implemented a program called SmartLand, which has as its basic premise the generation of information and the development of projects to conserve the natural environment and also to accompany communities in the medium and long term.

xiii
Zusammenfassung
In den vergangenen Jahren hat sich die nachhaltige Entwicklung als ein Thema von großem Interesse und Teil der politischen Agenda in vielen Ländern der Welt entwickelt. Verschiedene Interessengrupen haben sich dieses Themas angenommen was seit der UNCED-Konferenz Jahr 1992 in Rio de Janeiro zu umfangreichen internationalen Debatten und verschiedenen Gipfeltreffen geführt hat. Die Literaturrecherche zu diesem Konzept offenbart einige grundsätzliche Ideen, die auf internationaler Ebene akzeptiert werden und in vier Dimensionen (wirtschaftliche, soziale, ökologische und institutionelle) gruppiert werden können.
Allerdings ist das Konzept nicht frei von konzeptionellen Inkonsistenzen So gibt es Probleme im Zusammenhang mit dem hohen Maß an Armut in ländlichen Gebieten, die auf die Zerstörung der Umwelt zurückzuführen sind. Zudem gibt es Inkonsistenzen innerhalb des Konzepts der wirtschaftlichen Entwicklung, wenn man verschiedene Aspekte von Nachhaltigkeit und Partizipation in Verbindung bringt. Es ist daher wichtig zu prüfen, ob diese Inkonsistenzen politische Entscheidungen nicht nur auf der internationalen Ebene, sondern auch lokal beeinflussen.
Vor diesem Hintergrund war das Ziel dieser Studie die Entwicklung einer praktischen Methodik zur Bewertung der Nachhaltigkeit von landwirtschaftlichen Betrieben im Süden des ecuadorianischen Amazonasgebietes mit Hilfe von Indikatoren. Aus diesem Grund wurden die Provinz Zamora Chinchipe und die Gemeinde Yantzaza gewählt. Mit dieser Methodik soll ein Beitrag zur Umsetzung des Konzepts der Nachhaltigkeit als grundlegendes Element zur Unterstützung der Goveranance-Strukturen dieser Gegend geleistet werden. Unsere Methodik basiert auf der Berechnung von 12 Indikatoren zu den 3 Dimensionen nachhaltiger Entwicklung (ökonomisch, sozial und ökologisch). Für die Präzisierung der allgemeinen Indikatoren wurden 28 Subindikatoren verwendet.
Unsere Ergebnisse zeigen, dass es eine große Heterogenität der Bauernhöfe gibt. Darüber hinaus wird auf der Basis der untersuchten Dimensionen ein ernsthaftes Management-Problem deutlich, das in den landwirtschaftlichen Betrieben existiert. Abgesehen von diesen ökonomischen Problemen wurden schwache soziale Strukturen und eine unzureichende Beachtung der agroökologischen Voraussetzungen beobachtet. Alle diese Informationen können dazu beitragen, die bestehenden Politikansätze anzupassen, mit dem Ziel, die Nachhaltigkeit in diesem Sektor zu verbessern.
Nachdem man sich mit den Gegebenheiten des Gebietes vertraut gemacht hatte, war es wichtig, homogenere Gruppen von landwirtschaftlichen Betrieben zu identifizieren und voneinander abzugrenzen. Damit haben wir eine klarere Sicht auf die bisher getroffenen Entscheidungen. Drei Arten von Bauernhöfen wurden bestimmt: „Selbstversorgung“, „Agrarproduktion für den Markt “ und „Viehwirtschaft“. Einerseits soll in dieser Studie ein Vorschlag für die nachhaltige Entwicklung des ländlichen Raums entwickelt werden. Auf der anderen Seite zielt sie darauf ab, livelihood strategies (Strategien zum Lebensunterhalt) zu formulieren, die von ländlichen Haushalten angenommen werden.
Es wurden 24 Strategien vorgeschlagen, die auf den 3 Dimensionen der Nachhaltigkeit basieren. Sie setzen an den Problemen an, die in der Diagnosephase identifiziert wurden. Jede der Strategien wurde detailliert ausgearbeitet. Alle diese Strategien wurden durch landwirtschaftliche Beratungsprogramme, die in situ entwickelt wurden, auf die ländlichen Gemeinschaften übertragen. Dazu wurden, je nach den Gegebenheiten und Dynamik jedes ländlichen Bezirks (parish), drei verschiedene Transfermethoden verwendet.

xiv
So hat die Wissensvermittlung die Institutionen der Gemeinschaften durch die Gründung von Partnerschaften und durch die Verbesserung bestehender Partnerschaften intensiv beeinflusst. Auch die öffentlichen Organisationen haben Projekte geschaffen, die innerhalb der vorgeschlagenen Themenkomplexe eingerichtet wurden. Die Private Technische Universität von Loja hat ein Programm mit dem Namen SmartLand implementiert. Dieses basiert auf der Generierung von Informationen und der Entwicklung von Projekten zur Erhaltung der natürlichen Umwelt. Ziel ist aber auch eine mittel- und langfristige Begleitung der einbezogenen Gemeinschaften.
1
1. - Introduction:
1.1 Overview
In recent years, the controversy regarding natural resource management has become more prevalent. For example, the deficits fulfilling social, economic, and environmental criteria are a major concern within the global community (FAO 2013).It is clear that the purpose of eradicating abject poverty and famine, as well as of guaranteeing environmental sustainability have not been achieved. Consequently, it affects the community at large (UNICEF 2013). Brundtland Report (Brundtland Commission 1987), also known as the Earth Summit (United Nations 1994) first introduced an integral concept of development, taking into account economic aspects, natural resources management, wildlife protection, social equity and inclusion.
The United Nations Conference on Environment and Development (UNCED), the Earth Summit in Rio de Janeiro, has likewise had a major effect on countries worldwide by placing the promotion of environmental concerns at the center of their relations. It is necessary to assess in detail the three different steps: before, during and after the Earth Summit.
The first phase is related to the characteristics of entrepreneurship capacity, savings and capital, which are seen as the basis for economic growth. In this phase, industrialization has been preferred to natural resource protection (Rostow 1960). Then, the action plan of Agenda 21 was proposed (United Nations 1994). This integrates the social and economic dimensions and management of resources for development i.e. as mechanisms for environmental protection and sustainable development. Osborn & Bigg (Osborn and Bigg 1998) mention that between 1993 and 1998 the results of the aforementioned agenda are very poor when analyzed in light of significant environmental issues. For this reason, during the Johannesburg meeting (Union Nations 2003) a report was presented of the results of Agenda 21, which permeated all sectors of the global economy causing immense frustration among the international community1.
Indeed, today we are facing major challenges which raise concerns about the model upon which modern society is built. First, there is the sustainability challenge, or the trade-off between an economic perspective and ecological scarcity (Chambers 1993) (Lundberg and Squire 1999). This includes action aimed at balancing environmental degradation and usage of natural resource with economic growth. Second, there is the compensation associated with the global benefits from ecosystems and the willingness to pay individuals for their respective environmental services (Bartelmus 2010a). International mechanisms were implemented such as the Kyoto Protocol (Union Nations 1998), which produced limited results. Third, is “growth with redistribution” (Hunt 1989b). In 1973, when Robert McNamara became President of the World Bank, a policy shift was made towards poverty alleviation due to the high number of impoverished people throughout the world.
Conflicts about these matters therefore dominated scientific and socio-economic discussions. The Brundtland Commission provided a widely accepted definition of sustainability as: “Sustainable Development is development that meets the needs of the present without compromising the ability of future generations to meet their own needs” (Brundtland Commission 1987, p. 41). The Food and Agriculture Organization (FAO) (FAO 2013) proposed to add to this multi-dimensional concept the governance dimension which makes learning more participatory. One
1 Although the UN meeting in Río was not seen as a particular success in terms of achieving its objectives, there were some who felt that it paved the way for future action.
2
of the general objectives of modern society is to improve quality of life through anthropocentric production and commercialization systems. However, these systems are not always coherent with the sustainable environmental management practices. Although they may increase the productive efficiency, they may reduce natural assets and environmental services in the short, medium, and long-term. The sustainable development discussed in Article 14 of the Agenda 21 is related to sustainable agriculture and rural development. It emphasizes a participatory approach and the respect for local knowledge, as well as other more sensitive topics (Union Nations 1992) More recently, rural development has been the focus of various societies. The rural regions are related to the interplay of global and local forces where territorial dynamics, population dynamics and globalization processes become important determinants (Bor et al. 1997) In this context, the intensification processes of social and economic relations worldwide causes the displacement of people and creates obstacles in the movement of capital between countries, which is due to new technological processes, production restructuring, and the division of labor (Pizarro 2000). During the last few years, participatory approaches and sustainability have been an important topic for increasing the debate in rural development policy, stakeholder networks and scientific discourses (Chambers 1993). Also, good governance has been important, which individuals and institutions – both public and private – can manage their common affairs in a coordinated manner (The Commission on Global Governance 1995). Therefore, the promoters of participatory approaches believe that such action provides a better use of natural resources and increases efficiency. According to this position, local people should be appropriately involved in this process. Poverty alleviation can thus be strengthened for the improvement of local capabilities in combination with scientific knowledge (Neef 2005a). But so far, this has not had the desired impact, because it is still controversial. The following sections discuss the theoretical framework for sustainable development. Brundtland Commission’s (1987) definition supports this research. Sustainable development from economic, social and ecological perspectives were defined by Smyth A. & Dumanski J. (1993). The FAO Organization also found that institutional dimension is important. Other authors such as Egledow & Barker (1997), Ignacy Sachs (1980) or Masera et al., 1999 were referenced.
1.2 Sustainability and development in Latin America
Latin America is a region characterized by vast bio-diversity, extensive eco-regions, varied landscapes, soils and biomass, and a plethora of natural species. Latin America has the largest area of arable land reserves in the world: 29% of its territory (Gómez and Gallopín 1995). It is the region that has the highest ratio of agricultural land compared with the current population. Although it represents only 15% of the world's land surface and 10% of its population, it receives 29% of the globe's precipitation and has one third of the world's renewable water resources (FAO 2017). It is considered the world's richest biological area, with approximately 40% of global plant and animal species (Programa de las Naciones Unidas para el Medio Ambiente 2000). Latin America has 72, 9% of original forest cover. Three countries have the higher percentages: Surinam (94, 9%), Brasil (91, 7%) and Peru (88, 5%) (FAO 2014) In spite of their abundant resources, there are still many problems. The most detrimental influence comes out of the fact that the poor are compelled to exploit environmental resources for survival (Mellor 1966). This has led to severe pressure on the environment: loss of biodiversity, deforestation, desertification, land degradation, soil loss, poor solid waste management, and climate change. Poverty alleviation is an important goal because poverty
3
leads to environmental exploitation.With this increase in environmental exploitation,for example, Latin America and the Caribbean suffered the highest deforestation rate in the world, -.46% between 2000 and 2010, which means three times more than the global rate in the same time frame (FAO 2014). On the other hand, the development model adopted in the 70s2 showed an increase in exports, which generated sources of employment, thereby increasing social benefits. However, in Latin America, the composition of their exports was 41% for primary products, significantly increasing the pressure on natural resources, namely forests. Similarly, carbon dioxide emissions grew by 55% and deforestation rose at a rate of about 1.7% per year, which amounts to 189,000 acres per year (Rodríguez 2011).
According to a report prepared by International Labor Organization (ILO), the Economic Commission for Latin America in the Caribbean (ECLAC) and FAO (ILO 2012) informality and labor instability in the labor market are two of the factors that warrant the most attention, making over half the rural population in Latin America poor. 48 million impoverished people in Latin America live in rural areas. It is important to highlight that the majority of the impoverished classes in Latin America work in agriculture and cattle ranching in the rural area generating 60% of rural incomes (Ferranti et al. 2003). One of the key arguments related to economic and environmental restructuring in Latin America is that these areas can generate and renovate their resources. It has been determined that the only real source of income and development in this region is through family farming and the exploitation of primary resources. The FAO (2010a) and the Inter-American Institute for Cooperation on Agriculture (IICA) mention that a one dollar investment on agriculture generates more benefits than in any other area. The main motivation for studying this continent is to understand the integration between natural resources management and living conditions of the population. Our survey was conducted in Ecuador where the researchers continued to study natural resources and living conditions according to specific environmental and societal parameters of Ecuador. 1.3 Natural resources and development in Ecuador Latin America has spent about a quarter of a century since the Washington Consensus recommended structural adjustment policies and export promotion as a precondition for development. The per capita income between 1980 and 2005 was only 0.43% annually, which does not justify the model used (Rodríguez 2011).
The situation in Ecuador has historically been characterized by low economic growth, limited social equity, both ethnically and regionally, and by the over-exploitation of natural resources (Larrea 2003). Consequently, this has led to effects on the rural domestic sector. The focus of its activities with the field of sustainable development was via applications in strategic sectors such as energy, the establishment of a carbon market, ecotourism, Agenda 21 mechanisms, and local government and stakeholder action. Ecuador has been a country with an extractivist development model3 with little diversification
2 Import Substitution Model. 3 Extractivist Model comes from the extraction of resources. If a resource is removed (minerals, oil, agriculture, forestry, etc.), it is sold to the market, usually international.
4
of production4. Periods of economic booms have been temporary5, as expected, and have been largely dependent on the world market. Therefore, cocoa (1860-1950), bananas (1960) and oil (1972) have generated economic bubbles and have attracted cheap labor (Larrea 2003). Moreover, the growth model began with production based on monocultures. Up until 1960, for example, Ecuadorian forest coverage was reduced from 90 to 63% (Mckenzie 1994). The shrimp industry suffered a similar fate: over the last 20 years, 75% of the coastal zone manglares, or mangroves, (Alerta verde 1996) has been destroyed. Likewise, in 1987, the area of forest land was reduced to 45%. Finally, during the heavy oil extraction period, the reduction of forest land was reduced to 43% in 1990, and then to 39% in 2005 (Mosandl et al. 2008). The economic situation had a major impact on demographic changes over time, causing imbalances between urban and rural populations, since most of the population resided in rural areas and not in the city according to Castro (2007). In 1950, the urban population was 28.5% with 71.5% rural, and by 1982, it was 40.39% and 50.61%. Today, it is 66.25% and 33.75%, respectively. 1.4 Objectives of the research
The current research pursues the following general objective:
– To develop a model at a local level of sustainable development from an economic, social and agro-ecological dimension based on farmers participation.
The following specific objectives were pursued in this dissertation:
– Develop agro-ecological, social and economic indicators for evaluation. – Form clusters by farm size. – Identify strategies and tools in the management of farms to improve farm productivity
and living conditions of the population. – Define economic activities in the farms taking into account land use problems and
issues. – Improve knowledge and technology transfer.
1.5 Organization of the dissertation
Chapter 2 focuses on the review of the theoretical framework most commonly used to explain sustainable development applied in rural areas. This chapter will describe the challenge aimed at improving human welfare while not significantly affecting the surrounding environment. Additionally, Chapter 2 will explain environmental development from a rural perspective, along with describing the role of agriculture and natural resource management in farmers’ decision making.
Chapter 3 outlines the methodological framework of the research. This includes the research dimensions derived from the theory review, the design of the research process and the multidimensional model. Chapter 3 presents, in detail, the three main steps utilized in the research. Besides, additionally these steps will be accomplished through data collection, the use of statistical tools, econometric models, and data analysis.
4 Virtually no opportunities have existed to improve the industry sector. This sector remains one of the leading in its production structure, providing an average of 12.7% of GDP at prices constant during 2000-2012; this represents about 40% of annual incomes (Mateo and García 2014). 5 The State, through the collection of fees or the trickle-down effect uses this model though it is not necessarily the central actor in the mining industry. The country's economy is gradually gaining because GDP grows. In Ecuador, the principal commodity involved has been oil for the past 40 years.
5
Chapter 4 provides details of the information concerning the socio-economic, natural, cultural and institutional conditions that prevailed during the study. The purpose of this information is to describe the current situation for local farmers groups, the use of natural resources and basic regional data. This data will demonstrate the link between the study area and the four theoretically derived dimensions thus demonstrating the research objectives.
In Chapter 5, the research hypothesis will be empirically tested through the integral assessment of sustainability that comprises economic, social and agro-ecological indicators. This chapter emphasizes in the sustainable agricultural dimensions in order to assess the current conditions in the study area. This chapter defines two classifications of farms. An integral assessment will be conducted based on farm size and by the economic activity of a farm.
After learning about the indicators composition in the previous chapters, the solutions and strategies for sustainable development in Yantzaza County will be described in Chapter 6. Additionally, Chapter 6 will explore development strategies at the family level in Yantzaza – Ecuador. The research in this chapter emphasizes strategies from each dimension and theoretically supports the sustainable livelihood framework.
In order to optimize the model, Chapter 7 discusses participatory knowledge and technology transfer methods in the context of integrated natural resource management. Three different methods were applied, one in each parish. Chapter 7 investigates how transfer methods help in the learning cycle in the communities along with analyzing social structures.
The final section synthesizes and summarizes the outcomes of the study. Conclusions shall be drawn, and recommendations for development strategies transfer and natural resources management will be described. Statistically significant information, research instruments, relevant formulas, indicators, interviews, statistical tabulations, econometric models, auxiliary tables, and photographs related to study area are included in the appendices.
2. - Theoretical Framework
Natural resource usage can result in environmental impacts that reduce the quality of the natural environment. Sustainability focuses on ecology and its relation to the economy and society (Ecofair Trade Dialogue 2013; Bahr et al. 2014). It is important to stress that ecology is “the science of the relationships of organisms with the outside world, where we can recognize broad factors of the struggle for existence" (Haeckel 1866, p. 286). Therefore, humans are a part of a global community. The challenge emphasizes the need to maintain a reasonable environmental balance6.
Humans use at least 30% of all global net primary productivity, (Vitousek and Walker, 1989) with some regions using up to 100%. This population increase does not only increase disturbances, but can also risk human lives.
It also increases the likelihood of anthropogenic disturbances and the nature of these disturbances. The latter also generates greater risks to humans. According to these disturbances,
6 Equilibrium is established when environmental resistance adequately controls biotic potential, as long as it avoids reaching the minimum population to recover, which is referred to as critical number density in population (Wright 2005). Biotic interactions determine the structure of life of the communities in ecosystems. This is agreeable with the "equilibrium theory" (Zimmerman 2007), where there is a proper balance and stability in ecosystems. Space-time condition becomes a great value. What happens in ecosystems when the communities interact with each other and with the environment? Disturbances could be generated, which could destroy the structure of ecosystems, populations or the availability of resources.

6
ecosystems are changing–creating a "non-equilibrium theory”7 (Zimmerman 2007). The environment is able to recover and return to a normal systematic natural process. But when humans produce excessive disturbances, this affects the environmental balance. Indeed, this is the origin of the linkages between socio-economic and environmental sciences (Neef 2005a). Not only is the environment important as a biophysical interrelationship and ecological process, it is also an issue of concern as humans participate in the decision-making and action process. This is a phenomenon called instrumental relationships (i.e. people and their natural environment) (Neef 2005b), for example, when the linkage between these two sciences is necessary and transcendent.
Today, societies are looking for ways to improve the living conditions of the population. For this reason, environmental protection does not work by itself; it depends on human intervention. Pretty (1994) observes the link between technical and social sciences and its importance for the natural balance.
Throughout human history, people and countries have fought over natural resources. (Bartelmus 2001) emphasizes the importance of human welfare, understood as human needs, health and life support, which are based on environment-economy interactions. It is described as interaction in terms of the resources and sinks (waste disposal). Humans receive natural goods and services and indirect effects can be produced on health and others from environmental degradation.
The challenge is thus oriented towards satisfying human welfare, without significantly affecting the balance in nature. To achieve this, it is necessary to improve the environmental management and to find a successful economical system that enables the generation of resources and which are, at the same time, environmental friendly.
It is imperative therefore that the roots of economic theories are related to environmental policies and management. From the point of view of classical economy, the concept related to the satisfaction of individual and public demands can be best organized by the markets (Smith 1776), that is, until the state intervenes to overcome market failure.
Smith (1776) in his publication Inquiry into the Nature and Causes of the Wealth of Nations argues for the importance of free markets as a natural process for the development of the economy. He distinguishes two kinds of values of goods: use and exchange values. His focus in the latter is due to market action related to demand and supply intervention. However, there are problems with essential goods for society, such as water (Cubbage et al. 1993).
Neoclassical economy adds to the classical concept: individual preferences and utilities. Rational choice8 is the principle of neoclassical behavior. It consists of the maximization of individual preferences in consumption and a willingness to pay that is related to human 7 Because of this, it is increasingly important to analyze the concept of resilience from an environmental perspective. Resilience is considered a measure of persistence of ecosystems, to the action of disturbance or stress, the system can absorb in such a manner that will maintain the same relations between the stated variables. All of this, in light of instabilities, can vary the balance of systems. Ecological resilience assumes that the system can display multiple stable states depending on environmental conditions. When a critical variable passes the threshold, it produces a sudden change or a change of system state (Adger 2000). This means gradual or abrupt changes to ecosystems, can alter this balance and ecological resilience plays a key role in regulatory processes. It is important to know that ecosystems function even in the presence of perturbations. Resilience can thus help maintain the sustainability of ecosystems. 8 Rational choice“[a]ttempts to explain all social phenomenon in terms of how self-interested individuals make choices under the influence of their preferences. It treats social exchange as similar to economic exchange where all parties try to maximize their advantage or gain, and to minimize their disadvantage or loss. RCT's basic premises are that (1) human beings base their behavior on rational calculations, (2) they act with rationality when making choices, (3) their choices are aimed at optimization of their pleasure or profit“. In Business Dictionary. Retrived March 28, 2017, http://www.businessdictionary.com/definition/rational-choice-theory-RCT.html
7
performance. Society is continuously looking for benefit and growth. Neoclassical welfare economics are “concerned with the total welfare of society and evaluate alternative projects or actions on the basis of changes in social welfare” (Dixon et al. 1988, p.24). Social welfare is understood as the sum of individual welfare. All this involves striking a fine balance between market forces, which is where unfortunately not everyone always feels at ease. The welfare optimum (PARETO-optimal outcome) states that: “no change can take place that makes someone better off without at the same time making at least one individual worse off” (Eggertsson 1990, p. 19).
The rationality axiom introduces individual behavior as the force that provides the greatest benefits. Some authors (Samuelson and Nordhaus 1992) (Solow 1992) (Blanchard 2006) who defend free market forces, argue that a series of policy reforms can help to achieve the general equilibrium in the system.
Galbraith (1986) made a vehement criticism about the basic principles that govern neo-classical economy. Its main focus is in economic policy analysis in current weaknesses and gaps. The perfect competition is censured due to market failures and individual preferences. Essentially, the aim was to assess the basic problems behind it. Equity problems, imperfect knowledge, lack of clear basis of competition, non-clearly defined property rights and costs and benefits from the non-market, form the deep framework in the system (OECD 1991).
It follows that the economy plays a vital role in societies and that its relationship with the environment depends on the vision and action of humans. Next are the fundamental schools of thought related to the dynamics between the environment and economics, which aim to improve human welfare (Bartelmus 2010a). In this sense, the schools of neoclassical economics have specific continuum: from a growth economy to deep ecology9. These theoretical definitions serve as the roadmap for policymakers around the world. These two foci are, however, constantly changing due to specific factors like profit, utility, and economic growth maximization, which have produced land degradation and externalities. Environmental economics is the third school of thought whose focus is economic growth – where environmental and social costs are taken into account (Cooper 1981) (Russel 2001) (Bartelmus 2010b). And the fourth option refers to ecological economy, which is intended to obtain the “dematerialization of the economy10”, (Daly 1990), that is, where the collective responsibility for the protection of nature assets is recommended. The latter is based on the conservation principle.
Any one of the options described above provides a consensus regarding the analysis of alternatives that aim to improve environmental management. While the first trend aims to achieve a market solution through the internalization of externalities, there is also an exchange system of environment goods and services and money within markets. On the other hand, the second theory (where the environment is the prevailing factor) aims to prevent or minimize environmental impacts. The environment is considered a national heritage, rather than something that reflects the willingness to pay (Doob 1995).
This apparent conflict creates a differentiation in individual preferences vs. collective action11, which helps to understand the needs to generate a model, where the integration of environmental and socio-economic dimensions is vital. Therefore, a distinction had been made between “economics of the environment”, as is understood by neoclassical economist, 9 See Ecology concept in section 2. 10 In economics, dematerialization refers to the absolute or relative reduction in the quantity of materials required to serve economic functions in society. In common terms, dematerialization means doing more with less. This concept is similar to ephemeralization as proposed by Fuller and Kuromiya (1982) 11 Collective action is still present in traditional societies, where the principle of reciprocity is often guiding action.

8
(Baumol, W. J. & Oates, W. E. 1988) and “economists for the environment”, as defined by (Passet 1989, p. 4) “which without giving up its traditional areas, chooses or not, to develop its own laws in accordance with those of nature”.
2.1 Sustainability as a result of the integral model.
Various dimensions are involved in the concept of sustainability12 (United Nations 1994). (Meadows et al. 1972), who bases his theory on ecological constraints and complex social problems–namely those which are associated with economic growth– mentions that the system could not be sustainable as it is.
The philosophy behind this criterion is associated with the total stock of capital employed by the economic system, which aims to achieve successful results and economic well-being. Society has to decide how much capital is used today and how much is needed for the future. The underlying aim of economic activity implies the use of natural resources. The core of the problem is that the classical economic model suggests a rapid accumulation of physical and human capital, but at the expense of natural capital (Barbier 1989).
The challenge is therefore considerable and required major efforts in various social dimensions. This situation is not only implicated in the growth capacity, but also in the debate caused by the current loss of natural capital and how much compensation is suitable for future generations (Mäler 1995). Thus, two different points of view are referred to in this field of research: weak sustainability and strong sustainability (Barbier et al. 1994)
According to weak sustainability, natural capital has similar conditions with respect to physical or human capital. The main idea is to maintain the productive capacity of resources by technical evolution. Whereas for strong sustainability, environmental goods and services that are vital for humans cannot be easily replaced. Thus, they should be protected and not depleted (Barbier 2011). Daly (1990) describes some basic precautionary regulations related to this topic: 1) the rate of renewable natural resource development should be equal to their rate of generation; 2) the emission rate of waste should equal the assimilation capacity of the environment in which it is deposited; 3) non-renewable natural resources should be exploited at same rate at which they are being replaced with renewable resources, which means to maintain the natural stock for the future.
However, the World Commission on Environment and Development (WCED) (1987) defined sustainability as a generational challenge according to needs that are satisfied today and in the future. Regardless of the type of sustainability that is used, the balance is always preferred.
By using this theoretical basis, the development concept becomes even more essential. Humans have many types of needs13, which should be met. It is crucial that the natural balance that is recommended by researchers and academics obtains the best solutions to improve global living conditions.
2.1.1 Sustainable land management
Since its founding in 1945, the FAO has determined that certain issues are important such as the appreciation of quality and land use. In 1970, many countries used the system of classification of land use and land rating system. However, standardization was required. For that reason, in 1976 the University of Wageningen in collaboration with the FAO published the
12 See section 1. 13 Maslow’s Hierarchy of Needs describes five classes of needs: physiological needs, need for safety, social needs, the need for esteem and the need for self-development.
9
“Structure for Land use” (World Bank 2001). At the same time, some economists contrasted their thinking with the limitation of the use of natural resources. Meadows et al. (1972) is the one, who in his book “The Limits of growth "exposes the problems of economic growth against a limited amount of natural resources and social difficulties. The UN Conference on Environment and Development in Rio de Janeiro in 1992, in its Agenda 21, and the Sustainable Development focus in Chapter 10 (in the integrated approach to the planning and management of land resources and in Chapter 14 on sustainable agriculture and rural development), proposed a number of new initiatives by some organizations such as the Commonwealth Agricultural Bureau (CABI) for evaluating/assessing the sustainability and resilience of soil resources and their sustainable use.
Likewise, the Consultative Group for International Agricultural Research (CGIAR) defined sustainable agriculture as: "the successive management of resources for agriculture to satisfy changing human needs while maintaining or enhancing the quality of the environment and conserving natural resources" (TAG/CGIAR 1992, p.2). Thus, we can conclude that three dimensions are internationally accepted: the economic, social and ecological dimensions.
2.2 Development and rural livelihoods:
The concept of integral development may encompass various dimensions related to humans and their environmental conditions. Within this framework are economic, social, political, human, environmental, historical, cultural and technological dimensions (Zeller et al. 1997b). The focus is placed on meeting people’s basic needs, that is, when considering their current circumstances. Moreover, the above dimensions are related to one another because development is a complex, arduous, and often fragile process. Furthermore, development needs to be seen within a long-term perspective.
There are three important aspects that are considered within the rural development perspective. First, there is the increase in people's living standards, income and consumption, which is reflected in economic growth. Second, there is the creation of adequate circumstances for people's self-esteem, which is achieved through the integration of dimensions related to the promotion of human dignity and respect. Lastly, there is the increase of personal freedom, which leads to a rise in consumer alternatives such as goods and services, and their relationship with the environment (Todaro 1997), resulting in an integral definition of development.
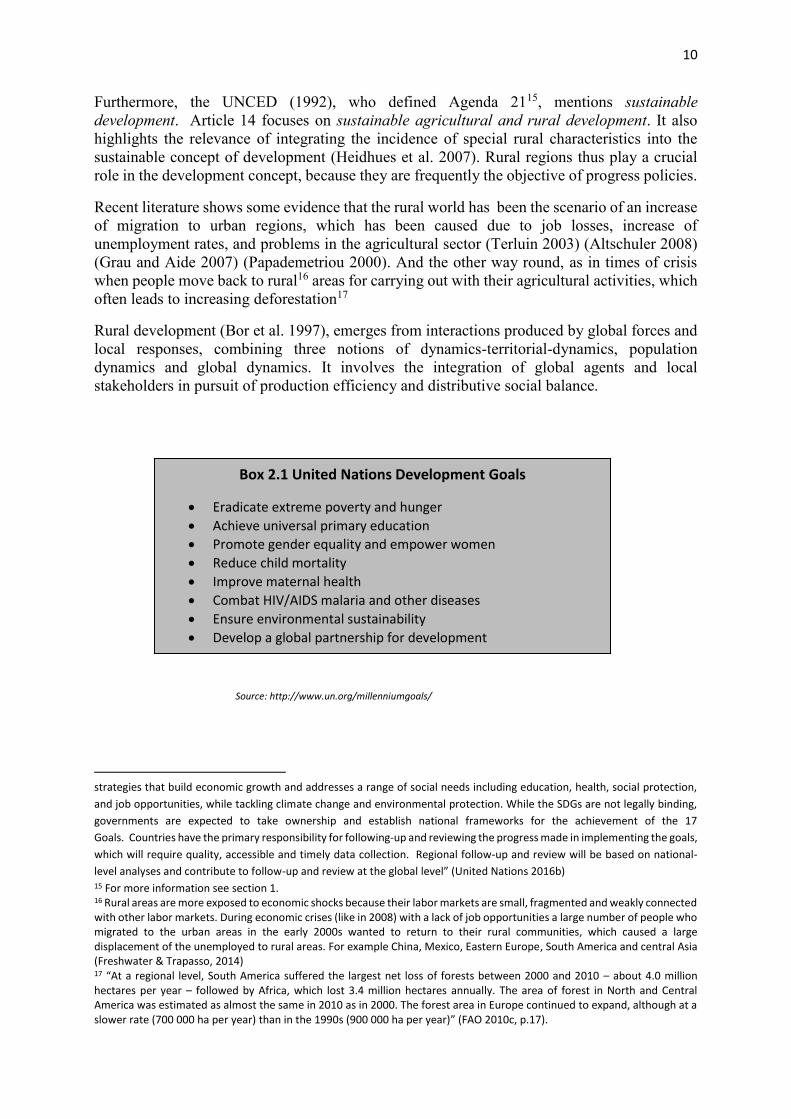
This definition makes it possible to identify the exact role of the physical needs and non-material aspirations. This can be summarized as human welfare. The aim is to understand the overall goals related to the human welfare definition in order to achieve development. This is why the United Nations Millennium Declaration led to the adoption of a set of Millennium Development Goals (MDG), which are summarized in Box 2.1 (United Nations 2016a) (Bartelmus 1994b). These goals were an arduous means to establish solid baselines to track the world policies that had a similar vision. It is worth mentioning that from 2016 UN worked with governments, civil society and other partners to build on the momentum generated by the MDGs and carry on with an ambitious post-2015 development agenda14 (See Box 2.1).
14 In the declaration the United Nations made it clear that, and I quote directly “On 1 January 2016, the 17 Sustainable
Development Goals (SDGs) of the 2030 Agenda for Sustainable Development — adopted by world leaders in September 2015
at an historic UN Summit — officially came into force. Over the next fifteen years, with these new Goals that universally apply
to all, countries will mobilize efforts to end all forms of poverty, fight inequalities and tackle climate change, while ensuring
that no one is left behind. The SDGs build on the success of the Millennium Development Goals (MDGs) and aim to go further
to end all forms of poverty. The new Goals are unique in that they call for action by all countries, poor, rich and middle-
income to promote prosperity while protecting the planet. They recognize that ending poverty must go hand-in-hand with
10
Furthermore, the UNCED (1992), who defined Agenda 2115, mentions sustainable development. Article 14 focuses on sustainable agricultural and rural development. It also highlights the relevance of integrating the incidence of special rural characteristics into the sustainable concept of development (Heidhues et al. 2007). Rural regions thus play a crucial role in the development concept, because they are frequently the objective of progress policies.
Recent literature shows some evidence that the rural world has been the scenario of an increase of migration to urban regions, which has been caused due to job losses, increase of unemployment rates, and problems in the agricultural sector (Terluin 2003) (Altschuler 2008) (Grau and Aide 2007) (Papademetriou 2000). And the other way round, as in times of crisis when people move back to rural16 areas for carrying out with their agricultural activities, which often leads to increasing deforestation17
Rural development (Bor et al. 1997), emerges from interactions produced by global forces and local responses, combining three notions of dynamics-territorial-dynamics, population dynamics and global dynamics. It involves the integration of global agents and local stakeholders in pursuit of production efficiency and distributive social balance.
Source: http://www.un.org/millenniumgoals/
strategies that build economic growth and addresses a range of social needs including education, health, social protection,
and job opportunities, while tackling climate change and environmental protection. While the SDGs are not legally binding,
governments are expected to take ownership and establish national frameworks for the achievement of the 17
Goals. Countries have the primary responsibility for following-up and reviewing the progress made in implementing the goals,
which will require quality, accessible and timely data collection. Regional follow-up and review will be based on national-
level analyses and contribute to follow-up and review at the global level” (United Nations 2016b) 15 For more information see section 1. 16 Rural areas are more exposed to economic shocks because their labor markets are small, fragmented and weakly connected with other labor markets. During economic crises (like in 2008) with a lack of job opportunities a large number of people who migrated to the urban areas in the early 2000s wanted to return to their rural communities, which caused a large displacement of the unemployed to rural areas. For example China, Mexico, Eastern Europe, South America and central Asia (Freshwater & Trapasso, 2014) 17 “At a regional level, South America suffered the largest net loss of forests between 2000 and 2010 – about 4.0 million hectares per year – followed by Africa, which lost 3.4 million hectares annually. The area of forest in North and Central America was estimated as almost the same in 2010 as in 2000. The forest area in Europe continued to expand, although at a slower rate (700 000 ha per year) than in the 1990s (900 000 ha per year)” (FAO 2010c, p.17).
Box 2.1 United Nations Development Goals
Eradicate extreme poverty and hunger
Achieve universal primary education
Promote gender equality and empower women
Reduce child mortality
Improve maternal health
Combat HIV/AIDS malaria and other diseases
Ensure environmental sustainability
Develop a global partnership for development

11
Plate 2.1 Sustainable Development Goals. 17 Goals to Transform our World.
In a nutshell, rural development implies an ample improvement of the social and economic living conditions in rural areas, in order to increase participation of low-income groups (Hagen 1975). “Rural development is development that benefits rural populations; where development is understood as the sustained improvement of the population’s standards of living or welfare” (Anriquez et al., 2007, p. 5). Most of the MDGs are related to rural interactions, poverty alleviation and environmental sustainability. The challenge then, is to define new mechanisms that improve human welfare, but with imposed restrictions18. Economic activities in rural areas of developing countries19 are mainly associated with the agricultural sector. Consequently, direct or indirect employment depends on this sector. Furthermore, poverty and rural regions are closely related with agricultural areas (Zeller et al. 1997a). This is especially significant for the regional economy, because it is a valuable notion in the project development process (Armstrong and Taylor 2000). However, many developing countries are now looking for strategies to establish better models of development to resolve these issues. Many of the parameters that are delineated are based on economic growth.
Theories related to economic development and regional economy20 are much more interconnected than we might think. This is essentially because labor and capital are directly
18 See environmental and economic trade off. 19 Developing countries are defined according to their Gross National Income (GNI) per capita per year. Countries with a GNI of US$ 11,905 and less are defined as developing (specified by the World Bank, 2013). 20 First, it could be relevant to understanding the regional economy and its functioning. Throughout regional economy history, there were a large number of theories previous to this discussion (Myrdal 1957), but always on the basis of economic growth with respect to use and combination of production factors in terms of a production function. According to this function, Terluin and Post (2000) recapitulate regional economic growth theories in four main groups: traditional models pure agglomeration models, local milieu models and territorial innovation models. The traditional model refers to the labor force and regional mobility in relation to opposing forces acting against capital (Thirlwall 2006). Development is measured from
12
involved. That is the reason why there is an ongoing debate about the rural and agricultural sector and the importance of having theoretical support. For this reason, an overview is required that pays close attention to the evolution of current theories.
2.3 Development theories and the role of agriculture
Some general ideas about rural development and agricultural support were introduced earlier. We turn now to ideas and theories that try to explain how the resources and production factors can be integrated to reach better living conditions (Norton et al. 2010).
In the past, climate conditions were used to explain development. In this regard, the initial ideas which have emerged classify under-development as a problem related to the distance of countries from the equator (Montesquieu 1748). Food storage in winter time helps with land use planning. Sociologists, for example, focus on the facility of social change (Hagen 1975). Motivation, innovation and creativity in societies encompass an essential challenge for achieving development.
Adam Smith and his idea of the free market aim to generate good living conditions. John Stuart Mill and David Ricardo combine various ideas about labor and specialization, as well as comparative advantage and trade. Some of these ideas are now more widely accepted. For example, Thomas Malthus projected that geometrically increasing population growth would arithmetically outstrip increasing food production. Classical theory thus begins with the integration of land, capital and labor as a basic principle. Favorable events increase the production, generating profit for capitalists. Arable land expansion can be produced by raising wages and population growth. More people equal more food demands. The central problem is due to high food prices, thus real wages suffer. Subsistence level thus becomes the norm. (Hayami and Vernon 1985; Norton et al. 2010)
Growth stage theories are also taken into account. Karl Marx, whose views are based on industrial processes (Singer 1950) (Rodrik 1995), property rights and Marxian ideology, describes five stages of development: primitive communism, ancient slavery, medieval feudalism, industrial capitalism and communism. Class struggle occurs because of labor crises. Revolution is a means to achieve communism21. Later, Rostow (1960) defined capital accumulation as a condition of economic growth. Conversely, neo-liberal22 development policy is supported by the saving capacity to increase investment as a basis of production. Six steps are defined: traditional societies, transitional stages, take-off stage, maturity and mass consumption. Development is reached when the industry sector increases from capital accumulation (Rostow 1960). Finally, Roy Harrod and Evsey Domar, through their mathematical model, show how the rate of output growth could be limited by the level of investment and national saving rate.
Other authors used models with two principal sectors (traditional and industrial), otherwise called the dual-economy. Allocations of labor define development. Arthur Lewis, John Fei,
the increase of exports, capital mobility which creates jobs and good development. The second model called pure agglomeration model emphasizes the agglomeration of activities and people in certain pole providers based natural resources, rural development aiming to attract capital and labor, which generates positive externalities to the rest of the economic sectors. 21 Communism is the doctrine of the conditions of the liberation of the proletariat. Communism (from Latin communis, universal) is a social, political, and economic ideology which ideal is a socioeconomic order structured upon the common ownership of the means of production and the absence of social classes, money, and the state. Engels (1847) 22 Since the 1980s, this ideological position has been used in different publications. This is associated with the policies adopted by the United Kingdom and the United States beginning 1970s and 1980s. Economic liberalization, fiscal austerity, free trade, and privatization are a principal policies in neoliberalism. The aim is to enhance the private sector in order to improve the market. Taylor C and Gans-Morse. Jordan (2009)
13
Gustav Ranis and Dale Jorgenson worked on these kinds of representations. Static and dynamic dualisms were distinct in this case. Static dualism emphasizes the limited interactions between traditional and modern sectors23. Modern sectors can develop through capital accumulation, but the traditional sector does not have incentives for growth. In dynamic dualism, people could be moved out from agriculture into the industry sector without negatively affecting traditional production. This is achieved by increasing the labor demand in the modern sector, but without affecting agricultural production. Capital investment will thus make labor more productive in the modern sector. The traditional sector has to maintain a high productivity to leverage the food prices; economic development depends on this balance. On the other hand, technological progress is required to increase productivity. Quality of labor and trade are not directly implicated in the proposal.
Contrary to dualistic theories are dependence theories, which stress the external forces as causes of development. Immanuel Wallerstein described development as a link between the center and the periphery. The idea behind this refers to the poverty caused by trade effects. Raul Prebish and Hans Singer24 introduced the phrase trade in development, because developing countries produce raw materials that produce a price decline when comparing them with manufactured prices. This deterioration in terms of trade diminishes development.
In Latin America (until 1980), it became progressively clear that industrialization aimed at substituting imports for domestic markets, which could be used to create local economic growth (Thirlwall 2006).By the mid-1980s, Robert Solow predicted, by statistic modeling, that poor countries could be submerged due to diminishing returns to capital. Robert Lucas and Paul Romer attempted to explain the latter estimation. The conclusion was that technological innovations can accumulate capital without maximizing value. It may be assumed that beneath the surface of this concept lies essential knowledge. For this reason, appropriate techniques and applications are related to knowledge development and knowledge dissemination. A degree of innovation is necessary to obtain the desired results. Also, access to technology by the farmers is required, and new public policies should be integrated in the system. The interaction among technology, natural resources, human capital and institutions might be the best strategy to achieve this development. Institutional theories have underlined the essential role of institutions and development case studies. Institutions thus play an important function in development, creating a bridge between poor people and governments. Some theoretical contributions have been carried out, such as the work of Douglas North and his transaction costs premise, which lead to models of different pathways and strategies of development. This discussion will be elaborated in more detail in section 7 (North 1991).
2.4 Natural resource management and farmers’ decisions, an alternative to poverty alleviation
Bearing in mind the definition of MDGs25, our aim is to build a long term model based on the integration of the development dimensions referred to above. As already mentioned,
23 The traditional sector is characterized by agricultural activities, when labor is primary. On the other hand, modern sector means industrialization and more capital accumulation. The concept of endogenous development is part of a group of theories (Becattini 1987) that together unite the skills of the labor, organizational and technical know-how and social and institutional structures from the local perspective. Finally, innovation has been regarded as a new variable added to the above which will allow development of rural areas. The focus is on trying to adapt production processes to the new features of the domestic and external demand, allowing the old know-how to produce new technological processes 24 Example of Latin America and Prebish. 25 Millennium devompent goals are presented in the box 2.1
14
development26 has been a crucial concept for researchers and academics. Our challenge is to alleviate poverty at the local level, to improve the living conditions of the population and at the same time to generate an adequate use of natural resources in the research area, based on the conditions prescribed by UNCED, ECOSOC, FAO, UNICEF, ILO, ECLAC and other international organizations.
The Neoliberal model has lost all intellectual and moral credibility due to international concerns, the increase of international poverty, environmental climate changes and debt crises, the latter of which could be called the “zombie phase”27 (Peck et al. 2010). This time, the hurdle at which it fell was that of the internal notions. Classical proposals, industrializations, trade and exogenous models and their application do not always achieve the same desired level of success. In this context, might there now be range for optional visions of the future, where small farms could be a fundamental part of the process?
Neoclassical economy was gradually expected to eliminate the family farm due to the impossibility of having opportunities in competition. Agribusiness took the internal markets and small farms fell into a crisis. However, they did not disappear, but rather these kinds of living conditions persisted, although in misery and in poverty. (Newby et al. 1981). Small farmers are characterized by poverty, are risk-averse, suffer unemployment, and are economically rational, but not necessarily profit-maximized because they have their own scale of utility, a weak social infrastructure, weak market conditions, and are typified by unavailable or expensive loans- indicating a severe lack of basic living conditions (Simmonds 1985). All these factors lead to rethinking sustainable development with a local vision.
Decoupling the use of natural resources from economic growth is a key development challenge. Decoupling sometimes works very well in developed countries. However, in Latin America and small cities in the Amazon region the results could be different because of the current problems of sustainability. Since Rostow´s economic growth model, the objective of achieving economic benefits and industrialization has been done at the expense of environmental degradation. Hence, as previously mentioned, people do not receive improved living conditions. In 1973, the World Bank acknowledged the trouble and the policy shift towards “redistribution with growth”, i.e. where poverty alleviation and the basic needs28 concept are prioritized.
Hunt (1989a) established a set of policy mechanisms that helps to obtain positive results in development. In his “Basic Needs Paradigm”, he argues that economic growth cannot solely ensure development. Instead, better income distribution is suggested. For developing countries, this would generate a more homogeneous demand pattern, induced investment, and extend demand for some products on a small and medium scale. Mass welfare is the means to obtain long term results. This strategy provides a link between small producers in agriculture, that is, where labor-intensity is high and where there are large scale manufacturing and services
26 In Latin America, especially during the 1960s and 1970s, development policy was defined by industrialization, and was oriented towards import substitution models in highly protectionist and non-competitive markets. The state acted as promoter of development. Another issue was that the planning process was found to be still top-down with large enterprises and contrastive technological poles of development. With the crises of the industrial model, an economic opening was the solution26. Free market principles formed the basis of the economic system. The debt crises, open markets and the reduction in the state's role caused serious social problems mainly in communities and rural regions. 27 “Its refers to the description of the contemporary state of neoliberalism. This is marked for the crisis of the very category of the project: be it a social, political, economic, cultural, technological, urban, or architectural one. The persistence of anti-neoliberal protests is not proof against, but rather itself an indication of, the aforementioned crisis, for as a form of political engagement, protests serve primarily to discredit the current regime and less to articulate an alternative” (Jeinić and Wagner 2013) 28 Basic Need from ILO

15
enterprises. The outcomes show a significant number of labor-intensive productions in rural areas, which means less poverty and long term income.
In order to accomplish this objective, a set of policy mechanisms have been defined. These are summarized in Box 2.2. The traditional sector needs external help to obtain better results. Land reform and superior infrastructure conditions also aid the process. On the other hand, marketing conditions in the traditional sector are unstable. This is why demand and supply guidelines are important. Popular participation is thus an integral part of the basic requirements. Different actors are integrated in this process, i.e. where local action and institutional support are provided and where pertinence is a key characteristic.
Source: Hunt (1989, p. 259)
Therefore, today it is argued that the onus of governance29 is placed on obtaining good results in the territorial dynamic and in establishing stakeholder connections. Our proposal links these dimensions with local stakeholders’ integration, thus achieving development in the long term (See Plate 2.1) (FAO 2013). A conceptual model is presented (See Figure 2.1) (Noordwwijk 2010) in which there is a direct interplay between farmers’ choices and landscape functions.
The shortest relationship will result in more efficient work with the aim of improving development. Indeed, the environment provides raw materials and energy to farmers without which production and consumption would be impossible. Moreover, farmers rely on natural resources for their livelihoods. The key to development is therefore to understand the significance of land-use management through the implementation of policy mechanisms and stakeholder intervention.
29 This endogenous proposal may help to solve problems related to natural resource management, land use planning, food security, migration, poverty alleviation, stakeholder interaction and other things pertinent to rural regions (Bessette 2006). This requires capacity building for inclusive and participatory processes, that is, from the use of resources and articulation of local actors for good governance to obtaining multilevel results in development (Eizaguirre et al. 2012)
Box 2.2 The main policy concerns of the basic needs paradigm
1. Asset distribution: land reform, creation of new productive assets. 2. Composition of demand: income distribution, price, credit policy, investment,
public sector production. 3. Choice of technology: farm size, price policy, credit policy, subsidies, public sector
investment. 4. Institutional development: interest rate policy, public sector investment, retraining
for extension personnel. 5. Popular participation in resource mobilization and allocation: promotion of local
associations, district level planning, reductions in absolute poverty, inequality and sources of rural patronage.
6. Creation and distribution of public services: public expenditure, popular participation in construction of capital assets.
7. Scale of public services: Dito, plus policy on fees and levies for use, and general tax policy.
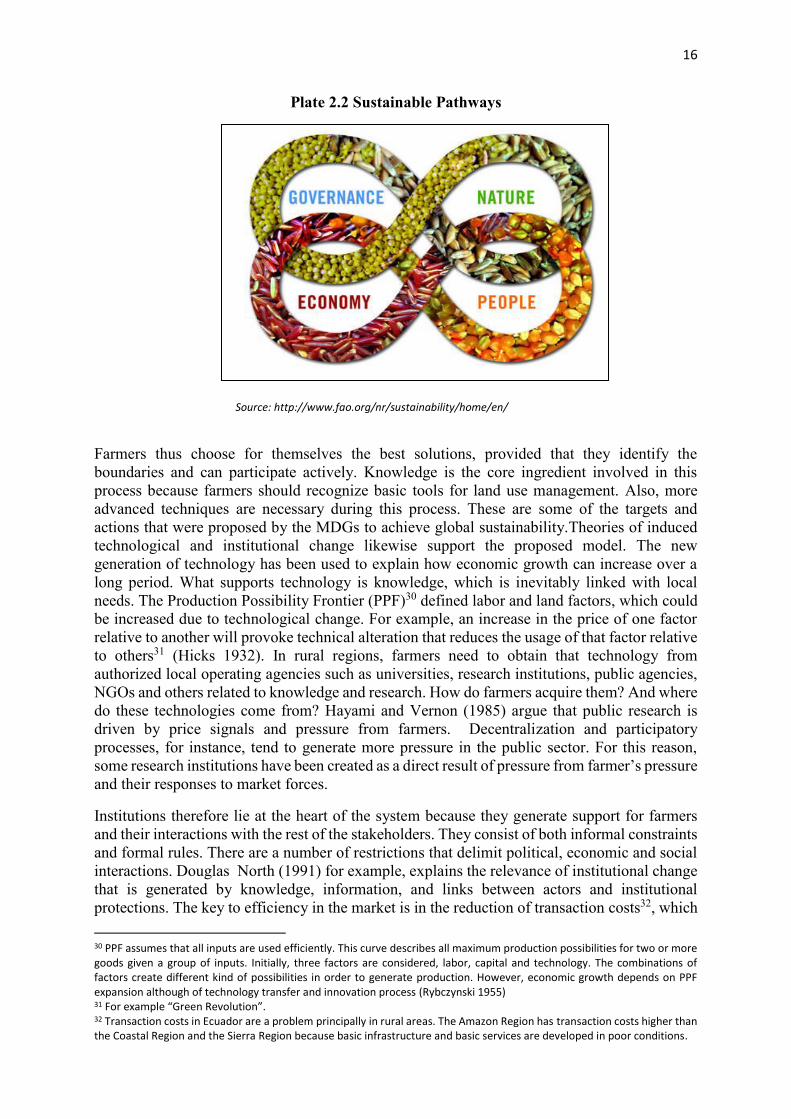
16
Plate 2.2 Sustainable Pathways
Source: http://www.fao.org/nr/sustainability/home/en/
Farmers thus choose for themselves the best solutions, provided that they identify the boundaries and can participate actively. Knowledge is the core ingredient involved in this process because farmers should recognize basic tools for land use management. Also, more advanced techniques are necessary during this process. These are some of the targets and actions that were proposed by the MDGs to achieve global sustainability.Theories of induced technological and institutional change likewise support the proposed model. The new generation of technology has been used to explain how economic growth can increase over a long period. What supports technology is knowledge, which is inevitably linked with local needs. The Production Possibility Frontier (PPF)30 defined labor and land factors, which could be increased due to technological change. For example, an increase in the price of one factor relative to another will provoke technical alteration that reduces the usage of that factor relative to others31 (Hicks 1932). In rural regions, farmers need to obtain that technology from authorized local operating agencies such as universities, research institutions, public agencies, NGOs and others related to knowledge and research. How do farmers acquire them? And where do these technologies come from? Hayami and Vernon (1985) argue that public research is driven by price signals and pressure from farmers. Decentralization and participatory processes, for instance, tend to generate more pressure in the public sector. For this reason, some research institutions have been created as a direct result of pressure from farmer’s pressure and their responses to market forces.
Institutions therefore lie at the heart of the system because they generate support for farmers and their interactions with the rest of the stakeholders. They consist of both informal constraints and formal rules. There are a number of restrictions that delimit political, economic and social interactions. Douglas North (1991) for example, explains the relevance of institutional change that is generated by knowledge, information, and links between actors and institutional protections. The key to efficiency in the market is in the reduction of transaction costs32, which 30 PPF assumes that all inputs are used efficiently. This curve describes all maximum production possibilities for two or more goods given a group of inputs. Initially, three factors are considered, labor, capital and technology. The combinations of factors create different kind of possibilities in order to generate production. However, economic growth depends on PPF expansion although of technology transfer and innovation process (Rybczynski 1955) 31 For example “Green Revolution”. 32 Transaction costs in Ecuador are a problem principally in rural areas. The Amazon Region has transaction costs higher than the Coastal Region and the Sierra Region because basic infrastructure and basic services are developed in poor conditions.

17
is understood in the rural sector as the costs of research, the bargaining process, negotiation, monitoring, and of writing up contracts. In the rural sector, small farmers spend a lot of financial resources on these kinds of transactions. Socioeconomic factors like loans, labor costs, land transactions and marketing activities can be improved when institutions are involved directly.
Figure 2.1: A schematic view on farmers ‘decisions concerning the landscape, factors and their influence upon decision-making
Source: Adapted from Noordwijk (2010)
Recent research indicates that technology transfers from institutions can help with the development process. However, stakeholder interaction largely depends on what is referred to as an integral local plan. Similarly, collective action and policy intervention may be incorporated to solve problems related to this field. It should also be borne in mind that rational choice has been part of the cause of land degradation. Therefore, the world needs to recognize the significance of market failures, and their effects on poverty. The Pareto-optimal criteria are therefore insufficient for dealing with these issues. The proposed model should recognize that the profit is sufficient to recompense for the disadvantages of the losses (Eggertsson 1990). It is precisely in the rural area where this situation creates a need for support smallholders, namely through policies and institutional interventions.
A more endogenous proposal would encourage local participation, that is, where the local community is actively involved in the entire development process. There are a few ways of achieving this. First, we can use the participatory process as a means of obtaining what we refer to as an open route, that is, where individuals have a voice in the decisions that concern them, and they are able to have local dialogues and promote civic action (Neef 2005a). The essential goal is to achieve the optimization of participatory methods. In the agricultural sector, participatory research has been seen as an answer for sustainability problems. However, it has not always been be successful. The integration among local and scientific knowledge is
K N O W L E D G E
Institutions
Marketing
Social Capital
Incentives
Poverty
A c t i o n
Biodiversity
C-stocks
Local Environmental
Functions
Care, plant, reforest
Use,extract, exploit Land -
scape Farmers‘ choice
18
required. Thus, the results can be seen as improvement in the long-term, i.e. when the small farmers and researches are committed to local goals. In sum, the integration of local and scientific knowledge should always align to the local vision in order to achieve sustainable development.
2.5 Research Hypotheses
The following research questions and hypotheses have been defined based on the multiple developmental dimensions and the review of the theoretical and empirical research and from the areas of household living conditions, local production, conservation practices and social structures.
One of the questions of this research is: How can we provide sustainability in an agricultural economy which has production capacity but low participation in market channels in the commercial sector (agricultural subsistence economy)? To answer this question, it is not enough to simply evaluate the actual situation, but it is necessary to know when and how to establish sustainable business models which can change the lives of farmers in rural areas. Could one alternative be the design of a model of endogenous agricultural growth?
Basically, we need to answer three key questions:
Is there currently a sustainable development from an economic, social and ecological standpoint for Yantzaza?
What strategies address sustainable development in farm management at the local level in Yantzaza?
What methods of knowledge and technology transfer can be used to cater to the needs of rural people within the context of integrated natural resource management?
In order to get a sustainable model from this research, the following essential hypothesis is presented.
Hypothesis
"Farms in the southern Ecuadorian Amazon do not operate sustainably from an economic, social and agro-ecological perspective”.
3. - Methodological Framework of the Research
3.1 Overview and research methodology
The concept of sustainable33 economic development was included in the interaction of economic, social, and ecological components a quarter century ago - with the sole purpose of reducing social inequalities34 and ensuring effective rural development35.
33 Sustainability is understood as the capacity of future generations to obtain the same welfare level as present generations. 34 Hunt (1989) said that what matters is that people have the minimum requirements of household consumption (food, shelter and clothing) as well as essential access to basic services, suitable paid work and the satisfaction of needs-- considering reality as set of basic needs and pillars of development. 35 Ignacy Sachs (1980) refers to eco-development, which means to introduce ecological perspectives into the development concept. It is important to bear in mind that ecological economy studies all the objects that make up the biosphere and natural resources; there is no reference to the usefulness of these objects on human societies, the environment is worth more by itself than by its usefulness. This approach has conditioned a research group to try to think about development by considering the ecological issue itself and not only because of its usefulness. As stated by anthropocentric ethics, things are different not just for their value, but for how they are valued; this criterion intensifies the extension of the concept to

19
Based on this premise, natural capital is considered to be of immense importance, which up until recently, was considered to be irrelevant. However, since the 1990s, there has been a growing need for natural capital, which has arisen as a result of neoclassical theory. Sustainability can be measured based on certain hypotheses that are linked together; these hypotheses concern innovation, investment, prices, and market-to-market channels. In addition, there have been important constraints on environmental management due to the heterogeneity of the involved elements and the limitations on farm management (Egledow and Barker 1997). Sustainable principles are essential due to the high degree of cohesion and balance among markets, government and civil society. They are also important because of participatory planning processes, and because they are understood as an interaction between the key agents involved in these processes. For this reason, the statement by Smyth and Dumansky (1993) on sustainable agriculture and water management consolidates the definition given above. Its five pillars of sustainability include: productivity, stability, security, protection of natural resources, feasibility and acceptability. These five pillars define the minimum framework needed to allow development. Our methodological base is taken from this criterion, where four (Plate 2.1) sustainable dimensions are involved according to some basic statements. Nowadays, it is not easy to find development proposals that do not have participatory methods included. Essentially, it is because the focus of development starts with needs from local communities and stakeholders. Therefore, all internal process should engage local actors, in order to achieve the goal rather than just concentrating on producing results. Neef (2005a) affirms that the participatory action model is the new (universal) paradigm for agricultural research and rural development. According to this point of view, local people ought to be involved in the development projects since they are aware of key problems and possible solutions to alleviating poverty. Local knowledge has to be an important part of the local proposal. Participatory research in rural development and natural resources management have been greatly discussed by researchers in order to develop sustainability (Chambers and Arnold, P., Thrupp, L 1989) (Neef 2003) (Ashworth and Voogd 1990). The origin of this scheme results from failures in the 1960s and 1980s when top-down planning processes were used. During that time, long surveys with high costs and lengthy research periods created a rift between social community concerns and that of the researchers. This type of investigation was previously called “Rapid Rural Appraisal” (RRA) (Chambers 1994). However, Participatory Rural Appraisal (PRA)36 replaced RRA due to the importance of including local people with the researchers in the development process. extended anthropocentric ethics. In order to achieve eco-development, there should exist a connection between the environment and rural areas; the latter plays an important role in economic interactions. For Armstrong and Taylor (2000) rural development is conceptualized from the ability of industries in the region to compete their production function. Factors such as land, labor and capital are integrated, allowing for the creation of employment and investment - as long as there is a perfect balance. However, inequalities are often the cause of unemployment, as well as a lack of savings and an overall unsustainable extraction of natural resources. Rural development theories have their origins in the neoclassical thinking with traditional models and agglomeration, where capital and labor determine the savings, growth and henceforth development (Terluin, 2003). Although in some ways they were successful in some parts of the world, it failed in South American countries. Therefore, authors such as Beccattini (1987) or Lacoponi et al. (1995) support the development from local milieu models that are based on endogenous growth and rural development. Endogenous Development is to be understood as local development, produced by mainly local impulses and grounded largely on local resources that basically encourages the realization of this work.
36 “PRA is short-cut method of data collection. It is a methodology for action research and utilizes a range of techniques. It involves local people and outsiders from different sectors and disciplines. Outsiders assist local people in analyzing information practicing critical self-awareness, taking responsibility and sharing knowledge of life and conditions in order to plan and to act” Bhandari (2003a)
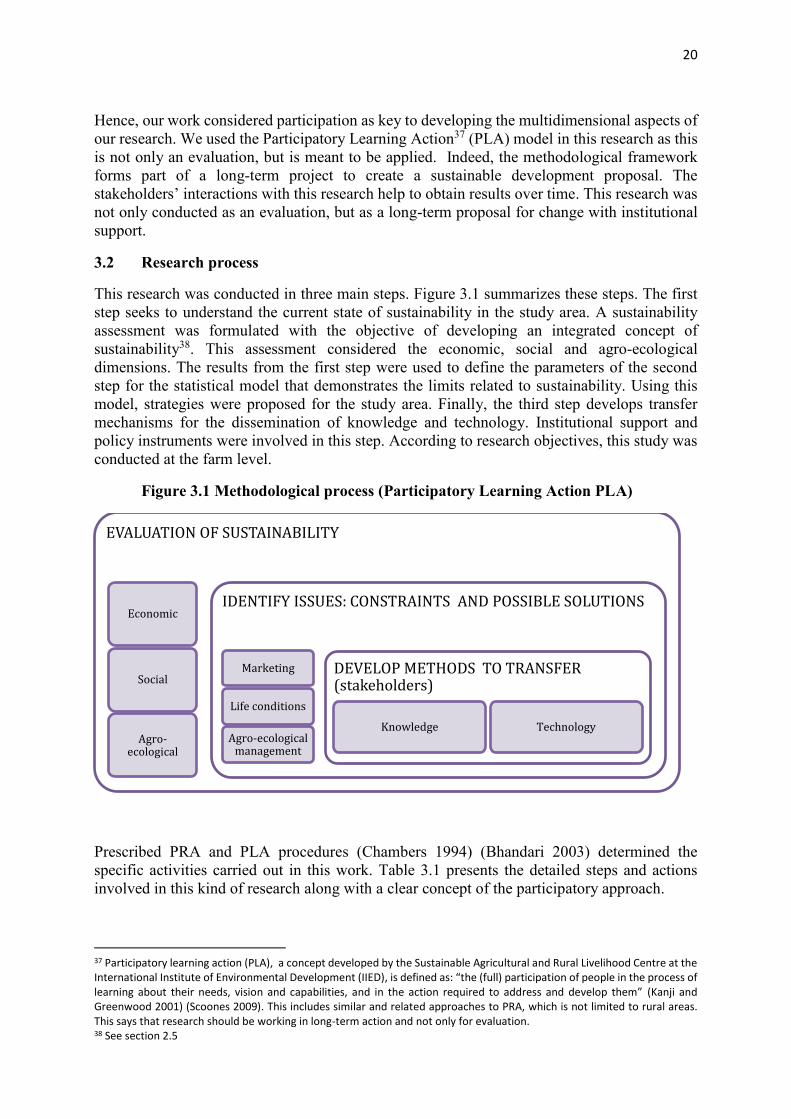
20
Hence, our work considered participation as key to developing the multidimensional aspects of our research. We used the Participatory Learning Action37 (PLA) model in this research as this is not only an evaluation, but is meant to be applied. Indeed, the methodological framework forms part of a long-term project to create a sustainable development proposal. The stakeholders’ interactions with this research help to obtain results over time. This research was not only conducted as an evaluation, but as a long-term proposal for change with institutional support.
3.2 Research process
This research was conducted in three main steps. Figure 3.1 summarizes these steps. The first step seeks to understand the current state of sustainability in the study area. A sustainability assessment was formulated with the objective of developing an integrated concept of sustainability38. This assessment considered the economic, social and agro-ecological dimensions. The results from the first step were used to define the parameters of the second step for the statistical model that demonstrates the limits related to sustainability. Using this model, strategies were proposed for the study area. Finally, the third step develops transfer mechanisms for the dissemination of knowledge and technology. Institutional support and policy instruments were involved in this step. According to research objectives, this study was conducted at the farm level.
Figure 3.1 Methodological process (Participatory Learning Action PLA)
Prescribed PRA and PLA procedures (Chambers 1994) (Bhandari 2003) determined the specific activities carried out in this work. Table 3.1 presents the detailed steps and actions involved in this kind of research along with a clear concept of the participatory approach. 37 Participatory learning action (PLA), a concept developed by the Sustainable Agricultural and Rural Livelihood Centre at the International Institute of Environmental Development (IIED), is defined as: “the (full) participation of people in the process of learning about their needs, vision and capabilities, and in the action required to address and develop them” (Kanji and Greenwood 2001) (Scoones 2009). This includes similar and related approaches to PRA, which is not limited to rural areas. This says that research should be working in long-term action and not only for evaluation. 38 See section 2.5
EVALUATION OF SUSTAINABILITY
Economic
Social
Agro-ecological
IDENTIFY ISSUES: CONSTRAINTS AND POSSIBLE SOLUTIONS
Marketing
Life conditions
Agro-ecological management
DEVELOP METHODS TO TRANSFER (stakeholders)
Knowledge Technology

21
Table 3.1 Participatory Learning Action (PLA)
Definition Steps Activities "The (full) participation of the people in the processes of learning about their needs, vision and capabilities, and in the action required to address and develop them" (Kanji and Greenwood 2001, p.10)
1. Learn about the issues thoroughly
- Data collection methods: Secondary data, direct observation in the farms, surveys, focus groups, direct interviews with leaders (public government and farmers), and analytical game.
- Behavior Attitudes -Information - Sharing information - Report - Long term compromise
2. Experience and evaluate the knowledge
-Asking small groups of farmers about: marketing problems, family income, labor, mechanization, human and social capital, livestock and agricultural management, land use management, conservation soils practices, yield in the farms -Worked on strategies to get solutions (economic, social, agro-ecological and institutional) -Some strategies are defined -Ask farmers about results -Feedback
3. Adapt the knowledge and Technology for the
Community
-New organizations are involved -Discuss the type of solutions suggested for their community -Discuss the way they want to tackle the problems (economic, social, agro-ecological and institutional) -Discuss the implementation of Participatory Technology development -Develop a tentative guideline for adapting plan -Stakeholders discussion (common decision)
4. Promote the Knowledge -Develop a plan of action for dissemination of knowledge and technology
-Stakeholder networks Source: Own elaboration, adapted from (Bhandari 2003)
3.3 Selection of the case study
In the early 1960s, Ecuador was one of many Latin American countries that adopted the model of "import substitution"39 as a paradigm of growth and development. The need to increase exports through industrialization led to an increase in imports of capital and intermediate goods, which in turn contributed to an imbalance in terms of trade. State protection of domestic industry through subsidies and exchange rate policy led to an external debt that exploded in the 1980s. The effects were high inflation and loss of domestic competitiveness.
The labor force coming from rural areas was characterized by being cheap and of a low technical level, which was directly related to the capital needs of the system in addition to the unbalanced exploitation of natural resources.
39 See section 1.3
22
A mid-century traditional model was adopted considering the industrial capacity of temporary employment which generated very few new part-time jobs. This led to the internal migration phenomena, mainly toward the poles of attraction borne from the economic booms. Additionally, this lead to increased agricultural40 monoculture spaces at the expense of forests in an attempt to take advantage of the external demand for commodities. Capital was prefered instead of labor because the model was capital intensive and non-binding. In 1982 for example, only 12.9% of the economically active population was employed, thus indicating a lack of differentiated primary production in rural areas leading to a 12% increase in poverty from 1995 to 1999 (Larrea 2003).
With the birth of the oil boom41 (1972) the matrix of natural production varied depending on the domestic development centers, and therefore generated significant agglomeration effects. Economic Growth through the polarization of the production areas of commodities and major provinces generated a new economic geography. Even with this new economic geography, the proposed theories of accumulation did not occur. There were two main reasons for the cause. The first was the unjust distribution of land, despite the land reform of 1964. This led to 43. 4% of the rural population owning only 2% of the land and 2.3% of landlords owning approximately 42.6%, with a Gini coefficient of 0.80 (Castro 2007). And the second was due to the poor distribution of income, whose urban Gini for 2000 was 0.570 and 0.513 in rural areas (Chiriboga 2010). The land and income disparities perfectly demonstrate the differences between urban and rural sectors. On the basis of the foregoing considerations, it is hard to resolve the development problem in Ecuador. However, due to the oil dependence and natural resources management combined with the high level of poverty, studying the Amazon region in Ecuador is key to finding new development proposals. The Amazon region in South America is a vast region comprising of rainforests and the Amazon River Basin. These specific geographical features create complex geographic distortions causing economic, social and ecological problems. Deutsche Forschungsgemeinschaft (DFG) Research Unit 402 called “Biodiversity and Sustainable Management of a Megadiverse Mountain Ecosystem in Southern Ecuador” has been investigating Southern Ecuador since 2000. The international research cooperation between Germany and Ecuador facilitated this study. The core of the research activities expands around the research station ECSF (Estación Científica San Francisico)42 (Bendix et al. 2013). ECSF is focused on ecological experiments related to geology, geomorphology, soils, climate, biodiversity, and more.
It is nevertheless important to make a distinction between the environmental topics and the basic needs of the affected population. This is one of the main reasons why social researchers view this region as a significant site to study. The Universidad Técnica Particular de Loja43 has taken advantage of its position by establishing a link with local actors, farmers and international organizations. The University believes that a new set of projects and programs focused on development are needed. A first trial to improve development was conducted with the present research. 40 In Ecuador, 59% of the rural people are involved in the primary sector, i.e., agriculture, livestock and forestry production. This industry contributes only 7. 5% and the rest belong to the tertiary sector. (García 2007) 41 Oil boom began in 1972 when the oilfields were discovered in Ecuador’s Amazon Region. From 1973 to today, Ecuador’s economic model has been regulated by oil activity. 42ECSF is located in the Andean part of south-eastern Ecuador between the provincial capital Loja and Zamora (lat. 3°58’18’’ S, long. 79°4’45’’ W, 1860 m a.s.l.) (Bendix et al. 2013). 43 Universidad Técnica Particular de Loja (UTPL) is located in the Loja province of southern Ecuador. This institution has been working in international cooperation with universities and development agencies of Germany. For this reason, this research was conducted with international funds, and researchers involved from Germany and Ecuador. The social participation and linkage with the population is the principal objective of the university.
23
The status of the mountain ecosystems encircling native forest and pastures as the anthropogenic substitute systems shows that the current mode of development is not sustainable in the Ecuadorian Amazon region. Hence, some ecosystem services have been affected by land use practices and the over-exploitation of natural resources. Some areas located in the southern Amazon are affected by similar concerns (Beck et al. 2008).
On other hand, in southern Ecuador, agriculture is the most significant economic activity. Zamora Chinchipe is a province located in southern Ecuador. In this province, as much as 59% of its population works in the primary sector. Since 1960, this province started the migration process due to new roads connecting the Andean and Amazonian areas and national land reforms that helped to colonize the rainforest (Pohle 2008).
In short, all of the above confirms that this region is an excellent area to study sustainable development. Our focus was on Yantzaza44, a part of Zamora Chinchipe province. We selected Yantzaza as our specific study area based on its socio-economic and ecological characteristics, stakeholders’ participation, environmental concerns, agricultural production, landscape conditions, poverty, availability of secondary data and geographical conditions.
3.4 Data collection methods and tools
PLA45 (Bhandari 2003) suggest using some features to obtain better results in the research. This method uses a set of techniques that involves local people and outsiders. The process should be iterative, innovative, interactive, and informal and involve the community. Methods and tools that stem from the field of empirical social research have been used to collect qualitative and quantitative primary and secondary data.
3.4.1 Exploration survey
A clear and accurate way of learning about a case study is to visit the area. The researcher and his team are introduced to the sector in order to learn more about the current situation (Neuman 2000). Transectional walks allow the research team to get a feel for the area as they walk across it. Using the observational method throughout the walks, the research group becomes acquainted with the environmental and socio-economic conditions of the study area. Strategies are used to facilitate direct observation of the local stakeholders also.
In this exploratory phase, local actors were divided in three different target groups: public, local organizations and individuals, and foreign researchers46. Researchers took advantage of the University47 umbrella in order to have more opportunities to work closely with local actors. The research team spoke with the public leaders to define tactics, gather information and build a spirit of collaboration. Public agencies from different levels discussed the current conditions of the study area. Both researchers and the public shared feedback to facilitate future work. Sustainable goals and inter-institutional collaboration was defined. A tentative plan was written 44 See section 4. 45 PLA maintain the basic procedure conducted in PRA; however, behavior and attitudes about sharing can be improved in PLA. 46 Foreign researchers are from Germany principally (Soil science and environmental researchers from Dresden University of Technology were working in this area; therefore, some information for this work has been developed together). They were working in environmental projects mostly, which from their agro-ecological point of view helped in the research. 47 The research group belongs to the Universidad Técnica Particular de Loja (UTPL) in Ecuador. This university is working in the south of Ecuador, and has a good relationship with the local actors. Also, local agreements in environmental and socio-economic topics helped this research. During the last two years UTPL has been working with the university extension center called “Departamento de Política Pública”, which collaborates on research and transfer projects. Research and extension is the objective of this department. With the cooperation of local stakeholders, UTPL has aimed to improve the living conditions of the population.

24
with the purpose of sharing information in order to work together. Deliberations with the key informants also assisted the selection of environmental and socio-economic variables for inclusion in the household surveys. The review of local plans and proposals complemented the information. These documents were submitted to the research team under institutional cooperation. The University holds an institutional collaboration with some farmer groups48, principally in agriculture and cattle projects linked with the academic programs. Informal interviews with the leaders of those groups added to the public information collected. During the reconnaissance phase, technical staff from public agencies, farmers and researchers developed a set of ideas in order to define the necessary variables for the next steps of the study. The results were outlined so that comprimises for future research which require a high level of participation could be made. The foreign researchers from Germany also assisted the research process by defining the agro-ecological variables due to their experience in environmental topics. Their collaboration was essential in this research because it allowed different sustainable dimensions to be integrated in the research.
3.4.2 Household survey
After an analysis of the initial data, a structured survey was prepared for the fieldwork (Asian Development Bank 2002) (Deaton 1997) (Deaton and Zaidi 2002). The first step helped to obtain a good draft of the theoretical framework. In order to obtain better results, some items were pre-tested with five leaders in the region. We conducted surveys in a total of 154 households49 (see appendix 1), among male and female informants50, in Yantzaza’s rural sector. The age of the head of households, which ranged between 18 to 80 years, was taken into account during the interview process. A leader from the community accompanied the research team during the fieldwork.
With the aim of obtaining reliable information, the researchers organized a focus group with the community. A large number of people associated with the university’s agricultural and cattle programs51 arrived. Three different meetings were carried out with a large number of farmers. Many farmers wanted to participate but others were indifferent. Basic information was shared between the groups and the farmers agreed to collaborate with us. After that formal meeting, the researchers met individually with the farmers to establish direct relationships. Then, to introduce the research, the researchers spoke with each farmer. A team was formed of four researchers (two from TU Dresden and two from UTPL), four research assistants and eight students from UTPL to collect the data. The research team had four prior discussion meetings to define the information gathering instruments. The survey was first validated by Professors
48 Non organized Groups 49 This value was conducted in the field-work, however the indicators were conducted with 146 households because there were errors in 8 of them. 50 The proposal used statistical sampling model to define a significant number of farms based on sampling methods and research needs. Given the nature of the research, an alternative sample stratification was chosen, although it is known that the larger the sample the better, but it is still better to have a representative sample of 30 elements instead of a non-representative sample of 80 (Jiménez et al. 1983). It was determined that the farms are distinguished according to size. Four differents types of farms were described. When the surveys were conducted with groups of over 40 elements, they were considered a large sample (García 2005). We used a statistical sampling model to define a significant number of farms, depending on the stratification and research needs. 51 UTPL developed some strategies in order to improve regional conditions in the south of Ecuador. One of the proposals is the company's dairy Ecolac. This company began to operate in 1982 as a training center for students. The company continued but as a small business that developed products with the trademark "La Colina". Later in 1999, it acquired the name Ecolac, thus constituting a solid company. In regard to daily production enterprise the company produces pasteurized milk, yogurt, mozzarella cheese, butter and small delicacies. It processes about 7500-8000 liters of milk, 5000 of which are brought from four collection centers located in the province of Zamora, Chicaña, Chamico, Suny, and Yanzatza, while the rest comes from the basin of Loja. In Zamora, there are 167 suppliers and with five members per household, which means that more than 1.5 people benefited indirectly by each supplier. The average income is $ 784 per provider.
25
Franz Makeschin and Franz Heidhues and also discussed between the team of German and Ecuadorian researchers. The team of Ecuadorian researchers was then in charge of training the first research assistants (who acted as supervisors of field work) and the students about obtaining the information, so that they all have the same skills and abilities in the development of the poll. The discussion of this topic was very important because some alternatives were redefined and also tests were made during this process where the average time per survey was determined. There were four working sessions at the UTPL with the supervisors and five with the students, i.e. prior to the visit to the farmers. Finally, the research assistants who functioned as supervisors, coordinated groups of students to solve problems during the development of the work and to standardize criteria. This team developed the interviews face to face with the farmers. All conversations were conducted in Spanish. A set of questions was prepared in order to obtain the information for the survey.
The survey was made according to the sustainability dimensions. This survey was compiled of a set of standardized questions and anwers based on a numerical scale (refer to appendix 2). A few open-ended questions inquiring about alternatives and rankings were asked towards the end of the survey. The survey was compiled according to specific methodological requirements and with the hopes of obtaining reliable primary information. Five different topics were included to facilitate the sequence of results. An introductory part contained the general overview about the household. General data was taken in order to identify the farms. Then, economic, social and agro-ecological variables were considered. For these three variables, key information was obtained and coded based on specific categories of interest and based on particular scales to facilitate the analysis of the data later on. The current economic situation and productivity conditions are the most important topics in economic evaluation. The main themes and dimensions that we are studying are based on the lifestyle, social and environmental conditions of the area. Land use management and conservation practices were tackled based on agro-ecological location. The final part of the survey included specific questions about marketing conditions for agriculture and cattle, as well as about the region’s financial situation.
Yantzaza has three rural parishes. In order to cover the entire area, the group decided to make a survey for each one. We were attempting to simulate simple random sampling from the entire population. The key parameter for the surveys was the farm’s size. Four different farm sizes, based on the number of hectares, were identified: large-scale, large, medium and small. Each category was tested with the same probability52. The interviews lasted 90 minutes on average. Answers were recorded from head farmers, sometimes with the assistance of family members. The interviews were conversationally based, however, in some technical parameters the leader of the community facilitated our understanding. We obtained a map from each farm to record the farm distribution and land use management. Observation was necessary to obtain some survey answers. Each survey included a walk on the farm with the purpose of the researcher directly observing and recording specific characteristics.
The fieldwork was conducted during a one month period of time which had been agreed upon during the initial meetings. The international collaboration between German and Ecuadorian researchers took place during the fieldwork. Information from the interviews was mainly recorded in the written polls and extra notes. Other instruments of data collection were advantageous to clarifying the current situation. Cams, tape recorder and computers have been elemental tools in order to facilitate the information transfer.
52 A third of the total surveys were conducted in each category according national census MAGAP (2000).
26
3.4.3 Focus groups
Focus groups (Kamberelis and Dimitriadis 2013) (Kiribati. Ministry of Finance and Economic Planning 2004) (Krueger and Casey 2014) are a qualitative research technique that is used to deepen the knowledge of certain topics (Liamputtong 2011). After one year approximately, researchers prepared a new general meeting with the farmers related to the household survey. The University sent selective personal invitations throughout the research department. Farmers and the university remained active throughout the research study. Participation53 is clearly required in this study. Therefore, all the information and techniques were discussed between local people, researchers and public agencies (Morgan 1997). Three general meetings were defined (like in the household interviews), and in each one four focus groups were conducted in order to collect quality information from the farmers. One researcher, one student and a group of farmers composed every small group. Local technicians and coordinators from public agencies participated in all the groups but only for a few minutes in each one. A set of questions (see Appendix 3) was prepared according to the evaluation results, secondary data and technique proposals. Thus, the discussion also provided feedback from the local participators. Farmers revealed other interesting information. The in-depth groups helped to verify the information.
Two objectives were defined in these events. The first objective was to share the results from field work, i.e. economic, social and agroecological information with the local people. The second was to compare and contrast the information obtained to the researchers’ technical ideas. With regard to the first objective, sustainable dimensions and agricultural and cattle management solutions were analyzed. Local contribution was significant and consequently the results could be verified. Second, additional information was obtained according to the researchers’ priorities and farmers’ needs. The combination of these contributions has been part of the discussion in these focus groups.
Some analytical tools were used (e.g., flowcharts, cause-and-effect diagrams, maps) that helped to improve the data collection. In view of the research objectives, all technical ideas about upcoming steps needed to be discussed. Farmers tried to establish basic parameters and ranges in order to increase the sustainability in Yantzaza. Referential themes and specific vulnerable variables were explored. The three dimensions interact as a poly mechanism thus contributing to the integrative model.
Outcomes from the focus group are summarized in the reports. Information gained from the feedback sessions was widely analyzed. Public actors who participated in the focus group took local ideas into account. However, the local community does not have a strong structure to follow and implement the proposals. A series of policies mechanisms were discussed with the hope of being transmitted to the stakeholders involved. The participatory action process includes linking all individuals to collective goals.
3.4.4 Additional data collection
Researchers have made the decision to apply two different strategies to facilitate the second and third stages of the general proposal (Morgan 1997). According to the steps54in the study, there is a set of mechanisms to develop the solutions after the survey is finished. Additional data collection is necessary in order to develop better mechanisms and policy actions from the public and private stakeholders.
53 See Table 3.1 54 See Figure 3.1
27
First, direct observation subsequent to the survey results is important, especially when the researchers shared the first results with the local people and public agencies. This is essential for the design of subsequent research steps and aides in sustaining relationships with farmers as they continue their normal activities. The desire to integrate the author into the community was considered necessary to obtaining participative solutions for the study area. Researchers had the opportunity to live a couple of days in the current conditions of the farmers. The scientists can better understand the depths of the society and rural regions by observing the human and social features. Local knowledge cannot be learnt when farmers do not trust the researchers. Therefore, participation in informal activities such as sowing, harvesting, cooking, walking, and talking were part of the normal affairs in the area.
Second, beyond the interaction with community leaders, institutional support is part of the sustainable development model’s dimensions. Public actors from national and local level were interviewed (refer to appendix 4). In the third step, knowledge and technology transfer, the institutional framework data is required. Qualitative data are able to satisfy the requirements in order establish the current situation. A basic matrix (refer to appendix 5) was built according to the vulnerability of the variables, local community participation, public technical suggestions, and external experts.55
3.5 Analytical approach and statistical methods
3.5.1 Data compilation and format
The interviews carried out through surveys, were transcribed using MS Word (2007) documents in order to create a general database with the information. The written interviews and value scale of the face-to-face conversation were processed using MS Excel sheets. The focus group information of the participatory rural appraisal56 was written in papers and on blackboards and afterwards transcribed into MS Word documents. These results have been presented in tables.
Interviews with local stakeholders associated to the study due to institutional support was written in MS Word with the intention of building matrixes and graphs based on the results. The set of values processed in MS Excel was compiled and listed in a MS Excel matrix in order to obtain a sum of results. These contain all outcomes from the fieldwork. The data sets produced were made agreeable to quantitative statistical examination by transferring them to the SPSS software package (2004). A set of variables and indicators were defined. The indicator matrix was obtained and added using this software. Indicators were listed and aggregated in indices for each specific dimension. The results were presented in graphs and tables.
The set of indicators were used for statistical analysis. Econometric analyses were necessary, and used the STATA statistical package (2011) to facilitate statistical understanding. The results were presented in graphs and tables. Relevant data from observation, secondary references, experiences, comparable studies and public agencies were also compiled in tables and graphs in order to facilitate a future analysis. Figures and boxes helped some statistical processes.
55 Expert commentaries were received from social and environmental scientists about similar cases in others countries. Professors from Germany involved in the research traveled to Ecuador in order to visit the case study area. Some suggestions were developed. 56 See PRA

28
3.5.2 Statistical methods
Quantitative and qualitative research methods were developed with the intention of understanding the current situation of the farmers in order to establish the research objectives. The research therefore largely makes statistical inferences based on the empirical data from the testing of the study hypothesis in order to answer the research goals. Qualitative data derived from the surveys were tested and used for analytic procedures in order to obtain satisfactory results.
3.5.2.1 Composite Indicators
Taking into account the objectives of Agenda 21 as a priority and being aware of the agricultural potential in Yantzaza, it was decided to assess the economic, social and ecological dimensions. A reference was made to FESLM (International Framework for Evaluating Sustainable Land Management) (Smyth and Dumansky 1993). With the objective of raising attention on the use of indicators for sustainable agriculture and for rural development, the ecological dimension was adjusted from the agroecological perspective. "The evaluation of sustainable land management is an integral part of the process of harmonizing agriculture and food production with the often conflicting interests of economics and the environment" (ibid., p. 4). Agriculture has been and will be linked to development in many developing countries for this reason, it is necessary to increase its productivity, to be economically efficient and also friendly with the sustainable environment. Sustainability does not only imply the continuing stability of productivity levels, but also refers to the resilience of the land, which is considered to have the ability to be quickly recovered (World Bank 2001). A composite indicator is a tool for learning about the current system in the Amazon region and has the potential to indicate which of several management options available may be the most effective. Three criteria that defined the indicators were environmental key concerns and livelihoods, and economic activity57.
Nevertheless, the quantification of agricultural sustainability in rural regions by means of indicators continues to present operational problems. We are convinced that the success of this strategy depends on the capacity to actively involve all dimensions of the composite indicators. (Gómez-Limón and Sanchez-Fernández 2009). In relation to this, we referenced three different models. First, it is a publication produced by FAO which describes the five pillars of sustainable agricultural and food production on the basis of productivity, stability/security, natural resources protection, economic viability and acceptability (Smyth and Dumansky 1993).
Secondly, “Production project to revive vulnerable areas in the tropical regions of Central America (2009)” (González et al. 2009) which was developed in the central areas of the continent with a few changes that focus on the creation of productive systems. Thirdly, we referred to the publication by Van Cauwenbergh et al. (2007) titled “Sustainable assessment of farming and the environment framework (SAFE)”. Many attempts have been made to find the best solution by applying different kinds of combinations and using alternative dimensions (See Table 3.2). (Gómez and Sanchez 2010) (Masera et al. 1999) (López-Ridaura et al. 2002).
57 Agricultural activity is the most common economic activity in Yantzaza according the national agricultural census in Ecuador (MAGAP 2000)

29
Table 3.2 International framework for the evaluation of sustainable land management
Pillars of sustainability (Smyth and Dumansky 1993)
Sustainability Attributes (López-Ridaura et al. 2002)
Maintain or enhance production/services (productivity)
Efficiency, yields and profits, return to labor (productivity)
Reduce the level of production risk (security)
Ability to change and adopt new technology (adaptability)
Protect the potential of natural resources and prevent degradation of soil and water quality (protection)
Degradation and conservation of resources, agro diversity, crop damages, variability of input/output prices (stability, resilience, reliability)
Be economically viable (viability) Distribution of costs and benefits
(equity)
Be socially acceptable (acceptability)
Organization and participation, degree of dependence from external inputs (self-reliance)
According Gomez-Limon et al. (2010) composite indicators are therefore useful as a means of a) summarizing the information for the stakeholders b) permitting the farms to be ranked from best to worst in order to facilitate understanding of the currently conditions of the study area. In environmental sciences “An indicator is a parameter or value that reflects the condition of an environmental (or human health) component, usually with significance that extends beyond the measurement or value itself. Used alone or in combination, indicators provide the means to assess progress toward one or more objectives…” (Shear et. al., 2003, p. 122).
The research followed ten basic steps to obtain the sustainability indices through the indicators composition (OECD 2008). First, initial information helped to build the surveys58 on the basis of sustainable development concepts59. A significant theoretical discussion was conducted60.
Second, three kinds of categories were planned. From an integral viewpoint, economic, social and agro-ecological indicators encompassed the basic dimensions of sustainability (Smyth and Dumansky 1993). The third step referred to repairing gaps. Thus, the Multivariate analysis61 is suggested because this technique allows us to find out if there are correlations between indicators of different dimensions. In case of the existence of such correlations, the correlated variable should be eliminated. Clustering techniques are preferred in order to simplify the process in the case that correlations could be high (Gómez-Limón and Sanchez-Fernández 2010). Then, the indicators were normalized. They need to be expressed in the homogeneous measurement with the intention of comparing similar units. The survey assured a similar scale so as to establish common results. Primary information was transferred to the same type of scale. IT programs were used to facilitate this work. A scale was defined between 0, which corresponds to minimum value (low sustainability), and 5, corresponds upper scale value (acceptable sustainability), which is defined by the maximum number in the scale related with the indicator (when the indicator represents 100% in the scale) (refer to Appendix 6)
58 See Household survey in Annex 2. 59 Smith & Dumansky (1993) 60 See section 2.1; 2.2 and 2.3 61 González et al. (2009) suggest in assessment research to apply multivariate analysis because correlations between variables can affect the results.
30
In the next stage, the weighting of indicators is necessary. In our survey, researchers defined each indicator with the same probability due to lack of information that could help us in this step. Indeed in stages 7, 8 and 9, an aggregation of indicators was made. Three dimensions with a set of indicators were defined. The arithmetical mean served as the statistical measurement (Hediger 1999). In relation to sustainability though, an exact measurement does not exist. Because of this, there is an alternative measurement developed by scientists around the world. (McAllister 1980). Finally in stage 10, the results are presented. In the next chapters we will discuss all the outcomes.
Table 3.3 presents the indicators list with the definitions according to agricultural sustainability proposal by Smyth and Dumansky. Also, in this table a set of sub-indicators is presented in order to improve the definitions.
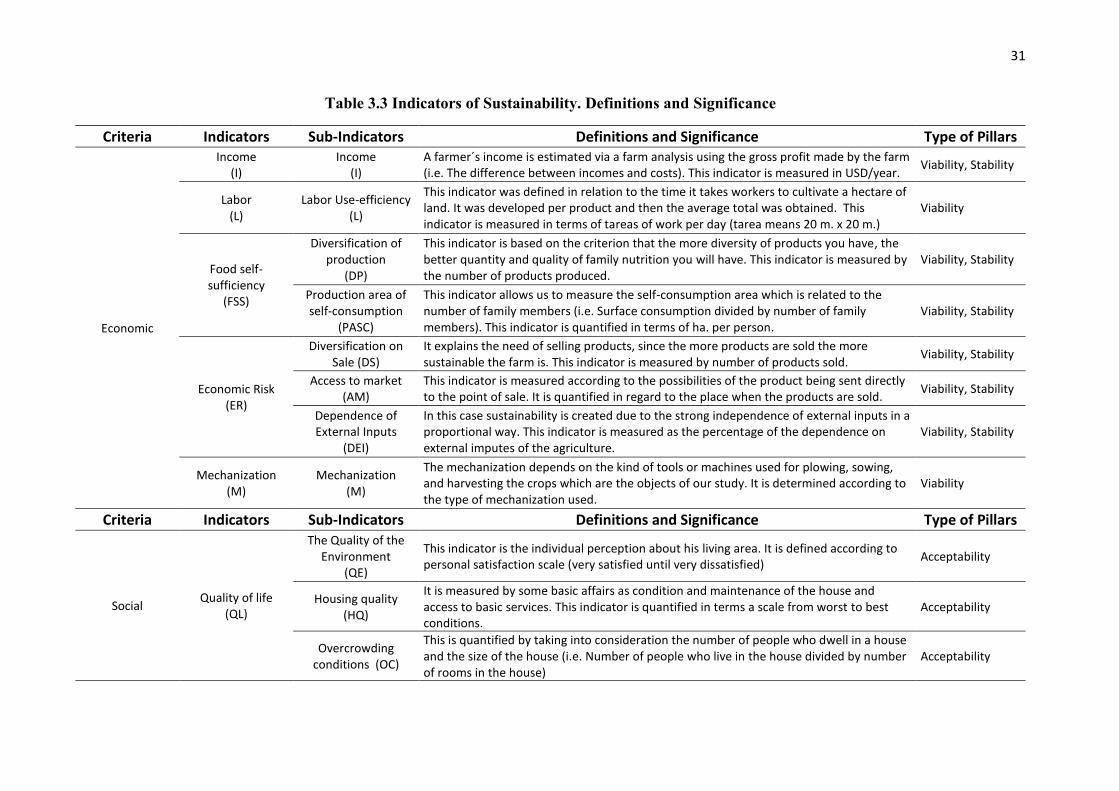
31
Table 3.3 Indicators of Sustainability. Definitions and Significance
Criteria Indicators Sub-Indicators Definitions and Significance Type of Pillars
Economic
Income (I)
Income (I)
A farmer´s income is estimated via a farm analysis using the gross profit made by the farm (i.e. The difference between incomes and costs). This indicator is measured in USD/year.
Viability, Stability
Labor (L)
Labor Use-efficiency (L)
This indicator was defined in relation to the time it takes workers to cultivate a hectare of land. It was developed per product and then the average total was obtained. This indicator is measured in terms of tareas of work per day (tarea means 20 m. x 20 m.)
Viability
Food self-sufficiency
(FSS)
Diversification of production
(DP)
This indicator is based on the criterion that the more diversity of products you have, the better quantity and quality of family nutrition you will have. This indicator is measured by the number of products produced.
Viability, Stability
Production area of self-consumption
(PASC)
This indicator allows us to measure the self-consumption area which is related to the number of family members (i.e. Surface consumption divided by number of family members). This indicator is quantified in terms of ha. per person.
Viability, Stability
Economic Risk (ER)
Diversification on Sale (DS)
It explains the need of selling products, since the more products are sold the more sustainable the farm is. This indicator is measured by number of products sold.
Viability, Stability
Access to market (AM)
This indicator is measured according to the possibilities of the product being sent directly to the point of sale. It is quantified in regard to the place when the products are sold.
Viability, Stability
Dependence of External Inputs
(DEI)
In this case sustainability is created due to the strong independence of external inputs in a proportional way. This indicator is measured as the percentage of the dependence on external imputes of the agriculture.
Viability, Stability
Mechanization (M)
Mechanization (M)
The mechanization depends on the kind of tools or machines used for plowing, sowing, and harvesting the crops which are the objects of our study. It is determined according to the type of mechanization used.
Viability
Criteria Indicators Sub-Indicators Definitions and Significance Type of Pillars
Social Quality of life
(QL)
The Quality of the Environment
(QE)
This indicator is the individual perception about his living area. It is defined according to personal satisfaction scale (very satisfied until very dissatisfied)
Acceptability
Housing quality (HQ)
It is measured by some basic affairs as condition and maintenance of the house and access to basic services. This indicator is quantified in terms a scale from worst to best conditions.
Acceptability
Overcrowding conditions (OC)
This is quantified by taking into consideration the number of people who dwell in a house and the size of the house (i.e. Number of people who live in the house divided by number of rooms in the house)
Acceptability

32
Health Conditions (HC)
One of the most important aspects in the study of the quality of life is a human being’s health. This is measured on a scale (i.e. From healthy to sick conditions)
Acceptability
Family Perception (FP)
It is essential to ask people this question even though the analysis is subjective. However, this does not imply lack of validity. This indicator is the individual perception about his life conditions. A similar scale of quality of environment is used.
Acceptability
Accumulation of Human Capital and
Social capital (HSC)
Human Capital and agricultural
permanence (HCAP)
This indicator is a composition of two indicators: age and education level. First, we should consider how young they are, because this could significantly increase production. Second, we have to find out what kind of education or other type of knowledge the farmer has received.
Acceptability
Workforce Stability (WS)
The stable character of the work factor has been measured through a percentage according to the individual demands. It will be a percentage that relates the potential demand and the real offer for working in one hectare in regular time periods.
Acceptability
Land Tenure (LT)
This indicator was measured in terms of land tenure. This is quantified by type of land tenure.
Acceptability
Organization (O)
This indicator refers to the social capital that can be obtained through participation in social networks or organizations. It is defined in terms of quantity of organizations (formal and informal)
Acceptability
Criteria Indicators Sub-Indicators Definitions and Significance Type of Pillars
Agro ecological
Yield (Y) Yield (Y)
This indicator reveals the productivity that the crops have per unit area. It can be measured in qq/ha or ud/ha depending on the crop to be worked with. Ten crops were defined.
Productivity, Stability.
Land Use (LU)
Forest (F)
The sustainability scale depends on the coverage percentage. Forest was measured by the percentage of coverage on the farm.
Productivity, Stability. Natural Resources Protection
Crop Rotation (CR)
The crop rotation indicator represents the number of crop rotations ove time. It is measured according to tperiod of time of crop rotation (years).
Productivity, Stability. Natural Resources Protection
Crop Diversity (CD)
It is measured by starting with monoculture and its application in each of the farms. This indicator is a percentage in relation to the total sown area. This is obtained when we divide the space occupied by a monoculture by the total area in hectares
Productivity, Stability. Natural Resources Protection

33
Erosion Risk (E)
Observation (OB)
The results of this indicator are according to FAO methodology. It is quantified considering FAO criteria about erosion. This criterion defines the levels of erosion starting from zero to the most severe one. (see appendix 15)
Productivity, Stability. Natural Resources Protection
Slope (S)
This indicator means the percentage of the slope present in the farm. It is measured in terms of percentage of slop.
Productivity, Stability. Natural Resources Protection
Forest (F)
The sustainability scale depends on the coverage percentage. Forests were measured by a percentage of coverage on the farm.
Productivity, Stability. Natural Resources Protection
Organic Matter (OM)
Crop residues (CR)
This indicator gives us information about quantity of crop residues reused in the agricultural production. It has been determined in terms of the residues use.
Productivity, Stability
Humus content (HC)
This indicator allows us to know the amount of organic matter that the study zone contains. Its measurement is in terms of humus use in the agricultural activities.
Productivity, Stability
Agrochemicals use (AU)
Agrochemicals use (AU)
This indicator measures the efficiency of the use of pesticides, fungicides, plaguicides and herbicides. This is measured according to the quantity applied per ha. (the measure depends on type of product)
Natural Resources Protection
34
3.5.2.2 Cluster Analysis
A cluster analysis classifies the data in groups with regard to specific selection criteria. This means that the homogeneous groups were ordered in a way to obtain similar members and a strong cluster (Gutierrez et al. 1994) (Vaquerizo 2008). The cluster is optimal when the distance between data is low, and the distance is high in comparison to other conglomerates. This analysis was comprised of the number of classes that can be divided by m objectives. These were described by a set of p variables order by a matrix m x p (Aldenderfer and Blashfield 1984) (Everitt et al. 2001) (Rencher and Christensen 2012). Three steps were necessary: variable selection, association measures and the application and use of clustering techniques (González et al. 2009). The research was conducted using a method called the composition of indicators. Therefore, a complex matrix was obtained in order to figure out the relationships between the variables. Algorithm K-means62 was chosen. This is a simple and direct algorithm based on variance analysis. It is a non-hierarchical method and is interactive. The point of departure is based on the number of groups related to the number of cases. In each one the centroid is calculated and assigned a cluster. Thus, the centroid is obtained in every group again after each assignation, considering those centroides as fixed. Then, the assignation is made once more to the individuals in the closer centroide. This procedure is repeated until any individual changes the group (Perez et al. 2007). The software WEKA 3.6.663 is used to find the results. This method is frequently used by researchers because it is simple. Quality data are required to improve the statistical results.
3.5.2.3 Regression Model
A regression analysis was conducted to determine the relationship between variables involved in the study. This analysis aims to find the dependent or independent links. An independent variable is affected by the rest of variables (Gujarati 2009). The results from this statistical process enable us to quantify the outcomes, i.e. in order to obtain solutions or relations.
In accordance with general data requirements of regression models, categorical variables were converted into binary dummy variables and different models were used in order to reduce the econometrical problems. Since there were qualitative and quantitative variables in this study, ANCOVA64 models can be a good alternative to generalized ANOVA models. ANCOVA models work with covariance in order to control external variables (independent), which means less error and more accuracy (Garson n.d.). Also, it can regulate the treatment of dependent variables to get better results.
The multiple regression equation is as follows:
62 This technique was used by MacQueen in 1968 in the work called “Some methods for classification and analysis of multivariate observations” Villagra et al. (2009). 63 WEKA 3.6.6 is a complete set of tools that allows us to extract useful information from large databases. This process is commonly called as data mining. Weka has been used in this research. In WEKA The University of Waikato. Retrived March 28, 2017 from http://www.cs.waikato.ac.nz/ml/weka/downloading.html 64 ANCOVA
35
Y = a1x1 + a2x2 + ⋯ + anxn + b
Where (Y) corresponds to the dependent variables and (x) to the independent variables, (a) denotes coefficients and (b) is the intercept. The correlation analysis expresses the degree of association between variables. Throughout the statistical analysis, it is possible to determine the indicators relationships and interdependence. The regression coefficients allowed us to quantify the relationships between variables to facilitate the development of strategies and future conclusions. The original heterogeneous data can affect the original model. The logarithm model design is used when it is necessary to work with the same scale and rates. This procedure reduces the heteroscedasticity and autocorrelation.
3.5.2.4 Gravity equation related to rural marketing
The gravity equation has been extensively used in several international trade studies. The most successful tool in trade studies especially when the transaction costs vary too much and that then affects the product earnings (Anderson 1979). It is applied according to the goods and services moving across the borders. Policy instruments can be used after the gravitational definitions. The distance between countries and their interdependence affects the international trade.
Newton in 1687 proposed the Universal Law of Gravity between two objects, where the force of attraction is directly proportional to the masses of both objects and inversely proportional to the square of the distance that separates them (McCallum 1995). In this research the gravity equation plays an important role in the rural market process. According to Shilpia and Umali-Deininger (2008) the effects between distance and market facilities have an inverse relation. For this reason, the transaction costs can increase when the market facilities are decreasing, and they may decrease when the distance is decreasing. In agricultural science this kind of method can be applied. Fafchamps and Hill (2005) gave a good example related to agriculture and marketing. They focused on the impact of distance to markets, the place of sale, and its effect on famers’ profits. In trade studies this equation is used to facilitate the links between countries. In our case, the idea is to understand how the market conditions are functioning in relation to distance and sales for the rural regions.
In rural markets, the costs involved in the transactions are reducing the potential of the farms. This may be due to a lack of basic conditions allowing access to the market. These models compare sales from the farms to those of the marketplace. The willingness to sell in the markets is based on the farmer’s perception of the benefits associated with selling at or near them. The regression model in required to assist the stakeholders’ decision making.
4. - Description of the study area
For the description of the study area, secondary information was used from available studies carried out by national and local public agencies, NGOs and Universities. Qualitative and quantitative information were compiled in order to acquire basic knowledge about the survey area. Additionally, an elemental research framework of local features was applied to assess the study area. It is described in the following chapters.

36
The investigated area is located in the Cordillera Real, an eastern range of the Southern Ecuadorian Andes in South America. This Cordillera divides the country in two natural regions, the humid Amazon and the Inter-Andean (Bendix et al. 2013). The Amazon region is one of the four natural regions in Ecuador. It is also known as the Ecuadorian Oriente. It consists of six provinces: Sucumbíos, Orellana, Napo, Pastaza, Morona Santiago and Zamora Chinchipe. It covers an area of 120 000 km2, characterized by tropical rain forests and exuberant vegetation. The Amazon relief is very rough, irregular and mountainous. It is surrounded by lush vegetation beginning in the Andes Mountains and descending into the plains of the Amazon (POTY 2002).
The main part of the research was conducted in Yantzaza, located (3º 4`42” S and 78º 45´32”. W about 791 km2) in the south of the Ecuadorian Amazon region (See Figure 4.1). The name YANTZAZA comes from two words in the native language (Shuar): YANTSA which means firefly and ENTSA, firefly river. Now it is called the Firefly Valley. Yantzaza is one of the cantons of the Zamora Chinchipe province. It is enclosed in the north by the Morona Santiago province, in the south by Centinela del Cóndor and El Pangui cantons, in the east by the Cordillera del Cóndor and in the west by the Yacuambi and Zamora cantons (López 2006). The study area is divided by two rural parishes Los Encuentros y Chicaña and one urban parish named Yantzaza. According to the national census (2010), Yantzaza has an estimated population of 18,675.
Plate 4.1 Study villages in Yantzaza

37
The population that settled in Yantzaza dates back to 1940. Most are from the provinces of Loja, El Oro and Azuay. This population is mainly engaged in trade and agriculture. Since most did not own land, many worked close together as tenants on the estates of those provinces. In addition, the significant drought that affected the fields in 1950, 1951 and 1952, and then affected the border area of Loja, in 1964 and intensifying in 1968, made the valleys of Zamora and Nangaritza receive hundreds of immigrants, who are now part of the Yantzaza canton (PDYOT 2012) .
4.1 The physical environment65
4.1.1 Climate Yantzaza has a humid subtropical and a very humid subtropical climate. Its temperature fluctuates between 18 and 28 ° C, with an average of 23 ° C. Isothermal behavior is highest in June and July, as the warmest months, with the coldest months being November and December. Its altitude is between 600 and 1600 meters above sea level, and is characterized by mild Andean mountain area which generates unique climatic conditions. Normal annual rainfall is approximately 2050.2 mm. The most rainfall occurs in April with 219.7 mm and lowest precipitation rates occur in August and September with 137.9 mm and 129.0 mm respectively. These rates of precipitation describe the bimodal behavior of rain with two rainy peaks, the first being between January and July and the second from August to December. Considering a historical analysis of the rainfall, the highest rainfall recorded in the area dates back to November 1983 with a value of 104.2 mm. Being a jungle area of lush vegetation, rain is persistent over time and generates excellent qualities for the development of agriculture and livestock (POTY 2002). 4.1.2 Hydraulic resources
The main river that runs through the Yantzaza canton is the Zamora River. It runs from the border of the Centinela del Condor canton to the Pangui canton, further south. It connects and receives water from other tributaries like Nambija and Yacuambi up to Namírez and Saquea respectively. Examining the area completely, it is worthy to note the noticeable deterioration suffered by the river banks due to the agricultural system developed in the area. Yantzaza is very close to zones of mining operation where toxic waste such as mercury and cyanide seep into the river. This is the same river that does not have a process for the sustainable management of water resources. In addition, many communities use it to support their livelihood through fishing, thus presenting a significant health risk to the population. Another serious problem is sending wastewater into the river without means to mitigate environmental damage caused by contaminating the main river (POTY 2002). Additionally, there are other rivers like the Nangaritza and Chicaña which cross near Los Encuentros and Chicaña parishes respectively. The population uses these rivers to cultivate transitory crops near the river banks. However, the lack of technology does not allow for
65 This infomation has been obtained from “Plan de Desarrollo local del cantón Yanztaza” (2002) because the information is limited.
38
better utilization of these resources. Being an Amazonian area there is a large quantity of water, not only in rivers but in streams (Yantzaza, Pitá, Chimbutza, Muchine, El Padmi, Skewer) that completely cross the rural area of the canton under study. These streams have not yet been exploited completely. 4.1.3 Soils
Tropical forest coverage turns out to be the typical characteristic of the geographical location of Yantzaza in the Ecuadorian Amazon. This suggests that there would be a lack of evident natural erosion. However, the lack of adequate agricultural extension and technical monitoring has led to mismanagement of the soil which was caused by people changing the natural use of the land for agricultural and livestock activities while using inappropriate techniques. “The local geology is dominated by granites, granodiorites and dacites. The establishment of soil profiles served for the description and classification of the Haplic Cambisol (humic) as the dominant soiltype in slope positions. Natural vegetation is comprised of an evergreen submontane rainforest which, at the present time can only be found in top slope positions” (Bahr et al. 2014, p. 276) Studies carried out by the Municipality of the Yantzaza Canton detected that the area is susceptible to landslides, mudslides and soil fluctuation in varying degrees of intensity. The biggest area of rugged terrain is to the west of the Canton, in the parishes of Chicaña and Yantzaza, and covers approximately 24,966 ha which accounts for 23.86% of the cantonal area. There, the land is moderately susceptible to landslides while the surrounding area has a low susceptibility accounting for 20.81% of the area, approximately 21,768.5 ha. Instead, there is a high susceptibility in the sub-Andean rugged terrain, east of the Canton, in separate sectors of the Los Encuentros parish. It covers approximately 26,396.4 ha and represents 25.23% of the cantonal area. Soil fluctuations have been detected, which can be very intense, in the surrounding slopes of the rainy area. In terms of area, this part has the highest percentage, covering approximately 31,510.3 ha and representing about 30.11% the study area. Ecuador is a country formed by various natural regions and a series of high altitude sections. Yantzaza has two basic regions. The Amazonian region is the most representative of the región with 78% of the total area. This region contains the three geographical forms most characteristic of the Amazon. These forms include the rugged sub-Andean terrain that represents 30.78% of the canton, and rugged sub-Andean terrain with corridors, depressions and lower slopes covering more than 40,221.68 ha that represent 38.44 % of the canton’s area. Additionally, the periandina part of the Amazon corresponds to the alluvial formations of the Zamora, Nangaritza y Chicaña Rivers, a stretch of land that is 1.8 km wide.
On the other side, the Sierra region is characterized by its proximity to the eastern slopes of the Andes, the eastern mountain range, and by the area of rugged terrain covered with recent pyroclastic projections, ash and lapilli. This represents 21.96% of the canton’s jurisdiction (AEE 2002).
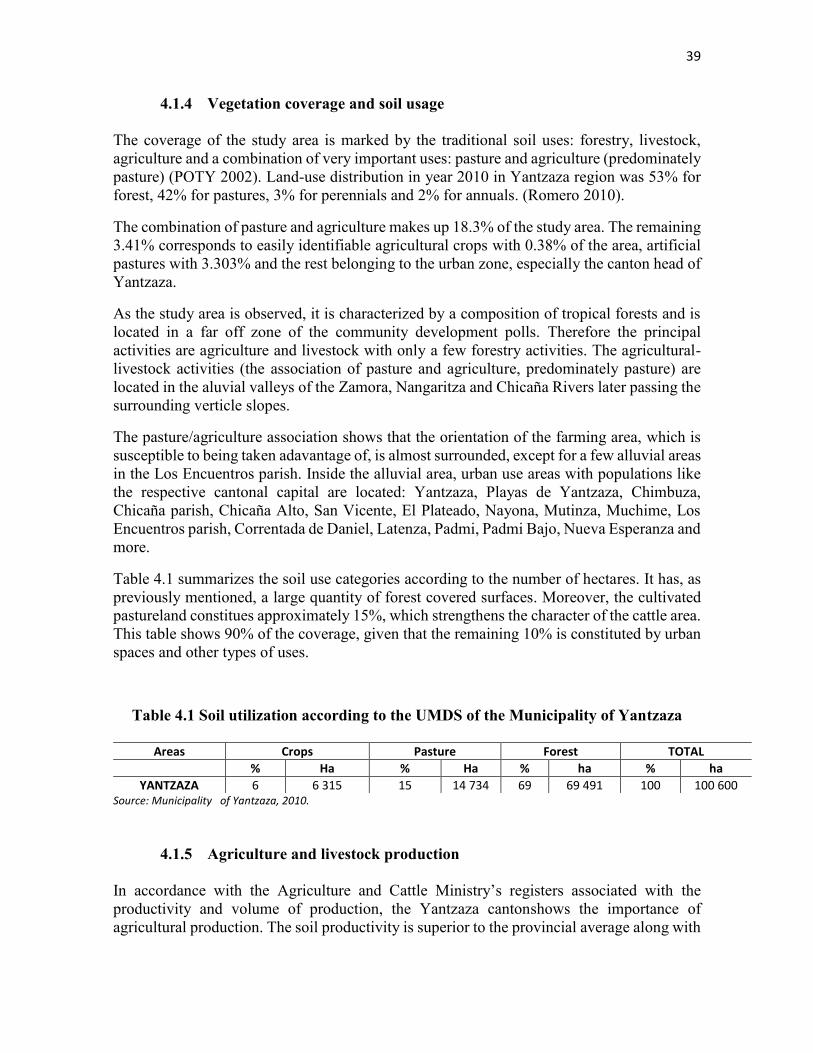
39
4.1.4 Vegetation coverage and soil usage The coverage of the study area is marked by the traditional soil uses: forestry, livestock, agriculture and a combination of very important uses: pasture and agriculture (predominately pasture) (POTY 2002). Land-use distribution in year 2010 in Yantzaza region was 53% for forest, 42% for pastures, 3% for perennials and 2% for annuals. (Romero 2010).
The combination of pasture and agriculture makes up 18.3% of the study area. The remaining 3.41% corresponds to easily identifiable agricultural crops with 0.38% of the area, artificial pastures with 3.303% and the rest belonging to the urban zone, especially the canton head of Yantzaza.
As the study area is observed, it is characterized by a composition of tropical forests and is located in a far off zone of the community development polls. Therefore the principal activities are agriculture and livestock with only a few forestry activities. The agricultural-livestock activities (the association of pasture and agriculture, predominately pasture) are located in the aluvial valleys of the Zamora, Nangaritza and Chicaña Rivers later passing the surrounding verticle slopes.
The pasture/agriculture association shows that the orientation of the farming area, which is susceptible to being taken adavantage of, is almost surrounded, except for a few alluvial areas in the Los Encuentros parish. Inside the alluvial area, urban use areas with populations like the respective cantonal capital are located: Yantzaza, Playas de Yantzaza, Chimbuza, Chicaña parish, Chicaña Alto, San Vicente, El Plateado, Nayona, Mutinza, Muchime, Los Encuentros parish, Correntada de Daniel, Latenza, Padmi, Padmi Bajo, Nueva Esperanza and more.
Table 4.1 summarizes the soil use categories according to the number of hectares. It has, as previously mentioned, a large quantity of forest covered surfaces. Moreover, the cultivated pastureland constitues approximately 15%, which strengthens the character of the cattle area. This table shows 90% of the coverage, given that the remaining 10% is constituted by urban spaces and other types of uses.
Table 4.1 Soil utilization according to the UMDS of the Municipality of Yantzaza
Areas Crops Pasture Forest TOTAL
% Ha % Ha % ha % ha
YANTZAZA 6 6 315 15 14 734 69 69 491 100 100 600 Source: Municipality of Yantzaza, 2010.
4.1.5 Agriculture and livestock production In accordance with the Agriculture and Cattle Ministry’s registers associated with the productivity and volume of production, the Yantzaza cantonshows the importance of agricultural production. The soil productivity is superior to the provincial average along with

40
the sowing and harvesting. Table 4.2 shows the yields per hectar of the most prominent products in Yantzaza along with the plant cycles and mechanization system used.
Table 4.2 Main crops, costs and management
Crops Vegetative cycle Yield Tm/Ha
Management system
Corn 4 Months 0,24 Traditional Plantain Perennial 7,30 Traditional Yucca 10-12 meses 2,30 Traditional Coffee Perennial 0.38 Semi-technical Cocoa Perennial 0,21 Traditional Beans 4 Months 0,90 Traditional and
introduced Banana Perennial 6,70 Traditional Sugar Cane Annual 6,50 Semi-technical Naranjilla Annual 3,40 Semi-technical Vegetables Varies Traditional Fruits Perennial Traditional Grasses Traditional
Source: Arturo Jijón, “Diagnóstico de la Microrregión Zamora Nangaritza” (2001)
From the livestock point of view, the most important product is related to cattle. The yields of meat from the slaughterhouse reaches an average of 25-20 pounds, approximately 312 kilograms. The average milk production fluctuates between 4 to 6 liters daily in one milking. The estimated milk production between the Yantzaza cantons is approximately 10,000 liters daily of which 60% is processed in the farms to obtain quesillo; the whey is used to feed the pigs. 40% of the milk production is sold comercially for 45 cents (USD) per litre. It is essential to take into account the grass that is cultivated for cows. The forage yields approximately 70 tons per ha and when cutting, 20 cm of vegetation is left in the soil to be the bed for new sprouts. In accordance with the studies completed by the Municipality of Yantzaza with the management system al sogueo, the animals only benefited from 30% of the forage because 70% was lost due to being trampled. The ration consists mainly of grasses among which are: Blue Gramalote, Setaria Grass, Brachiaria, Elephant, and Chile. Mixing is not practiced with legumes or in any case is sporadic. Few producers draw upon food supplements.
4.1.6 Biophysical generalities
To review, geomorphologically the canton has four large geoforms, predominately the geoforms belongs to the rugged sub-Andean terrains and to the corridors, depressions and lower slopes that follow the sub-Andean mountain range and finally the alluvial áreas of the Amazonian periandina. There is uncertainty in regards to the errosion process, but never the
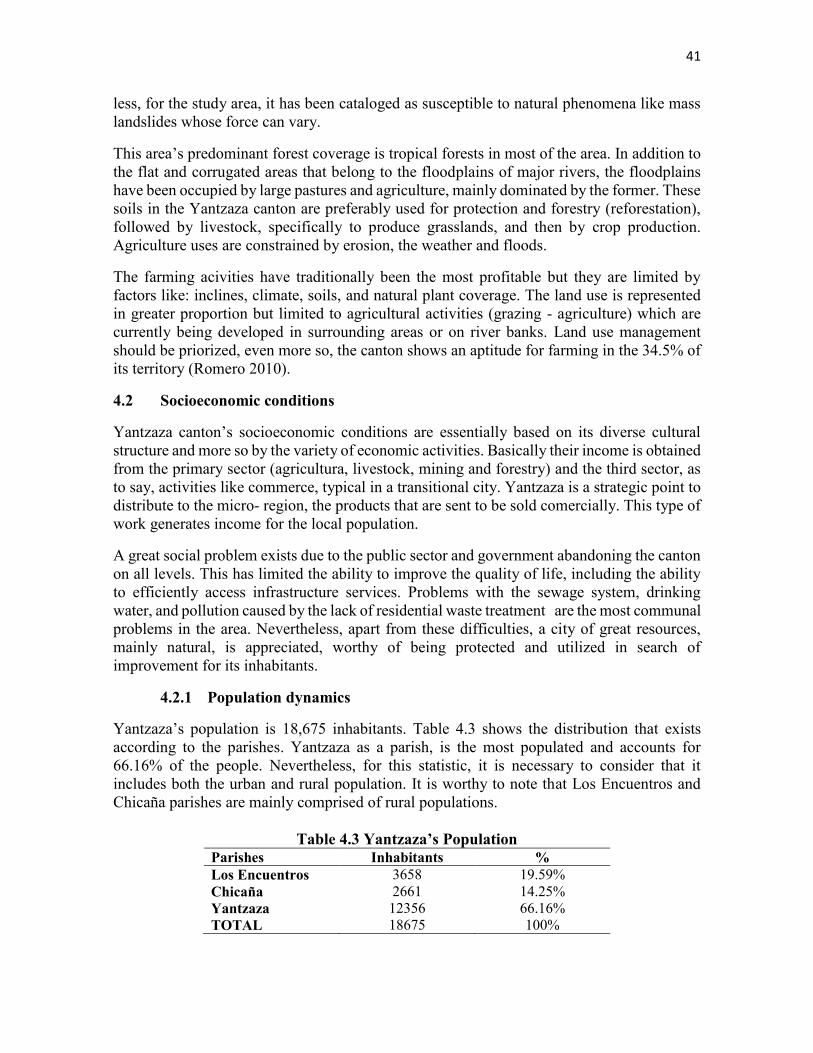
41
less, for the study area, it has been cataloged as susceptible to natural phenomena like mass landslides whose force can vary.
This area’s predominant forest coverage is tropical forests in most of the area. In addition to the flat and corrugated areas that belong to the floodplains of major rivers, the floodplains have been occupied by large pastures and agriculture, mainly dominated by the former. These soils in the Yantzaza canton are preferably used for protection and forestry (reforestation), followed by livestock, specifically to produce grasslands, and then by crop production. Agriculture uses are constrained by erosion, the weather and floods.
The farming acivities have traditionally been the most profitable but they are limited by factors like: inclines, climate, soils, and natural plant coverage. The land use is represented in greater proportion but limited to agricultural activities (grazing - agriculture) which are currently being developed in surrounding areas or on river banks. Land use management should be priorized, even more so, the canton shows an aptitude for farming in the 34.5% of its territory (Romero 2010).
4.2 Socioeconomic conditions
Yantzaza canton’s socioeconomic conditions are essentially based on its diverse cultural structure and more so by the variety of economic activities. Basically their income is obtained from the primary sector (agricultura, livestock, mining and forestry) and the third sector, as to say, activities like commerce, typical in a transitional city. Yantzaza is a strategic point to distribute to the micro- region, the products that are sent to be sold comercially. This type of work generates income for the local population.
A great social problem exists due to the public sector and government abandoning the canton on all levels. This has limited the ability to improve the quality of life, including the ability to efficiently access infrastructure services. Problems with the sewage system, drinking water, and pollution caused by the lack of residential waste treatment are the most communal problems in the area. Nevertheless, apart from these difficulties, a city of great resources, mainly natural, is appreciated, worthy of being protected and utilized in search of improvement for its inhabitants.
4.2.1 Population dynamics
Yantzaza’s population is 18,675 inhabitants. Table 4.3 shows the distribution that exists according to the parishes. Yantzaza as a parish, is the most populated and accounts for 66.16% of the people. Nevertheless, for this statistic, it is necessary to consider that it includes both the urban and rural population. It is worthy to note that Los Encuentros and Chicaña parishes are mainly comprised of rural populations.
Table 4.3 Yantzaza’s Population Parishes Inhabitants % Los Encuentros 3658 19.59% Chicaña 2661 14.25% Yantzaza 12356 66.16% TOTAL 18675 100%

42
For having high participation in rural activities, Yantzaza canton posesses a large quantity of people in the rural area. Table 4.4 shows that the distribution of people between the urban and rural areas is very similar. 50.74% of the population lives in the rural sector, motivating the development of strategies directed to that sector. In accordance with the last census completed in Ecuador, 9,476 people are working in rural locations and have the responsibility to better their living standards through the sustainable management of natural resources.
Table 4.4 Yantzaza canton’s urban and rural population
Cases % Urban 9,199 49.26% Rural 9,476 50.74% Total 18,675 100%
More so, if the rural sector is distributed by parish, we reaffirm what was mentioned at the beginning of this section. There is a large quantity of the rural population (see table 4.5) in Los Encuentros and Chicaña parishes and when summed together constitute 66.68% of the total population. The Yantzaza parish has 33.31% of people in the rural áreas, and even though that is less than others, it is still significant towards the search for new strategies.
Table 4.5 Rural population expressed by parishes
Parishes Area Inhabitants % Los Encuentros Rural 3 658 38. 60% Chicaña Rural 2 661 28. 08% Yantzaza Rural 3 157 33. 31% Total 9 476 100%
The population dynamic by sex is relevant to this study. In Yantzaza there is a slight male majority. 50.6% are men. If we profoundly analyze this data, there is practically gender equality. In the rural sector the trend continues. Although in the urban sector, there is a small majority of women. The similar growth trend continues in Yantzaza.
Table 4.6 Poblation by sex
SEX Urban o rural area Urban Area Rural Area Total Man 4,590 4,866 9,456 Woman 4,609 4,610 9,219 Total 9,199 9,476 18,675
4.2.2 Ethnic Composition
Yantzaza’s cultural diversity is marked according to the prevailing historical reality. There are three important cutural groups: the shuaras or natives, the saraguros and the settlers. The
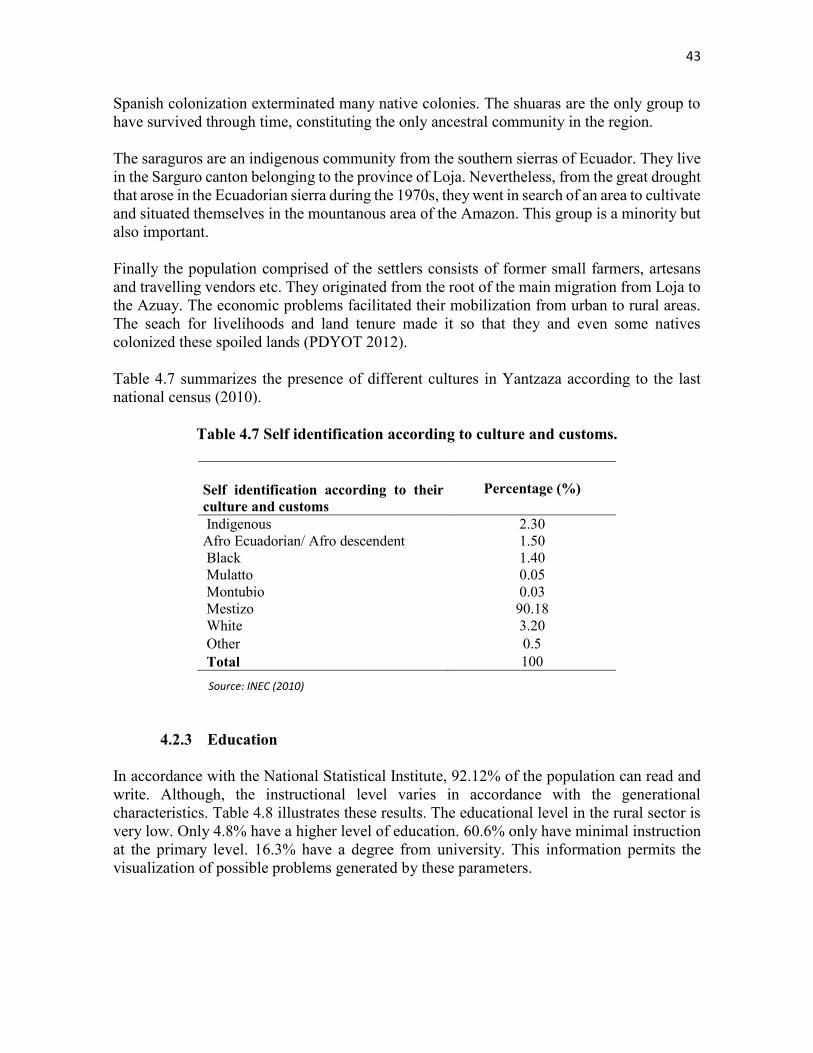
43
Spanish colonization exterminated many native colonies. The shuaras are the only group to have survived through time, constituting the only ancestral community in the region. The saraguros are an indigenous community from the southern sierras of Ecuador. They live in the Sarguro canton belonging to the province of Loja. Nevertheless, from the great drought that arose in the Ecuadorian sierra during the 1970s, they went in search of an area to cultivate and situated themselves in the mountanous area of the Amazon. This group is a minority but also important. Finally the population comprised of the settlers consists of former small farmers, artesans and travelling vendors etc. They originated from the root of the main migration from Loja to the Azuay. The economic problems facilitated their mobilization from urban to rural areas. The seach for livelihoods and land tenure made it so that they and even some natives colonized these spoiled lands (PDYOT 2012). Table 4.7 summarizes the presence of different cultures in Yantzaza according to the last national census (2010).
Table 4.7 Self identification according to culture and customs.
Self identification according to their culture and customs
Percentage (%)
Indigenous 2.30 Afro Ecuadorian/ Afro descendent 1.50 Black 1.40 Mulatto 0.05 Montubio 0.03 Mestizo 90.18 White 3.20 Other 0.5 Total 100
Source: INEC (2010)
4.2.3 Education In accordance with the National Statistical Institute, 92.12% of the population can read and write. Although, the instructional level varies in accordance with the generational characteristics. Table 4.8 illustrates these results. The educational level in the rural sector is very low. Only 4.8% have a higher level of education. 60.6% only have minimal instruction at the primary level. 16.3% have a degree from university. This information permits the visualization of possible problems generated by these parameters.

44
Table 4.8 Population’s educational level
Source: INEC (2010)
4.2.4 Economic activities in Yantzaza
The majority of the population is dedicated to the primary sector. In accordance to the information coming from the rural sector investigation, 93.5% of the rural sector works in agriculture, even if it is not their primary source of income. As a secondary activity, 51.3% worked in cattle. 6.5% works in commerce. The people have other sources of income that permit them to survive. Table 4.9 shows the principle economic activities developed in Yantzaza.
Table 4.9 Yantzaza canton’s economic activities
Activity branch
Percentage %
Cattle 51.3 Unemployed Other service activities Big and small commerce Housewives Construction Public administration and defense
9.1 8.4 6.5 5.2 3.9 3.2
Mining and quarrying 3.2 New worker 3.2 Beekeeper 2.6 Not declared 1.3 Artisans 1.2 Teaching 0.6
Total 100 Source: Own elaboration, from field research
This region does not envision a change in economics unless the mining industry opens possibilities for economic movement and increased incomes. It should be considered that between Yantzaza and El Pangui, one of the largest copper mines in South America is found, the same one that has given an intermediate term promise to boost the local economy.
Level of higher education % Percentage None 6, 4 Learning centers 1, 2 Preschool 1, 1 Primary 38, 5 Secondary 16, 3 Basic education 22, 1 Diploma 6, 9 Technical knowledge 0, 8 College 4, 5 Post graduate 0, 3 Not answered 1, 6 TOTAL 100
45
At the canton level, around 68.65% of the total population are unable to provide for their basic needs. This figure is high in comparision to the province of Zamora Chinchipe with 68.39% below the poverty line but also higher than the national average which is 56.15%. Similarly, the incidence of extreme poverty is 28.59% in the region while the national average is 26.81%.
4.2.5 Labor market
Yantzaza has a difficult labor market. Even though approximately 37% of their population is economically active, the majority of the employment is not very profitable. The major employment opportunities are traditionally comprised of agriculture, livestock, fishing, and silvicultue (58.40%).
On the other hand, 99% of non-agricultural economic work in the canton takes place in the uban sector (manufacturing, commerce and services), with agriculture, livestock and mining in the rural area. The possibilities to better the quality of life rests in this aspect of the region. Lastly, for every 100 people that stop being productive, 471 exist that are of work age, a situation which could result in too many people in the work force. Which has itself generated unemployment and migration (PDYOT 2012). 5. - Integral assessment of Sustainability
The composition of indicators proposed in Section 3.5.2.1 suggests that these indicators can analyze sustainability. The information was generated by surveys66 considering a total of 1385 UPA´s in Yantzaza67. The sample corresponds to 8% of the population68. Appendix 7 shows the database that generated the indicators.
This chapter emphasizes the dimensions of agricultural sustainability needed to assess the study area’s current conditions. The Earth Summit’s Agenda 21 (1994) defined the need to encompass the sustainability in terms of different dimensions. Several frameworks for sustainable indicators have been made. Basic parameters were determined and this can lead to a path for other work to be done in the future (Bartelmus 1994b). For this study’s purpose, the diagnostic was based on the three principle dimensions defined in the previous section. The intention of this study is to determine a baseline thus allowing the best formulations of strategies and solutions related to future research objectives. . The principle vision of this study was oriented to the expressed in the Chapter 14 of the Agenda 21, emphasizing two key objectives related to sustainable agriculture: increasing sustainable food production and food security (UN 1992).
The concept of sustainability is understood as an intergenerational69 definition. Furthermore, the data obtained from the sustainability indicators could become significant by providing a minimum level of understanding to policy makers thus allowing them to base decisions off
66 See appendix 2. 67 According census 2010 in Yantzaza there are 1385 productive agricultural units (UPA), which are working in the rural sector. 68 See mathematical sample in appendix 1. 69 Which means: future generations can receive positive or negative effects from the current generations.
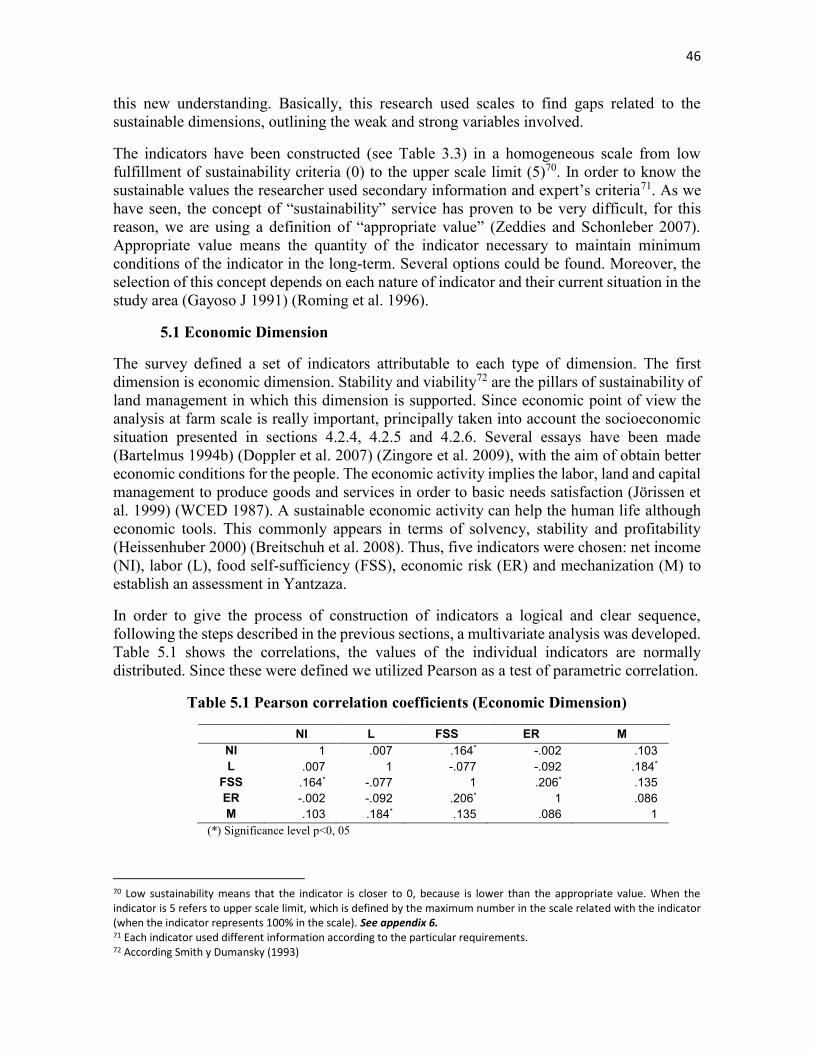
46
this new understanding. Basically, this research used scales to find gaps related to the sustainable dimensions, outlining the weak and strong variables involved.
The indicators have been constructed (see Table 3.3) in a homogeneous scale from low fulfillment of sustainability criteria (0) to the upper scale limit (5)70. In order to know the sustainable values the researcher used secondary information and expert’s criteria71. As we have seen, the concept of “sustainability” service has proven to be very difficult, for this reason, we are using a definition of “appropriate value” (Zeddies and Schonleber 2007). Appropriate value means the quantity of the indicator necessary to maintain minimum conditions of the indicator in the long-term. Several options could be found. Moreover, the selection of this concept depends on each nature of indicator and their current situation in the study area (Gayoso J 1991) (Roming et al. 1996).
5.1 Economic Dimension
The survey defined a set of indicators attributable to each type of dimension. The first dimension is economic dimension. Stability and viability72 are the pillars of sustainability of land management in which this dimension is supported. Since economic point of view the analysis at farm scale is really important, principally taken into account the socioeconomic situation presented in sections 4.2.4, 4.2.5 and 4.2.6. Several essays have been made (Bartelmus 1994b) (Doppler et al. 2007) (Zingore et al. 2009), with the aim of obtain better economic conditions for the people. The economic activity implies the labor, land and capital management to produce goods and services in order to basic needs satisfaction (Jörissen et al. 1999) (WCED 1987). A sustainable economic activity can help the human life although economic tools. This commonly appears in terms of solvency, stability and profitability (Heissenhuber 2000) (Breitschuh et al. 2008). Thus, five indicators were chosen: net income (NI), labor (L), food self-sufficiency (FSS), economic risk (ER) and mechanization (M) to establish an assessment in Yantzaza.
In order to give the process of construction of indicators a logical and clear sequence, following the steps described in the previous sections, a multivariate analysis was developed. Table 5.1 shows the correlations, the values of the individual indicators are normally distributed. Since these were defined we utilized Pearson as a test of parametric correlation.
Table 5.1 Pearson correlation coefficients (Economic Dimension)
NI L FSS ER M NI 1 .007 .164* -.002 .103 L .007 1 -.077 -.092 .184*
FSS .164* -.077 1 .206* .135 ER -.002 -.092 .206* 1 .086 M .103 .184* .135 .086 1
(*) Significance level p<0, 05
70 Low sustainability means that the indicator is closer to 0, because is lower than the appropriate value. When the indicator is 5 refers to upper scale limit, which is defined by the maximum number in the scale related with the indicator (when the indicator represents 100% in the scale). See appendix 6. 71 Each indicator used different information according to the particular requirements. 72 According Smith y Dumansky (1993)

47
This analysis basically permits to conclude that there is not important correlation between the selected set of indicators. Also, it helps to know that the indicators can be described and interpreted individually in the economic measurement.
Following the methods mentioned in the Section 3.5.2.1, we obtained the indicators composition in the economic dimension (See Appendix 8). Table 5.2 shows the results from secondary economic assessment. Some of the indicators are explained by sub-indicators which facilitate understanding. Range of values is presented in order to explain the appropriate value considered in each kind of indicator. This appropriate value changes according to each one. The work considered official information and empirical criteria.
Table 5.2 Economic dimension indicators and its appropriate values of sustainability
Economic Indicator Sub-indicators Range of values [1] Reference sources
NET INCOME ( NI ) 398, 85 - 555,27 (USD/per month) (INEC 2012)
LABOUR ( L ) 1 - 3 (tarea/per day/per worker) (PDYOT 2012)
FOOD SELF-SUFFICIENCY
( FSS )
Diversification of Production
3; 5 - 8 (products/per farm) (Sarandón et al. 2007)
Production Area of Self-Consumption
0,3; 0,5 - >1 (ha/per person) (Sarandón et al. 2007)
ECONOMIC RISK ( ER )
Diversification of Sale 3 - >5 (products/per farm) (Sarandón et al. 2007)
Access to market sale is appropriate (PDYOT 2012) (Fafchamps
and Hill 2005)
Dependence of external inputs <40% is appropriate (Sarandón et al. 2007)
MECHANIZATION
( M ) [2] traditional is appropriate (PDYOT 2012)
[1]Range between appropriate and upper values
[2] Ranging from 0 (without mechanization) to 5 (advanced).
5.1.1 Net Income (NI): it was defined from data obtained by farmers. It consists of the analysis cost/benefit that each product has. Two classes of incomes were defined, the ones that belong to agriculture and the ones that do not belong to it.
48
Regarding the agricultural incomes73, the indicator was defined considering incomes for each crop and the margin of production per hectare. First of all, the nine crops that are under study were calculated. Also other incomes such as milk, meat and animal farm was considered. These incomes are annual; for this reason, it is necessary to consider all total costs, variable costs.74
The difference between the gross income and total costs results in the indicator being measured annually. In other words, this refers to the information obtained from the survey’s section on cash flow (Meierhofer 2008) (Meier 2004).
On the basis of INEC (2010) the average family in Ecuador has 4 to 6 members. National vital basket (NVB) 75 and national basic basket (NBB)76 are the essential parameters for a family and they describe the minimum income necessary to live. This information was used to establish the indicator. NVB has been considered as an appropriate value, and NBB as an upper scale value. In Ecuador the NVB corresponds to 398.85 USD per month and the NBB is 555.27 USD per month77 (See Table 3.5)
NI in this research is below the appropriate sustainability level. This is due to the fact that indicator 2.278 is lower than the indicator proposed according to NVB 3.5 (See appendix 6 and appendix 8). Farm NI depends on agricultural and off farm incomes. Owing to income constraints, there is considerable participation in the agricultural sector. In 93% of the farms analyzed there were agricultural activities. The second main activity was raising livestock, which was present in 51.2% of the farms. Both the agriculture production and livestock affect farm income directly. Others revenues were identified, such as, business (6.5%), arts and crafts (5.1%), mining (5 %) and fish farming (3%). The study reveals many concerns about income. Only 19.92% of farms in Yantzaza exceed NVB.
In this context, it is necessary to highlight the significance of agriculture and livestock as the main source of income in rural areas. For this reason, it was easy to study and gain information about agricultural incomes. Farmers principally sell cocoa (30.5% of the total farm agriculture), plantain or banana (26.6% of the total farm agriculture) and coffee (9, 7% of the total farm agriculture) to the market. The other crops make up less than 5% of sales.
Also, livestock significantly contributes to the farmers’income. Cattle provides the most significant source of income related to the livestock industry. The large extension of pasture and landscape conditions help support this industry.
73 According National Census (2000) the principal produced crops in Yantzaza are: coffee, banana, plantain, maize, yucca, sugar cane, cocoa, papaya and naranjilla. Livestock is other way to get income. Milk, meat and small animals are commercialized. 74 Variable costs as seeds, compost, labor, rent machinery, fertilizers and agro-chemicals. Kay and Edwards (1999) 75 National vital basket in Ecuador is the basket that contains the minimum amount of products that a family needs to live. 76 National basic basket means the normal quantity of products that a family in Ecuador needs per month. (normal conditions) 77 These values were defined in 2012 because the primary information was obtained in that year. 78 This value was obtained from the field survey within the chosen range (see appendix 6 and appendix 8).
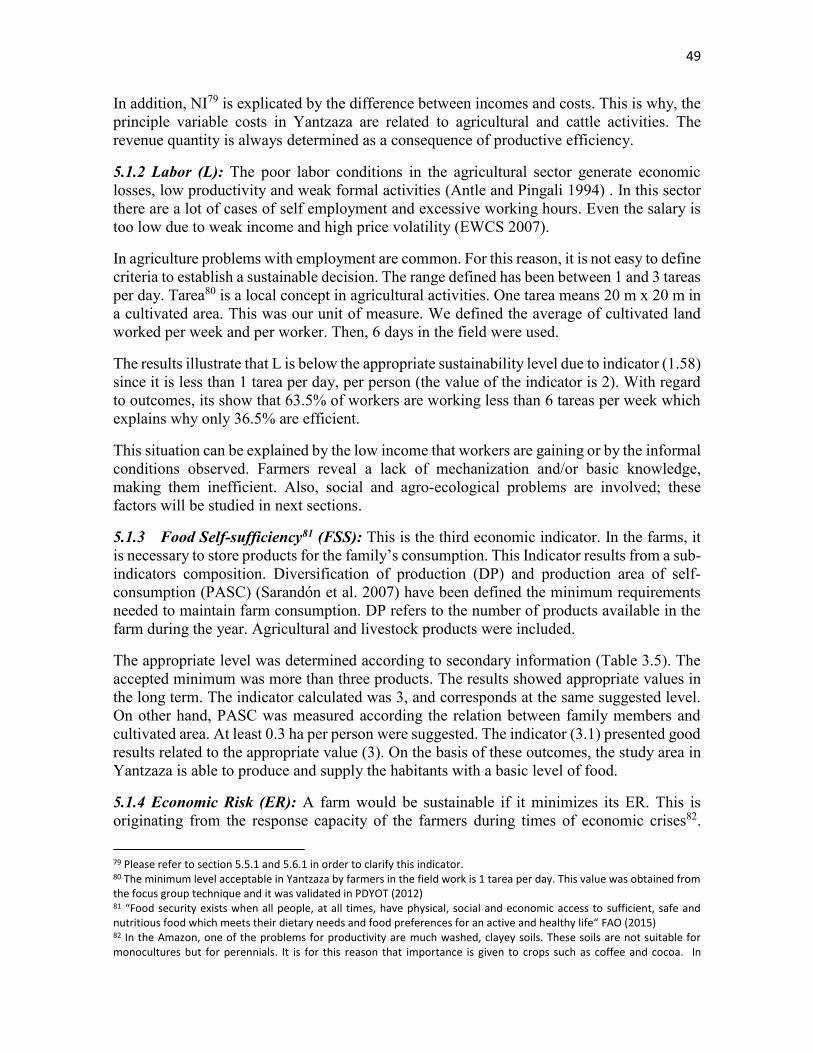
49
In addition, NI79 is explicated by the difference between incomes and costs. This is why, the principle variable costs in Yantzaza are related to agricultural and cattle activities. The revenue quantity is always determined as a consequence of productive efficiency.
5.1.2 Labor (L): The poor labor conditions in the agricultural sector generate economic losses, low productivity and weak formal activities (Antle and Pingali 1994) . In this sector there are a lot of cases of self employment and excessive working hours. Even the salary is too low due to weak income and high price volatility (EWCS 2007).
In agriculture problems with employment are common. For this reason, it is not easy to define criteria to establish a sustainable decision. The range defined has been between 1 and 3 tareas per day. Tarea80 is a local concept in agricultural activities. One tarea means 20 m x 20 m in a cultivated area. This was our unit of measure. We defined the average of cultivated land worked per week and per worker. Then, 6 days in the field were used.
The results illustrate that L is below the appropriate sustainability level due to indicator (1.58) since it is less than 1 tarea per day, per person (the value of the indicator is 2). With regard to outcomes, its show that 63.5% of workers are working less than 6 tareas per week which explains why only 36.5% are efficient.
This situation can be explained by the low income that workers are gaining or by the informal conditions observed. Farmers reveal a lack of mechanization and/or basic knowledge, making them inefficient. Also, social and agro-ecological problems are involved; these factors will be studied in next sections.
5.1.3 Food Self-sufficiency81 (FSS): This is the third economic indicator. In the farms, it is necessary to store products for the family’s consumption. This Indicator results from a sub-indicators composition. Diversification of production (DP) and production area of self-consumption (PASC) (Sarandón et al. 2007) have been defined the minimum requirements needed to maintain farm consumption. DP refers to the number of products available in the farm during the year. Agricultural and livestock products were included.
The appropriate level was determined according to secondary information (Table 3.5). The accepted minimum was more than three products. The results showed appropriate values in the long term. The indicator calculated was 3, and corresponds at the same suggested level. On other hand, PASC was measured according the relation between family members and cultivated area. At least 0.3 ha per person were suggested. The indicator (3.1) presented good results related to the appropriate value (3). On the basis of these outcomes, the study area in Yantzaza is able to produce and supply the habitants with a basic level of food.
5.1.4 Economic Risk (ER): A farm would be sustainable if it minimizes its ER. This is originating from the response capacity of the farmers during times of economic crises82.
79 Please refer to section 5.5.1 and 5.6.1 in order to clarify this indicator. 80 The minimum level acceptable in Yantzaza by farmers in the field work is 1 tarea per day. This value was obtained from the focus group technique and it was validated in PDYOT (2012) 81 “Food security exists when all people, at all times, have physical, social and economic access to sufficient, safe and nutritious food which meets their dietary needs and food preferences for an active and healthy life“ FAO (2015) 82 In the Amazon, one of the problems for productivity are much washed, clayey soils. These soils are not suitable for monocultures but for perennials. It is for this reason that importance is given to crops such as coffee and cocoa. In
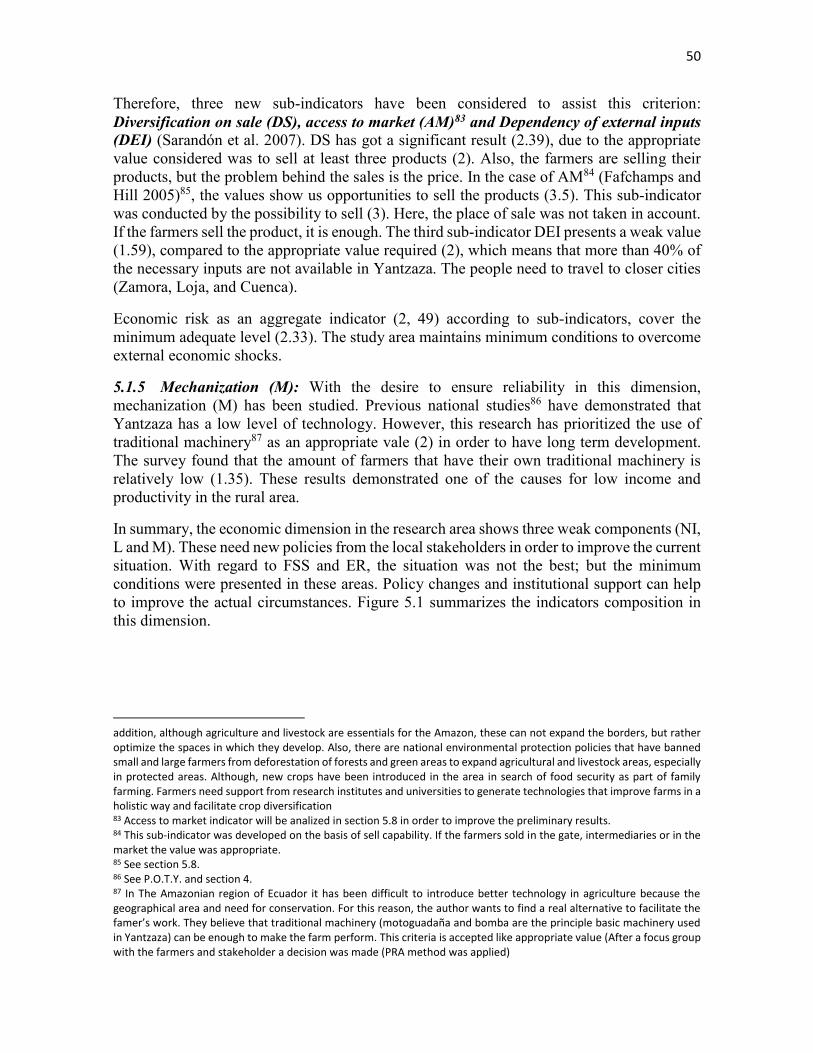
50
Therefore, three new sub-indicators have been considered to assist this criterion: Diversification on sale (DS), access to market (AM)83 and Dependency of external inputs (DEI) (Sarandón et al. 2007). DS has got a significant result (2.39), due to the appropriate value considered was to sell at least three products (2). Also, the farmers are selling their products, but the problem behind the sales is the price. In the case of AM84 (Fafchamps and Hill 2005)85, the values show us opportunities to sell the products (3.5). This sub-indicator was conducted by the possibility to sell (3). Here, the place of sale was not taken in account. If the farmers sell the product, it is enough. The third sub-indicator DEI presents a weak value (1.59), compared to the appropriate value required (2), which means that more than 40% of the necessary inputs are not available in Yantzaza. The people need to travel to closer cities (Zamora, Loja, and Cuenca).
Economic risk as an aggregate indicator (2, 49) according to sub-indicators, cover the minimum adequate level (2.33). The study area maintains minimum conditions to overcome external economic shocks.
5.1.5 Mechanization (M): With the desire to ensure reliability in this dimension, mechanization (M) has been studied. Previous national studies86 have demonstrated that Yantzaza has a low level of technology. However, this research has prioritized the use of traditional machinery87 as an appropriate vale (2) in order to have long term development. The survey found that the amount of farmers that have their own traditional machinery is relatively low (1.35). These results demonstrated one of the causes for low income and productivity in the rural area.
In summary, the economic dimension in the research area shows three weak components (NI, L and M). These need new policies from the local stakeholders in order to improve the current situation. With regard to FSS and ER, the situation was not the best; but the minimum conditions were presented in these areas. Policy changes and institutional support can help to improve the actual circumstances. Figure 5.1 summarizes the indicators composition in this dimension.
addition, although agriculture and livestock are essentials for the Amazon, these can not expand the borders, but rather optimize the spaces in which they develop. Also, there are national environmental protection policies that have banned small and large farmers from deforestation of forests and green areas to expand agricultural and livestock areas, especially in protected areas. Although, new crops have been introduced in the area in search of food security as part of family farming. Farmers need support from research institutes and universities to generate technologies that improve farms in a holistic way and facilitate crop diversification 83 Access to market indicator will be analized in section 5.8 in order to improve the preliminary results. 84 This sub-indicator was developed on the basis of sell capability. If the farmers sold in the gate, intermediaries or in the market the value was appropriate. 85 See section 5.8. 86 See P.O.T.Y. and section 4. 87 In The Amazonian region of Ecuador it has been difficult to introduce better technology in agriculture because the geographical area and need for conservation. For this reason, the author wants to find a real alternative to facilitate the famer’s work. They believe that traditional machinery (motoguadaña and bomba are the principle basic machinery used in Yantzaza) can be enough to make the farm perform. This criteria is accepted like appropriate value (After a focus group with the farmers and stakeholder a decision was made (PRA method was applied)
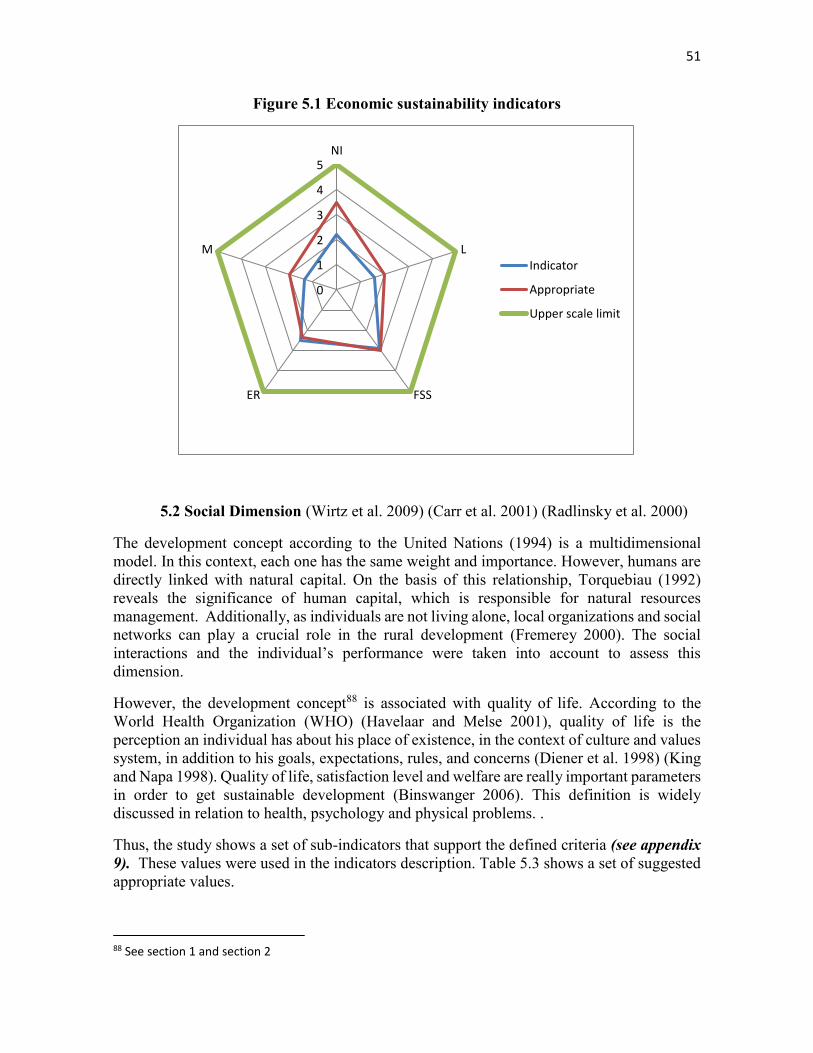
51
Figure 5.1 Economic sustainability indicators
5.2 Social Dimension (Wirtz et al. 2009) (Carr et al. 2001) (Radlinsky et al. 2000)
The development concept according to the United Nations (1994) is a multidimensional model. In this context, each one has the same weight and importance. However, humans are directly linked with natural capital. On the basis of this relationship, Torquebiau (1992) reveals the significance of human capital, which is responsible for natural resources management. Additionally, as individuals are not living alone, local organizations and social networks can play a crucial role in the rural development (Fremerey 2000). The social interactions and the individual’s performance were taken into account to assess this dimension.
However, the development concept88 is associated with quality of life. According to the World Health Organization (WHO) (Havelaar and Melse 2001), quality of life is the perception an individual has about his place of existence, in the context of culture and values system, in addition to his goals, expectations, rules, and concerns (Diener et al. 1998) (King and Napa 1998). Quality of life, satisfaction level and welfare are really important parameters in order to get sustainable development (Binswanger 2006). This definition is widely discussed in relation to health, psychology and physical problems. .
Thus, the study shows a set of sub-indicators that support the defined criteria (see appendix 9). These values were used in the indicators description. Table 5.3 shows a set of suggested appropriate values.
88 See section 1 and section 2
0
1
2
3
4
5NI
L
FSSER
MIndicator
Appropriate
Upper scale limit
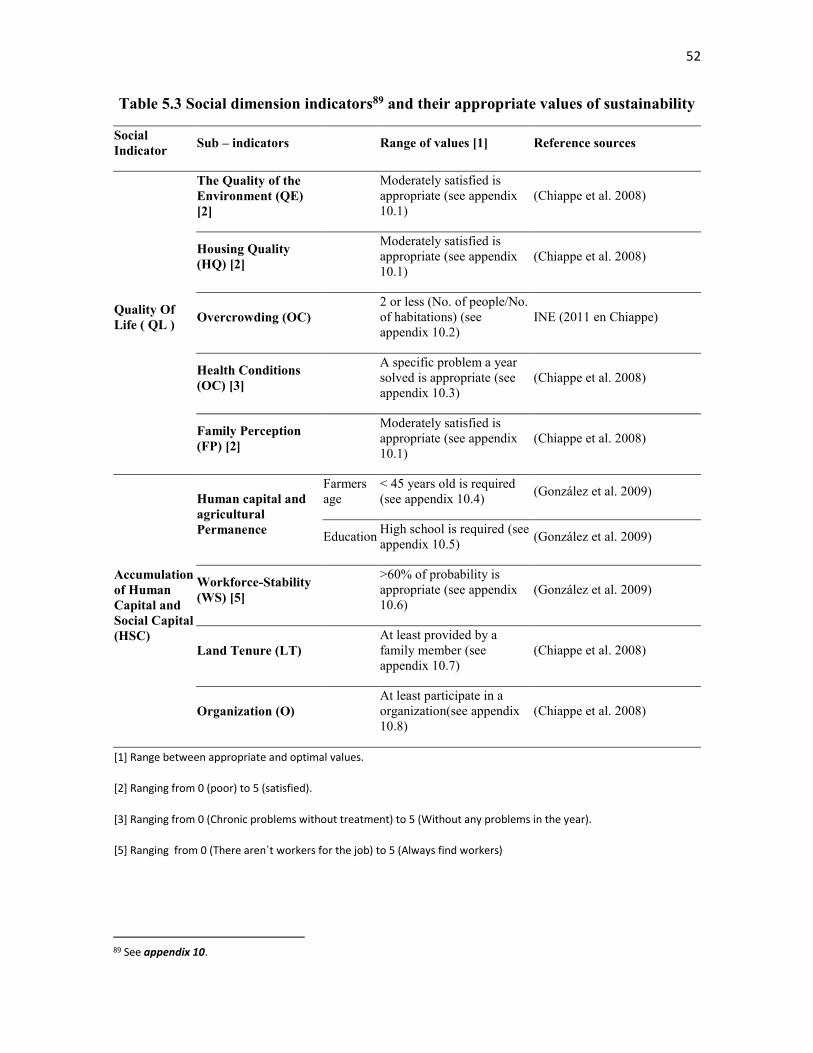
52
Table 5.3 Social dimension indicators89 and their appropriate values of sustainability
Social Indicator Sub – indicators Range of values [1] Reference sources
Quality Of Life ( QL )
The Quality of the Environment (QE) [2]
Moderately satisfied is appropriate (see appendix 10.1)
(Chiappe et al. 2008)
Housing Quality (HQ) [2]
Moderately satisfied is appropriate (see appendix 10.1)
(Chiappe et al. 2008)
Overcrowding (OC) 2 or less (No. of people/No. of habitations) (see appendix 10.2)
INE (2011 en Chiappe)
Health Conditions (OC) [3]
A specific problem a year solved is appropriate (see appendix 10.3)
(Chiappe et al. 2008)
Family Perception (FP) [2]
Moderately satisfied is appropriate (see appendix 10.1)
(Chiappe et al. 2008)
Accumulation of Human Capital and Social Capital (HSC)
Human capital and agricultural Permanence
Farmers age
< 45 years old is required (see appendix 10.4) (González et al. 2009)
Education High school is required (see appendix 10.5) (González et al. 2009)
Workforce-Stability (WS) [5]
>60% of probability is appropriate (see appendix 10.6)
(González et al. 2009)
Land Tenure (LT) At least provided by a family member (see appendix 10.7)
(Chiappe et al. 2008)
Organization (O) At least participate in a organization(see appendix 10.8)
(Chiappe et al. 2008)
[1] Range between appropriate and optimal values.
[2] Ranging from 0 (poor) to 5 (satisfied).
[3] Ranging from 0 (Chronic problems without treatment) to 5 (Without any problems in the year).
[5] Ranging from 0 (There aren´t workers for the job) to 5 (Always find workers)
89 See appendix 10.

53
As in the economic dimension, a multivariate analysis was completed. Table 5.4 shows the correlations, the values of the individual indicators are normally distributed. Since these were defined we utilized Pearson as a test of parametric correlation.
Table 5.4 Pearson correlation coefficients (Social Dimension)
QE HQ OC HC FP Age Ed. WS LT O
QE 1 .316** 0.099 0.067 .204* 0.053 0.09 0.14 0.041 0.028
HQ .316** 1 0.148 .201* .387** 0.103 0.102 0.077 0.132 -0.003
OC 0.099 0.148 1 -0.041 0.136 -0.153 -0.03 0.036 0.009 -0.114
HC 0.067 .201* -0.041 1 .255** 0.114 -0.035 -0.026 -0.087 -0.122
FP .204* .387** 0.136 .255** 1 -0.014 0.024 .197* 0.106 0.045
Age 0.053 0.103 -0.153 0.114 -0.014 1 .438** -0.054 -.174* -0.002
Ed 0.09 0.102 -0.03 -0.035 0.024 .438** 1 -0.021 -0.051 0.099
WS 0.14 0.077 0.036 -0.026 .197* -0.054 -0.021 1 -.167* 0.137
LT 0.041 0.132 0.009 -0.087 0.106 -.174* -0.051 -.167* 1 0.003
O 0.028 -0.003 -0.114 -0.122 0.045 -0.002 0.099 0.137 0.003 1
(*) Significance level p<0, 05; (**) Significance level p<0 01.
This matrix allows us to know that there was not a high correlation between the selected set of indicators. However, in one case there was a moderate correlation90 (between education and age). The principal reason is because the people in Yantzaza are getting education when they are older. Even these two sub-indicators are part of human and social capital as a significant indicator for the conclusions. There are other cases of correlations between 0.2 and 0.4, which is considered low. These are explained by the answers from the questionaries’ since the scale was similar (from very satisfied to very unsatisfied) and the people’s perception was required. Also, it helps to know that the indicators can be described and interpreted individually in the dimension.
The indicators proposed will be described in the next section, taking the outcomes from field-work into account. Appendix 10 illustrates the referential scale in each case.
5.2.1 Quality of Life (QL): Local knowledge in this survey was a priority according to participatory91 goals. The first indicator is QL. With the aim to find a good measure, the researcher’s team took individual objectives related to local context to seek the better results (Carr et al. 2001, Wirtz et al. 2009). Campbell et al. (1976) used a basic method to find a certain measure related to quality of life in the United States of America. Our work used that proposal as a reference and combined it with other empirical works (Chiappe et al. 2008) (González et al. 2009). The scale was defined based on people’s perception (See appendix 10.1)
The indicator has been structured with five sub-indicators: The quality of the environment (QE), housing quality (HQ), overcrowding conditions (OC), health conditions (HC) and 90 Researchers conclude that a very low correlation is <0.20; a low correlation is between 0.20 and 0.40; and a moderate correlation is between 0.40 and 0.60. 91 See Neef (2005a)
54
family perception (FP). The family criterion was taken from the surveys. According to the determinate scale, QE, HQ and FP have used a range, between very dissatisfied (0) until very satisfied (5). Moderately satisfied has been selected as an appropriate value (3). In the three cases the results present relevant significance, because they are above the delimited level (3). The outcomes are: 3.35; 3.21 and 3.17; respectively. These values mean that even though the rural people have poor infastructure, and lack public services, they want to continue living in this area as they enjoy the local environment and perceive their lives as being fulfilling.
Also, the next two sub-indicators show high values (OC 2.97 and HC 2.97) taking into account that the lower level was defined as 3. In the case of OC, the appropriate value is that two or less people are living in a one room. The OC is very close to the suggested value. The case of HC is similar. In this sub-indicator, the appropriate value is related to the number of illnesses and rate of treatment92. The people in Yantzaza do not have many serious health problems, and even if they are sick, they are able to obtain treatment. The rural population encounter some health problems such as the flu, mumps, rubella, diseases associated with old age and seasonal illnesses. Quality of life is a composed indicator; the five sub-indicators comprise the same weight (Roming et al. 1996). The aggregate value (3.13) is higher than the required value (3). These outcomes reveal a positive situation in reference to family life in Yantzaza. Basically, the population accepts the current standards of living and they prefer to maintain it.
5.2.2 Accumulation of the human and social capital (HSC): The second criterion related to the social dimension depends on HSC. Human capital refers to capabilities, and level of training for the local people, as well as skills, education, leadership, experience, local knowledge and environmental conditions. Instead, social capital is related to collective action and confidence between people. Social capital describes the social interactions in a community with networks, alliances, and team work. (Flora et al. 1994).
Four sub-indicators were conducted to facilitate this dimension: Human capital and agricultural permanence (HCAP), workforce-stability (WS), land tenure (LT) and organization (O). First, HCAP was developed with two parameters, age and education. With the aim of ensuring long-term permanence, young people and technical knowledge were used as reference levels. A farmer between 35 and 44 years of age with at least a medium level of education was suggested93 (3). In both cases low values were encountered (1.92 and 2.18 respectively). There is evidence of long-term problems though because a large amount of farmers are old and have a low level of education. The study found that 16.9% have a medium level of education and only 8.4% have attended university.
Another sub-indicator is WS, which is measured through interviews with farmers and their work experience according to the individual demands. At least a 60% (3) success rate is required. This means that although it is difficult, it is possible to find workers for a job. The value of the sub-indicator (2.28) is below the suggested indicator, i.e. occasionally the farmers find workers for the job. On other hand, property rights94 play a very important role 92 Health conditions scale refers to illness and treatments (see appendix 10.3) 93 Age and education are sub-indicators defined according to empirical criteria. Appndix 10.4 and 10.5 explain the scale used in the research. 94 Property rights play an important role in the neoclassical economy as a key assumption. Even, North (1991), describes the increasing importance of transaction costs in the markets in the discussion on institutional arrangements of market

55
in the rural economy. LT comprises the kind of property that farmers have in the study area. As for Al, in order for this indicator to be valid, the property must be owned by a family member 95 (3). The results show sufficient tenure levels (3.53) in Yantzaza. However, 35% of farms do not have a legal title, which is a considerable amount.
Finally, O is a base of social capital structure. Transaction costs can be reduced if the people in the rural regions can work together. In the research it was good if the farms participated in an organization (3), but the survey data found a critical problem with this indicator (0.95). The people in Yantzaza are not working together, because they have had bad experiences and several failures. Only 19% of people belong to formal organizations, and 17% are involved in informal organizations. The rest of farmers (64 %) do not participate at any organizational level.
HSC is a composed indicator. From aggregate information the indicator (2.2) reveals serious problems in human and social capital. The appropriate value (3) is higher than the indicator.
In summary, our results clearly showed two different types of findings. First, even though the people find their lives fulfilling in the study area, they also see its flaws and would like to work to better it. On other hand the survey announces serious problems in regards to human and social capital. Policy mechanisms and institutional support are required. Local stakeholders should take into account the importance of this dimension to establishing sustainability. Figure 5.2 presents a recapitulated graphic related to indicators’ composition in this dimension.
Figure 5.2 Social sustainability indicators
dynamics. The exchange of property rights between people creates transaction costs. Environmental issues and rural dynamics can only partly be explained by the classical economic theory, due to unclear property rights and lack of market prices for services. Products and services obtained from natural resources have very different characteristics in relation to their private and public nature. Sometimes, these products and services have the character of common or collective goods, which have independent characteristics. 95 This property has a legal title but the owner is not the head of the family.
0
1
2
3
4
5QE
HQ
OC
HC
FPHCAP
WS
LT
O
Indicator
Appropriate
Upper scale limit
56
5.3 Agro-ecological Dimension
Section 4 described the ecological conditions in Yantzaza. Our focus in this part of the research was ecological constraints related to agricultural production. To recapitulate, land use types in Yantzaza depend mainly on the local features. For example, the arable land in the valley bottoms allows two harvests per year in a field rotation system. Orchards with small associative plantations are commons (e.g. coffee, cocoa, plantain, yucca and fruit trees) (Beck et al. 2008). Also, pasture systems provide food for cattle. Besides, several land use concepts have been used; animal-husbandry systems and pasture management were developed by some of the ethnic groups (Pohle 2008).
When the analysis involves the agro-ecological dimension, the state of the soils is very important. The soil purifies the water, as it is a natural means of storing carbon, thus helping people have cleaner water sources (BMU 2002).
The fertile soils allow humans to improve their condition as they help plants through balancing the water, air, heat and nutrients (Scheffer and Schachtschabel, P. et al. 1989). It is very difficult to increase the amount of fertile soil on the planet96, however it is relatively easy to destroy it (European Soil Charter 1972).
Around the world, soil fertility is a one of the principle problems in the agricultural sector and constrains plants productivity (FAO 2001). The focus of this research was sustainable development related to the agricultural sector and for this reason, soil fertility is a key indicator. It is challenging to have an international appropriate value with regard to soils. However, we described a set of parameters that permit us to obtain good results in this dimension (RISE 2012).
Traditional agriculture is good to evaluate because within sustainable devoplement, it has the ability to become a more powerful influence than other sectors. (Altieri 1995) (Toledo 1993). In order to complete this analysis, it is important to take into account that pasture management and cultivation of annual land perennial crops are the principle land-use types in Ecuador (de Koning et al. 1999). Nevertheless, the agro-ecological dimension encompasses some parameters that aide sustainable development.
In order to improve the current agro-ecological situation on the basis of crop yields, pasture land, and livestock performance, a set of indicators was made (see Appendix 11). Natural resource protection, stability and productivity support the indicators (Smyth and Dumansky 1993).
Five indicators are defined: yield (Y), land use (LU), erosion risk (E), organic matter (OM) and agrochemical use (AU). Table 5.5 synthesizes the outcomes from the agro-ecological assessment. This information was used in the indicators description.
96 Actual situation: 1 billion ha of degraded lands

57
Table 5.5 Agro-ecological dimension indicators and their appropriate values of sustainability
Agro-ecological Indicator Sub-indicators Range of values [1] Reference sources
Yield ( Y ) [2]
Coffee 2,4 (qq/ha) (FAOSTAT 2015)
Banana 191,46 (heads/ha) (FAOSTAT 2015)
Plantain 217,67 (heads/ha) (FAOSTAT 2015)
Corn 24,7 (qq/ha) (FAOSTAT 2015)
Yucca 28,3 (qq/ha) (FAOSTAT 2015)
Sugar Cane 6500 (panelas/ha) (INIAP 2015)
Cocoa 6(qq/ha) (FAOSTAT 2015)
Papaya 2268 (units/ha) (INIAP 2015)
Naranjilla 88 (qq/ha) (INIAP 2015)
Land Use ( LU )
Forest 51% - 100% (coverage) Sarandon et al. (2007)
Crop Rotation (CR) > 1 year is appropriate (Häni et al. 1998) (Sarandón et al. 2007)
Crop Diversity (CD) [3] diversification with low association levels is appropriate
(Sarandón et al. 2007)
Erosion Risk (E )
Observation (OB) Without and slight erosion (González et al. 2009)
Slope (S) < 15% (slope) (Mosimann et al. 1991)
Forest (F) 51% - 100% (coverage) (González et al. 2009)
Organic Matter (OM) Crop Residues (CR) [4] at least food for the animals is
appropriate Field work (2012)
Humus Content (HC) [5] at least produced by farmers Field work (2012)
Agrochemical Use
( AU ) Indicator depends on the product
Quantity suggested by the manufacturer. (see appendix 13)
[1} Range between appropriate and optimal values
[2] Appropriate value is presented, optimal value is higher than the field work (See appendix 12)
[3] Ranging from 0 (Perennial monoculture) to 5 (Total diversification with crop association)
[4] Ranging from 0 (Wasting residues) to 5 (New humus)
[5] Ranging from o (non-use) to 5 (purchase compost)

58
Previously, based on the indicators description, multivariate analysis was used. Table 5.6 shows the correlations. The values of the individual indicators are normally distributed. Since these indicators were defined, we utilized Pearson as a test of parametric correlation.
Table 5.6 Pearson correlation coefficients (Agro-ecological Dimension)
Y LU ER OM AU
Y 1 .167* .012 .075 .098
LU .167* 1 .021 .198* -.094
ER .012 .021 1 -.049 -.058
OM .075 .198* -.049 1 .134
AU .098 -.094 -.058 .134 1 (*) Significance level p<0,05
The preceding analysis permits us to conclude that there was not a significant correlation between the selected set of agro-ecological indicators. Also, it helps to know that the indicators can be interpreted individually in this dimension.
5.3.1 Yield (Y): The yield indicator was carried out on the basis of nine crops97. Yantzaza shows four types of land use: primary forest, pasture, perennial plantation crops and annual crops (Bahr et al. 2014). This indicator used perennial and annual crops because the study evaluated cash crops.
One indicator was determinate. Moreover, all crops participated with different varying weights depending on the production level. Fruit crops have half the weight in comparison to other crops. Seven crops were considered with the same level of importance (see appendix 12).
Coffee, corn and yucca are the crops with values above the appropriate value. The rest of the crops demonstrated low productivity according to national standards used in this indicator. The minimum acceptable value of production changes in each cultivation and because of that, we can not use the same value scale. (see appendix 12). Banana, plantain, sugar cane, cocoa, papaya and naranjilla resulted in low yields. In summary, and taking into account different crop weights, the indicator (2.29) is not appropriate compared to the national indicator required (2.45). It is necessary to find ways to improve this result.
5.3.2 Land Use (LU): The second indicator is a composite. LU (see appendix 14.1; 14.2 and 14.3) is a general concept, although this survey has taken into account three sub-indicators to explain it. These are: Forest (F), crop rotation (CR) and crop diversity (CD) (Christen and O'Halloran-Wietholtz 2002) (Pretty, J. et al. 2008) (Breitschuh et al. 2008). In this context, F98 is relevant to sustainability, because it protects the soil from climatic effects and reduces erosion. In Yantzaza, previous forest degradations from Colonos, through fire or pasture extension (Paulsch and Czimczik 2001) have been identified. The sub-indicator 97 These crops were chosen after field work, because the results show an irrelevant production of the rest of the crops. Other kinds of them can be found, but, in low production levels. 98 Forest coverage has been carried out by the researchers. An observation technique was used, usingf farm maps. The map was drawn by the farmers to know the forest coverage. The percentage is the result of a map analysis. A percentage related with the total area was selected in order to find coverage.

59
(2.71) shows a value below the percentage defined by expertise and external references (at least 51% of forest coverage, represents the 3 value). This is explicated by high forest degradation rate99 in Ecuador during last three decades. According to Romero et al. (2010) forest cover in Yantzaza was 53%, but at the time of this study this value has reduced by 5% approximately.
The next sub-indicator is CR. This value was defined in accordance to survey information. The values (1.19 is low in relation to 3) found show us poor rotation conditions. The people practically do not rotate crops. After harvest, farmers sow new crops in short periods of time.
In the case of CD, the situation did not change, because monoculture is preferred in Yantzaza. The sub-indicator (1.39) presents a very low level of diversification on the basis of the appropriate value (3).
As LU is a composite indicator, the final results demonstrated a problem that is encountered in these parameters. The indicator (1.76) was found below the suggested value (3). LU had a significant problem in agro-ecological measures.
5.3.3 Erosion Risk (ER): Another composed indicator is ER. Observation method (OB), slope (S) and forest (F) were studied to facilitate the study. OB100 is a rapid method used by Gonzalez et al. (2009) where direct observation and conservation practices are considered (see appendix 15). Erosion problems were determined by the weak sub-indicator (2.53) which were below the value suggested (3). Direct observation concluded an erosion threat. Other criteria is S, which is measured according to slope percentage. The study area is a mountainous region where the farmers are living. Thus, this sub-indicator (1.95) shows predominant slope in the farms in contrast with the minimum value suggested (15 % or less represents a 3 value). The last measured was forest coverage, but it was analyzed in the last indicator. In summation, ER (2.4 compared with the appropriate value of 3) shows a serious problem considering the three sub-indicators combined.
Erosion is an important factor in a negative nutrient balance (de Koning et al. 1997). Quiroz et al. (1995) estimated soil loss in the Andean countries and stated that current management in most cultivable land in the Andes threatens the sustainability of the agricultural systems.
5.3.4 Organic Matter (OM): The agricultural production needs to be evaluated according to productivity. OM content is the next indicator. OM was measured on the basis of ecological farmer’s behavior. Crop residues (CR), and Humus Content (HC) were used (Kuntze, H. et al. 1994). In the three cases, a scale was realized where the appropriate value represents 3 and the upper scale limit value represents 5 (see appendix 14.4 and 14.5). CR illustrated good results (3.99) due to farmer’s use of harvest residues. With respect to HC, it was appropriate when at least the farmers produce compost from themselves. The sub-indicator (2.56) presents low results. The use of compost has not been a traditional practice in
99 For example in 2005 deforestation in Ecuador was 10.8 million ha, representing 39% of the land area (FAO 2006a) 100 The universal equation of soils losses is too complex for this research due to the quantity of data required. For this reason, the indicator is called erosion risk instead of erosion. Also, external information from related studies was taken in order to improve the diagnostic.

60
Yantzaza’s agriculture. OM, as a composite indicator, had high results (3.22) which support soil productivity.
5.3.5 Agrochemical use (AU): Finally, chemical use in the agriculture is a common method used to obtain faster production. For instance, the agrochemical use in emerging and developing countries is increasing (OECD 2010) thus affecting the normal agricultural production.
In this research ten chemical products (agrochemicals, pesticides, and fungicides) were studied. Each product had different results in reference to the provider’s suggestion (see appendix 13). The indicator is appropriate according to our study because approximately 55% of farmers did not use these products frequently. But, for the 45% of farmers that are using the products, the results show inappropriate levels (the indicator was 3.51 related to appropriate value of 3.5). The Ecuadorian agriculture systems was characterized by low chemical and fertilizer usage (Koning et al. 1997). However, in Yantzaza, it is necessary to pay attention to this indicator as agrochemicals can cause acute and chronic problems for the population (McCauley et al. 2006).
Overall, this dimension presented three weak indicators (yield, land use and erosion risk), furthermore, organic matter and agrochemical use were at the minimum levels suggested. This dimension tried to find ways to improve the use of natural resources in agricultural activities. These outcomes represented current concerns in ecological parameters. New policies are needed to take the farmers’ perspective into account in order to sustain natural resources management. Figure 5.3 illustrates the indicators composition in this dimension.
Figure 5.3 Agro-ecological sustainability indicators
0
1
2
3
4
5Y
LU
EROM
AUIndicator
Appropriate
Upper scale limit
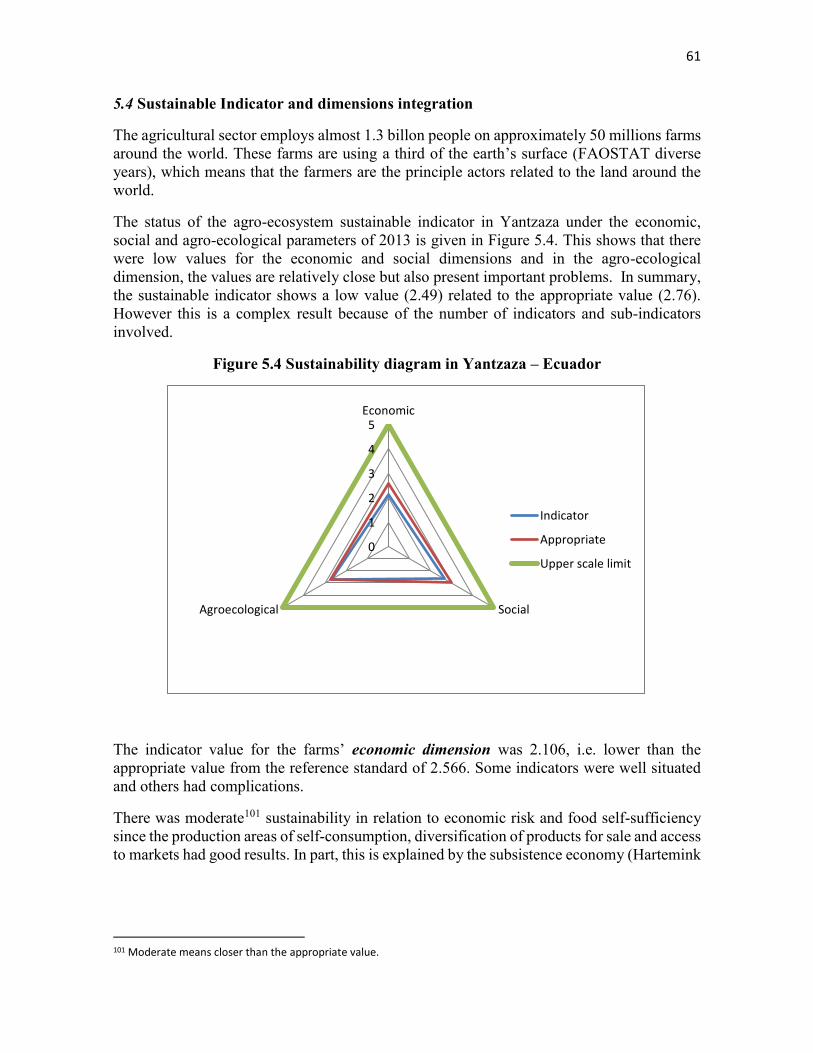
61
5.4 Sustainable Indicator and dimensions integration
The agricultural sector employs almost 1.3 billon people on approximately 50 millions farms around the world. These farms are using a third of the earth’s surface (FAOSTAT diverse years), which means that the farmers are the principle actors related to the land around the world.
The status of the agro-ecosystem sustainable indicator in Yantzaza under the economic, social and agro-ecological parameters of 2013 is given in Figure 5.4. This shows that there were low values for the economic and social dimensions and in the agro-ecological dimension, the values are relatively close but also present important problems. In summary, the sustainable indicator shows a low value (2.49) related to the appropriate value (2.76). However this is a complex result because of the number of indicators and sub-indicators involved.
Figure 5.4 Sustainability diagram in Yantzaza – Ecuador
The indicator value for the farms’ economic dimension was 2.106, i.e. lower than the appropriate value from the reference standard of 2.566. Some indicators were well situated and others had complications.
There was moderate101 sustainability in relation to economic risk and food self-sufficiency since the production areas of self-consumption, diversification of products for sale and access to markets had good results. In part, this is explained by the subsistence economy (Hartemink
101 Moderate means closer than the appropriate value.
0
1
2
3
4
5Economic
SocialAgroecological
Indicator
Appropriate
Upper scale limit
62
2005) (Heidhues et al. 2007) (Bendix et al. 2013) that is very common for impoverished people in southern Ecuador with few employment opportunities and a weak rural sector.102
Local conditions cause the people to try to minimize the effects, through diversification of crops. On other hand, the Ecuadorian Amazon region was abandoned by public policy makers for the past few years while the people continued to live in precarious conditions. This is the principal reason why the people are looking for more income to satisfy their basic needs. The agricultural sector helps them sell their crops. Additionally, since the rural migration in 1960s and 70s, the people in rural areas of the Amazon regions have sufficient land area to cultivate enough crops to survive and to sell. With regard to food and animal storage, the area has enough to survive but many basic needs are still left unfulfilled.
Moreover, in reference to the economic dimension, there were significant problems related to net income, labor and mechanization. The proportion of the farmer’s income derived from agriculture and livestock increased. This variable was an indicator of the level of income related to the minimum vital basket in Ecuador. The result (2.2) was lower than the national level (3.5), which means that the people do not have the minimum income necessary to provide for a family. This result explained the high poverty level and lack of basic needs, even though subsistence farming provided a minimum level of food. The lack of income was a consequence of price volatility in the agricultural sector, weak public policies, lack of markets, employment diversification and more. Low profits affected migration, deforestation, and use of natural resources. At the same time, labor was another crucial issue. When there were poor prices and sales with high transaction costs involved, the farmers could not pay the workers enough money. Furthermore, migration combined with the lack of employment opportunities generated a reduced supply of labor (Terluin 2003).
The last affected indicator was mechanization. In this case, the natural conditions like mountains and high slopes were a significant problem for the area. That is why the machinery involved in Yantzaza did not use more advanced technology. As mentioned in Table 5.2, the basic machinery was required. However, the farmers did not have the money to purchase the equipment. This was critical because more advanced mechanization helps farmers increase the efficiency and productivity of their farms. In the Amazon region it was relatively easy to obtain basic tools to work. But, the people needed financial instruments or public support to facilitate this process (Heidhues et al. 2007) (Hediger 1999).
The farm social values were defined on the basis of people’s perception (QL) and social structure (HSC). The social indicator illustrates a fragile situation in this dimension. The indicator obtained was 2.67 and the suggested value was 3.
As the scale implies the first indicator is perceived between unsatisfied and very satisfied. The appropriate value was found. The 3 value means appropriate value, and the outcomes show acceptable criteria for this indicator. The average was 3.13 which indicated that people’s perception about the environment, housing and overcrowding, was closely related to the reference value defined previously. This parameter is subjective for some researchers, although in human studies the people’s opinion plays a very important role (Campbell et al.
102 In Ecuador, 59% of the rural people are involved in the primary sector, i.e., agriculture, livestock and forestry production. (García 2007)

63
1976). Natural conditions, family inheritance, human priorities and tranquility are several of the reasons why people in Yantzaza like their quality of life.
Now, the discussion shall be about the social linkages in the study area. The principle reason is the second sub-indicator. When in the rural regions the analysis refers to human and social interactions the probability of failure increases. Yantzaza is a rural village, often characterized by a low level of education and old people working in the fields. The findings illustrated that low levels of education and significant issues with farmers’ ages will affect long-term work. This was caused by a lack of opportunity and accessibility to pursue higher education in the rural regions and a high rate of poverty in the agricultural and livestock sectors.
Thus, the majority of farmers in the village are 45 years old or more. Which means that there
are old farmers and a possible abandonment of the field in the future. Other negative factors are local organization and workforce stability. The results show that there is a lack of local organization as farmers prefer to work alone withouth a team mentality. In rural regions, a way to increase incomes would be to establish organizations, thus reducing the transactions cost (North 1991), avoiding external shocks, facilitating access to credit and opening markets etc. The local and national institutions would be able to help them in this area. The workforce is also a substantial weak point. The young people could work in the fields, but there is a lack of economic incentive. There are some local incentives to increase the workforce like income incentives, institutional facilities, training, demonstrative plots, and farm management strategies, etc. Finally, land tenure in the town remains as a consistent indicator. The 1964 land distribution and the 1970s internal migration increased the land tenure in the study area.
The agro-ecological dimension shows a value of 2.682 which is very close to the suggested number of 2.718. Nonetheless, each indicator has a different result. The aggregate indicator in agro-ecological dimension did not specify the sub-indicators and individual results. This topic is part of an international debate. In section 2, the discussion emphasized soil conservation and natural resource protection. The world is running out of natural resources (Falconí 2014) and faces a number of economic systems that do not use responsible social and environmental methods.
In the south of the Ecuadorian amazon region, the agro-ecological issues focused on crop productivity, land use and erosion risk (de Koning et al. 1997). The agricultural education in the village is virtually zero. Additionally, agricultural extension and technical support are not linked to the farmers. Agricultural management is based on farmers’ experiences (UGT 2012) in the research area. Deforestation and the expansion of the cultivated land are degrading the soil. Forest cover is decreasing due to agricultural and livestock production. The soils have an imbalance of nutrients which cause low productivity.
Bahr et al. (2014) studied nutrient balance103 based in agricultural management activities in four land use types in Yantzaza (primary forest, pasture, perennial plantation crops and
103 Nutrient gains were derived from mineral and organic fertilizer (compost and animal excreta), atmospheric deposition and biological N-fixation. Outputs were based on nutrient losses from harvested farm products and other organic material (grazing in pastures and harvest residues), leaching, gaseous losses and erosion. Consequently, data on fertilizer application and harvested farm products were obtained by farm surveys. Inputs and outputs from animal excrement and grazing were calculated using livestock regression models of the NUTMON tool after data was collected“ (Bahr et al. 2014)
64
annual crops). He showed that annuals had the most negative nutrient balance of all investigated land-uses with losses of Nitrogen (N), Phosphorus (P) and Potassium (K). The negative nutrient balance was mainly due to erosion and a lack of fertilizer. To compensate for nutrient losses and to improve soil fertility in the short and the long-term, it is necessary to use mineral NP fertilizers and to adapt an integrated residue management with organic amendments (Diacono and Montemurro 2010).
Furthermore, Bahr et al. (2014) also concluded that there was a strong decrease of SOC and total soil nutrient stocks in the oldest perennial and pasture sites.104 Therefore, Yantzaza was demanding new management strategies. Nevertheless, knowledge capacity building programs were not established by public actors and public institutions and motivation was low to implement more adapted management strategies. In regards to pastures in the research area, they were managed poorly without technical support as is the case with the majority of the Amazonian pastures (Fearnside and Barbosa 1998). Additionally, poorly managed pastures were widely subject to SOC losses (deMoraes et al. 1996) (Fearnside and Barbosa 1998).
However, Conant et al. (2001) demonstrated that well managed pastures with fertilization, improved grazing management, sowing of legumes and earthworm introduction showed significant SOC increases in 74% of the investigated study sites. Consequently, the productivity depended on SOC as a crucial factor for this type of agricultural system in order to maintain the nutrient cycling and soil structure (Palm et al. 1996). Lack of soil management mechanisms and agricultural advisories hinder farmers’ work. Although, the organic matter indicator showed a value close to the appropriate value in regards to the recommended value because the agricultural practices in Yantzaza use traditional mechanisms.105 However, there are some rural people that do not use agricultural management practices adequately.
On the other hand, some ecological strategies like crop rotation or crop diversification were not used by the farmers. They did not have the technical knowledge in order to improve the current conditions. Also, soil erosion was a special concern defined in the survey. Agricultural land was part of the problem, although there were other reasons like road building, trail use, excavation and construction that affected the area too (Harden 2001). Soil loss lowers crop productivity, changes on- and offsite hydrology, and creates off-site deposits that may be damaging (Pimentel et al. 1995) (Cook 1988). Yantaza’s soil is vulnerabe to erosion because it is exposed to moving water and wind as well as the effects of topography and human use. Slopes, removal of vegetation and years of plowing are some examples, which are increasing the force of the moving fluid or decreasing the cohesion of soil (Harden 2001). One of the solutions for these problems could be to increase the amount of densely vegetated land (Sanders 1988) or to decrease deforestation. Mountain soils should be saved for future generations in rural sectors in order to maintain sustainable production (Landa et al. 1997). Since subsistence agricultural is practiced, it is
104 Common doctrine which either shows a stabilization of SOC and nutrient stocks at higher age, or a constant decrease over time. (Cerri et al. 2007) (Don et al. 2011) 105 For instance, the farmers do not burn the crop residues; they are using the waist for the next cultivatation period. Additionally, the people are using the animals residues as humus, while others farmers prepare their own humus.
65
necessary to use the most effective and cost effective soil conservation practices106. Specific practices are applied (Sanders 1988), however some themes can be generalized. For example, cultivation will never be sustainable on extreme slopes (> 45%), including hedgerow systems (Dercon et al. 2006)without increasing reforestation practices. Other means to secure better cultivation include sowing legumes, introducing earthworms (Bahr et al. 2014), and improving the land management through knowledge transfer and technical programs about nutrient balance, fertilization practice, and erosion risk and prevention. Finally, outcomes illustrated poor chemical management. For example, Ecuadorian pasture systems are characterized by the application of low fertilizer amounts (de Koning et al., 1997). Also, they are normally abandoned after several decades due to soil nutrient depletion (Hamer et al. 2013). The indicator value is close to the appropriate value because the small farmers are either not using chemicals or only using herbicides. This is not the majority (45%) though. Although the effect is certainly not strong, the principle recommendation is to use fertilizers, wether organic or inorganic, in the future.
The problem resides in other cases where the fertilizers and agrochemicals are degrading the soil. However, Bahr et al. (2014) suggested the implementation of integrated nutrient management using organic and inorganic fertilization to increase SOC and nutrients in order to compensate nutrient losses via harvest. If farmers used fertilizers under the current conditions, they could damage the field. This happens because farmers do not have basic knowledge and have no training programs. They need at least a minimum level of information. Public agencies or universities can help the local people with transfer programs in order to avoid future problems. This means that transfer technology and knowledge is urgently required and highly recommended for achieving a sustainable farming system in Yantzaza.
5.5 Analysis of farm size and sustainability
There are several ways to classify the farms in the agricultural sector. For instance, economic criteria, land tenure, mechanization, production type, and size etc. (Bachman et al.) (Grenz et al. 2012). The main purpose of the classification of farms is to summarize and compare the information. In order to have better results, the researchers referred to the national standards.
The National Agricultural Census (CNA 2000) classified farms by size. The researchers worked in the area recording information that allowed them to validate the information proposed by the CNA. In order to clarify the results explained in the last section, the farm
106 Harden (2001) offers four general recommendation for erosion management in the Andes: 1. Approach hillsides and rivers as connected systems, examining entire spatial connections between runoff generating surfaces, surfaces susceptible to soil erosion, and channels that deliver eroded soil to streams and rivers. 2. Provide drainage and sediment traps for water flowing down roads and paths. Such drains and traps should accommodate used irrigation water as well as rainfall runoff. 3. Coordinate efforts between agencies to avoid practices that degrade soil, such as the use of tractors on steep slopes. 4. Recognize that any bare ground is subject to soil erosion. As shown in earlier work (Harden 1996), fallow and abandoned lands, especially those previously degraded, can have much higher erosion rates than cultivated sites. Reducing erosion on abandoned and fallow lands may necessitate special efforts by family, community members, or agency personnel.
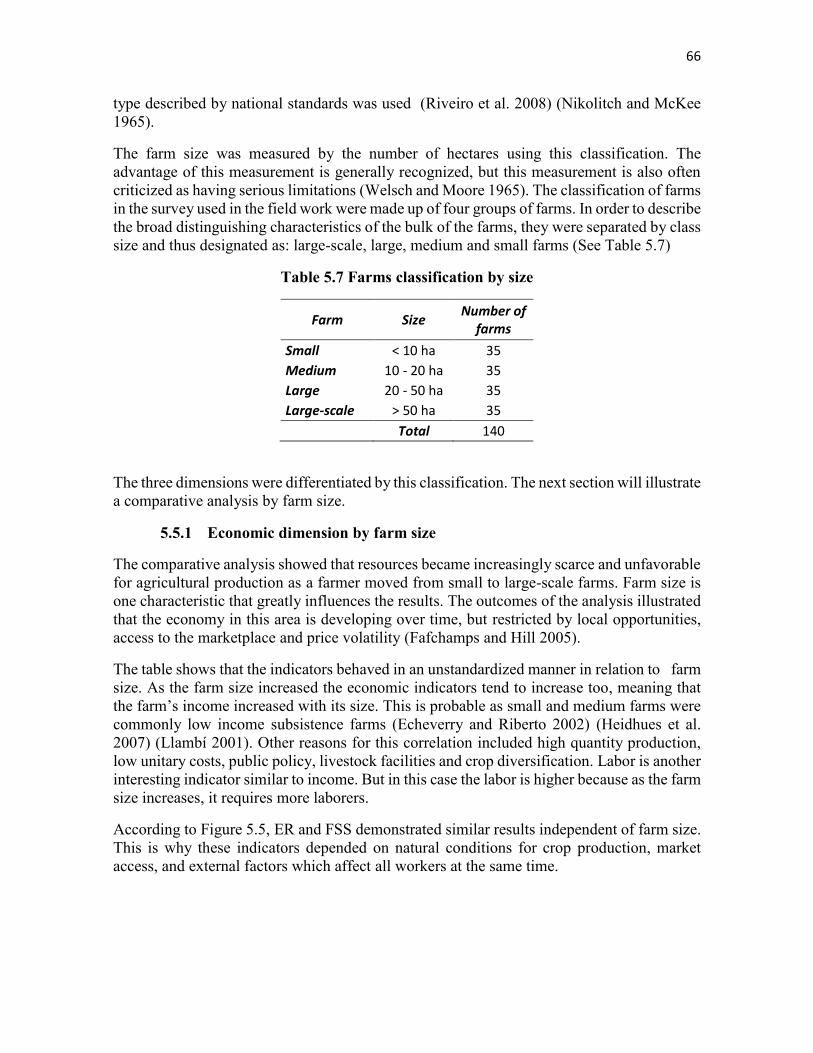
66
type described by national standards was used (Riveiro et al. 2008) (Nikolitch and McKee 1965).
The farm size was measured by the number of hectares using this classification. The advantage of this measurement is generally recognized, but this measurement is also often criticized as having serious limitations (Welsch and Moore 1965). The classification of farms in the survey used in the field work were made up of four groups of farms. In order to describe the broad distinguishing characteristics of the bulk of the farms, they were separated by class size and thus designated as: large-scale, large, medium and small farms (See Table 5.7)
Table 5.7 Farms classification by size
Farm Size Number of
farms
Small < 10 ha 35
Medium 10 - 20 ha 35
Large 20 - 50 ha 35
Large-scale > 50 ha 35
Total 140
The three dimensions were differentiated by this classification. The next section will illustrate a comparative analysis by farm size.
5.5.1 Economic dimension by farm size
The comparative analysis showed that resources became increasingly scarce and unfavorable for agricultural production as a farmer moved from small to large-scale farms. Farm size is one characteristic that greatly influences the results. The outcomes of the analysis illustrated that the economy in this area is developing over time, but restricted by local opportunities, access to the marketplace and price volatility (Fafchamps and Hill 2005).
The table shows that the indicators behaved in an unstandardized manner in relation to farm size. As the farm size increased the economic indicators tend to increase too, meaning that the farm’s income increased with its size. This is probable as small and medium farms were commonly low income subsistence farms (Echeverry and Riberto 2002) (Heidhues et al. 2007) (Llambí 2001). Other reasons for this correlation included high quantity production, low unitary costs, public policy, livestock facilities and crop diversification. Labor is another interesting indicator similar to income. But in this case the labor is higher because as the farm size increases, it requires more laborers.
According to Figure 5.5, ER and FSS demonstrated similar results independent of farm size. This is why these indicators depended on natural conditions for crop production, market access, and external factors which affect all workers at the same time.
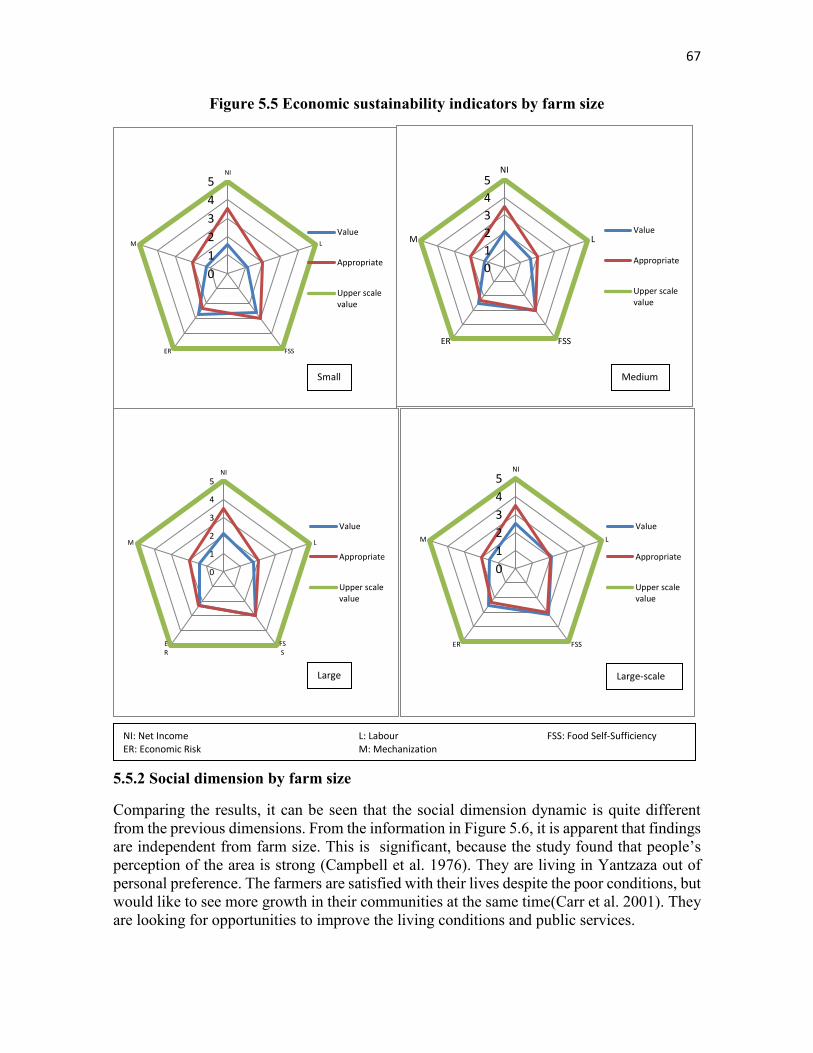
67
Figure 5.5 Economic sustainability indicators by farm size
5.5.2 Social dimension by farm size
Comparing the results, it can be seen that the social dimension dynamic is quite different from the previous dimensions. From the information in Figure 5.6, it is apparent that findings are independent from farm size. This is significant, because the study found that people’s perception of the area is strong (Campbell et al. 1976). They are living in Yantzaza out of personal preference. The farmers are satisfied with their lives despite the poor conditions, but would like to see more growth in their communities at the same time(Carr et al. 2001). They are looking for opportunities to improve the living conditions and public services.
0
1
2
3
4
5NI
L
FSSER
M
Value
Appropriate
Upper scalevalue
0
1
2
3
4
5NI
L
FSSER
MValue
Appropriate
Upper scalevalue
0
1
2
3
4
5NI
L
FSS
ER
M
Value
Appropriate
Upper scalevalue
0
1
2
3
4
5NI
L
FSSER
M
Value
Appropriate
Upper scalevalue
Small
Large-scale Large
Medium
NI: Net Income L: Labour FSS: Food Self-Sufficiency ER: Economic Risk M: Mechanization
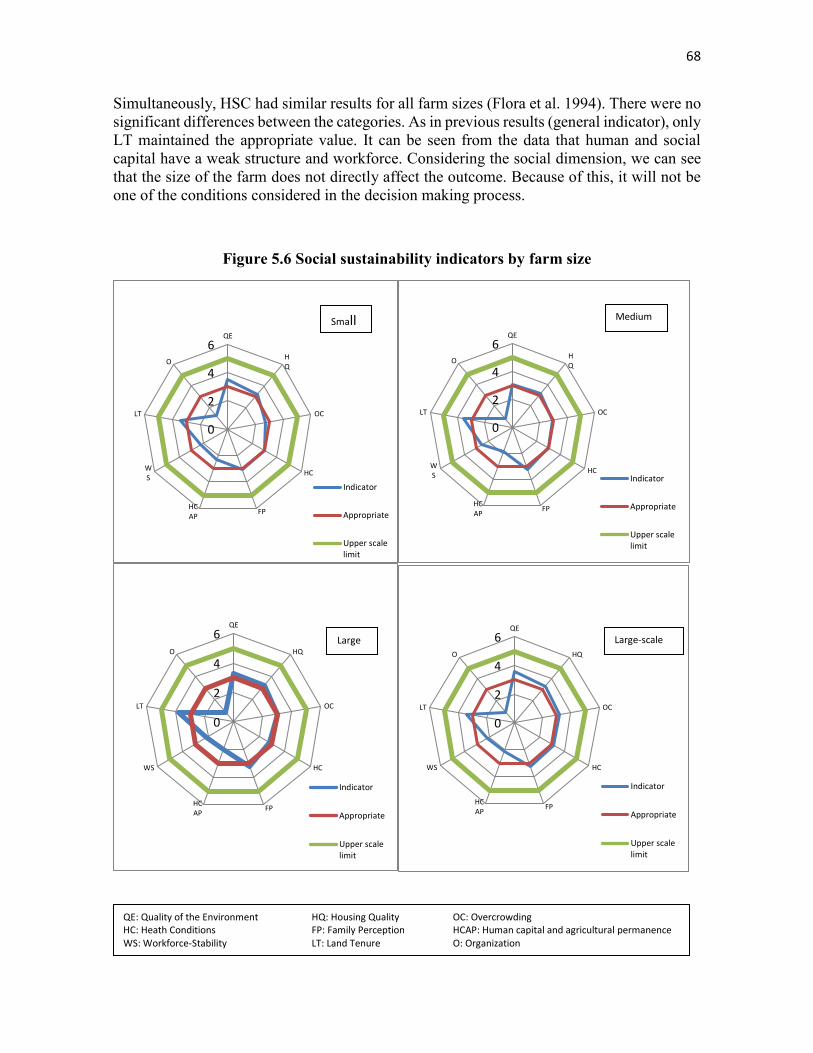
68
Simultaneously, HSC had similar results for all farm sizes (Flora et al. 1994). There were no significant differences between the categories. As in previous results (general indicator), only LT maintained the appropriate value. It can be seen from the data that human and social capital have a weak structure and workforce. Considering the social dimension, we can see that the size of the farm does not directly affect the outcome. Because of this, it will not be one of the conditions considered in the decision making process.
Figure 5.6 Social sustainability indicators by farm size
0
2
4
6QE
HQ
OC
HC
FPHCAP
WS
LT
O
Indicator
Appropriate
Upper scalelimit
0
2
4
6QE
HQ
OC
HC
FPHCAP
WS
LT
O
Indicator
Appropriate
Upper scalelimit
0
2
4
6QE
HQ
OC
HC
FPHCAP
WS
LT
O
Indicator
Appropriate
Upper scalelimit
0
2
4
6QE
HQ
OC
HC
FPHCAP
WS
LT
O
Indicator
Appropriate
Upper scalelimit
Small
Large-scale Large
Medium
QE: Quality of the Environment HQ: Housing Quality OC: Overcrowding HC: Heath Conditions FP: Family Perception HCAP: Human capital and agricultural permanence WS: Workforce-Stability LT: Land Tenure O: Organization

69
5.5.3 Agroecological dimension by farm size
In the third part of the sustainable development model, the findings revealed some issues regarding soil conditions and the environmental conditions of the study area (Bahr et al. 2014). Of course, with further analysis on the way the agro-ecological dimension has worked to date, it has to be said that it has a lot of problems. The single most striking observation to emerge from the data comparison was AU and LU. In Yantzaza the farmers have traditional and subsistence agriculture (UGT 2012). For this reason it is common that small farmers do not use chemicals for their crops (see section 5.4).
Thus, the results illustrated in Figure 5.7 present the clear tendency by farms size. When the farm is bigger the AU value is more inappropriate. The same situation occurs with the LU indicator. In this case, the main reason is the expansion of agricultural land into forests (Mosandl et al. 2008). The second reason is monoculture production with the aim of earning money in the sector (Torquebiau 1992). The consequences of these practices are soil degradation and scarcity of natural resources.
On the other hand, Y, ER and OM did not depend on farmer practices directly in Yantzaza. And for this reason they are independent of farm size. The ecological situation in the area is not satisfying. In section 5.4, some technical measures and knowledge transfer were suggested (Harden 2001) (Hamer et al. 2012).
Figure 5.7 Agroecological sustainability indicators by farm size
0
1
2
3
4
5Y
LU
ER
OM
AU
Indicator
Appropriate
Upper scalelimit
0
1
2
3
4
5
Y
LU
ER
OM
AU
Indicator
Appropriate
Upper sclaelimit
Small Medium
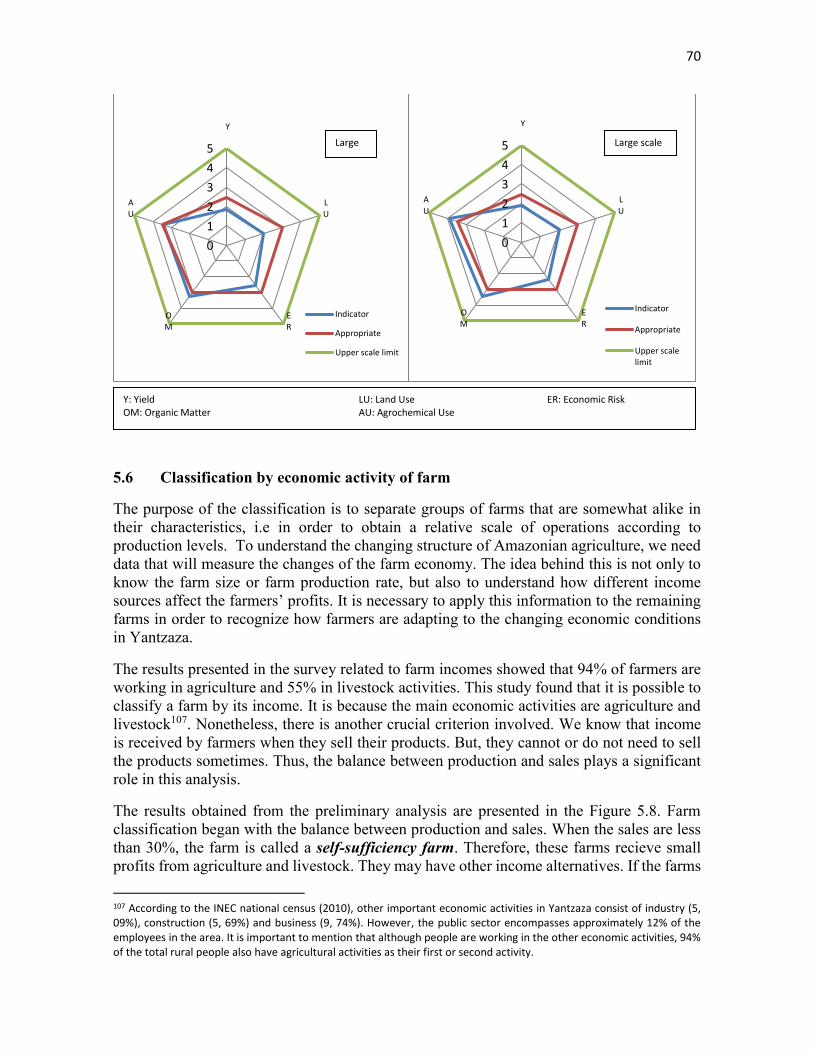
70
5.6 Classification by economic activity of farm
The purpose of the classification is to separate groups of farms that are somewhat alike in their characteristics, i.e in order to obtain a relative scale of operations according to production levels. To understand the changing structure of Amazonian agriculture, we need data that will measure the changes of the farm economy. The idea behind this is not only to know the farm size or farm production rate, but also to understand how different income sources affect the farmers’ profits. It is necessary to apply this information to the remaining farms in order to recognize how farmers are adapting to the changing economic conditions in Yantzaza.
The results presented in the survey related to farm incomes showed that 94% of farmers are working in agriculture and 55% in livestock activities. This study found that it is possible to classify a farm by its income. It is because the main economic activities are agriculture and livestock107. Nonetheless, there is another crucial criterion involved. We know that income is received by farmers when they sell their products. But, they cannot or do not need to sell the products sometimes. Thus, the balance between production and sales plays a significant role in this analysis.
The results obtained from the preliminary analysis are presented in the Figure 5.8. Farm classification began with the balance between production and sales. When the sales are less than 30%, the farm is called a self-sufficiency farm. Therefore, these farms recieve small profits from agriculture and livestock. They may have other income alternatives. If the farms 107 According to the INEC national census (2010), other important economic activities in Yantzaza consist of industry (5, 09%), construction (5, 69%) and business (9, 74%). However, the public sector encompasses approximately 12% of the employees in the area. It is important to mention that although people are working in the other economic activities, 94% of the total rural people also have agricultural activities as their first or second activity.
0
1
2
3
4
5
Y
LU
ER
OM
AU
Indicator
Appropriate
Upper scale limit
0
1
2
3
4
5
Y
LU
ER
OM
AU
Indicator
Appropriate
Upper scalelimit
Large scale Large
Y: Yield LU: Land Use ER: Economic Risk OM: Organic Matter AU: Agrochemical Use
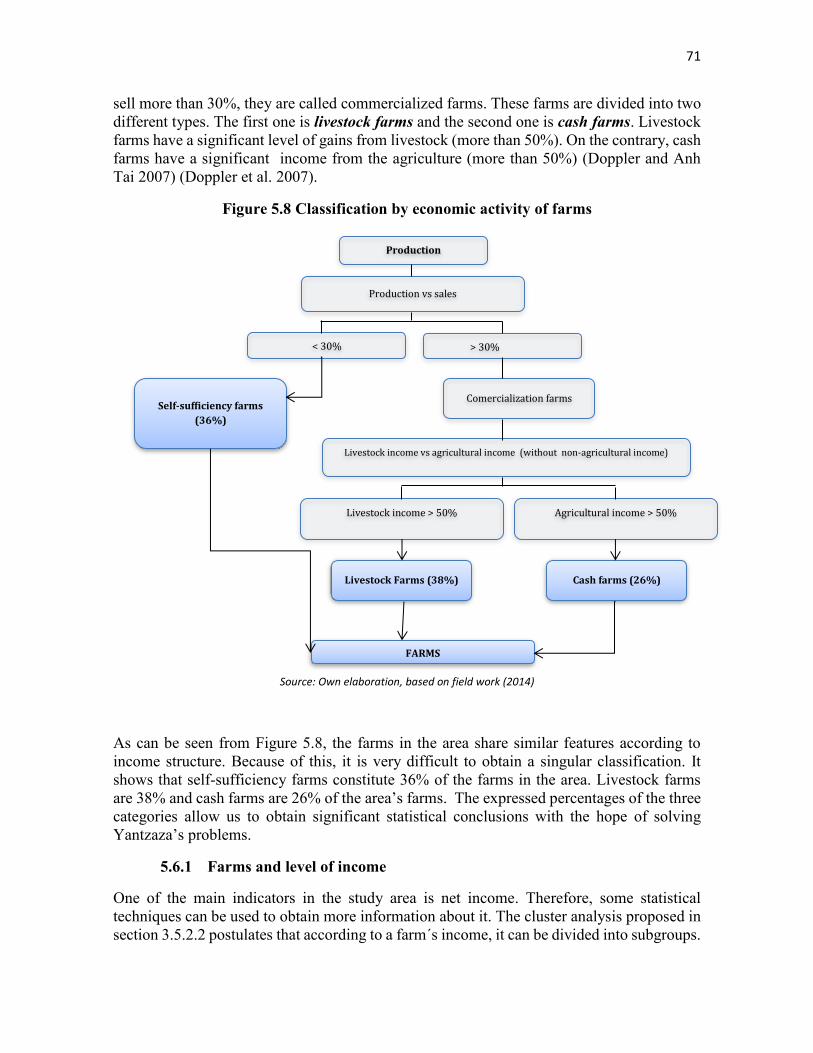
71
sell more than 30%, they are called commercialized farms. These farms are divided into two different types. The first one is livestock farms and the second one is cash farms. Livestock farms have a significant level of gains from livestock (more than 50%). On the contrary, cash farms have a significant income from the agriculture (more than 50%) (Doppler and Anh Tai 2007) (Doppler et al. 2007).
Figure 5.8 Classification by economic activity of farms
Source: Own elaboration, based on field work (2014)
As can be seen from Figure 5.8, the farms in the area share similar features according to income structure. Because of this, it is very difficult to obtain a singular classification. It shows that self-sufficiency farms constitute 36% of the farms in the area. Livestock farms are 38% and cash farms are 26% of the area’s farms. The expressed percentages of the three categories allow us to obtain significant statistical conclusions with the hope of solving Yantzaza’s problems.
5.6.1 Farms and level of income
One of the main indicators in the study area is net income. Therefore, some statistical techniques can be used to obtain more information about it. The cluster analysis proposed in section 3.5.2.2 postulates that according to a farm´s income, it can be divided into subgroups.
Production
Production vs sales
< 30%
Self-sufficiency farms
(36%)
> 30%
Comercialization farms
Livestock income vs agricultural income (without non-agricultural income)
Livestock income > 50% Agricultural income > 50%
Livestock Farms (38%) Cash farms (26%)
FARMS
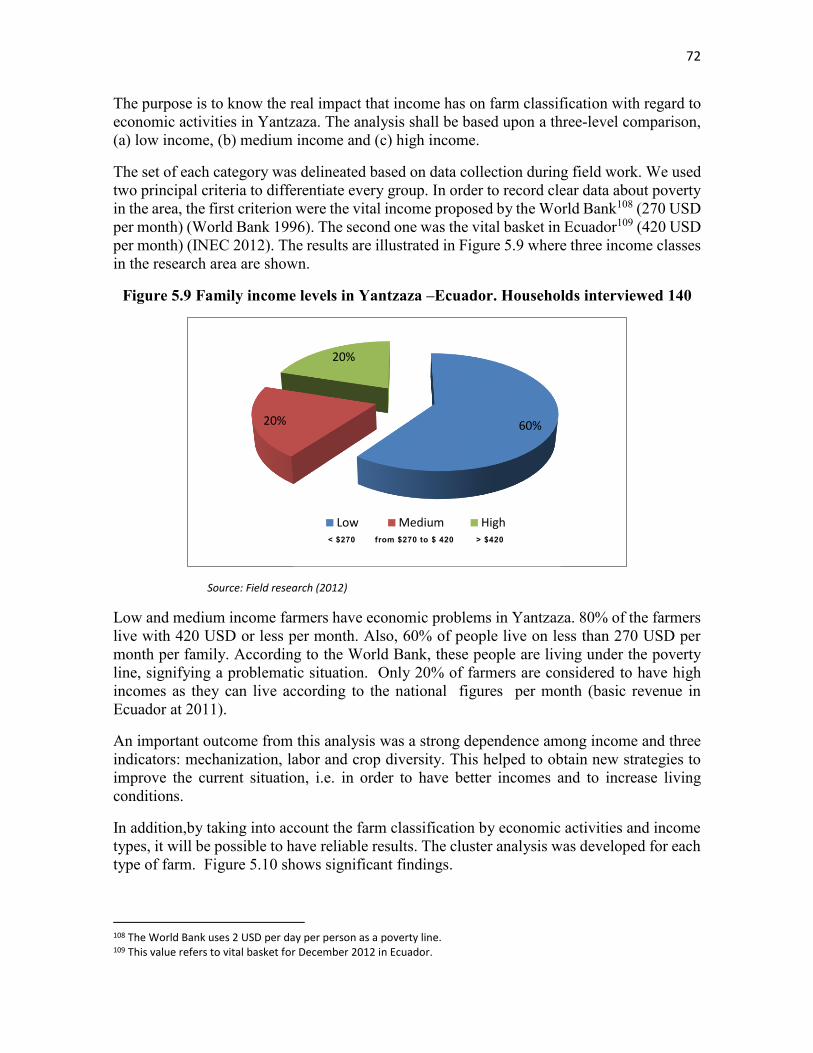
72
The purpose is to know the real impact that income has on farm classification with regard to economic activities in Yantzaza. The analysis shall be based upon a three-level comparison, (a) low income, (b) medium income and (c) high income.
The set of each category was delineated based on data collection during field work. We used two principal criteria to differentiate every group. In order to record clear data about poverty in the area, the first criterion were the vital income proposed by the World Bank108 (270 USD per month) (World Bank 1996). The second one was the vital basket in Ecuador109 (420 USD per month) (INEC 2012). The results are illustrated in Figure 5.9 where three income classes in the research area are shown.
Figure 5.9 Family income levels in Yantzaza –Ecuador. Households interviewed 140
Source: Field research (2012)
Low and medium income farmers have economic problems in Yantzaza. 80% of the farmers live with 420 USD or less per month. Also, 60% of people live on less than 270 USD per month per family. According to the World Bank, these people are living under the poverty line, signifying a problematic situation. Only 20% of farmers are considered to have high incomes as they can live according to the national figures per month (basic revenue in Ecuador at 2011).
An important outcome from this analysis was a strong dependence among income and three indicators: mechanization, labor and crop diversity. This helped to obtain new strategies to improve the current situation, i.e. in order to have better incomes and to increase living conditions.
In addition,by taking into account the farm classification by economic activities and income types, it will be possible to have reliable results. The cluster analysis was developed for each type of farm. Figure 5.10 shows significant findings.
108 The World Bank uses 2 USD per day per person as a poverty line. 109 This value refers to vital basket for December 2012 in Ecuador.
60%20%
20%
Low Medium High < $270 from $270 to $ 420 > $420
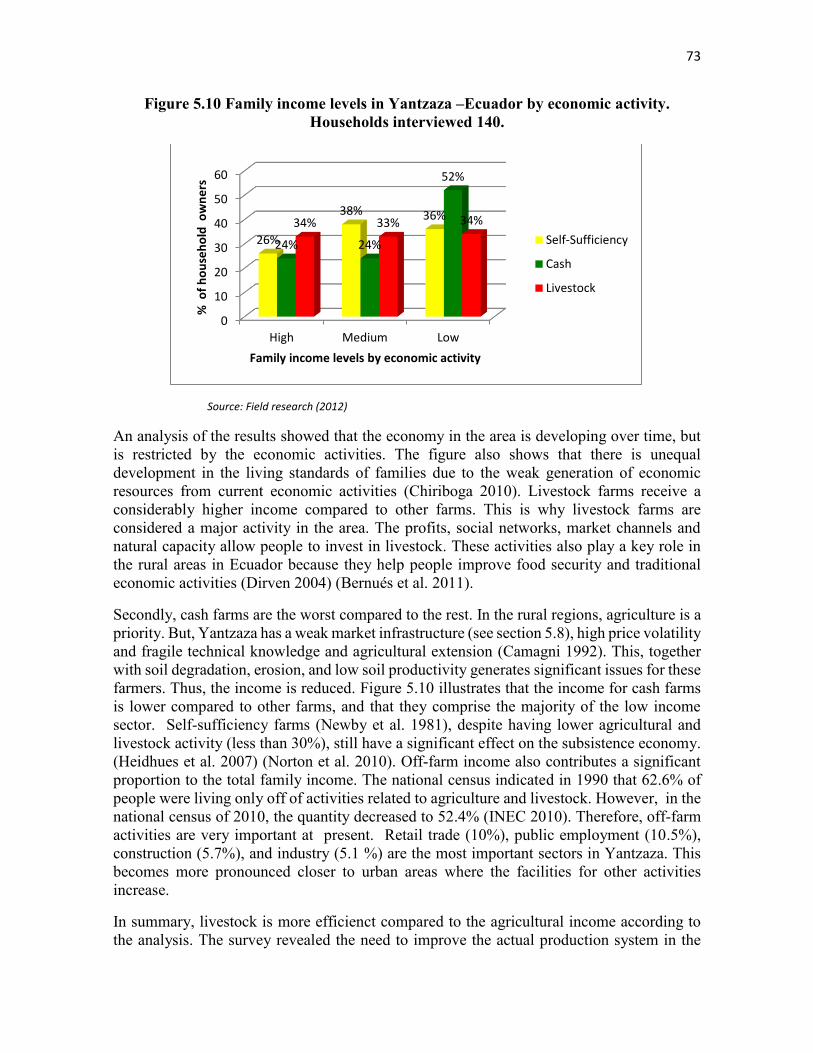
73
Figure 5.10 Family income levels in Yantzaza –Ecuador by economic activity. Households interviewed 140.
Source: Field research (2012)
An analysis of the results showed that the economy in the area is developing over time, but is restricted by the economic activities. The figure also shows that there is unequal development in the living standards of families due to the weak generation of economic resources from current economic activities (Chiriboga 2010). Livestock farms receive a considerably higher income compared to other farms. This is why livestock farms are considered a major activity in the area. The profits, social networks, market channels and natural capacity allow people to invest in livestock. These activities also play a key role in the rural areas in Ecuador because they help people improve food security and traditional economic activities (Dirven 2004) (Bernués et al. 2011).
Secondly, cash farms are the worst compared to the rest. In the rural regions, agriculture is a priority. But, Yantzaza has a weak market infrastructure (see section 5.8), high price volatility and fragile technical knowledge and agricultural extension (Camagni 1992). This, together with soil degradation, erosion, and low soil productivity generates significant issues for these farmers. Thus, the income is reduced. Figure 5.10 illustrates that the income for cash farms is lower compared to other farms, and that they comprise the majority of the low income sector. Self-sufficiency farms (Newby et al. 1981), despite having lower agricultural and livestock activity (less than 30%), still have a significant effect on the subsistence economy. (Heidhues et al. 2007) (Norton et al. 2010). Off-farm income also contributes a significant proportion to the total family income. The national census indicated in 1990 that 62.6% of people were living only off of activities related to agriculture and livestock. However, in the national census of 2010, the quantity decreased to 52.4% (INEC 2010). Therefore, off-farm activities are very important at present. Retail trade (10%), public employment (10.5%), construction (5.7%), and industry (5.1 %) are the most important sectors in Yantzaza. This becomes more pronounced closer to urban areas where the facilities for other activities increase.
In summary, livestock is more efficienct compared to the agricultural income according to the analysis. The survey revealed the need to improve the actual production system in the
0
10
20
30
40
50
60
High Medium Low
26%
38% 36%
24% 24%
52%
34% 33% 34%
% o
f h
ou
seh
old
ow
ne
rs
Family income levels by economic activity
Self-Sufficiency
Cash
Livestock
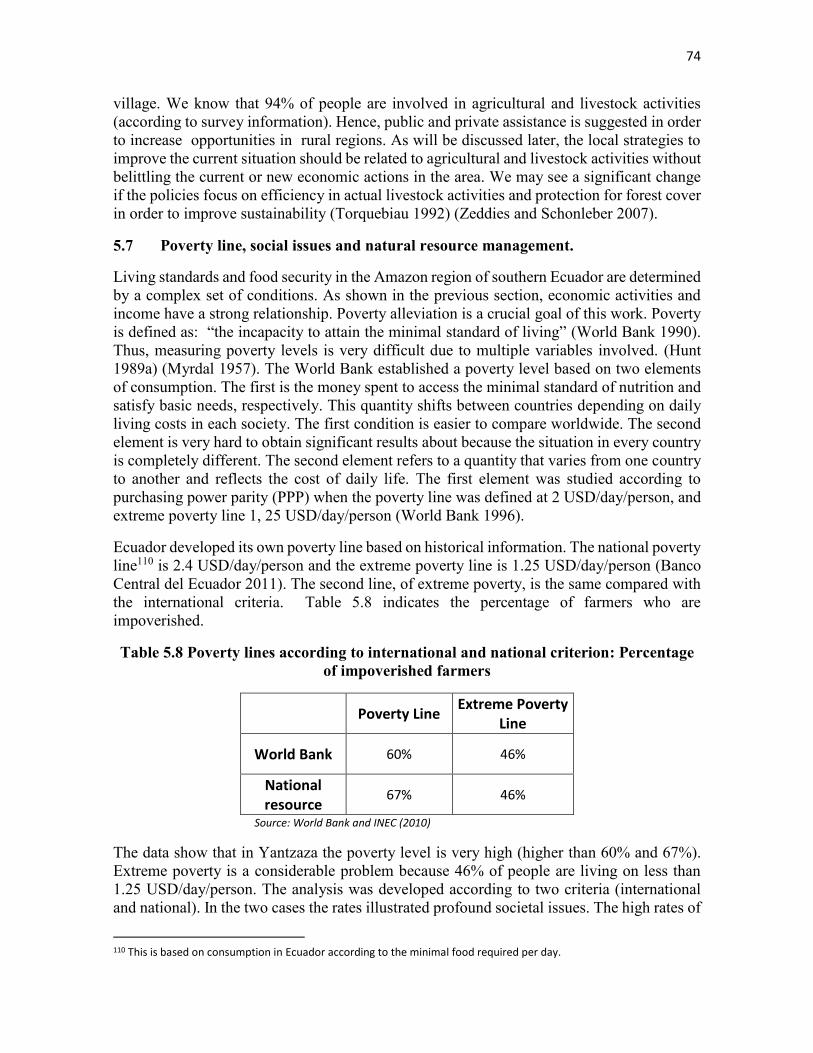
74
village. We know that 94% of people are involved in agricultural and livestock activities (according to survey information). Hence, public and private assistance is suggested in order to increase opportunities in rural regions. As will be discussed later, the local strategies to improve the current situation should be related to agricultural and livestock activities without belittling the current or new economic actions in the area. We may see a significant change if the policies focus on efficiency in actual livestock activities and protection for forest cover in order to improve sustainability (Torquebiau 1992) (Zeddies and Schonleber 2007).
5.7 Poverty line, social issues and natural resource management.
Living standards and food security in the Amazon region of southern Ecuador are determined by a complex set of conditions. As shown in the previous section, economic activities and income have a strong relationship. Poverty alleviation is a crucial goal of this work. Poverty is defined as: “the incapacity to attain the minimal standard of living” (World Bank 1990). Thus, measuring poverty levels is very difficult due to multiple variables involved. (Hunt 1989a) (Myrdal 1957). The World Bank established a poverty level based on two elements of consumption. The first is the money spent to access the minimal standard of nutrition and satisfy basic needs, respectively. This quantity shifts between countries depending on daily living costs in each society. The first condition is easier to compare worldwide. The second element is very hard to obtain significant results about because the situation in every country is completely different. The second element refers to a quantity that varies from one country to another and reflects the cost of daily life. The first element was studied according to purchasing power parity (PPP) when the poverty line was defined at 2 USD/day/person, and extreme poverty line 1, 25 USD/day/person (World Bank 1996).
Ecuador developed its own poverty line based on historical information. The national poverty line110 is 2.4 USD/day/person and the extreme poverty line is 1.25 USD/day/person (Banco Central del Ecuador 2011). The second line, of extreme poverty, is the same compared with the international criteria. Table 5.8 indicates the percentage of farmers who are impoverished.
Table 5.8 Poverty lines according to international and national criterion: Percentage of impoverished farmers
Poverty Line Extreme Poverty
Line
World Bank 60% 46%
National resource
67% 46%
Source: World Bank and INEC (2010)
The data show that in Yantzaza the poverty level is very high (higher than 60% and 67%). Extreme poverty is a considerable problem because 46% of people are living on less than 1.25 USD/day/person. The analysis was developed according to two criteria (international and national). In the two cases the rates illustrated profound societal issues. The high rates of
110 This is based on consumption in Ecuador according to the minimal food required per day.
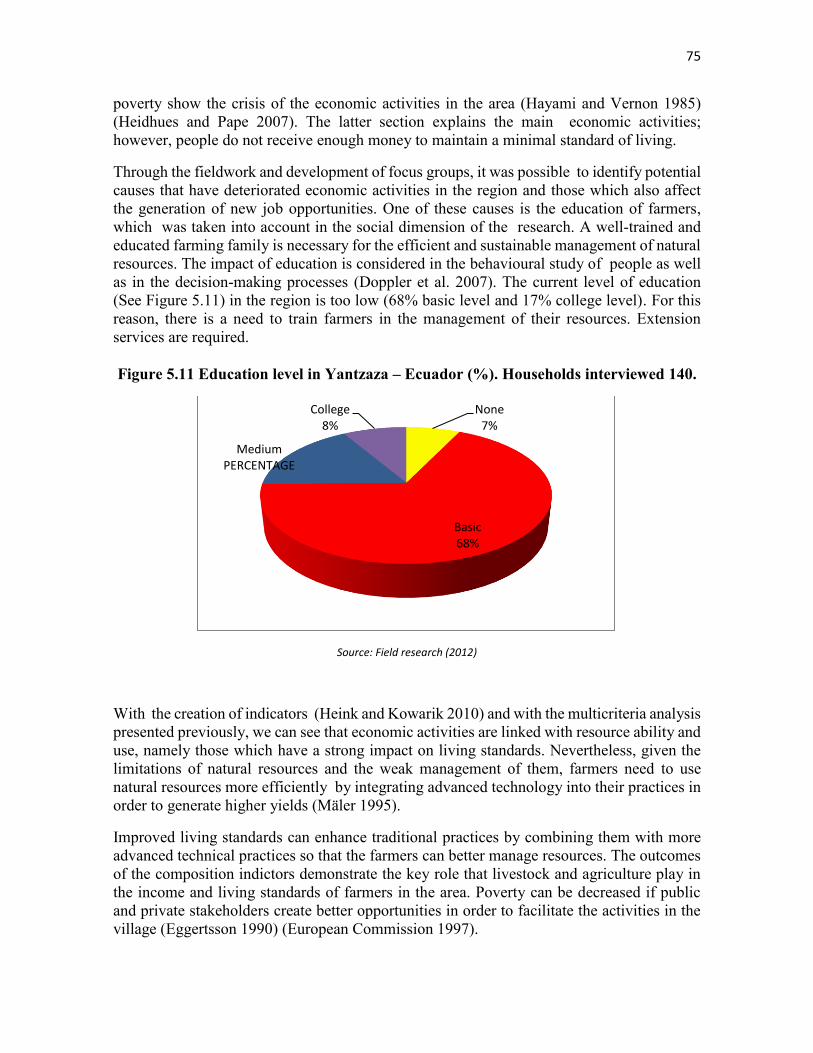
75
poverty show the crisis of the economic activities in the area (Hayami and Vernon 1985) (Heidhues and Pape 2007). The latter section explains the main economic activities; however, people do not receive enough money to maintain a minimal standard of living.
Through the fieldwork and development of focus groups, it was possible to identify potential causes that have deteriorated economic activities in the region and those which also affect the generation of new job opportunities. One of these causes is the education of farmers, which was taken into account in the social dimension of the research. A well-trained and educated farming family is necessary for the efficient and sustainable management of natural resources. The impact of education is considered in the behavioural study of people as well as in the decision-making processes (Doppler et al. 2007). The current level of education (See Figure 5.11) in the region is too low (68% basic level and 17% college level). For this reason, there is a need to train farmers in the management of their resources. Extension services are required. Figure 5.11 Education level in Yantzaza – Ecuador (%). Households interviewed 140.
Source: Field research (2012)
With the creation of indicators (Heink and Kowarik 2010) and with the multicriteria analysis presented previously, we can see that economic activities are linked with resource ability and use, namely those which have a strong impact on living standards. Nevertheless, given the limitations of natural resources and the weak management of them, farmers need to use natural resources more efficiently by integrating advanced technology into their practices in order to generate higher yields (Mäler 1995).
Improved living standards can enhance traditional practices by combining them with more advanced technical practices so that the farmers can better manage resources. The outcomes of the composition indictors demonstrate the key role that livestock and agriculture play in the income and living standards of farmers in the area. Poverty can be decreased if public and private stakeholders create better opportunities in order to facilitate the activities in the village (Eggertsson 1990) (European Commission 1997).
None7%
Basic68%
MediumPERCENTAGE
College8%

76
The social dimension describes some issues in the area, e.g. the age of farmers, land tenure, organization, health conditions and workforce stability. Older farmers are the common feature (see Figure 5.12) of the area with 65% of farmers being 45 years old or more. This creates a problem in regards to knowledge transfer to future generations and the continued use of sustainable practices. New generations are not interested in the field activities. They prefer to migrate to the urban zones (Papademetriou 2000). Land tenure allows people to maintain stability in the long-term. In Yantzaza 78% of farmers (Perez 2001) have their own home. However, 28% do not have their own farm. This is a problem because people do not have more formal jobs options. They are working in informal employment. 12 USD per day111 is the average salary in the area for these people. However, these jobs are seasonal as the agricultural activities depend on seasonal periods (Perrings et al. 1995). Also, another significant problem related with the social structure is the weak level of organization. This is caused by the local culture and weak institutional support (Pound et al. 2003) (Eggertsson 1990). Prices, risk, and markets could improve in the future when the farmers develop a stronger social network. Poverty alleviation in communal organizations has been a successful strategy in other countries (BMZ 1999) (Campilan 2005).
Figure 5.12 Farmers’ age in Yantzaza – Ecuador. Households interviewed 140.
Source: Field research (2012)
On the other hand, food security112 is, as expected, apparently guaranteed in the village. 94% of people have agricultural activities and 51.3% produce livestock. High crop diversification, and sufficient forest area are indicators that allow farmers to increase the probability of maintaining food security. However, knowing the farm income per member of the family provides an economic basis for assessing the levels of family consumption and household supply.
111 This value was obatined from the focus group with the farmers in the area. This is the informal salary but normally accepted by the people. 112 Food security exists when all people, at all times, have physical, social and economic access to sufficient, safe and nutritious food which meets their dietary needs and food preferences for an active and healthy life“ (FAO 2016b)
0
5
10
15
20
25
< 25 25 - 34 35 - 44 45 - 54 55 - 64 >65
2,6%
18,2%13,6%
24%
17,5%
24%
% o
f h
ou
seh
old
ow
nin
g
Age of household owning
77
Generally, the family income is lower than the minimal vital basket113. For this reason, the chance to buy appropriate food is lower, too. Food security means “having at all times physical social and economic access to sufficient, safe and nutritious food” (FAO 2016). In addition, social problems contribute to high levels of poverty (POTY 2002) (UGT 2012). Yantzaza’s children suffer from poor nutrition (INEC 2012).
Farmers need to change their production habits in order to obtain adequate and nutritious food. There is a clear relationship between temporary food deficits and how far the people live from towns (Doppler et al. 2007). For this reason in rural regions, like in Yantzaza, people in remote areas consume more high energy crops and suffer long term protein deficits. Thus, livestock or protein crops can help people stay healthy and energized in order to work.
In summary, agro-ecological analysis showed significative concerns in Yantzaza village (Bahr et al. 2014) (Conant et al. 2001). Families are larger in the area. 50 % of families have 5 members or more in the rural sector. The farms typically have few capital assets, weak infrastructure capacity, weak market sales, a low level of education and problems with public services. As a consequence, in Yantzaza114, knowledge becomes based on traditional experiences rather than knowledge transfer from technical agencies. Moreover, the same people who generated the social and environmental problems did so in an uncontrolled and unmeasured manner. Livestock and agricultural activities have specific requirements. For livestock, feed is crucial. It is influenced not only by the amount of grazing but also by crop production. In the area, the soil quality is low based on the farmers’ responses (69.4%) who say that the soil productivity is decreasing. To replenish soil, farmers use manure. 11% of families use manure, 36.4% use crop residues and 5.8% are buying other kinds of manure.
These practices are helping soil fertility but 46.8% of farmers’ usage is unknown. Forest land also degraded over time due to the expansion of agricultural activities and livestock needs (principally grazing). Agro-ecological sustainability is endangered by the overuse of fertilizers and pesticides. The use of mineral fertilizers in Yantzaza has increased over time. Although only 40% in the village use these fertilizers, use tends to increase. One suggestion is to use fertilizer but with technical support. Herbicide and fungicide applications are more relevant. 41% of farmers are using these products. The application is not technically supervised. Poverty has a strong relation with economic activities, social issues and natural resource management. This research tried to obtain solutions in order to improve living conditions while balancing these three dimensions. Yantzaza can be an interesting focus for public policy in the future.
5.8 Market facilities and agricultural commercialization The World Bank (2001) based on the report about World Development from 2000 to 2001, raises three fundamental pillars to combat poverty (Johnson 2000) with a higher influence in rural areas: i) opportunities, to obtain more efficient markets and increase the assets of the poor; ii) empowerment, to ensure that state institutions will be more attentive to the needs of
113 Economic indicator is lower than the appropriate value. 114 Yantzaza is comprised of three rural towns, however, we are using an average in order to analyze the general impact on the area.
78
the poor, and iii) security, to help the poor tackle risks and reduce vulnerability. In parallel, a good operation and market access influence the achievement of the objectives of rural development, reduction of poverty, agro-industries promotion, and marketing channels etc. Some investigations, for example in the United States and Australia have shown that market characteristics influence the farmers’ choice of location for their sales (Fafchamps and Hill 2005). Thus, Shilpia and Umali-Deininger (2008) indicate that the presence of transaction costs - transportation costs, market infrastructure, media, etc. - affect production and the farmers' decisions about the place of sale (Bardhan 1989) (Key et al. 2000). The cited empirical literature has allowed the use of transportation costs as a basic component of transaction costs in our work in this section. Common domestic markets are characterized by farm gate commercialization and intermediaries. This is caused by the difficulty small farmers have in getting their produce to the market. High transportation costs and low quantities of production generate higher returns in these types of practices (Badiane and Shively 1998). Therefore, the smaller the distances are, the greater the profitability that can be achieved is. In addition, farmers need incentives to go to the markets and can be defined based on ease of access. Improvements in market conditions will have positive effects on producers. On the one hand, they can impact farmers acting as a production incentive enabling them to adjust their cropping patterns in search of sales and profitability (Bellemare and Barrett 2006). Similarly, guaranteeing greater market access and better infrastructure, small producers will be motivated to take their products ensuring them a secured area for sales, better conditions and improvements in the surroundings. Such guarantees not only stimulate improvement in income but allow efficiency and less environmental damage. This section has been built on investigations performed by Fafchamps and Hill (2005) and Shilpia and Umali-Deininger (2008) in Uganda and Tamil Nadu, respectively. These theoretical models formalize how much market facilities, like the distance from farms to markets, are key determinants that influence changes in transaction costs. This relationship is determined by an index of market access, which is based on a gravity equation (see section 3.5.2.4). This index is defined according to the number of market access facilities normalized by the square of the distance from the farm to the nearest market115. Taking this index into account, we observe that with a larger number of facilities, there will be better product sales in the market. Furthermore, the distance has an inverse relationship with respect to the product sales in the market. This model has been developed taking into account the information obtained from fieldwork in Yantzaza during 2012 (see Appendix 2, see section 6). This study collected information about the type and number of facilities that a common market in a rural sector can have and furthermore determined the distance in time to the nearest market. Box 5.1 summarizes the proposed methodology by Fatchamps & Hill (2005) that has been used to amplify the quantitative evaluation in this work.
115 It is recommended to review the impact of elevated distance squared as based on Newton's law. It is important to consider that the distance has been measured considering the travel time.
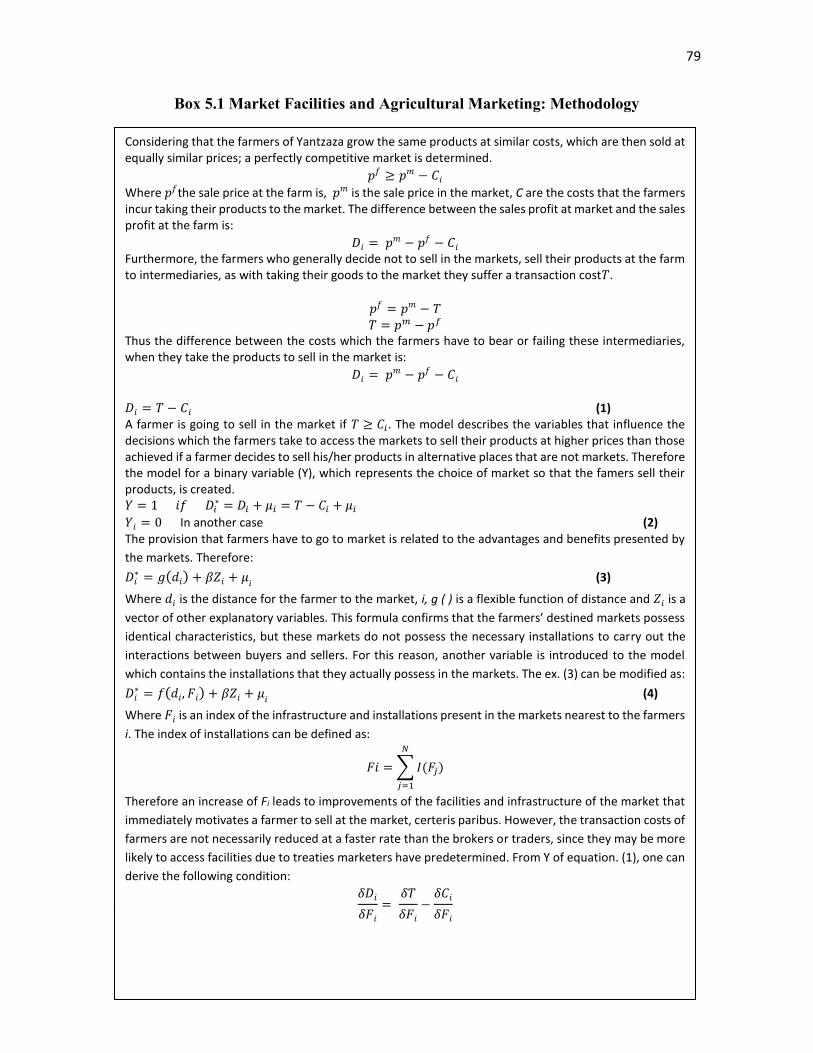
79
Box 5.1 Market Facilities and Agricultural Marketing: Methodology
5.8.1 Agricultural marketing and market access
Considering that the farmers of Yantzaza grow the same products at similar costs, which are then sold at equally similar prices; a perfectly competitive market is determined.
𝑝𝑓 ≥ 𝑝𝑚 − 𝐶𝑖
Where 𝑝𝑓the sale price at the farm is, 𝑝𝑚 is the sale price in the market, C are the costs that the farmers incur taking their products to the market. The difference between the sales profit at market and the sales profit at the farm is:
𝐷𝑖 = 𝑝𝑚 − 𝑝𝑓 − 𝐶𝑖 Furthermore, the farmers who generally decide not to sell in the markets, sell their products at the farm to intermediaries, as with taking their goods to the market they suffer a transaction cost𝑇.
𝑝𝑓 = 𝑝𝑚 − 𝑇 𝑇 = 𝑝𝑚 − 𝑝𝑓
Thus the difference between the costs which the farmers have to bear or failing these intermediaries, when they take the products to sell in the market is:
𝐷𝑖 = 𝑝𝑚 − 𝑝𝑓 − 𝐶𝑖
𝐷𝑖 = 𝑇 − 𝐶𝑖 (1) A farmer is going to sell in the market if 𝑇 ≥ 𝐶𝑖. The model describes the variables that influence the decisions which the farmers take to access the markets to sell their products at higher prices than those achieved if a farmer decides to sell his/her products in alternative places that are not markets. Therefore the model for a binary variable (Y), which represents the choice of market so that the famers sell their products, is created. 𝑌 = 1 𝑖𝑓 𝐷𝑖
∗ = 𝐷𝑖 + 𝜇𝑖 = 𝑇 − 𝐶𝑖 + 𝜇𝑖
𝑌𝑖 = 0 In another case (2) The provision that farmers have to go to market is related to the advantages and benefits presented by
the markets. Therefore:
𝐷𝑖∗ = 𝑔(𝑑𝑖) + 𝛽𝑍𝑖 + 𝜇
𝑖 (3)
Where 𝑑𝑖 is the distance for the farmer to the market, i, g ( ) is a flexible function of distance and 𝑍𝑖 is a
vector of other explanatory variables. This formula confirms that the farmers’ destined markets possess
identical characteristics, but these markets do not possess the necessary installations to carry out the
interactions between buyers and sellers. For this reason, another variable is introduced to the model
which contains the installations that they actually possess in the markets. The ex. (3) can be modified as:
𝐷𝑖∗ = 𝑓(𝑑𝑖, 𝐹𝑖) + 𝛽𝑍𝑖 + 𝜇
𝑖 (4)
Where 𝐹𝑖 is an index of the infrastructure and installations present in the markets nearest to the farmers
i. The index of installations can be defined as:
𝐹𝑖 = ∑ 𝐼(𝐹𝑗)
𝑁
𝑗=1
Therefore an increase of Fi leads to improvements of the facilities and infrastructure of the market that
immediately motivates a farmer to sell at the market, certeris paribus. However, the transaction costs of
farmers are not necessarily reduced at a faster rate than the brokers or traders, since they may be more
likely to access facilities due to treaties marketers have predetermined. From Y of equation. (1), one can
derive the following condition:
𝛿𝐷𝑖
𝛿𝐹𝑖
= 𝛿𝑇
𝛿𝐹𝑖
−𝛿𝐶𝑖
𝛿𝐹𝑖
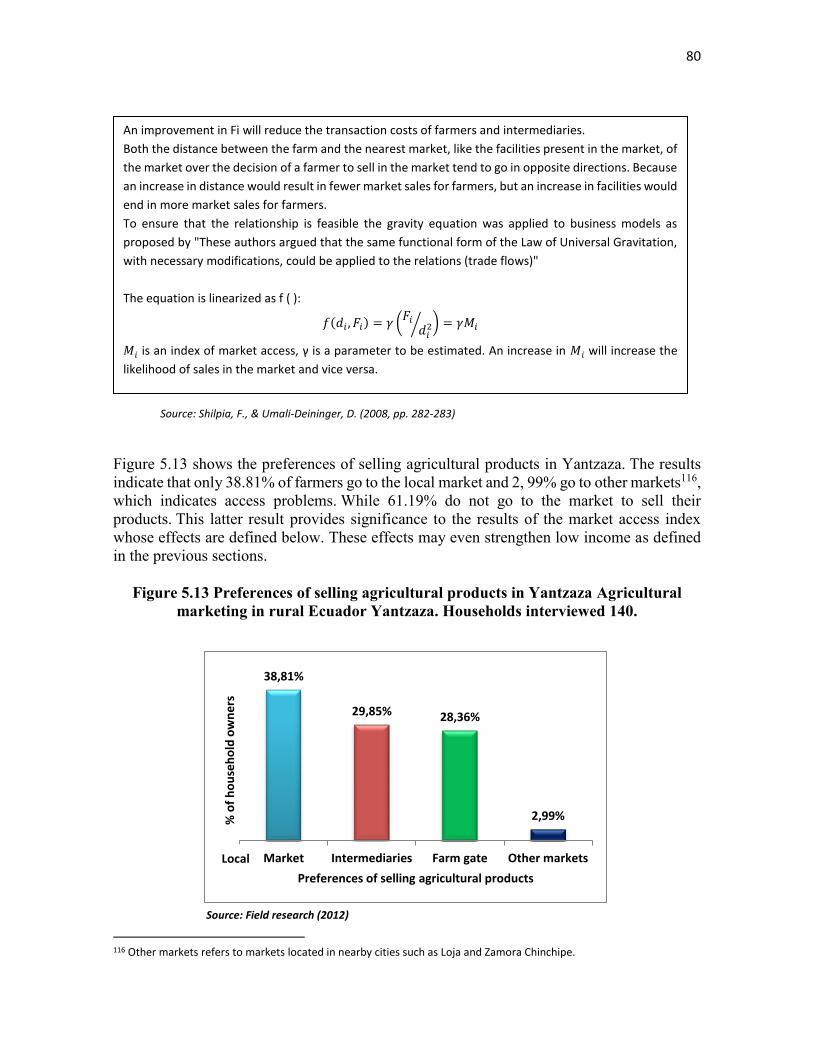
80
Source: Shilpia, F., & Umali-Deininger, D. (2008, pp. 282-283)
Figure 5.13 shows the preferences of selling agricultural products in Yantzaza. The results indicate that only 38.81% of farmers go to the local market and 2, 99% go to other markets116, which indicates access problems. While 61.19% do not go to the market to sell their products. This latter result provides significance to the results of the market access index whose effects are defined below. These effects may even strengthen low income as defined in the previous sections.
Figure 5.13 Preferences of selling agricultural products in Yantzaza Agricultural marketing in rural Ecuador Yantzaza. Households interviewed 140.
Source: Field research (2012)
116 Other markets refers to markets located in nearby cities such as Loja and Zamora Chinchipe.
38,81%
29,85% 28,36%
2,99%
Market Intermediaries Farm gate Other markets
% o
f h
ou
seh
old
ow
ne
rs
Preferences of selling agricultural products
An improvement in Fi will reduce the transaction costs of farmers and intermediaries.
Both the distance between the farm and the nearest market, like the facilities present in the market, of
the market over the decision of a farmer to sell in the market tend to go in opposite directions. Because
an increase in distance would result in fewer market sales for farmers, but an increase in facilities would
end in more market sales for farmers.
To ensure that the relationship is feasible the gravity equation was applied to business models as
proposed by "These authors argued that the same functional form of the Law of Universal Gravitation,
with necessary modifications, could be applied to the relations (trade flows)"
The equation is linearized as f ( ):
𝑓(𝑑𝑖 , 𝐹𝑖) = 𝛾 (𝐹𝑖
𝑑𝑖2⁄ ) = 𝛾𝑀𝑖
𝑀𝑖 is an index of market access, γ is a parameter to be estimated. An increase in 𝑀𝑖 will increase the
likelihood of sales in the market and vice versa.
Local
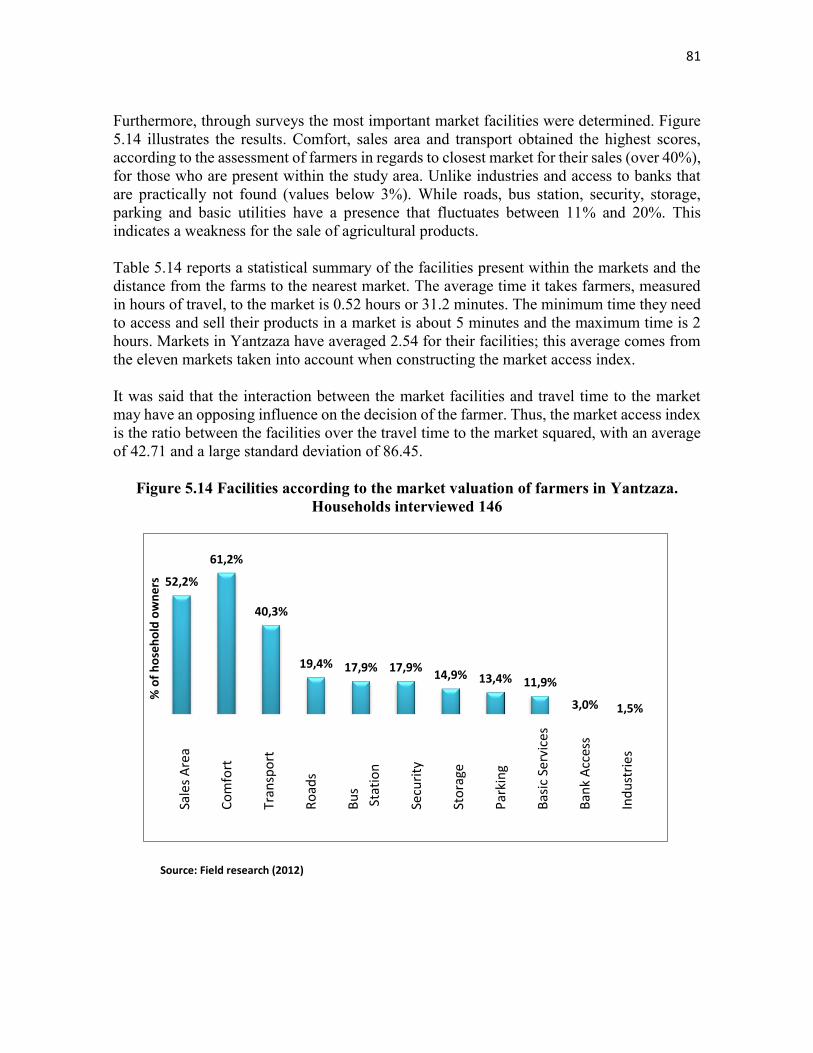
81
Furthermore, through surveys the most important market facilities were determined. Figure 5.14 illustrates the results. Comfort, sales area and transport obtained the highest scores, according to the assessment of farmers in regards to closest market for their sales (over 40%), for those who are present within the study area. Unlike industries and access to banks that are practically not found (values below 3%). While roads, bus station, security, storage, parking and basic utilities have a presence that fluctuates between 11% and 20%. This indicates a weakness for the sale of agricultural products. Table 5.14 reports a statistical summary of the facilities present within the markets and the distance from the farms to the nearest market. The average time it takes farmers, measured in hours of travel, to the market is 0.52 hours or 31.2 minutes. The minimum time they need to access and sell their products in a market is about 5 minutes and the maximum time is 2 hours. Markets in Yantzaza have averaged 2.54 for their facilities; this average comes from the eleven markets taken into account when constructing the market access index. It was said that the interaction between the market facilities and travel time to the market may have an opposing influence on the decision of the farmer. Thus, the market access index is the ratio between the facilities over the travel time to the market squared, with an average of 42.71 and a large standard deviation of 86.45.
Figure 5.14 Facilities according to the market valuation of farmers in Yantzaza.
Households interviewed 146
Source: Field research (2012)
52,2%
61,2%
40,3%
19,4% 17,9% 17,9%14,9% 13,4% 11,9%
3,0% 1,5%
% o
f h
ose
ho
ld o
wn
ers
Título del eje
Sale
s A
rea
Co
mfo
rt
Tran
spo
rt
Ro
ads
Bu
s
Sta
tio
n
Secu
rity
Sto
rage
Par
kin
g
Bas
ic S
ervi
ces
Ban
k A
cces
s
Ind
ust
ries

82
Table 5.9 Market facilities and distance. Unit Average Median
Standard
Deviation Minimum Maximum
Travel time to
market (in hours) Hour 0.52 0.50 0.37 0.08 2.00
Market place
Facilities Number 2.54 3.00 1.19 1.00 7.00
Market access
index Index 42.71 15.75 86.45 0.25 432.00
Source: Field research (2012)
5.8.1 Empirical Results
The empirical analysis is conducted via a marketing model of qualitative responses of normal probability distribution. A probit model was chosen to make the estimations. The explained variable from the econometric model is valued at 1 if the farmer sells at market, and zero otherwise. Furthermore, a number of specific variables, based on the design of indicators117 that were studied in the previous sections, were included. Some tests were carried out trying to obtain a robust model. Variables related to social aspects were more successful mainly because of their influence on family decision-making. Table 5.10 shows estimates, marginal effects and summarizes the results. As for the model, the estimations are already corrected for heteroskedasticity: M1 complies with the normality and autocorrelation tests (see Appendix 15). These econometric requirements are reinforced by the analysis of pseudo R2. By the consistency presented in the model the interpretation of their marginal effects will proceed.
Table 5.10: Market access and sale at the market
M1
Market access index 0.00148 (1.69)*
Household quality 0.23366 (2.26)**
Family perception -0.26172 (-2.97)***
Age of household head 0.15859 (3.56)***
Education of household head -0.21634 (-2.85)***
Crop diversification -0.08973 (-1.72)*
Cultivated ha 0.05102 (2.38)**
Pseudo R2 0.2338
Log likelihood -34.285
Robust statistical z in parentheses * 10% significance, ** 5% significance, *** 1% significance The coefficients are marginal effects after the probit estimation
2 They were basically considered the economic and social dimensions in the nature of work and the relationship within the process of agricultural commercialization. However, some test variables agro-environmental performance, but good results were not achieved.

83
Consistent with the evidence, M1 reveals the results of regression related to the market access index as an indicator of transaction costs. The estimated coefficient value of the market access index has a positive sign and is statistically significant at the level of 10%. Facing an average increase in the market’s access index, certeris paribus, the probability that a farmer sells in the market increases. Obviously improving market facilities or decreasing the distance from farm to market implies that the transaction costs of both farmers and intermediaries decrease. Among other explanatory variables, the quality of the home also proved to be statistically significant at a level of 5%. An average increase of household quality increases the probability of market sales. This result is directly related to the living conditions of farmers. Better conditions reflect higher incomes for farmers, thus their quality of life is also increased and people not only meet their basic needs but can achieve a higher standard of living. The variable of family perception is also statistically significant at a level of 1%. However, the relationship is indirect. This shows that the more they conform as a family, the less willing they are to go to the market and sell their products. This may be due to the environment providing them with the necessary conditions to meet their needs or it could be because of the non-agricultural income is sufficient. The head of the household's age is statistically significant at a level of 1%. The farmers' age has a positive influence on the probability of selling at the market. The older farmers prefer to stay in the rural sector to cultivate their land, while the younger prefer to migrate to urban areas in search of better opportunities. The level of education is statistically significant in this model with a level of 1%. While a person improves their level of education, they are more willing to look for better jobs and also migrate to the city. For this reason, this indicator negatively intervenes on the probability of sales in the market. Given an average increase of the education variable, the probability of sales decreases. This is a serious problem in rural areas where agriculture is in the background when a high level of education is obtained. Crop diversification is also statistically significant at a level 10%. Given an average increase of crop diversity, the probability of selling in the market decreases. If crops are more diverse, the farmers of Yantzaza tend to use them for human consumption and even as food for animals. It is also more profitable to take a large quantity of one particular product to market, as opposed to small amounts of several products because of the cost benefit. Finally, cultivated hectares are statistically significant at a level of 5%. If farmers expand the number of cultivated hectares, they increase their production and therefore the cost-benefit relation to sell at market is both profitable and convenient for farmers. An average increase of just one cultivated hectare increases the probability of selling in the market.

84
6. - Development strategies at the family level in Yantzaza - Ecuador
The previous chapter involved a diagnostic and statistical analysis of farming systems in the south-east Ecuadorian Amazon region. Development strategies from economic, social and ecological dimensions were suggested. The current section highlights the role of these new strategies for Yantzaza. Minimum income, living standards and natural resources management in the family farming system are all issues in Yantzaza today. Significant issues and future needs in the area are known. The current section will explain a set of strategies that researchers defined as a solution in the short-term and intermediate-term. Each one will try to solve the problems in the research area. These strategies are very useful tools in the decision-making process for the different stakeholders involved. These actors can be working together or alone. The goal is to establish clear strategies to improve local development while involving key stakeholders.
Sustainable rural development transcends the aspiration of agricultural production development towards multidimensionality of social interest goals (see Figure 6.1) because the rural area is also a socially constructed space, where economic goals coexist with ecological goals that shape the vision of a desirable rural economy (Pretzsch 2005) (Zeller et al. 1997b) (Zeller et al. 1997a).
Figure 6.1 Setting goals for sustainable rural development
Source: Adapted from (Müller 1997) (Santacoloma 2000)
Family farming is the predominant structural system in the research area. The hypothesis behind the strategies aims to implement alternative developmental methods thus helping improve the people’s conditions in the rural sector. The impacts of these strategies on the living standards, productivity and natural resources administration are the goal for the intermediate – term. All types of farms in Yantzaza whether small or large scale are involved in this design, as they are considered through a social lens. The information base was obtained
Economic goals Efficiency–Productivity
Rationality
Ecological goals Biodiversity Resilience
Social goals Satisfaction of needs Cultural diversity Alleviation of poverty Social inclusion Social assets accumulation
Resource management rules spatial planning
Conservation of resource stock Income distribution

85
from the field work through questionnaires completed through interviews with the farmers, focus groups and interviewing local actors (2013).
Strategies for the development of farming systems.
Natural resources are involved in the decision-making process in the world everyday (Tolba 2001). This kind of decision directly affects the living conditions and the ecological and economic balances of this community. Van Noordwijk et al. (2001b) (Neef 2005a) (see figure 2.1) show what happens when the farmers have the decision to use, extract and exploit the landscape and / or develop alternatives for taking care for the natural assets (like strategies of land use management, forms of management, applied science, field learning and local common plans), while impacting profits, social structure and environment. Farmers’ decisions depend on available knowledge, market supply and demand, push factors of migration and pool and the institutional actions which affect local interaction in the rural sector (Neef 2005b).
Farmers have the power to maintain natural landscapes. Natural resource use and living conditions play a significant role in the traditional rural sector life. Farmers’ decisions are key in this process (Yongping et al. 2009). Institutional support helps farmers preserve natural resources. The efficiency of these methods depends on the strategies applied in the area and the knowledge shared with the communities (Toledo 1993). Creating a land use system and alleviating poverty are the goal and focus of the stakeholders in the sustainable model. Feedback and knowledge transfer are the tools for the local community. These kinds of pathways need stakeholder's interactions.
The second framework is the "Sustainable livelihoods framework" (SLF). It was developed by the Department for International Development (DFID) (Carney 1998), which analyzes rural livelihoods and sustainability. The model explains the complexity of the rural sector and provides insights into the role of various household assets, with the focus on agriculture and livestock (for our research) (Stroebel et al. 2011). In order to achieve a methodological framework to describe the development strategies, the research group used two sources as a reference model for the strategies.
Figure 6.2 shows the results from the current study. The Sustainable Livelihoods Framework has evolved from changing perspectives on poverty, to participation and sustainable development (Arun et al. 2004) (CAF 2013). SLF constitutes a model in terms of assets, vulnerabilities, processes, and institutions. SLF’s results are directly related to the poverty of the rural homes. Five types of assets were described (natural, human, financial, physical and social capital) to maintain life in the sector. If rural livelihoods can become more sustainable then they can "cope with and recover from shocks and stressed and maintain or enhance both its capabilities and assets now in the future, while not undermining the natural resource base" (Krantz 2001, p.18) (Carney 1998).
This research has tried to generate the best solutions based on assets which are present in rural households. Farmers validated information in focus groups. However, some assets were not the main object of our study. For this reason, they shall be defined as 'observed potential solutions' so that future works can improve them.Taking into account the two proposed models’ (farmers' decisions and SFL) solutions to the problems discussed in the previous

86
section, these problems continue to be raised. Figure 6.2 shows that these solutions will be analysed for each of the dimensions studied.
In this context, the alleviation of poverty in the rural sector is always defined by states of vulnerability, which in Yantzaza, are mainly economic and natural in character. These vulnerabilities should be decreased so that their effect is minimized. Sustainability as an integral concept and based on the statement by the FAO establishes the need for institutional support (through governance processes) at different levels (FAO 2010a), so that the results achieve maximum success. The interaction of stakeholders coupled with public and private policies support a sustainable model. The strategies detailed below represent a set of activities and choices that the involved people and stakeholders should make to achieve the goals of rural households.
Figure 6.2118 Sustainable Livelihood Framework (SLF). Yantzaza - Ecuador
118“Human capital represents the skills, knowledge labour ability, and good health that together enable people to pursue different livelihood strategies and achieve their livelihood objectives. Social capital is the genre of social resources upon which people draw in pursuit of their livelihood objectives, networks and relationships based on trust, reciprocity and exchanges. Natural capital is the term used for the natural resource stocks from which resources flow and where services that are useful for livelihoods are derived. Physical capital comprises the basic infrastructure and goods produced that are needed to support livelihoods. Financial capital denotes the financial resources that people use to achieve their livelihood such as available stocks, which can be held in several forms such as cash, bank deposits, liquid assets such as livestock and jewelry, or resources obtained through credit-providing institutions and regular inflows of money, including earned income, pensions, other transfers from the state, and remittances” (Arun et al. 2004).
Financial
Physical
Process and structure
Livelihood Outcomes
Alternative strategies Governa
nce and stakeholders
Institutions, policies and culture.
- More income and employment
- Better living conditions
- Food security
Technology and knowledge, public
policies
Feedback from community and politicians
Human
Organizations and social networks
Living conditions improvement and human
capital programs
Marketing and business management
Incomes diversification, participatory methods and environmental service payments.
Vulnerability Context
Land-use management, conservation
practices, soils management
Natural
Social Shocks, market prices, seasonality, weather conditions, plagues, management
Sustainable Livelihood Framework
POVERTY
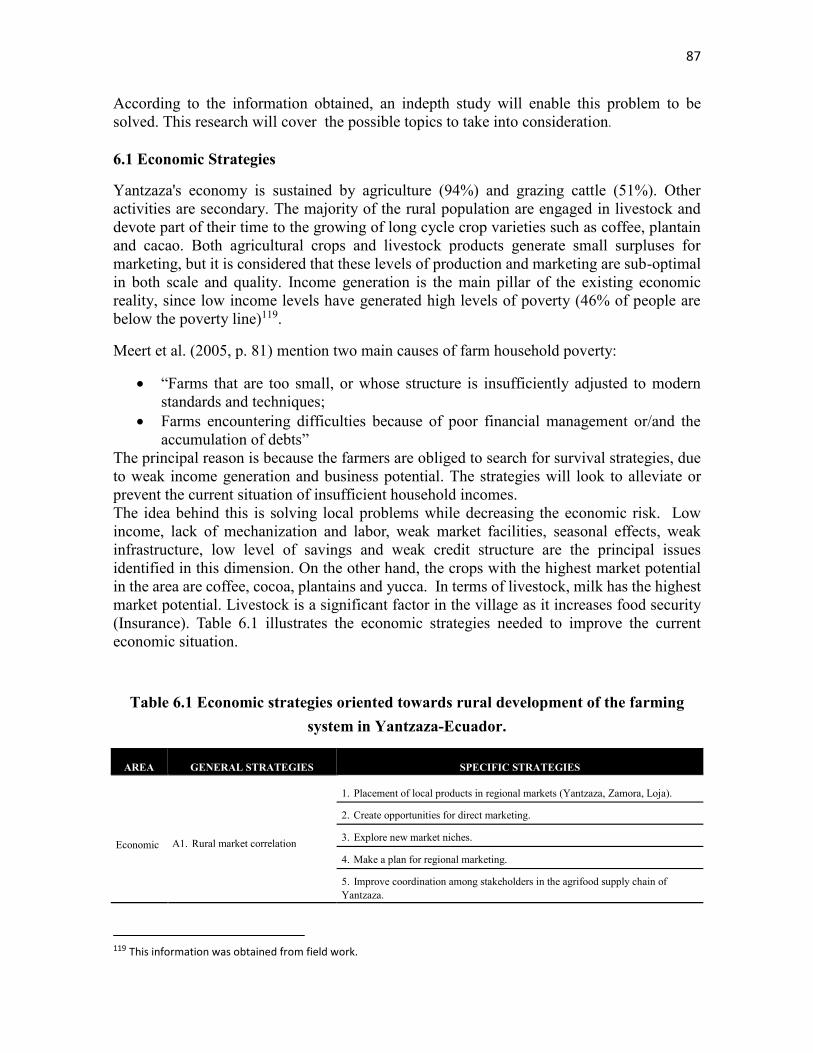
87
According to the information obtained, an indepth study will enable this problem to be solved. This research will cover the possible topics to take into consideration.
6.1 Economic Strategies
Yantzaza's economy is sustained by agriculture (94%) and grazing cattle (51%). Other activities are secondary. The majority of the rural population are engaged in livestock and devote part of their time to the growing of long cycle crop varieties such as coffee, plantain and cacao. Both agricultural crops and livestock products generate small surpluses for marketing, but it is considered that these levels of production and marketing are sub-optimal in both scale and quality. Income generation is the main pillar of the existing economic reality, since low income levels have generated high levels of poverty (46% of people are below the poverty line)119.
Meert et al. (2005, p. 81) mention two main causes of farm household poverty:
“Farms that are too small, or whose structure is insufficiently adjusted to modern standards and techniques;
Farms encountering difficulties because of poor financial management or/and the accumulation of debts”
The principal reason is because the farmers are obliged to search for survival strategies, due to weak income generation and business potential. The strategies will look to alleviate or prevent the current situation of insufficient household incomes. The idea behind this is solving local problems while decreasing the economic risk. Low income, lack of mechanization and labor, weak market facilities, seasonal effects, weak infrastructure, low level of savings and weak credit structure are the principal issues identified in this dimension. On the other hand, the crops with the highest market potential in the area are coffee, cocoa, plantains and yucca. In terms of livestock, milk has the highest market potential. Livestock is a significant factor in the village as it increases food security (Insurance). Table 6.1 illustrates the economic strategies needed to improve the current economic situation.
Table 6.1 Economic strategies oriented towards rural development of the farming system in Yantzaza-Ecuador.
AREA GENERAL STRATEGIES SPECIFIC STRATEGIES
Economic A1. Rural market correlation
1. Placement of local products in regional markets (Yantzaza, Zamora, Loja). 2. Create opportunities for direct marketing. 3. Explore new market niches. 4. Make a plan for regional marketing. 5. Improve coordination among stakeholders in the agrifood supply chain of Yantzaza.
119 This information was obtained from field work.
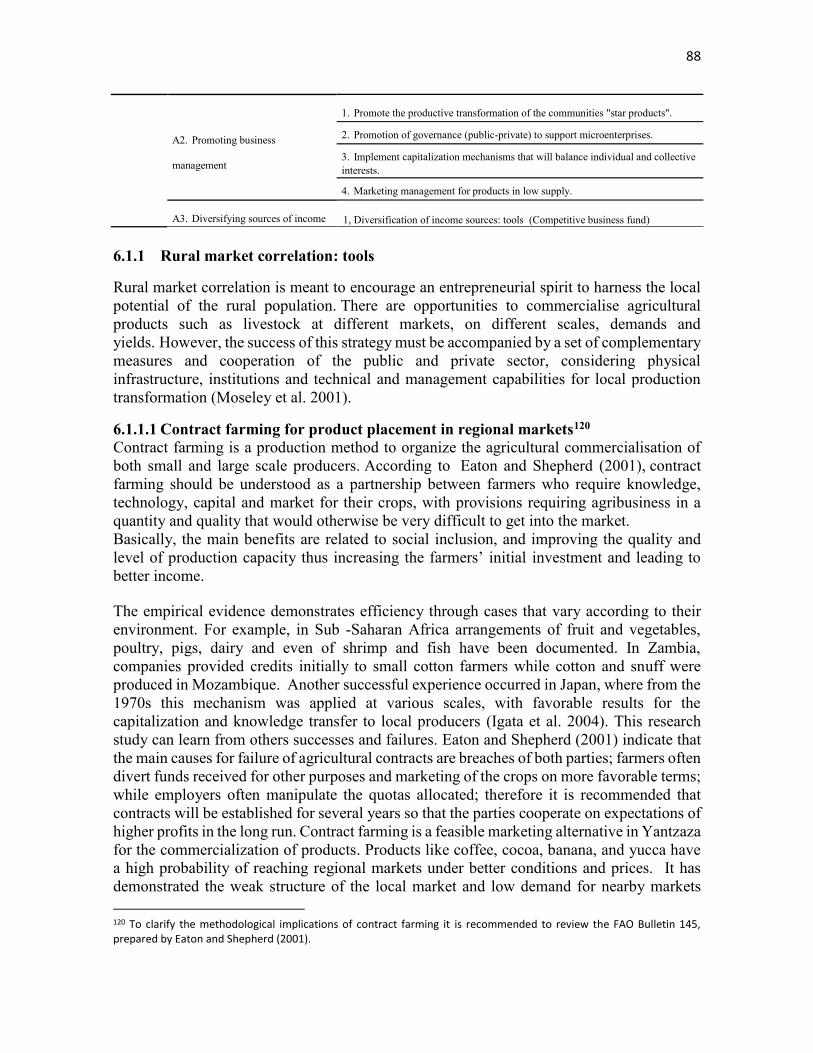
88
A2. Promoting business
management
1. Promote the productive transformation of the communities "star products". 2. Promotion of governance (public-private) to support microenterprises. 3. Implement capitalization mechanisms that will balance individual and collective interests. 4. Marketing management for products in low supply.
A3. Diversifying sources of income 1, Diversification of income sources: tools (Competitive business fund)
6.1.1 Rural market correlation: tools
Rural market correlation is meant to encourage an entrepreneurial spirit to harness the local potential of the rural population. There are opportunities to commercialise agricultural products such as livestock at different markets, on different scales, demands and yields. However, the success of this strategy must be accompanied by a set of complementary measures and cooperation of the public and private sector, considering physical infrastructure, institutions and technical and management capabilities for local production transformation (Moseley et al. 2001).
6.1.1.1 Contract farming for product placement in regional markets120 Contract farming is a production method to organize the agricultural commercialisation of both small and large scale producers. According to Eaton and Shepherd (2001), contract farming should be understood as a partnership between farmers who require knowledge, technology, capital and market for their crops, with provisions requiring agribusiness in a quantity and quality that would otherwise be very difficult to get into the market. Basically, the main benefits are related to social inclusion, and improving the quality and level of production capacity thus increasing the farmers’ initial investment and leading to better income. The empirical evidence demonstrates efficiency through cases that vary according to their environment. For example, in Sub -Saharan Africa arrangements of fruit and vegetables, poultry, pigs, dairy and even of shrimp and fish have been documented. In Zambia, companies provided credits initially to small cotton farmers while cotton and snuff were produced in Mozambique. Another successful experience occurred in Japan, where from the 1970s this mechanism was applied at various scales, with favorable results for the capitalization and knowledge transfer to local producers (Igata et al. 2004). This research study can learn from others successes and failures. Eaton and Shepherd (2001) indicate that the main causes for failure of agricultural contracts are breaches of both parties; farmers often divert funds received for other purposes and marketing of the crops on more favorable terms; while employers often manipulate the quotas allocated; therefore it is recommended that contracts will be established for several years so that the parties cooperate on expectations of higher profits in the long run. Contract farming is a feasible marketing alternative in Yantzaza for the commercialization of products. Products like coffee, cocoa, banana, and yucca have a high probability of reaching regional markets under better conditions and prices. It has demonstrated the weak structure of the local market and low demand for nearby markets 120 To clarify the methodological implications of contract farming it is recommended to review the FAO Bulletin 145, prepared by Eaton and Shepherd (2001).

89
considering their production volumes. There are some requirements for the implementation of the strategy. Table 6.2 summarizes the strategy and generates a series of links that support economic strategy. For the strategy to succeed it must be linked closely to existing companies.121
Table 6.2 Strategy 1: Contract farming for product placement in regional markets122.
Topics Description Specific strategy Placement of local products in regional markets (Yantzaza, Zamora, Loja, Cuenca).
Strategy description Generate an agreement between farmers and community groups or business development and / or marketing for the production and supply of agricultural products under forward agreements, frequently at predetermined prices.
Objectives
General: Establish a contract between farmers and community groups or business development and / or marketing Specific: (1) Create safe spaces for agricultural marketing; (2) diversifying income opportunities for producers; (3) economic growth depending on market demand that reduces risk.
Problems to solve
Lack of marketing opportunities for agricultural products grown in Yantzaza and lack of income sources. The purchaser allows you to organize a reliable supply of products with the desired quality, which probably could not be achieved in an open market.
Tools Contract farming
Prerequisites
Economic Determine productive potential of the farm (in volume and seasonal products). Functional coordination of the production chain (production, storage, transportation, delivery). Mapping agribusiness companies in nearby cities.
Social Build an organization of potential suppliers (banana, papaya, orange ...).
Institutional Public funding service. (Ban Ecuador123); promoting opportunities for dialogue among producers and agribusiness entrepreneurs; provision of public goods (road connectivity).
Environmental Will be defined according to market requirements
Stages of implementation
1. Exploratory stage [and potential resources (agricultural) land and agribusinesses external (potential customers / partners)] 2. The farmer and the buyer agree to the terms and conditions for future sale and purchase of a crop or livestock product. 3. Along with the marketing arrangements the buyer agrees to supply selected inputs, including, at times, the land preparation and technical assistance or technology transfer. 4. The grower agrees to follow recommended production methods, input regimes, and specifications on growing and harvesting procedures. 5. Production performance. 6. Monitoring and feedback.
People involved
Hosts UTPL or party delegated by the Municipal Rural Development Forum In charge Organized farmers, contracting company.
Funding Partially granted by the company or government agency and covered by producers through credit associations.
Target population Organized producers and agribusiness entrepreneurs in the region. People in favor No information People against No information
Duration A season to test (at least according to the seasonality of crops.)
Expected results Safe marketing of agricultural products for less volatile prices; technology and knowledge transfer, improved revenue and reduced agricultural risk.
Rules and regulations Popular law and economic solidarity (forms of organization of production); control law of market power; Labor Code (some contract / piece-work )
Source: Own elaboration, based on FAO (2016)
121 In Yantzaza, there are two important organizations working in regional and international markets: APEOSAE and APECAP. In the year 2005, some producers and local actors from public institutions established a meeting in order to discuss productive chains and development problems in the amazon region. One year later, APEOSAE was born as a second grade organization. However, since 2014 APEOSAE has been strengthened by public support and university knowledge. This procees is part of the main development program at UTPL (APEOSAE 2016) 122 All the strategies will be explained in a summary table in order to enable efficient implementation. 123 Which means Rural Development Bank of Ecuador. Its mission is providing innovative products and financial services, contributing to inclusion and improving the quality of life for small and medium producers (BanEcuador 2016)
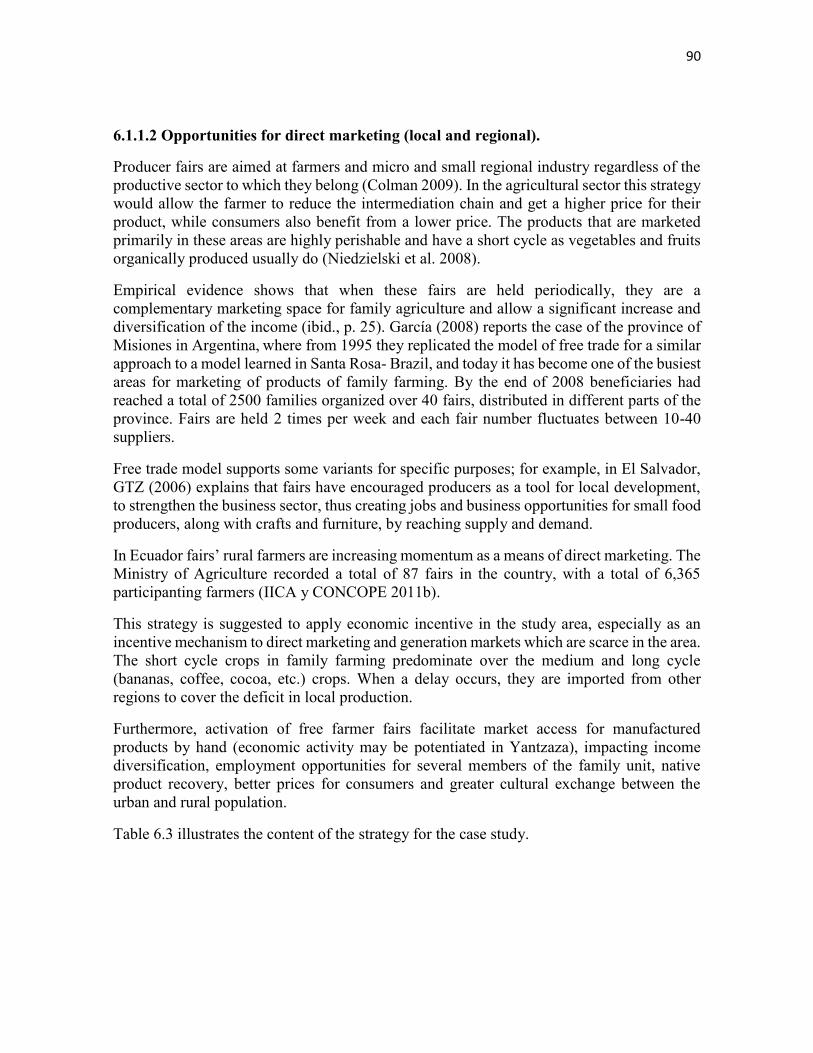
90
6.1.1.2 Opportunities for direct marketing (local and regional).
Producer fairs are aimed at farmers and micro and small regional industry regardless of the productive sector to which they belong (Colman 2009). In the agricultural sector this strategy would allow the farmer to reduce the intermediation chain and get a higher price for their product, while consumers also benefit from a lower price. The products that are marketed primarily in these areas are highly perishable and have a short cycle as vegetables and fruits organically produced usually do (Niedzielski et al. 2008).
Empirical evidence shows that when these fairs are held periodically, they are a complementary marketing space for family agriculture and allow a significant increase and diversification of the income (ibid., p. 25). García (2008) reports the case of the province of Misiones in Argentina, where from 1995 they replicated the model of free trade for a similar approach to a model learned in Santa Rosa- Brazil, and today it has become one of the busiest areas for marketing of products of family farming. By the end of 2008 beneficiaries had reached a total of 2500 families organized over 40 fairs, distributed in different parts of the province. Fairs are held 2 times per week and each fair number fluctuates between 10-40 suppliers.
Free trade model supports some variants for specific purposes; for example, in El Salvador, GTZ (2006) explains that fairs have encouraged producers as a tool for local development, to strengthen the business sector, thus creating jobs and business opportunities for small food producers, along with crafts and furniture, by reaching supply and demand.
In Ecuador fairs’ rural farmers are increasing momentum as a means of direct marketing. The Ministry of Agriculture recorded a total of 87 fairs in the country, with a total of 6,365 participanting farmers (IICA y CONCOPE 2011b).
This strategy is suggested to apply economic incentive in the study area, especially as an incentive mechanism to direct marketing and generation markets which are scarce in the area. The short cycle crops in family farming predominate over the medium and long cycle (bananas, coffee, cocoa, etc.) crops. When a delay occurs, they are imported from other regions to cover the deficit in local production.
Furthermore, activation of free farmer fairs facilitate market access for manufactured products by hand (economic activity may be potentiated in Yantzaza), impacting income diversification, employment opportunities for several members of the family unit, native product recovery, better prices for consumers and greater cultural exchange between the urban and rural population.
Table 6.3 illustrates the content of the strategy for the case study.
91
Table 6.3 Strategy 2: Opportunities for direct marketing (local and regional).
Topics Description Specific strategy Create opportunities for direct marketing between producer and consumer.
Description of strategy Trade promotion event aimed at local farmers regardless of the productive sector to which they belong.
Objectives
General: Creating a complementary marketing space for family farming deficient management markets. Specific: (1) increase the income of farmers by reducing the intermediation chain; (2) dissemination of local identity; (3) consolidates and publicizes local productive potential.
Problems Lower net income of producers; long chain of intermediaries (low producer prices, high price to the consumer);
Tools Trade fairs producer or free (local and regional)
Prerequisites
Economic Organization of a "basket of goods" regional and provider associations Social Provider associations
Institutional Creation of an advocacy group made up of a steering committee, an assembly and a monitoring body. A level of local and regional government is suggested.
Environmental Contingency plan for sanitation and cleaning of occupied space.
Stages of implementation
1. Geographic market segmentation and siting. 2. Call for farmers to integrate attractive offer products permanently. 3. Advocacy to request the enabling ordinance to GAD. 4. Development and socialization of a flow chart and rules of operation. 5. Dissemination / promotion of the fair 6. Implementation and ongoing feedback.
People involved
Hosts UTPL, MIES, [or responsibility delegated by the Municipal Forum of DR]. In charge Producers enrolled; microentrepreneurs and artisans of the region designated leaders.
Funding Producers enrolled; GAD Municipal (public infrastructure). The municipal GAD provides adequate public infrastructure; producers assume individual or organized transportation costs and related expenses.
Target Population Agricultural and organized individual producers, artisans of the region. People in favour Beneficiaries, rural families, agribusiness SMEs, entrepreneurs and self-employed artisans.
People against Current intermediaries, workers who supply urban markets, transportation intermediaries (wholesalers).
Duration One day a week (weekends) Mode of financing Local governments and community outreach tool
Expected results A space suitable to the demands of consumers and producers to consolidate marketing; a more direct link between the two is generated.
Rules and regulations Professional Code of territorial autonomy and decentralization organization (COOTAD); Consumer Protection Act; Law popular and solidarity economy (legal personality).
Source: Own elaboration, based on Colman (2009)
6.1.1.3 Generating new market niches. Export consortia.
International trade is an important alternative to expand agricultural output, as international demand for food is growing faster than domestic demand. In this context, export consortia as tools of trade promotion, circumvents many of the difficulties that unsuccessful individual producers normally would face, such as the absence of economic scales, lack of demand or resources, and financial and human limitations. Export consortia are defined by (ONUDI and FEDEXPORT 2004), as voluntary alliances of companies or individual producers without altering the original legal and administrative autonomy of the participants. Export consortia promotes the goods and services of its members, usually small producers of the same value chain in the foreign market niches to facilitate the export of their products through joint action. This tool would imply the dominance of cooperation over competition in order to reduce risks and gain access to greater benefits.
These export consortia have a long history as a tool for managing external market niches. Welch and Joynt (1987) documented the successful and unsuccessful experiences in the New York market. In more recent years a lot was learned from experiences in places such as Spain,
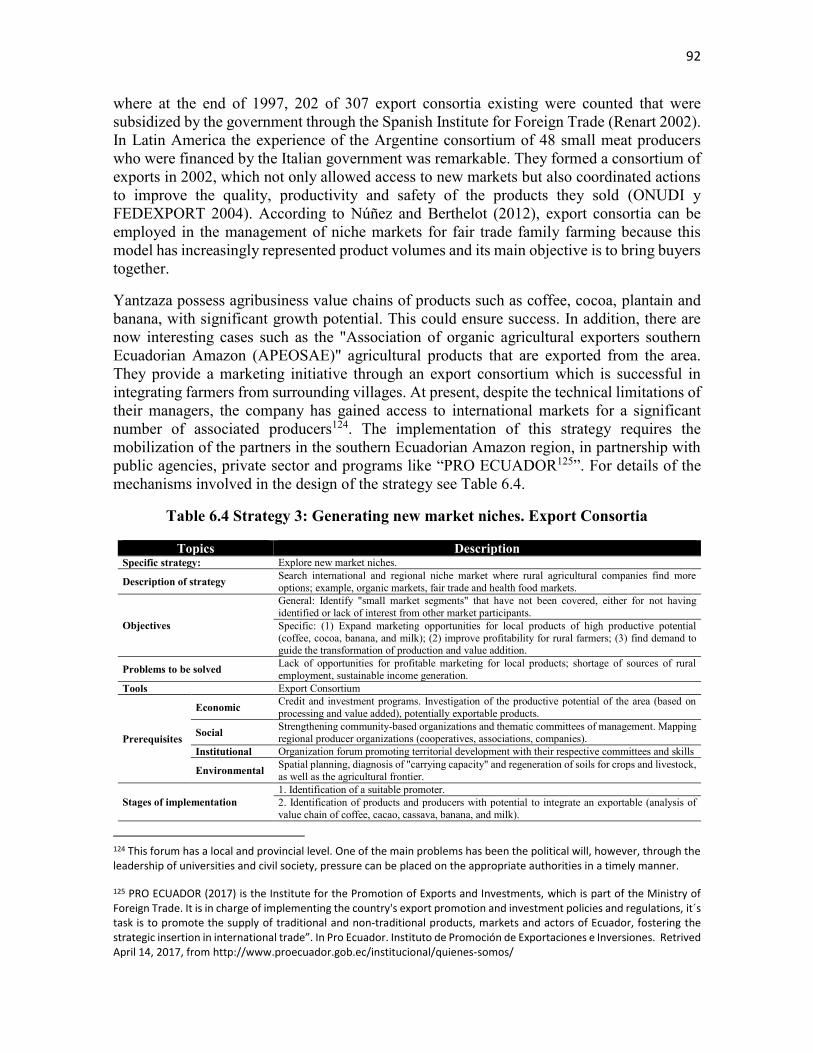
92
where at the end of 1997, 202 of 307 export consortia existing were counted that were subsidized by the government through the Spanish Institute for Foreign Trade (Renart 2002). In Latin America the experience of the Argentine consortium of 48 small meat producers who were financed by the Italian government was remarkable. They formed a consortium of exports in 2002, which not only allowed access to new markets but also coordinated actions to improve the quality, productivity and safety of the products they sold (ONUDI y FEDEXPORT 2004). According to Núñez and Berthelot (2012), export consortia can be employed in the management of niche markets for fair trade family farming because this model has increasingly represented product volumes and its main objective is to bring buyers together.
Yantzaza possess agribusiness value chains of products such as coffee, cocoa, plantain and banana, with significant growth potential. This could ensure success. In addition, there are now interesting cases such as the "Association of organic agricultural exporters southern Ecuadorian Amazon (APEOSAE)" agricultural products that are exported from the area. They provide a marketing initiative through an export consortium which is successful in integrating farmers from surrounding villages. At present, despite the technical limitations of their managers, the company has gained access to international markets for a significant number of associated producers124. The implementation of this strategy requires the mobilization of the partners in the southern Ecuadorian Amazon region, in partnership with public agencies, private sector and programs like “PRO ECUADOR125”. For details of the mechanisms involved in the design of the strategy see Table 6.4.
Table 6.4 Strategy 3: Generating new market niches. Export Consortia
Topics Description Specific strategy: Explore new market niches.
Description of strategy Search international and regional niche market where rural agricultural companies find more options; example, organic markets, fair trade and health food markets.
Objectives
General: Identify "small market segments" that have not been covered, either for not having identified or lack of interest from other market participants. Specific: (1) Expand marketing opportunities for local products of high productive potential (coffee, cocoa, banana, and milk); (2) improve profitability for rural farmers; (3) find demand to guide the transformation of production and value addition.
Problems to be solved Lack of opportunities for profitable marketing for local products; shortage of sources of rural employment, sustainable income generation.
Tools Export Consortium
Prerequisites
Economic Credit and investment programs. Investigation of the productive potential of the area (based on processing and value added), potentially exportable products.
Social Strengthening community-based organizations and thematic committees of management. Mapping regional producer organizations (cooperatives, associations, companies).
Institutional Organization forum promoting territorial development with their respective committees and skills
Environmental Spatial planning, diagnosis of "carrying capacity" and regeneration of soils for crops and livestock, as well as the agricultural frontier.
Stages of implementation 1. Identification of a suitable promoter. 2. Identification of products and producers with potential to integrate an exportable (analysis of value chain of coffee, cacao, cassava, banana, and milk).
124 This forum has a local and provincial level. One of the main problems has been the political will, however, through the leadership of universities and civil society, pressure can be placed on the appropriate authorities in a timely manner.
125 PRO ECUADOR (2017) is the Institute for the Promotion of Exports and Investments, which is part of the Ministry of Foreign Trade. It is in charge of implementing the country's export promotion and investment policies and regulations, it´s task is to promote the supply of traditional and non-traditional products, markets and actors of Ecuador, fostering the strategic insertion in international trade”. In Pro Ecuador. Instituto de Promoción de Exportaciones e Inversiones. Retrived April 14, 2017, from http://www.proecuador.gob.ec/institucional/quienes-somos/

93
3. Building a directory of exporters of agro-related products in the country, in the form of fair trade and organic trade. 4. Appointment of representatives of the various group exporters (companies and producers). 5. Organizations negotiation between agro-exporters [corporate and regional producers]; 6.Conducting a feasibility study and writing a business plan; 7. Official establishment of the consortium as a society (legal entity); 8. Monitoring and feedback.
People involved
Hosts UTPL; Pro ecuador
In charge Designated promoter (consultant, expert in foreign trade), The formation of the consortium running with the participation of interested members, with the guidance of an external consultant (PROECUADOR).
Funding Funding for the consortium is partially done with input from members (proportionate share) and local institutions and regional productive development
Target population
Rural farmers with potential products to export (coffee, cocoa, bananas, cassava and milk) and companies with experience in the agro-export of related products.
People in favor Producers, GADs and universities. People against -
Duration After forming the consortium, there will be a one year timeframe.
Mode of financing The consortium acquires administrative autonomy and is funded by contributions from members and public subsidy promotion agencies (GAD's or Proecuador)
Expected results Consolidation of a consortium of exporters with regional coverage, which reduces transaction costs, product positioning in profitable niches and creates opportunities for technology transfer.
Rules and regulations Companies Act (legal concept of Society); Law of Popular and Solidarity Economy. Source: Own elaboration, based on PNUD (2004)
6.1.1.4 Territorial marketing plan
The goal of territorial development goal is to design operational instruments in order to facilitate the application of a local vision. This is the case of territorial marketing, whose specific aims are attracting capital, tourism, and technology, among others external to the territories but crucial to realizing its planned development strategies in scenarios of global competition factors (Boisier 2006).
A territorial marketing plan, according Precedo et al. (2010), is a concerted action for the economic advancement of a country that is part of a concerted development strategy. A territorial marketing plan considers tangible assets and plans intangibles that differentiate the territory in question and make it attractive for stakeholders to which the communication is directed. Territorial marketing has its theoretical aspects in the marketing of cities, a relatively new but rapidly developing discipline through practical variants (ibid.).
From empirical evidence, we can highlight cases like Rainisto (2003), which provides a comparative analysis of the determinants of success of territorial marketing in the positioning of the regions of Helsinki, Stockholm, Copenhagen and Chicago. Some of those determinants for success for public- private partnerships are the leadership skills of the managers of territorial marketing initiatives, accurate identification of hearings and citizen engagement with the construction of the image of region touting. Gold and Ward (1994) also discussed several specific types of territorial marketing, covering cases of cities, suburbs, industrial towns, fairs, festivals, and the landscape of the American West, China and Eastern Europe.
The widespread use of this practice has resulted in the development of methodological approaches which have improved tourist and industrial results along with private investment. It is still a challenge to define public projects that facilitate these dynamics though (Ashworth and Voogd 1990). The application of this tool goes beyond the cities and towns and towards

94
understanding their situation in the regional context, as is the case for European cities in the context of European integration policies (Kavaratzis and Ashworth 2005).
This practical, powerful and multi-level tool is suggested to promote the rural areas of the object of our study, especially for the purposes of tourism, gastronomic and ecological production potential. The strategy would allow Yantzaza to enhance its position as a tourist destination city in the South of Ecuador as well as the acceptance of its products in the regional markets, in addition to expanding opportunities for rural employment and incomes.
Running this strategy implies having collective work group, officials, media and civil society organizations to build a collective identity or brand and get the local community to engage with their promotion. Table 6.5 summarizes the practices to be implemented in the study area complementing linking strategies.
Table 6.5 Strategy 4: Territorial marketing plan126.
Topic Description Specific strategy: Drafting a territorial marketing plan.
Strategy description A territorial marketing plan is a concerted set of actions for the promotion of the territory plan and has great relevance as an important part of developing a strategy for local development in a municipality.
Objectives
General: Coordinate local stocks of productive factors in Yantzaza for a promotion plan that would allow territory to explore external opportunities and raise funds for local development. Specific: (1) identify the potential of the rural territory of Yantzaza that are highly valued externally; (2) promote the production and tourism potential in Yantzaza; (3) expand the range of investment opportunities for productive players in Yantzaza.
Solved issues Shortage of jobs for the younger generation; concentration of income sources; lack of cooperation between the productive actors for collective action.
Tools Territorial marketing plan
Prerequisites
Economic Mapping land assets for development [eco-tourism resources, productive potential, and cultural assets, human talent, etc.]
Social Strengthening thematic social organizations to visualize the different social groups and interests.
Institutional Municipal Rural Development Forum to lead the process (Forum promoter actors).
Environmental Spatial planning (Land Use Planning); Map of assets and environmental vulnerability.
Stages of implementation
1. Design of strategies from an expert workshop (endomarketing) 2. Design training plan for adequate knowledge of the area between the internal actors; 3. Planning and internal dissemination campaign of civic culture; 4. Promotion of tourism, gastronomic tours, and other territorial assets. 5. Identification of market niches and opportunities to attract investment; 6. Political lobbying that accomplished the incorporation of the plan within the GAD's programs; 7. Formulation of a project bank for cooperation among stakeholders; 8. Building alliances and agreements with firms, area banks and cooperation agencies; 9. Design basis for measuring the impact on cultural transformation and plan results online.
People involved
Hosts UTPL; Municipal Forum of DR; People in charge Representative actors [tour operators; media; GAD's] Financing GAD Provincial; GAD´s parishes; Target Population
To be defined in the expert workshop [Of: tourists from the neighboring provinces; investors in beekeeping, agro-industrial enterprises, etc.].
People in favor Actors of the productive sector, transport, and public actors. People against -
126 For a methodological approach for developing a plan of territorial marketing and reviewing small-scale case studies, it
is recommended to review the report done about the German Development Cooperation (GTZ 2007) and a methodological
guide.
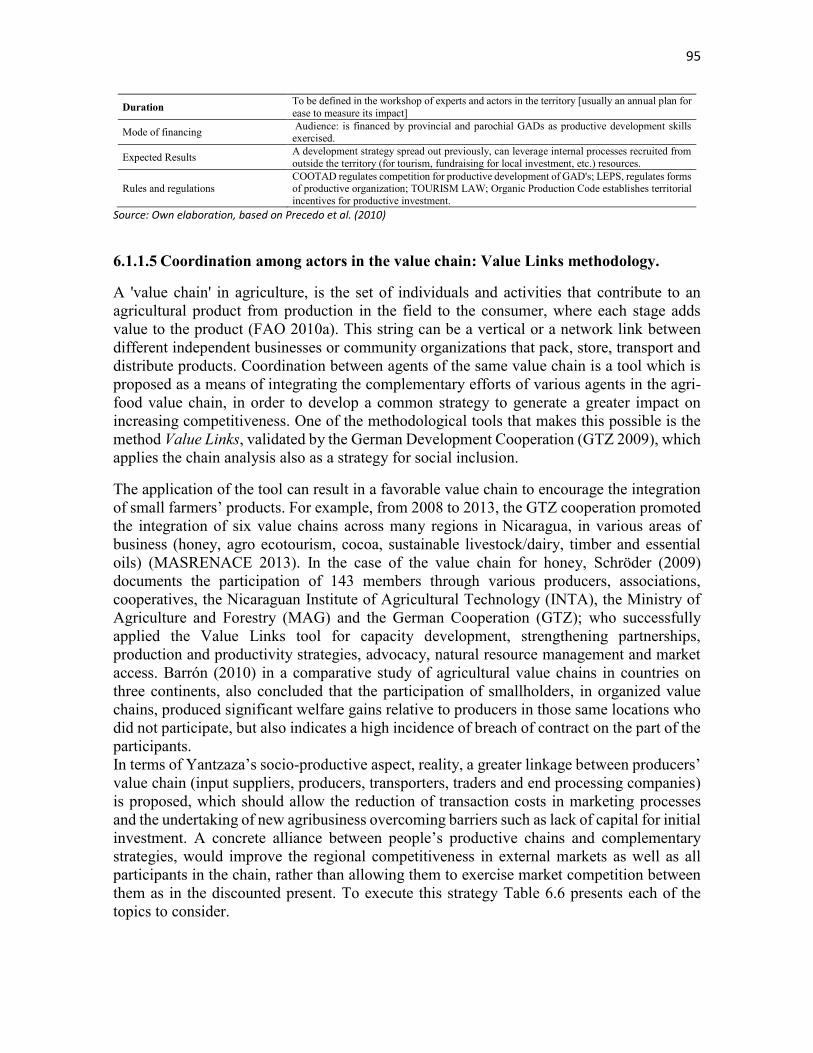
95
Duration To be defined in the workshop of experts and actors in the territory [usually an annual plan for ease to measure its impact]
Mode of financing Audience: is financed by provincial and parochial GADs as productive development skills exercised.
Expected Results A development strategy spread out previously, can leverage internal processes recruited from outside the territory (for tourism, fundraising for local investment, etc.) resources.
Rules and regulations COOTAD regulates competition for productive development of GAD's; LEPS, regulates forms of productive organization; TOURISM LAW; Organic Production Code establishes territorial incentives for productive investment.
Source: Own elaboration, based on Precedo et al. (2010)
6.1.1.5 Coordination among actors in the value chain: Value Links methodology.
A 'value chain' in agriculture, is the set of individuals and activities that contribute to an agricultural product from production in the field to the consumer, where each stage adds value to the product (FAO 2010a). This string can be a vertical or a network link between different independent businesses or community organizations that pack, store, transport and distribute products. Coordination between agents of the same value chain is a tool which is proposed as a means of integrating the complementary efforts of various agents in the agri-food value chain, in order to develop a common strategy to generate a greater impact on increasing competitiveness. One of the methodological tools that makes this possible is the method Value Links, validated by the German Development Cooperation (GTZ 2009), which applies the chain analysis also as a strategy for social inclusion.
The application of the tool can result in a favorable value chain to encourage the integration of small farmers’ products. For example, from 2008 to 2013, the GTZ cooperation promoted the integration of six value chains across many regions in Nicaragua, in various areas of business (honey, agro ecotourism, cocoa, sustainable livestock/dairy, timber and essential oils) (MASRENACE 2013). In the case of the value chain for honey, Schröder (2009) documents the participation of 143 members through various producers, associations, cooperatives, the Nicaraguan Institute of Agricultural Technology (INTA), the Ministry of Agriculture and Forestry (MAG) and the German Cooperation (GTZ); who successfully applied the Value Links tool for capacity development, strengthening partnerships, production and productivity strategies, advocacy, natural resource management and market access. Barrón (2010) in a comparative study of agricultural value chains in countries on three continents, also concluded that the participation of smallholders, in organized value chains, produced significant welfare gains relative to producers in those same locations who did not participate, but also indicates a high incidence of breach of contract on the part of the participants. In terms of Yantzaza’s socio-productive aspect, reality, a greater linkage between producers’ value chain (input suppliers, producers, transporters, traders and end processing companies) is proposed, which should allow the reduction of transaction costs in marketing processes and the undertaking of new agribusiness overcoming barriers such as lack of capital for initial investment. A concrete alliance between people’s productive chains and complementary strategies, would improve the regional competitiveness in external markets as well as all participants in the chain, rather than allowing them to exercise market competition between them as in the discounted present. To execute this strategy Table 6.6 presents each of the topics to consider.

96
Table 6.6 Strategy 5: Coordination among people in the value chain: Value Links methodology.
Topics Discription Specific strategy: Improve coordination among actors in the agrifood value chain in Yantzaza. Strategy description Coordination between agents of the value chain is full teamwork and leadership.
Objective
General: Dimension and growth opportunities in Yantzaza’s food chain, through cooperative work between the actors within it. Specific: (1) visible areas of cooperation and collective action in the agrifood value chain of Yantzaza; (2) encourage the willingness to undertake collective tasks between producers, transporters, brokers and others in the food chain; (3) take advantage of business opportunities in the local agri-food value chain.
Solved issues Lack of collective action for inclusive production development; limited sources of rural employment; technological difficulties in absorption at high individual costs; restrictive transaction costs for individual producers.
Tools Workshop promoting value chains methodology Value Links
prerequisites
Economic Characterization of productive potential and mapping Yantzaza Stakeholders. Social Strengthening productive CBOs.
Institutional Identifying opportunities for productive integration recognized in the existing legal framework. Intervention of regional institutions of national government.
Environment Mapping of natural resources and exploitation boundaries.
Stages of implementation
1. Preparatory meeting with more actors representing the value chain; presentation of objectives and logistics planning workshop. 2. Running the workshop building value chains. 3. Current map of the value chain (actors and specific data) 4. Development of a framework assembly (vision, mission, target improvement chain) 5. Definition of breeding strategy. 6. Development of an operational plan. 7. Agreements about process management (facilitation). 8. Thread, evaluation and closing of the workshop. 9. Meeting of the Steering Committee for the Implementation of Chain. 10. Implementation of improvement projects. 11. Monitoring, evaluation, and planning
People involved
Hosts UTPL; External consultants; FDRT delegates In Charge Entertainers and representative chain actors Financing Bodies productive development (GAD's, Local) Target Population Operators of the agrifood value chain of Yantzaza People in favor Operators of the value chain People against Possibly private companies
Duration A month plus the period of implementation of joint strategies. Mode of financing Workshop funded by development agencies; projects funded by chain operators. Expected results Consolidation of productive chains of major agricultural products of the area are expected.
Rules and regulations LEPS (collective organization of value chain); COOTAD (productive skills development); Organic Production Code (spaces for consultation and tax incentives for the various economic zones)
Source: Own elaboration, based on GTZ (2009)
6.1.2 Promotion of agro-business: tools.
6.1.2.1 Assisted production projects for production transformation.
Assisted production projects are defined as self-employment strategies aided by some kind of institutional support aimed at the creation and sustainability of a production unit with the goal of operating in the formal economy, regardless of size and legal form (Licandro and Echeverriarza 2006). In rural areas these projects along with infrastructure projects as a rule are oriented to the reduction of poverty and are part of the social inclusion policies (Kanbur and Rauniyar 2009). One example of the most important experiences of success is Uruguay’s registration of the Associated Country Women of Uruguay in 1985 where several productive groups were associated in order to improve the living conditions of rural women who began

97
developing packaged products, and gradually advanced to work in other areas of social concern such as housing, health and education. The creation and formalization of the working groups has enabled some organizations to gain institutional support for the consolidation of production, technical and managerial capabilities (Licandro and Echeverriarza 2006). In the countries of the Andean Community several successful ventures in agribusiness were also recorded through the mechanism of assisted projects. (IICA 2009) systematized experience of 14 productive agribusiness projects in the framework of the Hemispheric (PRODAR) Rural Agribusiness Program. These projects can emphasize not only their contribution to rising incomes of the rural population, but also the contribution of generating knowledge about structural problems of production management in rural areas as a technical change and a diversification of supply partnerships for business management and local market access enhancement. In this case, it is recommended applying the principles and lessons that were learned from other cases of assisted production projects, to encourage entrepreneurship and productive transformation of the most representative commodities (cocoa, coffee, banana and derivatives127). The implementation of this strategy implies that the stakeholders are formalized as organizations with legal status to access funds for productive development agencies (MIPRO, MAGAP, BanEcuador, GAD provincial), among others, which contribute to the development of rural communities, and the mobilization of resources to support entrepreneurs in the early stages. Table 6.7 summarizes the methodological strategy mechanism. The implementation of the strategy with the associated producers allows the use of the area’s productive potential and the expansion of rural employment participation in the food chain.
Table 6.7 Strategy 6: Productive Projects assisted transformation into production systems
Topic Description Specific strategy: Promote productive transformation in the "star products" of communities.
Tools description
An assisted self-employment productive project is a strategy supported bysome kind of institutional support. Its aims is the creation and sustainability of some type of production unit (In Yantzaza agricultural or livestock preference) with the goal of creating anexchange value in the market, and formally operating, regardless of size and legal form.
Objectives
General: promote productive transformation projects (knowledge-intensive) from the main agricultural products of the area. Specific: (1) identify opportunities for rural entrepreneurship in Yantzaza; (2) broaden the participation of the rural labor force in the production patterns; (3) generate effective demand for technologies in the rural sector for productive transformation.
Resolved issues Low value added products in the area and low participation of the local workforce in the local food chain.
Tools Product assisting projects.
Prerequisites
Economic Determination of the productive potential; asset mapping and actors. Productive private capital or financing.
Social Strengthening community-based organizations and technically trained human resources.
Institutional Consolidation of Municipal Forum on Rural Development or short-term support of the provincial GAD.
Environmental Determination of the boundaries of agricultural and livestock production
127 Derivatives are products made wholly or partly from coffee, cocoa or bananas such as raw materials and whose purpose is to use them in a differentiated manner.
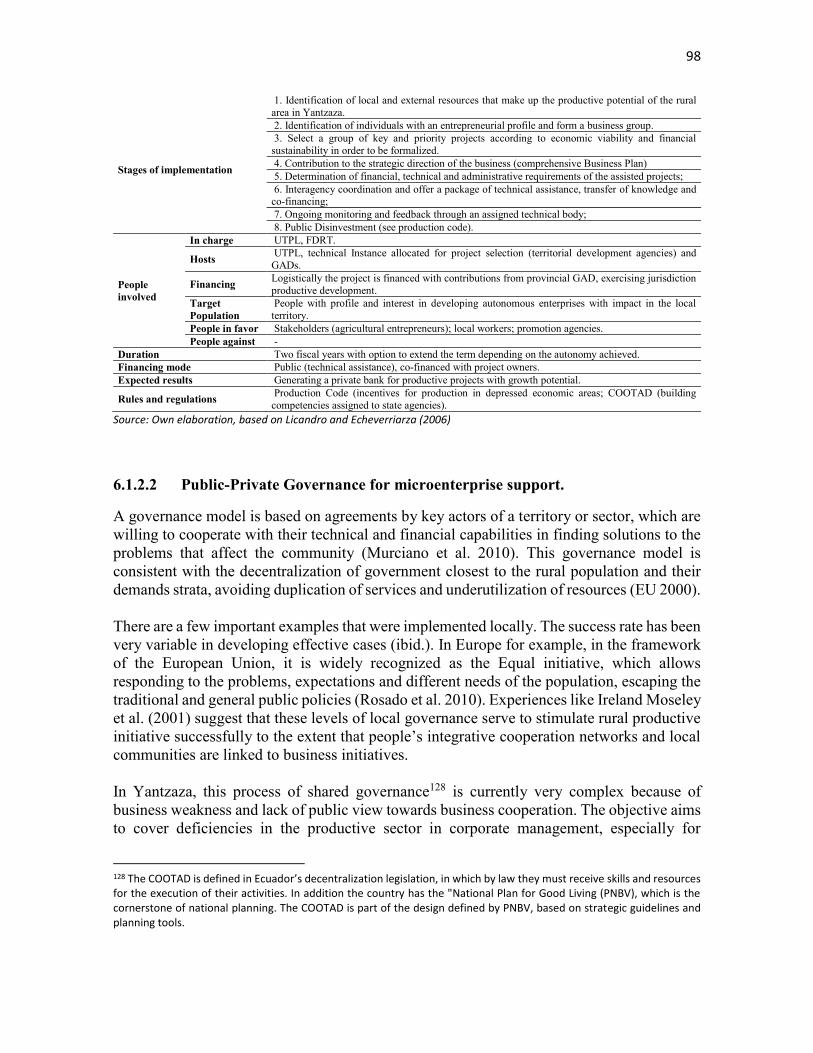
98
Stages of implementation
1. Identification of local and external resources that make up the productive potential of the rural area in Yantzaza. 2. Identification of individuals with an entrepreneurial profile and form a business group. 3. Select a group of key and priority projects according to economic viability and financial sustainability in order to be formalized. 4. Contribution to the strategic direction of the business (comprehensive Business Plan) 5. Determination of financial, technical and administrative requirements of the assisted projects; 6. Interagency coordination and offer a package of technical assistance, transfer of knowledge and co-financing; 7. Ongoing monitoring and feedback through an assigned technical body; 8. Public Disinvestment (see production code).
People involved
In charge UTPL, FDRT.
Hosts UTPL, technical Instance allocated for project selection (territorial development agencies) and GADs.
Financing Logistically the project is financed with contributions from provincial GAD, exercising jurisdiction productive development.
Target Population
People with profile and interest in developing autonomous enterprises with impact in the local territory.
People in favor Stakeholders (agricultural entrepreneurs); local workers; promotion agencies. People against -
Duration Two fiscal years with option to extend the term depending on the autonomy achieved. Financing mode Public (technical assistance), co-financed with project owners. Expected results Generating a private bank for productive projects with growth potential.
Rules and regulations Production Code (incentives for production in depressed economic areas; COOTAD (building competencies assigned to state agencies).
Source: Own elaboration, based on Licandro and Echeverriarza (2006)
6.1.2.2 Public-Private Governance for microenterprise support.
A governance model is based on agreements by key actors of a territory or sector, which are willing to cooperate with their technical and financial capabilities in finding solutions to the problems that affect the community (Murciano et al. 2010). This governance model is consistent with the decentralization of government closest to the rural population and their demands strata, avoiding duplication of services and underutilization of resources (EU 2000). There are a few important examples that were implemented locally. The success rate has been very variable in developing effective cases (ibid.). In Europe for example, in the framework of the European Union, it is widely recognized as the Equal initiative, which allows responding to the problems, expectations and different needs of the population, escaping the traditional and general public policies (Rosado et al. 2010). Experiences like Ireland Moseley et al. (2001) suggest that these levels of local governance serve to stimulate rural productive initiative successfully to the extent that people’s integrative cooperation networks and local communities are linked to business initiatives. In Yantzaza, this process of shared governance128 is currently very complex because of business weakness and lack of public view towards business cooperation. The objective aims to cover deficiencies in the productive sector in corporate management, especially for
128 The COOTAD is defined in Ecuador’s decentralization legislation, in which by law they must receive skills and resources for the execution of their activities. In addition the country has the "National Plan for Good Living (PNBV), which is the cornerstone of national planning. The COOTAD is part of the design defined by PNBV, based on strategic guidelines and planning tools.

99
integrating factors external to the firm competitiveness. Creating an entity or body building rural microenterprise is suggested. It may be comprised of units (public and academic) research, chambers and organizations representing producers the GAD's through its direction of productive development and credit agencies (private or public); so that it can integrate a plan of cooperation that is embodied in a package of support to enterprises, with an impact on the sustainability and productive processing of local raw materials. Some methodological references for the implementation of this cooperation can be found in Table 6.8. Experiences suggest that there is no unique formula for the ideal design, as this depends more on an execution that is based on flexible agreements rather than specific institutional designs.
Table 6.8 Strategy 7: Public-Private Governance for microenterprise support.
Topics Description Specific strategy: Promotion of a public-private cooperation and extension wing support.
Tool
This governance model enables the optimization of the coordination of policies and resources at the territories; is founded on institutional collaboration based on the technical or financial capacity of participants. It is proposed to Yantzaza, oriented to cover the deficiencies noted in the productive sector’s solution. UTPL can lead as a neutral entity, but the institutional support should be provided by the provincial GAD. Funding will be provided by the National Development Bank (BanEcuador) and private entities that fall within the needs of communities. The tool can be an independent and autonomous legal entity or may be part of GAD. This depends on the local bargaining process.
Objectives
General: Creating a space for public consultation - private for productive development with emphasis on business Yantzaza. Specific: (1) make available to the rural and urban entrepreneurs who have an impact on the rural sector, a package of technology services and technical assistance for business development; (2) facilitate access to productive resources development; (3) promote productive transformation initiatives.
Solved issues Low income, high unemployment, lack of institutional support, lack of productive investment, low value added to primary products and lack of local participation in agrifood value chain.
Tools Public-private governance to support microenterprise
Prerequisits
Economic Identification of investment opportunities according to the characteristics of the territory and the demands of market influence.
Social Consolidation of community organizations with the respective production processes of explicit self-government.
Institutional Display of institutionally involved and working actors to promote agro-enterprise. Consider powers according to law.
Environmental Determination of the boundaries of production and recognition of environmental regulations and land use planning.
Stages of implementation
1. Analysis of the composition of governance, according to the production requirements; 2. Participatory design of interventions, from theory-based restrictions in the agrifood value chain analysis; 3. Implementation of interventions, through tables of inter-institutional dialogue. (Leadership in universities and communities) 4. Monitoring and evaluation 5. Feedback
People involved
Hosts UTPL; FDRT In charge Entities in the Forum's GAD, MIES, UTPL
Financing Public promotion agencies (GAD-Q); Business Services: micro finance and government. BNF and private lenders that meet requirements.
Target Population
Micro agribusiness and forestry; communities and producers interested in productive transformation initiatives.
People in favor Micro-entrepreneurs and potential entrepreneurs; productive development agencies People against Carriers and intermediaries of the agrifood value chain
Duration One year with renewal projection. Mode of financing Financing of services between beneficiaries and providers of microenterprise services.
Expected results Governance that enjoys social legitimacy consolidates and promotes inclusive and strategic long-term development of the rural productive businesses sector.
Rules and regulations COOTAD (determined by the participants); Production Code (determined incentives and associative forms of financing entrepreneurship); LEPS (regulates the CBOs and endowed with legal personality).
Source: Own elaboration, based on UE (2000)
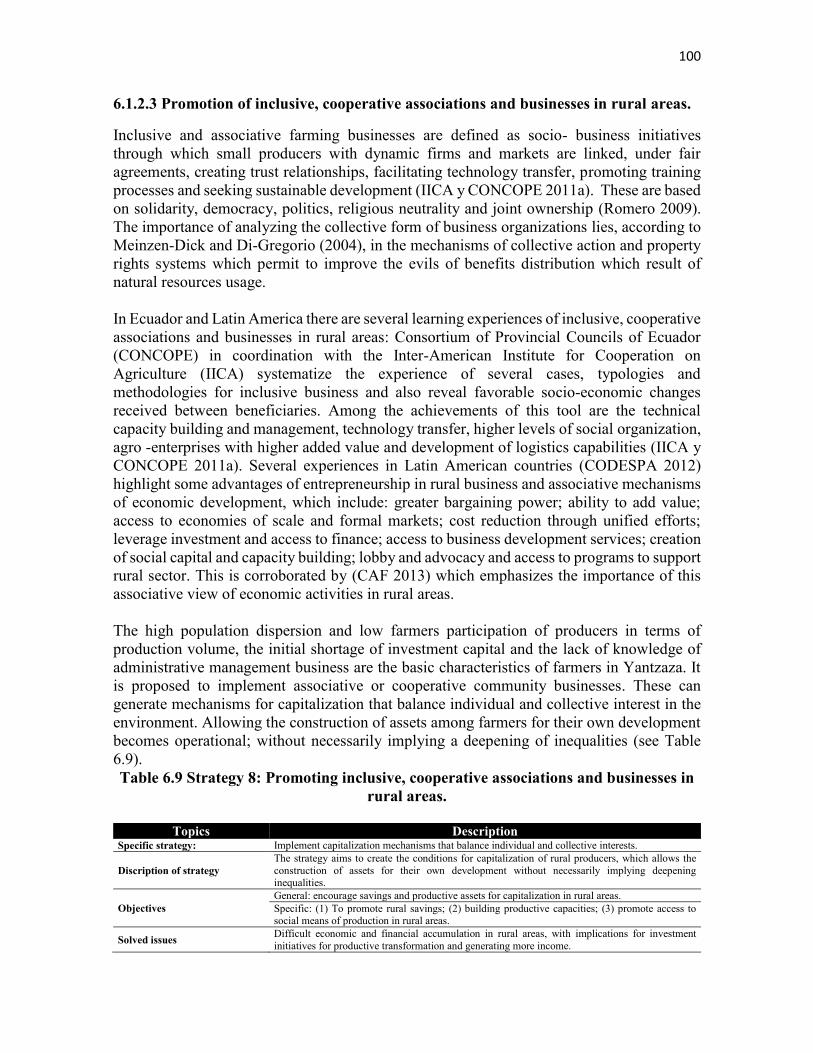
100
6.1.2.3 Promotion of inclusive, cooperative associations and businesses in rural areas.
Inclusive and associative farming businesses are defined as socio- business initiatives through which small producers with dynamic firms and markets are linked, under fair agreements, creating trust relationships, facilitating technology transfer, promoting training processes and seeking sustainable development (IICA y CONCOPE 2011a). These are based on solidarity, democracy, politics, religious neutrality and joint ownership (Romero 2009). The importance of analyzing the collective form of business organizations lies, according to Meinzen-Dick and Di-Gregorio (2004), in the mechanisms of collective action and property rights systems which permit to improve the evils of benefits distribution which result of natural resources usage. In Ecuador and Latin America there are several learning experiences of inclusive, cooperative associations and businesses in rural areas: Consortium of Provincial Councils of Ecuador (CONCOPE) in coordination with the Inter-American Institute for Cooperation on Agriculture (IICA) systematize the experience of several cases, typologies and methodologies for inclusive business and also reveal favorable socio-economic changes received between beneficiaries. Among the achievements of this tool are the technical capacity building and management, technology transfer, higher levels of social organization, agro -enterprises with higher added value and development of logistics capabilities (IICA y CONCOPE 2011a). Several experiences in Latin American countries (CODESPA 2012) highlight some advantages of entrepreneurship in rural business and associative mechanisms of economic development, which include: greater bargaining power; ability to add value; access to economies of scale and formal markets; cost reduction through unified efforts; leverage investment and access to finance; access to business development services; creation of social capital and capacity building; lobby and advocacy and access to programs to support rural sector. This is corroborated by (CAF 2013) which emphasizes the importance of this associative view of economic activities in rural areas. The high population dispersion and low farmers participation of producers in terms of production volume, the initial shortage of investment capital and the lack of knowledge of administrative management business are the basic characteristics of farmers in Yantzaza. It is proposed to implement associative or cooperative community businesses. These can generate mechanisms for capitalization that balance individual and collective interest in the environment. Allowing the construction of assets among farmers for their own development becomes operational; without necessarily implying a deepening of inequalities (see Table 6.9). Table 6.9 Strategy 8: Promoting inclusive, cooperative associations and businesses in
rural areas.
Topics Description Specific strategy: Implement capitalization mechanisms that balance individual and collective interests.
Discription of strategy The strategy aims to create the conditions for capitalization of rural producers, which allows the construction of assets for their own development without necessarily implying deepening inequalities.
Objectives General: encourage savings and productive assets for capitalization in rural areas. Specific: (1) To promote rural savings; (2) building productive capacities; (3) promote access to social means of production in rural areas.
Solved issues Difficult economic and financial accumulation in rural areas, with implications for investment initiatives for productive transformation and generating more income.

101
Tools Promoting inclusive, cooperative associations and businesses in rural areas
Prerequisits
Economic Identify potential productive capacity of the region. Minimum initial investment. Social Legal consolidation of community-based enterprises. Institutional Creation of a forum for the promotion of local economic development.
Environmental Preview of the opportunities to profit from environmental assets, environmental restrictions and legal regulations.
Rules and regulations
1. Selection for promotion business and productive chains; 2. Mapping and analysis of value chains; 3. Determine strategies for productive use and disposal restrictions; 4. Facilitating productive development processes. 5. Strengthen trade links and partnerships with appropriate political and regulatory environment; 6. Monitoring, managing impacts and feedback.
People involved
Hosts UTPL; FTDR In charge Specific farmers selected by the technical support group.
Financing Cofinancing deferred with companies in their early stages (input lenders); thereafter the companies cover the costs of services received.
Target population Rural agricultural enterprises and value chains People in favor Communities; public actors productive development People against -
Duration Two years with an option for reformulation.
Mode of financing Logistics financed by public actors in development; specific services are co-financed with the company.
Expectations Consolidation of community, business associations and inclusive raise funds for rural development in a sustainable manner.
Rules and regulations Production Code, LEPS, COOTAD, Companies Act. Source: Own elaboration, base on IICA y CONCOPE (2011a)
6.1.2.4 Management of short alternative marketing (CIALCO) A CIALCO is a system of production-marketing-consumption solidarity based on principles of environmental sustainability, which reduces the presence of intermediaries. The benefit to small producers and consumers, is prioritized, and traditions are valued and contribute to food sovereignty (IICA y CONCOPE 2011a). The rise of proximity circuits as a form of trade is due, as per CEPAL (2013), to mainly a growing demand from consumers who are looking for local, authentic, healthy and seasonal products; while producers attempt to capture a higher production value, save in other segments of the chain (transport, packaging, etc.), create value from intangible assets (brands, local roots, authenticity, social ties) and achieve greater autonomy with social integration. The small circuits are an alternative that come from years of reasearch and that have originated from many trials and variations such as community gardens; associations of producers and consumers; consumer cooperatives; sponsorships; direct sales on the farm; direct selling in the market; direct sale home or consumer groups; producer cooperatives/collective selling points; cooperatives with store; specialty stores and supermarkets (Binimelis and Descombes 2010). From an analysis of the short marketing channels in Andalusia and its contrast with other European experiences, Sevilla et al. (2012) concludes that CIALCO are consistent with emerging trends in land revaluation in the current eco - social context and suggestsmanagement mechanisms for sustainable family farming along with the promotion of farmer-based rural development. Tragsatec (2012) also highlights the experience of France and other European countries with short marketing channels. Short marketing circuits have contributed to the preservation of local food and cultural traditions.
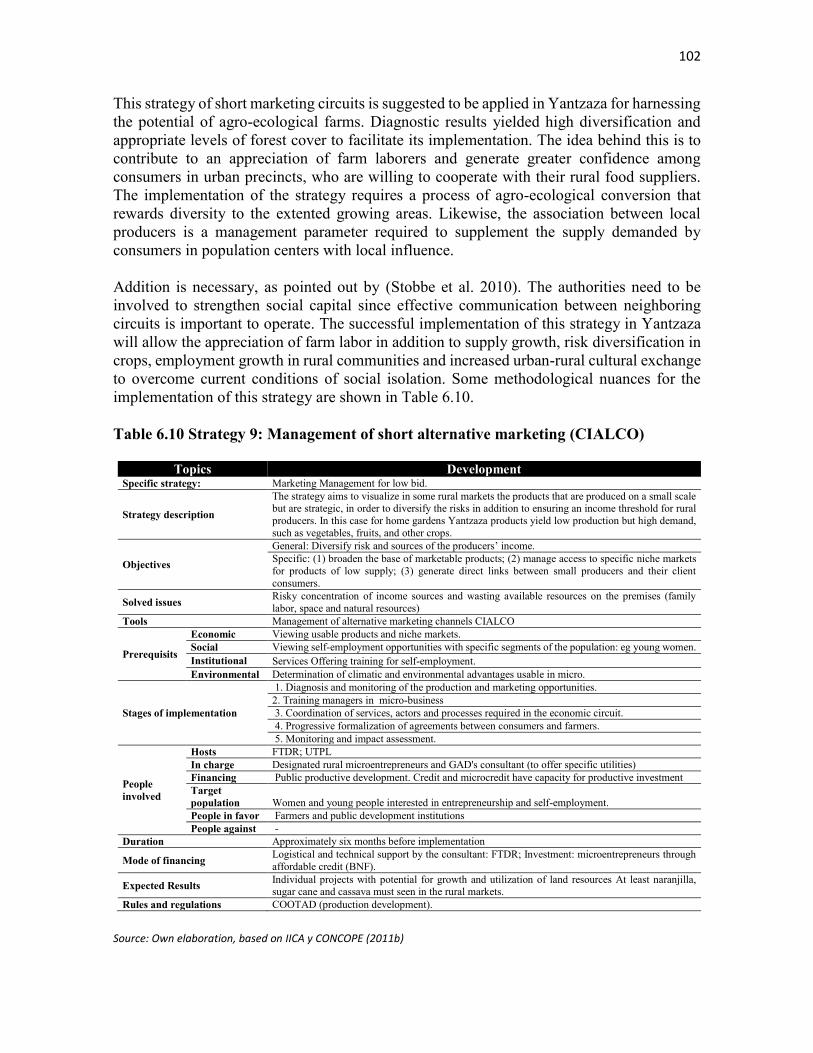
102
This strategy of short marketing circuits is suggested to be applied in Yantzaza for harnessing the potential of agro-ecological farms. Diagnostic results yielded high diversification and appropriate levels of forest cover to facilitate its implementation. The idea behind this is to contribute to an appreciation of farm laborers and generate greater confidence among consumers in urban precincts, who are willing to cooperate with their rural food suppliers. The implementation of the strategy requires a process of agro-ecological conversion that rewards diversity to the extented growing areas. Likewise, the association between local producers is a management parameter required to supplement the supply demanded by consumers in population centers with local influence. Addition is necessary, as pointed out by (Stobbe et al. 2010). The authorities need to be involved to strengthen social capital since effective communication between neighboring circuits is important to operate. The successful implementation of this strategy in Yantzaza will allow the appreciation of farm labor in addition to supply growth, risk diversification in crops, employment growth in rural communities and increased urban-rural cultural exchange to overcome current conditions of social isolation. Some methodological nuances for the implementation of this strategy are shown in Table 6.10. Table 6.10 Strategy 9: Management of short alternative marketing (CIALCO)
Topics Development Specific strategy: Marketing Management for low bid.
Strategy description
The strategy aims to visualize in some rural markets the products that are produced on a small scale but are strategic, in order to diversify the risks in addition to ensuring an income threshold for rural producers. In this case for home gardens Yantzaza products yield low production but high demand, such as vegetables, fruits, and other crops.
Objectives
General: Diversify risk and sources of the producers’ income. Specific: (1) broaden the base of marketable products; (2) manage access to specific niche markets for products of low supply; (3) generate direct links between small producers and their client consumers.
Solved issues Risky concentration of income sources and wasting available resources on the premises (family labor, space and natural resources)
Tools Management of alternative marketing channels CIALCO
Prerequisits
Economic Viewing usable products and niche markets. Social Viewing self-employment opportunities with specific segments of the population: eg young women. Institutional Services Offering training for self-employment. Environmental Determination of climatic and environmental advantages usable in micro.
Stages of implementation
1. Diagnosis and monitoring of the production and marketing opportunities. 2. Training managers in micro-business 3. Coordination of services, actors and processes required in the economic circuit. 4. Progressive formalization of agreements between consumers and farmers. 5. Monitoring and impact assessment.
People involved
Hosts FTDR; UTPL In charge Designated rural microentrepreneurs and GAD's consultant (to offer specific utilities) Financing Public productive development. Credit and microcredit have capacity for productive investment Target population Women and young people interested in entrepreneurship and self-employment. People in favor Farmers and public development institutions People against -
Duration Approximately six months before implementation
Mode of financing Logistical and technical support by the consultant: FTDR; Investment: microentrepreneurs through affordable credit (BNF).
Expected Results Individual projects with potential for growth and utilization of land resources At least naranjilla, sugar cane and cassava must seen in the rural markets.
Rules and regulations COOTAD (production development).
Source: Own elaboration, based on IICA y CONCOPE (2011b)

103
6.1.3 Diversification of income sources: tools
Competitive business fund Competitive funds are state’s financial resources made available to private users who compete for them, with guidelines and defined rules and regulations (Toro and Espinoza 2003). This has been a mechanism for allocation of funds for agriculture and rural development, has been used in Latin America for about the last two decades (Echeverría et al. 1995) and its application to agriculture has been traditionally associated with research projects, innovation and technology transfer. In recent years however, several countries have implemented this mechanism for allocating resources to rural areas, especially vulnerable impoverished areas, through productive assisted projects. One of the recent experiences of urban-rural funding productive projects is “Fondoempleo” in Peru. This established background in institutional alliance has created a line of co-financing of projects, that contribute to improving the employability, the development of production capacities, youth entrepreneurship and sustainable income generation in the provinces of Cajamarca and Celendín (FONDOEMPLEO 2013). Another implicit parameter in competitive funds for agricultural development is technological innovation. In Chile during the year 2009 permanent funds were created to promote entrepreneurship in the line of healthy foods, which aims to help by supporting research and development, and health of Chilean society through the development and improvement of foods, while keeping in mind side-effects and agro-industry chain in the country (Manríquez 2009). Multilateral development agencies have also generated experiences of rural finance; such is the case of IICA (2013) who developed the IICA Competitive Fund for Technical Cooperation (FonCT), financed with its own resources, and with the purpose of promoting help aimed at solving problems and seizing opportunities that face the agricultural innovations and rural life in the partner countries. The diverse experiences in using this mechanism have allowed systematizing the relevant learning. Toro and Espinoza (2003) points out the main advantages of this tool including: decentralizing contribution support services for users and providing incentives for the private sector through the provision of public resources, greater transparency in the allocation of public resources; and project financing as desirable parameters of social interest. The strategy of creating a revolving fund to boost the local rural enterprises in Yantzaza, is complementary to other strategies which will promote assisted projects or community businesses, creating new marketing opportunities. All the strategies proposed above have an implicit component of innovation and of course of empowerment to rural communities (private sector) to foster their own development. This strategy aims to enhance the effects on employment, innovation, income diversification, and social inclusion which such private initiatives may have, giving them access to public funding (partial). We must emphasize that the main target group to consider for achieving sustainability and solving local problems defined in Section 5, is the youth. Implementation of this strategy requires building partnerships between public agencies and other

104
organizations/civil societies such as universities, and agricultural research institutes. (see Table 6.11)
Table 6.11 Strategy 10: Competitive business fund
Topics Descriptions Specific strategy: To promote new business and integrated farms. Strategy descriptions The strategy of driving new business and sources of income arises in order to exploit the
indigenous resources in value creation and employment generation for rural youth
Objectives
General: promote the use of endogenous resources from Yantzaza’s rural territory with a sustainable business approach Specific: (1) promote entrepreneurship among young rural population; (2) encourage entrepreneurship viable ideas; (3) co-finance viable rural business ideas.
Solved issues Low amount of entrepreneurship in the rural sector; waste of resources; limited opportunities for employment for young rural people
Tools Competitive fund rotating venture
Prerequisites
Economic To determine the production potential of the territory using a data bank of possible viable projects. Social Approaches to young people and building spaces for dialogue. Institutional Creating youth organizations and links between them. Environmental Assessing environmental and climatic potential that can lead to entrepreneurship.
Stages of implementation
1. Call, promotion and dissemination; 2. Presentation of project ideas; 3.Evaluation of project ideas; 4. Project formulation; 5. Evaluation of project profiles; 6. Subscription agreements and contracts; 7. Disbursements and execution.
People involved
Hosts UTPL; FTDR In charge FTDR, Delegates consultants, entrepreneurs Funding Public bodies to promote Target population Rural youth between 18 and 30 years People in favor Young rural entrepreneurs People against Other external entrepreneurs (from big cities or other neighbourhood countries)
Duration Four months from notice to disbursement Mode of financing Banking in partnership with public agencies to promote production (MIPRO y GAD´s).
Expected results Creating and driving a bank of viable rural projects; knowledge-intensive and technology absorption capacity.
Rules and regulations COOTAD, Production Code. Sources: Own elaboration, based on Toro and Espinoza (2003)
6.2 Social Strategies
Farmers can be effective when social and human capital contribute to sustainable agricultural development. Farmers can learn from each other and from their satisfactory experiences when the external extension is appropriate. The research in Yantzaza from the social dimension concluded in acceptable living conditions (from farmers’ perception) and a weak accumulation of social and human capital, which emphasizes the potential of farmers’ networks in the rural sectors. Basically, the social strategies will be oriented in order to improve the social networks and human skills (Stone and Hughes 2002).
In general terms, the analysis based on a review of the literature (Oerlemans and Assouline 2004, p. 470) shows that the principal problem to obtaining strong farmers’ networks are:
“Lack of coherence among members due to differences in perceptions and goals.
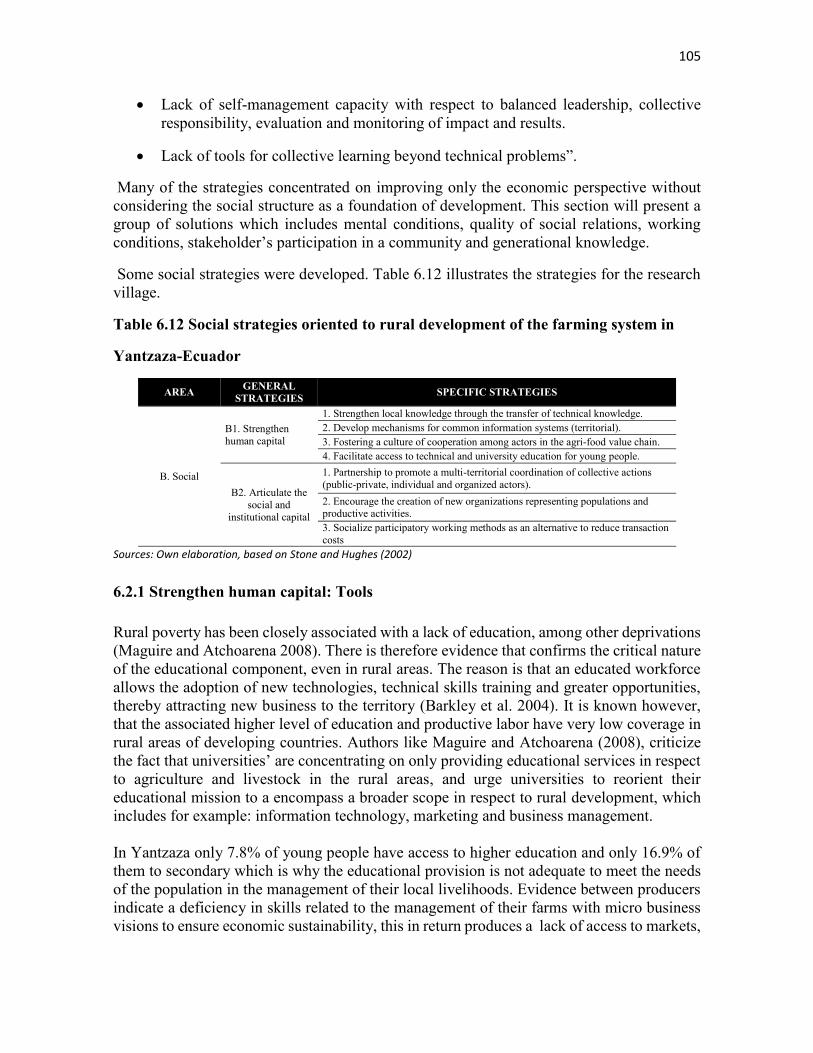
105
Lack of self-management capacity with respect to balanced leadership, collective responsibility, evaluation and monitoring of impact and results.
Lack of tools for collective learning beyond technical problems”.
Many of the strategies concentrated on improving only the economic perspective without considering the social structure as a foundation of development. This section will present a group of solutions which includes mental conditions, quality of social relations, working conditions, stakeholder’s participation in a community and generational knowledge.
Some social strategies were developed. Table 6.12 illustrates the strategies for the research village.
Table 6.12 Social strategies oriented to rural development of the farming system in
Yantzaza-Ecuador
AREA GENERAL STRATEGIES SPECIFIC STRATEGIES
B. Social
B1. Strengthen human capital
1. Strengthen local knowledge through the transfer of technical knowledge. 2. Develop mechanisms for common information systems (territorial). 3. Fostering a culture of cooperation among actors in the agri-food value chain. 4. Facilitate access to technical and university education for young people.
B2. Articulate the social and
institutional capital
1. Partnership to promote a multi-territorial coordination of collective actions (public-private, individual and organized actors). 2. Encourage the creation of new organizations representing populations and productive activities. 3. Socialize participatory working methods as an alternative to reduce transaction costs
Sources: Own elaboration, based on Stone and Hughes (2002)
6.2.1 Strengthen human capital: Tools
Rural poverty has been closely associated with a lack of education, among other deprivations (Maguire and Atchoarena 2008). There is therefore evidence that confirms the critical nature of the educational component, even in rural areas. The reason is that an educated workforce allows the adoption of new technologies, technical skills training and greater opportunities, thereby attracting new business to the territory (Barkley et al. 2004). It is known however, that the associated higher level of education and productive labor have very low coverage in rural areas of developing countries. Authors like Maguire and Atchoarena (2008), criticize the fact that universities’ are concentrating on only providing educational services in respect to agriculture and livestock in the rural areas, and urge universities to reorient their educational mission to a encompass a broader scope in respect to rural development, which includes for example: information technology, marketing and business management. In Yantzaza only 7.8% of young people have access to higher education and only 16.9% of them to secondary which is why the educational provision is not adequate to meet the needs of the population in the management of their local livelihoods. Evidence between producers indicate a deficiency in skills related to the management of their farms with micro business visions to ensure economic sustainability, this in return produces a lack of access to markets,

106
lack of innovation in products and processes that increase local participation and employment (UGT 2012). The strategies formulated tend to indirectly strengthen the human capital of rural producers in Yantzaza through facilitating coordinated spaces of collective action, where individual capabilities, the approach of public support services and the provision specific training services converge. 6.2.1.1 Participatory agricultural extension program [Farmer Field School (FFS)] A field school is a participatory method of agricultural extension (Zamorano et al. 2012). The term agricultural extension refers to the various activities of providing relevant information and advice to farmers and other people in agri-food systems and rural development (Escobar 2012). The main objective of the FFS as a participatory extension approach is to train change agents (farmers and facilitators), geared to the needs of communities to increase production and marketing of agricultural products with an Integrated Crop Management (Bustamante and Febres 2010). Anderson and Feder (2003) emphasize the importance of the state to make investments in agricultural extension services for rural development, as knowledge and extension services can be regarded as public goods. In particular, Latin America in recent years, expressed interest in repositioning the extension as a key tool for rural development through agricultural policies (Aguirre 2012), since extension contributes significantly to the expansion of the capabilities of farmers, integrating capabilities that they have accumulated in their local environment during the years of practice with new techniques that scientific experimental investigation finds. According to (Ardila 2010), empirical evidence suggests that the diversity of socio-economic starting conditions and capacities of the beneficiaries in the different areas of application do not allow a single method to standardize rural extension. Such complexity requires an experimental process that converges different levels of knowledge: scientific, expert/ technical, local, and experiential, surpassing the agricultural sector vision of rural development towards broader expectations of rural innovation (Benavides 2008). In Yantzaza it has been observed that the producers do not update their knowledge of new ways to increase agricultural productivity. Much of the knowledge that farmers apply come from a long process of population adaptation to the local environment. Another part comes from the requirement of commercial houses that provide inputs and only in very rare cases the producers were able to interact with extension agents to facilitate the integration of ancient wisdom with new techniques developed in the field of agricultural research. Additionally sectorization of extension services that have worked with concrete products such as coffee , cocoa and cattle , has not permitted integrative work which is known to ensure the resilience of farms as productive unit’s of family support. The strategy of bringing extension services to rural families aims to improve the overall management of the properties, processing, transportation and marketing. Table 6.13 summarizes the methodological implementation of this strategy.
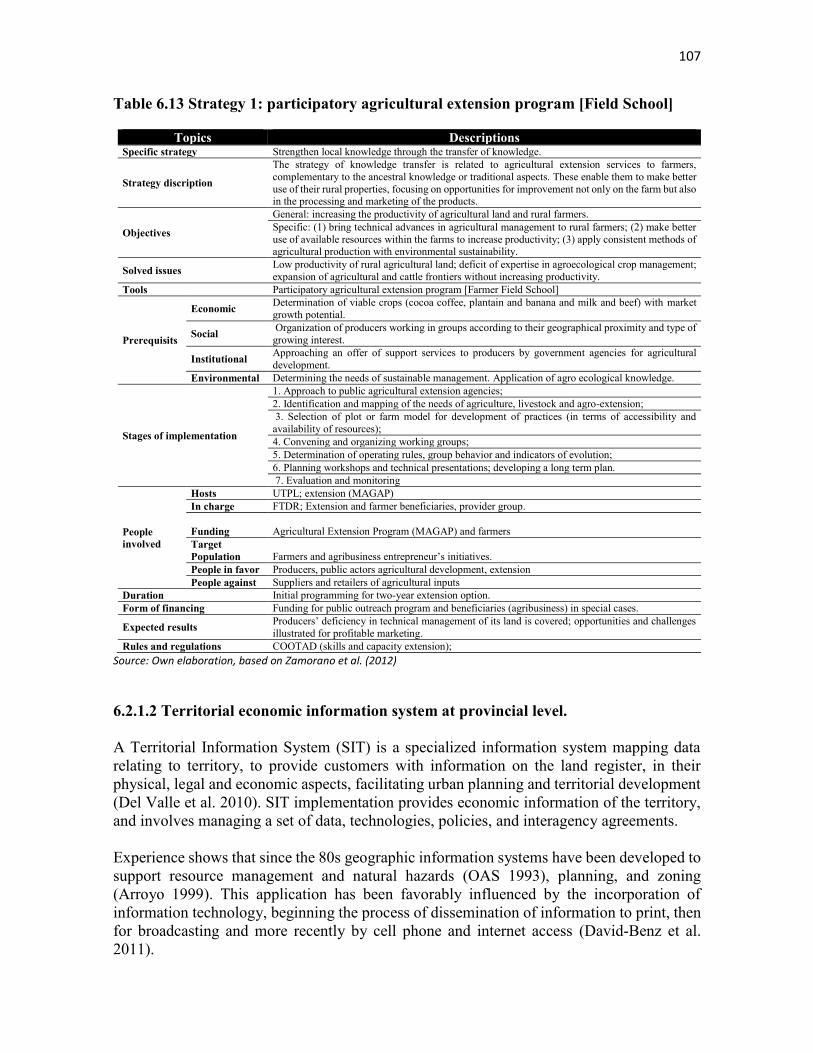
107
Table 6.13 Strategy 1: participatory agricultural extension program [Field School]
Topics Descriptions Specific strategy Strengthen local knowledge through the transfer of knowledge.
Strategy discription
The strategy of knowledge transfer is related to agricultural extension services to farmers, complementary to the ancestral knowledge or traditional aspects. These enable them to make better use of their rural properties, focusing on opportunities for improvement not only on the farm but also in the processing and marketing of the products.
Objectives
General: increasing the productivity of agricultural land and rural farmers. Specific: (1) bring technical advances in agricultural management to rural farmers; (2) make better use of available resources within the farms to increase productivity; (3) apply consistent methods of agricultural production with environmental sustainability.
Solved issues Low productivity of rural agricultural land; deficit of expertise in agroecological crop management; expansion of agricultural and cattle frontiers without increasing productivity.
Tools Participatory agricultural extension program [Farmer Field School]
Prerequisits
Economic Determination of viable crops (cocoa coffee, plantain and banana and milk and beef) with market growth potential.
Social Organization of producers working in groups according to their geographical proximity and type of growing interest.
Institutional Approaching an offer of support services to producers by government agencies for agricultural development.
Environmental Determining the needs of sustainable management. Application of agro ecological knowledge.
Stages of implementation
1. Approach to public agricultural extension agencies; 2. Identification and mapping of the needs of agriculture, livestock and agro-extension; 3. Selection of plot or farm model for development of practices (in terms of accessibility and availability of resources); 4. Convening and organizing working groups; 5. Determination of operating rules, group behavior and indicators of evolution; 6. Planning workshops and technical presentations; developing a long term plan. 7. Evaluation and monitoring
People involved
Hosts UTPL; extension (MAGAP) In charge FTDR; Extension and farmer beneficiaries, provider group. Funding Agricultural Extension Program (MAGAP) and farmers Target Population Farmers and agribusiness entrepreneur’s initiatives. People in favor Producers, public actors agricultural development, extension People against Suppliers and retailers of agricultural inputs
Duration Initial programming for two-year extension option. Form of financing Funding for public outreach program and beneficiaries (agribusiness) in special cases.
Expected results Producers’ deficiency in technical management of its land is covered; opportunities and challenges illustrated for profitable marketing.
Rules and regulations COOTAD (skills and capacity extension); Source: Own elaboration, based on Zamorano et al. (2012)
6.2.1.2 Territorial economic information system at provincial level. A Territorial Information System (SIT) is a specialized information system mapping data relating to territory, to provide customers with information on the land register, in their physical, legal and economic aspects, facilitating urban planning and territorial development (Del Valle et al. 2010). SIT implementation provides economic information of the territory, and involves managing a set of data, technologies, policies, and interagency agreements. Experience shows that since the 80s geographic information systems have been developed to support resource management and natural hazards (OAS 1993), planning, and zoning (Arroyo 1999). This application has been favorably influenced by the incorporation of information technology, beginning the process of dissemination of information to print, then for broadcasting and more recently by cell phone and internet access (David-Benz et al. 2011).
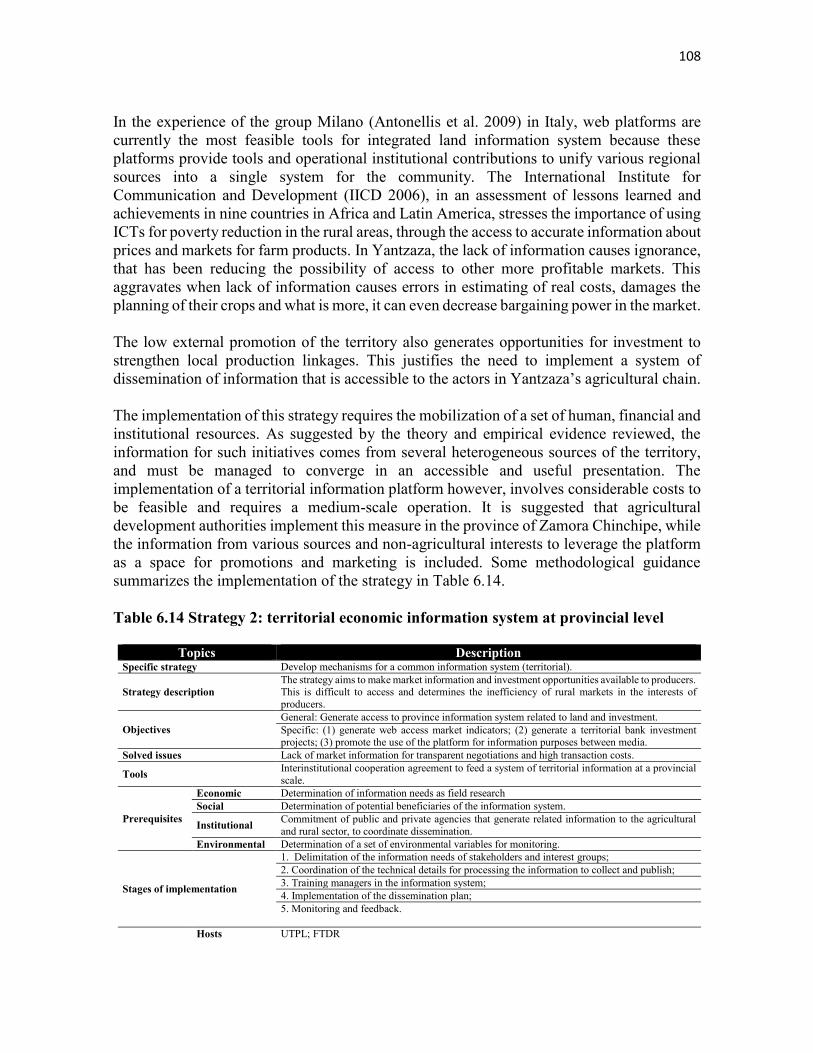
108
In the experience of the group Milano (Antonellis et al. 2009) in Italy, web platforms are currently the most feasible tools for integrated land information system because these platforms provide tools and operational institutional contributions to unify various regional sources into a single system for the community. The International Institute for Communication and Development (IICD 2006), in an assessment of lessons learned and achievements in nine countries in Africa and Latin America, stresses the importance of using ICTs for poverty reduction in the rural areas, through the access to accurate information about prices and markets for farm products. In Yantzaza, the lack of information causes ignorance, that has been reducing the possibility of access to other more profitable markets. This aggravates when lack of information causes errors in estimating of real costs, damages the planning of their crops and what is more, it can even decrease bargaining power in the market. The low external promotion of the territory also generates opportunities for investment to strengthen local production linkages. This justifies the need to implement a system of dissemination of information that is accessible to the actors in Yantzaza’s agricultural chain. The implementation of this strategy requires the mobilization of a set of human, financial and institutional resources. As suggested by the theory and empirical evidence reviewed, the information for such initiatives comes from several heterogeneous sources of the territory, and must be managed to converge in an accessible and useful presentation. The implementation of a territorial information platform however, involves considerable costs to be feasible and requires a medium-scale operation. It is suggested that agricultural development authorities implement this measure in the province of Zamora Chinchipe, while the information from various sources and non-agricultural interests to leverage the platform as a space for promotions and marketing is included. Some methodological guidance summarizes the implementation of the strategy in Table 6.14. Table 6.14 Strategy 2: territorial economic information system at provincial level
Topics Description Specific strategy Develop mechanisms for a common information system (territorial).
Strategy description The strategy aims to make market information and investment opportunities available to producers. This is difficult to access and determines the inefficiency of rural markets in the interests of producers.
Objectives General: Generate access to province information system related to land and investment. Specific: (1) generate web access market indicators; (2) generate a territorial bank investment projects; (3) promote the use of the platform for information purposes between media.
Solved issues Lack of market information for transparent negotiations and high transaction costs.
Tools Interinstitutional cooperation agreement to feed a system of territorial information at a provincial scale.
Prerequisites
Economic Determination of information needs as field research Social Determination of potential beneficiaries of the information system.
Institutional Commitment of public and private agencies that generate related information to the agricultural and rural sector, to coordinate dissemination.
Environmental Determination of a set of environmental variables for monitoring.
Stages of implementation
1. Delimitation of the information needs of stakeholders and interest groups; 2. Coordination of the technical details for processing the information to collect and publish; 3. Training managers in the information system; 4. Implementation of the dissemination plan; 5. Monitoring and feedback.
Hosts UTPL; FTDR
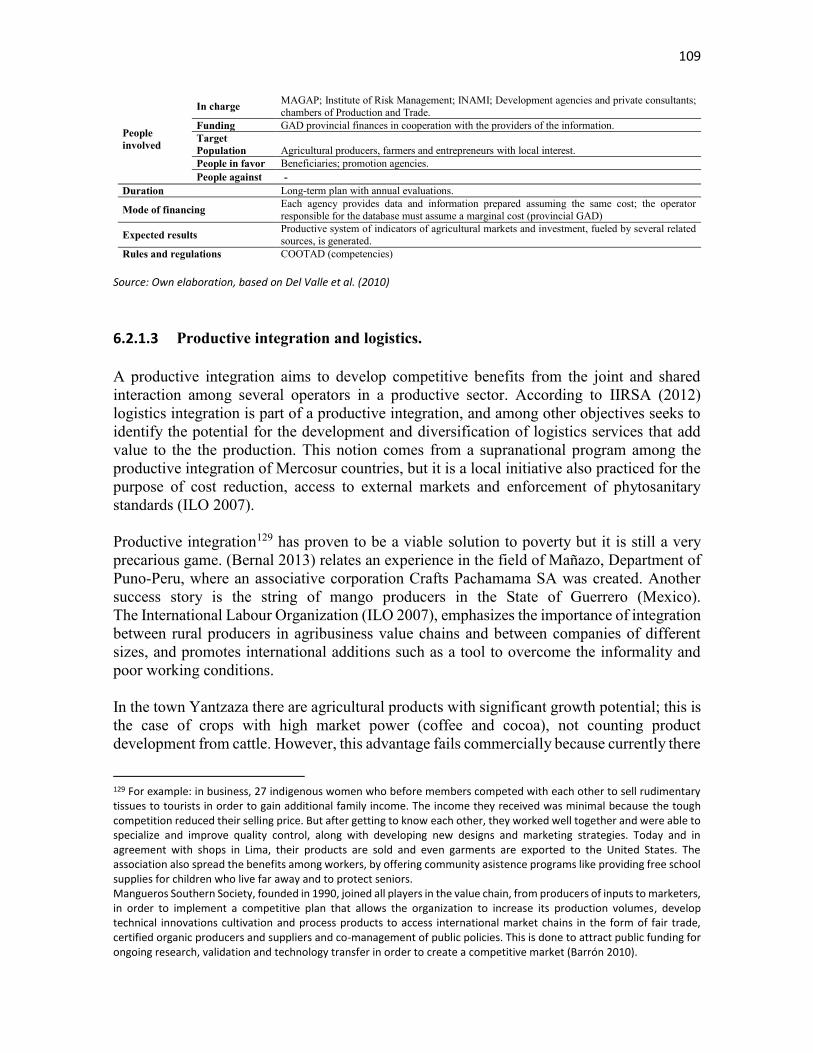
109
People involved
In charge MAGAP; Institute of Risk Management; INAMI; Development agencies and private consultants; chambers of Production and Trade.
Funding GAD provincial finances in cooperation with the providers of the information. Target Population Agricultural producers, farmers and entrepreneurs with local interest. People in favor Beneficiaries; promotion agencies. People against -
Duration Long-term plan with annual evaluations.
Mode of financing Each agency provides data and information prepared assuming the same cost; the operator responsible for the database must assume a marginal cost (provincial GAD)
Expected results Productive system of indicators of agricultural markets and investment, fueled by several related sources, is generated.
Rules and regulations COOTAD (competencies) Source: Own elaboration, based on Del Valle et al. (2010)
6.2.1.3 Productive integration and logistics. A productive integration aims to develop competitive benefits from the joint and shared interaction among several operators in a productive sector. According to IIRSA (2012) logistics integration is part of a productive integration, and among other objectives seeks to identify the potential for the development and diversification of logistics services that add value to the the production. This notion comes from a supranational program among the productive integration of Mercosur countries, but it is a local initiative also practiced for the purpose of cost reduction, access to external markets and enforcement of phytosanitary standards (ILO 2007). Productive integration129 has proven to be a viable solution to poverty but it is still a very precarious game. (Bernal 2013) relates an experience in the field of Mañazo, Department of Puno-Peru, where an associative corporation Crafts Pachamama SA was created. Another success story is the string of mango producers in the State of Guerrero (Mexico). The International Labour Organization (ILO 2007), emphasizes the importance of integration between rural producers in agribusiness value chains and between companies of different sizes, and promotes international additions such as a tool to overcome the informality and poor working conditions. In the town Yantzaza there are agricultural products with significant growth potential; this is the case of crops with high market power (coffee and cocoa), not counting product development from cattle. However, this advantage fails commercially because currently there
129 For example: in business, 27 indigenous women who before members competed with each other to sell rudimentary tissues to tourists in order to gain additional family income. The income they received was minimal because the tough competition reduced their selling price. But after getting to know each other, they worked well together and were able to specialize and improve quality control, along with developing new designs and marketing strategies. Today and in agreement with shops in Lima, their products are sold and even garments are exported to the United States. The association also spread the benefits among workers, by offering community asistence programs like providing free school supplies for children who live far away and to protect seniors. Mangueros Southern Society, founded in 1990, joined all players in the value chain, from producers of inputs to marketers, in order to implement a competitive plan that allows the organization to increase its production volumes, develop technical innovations cultivation and process products to access international market chains in the form of fair trade, certified organic producers and suppliers and co-management of public policies. This is done to attract public funding for ongoing research, validation and technology transfer in order to create a competitive market (Barrón 2010).

110
is no social cohesion due to cultural and historical factors in the Ecuadorian Amazon. The integration of the various actors in productive value chains prepares the conditions for improving the productive capacity of farmers and other actors in the value chain. Table 6.15 shows the methodology to be developed. Table 6.15 Strategy 3: Productive integration and logistics
Topics Description Specific strategy Fostering a culture of cooperation among actors in the agrifood value chain. Strategy description Reduce the transaction costs, reduce idleness of machinery through sharing, and take
advantage of economies of scale and market access on more competitive terms.
Objectives
General: Improve the culture of cooperation from farmers, to generate equitable community benefits. Specific: (1) Display the inclusive and equitable opportunities for cooperation between actors in the value chain; (2) generate the commitment to cooperation between actors in the value chain; (3) accompany the process of coordination between actors in the initial phase of the project.
Solved issues High transaction costs and low competitiveness of the local food chain. Tools Production integration and logistics.
Previous economic requirements
Economic Characterization of productive territory and recognition of the value chains with growth potential.
Social Mapping of stakeholders in the value chain and organizational structure.
Institutional Commitment of public authority’s support of the productive sector and provincial GAD MAGAP.
Environmental Characterization of environmental impacts on the various links in the value chain. Stages of implementation
1. Definition and characterization of the area of influence; 2. Required field work with farmers. 3. Proposed projects and activities and impact assessment in developing the area of influence; 4. Recommendations for an indicative action plan; 5. Dissemination of the indicative action plan for implementation and promotion.
6. Evaluation and feedback.
People involved
Hosts UTPL; GAD´s; FTDR In charge Consultant appointed and actors in the selected value chains.
Funding Logistics during the preparation of the Plan: Local GAD. In the implementation phase: chain actors in value.
Traget population Chain actors and other agri-food value chains with potential for long term growth. People in favor Beneficiaries, developers and animators. People against
Duration A calendar year. Mode of financing Public except for specific services to individual links in the value chain.
Expected results The actors in the food chain share costs, equipment and infrastructure; local value chain more competitive.
Rules and regulations Production code; Law of popular economy and solidarity. Source: Own elaboration, based on IIRSA (2012)
6.2.1.4 Continuous distance training program for rural farmers Numerous studies in the field of Economics of Education corroborate the contribution of this service to poverty mitigation and economic development (Lassibille and Navarro 2012). According to Becker (1994), human capital, taken as a tool for economic development, depends on the skills developed by people through education and work experience. In Mexico, an assessment presents education itself as an effective mechanism to help people overcome rural food poverty, capability poverty and asset poverty (Ordaz 2009). In Latin America, (Raygada 2003) highlights the efforts of countries like Peru, Mexico and Costa Rica, in the provision of tele-virtual spaces to reach young people in rural areas who otherwise would not have access to educational services because of physical and economic barriers. In the field of higher education, Maguire and Atchoarena (2008) mention the experience of the Zamorano University in Honduras; Bunda College in Malawi; National
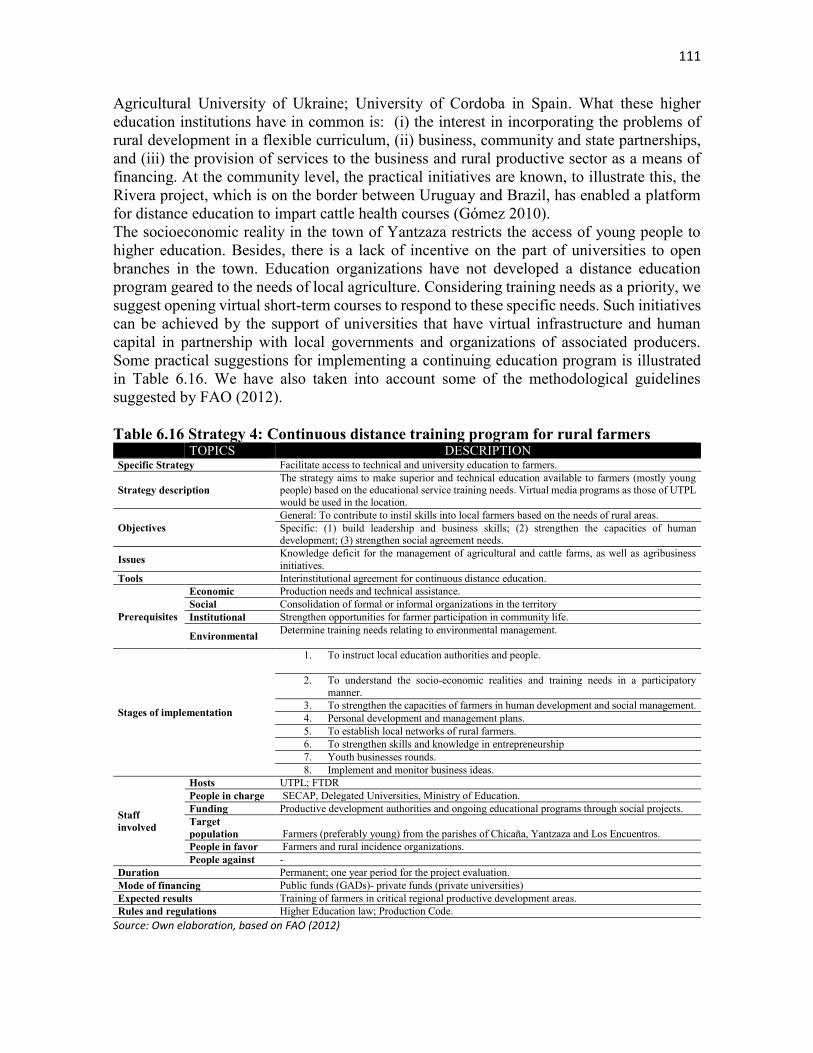
111
Agricultural University of Ukraine; University of Cordoba in Spain. What these higher education institutions have in common is: (i) the interest in incorporating the problems of rural development in a flexible curriculum, (ii) business, community and state partnerships, and (iii) the provision of services to the business and rural productive sector as a means of financing. At the community level, the practical initiatives are known, to illustrate this, the Rivera project, which is on the border between Uruguay and Brazil, has enabled a platform for distance education to impart cattle health courses (Gómez 2010). The socioeconomic reality in the town of Yantzaza restricts the access of young people to higher education. Besides, there is a lack of incentive on the part of universities to open branches in the town. Education organizations have not developed a distance education program geared to the needs of local agriculture. Considering training needs as a priority, we suggest opening virtual short-term courses to respond to these specific needs. Such initiatives can be achieved by the support of universities that have virtual infrastructure and human capital in partnership with local governments and organizations of associated producers. Some practical suggestions for implementing a continuing education program is illustrated in Table 6.16. We have also taken into account some of the methodological guidelines suggested by FAO (2012). Table 6.16 Strategy 4: Continuous distance training program for rural farmers TOPICS DESCRIPTION Specific Strategy Facilitate access to technical and university education to farmers.
Strategy description The strategy aims to make superior and technical education available to farmers (mostly young people) based on the educational service training needs. Virtual media programs as those of UTPL would be used in the location.
Objectives General: To contribute to instil skills into local farmers based on the needs of rural areas. Specific: (1) build leadership and business skills; (2) strengthen the capacities of human development; (3) strengthen social agreement needs.
Issues Knowledge deficit for the management of agricultural and cattle farms, as well as agribusiness initiatives.
Tools Interinstitutional agreement for continuous distance education.
Prerequisites
Economic Production needs and technical assistance. Social Consolidation of formal or informal organizations in the territory Institutional Strengthen opportunities for farmer participation in community life.
Environmental Determine training needs relating to environmental management.
Stages of implementation
1. To instruct local education authorities and people.
2. To understand the socio-economic realities and training needs in a participatory manner.
3. To strengthen the capacities of farmers in human development and social management. 4. Personal development and management plans. 5. To establish local networks of rural farmers. 6. To strengthen skills and knowledge in entrepreneurship 7. Youth businesses rounds. 8. Implement and monitor business ideas.
Staff involved
Hosts UTPL; FTDR People in charge SECAP, Delegated Universities, Ministry of Education. Funding Productive development authorities and ongoing educational programs through social projects. Target population Farmers (preferably young) from the parishes of Chicaña, Yantzaza and Los Encuentros. People in favor Farmers and rural incidence organizations. People against -
Duration Permanent; one year period for the project evaluation. Mode of financing Public funds (GADs)- private funds (private universities) Expected results Training of farmers in critical regional productive development areas. Rules and regulations Higher Education law; Production Code.
Source: Own elaboration, based on FAO (2012)

112
6.2.1.5 Personal agency program and intrinsic empowerment (community health developers) The model of health promotion, hygiene, and nutrition in rural communities based on personal agency and intrinsic empowerment of its people was applied in Mexico under the form of workshops for selected participants geared to develop skills and psychosocial competencies that promote behavior change (Pick et al. 2011)130. In California, for instance, community health developers applied a variant using domestic care services (intermediaries between public health systems and beneficiaries), acting in defense of the beneficiaries (Keane et al. 2004). In Latin America, community health developers’ programs have also been adopted; one of these successful examples is the “Four- Leaf Clover131“in the town of Sobral, Ceará region, Brazil (Bernal 2013). Thanks to the good relationship among public health workers, community developers and beneficiaries, the results are outstanding (Keane et al. 2004). In Peru, for example, the correlation between the results of public health workers and those of rural developers in the diagnosis of malaria in 419 patients was evaluated, concluding that the rapid tests of the rural developers have around 70% concordance with the results obtained by physicians (Cabezas et al. 2004). Although Yantzaza has an appropriate indicator for the assessment of health in our research, rural communities still need help. Seasonal disease is a common feature. In the suburbs of the town, access to health services is difficult for people who only come to the clinic when symptoms are acute. Although there is no data associated with mortality due to inconvenient access to health, it can provide a program of community workers to prevent and assist the rural population in nutrition and health. It significantly contributes to the welfare of the most vulnerable population in the region: women, children and elderly.
Table 6.17 Strategy 5: Personal agency program and intrinsic empowerment
(community health developers) Topics Description Specific strategy Generate assistance and prevention programs for Yantzaza farmers.
Strategy description Methodology based on experiential, reflective and participatory education; considering group learning through playful strategies.
Objectives General: To change food and health habits in people living in rural communities around Yantzaza through the development of psychosocial skills and knowledge to promote personal agency and intrinsic empowerment.
130 This model has variations in the way that content is delivered to recipients, but the principles of personal agency and empowerment are intrinsic components remaining in the design of most programs designed for similar purposes. 131 In this project, for example, health authorities found that the main causes for high perinatal morbidity in poor rural communities were because the mothers did not always have the ability and knowledge to identify a risk to warrant medical advice, nor had a social support network beyond the family unit, due to their precarious socio- economic situation. So public authorities decided to train mothers in the community to detect cases of risk, report and accompany the mother and family during the risk period. Social mothers were paid for by the health service during family exercise times during pregnancy, the postpartum period and during the first years of the child’s life when more supervision is needed. The program succeeded in reducing the rate of maternal and infant mortality. Now Sobral has levels that are below the national average and the Ministry of Health is considering making it public policy for the country. (Bernal 2013)

113
Specific: (1) to transfer knowledge related to eating habits and prevention; (2) to develop health prevention skills and good nutrition habits; (3) timely detection and reporting of disease among the population.
Issues Nutrition problems and recurring and predictable seasonal diseases among the peripheral population.
Tools Model for health promotion in rural communities through the development of personal agency and intrinsic empowerment.
Prerequisites
Economic Creation of municipal funding to finance the logistical costs of the program.
Social Selecting a group of potential community developers.
Institutional Determine public health programs and pre-establish prevention campaigns. Environmental Determine a schedule of common diseases caused by climate and seasonal changes.
Stages of implementation
1. Interinstitutional coordination between people and institutions, 2. Diagnosis of health and nutrition in the community; 3. Determination of a training plan for community leaders; 4. Knowledge transfer in experiential workshops; 5. Socialization of teaching materials; 6. Developing of an agenda for evaluation of results and impact indicators.
Staff involved
Hosts UTPL; MIES, FTDR; Ministry of Public Health (MSP) People in charge
Community leaders, developers, MSP
Funding MSP, co MIES, Ecuadorian Social Security Institute (IESS) Target population Mothers and adolescents in these rural communities People in favor Beneficiaries People against -
Duration 1-year. It can be renewed depending on results. Mode of financing Program subsidized by the government and its decentralized institutions.
Expected results Mothers, adolescents and children adopt healthier behaviors and practices improving their nutrition and quality of life; further, they shared their knowledge with the rest of their families.
Rules and regulations Public health policy of Ecuador. Source: Own elaboration, based on Pick et al. (2011)
6.2.2 Social and institutional link: tools
Social structure in the rural regions is an organizational process, a form of governance, and a mode to link stakeholders and regulate interactions among them. This procedure takes place within the local territory.
Based on the sustainable development concept, research includes the social dimension of sustainability. However, many definitions have been considered. “Social capital is defined as the networks of social relations characterized by norms of trust and reciprocity that can improve the efficiency of society by facilitating coordinated actions” (North 1991, p.100). Significant value is attributed to the social structure in sustainability when the associations allow good results in the productivity of the community.
In order to be successful with the collective action, regulations or norms are required in this proposal. Also, networks that facilitate the collective action permit increased efficiency. The social capital concept includes horizontal and vertical analyses. The first one refers to associative action in the communities. However, the second one talks about the capacity to leverage resources, ideas and information from institutions beyond the community as necessary to link social capital (Woolcock 2001).
Hence, social strategies need social structure and institutional support in the activities. A set of strategies related with these concepts will be considered in this section. Yantzaza could have an excellent opportunity to improve the local social structure if it applies some tools and strategies.
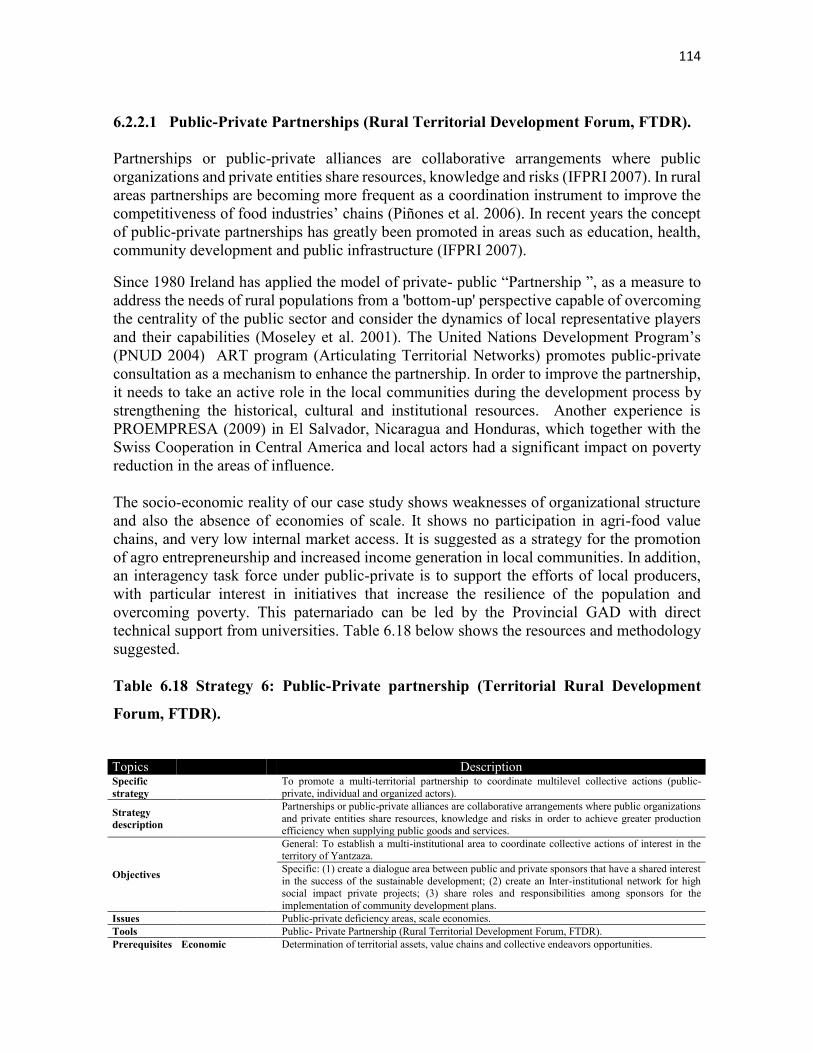
114
6.2.2.1 Public-Private Partnerships (Rural Territorial Development Forum, FTDR). Partnerships or public-private alliances are collaborative arrangements where public organizations and private entities share resources, knowledge and risks (IFPRI 2007). In rural areas partnerships are becoming more frequent as a coordination instrument to improve the competitiveness of food industries’ chains (Piñones et al. 2006). In recent years the concept of public-private partnerships has greatly been promoted in areas such as education, health, community development and public infrastructure (IFPRI 2007).
Since 1980 Ireland has applied the model of private- public “Partnership ”, as a measure to address the needs of rural populations from a 'bottom-up' perspective capable of overcoming the centrality of the public sector and consider the dynamics of local representative players and their capabilities (Moseley et al. 2001). The United Nations Development Program’s (PNUD 2004) ART program (Articulating Territorial Networks) promotes public-private consultation as a mechanism to enhance the partnership. In order to improve the partnership, it needs to take an active role in the local communities during the development process by strengthening the historical, cultural and institutional resources. Another experience is PROEMPRESA (2009) in El Salvador, Nicaragua and Honduras, which together with the Swiss Cooperation in Central America and local actors had a significant impact on poverty reduction in the areas of influence. The socio-economic reality of our case study shows weaknesses of organizational structure and also the absence of economies of scale. It shows no participation in agri-food value chains, and very low internal market access. It is suggested as a strategy for the promotion of agro entrepreneurship and increased income generation in local communities. In addition, an interagency task force under public-private is to support the efforts of local producers, with particular interest in initiatives that increase the resilience of the population and overcoming poverty. This paternariado can be led by the Provincial GAD with direct technical support from universities. Table 6.18 below shows the resources and methodology suggested. Table 6.18 Strategy 6: Public-Private partnership (Territorial Rural Development
Forum, FTDR).
Topics Description Specific strategy
To promote a multi-territorial partnership to coordinate multilevel collective actions (public-private, individual and organized actors).
Strategy description
Partnerships or public-private alliances are collaborative arrangements where public organizations and private entities share resources, knowledge and risks in order to achieve greater production efficiency when supplying public goods and services.
Objectives
General: To establish a multi-institutional area to coordinate collective actions of interest in the territory of Yantzaza. Specific: (1) create a dialogue area between public and private sponsors that have a shared interest in the success of the sustainable development; (2) create an Inter-institutional network for high social impact private projects; (3) share roles and responsibilities among sponsors for the implementation of community development plans.
Issues Public-private deficiency areas, scale economies. Tools Public- Private Partnership (Rural Territorial Development Forum, FTDR). Prerequisites Economic Determination of territorial assets, value chains and collective endeavors opportunities.

115
Source: Own elaboration, based on IFPRI (2007)
6.2.2.2 Method SUMA132 for strengthening grassroots organizations.
Grassroots development according to CODESPA (2013) is defined as a change in the community produced by participatory self-help initiatives. This process plays an important role in strengthening the capacity of organizations to enable auto-convened collectively defined needs, identify viable action alternatives, formulate and implement projects and programs, and to assess their achievements and difficulties.
Strengthening rural grassroots organizations is a prerequisite for rural development initiatives. FIDAMERICA (2008) describes the experience with 15,000 families in the state of Pernambuco, Brazil that led to a massive empowerment of community organizations. The World Bank also as a part of the efforts to work together for development, has driven processes of strengthening grassroots organizations. In the Philippines this measure would have been helpful during the 1980s for the independent collection and management of public funds, that allowed the execution of critical projects in Central Visayas in order to better 132 In recent years, the Public-Private Partnership for Development has been positioned as a strategy in which not only financial resources but also technical knowledge and experience from different fields and different actors are combined to achieve more effective and sustainable results for the development of communities of scarce resources. With a duration of five years, the SUMA project was a practical experience made up of public and private actors from Spain, Peru and Guatemala. Formed by the Spanish Agency for International Cooperation for Development (AECID), CODESPA Foundation, Los Andes Association of Cajamarca (ALAC), Unacem Association, the Inter-American Foundation (IAF) and the Pantaleón Foundation. The association sought to improve the socio-economic situation and the quality of life of the Productive Base Organizations through the development of capacities, the increase of their income and the creation or consolidation of jobs within these organizations. The alliance operated under the creation of an Investment Fund for Development (FID), which was conceived as a non-reimbursable competitive fund to co-finance productive and income-generating projects of grassroots productive organizations in the urban poor and rural. The objective of SUMA was to strengthen the entrepreneurial culture and develop business management skills. To this end, SUMA designed and developed a competitive bottom methodology that was tested and adapted (FIDAMERICA 2013).
Social Identification and prioritization of vulnerable groups in the communities. Institutional Mapping public actors (institutional sponsors) with influence in the rural areas of the territory. Environmental Map that displays environmental risks associated with the communal productive use.
Stages of implementation
1. Identification of a common interest - on the part of the actors; 2. Contract negotiations, including financing and legal aspects as well as the organizational design (public-private); 3. Functioning according to the planned objectives; 4. Evaluation; 5. Completion or continuation of the alliance.
Staff involved
Hosts
UTPL, community leaders, GADs. People in charge Provincial GAD and UTPL. Funding Autonomous Decentralized Government (GAD), companies and international cooperation. Target population Emerging social entrepreneurs. People in favor Local people, entrepreneurs. People against -
Duration One year for diagnosis. Four years of political coordination with possible extension depending on projects.
Mode of financing
Co-financing. Public institutions will finance the collective installation of actors’ stage, and private institutions will finance the individual installation stage.
Expected results
We expect to have an autonomous entity that allows the development of the region sharing farmers viewing align with private entrepreneurship. In Yantzaza, the productive base will be mainly farming and livestock considering crops as an added value.
Rules and regulations
COOTAD (competencies of the sector's public agencies), Commercial Code (forms of contracting), LEPS (vulnerable groups’ organization).
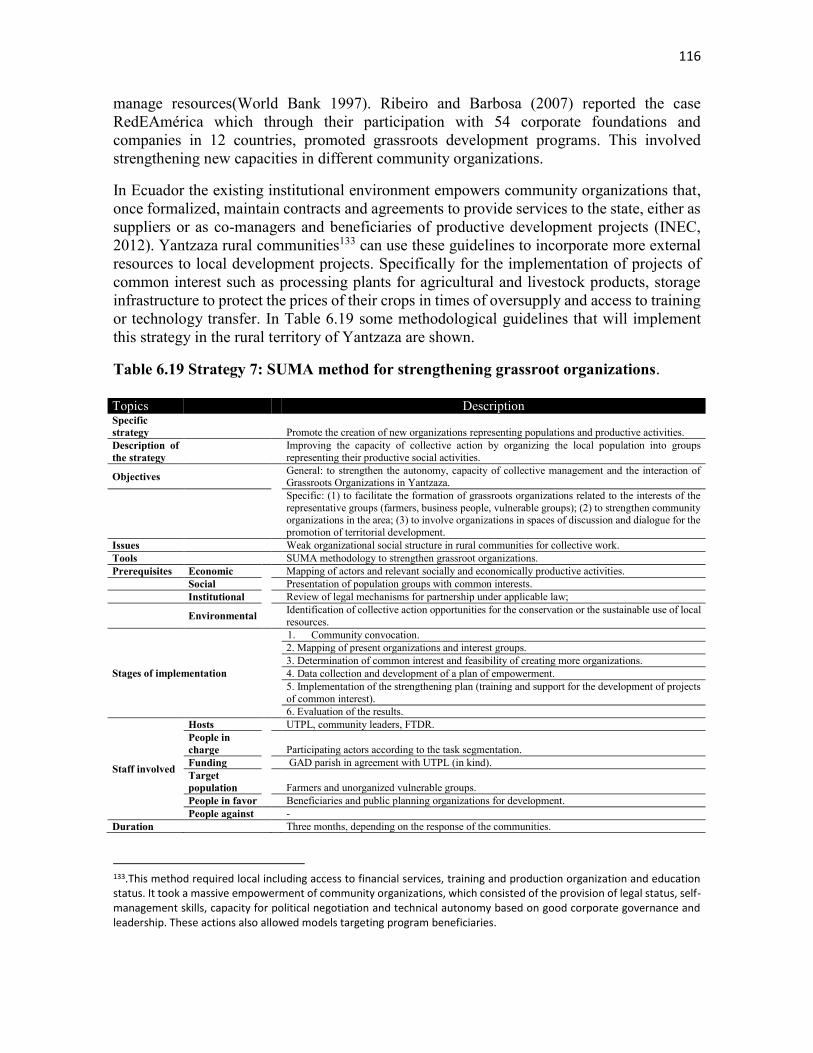
116
manage resources(World Bank 1997). Ribeiro and Barbosa (2007) reported the case RedEAmérica which through their participation with 54 corporate foundations and companies in 12 countries, promoted grassroots development programs. This involved strengthening new capacities in different community organizations.
In Ecuador the existing institutional environment empowers community organizations that, once formalized, maintain contracts and agreements to provide services to the state, either as suppliers or as co-managers and beneficiaries of productive development projects (INEC, 2012). Yantzaza rural communities133 can use these guidelines to incorporate more external resources to local development projects. Specifically for the implementation of projects of common interest such as processing plants for agricultural and livestock products, storage infrastructure to protect the prices of their crops in times of oversupply and access to training or technology transfer. In Table 6.19 some methodological guidelines that will implement this strategy in the rural territory of Yantzaza are shown.
Table 6.19 Strategy 7: SUMA method for strengthening grassroot organizations.
133.This method required local including access to financial services, training and production organization and education status. It took a massive empowerment of community organizations, which consisted of the provision of legal status, self-management skills, capacity for political negotiation and technical autonomy based on good corporate governance and leadership. These actions also allowed models targeting program beneficiaries.
Topics Description Specific strategy
Promote the creation of new organizations representing populations and productive activities. Description of the strategy
Improving the capacity of collective action by organizing the local population into groups representing their productive social activities.
Objectives
General: to strengthen the autonomy, capacity of collective management and the interaction of Grassroots Organizations in Yantzaza.
Specific: (1) to facilitate the formation of grassroots organizations related to the interests of the representative groups (farmers, business people, vulnerable groups); (2) to strengthen community organizations in the area; (3) to involve organizations in spaces of discussion and dialogue for the promotion of territorial development.
Issues Weak organizational social structure in rural communities for collective work. Tools SUMA methodology to strengthen grassroot organizations. Prerequisites Economic
Mapping of actors and relevant socially and economically productive activities. Social Presentation of population groups with common interests. Institutional Review of legal mechanisms for partnership under applicable law;
Environmental Identification of collective action opportunities for the conservation or the sustainable use of local resources.
Stages of implementation
1. Community convocation. 2. Mapping of present organizations and interest groups. 3. Determination of common interest and feasibility of creating more organizations. 4. Data collection and development of a plan of empowerment. 5. Implementation of the strengthening plan (training and support for the development of projects of common interest). 6. Evaluation of the results.
Staff involved
Hosts
UTPL, community leaders, FTDR. People in charge Participating actors according to the task segmentation. Funding GAD parish in agreement with UTPL (in kind). Target population Farmers and unorganized vulnerable groups. People in favor Beneficiaries and public planning organizations for development. People against -
Duration Three months, depending on the response of the communities.
117
Source: Own compilation based on CODESPA (2013) and Raygada (2003)
6.2.2.3 Participatory process methodology of agricultural innovation Participatory Rural Innovation (IRP) is a strategy to support rural producers which prioritizes the development and stimulates the capabilities and skills of farmers based on their own knowledge. In Colombia, for instance, this policy has led to the creation of small farmers’ businesses, known as Technology-Based Companies, producing clean seeds and bio-products, and of associative and processing companies that commercialize the crops of their members. Furthermore, small farmers are responsible for increasing this acquired knowledge in other locations and for spreading the results of their research among their peers using academic, research and technical means (Pérez and Clavijo 2012).
After an assessment of the determinants of success of 46 rural development projects in the region of Chiapas, Mexico, Arreola et al. (2009) made an important observation. They concluded that, among other determinants, the mechanism of collective discussion and the analysis of problems that occur in the daily operation of organizations allow the scaling of product innovations and processes with greater transparency and commitment from the participants. Another related experience took place in the region of Ribeirão Preto, Brazil, where since 2004 in a town called Sepé Tiaraju, an agro-ecological conversion process started to ensure food security and sovereignty of the region. This process was greatly facilitated by the massive participation of farmers in the research and innovation to adapt crops to soil quality. This agro-ecological conversion would not have been possible if the producers had undertaken it individually because the experiments were very expensive (Ramos et al. 2010). In Bolivia, the importance of participatory action to deal, through a process of dialogue and interaction, with different actors in the system and the gaps also existing in the innovation system in rural areas was also highlighted. The expertise revised by participatory innovation revealed the importance of the combined participation of the technical agencies with producers in order to generate appropriate knowledge on management of resources in specific territories. This cooperation is not only to meet the immediate objectives, it also strengthens the inter-institutional and inter-communal linkages so as to achieve innovations and related projects gradually. The foregoing evidence suggests, that in order to improve the work that Yantzaza rural producers do on their farms and also to improve local social cohesion and bonds with agricultural promotion agencies, new approaches are necessary. In undertaking participatory innovation joint projects resources could be used reasonably to avoid making the same investment in neighboring communities while facilitating the use of surpluses in later stages of the food chain. Table 6.20 illustrates the procedure in the Yantzaza area.
Mode of financing
Process partially funded by the Parish GAD. Expected results
To form at least one organization in each community and to strengthen the established ones to present formally to groups with similar interests.
Rules and regulations
Law of Popular and Solidarity Economy, Civil Code and COOTAD.

118
Table 6.20 Strategy 8: Participatory process methodology of agricultural innovation
Source: Own elaboration, based on Pérez and Clavijo (2012)
6.3 Environmental and agro-ecological strategies of the area
Tabla 6.21 Environmental and agro-ecological strategies of the area
ÁREA GENERAL STRATEGIES SPECIFIC STRATEGIES
C. Environment
C1. Boost territorial management
1. Promote a territorial management plan in Yantzaza through the use of participatory methods while including rural communities.
C2. Improve conservation practices
1. Improve the chemical and physical state of the soil (conservation practice) 2.Manage the agro-forest systems better 3. Promote wáter conservation. 4. Train in the production of organic fertilizers.
C3. Training producers
1. Promote cooperative projects between the Universities and the research institutes in order to share knowledge and technologies associated with managing the soil. Smartland-UTPL 2. Coordinate a participatory conservation plan for natural resources (crop rotation, food security, harvesting and after harvest, transformation of products).
Topics Description Specific strategy
To apply participatory working methods as an alternative in order to reduce transaction costs
Strategy description
The strategy aims to make explicit the benefits of partnership work for economic development in rural area. It also aims to improve the willingness among participants to undertake collective projects in order to enhance the competitiveness in new community agribusiness.
Objectives
General: to enhance the willingness of producers from Yantzaza to initiate projects based on experiences of successful partnerships. Specific: (1) to diagnose in a participatory way opportunities for associative business; (2) to achieve agreements for collaboration among agricultural value chains actors; (3) to find ways to share risks and transaction costs in a value chain.
Issues High transaction costs and difficulties for investment in agribusiness. Tools Methodology for participatory processes of agricultural innovation.
Prerequisites
Economic
Delimitation of production chains. Social Training and communication. Institutional Strengthening of grassrout organizations. Environmental Mapping of resources with potential sustainable use.
Stages of implementation
1. Calls for community workshops. 2. Exhibition of cases of successful partnerships in value chains related to the local ones; 3. Identification of opportunities to adapt experiences and to improve local processes. 4. Determination of new rural entrepreneurship association opportunities. 5. Design of an accompanying plan for concerted projects. 6. Implementation and feedback.
Staff involved
Hosts
FTDR; UTPL; Parish GADs. People in charge UTPL; community leaders. Funding Parish GADs. Target population Current value chains’ actors; people interested in new community associative enterprises.
People in favor Beneficiaries, independent workers; chain actors convinced of the viability of the associative business.
People against Actors along the value chain obtaining benefits unequally.
Duration One year depending on project success.
Mode of financing
Cofinancing between parish GADs (public infrastructure), local communities (labor and seed money with associative credits) and UTPL (in kind, training and research process).
Expected results
Greater cooperation is expected between the farmers and livestock farmers in specific activities that reduce transaction costs and the competitiveness of its food chain; Community agro business venture is also expected.
Rules and regulations
Law of Popular and Solidarity Economy; COOTAD; civil code.
119
6.3.1 Boosting territorial management
6.3.1.1 Promoting a territorial management plan in Yantzaza through the use of participatory methods while including rural communities.
The Development and Territorial Ordering Plan by Zamora Chinchipe’s Provincial Government manages the conservation and touristic development of the territory (PDYOT 2012). This plan is followed as a part of the national planning system (Senplades 2016). Nevertheless, it should be summarized as a participatory ordering process to solve problems like: the deficient agrarian structure, lack of employment opportunities, low quality machinery, little economic diversification, devalueing of agrarian activities and the aging of agricultural workers (Gastó et al. 1997).
The linkage between territorial management and the thematic areas of regional action are developed in hopes of solving large problems like poverty and equity, productivity, environmental conservation, preventing natural disasters, participation and efficiency in public politics (Montes 2001b). The territorial studies from the communal perspective are characterized by knowing the meaning and value of natural resources. They help to create systems based on the possible uses of territories while establishing restrictions or priorities in accordance to specific characteristics of conservation and use. In addition, they are characterized by the knowledge of the environment in order to assess the environmental impact of development plans, programs and projects, and to study the environment in one place in order to improve the conditions or the best use of resources. Between all that, there is the restoration of degraded areas, the fitness for reforestation, building public works, or ordering a plot or property (Gastó 1994).
The challenge is based on the need to integrate sustainability criteria in the economic and social plan for the national and regional areas. This involves evaluating the endowment of natural resources and environmental services as fundamental elements in the consideration of territorial areas. The proposal is directed toward the quantitative and qualitative evaluation of the physical and biological base of economic and social development. This form of articulation permits the construction of different territorial ordering scenarios that reflect the true socio-economic costs and benefits in respect to the alternative use of natural, social, and technological alternatives (Montes 2001a). This plan should characterize the territory very well (Lamotte 1985), grouping the rural systems’ dimensions into six categories: geography, human sciences, plant ecology, geomorphology, soil sciences and theoretical and methodological foundations of the ecosystem. In Yantzaza it is essential that these systems emphasize critical nodes. In accordance with the plan, development should cover themes within the pre-established categories. Yantzaza should equalize conservation with usage in order to maintain sustainable development. Then, data collection should align to supporting institutions like Universities which would allow transparency and technical rigor. Being able to clearly identify the relative position would be a substantial input in this plan. It would locate the study’s territory in accordance with its’ external position within the country as if it were from the same. It is necessary to know some of the physical
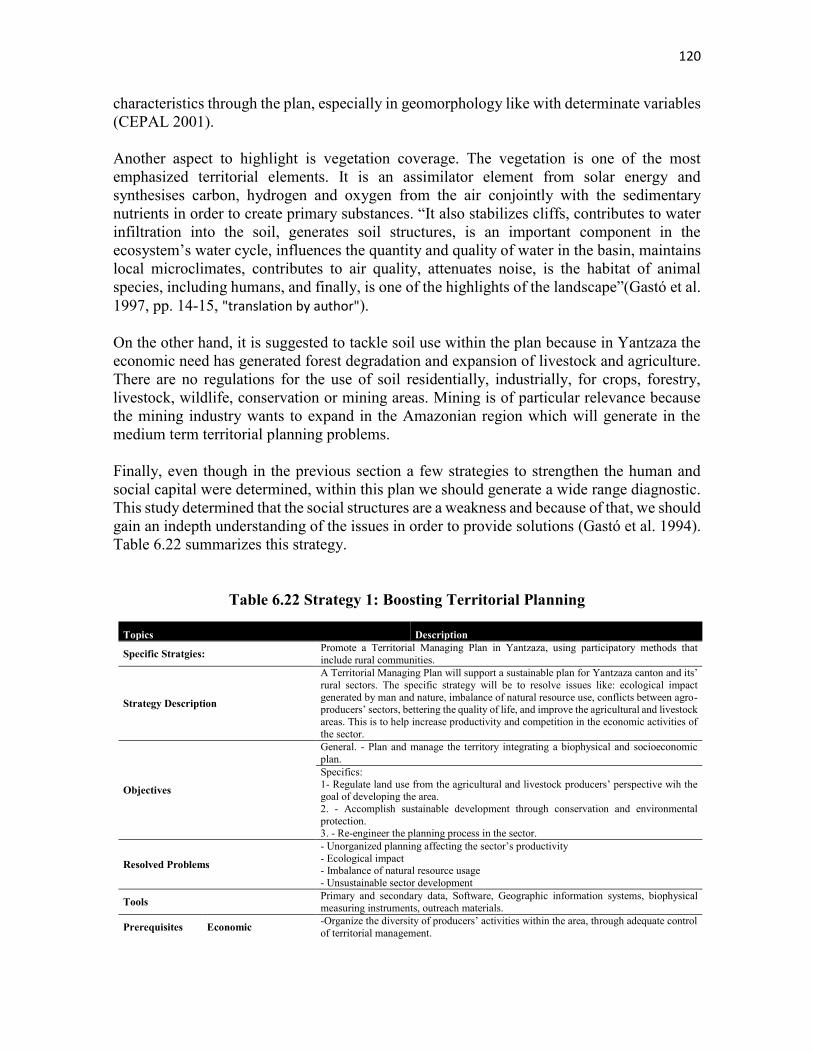
120
characteristics through the plan, especially in geomorphology like with determinate variables (CEPAL 2001). Another aspect to highlight is vegetation coverage. The vegetation is one of the most emphasized territorial elements. It is an assimilator element from solar energy and synthesises carbon, hydrogen and oxygen from the air conjointly with the sedimentary nutrients in order to create primary substances. “It also stabilizes cliffs, contributes to water infiltration into the soil, generates soil structures, is an important component in the ecosystem’s water cycle, influences the quantity and quality of water in the basin, maintains local microclimates, contributes to air quality, attenuates noise, is the habitat of animal species, including humans, and finally, is one of the highlights of the landscape”(Gastó et al. 1997, pp. 14-15, "translation by author"). On the other hand, it is suggested to tackle soil use within the plan because in Yantzaza the economic need has generated forest degradation and expansion of livestock and agriculture. There are no regulations for the use of soil residentially, industrially, for crops, forestry, livestock, wildlife, conservation or mining areas. Mining is of particular relevance because the mining industry wants to expand in the Amazonian region which will generate in the medium term territorial planning problems. Finally, even though in the previous section a few strategies to strengthen the human and social capital were determined, within this plan we should generate a wide range diagnostic. This study determined that the social structures are a weakness and because of that, we should gain an indepth understanding of the issues in order to provide solutions (Gastó et al. 1994). Table 6.22 summarizes this strategy.
Table 6.22 Strategy 1: Boosting Territorial Planning
Topics Description
Specific Stratgies: Promote a Territorial Managing Plan in Yantzaza, using participatory methods that include rural communities.
Strategy Description
A Territorial Managing Plan will support a sustainable plan for Yantzaza canton and its’ rural sectors. The specific strategy will be to resolve issues like: ecological impact generated by man and nature, imbalance of natural resource use, conflicts between agro-producers’ sectors, bettering the quality of life, and improve the agricultural and livestock areas. This is to help increase productivity and competition in the economic activities of the sector.
Objectives
General. - Plan and manage the territory integrating a biophysical and socioeconomic plan. Specifics: 1- Regulate land use from the agricultural and livestock producers’ perspective wih the goal of developing the area. 2. - Accomplish sustainable development through conservation and environmental protection. 3. - Re-engineer the planning process in the sector.
Resolved Problems
- Unorganized planning affecting the sector’s productivity - Ecological impact - Imbalance of natural resource usage - Unsustainable sector development
Tools Primary and secondary data, Software, Geographic information systems, biophysical measuring instruments, outreach materials.
Prerequisites Economic -Organize the diversity of producers’ activities within the area, through adequate control of territorial management.

121
-Mantain adequate information of producers’ diversified activities that develop within Yantzaza’s territory.
Social -Socioeconomic inclusion of rural communities for land use planning. - Linking rural comunities with governmental groups.
Institutional - Public Institutions like GAD-Yantzaza and SENPLADES, MAGAP, MAE etc.) that are available to support the producers in compliance with their agreement.
Environmental - Delineate the agricultural borders and suitable areas for cultivation and production. - Determine the special characteristics of distinct soil types and allocate them for the most viable activities.
Execution Stages
- Prepare and organize workshops and conferences. - Participatory discussions with residents of different communities - Collect surveys - Collect data in the field - Apply geographic information systems - Create maps for sustainable territorial management - Create handouts with the information - Disseminate the results within the communities
Stakeholders
Supporters GAD-Yantzaza, SENPLADES, MIES, MAGAP; MAE; UTPL, Responsilble Parties Respresentatives of GAD-Yantzaza’s Planning,
Financing It is parcially financed by Senplades and the GAD-Yantzaza for the adequate planning and managing of rural territory.
Execution Organized producers and participating institutions to start the production. Target Population (beneficiaries) Organized producers with territorial organization problems.
People In Favor Members of social collectives and people from universities responsible for caring for the environment, and rural producer beneficiaries that want adequately managed territories.
People Who Oppose People involved in activites that contaminate the soil. External Beneficiaries Transportation industry; microfinance; workers (laborers); vulnerable groups. Affected By Externalities Conventional producers.
Duration One year. Expected Results Territorial Management Plan integrating biophysics and socioeconomic needs.
Rules and Norms Strategic zone plan and changing the agricultural production model in the Plan of Good Living 2013-2017.
Source: Own elaboration, based on Gasto (1997)
6.3.2 Improving conservation practices
6.3.2.1 Improving the physical-chemical soil characteristics (conservation practices)
The Ecuadorian Amazon is characterized by vegetation that is predominately dense tropical forests, exceptionally adapted to the altitude and shallow soils due to rugged terrain. The vegetation maintains litters and very dense horizons in high altitude but these areas are partially transforming into crops and pastures (Custode and Sourdat 1986) The main cause of land degradation in Latin America is deforestation. In 1985, the speed of annual deforestation of the humid tropics in Latin America was 2.5-2.8 millions of hectare a year (Melillo et al. 1985), while in the Amazon it was 1.2 millons of hectacres a year and was associated with subsistence farming and the increase of pastures and livestock (Hecht 1982). At least in Yantzaza, to date, the conditions have continued to be similar. The main challenge for Yantzaza is how to assure the agricultural-livestock sustainability in the areas in which humans intervene, given the inability of people to maintain balance
122
between soil resistance and the forces that degrade them; produced once the forest areas can be deforested (Amezquita 1998). We know from this study that the physical, chemical and biological degradation of the soils is produced basically by the inappropriate use of land, deforestation, poverty, and ecosystem depletion. It should be taken into consideration that the soils differ enormously in their ability to recover. In some soil, it is possible to rapidly increase the productivity levels, but also, rapidly dereases its production capacity. Sustainability is achieved if the ground is handled properly. Amezquita (1998) shows the degenerative processes in the Amazonian region that are occuring in our study area. These processes are accelerated erosion, compacting soil, anaerobic nitrogen fertiliztion deficit, acidification, salinization, and biological degradation. It is imperative to understand the soil’s resilience134 in the Amazon in order to practice adequate land management strategies. This strategy will focus on creating the so-called topsoil, which is the superficial topsoil planned and obtained by man with the purpose of obtaining a soil that does not have physical, chemical or biological limits, for the normal development of the crops’ roots and that would be unalterable throughout time. The depth of this soil can vary between 0-15 cm for pastures, 0-25 cm for grains and legumes, and 0-40 cm for permanent crops (Amezquita 1998). This topsoil can develop through the combination of tillage that tends to correct physical limitations, with good use of fertilizers that correct the chemical condition that reaches the desired depths, and with the practical management of organic fertilizers and plant residue that favor biostructure formation. This way we can have a significant topsoil and the development of suatinable argiculture. For physical improvement the apparent high density and high resistance to soil penetration should be improved using vertical tillaging which permits the deep breach of the soil. Then after the soil has been lightened, it is necessary to maintain it through the planting of pastures or crops of a radical system or through the addition of fragmented straws that maintain the condition reached during the tillage. As for the chemical improvement, it should include correcting the soil to the depth at which the soil reeves, in the amount determined by the soil analysis and the corresponding details. Adding nutrients needed for good yields is elementary, and ensures the formation of a lot of external and internal biomass that also improves the soil. 134 “This concept which is vaguely defined, but accepted as a soil attribute, refers to the soils’ ability to resist the stress or to recover to its intial condition even after it has beeen tampered with by the engineering man. The term “resilience” is the elastic limit of a body. The limit to which you can arrive without destruction. The elasticity of the soil involves concepts as important as the ability to “buffer” the soil in order to resist and survive physical, chemical and biological impacts.” Szabolcs (1994).
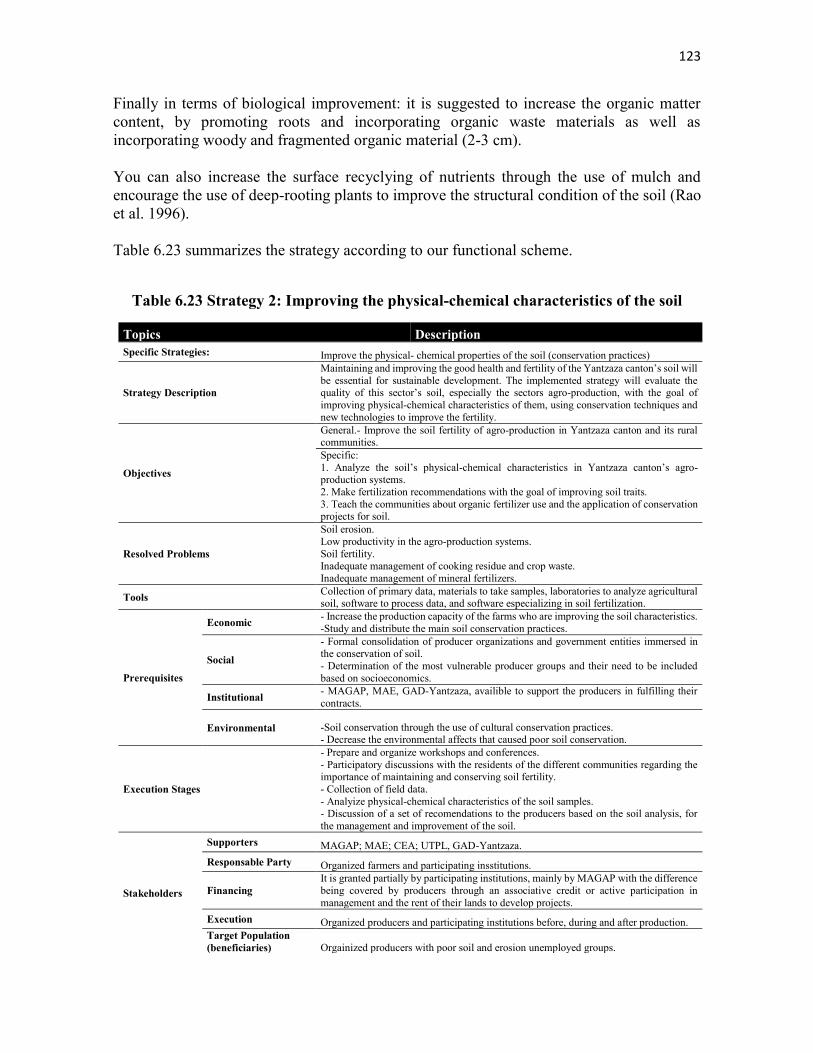
123
Finally in terms of biological improvement: it is suggested to increase the organic matter content, by promoting roots and incorporating organic waste materials as well as incorporating woody and fragmented organic material (2-3 cm). You can also increase the surface recyclying of nutrients through the use of mulch and encourage the use of deep-rooting plants to improve the structural condition of the soil (Rao et al. 1996). Table 6.23 summarizes the strategy according to our functional scheme.
Table 6.23 Strategy 2: Improving the physical-chemical characteristics of the soil
Topics Description Specific Strategies: Improve the physical- chemical properties of the soil (conservation practices)
Strategy Description
Maintaining and improving the good health and fertility of the Yantzaza canton’s soil will be essential for sustainable development. The implemented strategy will evaluate the quality of this sector’s soil, especially the sectors agro-production, with the goal of improving physical-chemical characteristics of them, using conservation techniques and new technologies to improve the fertility.
Objectives
General.- Improve the soil fertility of agro-production in Yantzaza canton and its rural communities. Specific: 1. Analyze the soil’s physical-chemical characteristics in Yantzaza canton’s agro-production systems. 2. Make fertilization recommendations with the goal of improving soil traits. 3. Teach the communities about organic fertilizer use and the application of conservation projects for soil.
Resolved Problems
Soil erosion. Low productivity in the agro-production systems. Soil fertility. Inadequate management of cooking residue and crop waste. Inadequate management of mineral fertilizers.
Tools Collection of primary data, materials to take samples, laboratories to analyze agricultural soil, software to process data, and software especializing in soil fertilization.
Prerequisites
Economic - Increase the production capacity of the farms who are improving the soil characteristics. -Study and distribute the main soil conservation practices.
Social
- Formal consolidation of producer organizations and government entities immersed in the conservation of soil. - Determination of the most vulnerable producer groups and their need to be included based on socioeconomics.
Institutional - MAGAP, MAE, GAD-Yantzaza, availible to support the producers in fulfilling their contracts.
Environmental -Soil conservation through the use of cultural conservation practices. - Decrease the environmental affects that caused poor soil conservation.
Execution Stages
- Prepare and organize workshops and conferences. - Participatory discussions with the residents of the different communities regarding the importance of maintaining and conserving soil fertility. - Collection of field data. - Analyize physical-chemical characteristics of the soil samples. - Discussion of a set of recomendations to the producers based on the soil analysis, for the management and improvement of the soil.
Stakeholders
Supporters MAGAP; MAE; CEA; UTPL, GAD-Yantzaza. Responsable Party Organized farmers and participating insstitutions.
Financing It is granted partially by participating institutions, mainly by MAGAP with the difference being covered by producers through an associative credit or active participation in management and the rent of their lands to develop projects.
Execution Organized producers and participating institutions before, during and after production. Target Population (beneficiaries) Orgainized producers with poor soil and erosion unemployed groups.
124
People In Favor Responsible members that care for the environment, motivated producers with high agricultural production.
People Who Oppose People involved in environmental contamination, like conventional producers.
External Beneficiaries Transportation industry; microfinances; workers (laborers); vulnerable groups, better the environment.
Affected by Externalities Conventional producers.
Duration One year.
Expected Results Fertile soil. Community knowledge about the management of soil.
Rules and Norms Instruct the general norm to promote and regulate the organic, ecological and biological production in Ecuador
Source: Own elaboration, based on Amezquita (1998)
6.3.2.2 Improved management of agro-forest systems
“Agro-forestry is the generic name used to describe a widely practiced antiquated land use system, in which the trees are spacially combined and/or temporarally with animals and/or with agricultural crops. This permits there to be a combination of elements that permit sustainable production” (Farrell and Altieri 1999, p. 229, "translation by author") Important characteristics of this system include a structure that combines trees, crops and animals: besides optimizing the beneficial effects of those interactions, they are generating a sustainable system. Other advantages are the increased productivity and the socioeconomic adaptability. Their potential has been recognized particularly for the small agricultural producers in marginal and impoverished tropical and subtropical areas. This reason is basically why this is proposed for Yantzaza (Farrell and Altieri 1999b) Those systems cooperate in the solution of the cited agroecological problems from our study. The trees increase the soil fertility, improving their structure and decreasing the erosion process. The fixation of nitrogen, needed in Yantzaza, satisfies those systems. The depth of the tree roots, the main activity of the macro and micro fauna and erosion control are supportive things in those systems. In order to have nutrients recycled the management of grasses accompanied by trees and bushes is suggested to permit a significant fraction of extracted nutrients to be returned to the soil through the deposition, on the soil surface, from the foliage and from grazing and pruning residues (Mahecha and Zoot 2002). Nitrogen fixation can improve the soil through the presence of legumes that are associated with Rhyzobium bacteria in order to capture nitrogen from the atmosphere making it available to the grasses in the soil. We can reach the average fixation of 200 kg N/ha/year. Another aspect to consider is the depth of the tree roots that facilitate the deposition of organic material, nutrient concentration, cation exchange capacity and soil stabilization (Farrell and Altieri 1999).
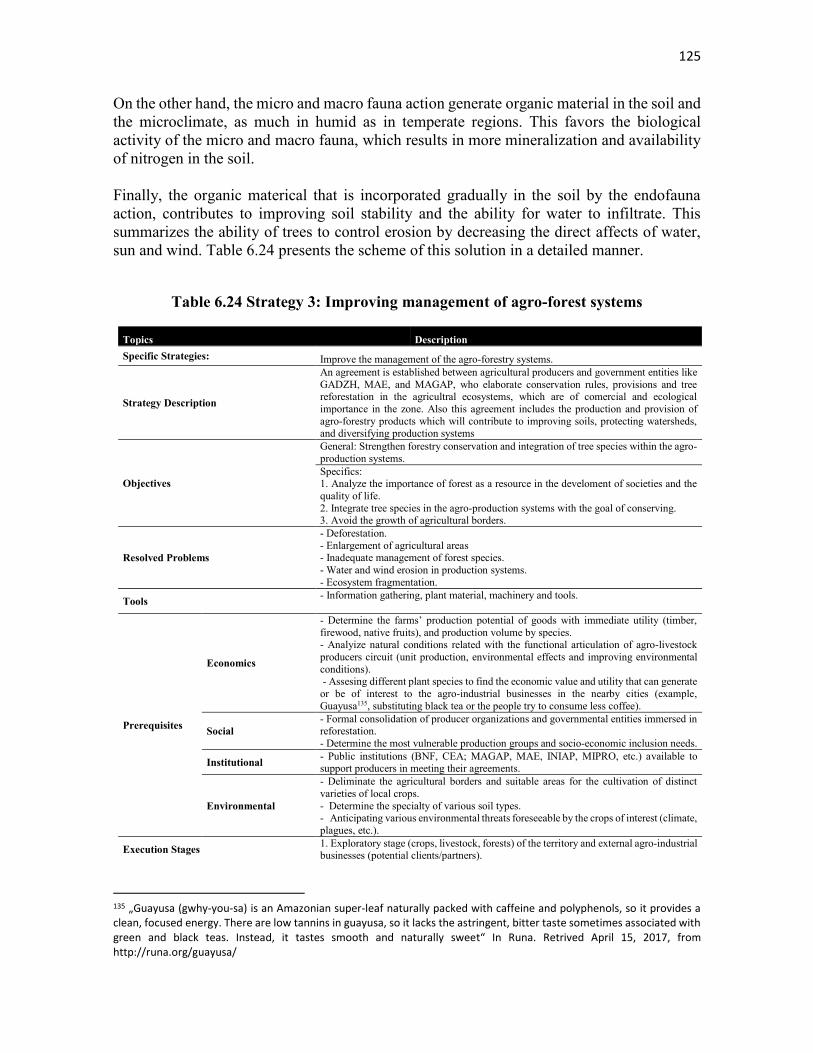
125
On the other hand, the micro and macro fauna action generate organic material in the soil and the microclimate, as much in humid as in temperate regions. This favors the biological activity of the micro and macro fauna, which results in more mineralization and availability of nitrogen in the soil. Finally, the organic materical that is incorporated gradually in the soil by the endofauna action, contributes to improving soil stability and the ability for water to infiltrate. This summarizes the ability of trees to control erosion by decreasing the direct affects of water, sun and wind. Table 6.24 presents the scheme of this solution in a detailed manner.
Table 6.24 Strategy 3: Improving management of agro-forest systems
Topics Description Specific Strategies: Improve the management of the agro-forestry systems.
Strategy Description
An agreement is established between agricultural producers and government entities like GADZH, MAE, and MAGAP, who elaborate conservation rules, provisions and tree reforestation in the agricultral ecosystems, which are of comercial and ecological importance in the zone. Also this agreement includes the production and provision of agro-forestry products which will contribute to improving soils, protecting watersheds, and diversifying production systems
Objectives
General: Strengthen forestry conservation and integration of tree species within the agro-production systems. Specifics: 1. Analyze the importance of forest as a resource in the develoment of societies and the quality of life. 2. Integrate tree species in the agro-production systems with the goal of conserving. 3. Avoid the growth of agricultural borders.
Resolved Problems
- Deforestation. - Enlargement of agricultural areas - Inadequate management of forest species. - Water and wind erosion in production systems. - Ecosystem fragmentation.
Tools - Information gathering, plant material, machinery and tools.
Prerequisites
Economics
- Determine the farms’ production potential of goods with immediate utility (timber, firewood, native fruits), and production volume by species. - Analyize natural conditions related with the functional articulation of agro-livestock producers circuit (unit production, environmental effects and improving environmental conditions). - Assesing different plant species to find the economic value and utility that can generate or be of interest to the agro-industrial businesses in the nearby cities (example, Guayusa135, substituting black tea or the people try to consume less coffee).
Social - Formal consolidation of producer organizations and governmental entities immersed in reforestation. - Determine the most vulnerable production groups and socio-economic inclusion needs.
Institutional - Public institutions (BNF, CEA; MAGAP, MAE, INIAP, MIPRO, etc.) available to support producers in meeting their agreements.
Environmental
- Deliminate the agricultural borders and suitable areas for the cultivation of distinct varieties of local crops. - Determine the specialty of various soil types. - Anticipating various environmental threats foreseeable by the crops of interest (climate, plagues, etc.).
Execution Stages 1. Exploratory stage (crops, livestock, forests) of the territory and external agro-industrial businesses (potential clients/partners).
135 „Guayusa (gwhy-you-sa) is an Amazonian super-leaf naturally packed with caffeine and polyphenols, so it provides a clean, focused energy. There are low tannins in guayusa, so it lacks the astringent, bitter taste sometimes associated with green and black teas. Instead, it tastes smooth and naturally sweet“ In Runa. Retrived April 15, 2017, from http://runa.org/guayusa/

126
2. The producer and the entities involved agree on the terms and conditions to obtain forest species, the sowing and future management of the crops, as well as the destination. 3. The buyer along with the marketing arrangements agrees to supply selected inputs, including, at times, the land preparation and technical assistance or technology transfer. 4. The grower agrees to follow recommended production methods, input regimes, and specifications on growing and harvesting procedures.
5. Production performance.
6. Monitoring and feedback from the company and extension involved (if any).
Stakeholders
Supporters MIES, MAGAP; MAE; UTPL [or the responsable delegate for the Municipal Rural Development Forum].
Responsible Party Organized farmers and participating institutions.
Financing It is funded partially by participating institutions and the rest is covered by producers through associative credit or participating as active management and renting their land for project development.
Execution Organized producers and participating institutions, during the production time. Target Population (beneficiaries) Organized producers with problems with poor soil and erosion; unemployed groups.
People In Favor Responsible members who care for the environment, motivated producers with sustainable alternatives.
People Who Oppose People involved in timber smuggling. External Beneficiaries Transportation industry; microfinances; workers (laborers); vulnerable groups. Affected by Externalities Middlemen, timber smugglers.
Duration Being an agroforestry system, mainly perennials, it will take at least 2 years until it is developed.
Expected Results
Products with added value of the property such as: timber, firewood, poles, fences, fruit (naranjilla, cocoa, coffee), medicinal and native plants, production of flowers, honey, pollination, among others. Improve local ecological conditions: reduced erosion, increased organic matter, and nutrient recycling movement, microclimates, presence of beneficial insects, etc. General environmental benefits: CO2 fixation, buffer zones, agro-productive plant diversity, less risk of erosion and landslides, and biodiversity
Rules and Norms Strategic zone plan and agricultural production model change, in the Good Living Plan 2013-2017.
Source: Own elaboration, based on Farrell and Altieri (1999).
6.3.2.3 Strengthening water conservation
The Amazonia basin is a large portion of the tropical region and of South American rivers, where a large amount of fresh water is located. At the same time an excessive use of natural resources, deforestation and the expansion of agricultural land are occurring there. Fresh water is lost from deforestation, soil erosion, general contamination- Yantzaza’s case- and by urbanization. Fundamentally the future mining activity that is thought of developing in the province of Zamora Chinchipe would be able to produce grave effects on water (Bucher et al. 1997). Water management should be identified and prioritized in order to preserve water. According to the Ecuadorian Constitution and the local norms water is the priority that identifies highly sensitive zones and avoids human intervention. Thus, there should be demanded a plan for watershed of Yantzaza, that would be related to social needs. On the other hand, water management plans should be coordinated between local and national authorities, mechanisms and instruments for pollution control and reduction of environmental impacts. This also includes zoning priority conservation areas where catchments are situated. All these ideas should build on participatory processes (Lopez 2010).
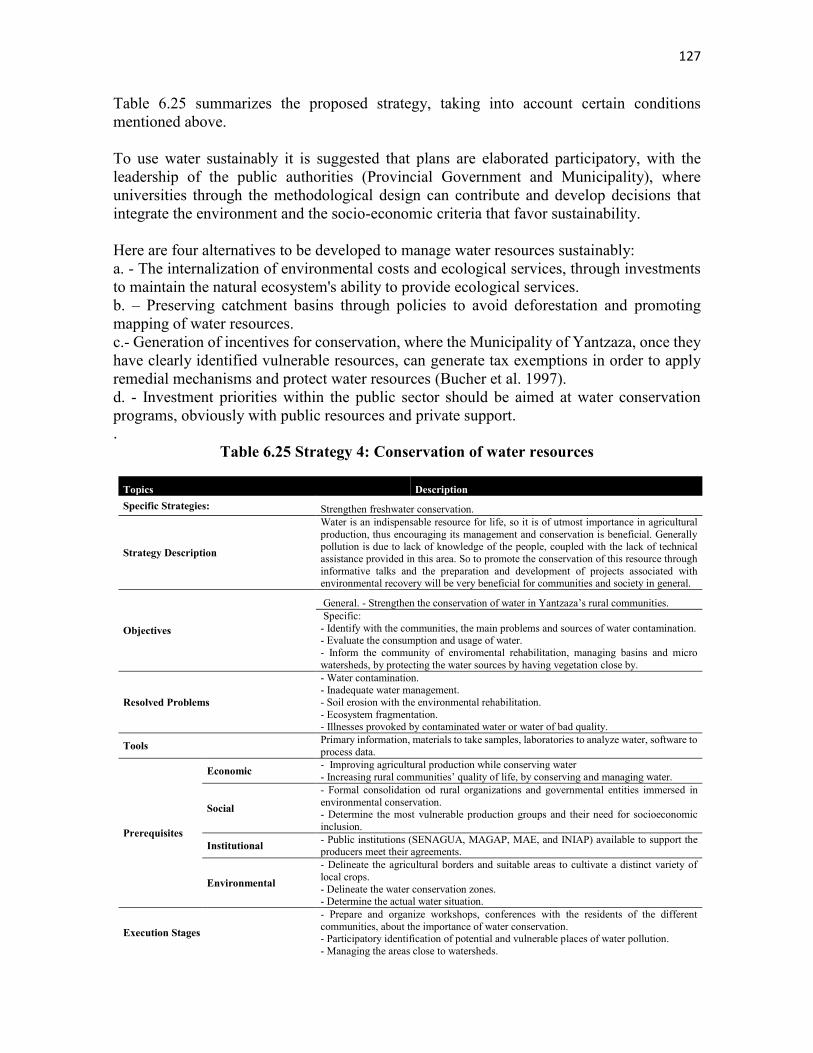
127
Table 6.25 summarizes the proposed strategy, taking into account certain conditions mentioned above. To use water sustainably it is suggested that plans are elaborated participatory, with the leadership of the public authorities (Provincial Government and Municipality), where universities through the methodological design can contribute and develop decisions that integrate the environment and the socio-economic criteria that favor sustainability. Here are four alternatives to be developed to manage water resources sustainably: a. - The internalization of environmental costs and ecological services, through investments to maintain the natural ecosystem's ability to provide ecological services. b. – Preserving catchment basins through policies to avoid deforestation and promoting mapping of water resources. c.- Generation of incentives for conservation, where the Municipality of Yantzaza, once they have clearly identified vulnerable resources, can generate tax exemptions in order to apply remedial mechanisms and protect water resources (Bucher et al. 1997). d. - Investment priorities within the public sector should be aimed at water conservation programs, obviously with public resources and private support. .
Table 6.25 Strategy 4: Conservation of water resources
Topics Description Specific Strategies: Strengthen freshwater conservation.
Strategy Description
Water is an indispensable resource for life, so it is of utmost importance in agricultural production, thus encouraging its management and conservation is beneficial. Generally pollution is due to lack of knowledge of the people, coupled with the lack of technical assistance provided in this area. So to promote the conservation of this resource through informative talks and the preparation and development of projects associated with environmental recovery will be very beneficial for communities and society in general.
Objectives
General. - Strengthen the conservation of water in Yantzaza’s rural communities. Specific: - Identify with the communities, the main problems and sources of water contamination. - Evaluate the consumption and usage of water. - Inform the community of enviromental rehabilitation, managing basins and micro watersheds, by protecting the water sources by having vegetation close by.
Resolved Problems
- Water contamination. - Inadequate water management. - Soil erosion with the environmental rehabilitation. - Ecosystem fragmentation. - Illnesses provoked by contaminated water or water of bad quality.
Tools Primary information, materials to take samples, laboratories to analyze water, software to process data.
Prerequisites
Economic - Improving agricultural production while conserving water - Increasing rural communities’ quality of life, by conserving and managing water.
Social
- Formal consolidation od rural organizations and governmental entities immersed in environmental conservation. - Determine the most vulnerable production groups and their need for socioeconomic inclusion.
Institutional - Public institutions (SENAGUA, MAGAP, MAE, and INIAP) available to support the producers meet their agreements.
Environmental
- Delineate the agricultural borders and suitable areas to cultivate a distinct variety of local crops. - Delineate the water conservation zones. - Determine the actual water situation.
Execution Stages
- Prepare and organize workshops, conferences with the residents of the different communities, about the importance of water conservation. - Participatory identification of potential and vulnerable places of water pollution. - Managing the areas close to watersheds.
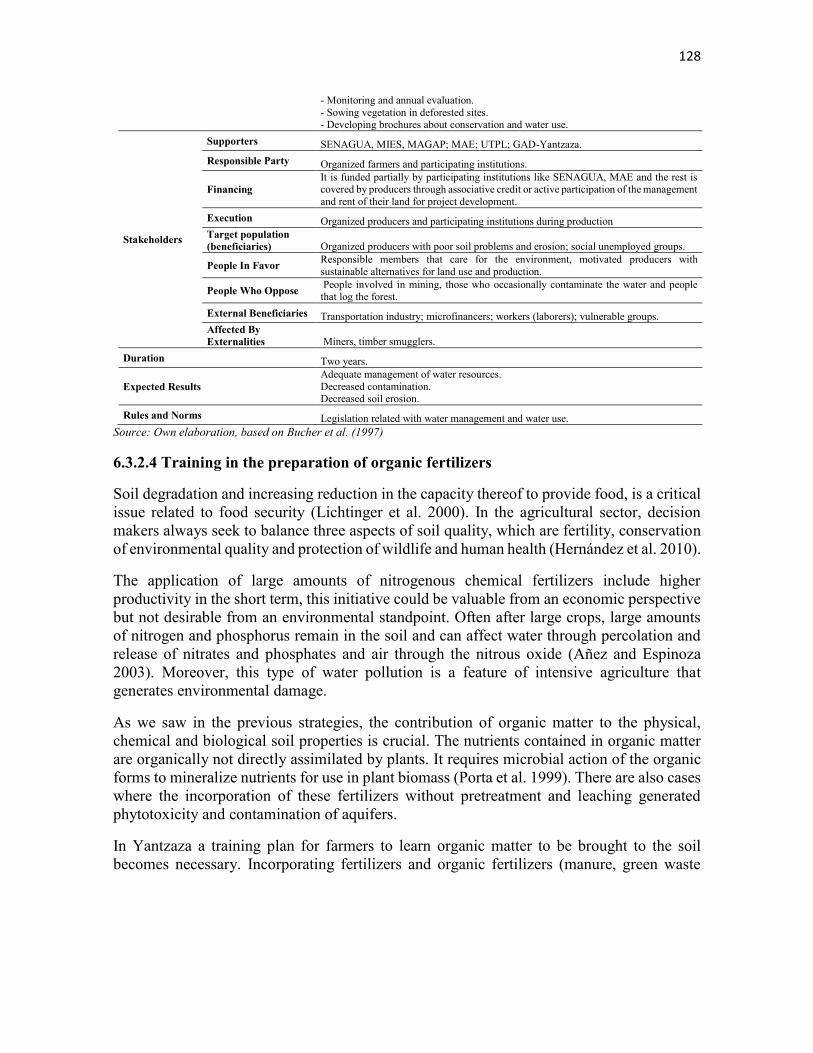
128
- Monitoring and annual evaluation. - Sowing vegetation in deforested sites. - Developing brochures about conservation and water use.
Stakeholders
Supporters SENAGUA, MIES, MAGAP; MAE; UTPL; GAD-Yantzaza. Responsible Party Organized farmers and participating institutions.
Financing It is funded partially by participating institutions like SENAGUA, MAE and the rest is covered by producers through associative credit or active participation of the management and rent of their land for project development.
Execution Organized producers and participating institutions during production Target population (beneficiaries) Organized producers with poor soil problems and erosion; social unemployed groups.
People In Favor Responsible members that care for the environment, motivated producers with sustainable alternatives for land use and production.
People Who Oppose People involved in mining, those who occasionally contaminate the water and people that log the forest.
External Beneficiaries Transportation industry; microfinancers; workers (laborers); vulnerable groups. Affected By Externalities Miners, timber smugglers.
Duration Two years.
Expected Results Adequate management of water resources. Decreased contamination. Decreased soil erosion.
Rules and Norms Legislation related with water management and water use. Source: Own elaboration, based on Bucher et al. (1997) 6.3.2.4 Training in the preparation of organic fertilizers
Soil degradation and increasing reduction in the capacity thereof to provide food, is a critical issue related to food security (Lichtinger et al. 2000). In the agricultural sector, decision makers always seek to balance three aspects of soil quality, which are fertility, conservation of environmental quality and protection of wildlife and human health (Hernández et al. 2010).
The application of large amounts of nitrogenous chemical fertilizers include higher productivity in the short term, this initiative could be valuable from an economic perspective but not desirable from an environmental standpoint. Often after large crops, large amounts of nitrogen and phosphorus remain in the soil and can affect water through percolation and release of nitrates and phosphates and air through the nitrous oxide (Añez and Espinoza 2003). Moreover, this type of water pollution is a feature of intensive agriculture that generates environmental damage.
As we saw in the previous strategies, the contribution of organic matter to the physical, chemical and biological soil properties is crucial. The nutrients contained in organic matter are organically not directly assimilated by plants. It requires microbial action of the organic forms to mineralize nutrients for use in plant biomass (Porta et al. 1999). There are also cases where the incorporation of these fertilizers without pretreatment and leaching generated phytotoxicity and contamination of aquifers.
In Yantzaza a training plan for farmers to learn organic matter to be brought to the soil becomes necessary. Incorporating fertilizers and organic fertilizers (manure, green waste
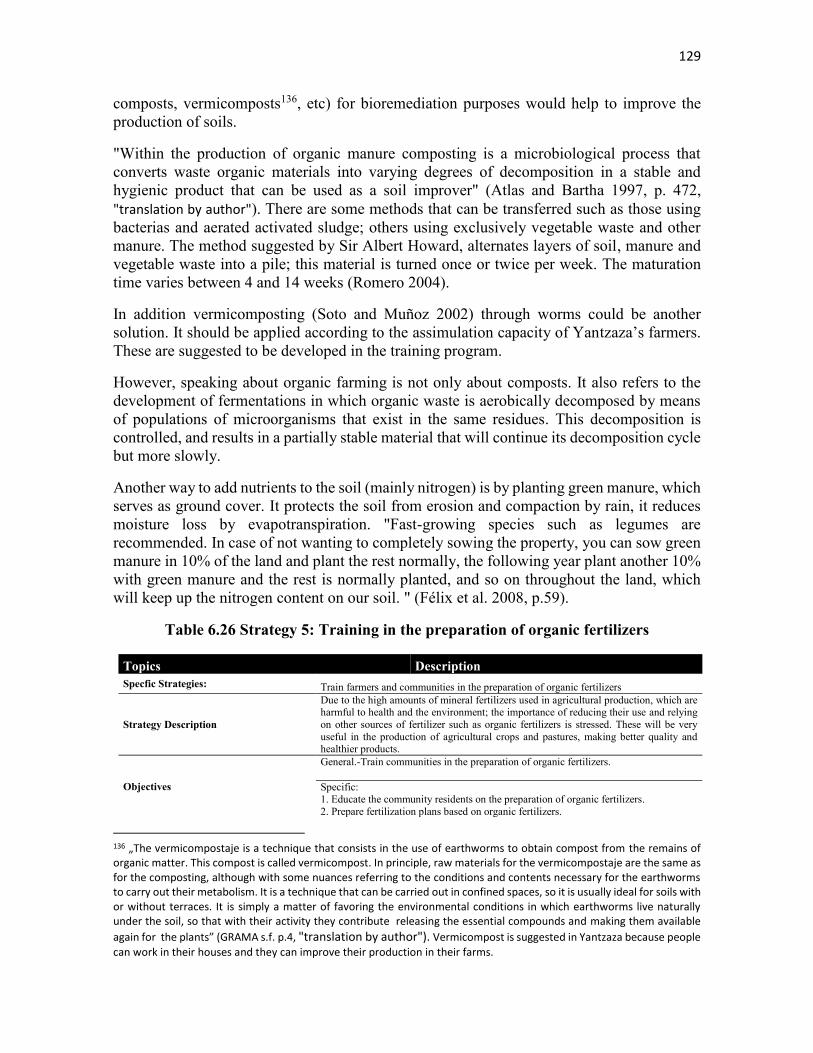
129
composts, vermicomposts136, etc) for bioremediation purposes would help to improve the production of soils.
"Within the production of organic manure composting is a microbiological process that converts waste organic materials into varying degrees of decomposition in a stable and hygienic product that can be used as a soil improver" (Atlas and Bartha 1997, p. 472, "translation by author"). There are some methods that can be transferred such as those using bacterias and aerated activated sludge; others using exclusively vegetable waste and other manure. The method suggested by Sir Albert Howard, alternates layers of soil, manure and vegetable waste into a pile; this material is turned once or twice per week. The maturation time varies between 4 and 14 weeks (Romero 2004).
In addition vermicomposting (Soto and Muñoz 2002) through worms could be another solution. It should be applied according to the assimulation capacity of Yantzaza’s farmers. These are suggested to be developed in the training program.
However, speaking about organic farming is not only about composts. It also refers to the development of fermentations in which organic waste is aerobically decomposed by means of populations of microorganisms that exist in the same residues. This decomposition is controlled, and results in a partially stable material that will continue its decomposition cycle but more slowly.
Another way to add nutrients to the soil (mainly nitrogen) is by planting green manure, which serves as ground cover. It protects the soil from erosion and compaction by rain, it reduces moisture loss by evapotranspiration. "Fast-growing species such as legumes are recommended. In case of not wanting to completely sowing the property, you can sow green manure in 10% of the land and plant the rest normally, the following year plant another 10% with green manure and the rest is normally planted, and so on throughout the land, which will keep up the nitrogen content on our soil. " (Félix et al. 2008, p.59).
Table 6.26 Strategy 5: Training in the preparation of organic fertilizers
Topics Description Specfic Strategies: Train farmers and communities in the preparation of organic fertilizers
Strategy Description
Due to the high amounts of mineral fertilizers used in agricultural production, which are harmful to health and the environment; the importance of reducing their use and relying on other sources of fertilizer such as organic fertilizers is stressed. These will be very useful in the production of agricultural crops and pastures, making better quality and healthier products.
Objectives
General.-Train communities in the preparation of organic fertilizers. Specific: 1. Educate the community residents on the preparation of organic fertilizers. 2. Prepare fertilization plans based on organic fertilizers.
136 „The vermicompostaje is a technique that consists in the use of earthworms to obtain compost from the remains of organic matter. This compost is called vermicompost. In principle, raw materials for the vermicompostaje are the same as for the composting, although with some nuances referring to the conditions and contents necessary for the earthworms to carry out their metabolism. It is a technique that can be carried out in confined spaces, so it is usually ideal for soils with or without terraces. It is simply a matter of favoring the environmental conditions in which earthworms live naturally under the soil, so that with their activity they contribute releasing the essential compounds and making them available
again for the plants” (GRAMA s.f. p.4, "translation by author"). Vermicompost is suggested in Yantzaza because people
can work in their houses and they can improve their production in their farms.
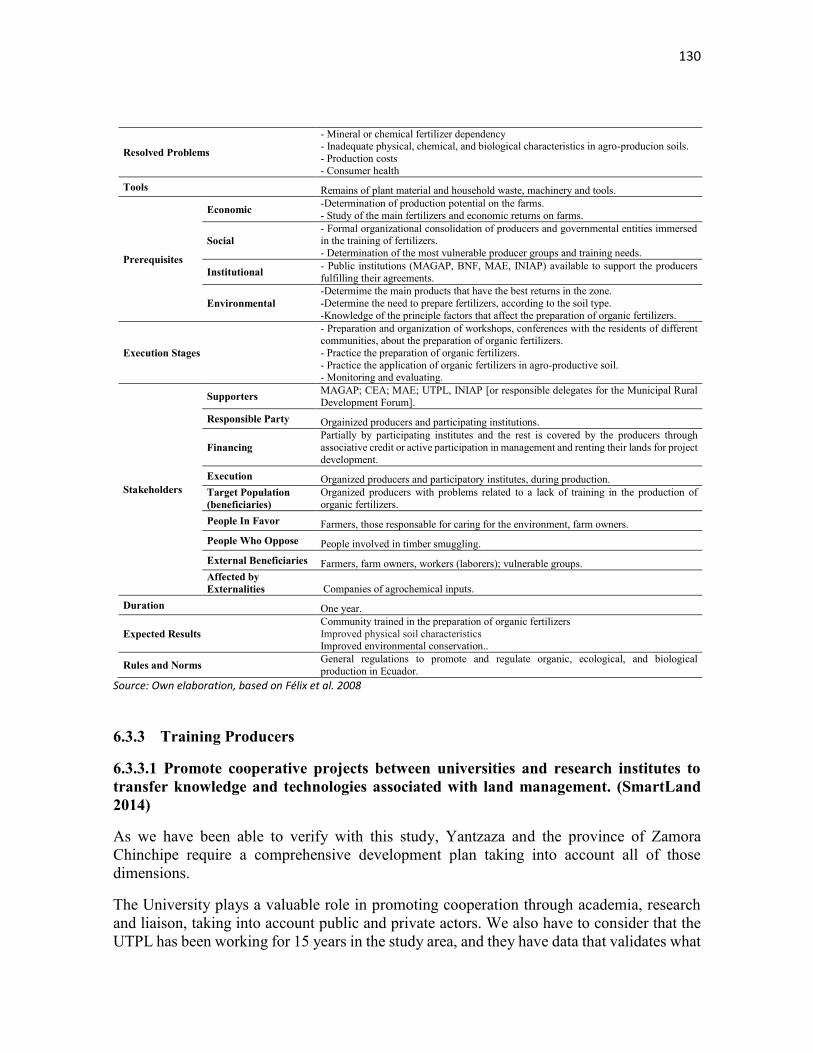
130
Resolved Problems
- Mineral or chemical fertilizer dependency - Inadequate physical, chemical, and biological characteristics in agro-producion soils. - Production costs - Consumer health
Tools Remains of plant material and household waste, machinery and tools.
Prerequisites
Economic -Determination of production potential on the farms. - Study of the main fertilizers and economic returns on farms.
Social - Formal organizational consolidation of producers and governmental entities immersed in the training of fertilizers. - Determination of the most vulnerable producer groups and training needs.
Institutional - Public institutions (MAGAP, BNF, MAE, INIAP) available to support the producers fulfilling their agreements.
Environmental -Determime the main products that have the best returns in the zone. -Determine the need to prepare fertilizers, according to the soil type. -Knowledge of the principle factors that affect the preparation of organic fertilizers.
Execution Stages
- Preparation and organization of workshops, conferences with the residents of different communities, about the preparation of organic fertilizers. - Practice the preparation of organic fertilizers. - Practice the application of organic fertilizers in agro-productive soil. - Monitoring and evaluating.
Stakeholders
Supporters MAGAP; CEA; MAE; UTPL, INIAP [or responsible delegates for the Municipal Rural Development Forum].
Responsible Party Orgainized producers and participating institutions.
Financing Partially by participating institutes and the rest is covered by the producers through associative credit or active participation in management and renting their lands for project development.
Execution Organized producers and participatory institutes, during production. Target Population (beneficiaries)
Organized producers with problems related to a lack of training in the production of organic fertilizers.
People In Favor Farmers, those responsable for caring for the environment, farm owners. People Who Oppose People involved in timber smuggling. External Beneficiaries Farmers, farm owners, workers (laborers); vulnerable groups. Affected by Externalities Companies of agrochemical inputs.
Duration One year.
Expected Results Community trained in the preparation of organic fertilizers Improved physical soil characteristics Improved environmental conservation..
Rules and Norms General regulations to promote and regulate organic, ecological, and biological production in Ecuador.
Source: Own elaboration, based on Félix et al. 2008
6.3.3 Training Producers
6.3.3.1 Promote cooperative projects between universities and research institutes to transfer knowledge and technologies associated with land management. (SmartLand 2014)
As we have been able to verify with this study, Yantzaza and the province of Zamora Chinchipe require a comprehensive development plan taking into account all of those dimensions.
The University plays a valuable role in promoting cooperation through academia, research and liaison, taking into account public and private actors. We also have to consider that the UTPL has been working for 15 years in the study area, and they have data that validates what
131
this study is strengthening. Thus institutional cooperation programs are considered a priority (see table 6.27), that will generate and provide access to dynamic information. This will facilitate decision-making and through participatory methodologies allows for better public-private proposals.
The proposal called SmartLand originates from this study. It started with the dynamics of environmental care, however, this initiative goes further because the UTPL thought it may have some links that generate true sustainable development. Here are the quotes from the initiative in 2014 which is already a reality.
“The territorial system undergoes rapid changes and traditional management models do not address the commitment to sustainability. The alternative proposal is "intelligent territories", addressing new and evolving challenges, including sustainability as a fundamental pillar. Since January 2014, the UTPL proposed the SmartLand initiative, which makes an inclusive model of intelligent management viable for communication technologies and information (TICS), a high capacity for natural learning and permanent adaptation.
This initiative uses ICT as digital preservation, representation and information retrieval, processing large volumes of data, analysis techniques variables, sensor technologies, geographic information systems, information visualization, and emerging technologies of the Semantic Web, among others.
The project's general objective is to implement a data platform that integrates monitoring systems, data collection and allow interoperability and generation of predictive models to support decision making for intelligent land management, improve citizen’s quality of life and improve environmental management.
The research projects of the initiative seek to collect and manage data and indicators and systems modeling social, biological, environmental, cultural and infrastructure monitoring, which will serve to propose an innovative and sustainable land management. This management includes contributing to the optimal utilization of natural and cultural resources revaluing equity. In the intermediate term the initiative seeks to be a supportive tool for decision-making, aimed at improving the quality of life of its inhabitants. SmartLand aides the collaboration with sectional, regional and governmental entities and public and private companies wishing to join the project.
Work Packages:
WP01 Heritage, culture, tourism and recreation WP02 Biodiversity and ecosystem integrity WP03 Cartography and geomorphology WP04 Climate WP05 Education: quality indicators and coverage WP06 Energy and telecommunications WP07 Infrastructure and transportation WP08 Water resources and water quality WP09 Public health
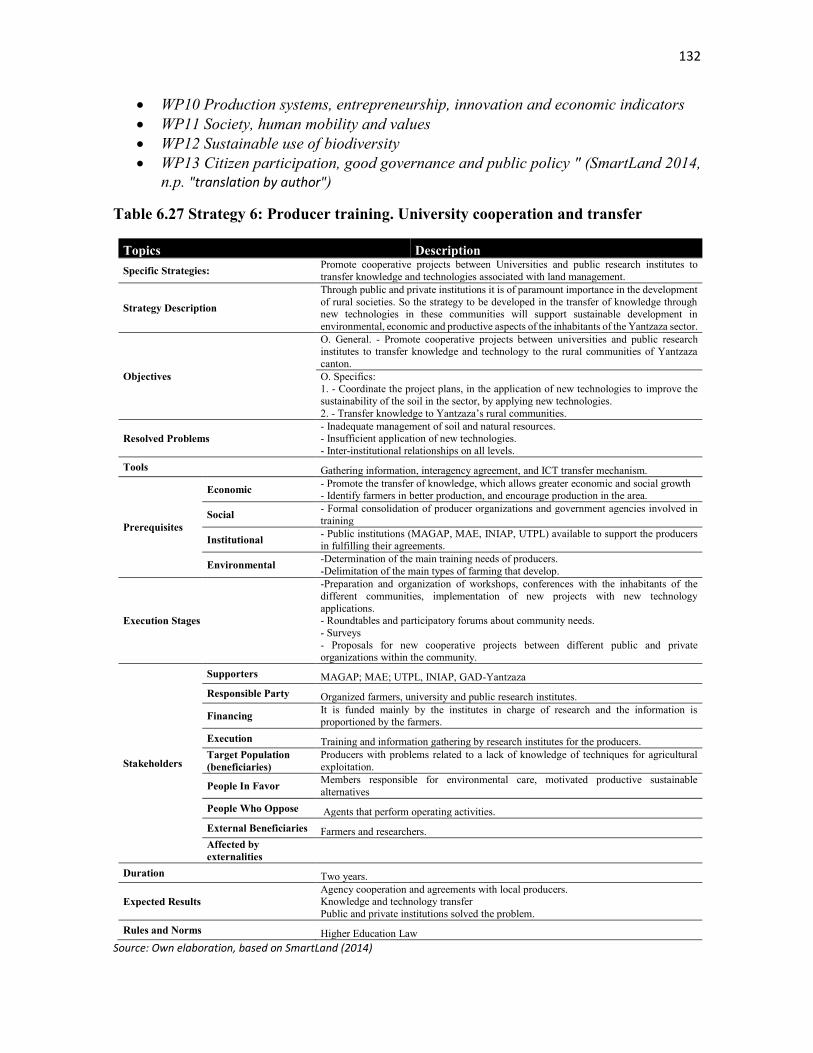
132
WP10 Production systems, entrepreneurship, innovation and economic indicators WP11 Society, human mobility and values WP12 Sustainable use of biodiversity WP13 Citizen participation, good governance and public policy " (SmartLand 2014,
n.p. "translation by author")
Table 6.27 Strategy 6: Producer training. University cooperation and transfer
Topics Description Specific Strategies: Promote cooperative projects between Universities and public research institutes to
transfer knowledge and technologies associated with land management.
Strategy Description
Through public and private institutions it is of paramount importance in the development of rural societies. So the strategy to be developed in the transfer of knowledge through new technologies in these communities will support sustainable development in environmental, economic and productive aspects of the inhabitants of the Yantzaza sector.
Objectives
O. General. - Promote cooperative projects between universities and public research institutes to transfer knowledge and technology to the rural communities of Yantzaza canton. O. Specifics: 1. - Coordinate the project plans, in the application of new technologies to improve the sustainability of the soil in the sector, by applying new technologies. 2. - Transfer knowledge to Yantzaza’s rural communities.
Resolved Problems - Inadequate management of soil and natural resources. - Insufficient application of new technologies. - Inter-institutional relationships on all levels.
Tools Gathering information, interagency agreement, and ICT transfer mechanism.
Prerequisites
Economic - Promote the transfer of knowledge, which allows greater economic and social growth - Identify farmers in better production, and encourage production in the area.
Social - Formal consolidation of producer organizations and government agencies involved in training
Institutional - Public institutions (MAGAP, MAE, INIAP, UTPL) available to support the producers in fulfilling their agreements.
Environmental -Determination of the main training needs of producers. -Delimitation of the main types of farming that develop.
Execution Stages
-Preparation and organization of workshops, conferences with the inhabitants of the different communities, implementation of new projects with new technology applications. - Roundtables and participatory forums about community needs. - Surveys - Proposals for new cooperative projects between different public and private organizations within the community.
Stakeholders
Supporters MAGAP; MAE; UTPL, INIAP, GAD-Yantzaza Responsible Party Organized farmers, university and public research institutes.
Financing It is funded mainly by the institutes in charge of research and the information is proportioned by the farmers.
Execution Training and information gathering by research institutes for the producers. Target Population (beneficiaries)
Producers with problems related to a lack of knowledge of techniques for agricultural exploitation.
People In Favor Members responsible for environmental care, motivated productive sustainable alternatives
People Who Oppose Agents that perform operating activities. External Beneficiaries Farmers and researchers. Affected by externalities
Duration Two years.
Expected Results Agency cooperation and agreements with local producers. Knowledge and technology transfer Public and private institutions solved the problem.
Rules and Norms Higher Education Law Source: Own elaboration, based on SmartLand (2014)

133
6.3.3.2 Coordinate a participatory conservation practices plan of natural resources (crop rotation, food safety, harvesting, post-harvest product processing)
This strategy is part of the SmartLand initiative. Basically, it describes projects aiming for a permanant training plan regarding conservation practices of natural resources.
Packages that generate projects within SmartLand are: WP2, WP5, WP8, WP10 and above all, a new package that is expected to generate public policies through citizen participation and good governance WP13.
Table 6.28 summarizes the strategy linked to the agro-ecological dimension.
Table 6.28 Strategy 7: Participatory plan in conservation practices
Topics Description Specific Strategy: Coordinate a participatory conservation practice of natural resources (crop rotation, food
safety, harvesting, post-harvest product processing).
Strategy Description
Development and unification of various specific strategies that foster the conservation and restoration of natural resources in order to improve the quality of life for residents of these communities and society in general is necessary. Through sustainable development human and environmental needs can be met.
Objectives
General.- Participatory coordinated plans for the management and conservation of natural resources in rural communities in the canton Yantzaza. Specific: 1. Develop management plans and conservation of natural resources: - Preservation of the natural features of interest. - Creating opportunities for recreation, education and research. - Adequate and comprehensive use of natural resources, through reorganization of use and zoning agro-productive as technological skills and social characteristics. - Minimizing the depletion of natural resources. - Formulation of plans management of natural resources - Rehabilitate degraded areas - Protect primary forests sustainably for the maintenance and development of biodiversity. 2. To sensitize the community on the importance of the environment and its resources.
Resolved Problems
- Inappropriate management of natural resources. - Contamination of soil, water and air. - Improper exploitation of resources. - Depletion of natural resources.
Tools Gathering information and educational materials.
Prerequisites
Economic
-Identify ancestral conservation practices implemented by the community. -Determine the productive potential of farms, based on conservation practices and natural resources. -Learn about the main natural resources of the farm which can be exploited sustainably.
Social
- Formal consolidation of producer organizations and government agencies involved in reforestation. - Determination of the most vulnerable producers and coordinate training needs for productive activities.
Institutional - Public institutions (MAGAP, MAE, INIAP, MIPRO, etc.) available to support producers in complying with their agreements.
Environmental - Determination of the main agricultural activities, carried out in the seeding process. - Determination of the various factors influencing the seeding process and directly or indirectly affecting the environment.
Execution Stages
- Preparation and organization of workshops, conferences with the inhabitants of different communities on the management and conservation of natural resources. - Roundtables and participatory forums on community needs. - Awareness campaigns with the aim of making known to producers the importance of nature and the problems to be solved.
Stakeholders Supporters MAGAP; MAE; MIES; UTPL; GAD-Yantzaza; CEA.
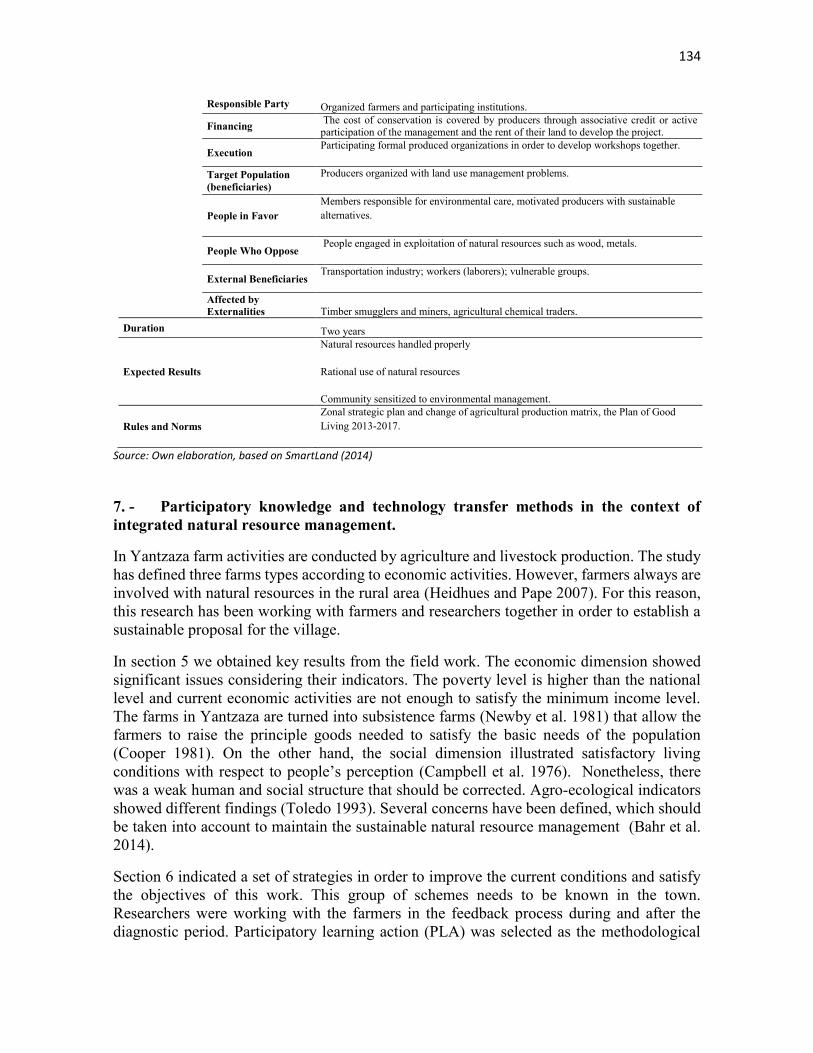
134
Responsible Party Organized farmers and participating institutions.
Financing The cost of conservation is covered by producers through associative credit or active participation of the management and the rent of their land to develop the project.
Execution Participating formal produced organizations in order to develop workshops together.
Target Population (beneficiaries)
Producers organized with land use management problems.
People in Favor Members responsible for environmental care, motivated producers with sustainable alternatives.
People Who Oppose People engaged in exploitation of natural resources such as wood, metals.
External Beneficiaries Transportation industry; workers (laborers); vulnerable groups.
Affected by Externalities Timber smugglers and miners, agricultural chemical traders.
Duration Two years
Expected Results
Natural resources handled properly
Rational use of natural resources
Community sensitized to environmental management.
Rules and Norms Zonal strategic plan and change of agricultural production matrix, the Plan of Good Living 2013-2017.
Source: Own elaboration, based on SmartLand (2014)
7. - Participatory knowledge and technology transfer methods in the context of integrated natural resource management.
In Yantzaza farm activities are conducted by agriculture and livestock production. The study has defined three farms types according to economic activities. However, farmers always are involved with natural resources in the rural area (Heidhues and Pape 2007). For this reason, this research has been working with farmers and researchers together in order to establish a sustainable proposal for the village.
In section 5 we obtained key results from the field work. The economic dimension showed significant issues considering their indicators. The poverty level is higher than the national level and current economic activities are not enough to satisfy the minimum income level. The farms in Yantzaza are turned into subsistence farms (Newby et al. 1981) that allow the farmers to raise the principle goods needed to satisfy the basic needs of the population (Cooper 1981). On the other hand, the social dimension illustrated satisfactory living conditions with respect to people’s perception (Campbell et al. 1976). Nonetheless, there was a weak human and social structure that should be corrected. Agro-ecological indicators showed different findings (Toledo 1993). Several concerns have been defined, which should be taken into account to maintain the sustainable natural resource management (Bahr et al. 2014).
Section 6 indicated a set of strategies in order to improve the current conditions and satisfy the objectives of this work. This group of schemes needs to be known in the town. Researchers were working with the farmers in the feedback process during and after the diagnostic period. Participatory learning action (PLA) was selected as the methodological
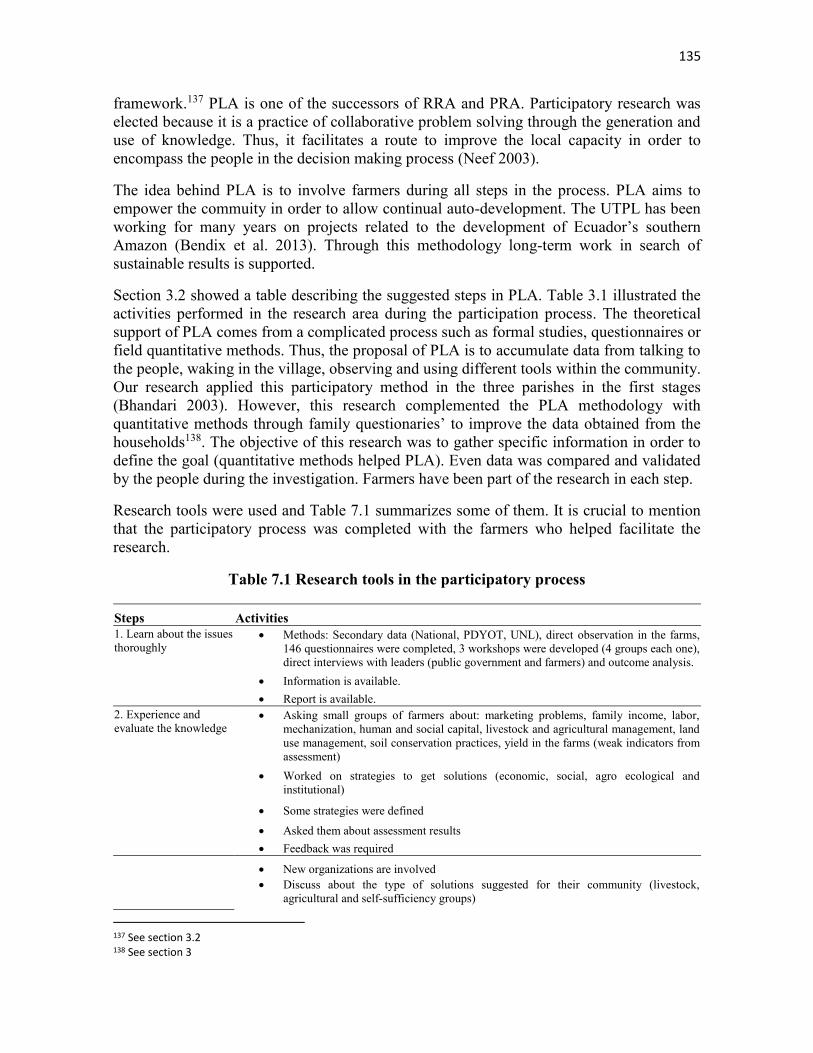
135
framework.137 PLA is one of the successors of RRA and PRA. Participatory research was elected because it is a practice of collaborative problem solving through the generation and use of knowledge. Thus, it facilitates a route to improve the local capacity in order to encompass the people in the decision making process (Neef 2003).
The idea behind PLA is to involve farmers during all steps in the process. PLA aims to empower the commuity in order to allow continual auto-development. The UTPL has been working for many years on projects related to the development of Ecuador’s southern Amazon (Bendix et al. 2013). Through this methodology long-term work in search of sustainable results is supported.
Section 3.2 showed a table describing the suggested steps in PLA. Table 3.1 illustrated the activities performed in the research area during the participation process. The theoretical support of PLA comes from a complicated process such as formal studies, questionnaires or field quantitative methods. Thus, the proposal of PLA is to accumulate data from talking to the people, waking in the village, observing and using different tools within the community. Our research applied this participatory method in the three parishes in the first stages (Bhandari 2003). However, this research complemented the PLA methodology with quantitative methods through family questionaries’ to improve the data obtained from the households138. The objective of this research was to gather specific information in order to define the goal (quantitative methods helped PLA). Even data was compared and validated by the people during the investigation. Farmers have been part of the research in each step.
Research tools were used and Table 7.1 summarizes some of them. It is crucial to mention that the participatory process was completed with the farmers who helped facilitate the research.
Table 7.1 Research tools in the participatory process
Steps Activities 1. Learn about the issues thoroughly
Methods: Secondary data (National, PDYOT, UNL), direct observation in the farms, 146 questionnaires were completed, 3 workshops were developed (4 groups each one), direct interviews with leaders (public government and farmers) and outcome analysis.
Information is available. Report is available.
2. Experience and evaluate the knowledge
Asking small groups of farmers about: marketing problems, family income, labor, mechanization, human and social capital, livestock and agricultural management, land use management, soil conservation practices, yield in the farms (weak indicators from assessment)
Worked on strategies to get solutions (economic, social, agro ecological and institutional)
Some strategies were defined
Asked them about assessment results Feedback was required
New organizations are involved Discuss about the type of solutions suggested for their community (livestock,
agricultural and self-sufficiency groups)
137 See section 3.2 138 See section 3

136
3. Adapt the knowledge and technology for the community
Discuss the way they want to tackle the problems (economic, social, agro ecological and institutional)
Discuss the implementation of Participatory Technology development (Neef 2010)
Develop a tentative guideline for adapting the plan
Stakeholders discussion (common decision) 4. Promote the knowledge
Develop a plan of actions for dissemination of knowledge and technology
Stakeholder networks (focus local community, GAD local leader) Source: Own elaboration, adapted from Bhandari (2003)
Findings from steps 1 and 2 were described in the previous sections. The present section concentrates on knowledge and technology transfer to the community. In order to achieve this objective the integration between traditional experience and scientific learning is required.
The integration between local and scientific knowledge has to be systematic, reflexive and cyclic so that multiple views and procedures are involved related to environmental management issue. In Yantzaza, integration was based on a few principles: a) Recognize the need to integrate academic and non-academic participants in the process; b) focus the need to consider different information and build a common understanding; c) use participatory research methods (PLA) in order to integrate different stakeholders in the decision-making and d) maintain the interactive process of knowledge creation (Raymond et al. 2010).
A significant element in the village was the way people had positive attitude towards scientific results. Besides, the farmers are highly compromised with their learning process. Traditional knowledge was included in the strategies defined in the previous section (Altschuler 2008). Therefore, transfer practice has been coordinated with the communities. During the three general steps the integration of knowledge was important. Farmers waited for the strategies in order to begin with the suggestions.
These processes required tough discussions and negotiations with different stakeholders in the rural area. These events produced a debate among actors, thus allowing the researchers to gain significant information for designing better strategies. Moreover, a key function of this route is to create a learning process to improve the organizational and institutional learning (Phillipson and Liddon 2006). Sustainability depends on the efficiency of learning channels and the understanding between experts, community members, researchers, facilitators and other important actors. UTPL and the municipality of Yantzaza provided experts in economic, social and agricultural topics. The researcher team came from UTPL and TU Dresden. Leaders of the communities were working to support the relationship between UTPL and rural organizations. Some stakeholders were invited such as national development agencies, other universities, private institutions, entrepreneurs and others. Bear in mind that at the core of the knowledge transfer is social construction, which is an integral context where social, political and historical features are directly linked (Longino 2002).
7.1 Yantzaza’s experiences in participatory research approaches.
Through the Participatory Learning Action (PLA), UTPL was able to offer farmers strategies previously identified at the research station in Yantzaza. Through this process, researchers, farmers and facilitators gained experience and learned together. Some benefits were found from this participatory action. The principles, methods and skills that were used in the
137
implementation have been described by Chambers (1994) in his participatory rural appraisal (PRA); however, the main difference respect to PLA is based on active, decision-making involvement of farmers in all research process.
The first step was carried out in 2012 in the rural village. A sample was used in order to obtain the information from the families. This information was validated in focus groups with the farmers the following year (2013). Due to the problematic indicators in the area, the solutions were defined to improve the current situation in the town. From the economic dimension, net income, labor and machinery have been identified as the main concerns for the area. People need revenue to live, for these reason economic factors were discussed in detail with the farmers. People think that economic factors are most relevant in the area. They prefer to find mechanisms to apply the strategies as soon as possible. Reducing the high poverty level in Yantzaza should be the priority for the policymakers and stakeholders involved in the village.
The social dimension revealed that accumulation of the human and social capital had a weak composition, which reduced the probability to create strong structures. Strategies can facilitate this issue, nevertheless, farmers’ participation is necessary. Finally agro-ecological issues were summed into three essential problems: land use, yields and erosion risk. Principally the strategies were involved with the farmer management, thus the current situation can be improved with knowledge transfer and agricultural extension.
While the traditional approach to research was successful at identifying farm management issues in the area, we also learned that farmers do not know how to protect natural resources (UGT 2012). In order to achieve sustainable development, economic alternatives to gain revenues and at the same time protect natural resource are the key mechanisms for local development. The aim was to identify the issues and transfer knowledge (strategies from section 6) to the rural people to improve living conditions and environmental sustainability.
If, during this process, farmers recognized problems they wanted to try to resolve, and the UTPL, local municipality and public agency (MAGAP) had the potential to resolve those concerns, researchers and farmers worked together to plan on how to apply the strategies in the area. For the second step, it was important for researchers to provide farmers with a broad amount of alternatives and basic information about economic activities, human and social guaranties and natural resource management.
During this stage (experience and evaluation of knowledge) researchers encouraged farmers to decide how they prefer to resolve the problems in the village. Farmers mentioned their priorities (economics) and they were open to beginning a coordinated process between researchers and themselves. The idea behind this was to develop a local model with traditional and scientific knowledge.
Transfer procedures were developed under the horizontal model of extension. The priority is the farmer; human capital is essential for the local development. This model emphasizes “farmer to farmer” (Hilje and Saunders 2008) where farmers receive benefits from researchers, and they communicate to others farmers the knowledge gained. Discussion between farmers and researchers is part of the process, and farmer’s communication is vital

138
for the success of the extension. Traditional and scientific knowledge is suggested, also, socioeconomic parameters are the core of the sustainability.
The extension approach aims to build villagers’ capacity for problem solving. Sustainability depends on extension efficiency in the local communities, this is why the quality of knowledge transfer is nuclear and essential (Phengvichith et al. 2010). Adapting the knowledge for the community can be done through a variety of procedures. The knowledge should be used and put into practice by all. Farmers have to determine where they can adapt this knowledge in order to make it a regular practice.
The three parishes selected by UTPL researchers are located in the Yantzaza village. The goal is to work with 150 families approximately. Researchers and farmers have a set of strategies for Yantzaza, nervertheless; its application can be different in each parish. The decision was taken according to farmer’s opinion, because both in Los Encuentros and Chicaña the people did not participate actively in communal activities. Rather, in Yantzaza’s parish the farmers participate more than others parishes because they are more integrated and their planning system is much more connected to organizational activities (UTPL)139. The methodology for agricultural extension presents some alternative methods. Three of them have been applied in Yantzaza in order to improve efficiency and sustainability.
In the Yantzaza parish (capital of Yantzaza canton) the leadership method was applied. The principle reason why this method was chosen was because of the level of education of farmers in this parish. The average number of years of education is 9.15; meanwhile in Los Encuentros y Chicaña are 7.2 and 6.86 years, respectively (INEC, 2010). Another reason was the credibility of the leaders in Yantzaza. In this parish’s fieldwork the communication between rural people and their leaders was developed with transparency and in an effective manner. Table 7.2 shows the applied procedure in the village.
Table 7.2 Leadership method: applied procedures in Yantzaza
Working plan Incentives Activities
1. Selection of community leaders and promoters.
2. Talking: the importance of community promotion.
3. Participatory identification of knowledge needs of the farmers. Innovation process.
4. How can they improve the work in the teams?
5. Coordinate proposals between local public actors, researchers and farmers.
6. Plan transfer events (exchange of experiences in the field, focus groups, workshops, etc.)
Technical workshops Learning process in the
demonstration plots (UTPL and local government)
Exchange of experiences Internship Training courses Methodological workshops Local leader’s events. Regional leader’s events. National leader’s events. Knowledge transfer from
researchers.
Source: Own compilation, based on Hilje and Saunders (2008)
139 UTPL is working with Yantzaza’s people more than other parishes because some of them are providing milk to the university enterprise (ECOLAC).
139
For communication, leaders used the horizontal transfer process140 (Hilje and Saunders 2008), which has a specific focus on acquisition, dissemination and use of the new knowledge. First the community chose the leaders from nascent organizations. Three principle leaders began the work. These leaders are the representatives of the communal associations, who have been involved in participatory method during some years in Yantzaza. Communal leaders were challenged next; therefore three principal leaders selected one leader to represent their community in order to establish a net of knowledge. Communal leaders have been responsible for the communication process in the community. Researchers were working with the leaders and the community (leaders are representative farmers of the community)
The research team trained 12 people (leaders of the communities) in economic, social and agro-ecological strategies to improve the current living conditions. Farmers participated actively in all processes during the two months. The group was made up by nine men and three women. One of the principle challenges was incentivizing participation. Researchers used the incentives illustrated in Table 7.2. Leaders were open to the participation; they understood the relevance of the intervention. In order to have a sustainable process we did not use economic incentives or gifts.
Leaders understood that community development depended on social structure and communal activities (Zingore et al. 2009). On the other hand, their focus was on improving the income for the families to reduce poverty. Linkage with rural markets and increasing family business was discussed. Economists suggested strategies to achieve this objective; however the intervention from public actors was a key topic to debate in the next step.
Farmers learned social skills, because they can help create better relationships between rural people. Farmers took into account the personal levels of satisfaction felt in the rural sector in order to foster these relationships.
They traveled to the city of Loja, to the UTPL field (demonstration plots) with the aim of teaching them some of the activities in the university plots in order to improve the natural resource management. The aim was to develop soil management, erosion control, agricultural strategies and knowledge about the agriculture and livestock141.
Yantzaza’s parishes selected by the UTPL researchers are located in a zone where livestock play a significant role in farming system, and where the farmers are highly experienced with the constrains and difficulties of the land. Therefore, the project was confident about the potential role of agriculture as an alternative in order to obtain incomes in the rural area. Livestock has been part of the tests conducted in the UTPL.
The extension approach used by the UTPL team aims to build knowledge and technical capacity in the communities. The applied methodology was developed from preparation, planning (previous work) and extension activities. The implementation stage provides the
140 This process means transfer from farmer to farmer. The scientists or researchers develop the knowledge with the farmers together, however, extension is carried out with the farmers’ interaction. 141 Basically the focus was to teach them that it is possible to work with sustainable natural management and produce high yields. Also, livestock can have better outcomes through the application of basic strategies. These strategies were explained in detail in section 6.

140
farmers with technical information that they needed to apply. In the first year, researchers worked together with the farmers in the small trial plots; even leaders invited other farmers in order to spread awareness. Leaders will share the information with the people; however, they can also participate during the process. Farmers require technical support when applying new strategies the first time. Leaders will work with the farmers and researchers through continued accompaniment and support so that any mistakes or faults can turn into opportunities for growth.
This process defined above can be carried out when issues are still being recognized and new strategies are being used by farmers at the same time. Within this procedure there is no best practice; they need to identify, know, improve and adapt the suggestions and information to their individual conditions (Cramb et al. 2004). The University will establish the controlled plan of activities in the year. Local public142 actors are involved in the process in order to continue the participatory action.
Transfer methods facilitate links between public and private actors, universities and farmers. For this reason, these methods are the key decision in the field work with the rural population. Thus, in Los Encuentros parish the decision was made on the basis of the level of dissemination of knowledge as principle criteria. Farmer field school approach is the method (FFS) (FAO 2010b). FFS consists of groups of famers who get together to study a specific affair. This process allows farmers to learn by doing. Agro-ecological strategies were preferred in the method because knowledge extension is related with the current activities in the field. Economic and social strategies was explained according to the proposal defined by researchers143, nonetheless, UTPL coordinated the social activities in the schools in order to improve the actual life conditions in the zone.
FFS was selected because Los Encuentros is associated with mining and natural resource use. Singular conditions in the area produce specific features that can shift the local decisions and transfer process. The risk is particularly high if leaders communicate the knowledge to the farmers due to the fact that they will begin to work with the mining industries and their decisions may be affected by external actors. Los Encuentros is close to the mining area, but it will be the principal place of business activities. FSS offers a crucial opportunity for people in order to conserve traditional practices and maintain the sustainability in the rural area. It offers farmers basic agricultural and management strategies that assist them in making them experts on their own farms.
FFS is a transfer method which requires cooperation of people for its implementation. The Agriculture Ministry of Ecuador (MAGAP) has been working with this model from 2013 in the country. Public policy prioritized this model as a means of reducing poverty in rural areas. FFS was developed through the schools brought about by the agrarian revolution (ARS) which are nothing more than the FFS but with a name that corresponds to the current government. The formulation of these schools is conceptually similar to FSS, however, extension and adoption process are lead by public facilitators.
142 Municipality of Yantzaza has compromised with the farmers to help them with technical and moral support. UTPL has been developing different projects in the study area that facilitate the interactions between public actors, and farmers. 143 See section 6.

141
UTPL has agreements with public actors in the south of Ecuador. Zamora Chinchipe province is the focus of this public policy, for this reason, the university can take advantage of the institutional cooperation to establish good support between public facilitators and facilitators from the university (researchers). One of these schools is functioning in Los Encuentros parish in the normal way and MAGAP is open to work together in the school. Both areas will use the participatory methodology. Researchers should incorporate diversity in a limited number of modules in primary training according to strategies defined in the previous diagnostic.
ARS was planned in three steps. The first one is an introductory step into the community. Facilitators teach the modules according to the needs. The second step applies the knowledge in the field (facilitators will work with researchers in new cooperation projects). The third step assures an efficient business administration in order to maintain sustainable development (MAGAP, 2014). Within that context, some specific roles have a significant value in the process. Farmers are experts conducting their field activities. Learning should be made with respect to farmers' understanding. All training processes will be established in the farmer’s field to demonstrate the practices efficiently. Also, the facilitator’s work is not teaching, but rather participating by offering guidance when the farmer needs it. Facilitators in the first step prepare the modules according to technical and traditional practices. Meetings and dynamic groups between farmers and facilitator shall be carried out with the aim of solving problems and discussing methods. The key outcome is when farmers implement their own decisions in their fields.
Researchers developed a plan of activities aimed at advancing the work for transfer procedures. Table 7.3 illustrates this proposal.
Table 7.3 Farmer field school: applied procedures in Los Encuentros
Working plan Incentives Activities
1. Identify priority problems and solutions for identified issues.
2. Establish farmer practices (strategies). 3. Identify field school participants and sites
(governmental institutions collaborated in this procedure).
4. Training facilitators on economic, social and agro-ecological strategies defined in section 6.
5. Participatory evaluation (adaptation process to the strategies and innovations).
6. Carries out experiments and field trials based on technical knowledge.
7. Establish a working group. 8. Field days. Implementation on their farms
(technical accomplishment). 9. Graduation. In this step farmers have
knowledge. 10. Follow-up facilitators.
Village guide maps. Life testimonials. Videos. Writing material: booklets, charts,
magazines. Posters and brochures. Seeds from the public agencies. Community mapping. Family farming crop plan. Strengthening of social and human
capital. Technology skills and knowledge.
Source: Own compilation, based on INNTA (2011)
142
Finally, in Chicaña parish Demonstrator Families (DF) (FAO 2011) method was used to transfer knowledge. The main feature of Chicaña is the high number of people. There are 550 homes in Chicaña with an average of 5 members per household. This represents 14.25% of all investigated population. Hence, this is an applicable method in the third parish.
Just like the other methods, the horizontal transfer method was applied, focusing on agricultural extention for the homes. However, another problem in the transfer methodology included involving women in gaining agricultural knowledge. In a subsistence economy women´s participation is relevant. The farm in rural areas needs men and woman working together, even the children should know about this process. It is needed to improve the organization, communication, and confidence into the family and subsequently into the social structure.
Localization is also a relevant factor. Chicaña is further away than others parishes and the possibility that families learn, adopt and disseminate knowledge is higher than in other places. In the assessment, food security was valued highly and DF method could be a good option in Chicaña.
First, local government together with researchers decided to choose fifteen similar Demonstrator Families that participated frequently in agricultural activities with the local actors. On the other hand, these DF are localized in different sectors to generate impact on all areas. But to achieve and diversify the impact, the DF method should be working with others familys’ groups called Irradiated Families (IF)144.
IF are part of social organization in Chicaña, as local government has different programs that involve native families. These include literacy programs, agricultural training for small farmers and support for small businesses. Two conditions in the process of collective construction are required: (a) access to land, and (b) who can read and write.
The implementation of DF, methodology is conducted within the Community House of the village. During transfer process the families were proactive and efficient with the identification of problems and local needs, as well as in planning and decision making on innovation and knowledge to be received according to their reality. People identified economic, social and agro-ecological indicators and researchers shared strategies in order to get knowledge.
As knowledge and technology transfer is similar in the three parishes, a key objective was to merge the knowledge between the communities.
In this way, the Demonstrator Family DF is a family group who assumes the role of learning to teach. They support all members of the family (sons, daughters, grandparents, brothers, sisters, etc.) living in the same household, who are the "stars" in the community to learn, to experience and to make decisions, which is then shared and taught to other nearby Irradiated Families.
144 “By irradiated families can be understood those that adopt good practices from demonstrator families, both, sustainable technologies for farm management, as well as good household practices, so that nutritional food security, quality of life and natural resource management can be improved” (FAO 2011, p.8, "translation by author" )
143
While the methodology seeks the family as a core structure, it is undeniable that there is no single type of household or nuclear family. Families in Chicaña operate like a unified structure. However, there are different types of families, with their own characteristics. The recognition of diversity is the key for this methodology.
FAO (2011) suggest that each researcher attend 16 families and each DF share with 18 IF, however in Chicaña there are 19 communities and our team had 3 researchers and a Director. Therefore, at least one researcher was responsible for 6 families, one per community, and the Director worked as a coordinator in all places. 19 communities were attended to and each DF worked with their community. The final result was 380 trained farmers.
This process emphasized three key aspects for the dissemination of knowledge and technology transfer. First, through direct communication with the DF, the researchers know that the information and technologies transfer is necessary. Second, the families learned how to use technology effectively or apply knowledge145. Third they learned how to incorporate the diffusion of knowledge and technologies to IF through various extension tools.
The work was developed in three participatory workshops with technicians, researchers and DF. In this workshop, Farm-Plan146 was required with the selection of priority actions for the first step. These events had a schedule according to the strategies. The economic event was coordinated for the research group, social strategies were conducted by researchers and local actors (from public institutions) and the agro-ecological meeting was led by a group of agricultural engineers and researchers.
In order to develop and disseminate the knowledge and technology, other extension methods and tools were used. These tools facilitated the establishment of links between families of different places, contributing to building social networks for the exchange of information. Over three months, the transfer process was developed. Workshops were made every month but researchers visited farmers (DF) two times per month. The visit included an explanation of the purpose of the visit, the review of Farm-Plan or concerns of the families about the technologies or practices and follow-up recommendations from the earlier visit; identifying solutions, and defining tasks and suggestions to follow.
Two types of tools were used in the workshops; training in a classroom and group mode, i.e. a training session in the community. Good facilitation is key to the training process. To meet the people where they are and work within their environment is an important part of transfering knowledge. Training was applied in economic and social sessions with local actors looking to link public policy to incentivize DF and IF. Implementation of 145 Educational process was lead for the research group. Economists, agricultural engineers and sociologist were present during the transfer knowledge. 146 Farm Plan must be developed from the first workshop that is executed between the technicians and the DF. This should be done with a gender perspective, which contemplates the actions to be taken to improve the conditions of productive activity and the home in general. This plan defines the actions prioritized for the first year of work. The plan contemplates the information, knowledge and technologies that will be applied both in the plot and in the home. In addition there must be a weekly or fortnightly periodicity to verify the advance of the same. In order to carry out a systematic and orderly process, the training contents are defined on the problems identified in this plan and cover topics related to the management of items, natural resources, production systems, gender and personal and home building, among others. FAO (2011)

144
demonstrative plots in the communities (19 communities) was part of agro-ecological strategies. Training and technical assistance was provided over the three months in order to help the DF learn and transfer knowledge to the IF.
Some IF were involved during training and demonstrative plots. The idea behind this is to motivate the community. Local actors from public institutions play an important role motivating famers in order to continue in their activities. After three months, the DF will share the new knowledge and technology with the IF. However, the efficiency and long-term sustainablity depend principly on local government and universities.
Table 7.4 shows a summary of the working plan in Chicaña.
Table 7.4 Demostrator Families: applied procedures in Chicaña
Working plan Incentives Activities
1. Select Demonstrator Families. 2. Family organization and looking for
methodology. 3. Basis for implementation. 4. Functions and coordination between
stakeholders. Public actors, researchers, DF, IF, social actors, and technical assistance.
5. Methods and complementary tools. Training and demonstration plots.
6. Monitoring and evaluation.
Technical workshops. Economic training. Learning process in the
demonstration plots (community). Social-structure strengthening. Exchange of experiences. Training courses about social
weaknesses. Knowledge transfer from
researchers. Public policies from local
government. Posters and brochures. Seeds from the public agencies. Community mapping.
Source: Own compilation, based on FAO (2011)
7.2 Local Communities as learning organizations (Yantzaza, Los Encuentros and Chicaña)
This section details how local communities in Yantzaza and adjacent to Yantzaza manage interactions between humans and natural resources. Three different transfer methods were used, and local stakeholders were involved in the practice. Learning organizations are the main point of the transfer procedure, across a myriad of perceptions, behaviors and actions. Local communities are perceived as “appropriators” (Fremerey 2000) who live together with natural resources in a subsistence model. This model was described based on size and perspective livelihood for Yantzaza.
In the current economy, welfare has been described as the result of rational behavior of the individuals in the policy arena (rational choice) (Pretzsch 2005). In the rural sectors, development used to be considered as a subsistence model, where farmers were living from agriculture and livestock activities. In this kind of system, maximization of individual’s

145
benefits is not the best strategy. In section 6, all of strategies for Yantzaza were described. All of these strategies implicitly needed, besides knowledge and technology transfer, a strong organization level147 in order to function effective.
The objective in this kind of rural systems is not a purely economic one; even risk aversion can be more relevant (Jost and Gentes 2014). In Yantzaza’s system two factors were detailed as important: financial aspects and food storage. The dynamics between household, farm and the rest of the economy is continuous and interdependent. Subsistence outputs, labor, cash surplus, wages, and farm products sold are part of a cycle in the amazon region in Ecuador. Therefore, in study areas sustainability depends on improving this economic dynamic through collective action. Consequently, extending the actual individual-oriented approach to the concept of social actor or agency is necessary (McGinnis and Ostrom 1992).
The issue of learning in the parishes was linked to the transfer methods from the researchers. However, the objective of horizontal transfer will be to sustain knowledge in the long-term while seeking feedback from the community. Thus, the notion of local knowledge includes both, knowledge acquired from researchers and local actors, and local experience gained throughout the generations (Fremerey 2000). Arce and Long (1992, p. 211) say “knowledge is constructive in the sense that it is the result of a great number of decisions and selective incorporations of previous ideas, beliefs and images, but at the same time deconstructive of other possible frames of conceptualization and understanding”.
Irrespective of the transfer method applied, our focus was on the “learning organization”. DiBella and Nevis (1998, p. 28) define “Organizational learning as the capacity or processes within an organization to maintain or improve performance based on experience”. In Yantzaza scientific local knowledge is not the best, nevertheless, farmers have a good experience in agricultural and cattle administration, they know about local production, and they have basic agro-ecological knowledge. Because of this, transfer methods try to record feedback between local farmers and researchers.
Natural resources management was one of the principal factors discussed in the meetings in Yantzaza, Chicaña and Los Encuentros. When Hardin talked about “tragedy of the commons” for example, he explained a basic theory on the utilization of common pool resources. In rural areas, like Yantzaza, villagers should have the capacity to manage the utilization of natural resources in a sustainable way. He mentioned that “overgrazing could result because for each additional sheep, a herder could receive benefits, while the group shared damage to the commons” (Hardin 1998, p. 682). With this individualized rational economic decision, the common good could be depleted or even destroyed.
The learning organization suggests that this problem cannot be solved only by technical means, but by a change in human values, social structure, morality, and solid organization etc.
147 Transfer methods applied in Yantzaza, Los Ecuentros and Chicaña, needed a strong organization level. First, leaders in the first stage can work alone, or together with researchers, but when they will share the information to farmers, an organizational level was required. In the field, schools collective action was imperative, due to farmers and local stakeholders had hard work together. Finally, in the Demonstrator Families the community action is relevant, because the third stage in the process connects trained families to new families in the communities.
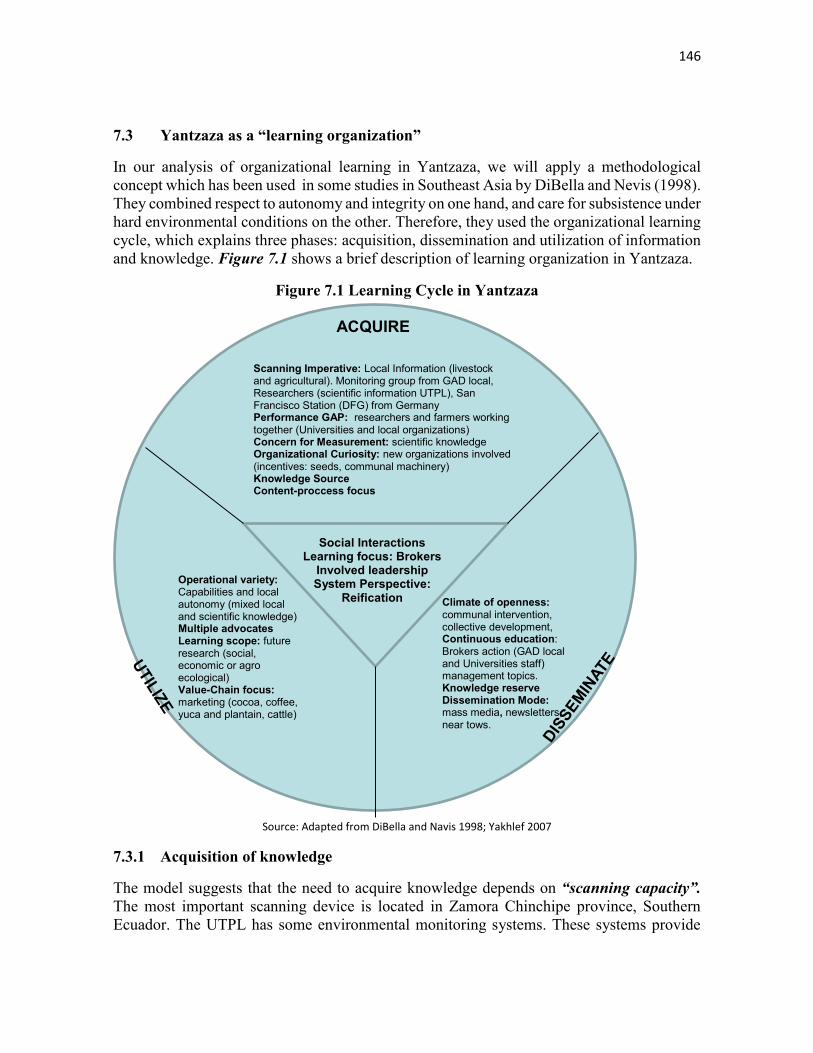
146
7.3 Yantzaza as a “learning organization”
In our analysis of organizational learning in Yantzaza, we will apply a methodological concept which has been used in some studies in Southeast Asia by DiBella and Nevis (1998). They combined respect to autonomy and integrity on one hand, and care for subsistence under hard environmental conditions on the other. Therefore, they used the organizational learning cycle, which explains three phases: acquisition, dissemination and utilization of information and knowledge. Figure 7.1 shows a brief description of learning organization in Yantzaza.
Figure 7.1 Learning Cycle in Yantzaza
Source: Adapted from DiBella and Navis 1998; Yakhlef 2007
7.3.1 Acquisition of knowledge
The model suggests that the need to acquire knowledge depends on “scanning capacity”. The most important scanning device is located in Zamora Chinchipe province, Southern Ecuador. The UTPL has some environmental monitoring systems. These systems provide
Scanning Imperative: Local Information (livestock and agricultural). Monitoring group from GAD local, Researchers (scientific information UTPL), San Francisco Station (DFG) from Germany Performance GAP: researchers and farmers working together (Universities and local organizations) Concern for Measurement: scientific knowledge Organizational Curiosity: new organizations involved (incentives: seeds, communal machinery) Knowledge Source Content-proccess focus
ACQUIRE
Social Interactions Learning focus: Brokers
Involved leadership System Perspective:
Reification Climate of openness: communal intervention, collective development, Continuous education: Brokers action (GAD local and Universities staff) management topics. Knowledge reserve Dissemination Mode: mass media, newsletters, near tows.
Operational variety: Capabilities and local autonomy (mixed local and scientific knowledge) Multiple advocates Learning scope: future research (social, economic or agro ecological) Value-Chain focus: marketing (cocoa, coffee, yuca and plantain, cattle)
147
information about rain, temperature, contamination, wind direction and speed, and humidity. For the transfer methods, researchers taught this information to leaders, FFS and DF.
Additionally, the San Francisco station, a scientific institution from Germany, can share the information with the communities. Researchers from the UTPL and from the San Francisco station generate information that will transfer to farmers during the field meetings148. Also, local government is playing a key role in this process, in order to sustain long-term results.
Transferring information would not have been possible without the help of the scientific community along with the participation of local stakeholders. Knowledge from monitoring systems is not easy to understand, researchers needed to discuss this information with scientific staff (concern for measurement) from the UTPL and the San Francisco station in order to generate a simple presentation to the farmers. It is worth noting that sustainability outcomes and future efficiency depend on the direct connection between the University (researchers), public actors (especially president of parish office) and farmers (learning organization is the core of this practice).
These “gap concerns” should be minimized through informative assistance from Universities for the local population, and continuous participatory action between farmers and researchers. It is important to note that there is a lot of relevant knowledge that can still be developed with the cooperation of external institutions in Yantzaza. This is a significant issue whose resolution is overdue.
Legal and administrative implications are required to make political decisions. New organizations as external factors could generate positive impacts. These effects should have influence on inputs and technology transfer. In Yantzaza, for example basic machinery, seeds and organic material is necessary when the new organizations can cooperate together with parish offices and local organizations (farmers).
7.3.2 Dissemination of knowledge
The goal in the “learning process” is to share information with the community. This work group devised a group of strategies from economic, social and agro-ecological perspectives, which have been discussed in the transfer process referred to in the last section. Nonetheless, we want to maintain knowledge in the long-term. Where organizational structure is relevant in order to avoid the gain of one person or farmer, it entails the loss of another, and vice versa.
Climate of openness was established during transfer meetings. In Yantzaza, the leaders’ group was working together with researchers, but the construction of the organizational structure will depend on results and empowerment of knowledge. During these months, we acted as coordinators and we defined the route for the future. Five years ago, when the research started the farmers began alone with low expectations. However, in the three parishes, farmers’ organizations were developing team activities i.e. in Chicaña they were
148 Meetings will depend on the transfer method. This type of information can be shared through researchers or local stakeholders. Local government will act as a linkage between actors in the future.
148
looking for new markets in Loja to sell banana and cocoa. These structures must be linked to the local government through political decisions and land use plan strategies149.
In the 1970s Ecuador’s Amazon region’s principle source of income was oil production. For this reason the growth population increased. Fourty years have passed since the farmers survived by agricultural activities and livestock production (subsistence economy). Lack of knowledge about natural resources degraded some areas. Farmers used to be alone and produced for their own consumption. However, today the situation is different. They need solid arrangements or teams to improve the current natural conditions.
The previous paragraph highlighted the importance of learning. Dissemination is not only a transfer of knowledge. Social structures depend on good understanding and high levels of education. National government is helping to solve this. As curricula in the primary school and high school are changing, they are including natural resource management, resource utilization, local history and entrepreneurship. The SmartLand program also established educational programs for the children in order to gain knowledge to protect natural resources and develop new businesses with local production. The DF method (applied in Chicaña) tries to introduce children to the knowledge transfer process, too, recognizing it as a key part of the learning cycle.
Beyond internal dissemination (dissemination mode), in Yantzaza, los Encuentros and Chicaña, presidents of parish offices have made efforts to create information networks. Farmers receive this information from mass media, newsletters, leaders, and other resources. UTPL is publishing newsletters with basic information produced from the SmartLand program150. The local government will publish a magazine assisted by UTPL and MAGAP.
7.3.3 Utilization of Knowledge
The utilization of knowledge shows the capability of internal problem solving. It also refers to the ability to manage resources, plan, make decisions and resolve conflicts. This knowledge will be the challenge for the organizations, especially if they require autonomy, self-reliance, and diminish the external dependence (local government, universities and external institutions).
Leaders in Yantzaza, FFS in Los Encuentros and DF in Chicaña were working in the communities. This kind of distribution enables researchers to regulate the number of organizations in Yantzaza canton. At least one organization151 per community should be created (in Yantzaza it could be less than others because FFS include a significant number of farmers), considering the set of strategies defined in the study.
149 Land use planning in Yantzaza will include developing strategies defined in this work. Even UTPL is working with local governments to establish the priorities through the wider program called “SmartLand” applied in Zamora Chinchipe province, hence in Yantzaza. 150 All of the projects conducted in Zamora Chinchipe province belong to this program. This research was one of the first projects at UTPL that caused the creation of the SmartLand platform. 151 Approximately 25 organizations could be created in the Yantzaza canton. This number could be less than 15, however, at this stage it, is important to strengthen the social structure.

149
Organizations are the core of the “learning” process. They were made in different places with the sole purpose of incorporating all communities in the “transfer process” and “learning cycle”. Twenty five groups of farmers have obtained knowledge from this study (transfer methods). They know economic strategies to improve income. They know how it is possible to use natural resources sustainably. Social strategies are part of the organizations; therefore, the challenge will be mantain and improve them for the long-term.
Social structures began as a group of organized people. Yantzaza has these organizations developing activities in the area. New extension methods are incorporated by the farmers in order to get benefits. The goal of these organizations is to develop a solid institution.
Different types of communities were distinguished. Spathelf (2010) defined them as an important criterion in the organizations’ level of liberty of decision to join a group. The objectives and capabilities of the 25 communities is different, therefore, it may be difficult to integrate all the goals into one organization. Let us recall that three types of farms were described (livestock, agricultural and others), taking into account that the goal of each should be based on this classification.
Social structure as seen as cooperation among industrial countries lost its original function, which was the prevention of economic and social misery. This cooperation is seen as a tool now to help develop countries. Ecuador is a good example. Müller (1993, pp. 98-99) developed the concept of cooperatives152, i.e. “associations consisting of people who collectively satisfy their primarily economic, but also cultural needs which they feel in common with a view to improving their situation in life since they, as individual economic subjects and adherents of their culture in their households or on their farms, do not have the physical, spiritual, and economic means to that end”. This concept is applied to Yantzaza, where there are common needs and common objectives. Cooperation seeks to achieve them through common activities in the communities. For example, in the Río Amarillo153 community they are setting up a specific company in order to sell banana and cocoa. Müller also states that to do so, farmers should impose rules, rights and obligations upon themselves and conduct their work voluntarily in the form of self-help, self-responsibility and self-administration. This is important to consider in the organizations. Here, the principle of subsidiarity is elemental, in communities all decisions should be made on the lowest possible hierarchical level154.
All of this cooperative practice includes environmental regulations, land use plans, information channels, educational systems and internal organizations. Sanctions for rule offenders include being asked to provide support (in cash, kind or work) according to the gravity of the offence. A learning process reveals itself in the continuous updating of the number of sanctions, taking into account ecological and economic factors defined in the organizations.
152 The origin of the word for cooperative was from Germany, namely Genossenscaft which means equal share of the the rights and obligations in a community. 153 This community is localized in Chicaña parish, twenty five km from the parish center. 154 This concept was introduced by STEIN in Prussia at the beginning of the 19th century.

150
7.3.4 External factors
Ostrom (1990, p. 190) highlights that “a theory of self-organization and self-governance of smaller units within larger political systems must overtly take the activities of surrounding political systems into account in explaining behavior and outcomes”. For this reason, the local learning process cannot be evaluated without including external factors, especially political arena and public institutions.
From the agro-ecological perspective national regulations were made. For example, the Socio Bosque program used ecological incentives and agro-ecological schools. Additionally, it allowed the inclusion of natural resources as national assets in the Ecuadorian Constitution. Even, the Environmental Ministry has developed natural conservation programs, and agricultural programs for farmers.
In order to improve current conditions in Yantzaza (land use management, conservation practices and soil management), the following public organizations were involved: MAGAP, Agrocalidad, Yantzaza government and Zamora Chinchipe government. These organizations together with the UTPL should support the cooperative work of the 25 groups of farmers. During the transfer methods, MAGAP was working, However, they must be constantly engaged in technical issues.
From the economic perspective, the government defined a new law related with popular and solidarity economy155. Organizations like those in Yantzaza will have better opportunities to obtain credit, establish companies, sell products and access markets. Additionally, tax incentives for the social structures could help them.
MAGAP, the Economic and Social Inclusion Ministry (MIES), the National Development Bank (BNF), Agrocalidad, the Tourism Ministry, and NGOs are involved in the economic development of Yantzaza. The focus of these organizations is marketing, business promotion and crop diversification in order to obtain better incomes for farmers.
Regardless, the effects of external factors on the local process of learning are difficult to determine in the given context. This topic could be the subject of a new study.
155 „ Popular economy and solidarity is understood as a set of forms and practices, either individual or collective, which are self managed by their owners. In the case of collectives, they have simultaneously the quality of workers, suppliers, consumers or users --thus benefiting human beings, as the subject and aim of its activity, oriented to the good life, in harmony with nature, above profit and capital accumulation” ( Maya et al. 2012).

151
8. – Discussion and Conclusions
Promoting sustainable land use and contributing to the improvement of rural livelihoods in the Amazon region in the south Ecuador is a very complex challenge.
This Amazon region is one of the most mega diverse regions in the world and is very rich in natural resources. The same region is home to rural populations, who satisfy their own needs while increasing the use of natural resources generating vulnerability in the ecological balance (Bendix et al. 2013).
This study concludes that participatory research is valuable in the framework of land use management. “Participatory Learning Action” as methodology allowed the participation of local actors in many stages of the research to be decisive. In addition, this research has managed to integrate local and scientific knowledge in the research process. Sustainable land use requires working at the local level to obtain better results. Furthermore, an important process of interaction between ecology, agricultural production, technology, economic and socio-cultural processes was observed.
8.1 Recapitulation of major results
Sustainability is a problem of global concern, which must be tackled at all levels of society. Finding a realistic and effective response to this problem must remain a political priority for countries around the world.
In order to achieve a synergy between the various dimensions of development, coordinated effort is necessary among public and private actors, universities and the community. This is the key to reducing poverty, strengthening social structures and avoiding environmental degradation.
Standardizing the evaluation of sustainability management perfomance is a complex task. In this sense, it could be evaluated based on five criteria that are accepted worldwide: productivity, safety, protection, feasibility and acceptability (Smyth & Dumansky 1993), i.e. so that the results can be compared with different perspectives and contribute to the development of societies. In rural areas, this issue could be more complex. However, in this research we used the three internationally accepted dimensions (economic, social and environmental) in order to establish an initial framework.
Sustainable development measured from an economic dimension shows deficiencies in family income in the mechanization of farms, and in the workforce. The economic dimension, by means of indicators, quantified the current situation. A loss of income and, above all, a tendency towards rural poverty have been widely defined in this work.
On the other hand, in this same dimension, there are interesting results in terms of food sufficiency since family farms have an important diversity of crops and thus food security. In addition, this enables us to diminish economic risk because there is the possibility of reducing periods of shortage or decreasing income.
152
With regard to the social dimension, two types of results can be clearly observed. For the perception of quality of life that the communities have, the result is favorable with an appropriate value of the indicator. This implies that the inhabitants have a certain level of security while living in Yantzaza. This indicator always had a favorable trend. Unlike the accumulation of social and human capital whose results show a serious sustainability problem, which is mainly due to the weak organizational capacity, labor unstability and low levels of education of farmers.
While analyzing the ecological dimension, we found problems of sustainability when taking into account land use management in the area, which rather complicates the expansion decisions. This was due to problems of forest degradation and low crop rotation. In addition, it can be seen that the use of agrochemicals is not tolerable according to the allowed norms. Finally, the risk of erosion of the zone is very considerable and therefore there should be intervention.
If we add our observations about the dimensions (specifically variables with problems), the situation is perturbing with regard to public policy decisions. Although the values are inappropriate as attached values in our sustainability scales, this does not imply that there aren't still possibilities that things will be improved through transfer mechanisms that will enable us to improve the present condition and to prepare communities.
The situation is even more complex. For example, we observed that the original classification of the study at a farm scale was carried out by size, but the high heterogeneity determined another classification for applying the development strategies to define a proposal. Thus, there was a classification done according to income, because one of the objectives is the eradication of poverty. In this case, three types of farms were identified: self-efficiency, commercialization farms and livestock. The conditions are different but they share some of the problems. The idea is that the strategies are determined according to their operationability, which later facilitated the work in the transfer process.
The suggested proposal took into account the sustainable livelihood framework by designing strategies to achieve sustainable development in Yantzaza. These strategies were elaborated according to each development dimension.
From the economic perspective, three general strategies were proposed to solve the problems. These are: rural market, promoting business management, and diversifying sources of income. Ten specific strategies that strengthened their application were used for this.
In order to improve social structures, two strategies have been proposed, i.e. to strengthen human capital and to articulate the social and institutional capital. In order to be applied in the research area, seven specific strategies have allowed their performance, the same that are developed considering needs according to be identified in the area.
The strategies related to the environmental reality were focused on the agro-ecological perspective basically on the reality of the study area. Three main strategies were supported by seven specific strategies. These strategies focus on soil conservation practices, territorial development plans and training processes that refer to problem indicators.
153
A comprehensive proposal was made by UTPL to address these needs. In the program called "Smartland", which promotes sustainability in the region, there are twelve intervention packages to analyze and solve the problems that we have mentioned.
For the transfer processes, three rural parishes were selected. In each one a different method has been applied that is adapted to the special characteristics. The results of community participation through the so-called PLA strategy were promising. A leadership method was applied in Yantzaza called "Farmer field school", which was implemented in the meetings in Los Encuentros. Other families were taught in Chicaña. The aim was that the developed strategies could be transferred to the communities obviously with the help of the institutional support of the public sector and led by the university.
8.2 Research Findings
This research was guided by four research questions: (see Chapter 2)
Is there currently a sustainable development from an economic, social and ecological standpoint for Yantzaza?
What strategies address the sustainable development of farm management at the local level in Yantzaza?
What methods of knowledge and technology transfer can be used to cater to needs of rural people in the context of integrated natural resource management?
How can we provide sustainability in an agricultural economy which has production capacity but low participation in market channels in the commercial sector (agricultural subsistence economy)?
These questions were proposed in order to work on the research objectives and hypothesis. Later, a deep going analysis was done to obtain answers.
8.2.1 Integrated assessment of Sustainability: Findings
In the field work, the research showed a close relationship between three dimensions. The hypothesis confirmed that Yantzaza does not have an appropriate level of sustainability.
Economic Dimension
According to the results obtained from the economic dimension, it was concluded that Yantzaza does not have appropriate levels of sustainability. This result is confirmed by the fact that the appropriate value obtained as a simple average of the indicators is less than the value suggested as appropriate in the research. Economic risk and food self-sufficiency showed values within the range of the minimum acceptable value (appropriate value). This result is favorable because crop diversification is common in a subsistence economy (Hartemink 2005) (Norton et al. 2010) so that its direct basic needs can be covered. What is more, taking into account the poor conditions, the land use is a quick solution to the problems. In addition, farmers in rural areas plant different crops for their own consumption and in that way they meet their family needs. This diversification occurs on the farm scale, not on the large scale. That is why, income generation by agriculture is minimal and ends up becoming
154
a means of subsistence. It was also observed that the production area of self-consumption in Yantzaza is important, and it allows users to manage the possibility of livestock as an alternative to agriculture and it generates as well an additional income. The economic risk is low because the same diversification of crops allows many of these to be sold, especially in times of crisis. Furthermore, as agriculture is not highly technified, it is seen that the dependence of external inputs is minimal, contributing to the reduction of economic risk.
Thus, farmers seek markets to sell their products, however, the problem lies in accessing them. In addition, the high transaction costs (North 1991) remain unchanged and the price of products on the market does not facilitate their sale. Only 41.5% of farmers go to markets to sell their products. This makes them more vulnerable to poverty as it decreases their potentional income. Additionally, 29.9% of them prefer selling their products to intermediaries for very low prices and 28.4% sell on their own farms, which at the end causes a significant difference in sales prices.
The problem of markets in Yantzaza is deepened through a gravitational equation related to rural marketing, which leads to a lack of access and the decrease of income. Farmers take half an hour on average to go to the markets (taking into account that they could be up to 2 hours on foot) and they lack access facilities. The transaction costs (% as a result of the interview with heads of households) show that with regard to transport, 40.3% of farmers do not have access, 19.4% refer to the poor quality of the roads and 17.9% to the absence of nearby bus stations. In addition, there is a lack of basic services, among others. The market access index found in this research shows that if market access facilities increase, ceteris paribus, the probability that farmers would sell on the market would rise by 1.5%, which is significant for the development of Yantzaza.
On the other hand, net income, labor and mechanization showed relevant problems producing a decisive impact in the final result of the area. Net income is one of the indicators that can be generated by deeper analysis. An economy at the farm scale requires sustainable income; however, in this type of economy, not producing on a large scale is highly dependent on daily generated income. When we determine the cash flow between income and costs related to agricultural activities and livestock, we can see that 60% of farms do not even cover the vital basis defined in Ecuador and only 20% of the farms have a higher income than basic living standards of the country. This is contrasted with the results of the different methods used, which shows 60% and 67% of poverty in the area. To go further to the extreme poverty, it would reach 46%. Obviously these values were measured according to the income. These data show a serious problem that occurs due to no real incentive plan to the agricultural sector and livestock in the area that allows farmers to access markets or to seek mechanisms to support their development. The lack of income was a consequence of price volatility in the agricultural sector, weak public policies, lack of markets, employment diversification, among others. The subsistence economy (von Cramon-Taubadel 2011) repeatedly occurs in most of the agricultural production units in this area (UPAs).
With regards to the labor (whose indicator definition was complex), it is unsustainable in the long run as seen in section 5.1.2. Thus, it is concluded that only 35% of workers perform their activities efficiently. Together with the lack of minimum mechanization to work (which also did not achieve sustainability criteria), one can see that the two indicators complicate

155
the panorama. A need for support from the public or private sector towards the generation of incentives investment in mechanization is required. It would not be necessary to have large amounts of economic resources in this field because of the characteristics of the area and need for sustainable land management. It would allow the use of minimal machinery such as a motorboat and a pump that would be accessible through credit policies.
Additionally, in order to strengthen and expand the results, a sustainability analysis was carried out by means of the classification of farms by size. Four categories were defined and explained in section 5.5. The results conclude that the three indicators Net income, Labor and Mechanization, are the indicators that have been improving according to the size of the farm. In other words, the larger farms in Yantzaza are, the better their income levels, and some of them even exceed the acceptable minimums. Furthermore, work is required to accomplish the scheduled times. Also, better remunerations means increased efficiency. Finally, in bigger farms the mechanization has improved since they have traditional instruments. And in some cases, they have been improved technologically, which facilitates their work. In terms of economic risk and food self-sufficiency, there are no significant variations according to the increase in farm size, which is logical because these indicators appear to be independent of farm size. Above all, they have other types of effects.
Another classification was made in Yantzaza. After having observed that the income from livestock was representative in many farms, it was decided that there should be a special analysis to perform a new classification defined by economic activity. Section 5.6 shows the process carried out. Three categories were defined, which helped obtain relevant results. For example, 52% of cash farms (Camagni 1992), or farms with greater agricultural income receive a lower income than Ecuador's figure for basic living expenses, which in our scale of sustainability poses a critical problem. In addition, only 24% of cash farms manage to overcome the basic amount--providing a significant income level over time. Another valid conclusion is that the livestock farms are those that show better results in terms of income, 34.5% of them have income above the standard minimum. In total, 67% operate under the minimum conditions of sustainability with higher values than the appropriate levels. This concludes that the greatest economic benefits bring the farms, whose income in proportion to the rest is the one generated by livestock. Finally, self-sufficiency farms (Newby et al. 1981) show that 36% is below the appropriate minimum value of sustainability. However, 64% of these farms exceed this appropriate value. This result can be validated because at about 10% of the total amount of people living in the rural area of Yantzaza live from other activities that are not directly involved with agriculture or livestock. Therefore, they can generate these incomes for those farms. To sum up, agricultural farms have been facing income problems which have been the objective of in-depth analysis within the strategies suggested in section 6 (Baiphethi and Jacobs 2009).
Social Dimension
From the social dimension point of view, two additional indicators were determined. The first one, quality of life, shows an appropriate value of sustainability (Kowaltowski et al. 2006). The result of the simple average value was greater than the appropriate value. Basically, this means that people are satisfied with their quality of life and that they enjoy living in Yantzaza. This indicator consisted of five sub-indicators. Virtually all are skirting
156
the appropriate value with minimal differences. Thus, quality of environment and family perception as indicators of perception demonstrate that people are found calm regarding their standards of living, especially in their natural environment. In addition, HQ concludes that there are minimum overcrowding conditions accepted. Health conditions are kept close to the appropriate minimum with relation to the standards, however, they are in a range to take into account vulnerable effects in the medium term. In general the perception of the people living in Yantzaza is positive, this was confirmed while focusing on the group that always preferred living there, however with the conditions of improving the level of their lives significantly, for this reason, this group was always determined to cooperate.
The second additional indicator was accumulation of human and social capital (Dale and Onyx 2010). Here the situation has changed completely. In short, it does not operate under the appropriate level of sustainability, which implies weakness in the organizational structures, a high labor instability in the area of study with regard to the farmers: 65, 5% surpass 45 years of age and 68% has only completed basic education. Organizational structures need to be improved, with the aim of reducing transaction costs. Farmers working in teams in formal organizations can achieve better results. Currently, only 19% of them participate in formal organizations. This means a great challenge to be achieved. It also shows that it has not been easy to find workers in Yantzaza to encourage them working in the field, and this generates the need of developing policies that will support this particular weakness. Additionally, young people must be kept motivated through education in order to work in this field. Transfer methods are necessary in this area to develop soft skills and minimal competences.
An interesting result is observed when we analyze the indicator through the classification of farms by size. Unlike the economic dimension, we can observe that in the behavior of the social dimension there is no noticeable change when the farms increase their size. As long as the indicators support quality of life, the sizes are kept similar. Regardless of size, people live in Yantzaza because they feel well living there (Carr et al., 2001). As for the accumulation of human and social capital, the difference is also not significant. And, it can be concluded that it is indifferent to the size of the farm facing these social problems common in all farms alike.
Agroecological Dimension
Finally, the agroecological dimension shows important sustainability deficits since it operates under the appropriate average (de Molina 2013). As this research prioritizes indicators related to land use management, we can conclude that there is low crop productivity, problems in land use and erosion risk. Unfortunately, there has been no articulated agricultural education that would facilitate the solution of these disadvantages. The low productivity is related to a negative balance of nutrients that are present in the soils, with losses of Nitrogen, Phosphorous and Potassium and a fall of SOC (Bahr et al., 2014). However, coffee, cassava and corn still represent appropriate minimum results related to regional production references. Forest cover has presented drawbacks in Yantzaza, as the consequence of expanding the agricultural border has led to deforestation. According to our study, the situation is critical, as current coverage reaches 53% (Romero et al., 2010). There are urgent prevention and remedy policies required. Another problem is the low crop rotation

157
and the farmers' ignorance of the strategies that could help in this intervention (Castoldi and Bechini 2010).
Within the studied category, erosion risk also proved to be detrimental. Erosion is an important factor in nutrient balance (Koning et al., 1997). We must bear in mind that the direct observation showed unfavorable results added to the present deforestation and the steep slopes that exist in the landscape have brought unfavorable consequences.
As for the practice of using organic manure, management showed in general favorable results since people have been using crop residues in agriculture. This has reduced the burning of residues which has improved the amount of organic matter in soil. However, there are 40% of farmers who are on the limit level because they do not use these practices effectively. Lastly, the use of agrochemicals is shown as an appropriate value but above all, it refers to non-use. 55% of farmers do not use agrochemicals. Nevertheless, within 45% of those who use it, there are notorious problems of sustainability since its use is disproportionate. This result must be considered as a point of departure of an extension project for the remaining 45% of farmers.
When considering the classification of farms in this dimension, it was concluded that while the farm increases its size the use of agrochemicals improve, it is to say that the larger farms use the right amounts, while the smaller ones are the ones that pollute more. Another important result is that land use also improved by increasing farm size, which implies that larger farms also indicate better land use practices, although this effect is not very considerable. The remaining indicators are similar regardless of the farm size. So both erosion risk, as well as yield and amount of organic matter maintain similar standards regardless of the farm size.
8.2.2 Strategies for the development of farming systems
The sustainability assessment allowed us to find out the problems in Yantzaza related to the living conditions of the population, and the economic - ecological balance. The set of strategies proposed in section 6 seeks to obtain the solution regarding farm scale. It was concluded that economic benefits, consolidation of social structures and environmental concerns are considered as a priority. This proposal was made by taking into account that farmers have the power to maintain natural landscapes. Institutional support helps farmers preserve natural resources. The strategies obviously seek to alleviate poverty under a participatory scheme where stakeholders have their space.
The proposal was based on the Sustainable Livelihoods Framework (SLF), which seeks to maintain sustainability in rural areas (Serrat 2008). A set of participatory development strategies was defined. The key condition obtained in this work was the coverage through the strategies of 5 types of capital (natural, human, financial, physical and social) to maintain sustainable conditions.
Agricultural and livestock activities are not isolated in household production. All these activities must be integrated in household production and consumption. It is a decision where minimizing the risk of households and maximizing their well-being is sought. Thus, SLF was
158
used as a conceptual model that explains this complexity and provides five types of capital needed at the household level with poverty reduction in its development. The essence of this model is its relationship between rural livelihoods and sustainability. This approach was based on an orientation towards people including different stakeholders, with relevant intervention in formal organizations in the pursuit of dynamic sustainability (FAO 2008).
This proposal sought to identify the group of strategies defined in section 6 to address the livelihood priorities of poor people who were involved in the decision making. Although the problem was basically determined in relation to agricultural production and livestock, the conclusions are not only based on this, but also on the connection with other areas involved in the integral concept as education, health, finance, environment, etc.
During the last few years, much effort has been made in relation to SLF, but there is still a need to strengthen them. SLFs can play a key role in building capacity in local actors and allow them to be part of the local planning process and then be integrated into other decision-making levels. It must be taken into account that there is always an implicit risk in the decisions to be taken by these actors, although the key lies in the leadership of public, private and university actors who can support the technical lack.
There is no doubt that there are strong arguments in favor of what SLF can do with local linkages towards other levels (Yunyan and Feng 2009). There is still an ongoing task in trying to articulate the strategies that are developed at a global level such as the "Sustainable Development Goals" with the definitions made at the local level. If successful integration is achieved these solutions presented in Yantzaza could be similar in many rural areas with similar physical and environmental conditions. Moreover, it would greatly help reduce poverty and enhancing sustainable development.
8.2.3 Linking participatory research with transfer methods
It has been a permanent challenge to try to link participatory approach with agricultural research, especially when there is an evaluation/assessment of land use management whose results are unfavorable (Reij and Waters-Bayer 2014). The fundamental challenge is to achieve an adequate combination between a solid participation of the stakeholders involved and at the same time reach the largest number of farmers. The research team always implicitly expects the challenge of reaching the largest number of beneficiaries. For example, Neef et al. (2005) state that experience in this type of methods throughout history has not achieved the desired success. He also mentions that in exceptional cases, there are still processes where contact with people is permanent the same like in the case of FFS and FD.
In farmer-to-farmer (Hilje and Saunders 2008) exchange many parts of the community could be forgotten. The communication channels used are valuable in reaching the greatest number of families involved. This is the main reason why it was decided to diversify transfer methods in Yantzaza in order to reduce risk and expand coverage. Extension methods were discussed with the community, and everyone was involved and had access to the information. Section 7 summarizes the methods and we see that the adoption decision basically responded to the criteria of degree of people participation in the preliminary activities, level of education and knowledge of the farmers, leadership, establishment of the organizations and the number of
159
families as an objective being transferred. The leadership method in Yantzaza was successfully applied. The dynamics was facilitated through the high degree of parish participation in organizations, although it was informal but encompassing. The knowledge was transferred via the agrarian revolution schools during the meetings. Although the opportunity of farmer field schools is not being specifically related to the UTPL, there were problems in communication between farmers and researchers. This is due to the activities developed during the extension, there was another type of information that came to the farmers which distorted the transfer relatively. Finally, in Chicaña, the work with the used sample of demonstration families ended up successfully, that was achieved through the learning practice. In terms of demonstration families this method was satisfying, but it is still necessary to evaluate the impact on irradiated families.
New transfer patterns related to participatory methods and researchers could be developed and tested (Hoffmann et al. 2007). The success of transference lies in the adoption of knowledge. This adoption is a function of the quality of intervention that has been carried out in the transfer. Thus, it is crucial to measure and understand it.
Local authorities, cooperation and public organizations should not only support this process, but should also be involved further. The agrarian revolution schools has been an attempt but it is still a challenge to separate the political content from the technical content, which has not yet been fully differentiated. There is this challenge of integrating all these organizations towards the same goal. The important thing is to leave aside the competition in order to join work. The UTPL has proposed to do so and university-led transfer could be a solution to improve participatory methods in Yantzaza.
As a favorable result we can mention that this study was carried out with the local authorities’ high knowledge, and this has been done successfully but the real impact on the community remains to be measured.
8.3 How does the current research contribute to the international discussion on Sustainable Development nowadays?
This research can be contrasted with the challenges that currently exist in the scientific world. This paper considered the dimensions proposed by the Brutland Commission (1987) as an elementary support for its development; which is still under discussion on the global level. "On 1 January 2016, the 17 Sustainable Development Goals (SDGs) of the 2030 Agenda for Sustainable Development - adopted by world leaders in September 2015 at an historic UN Summit - officially came into force" (UN 2017, n.p.). These goals seek to improve the outcome of the Millennium Development Goals and set a sustainable agenda for the year 2030. The aim is to achieve sustainable development by ending with poverty in all its forms, reducing inequality and combating climate change and environmental protection proposals (Le Blanc 2015).
Likewise, to adapt the third dimension of sustainable development (ecological dimension) to agroecology has been a productive decision. This can be concluded because the international forums currently discuss this issue in a preponderant way. For example the International Symposium on Agroecology (FAO 2017b) was held there was held in China, where the agro-
160
ecological dimension and a priority for achieving sustainable development were treated in a special way. Traditionally, farms in China have developed ecologically-based farming systems, for instance intercropping and rotation, organic fertilization and integrated rice-fish farming. "Agroecology is a key component of China's concept of 'ecological civilization', a set of wide-ranging reforms, detailed in the 2015 plan, that has been proposed with the aim to reconcile environmental sustainability with economic development." (ibid. n.p.).
At the same time, FAO general director José Graziano da Silva (2017) has mentioned that the Focus on agriculture is the key to ensure and promote sustainable development "Agriculture is a crucial sector. It implies more than 25 percent of GDP, as well as more than 40 percent of employment in many countries involved in the Initiative”. This statement is an addition to the well-known history that goes from objectives 10 and 14 of agenda 21 to the Rio + 20 Conference with the aim of providing more sustainable agriculture and launch the process of formulating Objectives (SDG) to be integrated into the United Nations Development Agenda after 2015 (UN 2012)
The problem cited in our research is fully related to the challenge presented by 2030. Even FAO's vision for Sustainable Food and Agriculture was developed to support Strategic Objective 2 "Make agriculture, forestry and fisheries more productive and more sustainable" in relation to the Sustainable Development Goals (UN 2017, n.p.). In this vision of the world, food must be nourishing and easily accessible for all, while maintaining the resources and functions of ecosystems in a way that supports current and future generations.
FAO (2015b) also built a common vision for sustainable food and agriculture where it defined a set of elementary principles that will be the challenge of sustainable agriculture for the next 15 years. This proposal precisely covers the dimensions established by Brundtland Commission (1987) in order to meet Objective 2 of the SDG. Five principles have been established which are directly linked to the studied dimensions, the indicators and the problem presented in this research.
1. “Improving efficiency in the use of resources is crucial to sustainable agriculture 2. Sustainability requires direct action to conserve, protect and enhance natural
resources 3. Agriculture that fails to protect and improve rural livelihoods, equity and social well-
being is unsustainable 4. Enhanced resilience of people, communities and ecosystems is key to sustainable
agriculture 5. Enhanced resilience of people, communities and ecosystems is key to sustainable
agriculture” (FAO 2015, p. 18)
This model covers the interface between the human system and the natural system. Challenges are presented as fundamental principles. Within the natural system, crops, livestock, forestry, fisheries and aquaculture must be developed jointly.
When comparing this model with the strategies proposed in this research we can say that there is a high relation between them. Both FAO and this paper clearly use the three
161
dimensions defined together with the institutional and organizational support required within the framework of sustainability where livelihoods are key actors in this process.
The principles 1, 4 and 5 involve the three dimensions analyzed and the strategies established. The first one is involved through the use of natural resources and their efficient transformation into products as a fundamental challenge for sustainable land management; additionally through the use of mechanization and precise technologies that improve productivity and reduce the impact on natural resources.
The purpose of principle 4 is to improve the productivity of the system through prevention, mitigation or adoption of measures that reduce risks, generate adaptation to change and to recovery caused after disruptions.
The principle 5 refers to a special section on policies, legal and institutional basis that establishes the appropriate balance between all initiatives.
In addition, it can be verified that principle 2 focuses on detail of the agroecological dimension. Degradation of agricultural ecosystems affects the food supply and income of the poor people. Thus, reducing the pressure of ecosystems contributes to greater profitability in the long term. The over-use of resources only creates a vicious circle between poverty and environmental degradation (UN 2013).
The principle 3 focuses on the social and economic dimension. Our study highly valued rural development and its sustainability. Here is presented, what depends on it for its subsistence as the fundamental agent in this dynamic through access to resources, greater participation in markets and greater employment opportunities. Rural poverty in Yantzaza was around 67 % which is not very different from the world's average rural poverty that is presented by 75 % (World Bank 2007)
Thus, the challenge is strengthened at the global level by trying to accelerate the transition to a sustainable food and agriculture system. That system should guarantee food security and provide economic and social opportunities as long as it protects ecosystem services the food depends on.
On the other hand, other efforts are currently being made in order to respond to the current failure of land management approach. It calls for a question of refining the concepts that have been developed so far. This, for example, involves the need of involving different stakeholders, especially local communities, or to integrate policy into practice. Landscape approach (Roe 2007) has tried to include these contents. The most important feature of this concept is that it precisely includes topics that this research has considered as priorities: society concerns related to environment and development, integration of poverty alleviation goals, increasing integration of agricultural production and food security and emphasis on adaptive management where local communities and the rest of stakeholders should be involved (Prager 2015).
Priority is given to the discussion of degree to which landscape sustainability is anthropocentrically defined (human well-being) or ecocentrically defined (as a self-
162
regenerative dynamic system), always conditioning principles to a spectrum of traditions and geographical context (Selman 2008).
Sustainable development has traditionally been seen as the integration of the ecological, economic and social dimensions that the landscape approach realizes, but also it seeks to make the political dimension relevant and a kind of aesthetic dimension that would differentiate it. The results discussed in this paper support these challenges, as it was seen, the problem analysis has generated solutions from these four dimensions involved and also it generated the particularity of interventions of local actors.
CIFOR (2017) has also made efforts in order to integrate different sectors and to generate researches related to the sustainable landscape establishment. “Instead of thinking about each component of a geographic area individually, a landscape approach considers the mosaic of people, motivation, sectors and land-use jointly. In this way, people and their livelihoods are as important as environmental values, creating an opportunity to find cross-sectorial and locally adapted solutions” (CIFOR 2017, n.p.)
The discussion continues. The urgency to improve the living conditions of the local population and defend the environment is an ongoing challenge. It is necessary to determine as a priority the satisfaction of the basic needs of the population without affecting the balance of ecosystems. Achieving sustainable development requires structural changes, thinking about our lives in sense of future generation’s rights. The spaces, proposals and participatory projects have generated novel approaches that could be an alternative solution to achieve that so much desired sustainable development.
8.4 Suggestions for Further Research
The areas that require future research are the following:
• Research that relates participatory approach and rural livelihoods to local level as a contribution to reach the global sustainable development goals.
• Assessment of the political and possibly aesthetic dimension through indicators that are aligned to what is referred to the landscape approach.
• Research for the public policies that should be proposed to promote the sustainable rural development of the Ecuadorian Amazon region, base on the problems being presented in Yantzaza.
• Impact assessment of transfer methods carried out in the rural communities of Yantzaza.
163
9. - References
(2004). SPSS Inc.: Statistical package for the social sciences: SPSS for Windows.
(2007). Microsoft: Word.
(2011). STATA 13: STATA.
AEE (2002). Almanaque Electrónico Ecuatoriano. Universidad del Azuay. http://www.uazuay.edu.ec/geomatica/source/web/links/aee.html.
Aguirre, F. (2012). El Nuevo Impulso de la Extensión Rural en América Latina: Situación actual y perspectivas. http://www.redinnovagro.in/documentosinnov/nuevoimpulso.pdf.
Adger, W. Neil (2000). Social and ecological resilience: are they related? In Progress in human geography 24 (3), pp. 347–364.
Alerta verde (1996). Lo que calla la historia del "boom" camaronero. Alerta Verde. Boletín de Acción Ecológica.
Altieri, M. (1995). El estado del arte de la agroecología y su contribución al desarrollo rural en América Latina. In A. Cárdenas (Ed.), Agricultura y desarrollo sostenible (pp. 153–203). Madrid.
Altschuler, B. (2008). Repensando el desarrollo: Aportes y limitaciones del desarrollo local y la economía social a una estrategia de desarrollo. In L. Martínez (Ed.), Territorios en mutación: repensando el desarrollo desde lo local, vol. 1 (pp. 29–44). Quito: FLACSO.
Amezquita, E. (1998). Hacia la sostenibilidad de los suelos en los llanos orientales de Colombia. CIAT, 1–20.
Anderson, J. (1979). A Theoretical foundation for the gravity equation. The american economic review, 69, 106–116.
Anderson, J., & Feder, G. (2003). Rural extension services (Policy Research Working Paper 2976). Washington, D.C.: World Bank.
Antle, J., & Pingali, P. (1994). Pesticides, Productivity, and Farmer Health - a Philippine Case-Study. American Journal of Agricultural Economics(76), 418–430.
Antonellis, V. de, Pozzi, G., Schreiber, F., Tanca, L., & Tosi, L. (2009). A Web-Geographical Information System to Support Territorial Data Integration. http://pdfdrive.com/download/2569380.

164
Anríquez, Gustavo; Stamoulis, Kostas (2007): Rural development and poverty reduction: is agriculture still the key. In Electronic Journal of Agricultural and Development Economics 4 (1), pp. 5–46.
Añez, V., & Espinoza, W. (2003). respuesta de la lechuga y el repollo a la fertilización química orgánica. Forest, 47(2), 73–82.
APEOSAE (2016). Asociación de pequeños productores en el sur de la amazonía ecuatoriana. APEOSAE. http://www.apeosae.com/.
Arce, A., & Long, N. (1992). The dynamics of knowledge. Interfaces between bureaucrats and peasants. London.
Ardila, J. (2010). Extensión rural para el desarrollo de la agricultura y la seguridad alimentaria: Aspectos conceptuales, situación y una visión de futuro. San José C. R: IICA.
Armstrong, H., & Taylor, J. (2000). Regional Economics and Policy, 3rd edn. Oxford: Blackwell Publishers.
Arreola, A., Peresgrovas, V., Reyes, C., Pérez, R., & Martínez, R. (2009). De las metas a los procesos: la evaluación de proyectos de desarrollo rural exitosos en el área del Corredor Biológico Mesoamericano-Chiapas. Geografía Agrícola(42), 51–64.
Arroyo, L. A. (1999). La tecnologla de los sistemas de informacion geografica en el uso de la tierra. Retrieved from Ministerio de Agricultura de Costa Rica. http://www.mag.go.cr/congreso_agronomico_xi/a50-6907-I_237.pdf.
Arun, S., Heeks, R., & Morgan, S. (2004). Researching ICT-Based Enterprise for Women in Developing Countries: A Livelihoods Perspective: Women's ICT-Based Enterprise for Development project. University of Manchester, 1–15.
Ashworth, G., & Voogd, H. (1990). Selling the City: Marketing Approaches in Public Sector Urban Planning. London: Belhaven Press.
Asian Development Bank (2002). Technical assistance to the Republic of Kiribati for the community development and sustainable participation: Asian Development Bank.
Atlas, R., & Bartha, R. (1997). Microbial Ecology: Fundamentals and Applications, 4th edn.
Bachman, K. L., Ellickson, J. C., Goodsell, W. D., & Hurley, R. Appraisal of the economic classification of farms. Bureau of Agricultural Economics, 690–702.
Badiane, O., & Shively, G. (1998). Spatial integration, transport costs and the response of local prices to policy changes in Ghana. Development Economic, 56(2), 411–431.
165
Bahr, E., Chamba Zaragocin, D., & Makeschin, F. (2014). Soil nutrient stock dynamics and land-use management of annuals,perennials and pastures after slash-and-burn in the SouthernEcuadorian Andes. Agr.Ecosyst. Environ., 188, 275–288.
Baiphethi, M. N., & Jacobs, P. T. (2009). The contribution of subsistence farming to food security in South Africa. Agrekon, 48(4), 459-482
Banco Central del Ecuador (2011). Estadísticas Sector Real 2011. BCE. http://www.bce.fin.ec/documentos/Estadisticas/SectorReal/Previsiones/IndCoyuntura/Empleo/PobrezaDic2011.pdf.
BanEcuador (2016). Banca para el Desarrollo productivo rural y urbano del Ecuador. BanEcuador. http://www.banecuador.fin.ec/institucion/institucion-financiera/.
Barbier, E. (2011). The policy challenges for green economy and sustainable economic development. Natural Resources(35), 235.
Barbier, E. B. (1989). Economics, Natural Resource Scarcity and Development: Conventional and Alternative Views. Earthscan Publications, London.
Barbier, E. B., Burgess, J. C., & Folke, C. (1994). Paradise Lost? The Ecological Economics of Biodiversity. Earthscan Publications, London.
Bardhan, P. (1989).The new institutional economics and development theory: a brief critical assessment. World Development. 17 (9), 1389-1395.
Barkley, D., Henry, M., & Li, H. (2004). Does human capital affect rural economic growth? Evidence from the south. Retrieved from CLEMSON University. http://www.clemson.edu/redrl/redrl_rpt11.pdf.
Barrón, É. (2010). La integración productiva y comercial para la competitividad de productores comercializadores de mango de la región Costa Chica de Guerrero. Retrieved from Fundación Produce Guerrero. http://www.siac.org.mx/fichas/48%20Guerrero%20Mango.pdf.
Bartelmus, P. (1994b). Towards a framework for indicators of sustainable development: DESIPA Working Paper Series No. 7. New York: United Nations.
Bartelmus, P. (2001). Accounting for sustainability: Greening the national accounts. In M. Tolba (Ed.), Our fragile world: Challenges and opportunities for sustainable development. Oxford: Eolss.
Bartelmus, P. (2010a). Quantitative Eco-nomics: How sustainable are our economies: Springer, 24.
166
Bartelmus, P. (2010b). Quantitative Eco-nomics: How sustainable are our economies: Springer, 26.
Baumol, W. J. & Oates, W. E. (1988). The Theory of Environmental Policy, 2nd edn. Cambridge, Cambridge University Press.
Becattini, G. (1987). Il distretto industriale marshalliano: cronaca di un ritrovamento. Mercato e forze locali; Il Mulino.
Beck, E., Bendix, J., Kottke, I., Makeschin, F., & Mosandl, R. (Eds.) (2008). Gradients in a tropical mountain ecosystem of Ecuador. Ecological Studies, vol. 198, 1st edn. Berlin: Springer.
Becker, G. (1994). Human Capital: A Theoretical and Empirical Analysis, with Special Reference to Education.
Bellemare, M., & Barrett, C. (2006). An ordered tobit model of market participation: evidence from Kenya and Ethiopia. Agriculture Economics, 88(2), 324–337.
Benavides, M. (2008). De la asistencia técnica a los negocios sostenibles: Experiencia de formación de promotores agropecuarios y agroindustriales en Cajamarca. Retrieved from http://www.bvcooperacion.pe/biblioteca/bitstream/123456789/6658/1/BVCI0006293.pdf.
Bendix, J., Beck, E., Bräuning, A., Makeschin, F., Mosandl, R., Scheu, S., et al. (Eds.) (2013). Ecosystem services, biodiversity and environmental change in a tropical mountain ecosystem of south Ecuador. Ecological Studies, vol. 221, 1st edn. New York: Springer.
Bernal, M. (2013). La innovación social como factor de inclusión social en Latinoamérica. In Á. Paz, M. Paz Montoya, & R. Asensio (Eds.), Escalando innovaciones reales (pp. 17–36). Lima: IEP; IDRC-CRDI; FIDA.
Bernués, A., Ruiz, R., Olaizola, A., Villalba, D., & Casasús, I. (2011). Sustainability of pasture-based livestock farming systems in the European Mediterranean context: Synergies and trade-offs: Special Issue: Assessment for Sustainable Development of Animal Production Systems. Livestock Science, 139(1-2), 44–57.
Bessette, Guy (2006): Facilitating dialogue, learning and participation in natural resource management. In People, Land & Water: Participatory development communication for natural resource management, pp. 3–31.
Bhandari, B. (2003). Participatory rural appraisal (PRA), 1st edn: Institute for Global Environmental Strategies.
Binimelis, R., & Descombes, C. A. (2010). Comercialització en circuits curts: Identificació i tipologia. Barcelona-España: Escola Agrària de Manresa i Verlo.

167
Binswanger, M. (2006). Wachstum, nachhaltige Entwicklung und subjektives Wohlempfinden. GAIA 15/1, 69–71.
Blanchard, O. (2006). Macroeconomía, 4th edn. Madrid: Pearson Educación S.A.
BMU (2002). Bundesministerium für Umwelt, Naturschutz und Reaktorsicherheit: Bodenschutzbericht der Bundesregierung für die 14. Legislaturperiode. www.bmu.de/files/pdfs/allgemein/application/pdf/bodenschutzbericht2002.pdf.
BMZ (1999). Croos-sectoral strategy: Participatory development cooperation. German Federal Ministry for Economic Cooperation and Development. Bonn, Berlin.
Boisier, S. (2006). La imperiosa necesidad de ser diferente en la globalización: el mercadeo territorial: La experiencia de las regiones chilenas. Territorios (15), 71–85.
Bor, W., Briden, J., & Fuller, A. (1997). Rethinking Rural Human Resource Management; the Impact of Globalisation and Rural Restructuring on Rural Education and Training in Western Europe. Wageningen.
Breitschuh, G., Eckert, H., Matthes, I., & Strümpfel, J. (2008). Kriteriensystem nachhaltige Landwirtschaft (KSNL). Kurato-rium für Technik und Bauwesen in der Landwirtschaft, Darmstadt, Germany.
Bucher, E., Castro, G., & Flores, V. (1997). Conservación de ecosistemas de agua dulce: Hacia una estrategia de manejo integrado de recursos hídricos. Washington.
Bustamante, M., & Febres, M. (2010). Escuelas de campo para agricultores de café y cacao: experiencias y lecciones aprendidas en la Selva Central. Retrieved from Instituto Interamericano de Cooperación para la Agricultura. http://repiica.iica.int/docs/B2040e/B2040e.pdf.
Cabezas, C., Arróspide, N., Marquiño, W., Gutiérrez, S., Álvarez, E., & Chuquipiondo, J., et al. (2004). Evaluación del uso de una prueba rápida inmunocromatográfica en promotores de salud para el diagnóstico de la malaria en áreas rurales de la amazonia peruana. http://www.scielo.org.pe/pdf/rins/v21n1/a02v21n1.pdf.
CAF (2013). Inclusión productiva y desarrollo rural: Acceso a mercados en localidades de bajos ingresos. Banco de Desarrollo de América Latina.
Camagni, R. (Ed.) (1992). Final Report of the Research Project on Development Prospects of the Community’s Lagging Regions and the Socio-economic Consequences of the Completion of the Internal Market; an Approach in Terms of Local ‘Milieux’ and Innovation Networks. Milan.

168
Campbell, A., Converse, P., & Rodgers, W. (1976). The Quality of American Life. Russel Sage Foundation, New York.
Campilan, D. (2005). Bridging social and technical sciences in facilitating local agricultural innovation: Implications for linking social and technical sciences. Recognising coupled systems in agriculture. In A. Neef (Ed.), Participatory approaches for sustainable land use in Southeast Asia (p. 127). Tailandia: White Lotus.
Carney, D. (1998). Implementing the Sustainable Rural Livelihood Approach. DFID. Sustainable Rural Livelihoods: What contribution can we make? London.
Carr, A., Gibson, B., & Robinson, P. G. (2001). Measuring quality of life: Is quality of life determined by expectation or experience? British Medical Journal (322), 1240–1243.
Castoldi, N., & Bechini, L. (2010). Integrated sustainability assessment of cropping systems with agro-ecological and economic indicators in northern Italy. European journal of agronomy, 32(1), 59-72.
Castro, M. (2007). La distribución de la riqueza en el Ecuador. Observatorio de la economía latinoamericana, 75.
CEPAL (2001). Plan de acción regional de América Latina y el Caribe sobre asentamientos humanos. Cooperación Económica para América Latina.
CEPAL (2013). Agricultura familiar y circuitos cortos: nuevos esquemas de producción, comercialización y nutrición. Cooperación Económica para América Latina. http://www.eclac.org/ddpe/agenda/8/50498/ProgramaCircuitosCortosFinal.pdf.
Cerri, E., Easter, M., Paustian, K., Killian, K., Coleman, K., Bernoux, M., et al. (2007). Predicted soil organic carbon stocks and changes in the Brazilian Amazon between 2000 and 2030. Agriculture Ecosystems Environment, 122, 58–72.
Chambers, R. (1993). Rural Development: Putting the Last First. Londom: Longman.
Chambers, R. (1994). The origins and practice of participatory rural appraisal. World Development, 22(7), 953–959.
Chambers, R., & Arnold, P., Thrupp, L (Eds.) (1989). Farmer first: Farmer innovation and agricultural research. London.
Chiappe, M., Bacigalupe, G. F., & Dogliotti, S. (2008). Indicadores sociales para la evaluación de la sustentabilidad de sistemas de producción familiares intensivos.
Chiriboga, M. W. B. (Ed.) (2010). Diagnóstico de la pobreza rural en el Ecuador y respuestas de política pública. Quito.
169
Christen, O., & O'Halloran-Wietholtz, Z. (2002). Indikatoren für eine nachhaltige Entwicklung der Landwirtschaft. FIL Gesellschaft zur Förderung des Integrierten Landbaus. http://wcms.uzi.uni-halle.de/download.php?down=12810&elem=2228795.
CIFOR (2017). Sustainable Landscapes. Center for International Forestry Research. Retrieved from http://www.cifor.org/sustainable-landscapes/. Accessed 15 May 2017.
CNA (2000). Censo Nacional Agropecuario. INEC. http://www.ecuadorencifras.gob.ec/censo-nacional-agropecuario/.
CODESPA (2012). Lecciones aprendidas y orientaciones en el apoyo a empresas asociativas rurales y cooperativas en contextos de pobreza. Retrieved from Fundación CODESPA. http://goo.gl/r6mgWA.
CODESPA (2013). Metodología SUMA para el fortalecimiento de Organizaciones de Base: El enfoque de desarrollo de base para proyectos de generación de ingresos. Retrieved from Fundación CODESPA. http://goo.gl/9ieSmD.
Colman, D. (2009). Las Ferias Francas: Una forma de comercialización de la Agricultura Familiar: Retrieved from Fundación Argeninta. http://www.argeninta.org.ar/pdf/Las%20Ferias%20Francas.%20Una%20forma%20de%20comercializaci%C3%B3n%20de%20la%20Agricultura%20Familiar.pdf.
Conant, R., Paustian, K., & Elliott, E. (2001). Grassland management and conversion into grassland: effects on soil carbon. Ecological Applied, 11, 343–355.
Cook, M. (1988). Soil conservation on steep lands in the tropics. Soil conservation on steep lands in the tropics. Conservation Farming on Steep Lands. Conservation Farming on Steep Lands. Ankeny, IA: Soil and Water Conservation Society and World Association of Soil and Water Conservation, 18–22.
Cooper, C. (1981). Economic evaluation and the environment. London: Hodder & Stoughton.
Cramb, R., Purcel, T., & Ho, T. (2004). Participatory assessment of rural livehoods in the Central Higllands of Vietnam. Agricultural Systems, 81, 255–272.
Cubbage, F., O'Laughlin, J., & Bullock III, C. (1993). Forest resource policy. John Wiley & Sons INC. New York.
Custode, E., & Sourdat, M. (1986). Paisajes y suelos de la Amazonía ecuatoriana: entre la conservación y la explotación. Cultura, 24, 325-337., 24, 325–337.
Dale, A., & Onyx, J. (Eds.). (2010). A dynamic balance: Social capital and sustainable community development. UBC Press.
170
Daly, H. E. (1990). Toward Some Operational Principles of Sustainable Development. Ecological Economics, 2, 1–6.
David-Benz, H., Galtier, F., Egg, J., & Meijerink, G. (2011). Market information systems: Using information to improve farmer's market power and farmers organization's voice. Retrieved from Agrinatura. http://pdfdrive.com/market-information-systems-e957198.html.
Deaton, A. (1997). The Analysis of Household Surveys: A Microeconometric Approach to Development Policy: World Bank.
Deaton, A., & Zaidi, S. (2002). Guidelines for Constructing Consumption Aggregates for Welfare Analysis: World Bank.
Del Valle, G., Herrera, L., Leiva, D., Carrizo, D., Ibañez, L., & Alaniz, J., et al. (2010). El Sistema de Información Territorial Municipal como Base de una Infraestructura de Datos Espaciales. Ciencia (Facultad de Tecnologia y Ciencias Aplicadas. Universidad Nacional de Catamarca, Argentina), 51–61.
de Molina, M. G. (2013). Agroecology and politics. How to get sustainability? About the necessity for a political agroecology. Agroecology and Sustainable Food Systems, 37(1), 45-59.
de Moraes, J., Volkoff, B., Cerri, C., & Bernoux, M. (1996). Soil properties under Amazon forest and changes due to pasture installation in Rondonia. Geoderma, 70, 63–81.
Dercon, G., Deckers, J., Poesen, J., & Govers, G. (2006). Spatial variability in crop response under contour hedgerow systems in the Andes region of Ecuador. Soil and Tillage (86), 15–26.
Diacono, M., & Montemurro, F. (2010). Long-term effects of organic amendments on soil fertility. Agron. Sustain. Dev (30), 401–422.
DiBella, A., & Nevis, E. (1998). How orgnizations learn: An integrated strategy for building learning capability. San Francisco.
Diener, E., Sapyta, J., & Suh, E. (1998). Subjective well-being is essential to well-being. Psychological Inquiry, 9, 33–37.
Dirven, M. (2004). Alcanzando las metas del milenio: una mirada hacia la pobreza rural y agrícola. Santiago.
Dixon, J., Fallon Scura, L., Carpenter, R., & Sherman, P. (1988). Economic Analysis of Environmental Impacts. London: Earthscan.
Don, A., Schumacher, J., & Freibauer, A. (2011). Impact of tropical land-use change onsoil organic carbon stocks – a meta-analysis. Global Change Biology, 17, 1658–1670.
171
Doob, L. (1995). Sustainers and sustainability: Attitudes, attributes, and actions for survival. Westport, CT: Praeger.
Doppler, W., & Anh Tai, D. (2007). The impact of family decision-making on sustainable rural livelihoods. In F. Heidhues, H. Ludger, N. Andreas, N. Sybille, P. Jens, S. Pittaya, et al. (Eds.), Sustainable Land Use in Mountainous Regions of Southeast Asia. Environmental Science and Engineering (pp. 234–247). Berlin: Springer.
Doppler, W., Huyen, N., & Tai, D. A. (2007a). The Contribution of Livestock to Sustainable Development of Mountain Farming in Northern Vietnam. In F. Heidhues, L. Herrmann, A. Neff, S. Neidhart, J. Pape, P. Sruamsiri, et al. (Eds.), Sustainable Land Use in Mountainous Regions of Southeast Asia: Meeting the Challenges of Ecological, Socio-Economic and Cultural Diversity (pp. 178–187). Alemania: Springer.
Eaton, C., & Shepherd, A. (2001). Agricultura por contrato: Alianzas para el crecimiento. Roma: FAO.
Echeverría, R., Trigo, E., & Byerlee, D. (1995). Financing Agricultural Research in Latin America. Buenos Aires: World Bank. A Sour-cebook, 323.
Echeverry, R., & Riberto, M. (2002). Nueva ruralidad, visión del territorio en América Latina y el Caribe. San José.
Ecofair Trade Dialogue (2013). Ecofair Trade Dialogue. Ecofair Trade Dialogue. http://www.ecofair-trade.org/.
ECOSOC (2013). United Nations Economic and Social Council: Sustainable Development. http://www.un.org/en/ecosoc/about/sustainable.shtml. Accessed 20/08/13.
Eggertsson, T. (1990). Economic behaviour and institutions. Cambridge.
Egledow, M., & Barker, G. (1997). A System of farm Classification as an aid in Formulating Polics and for measuring the effects of changes in agricultural strategy. Applied Biology, 195–209.
Engels, F. (1847). Draft of the Communist Confession of Faith. Hamburg: Progress Publishers.
Eizaguirre, Santiago; Pradel, Marc; Terrones, Albert; Martinez-Celorrio, Xavier; García, Marisol (2012): Multilevel governance and social cohesion: Bringing back conflict in citizenship practices. In Urban Studies 49 (9), pp. 1999–2016.
Escobar, G. (2012). Diseño de una Agenda de Extensión Rural Latinoamericana para un Desarrollo Rural Inclusivo: Extensión rural con un enfoque participativo y de mercado: Hacia un marco conceptual. RIMISP.

172
EU (2000). El Partenariado Local: ¿una estrategia eficaz para promover la cohesión social? OFICINA DE PUBLICACIONES OFICIALES DE LAS COMUNIDADES EUROPEAS.
European Commission (1997). Rural Developments: Situation and Outlook. CAP, 2000 Working Document.
European Soil Charter (1972). Council of Europe: Committee of Ministers.
Everitt, B., Landau, S., & Lesse, M. (2001). Cluster Analysis, 4th edn: Taylor & Francis.
EWCS (2007). European Foundation for the Improvement of Living and Working Conditions: Fourth European Working Conditions Survey. www.eurofound.europa.eu/pubdocs/2006/98/en/2/ef0698en.pdf.
Fafchamps, M., & Hill, R. (2005). Selling at the farmgate or traveling to market. Agricultural economics, 87, 717–734.
Falconí, F. (2014). Al Sur de las decisiones: Enfrentando la crisis del siglo XXI. Quito, Ecuador: El conejo.
FAO (2001). Lecture notes of the major soils of the World. Food and Agriculture Organization of the United Nations.
FAO (2006a). Global forest resources assesment 2005. Progress towards sustainable forest management. Rome: FAO.
FAO (2006b). Global Forest Resources Assessment: Progress towards sustainable forest management. Policy and Support Branch. Roma.
FAO (2006c). Global forest resources assessment 2005.: Progress towards sustainable forest management. Rome.
FAO (2008). Sustainable livelihoods: analysis at household level. Retrieved from http://www.fao.org/docs/up/easypol/581/3-7-social%20analysis%20session_167en.pdf. Accessed 14 May 2017.
FAO (2010a). Agricultural value chain development: threat or opportunity for women’s employment? http://www.fao.org/docrep/013/i2008e/i2008e04.pdf.
FAO (2010b). Farmer field school approach: Technical manual. Sustainable agriculture information, 1st edn. Nairobi: FAO.
FAO (2010c). Global Forest Resources Assessment 2010. Mai report. Forestry paper. 163. Roma. FAO

173
FAO (2011). Metodología de Familia Demostradora e Irradiada para la implementación de la Agricultura Familiar: Apoyo a la rehabilitación productiva y el manejo sostenible de microcuencas en municipios de Ahuachapán a consecuencia de la tormenta Stan y la erupción del volcán Ilamatepec. San Salvador.
FAO (2012). Gestión social y emprendedurismo: 8 pasos para implementar un programa de capacitación con personas jóvenes rurales. http://coin.fao.org/coin-static/cms/media/15/13596810454370/gestin_social_y_emprendedurismo8_pasos_fao_.pdf
FAO (2013). Sustainability Pathways: We make the path by walking. FAO. http://www.fao.org/nr/sustainability/home/en/.
FAO (2014): Anuario Estadístico de la FAO 2014. La Alimentación y la Agricultura en América Latina y el Caribe. FAO. Santiago (Anuario Estadítico). Available online at http://www.fao.org/3/a-i3592s.pdf.
FAO (2015). Food Security. FAO. http://www.fao.org/economic/ess/ess-fs/en/.
FAO (2015b). Building a common vision for sustainable food and agriculture. Principles and approaches. ISBN 978-92-5-108471-7. Rome
FAO (2016). Food security statistics. Food and Agriculture Organization of the United Nations. http://www.fao.org/economic/ess/ess-fs/en/.
FAO (2017): Conservación de Suelos y Aguas en América Latina. Santiago. Available online at http://www.fao.org/americas/perspectivas/suelo-agua/es/.
FAO (2017b). Report of international Symposium of Agroecology in China. Kunming, Yunnan, China, 29-31 August 2016. ISBN 978-92-5-109663-5
FAOSTAT (diverse years). Faostat-Agriculture Statistical Database. United Nations Food and Agriculture Organisation. http://faostat.fao.org/default.aspx.
FAOSTAT (2002). Base de datos: Agricultura, uso de la tierra. FAO.
FAOSTAT (2015). Food and agriculture organization of the United Nations Statistics Division. FAO. http://faostat3.fao.org/home/E.
Ferranti, David de; Perry, Guillermo; Ferreira, Francisco; Walton, Michael; Coday, D. (2003): Desigualdad en América Latina y el Caribe:¿ Ruptura con la historia. In Washington, DC, Banco Mundial (BM).
Farrell, J., & Altieri, M. (1999). Agroecología: Bases científicas para una agricultura sustentable: Sistemas Agroforestales. Montevideo: Nordan–Comunidad.
174
Fearnside, P., & Barbosa, R. (1998). Soil carbon changes from conversion of forest topasture in Brazilian Amazonia. Forest Ecological Management (108), 147–166.
Félix, j., Sañudo, R., & Rojo, G. (2008). Importancia de los abonos orgánicos. Revista de Sociedad, Cultura y Desarrollo, 4(1), 55–67.
FIDAMERICA (2008). Empoderamiento de organizaciones de base para el desarrollo territorial del semiárido brasileño: Sistematización de la experiencia del Proyecto Dom HelderCamara.http://www.fidamerica.org/conferenciaagosto2008/docs/Consorcio_Brasil_sintesis_de_la_sistematizacion.pdf.
Flora, C., Kroma, M., & Meares, A. (1994). Indicators of sustainability: Community and gender. In B. Bellows (Ed.), Proceedings of the Indicators of Sustainability Conference and Workshop: August 1- 5. SANREM CRSP (pp. 81–94). Washington State University.
FONDOEMPLEO (2013). Fondoempleo: Concurso de Proyectos 2013: Línea de Cofinanciamiento.http://fondoempleo.com.pe/abril2013/Bases%20Concurso%20FEALAC%202013%20Cajamarca_VERSION%2016%2004%202013.pdf.
Fremerey, M. (2000). Creating the future of village communities: Organizational learning in the Sundarban islands of West Bengal, India. In B. Overwien (Ed.), Lernen und Handeln im globalen Kontext (pp. 93–111). Frankfurt.
Freshwater, David; Trapasso, Raffaele (2014). The disconnect between principles and practice: rural policy reviews of OECD countries. In Growth and Change 45 (4), pp. 477–498.
Fuller, R. Buckminster; Kuromiya, Kiyoshi (1982). Critical path: Macmillan. Galbraith, J. (1986). The new industrial state, 4th edn. New York: Mentor.
García, F. (2007). ¿Un nuevo modelo rural en Ecuador? Cambios y permanencias en los espacios rurales en la era de la globalización: A new rurality in Ecuador? Change and permanence in rural spaces in the era of globalization. Iconos. Revista de Ciencias Sociales, 29, 77–93.
García, L. (2008). Resistencias campesinas: La experiencia de las ferias francas de la provincia de Misiones, Argentina. In B. Mançano (Ed.), Campesinado y Agronegocio. Sao Paulo: CLACSO.
García, M. (2005). Etapas del proceso investigador. Población y Muestra. http://www3.unileon.es/dp/ado/ENRIQUE/Diversid/Webquest/poblacionmuestra.doc.
Garson, D. (n.d.). "Multiple Regression" from statnotes: Topics in multivariate analysis. http://www2.chass.ncsu.edu/garson/pa765/statnote.htm.
175
Gastó, J. (1994). Bases Ecológicas de la Política Ambiental. Comisión Nacional del Medio Ambiente y División de Organizaciones Sociales Ministerio Secretaría General de Gobierno, La Función del Municipio en el Sistema de Evaluación del Impacto Ambiental, 13–58.
Gastó, J., Rodrigo, P., Arámguiz, I., & Urrutia, C. (1997). Ordenamiento Territorial Rural en Escala Comunal Bases Conceptuales y Metodología. La Serena.
Global Landscapes Forum (2017). Landscapes for a new climate and development agenda. Retrieved from http://www.landscapes.org/. Accessed 15 may 2017.
Gold, J., & Ward, S. (1994). Place Promotion, the Use of Publicity and Marketing to Sell Towns and Regions. Chichester: John Wiley & Sons.
Gómez, I., & Gallopín, G. (1995). Potencial agrícola de América Latina, en el futuro ecológico de un continente: Una visión prospectiva de América Latina. México D.F.: Ed. de la Universidad de las Naciones y Fondo de Cultura Económica.
Gómez, R. (2010). Educación a distancia en el medio rural: una experiencia con la XO en Rivera. Revista digital Comunidad de Aprendizaje, 6–7.
Gómez-Limón, J., & Sanchez-Fernández, G. (2010). Empirical evaluation of agricultural sustainability using composite indicators. Ecological Economics, 69, 1062–1075.
González, C., Hernández, C., & Postigo, J. (2009). Evaluación de la sostenibilidad agraria: El caso de La Concordia (Nicaragua), 1st edn. Valencia: GRUPOSINV.
GRAMA, (s.f). Manual de Vermicompostaje. Grupo de acción para el Medio Ambiente. Madrid. Retrived from http://www.asociaciongrama.org/documentacion/manuales/Manual%20de%20Vermicompostaje%20GRAMA.pdf
Graziano da Silva, J (2017) FAO. Regional Office for Asia and the Pacific. Retrieved fromhttp://www.fao.org/asiapacific/news/detail-events/en/c/885681/. Accessed 14 May 2017
Grau, R., & Aide, M. (2007). Are Rural–Urban Migration and Sustainable Development Compatible in Mountain Systems? Bio One Research, 27, 119–123.
Grenz, J., Schoch, M., Stämpfli, A., & Thalmann, C. (2012). RISE. In M. E. Chávez (Ed.), Manual RISE 2.0: Haciendo que el desarrollo sostenible sea medible y tangible para los agricultores (p. 85). Switzerland.
GTZ (2006). Manual de Ferias para el Desarrollo Económico Local. Catie. Costa Rica

176
GTZ (2007). Regional Marketing. Retrieved from German Technical Cooperation. http://regionomica.de/download/Study_Regional-Marketing.pdf.
GTZ (2009). Guía Metodológica para la implementación de Talleres Fomento de Cadenas de Valor. Retrieved from Ruta.org. http://www.ruta.org/toolbox/sites/default/files/93.pdf.
Gutierrez, F., González, A., Torres, F., & Gallardo, J. (1994). Técnicas de análisis de datos multivariable. Tratamiento computacional, 1st edn. Granada: Universidad de Granada.
Gujarati, Damoder N. (2009): Basic econometrics: Tata McGraw-Hill Education. Haeckel, R. (1866). Generelle Morphologie der Organismen. Berlin: Reimer 2.
Hagen, E. (1975). The economics of development. Homewood. Illinois.
Hamer, U., Potthast, K., Burneo, I., & Makeschin, F. (2012). Nutrient stocks and phosphorus fractions in mountain soils of Southern Ecuador after conversion of forest to pasture. Biogeochemistry, 112, 495–510.
Häni, F., Boller, E., & Keller, S. (1998). Natural Regulation at the Farm Level. In C. Pickett & Bugg R. (Eds.), Enhancing Biological Control (pp. 161–210). University of California Press, Berkeley USA.
Harden, K. (2001). Soil Erosion and Sustainable Mountain Development: Experiments, Observations, and Recommendations from the Ecuadorian Andes. Mountain research and development, 21, 77–83.
Hardin, G. (1998). Essays on science and society: extensions of "the tragedy of the commons". Science, 280(5364), 682–683.
Hartemink, A. (2005). Nutrient stocks, nutrient cycling, and soil changes in cocoaecosystems. Advances in Agronomy, 86. ElsevierAcademic Press, 227–253.
Havelaar, A., & Melse, J. (2001). Quantifying public health risk in the WHO. WHO. http://www.who.int/water_sanitation_health/dwq/rivmrep.pdf.
Hayami, Y., & Vernon, W. R. (1985). Agricultural Development: An International Perspestive. Baltimore: Johns Hopkins University Press, 94.
Hecht, S. (1982). Agroforestry in the Amazon Basin: practice, theory and limits of a promising land use. Amazonia: Agriculture and Land Use Research., 331–371.
Hediger, W. (1999). Reconciling "weak" and "strong" sustainability: International Journal of Social Economics, 26(7/8/9), 1120–1143.
177
Heidhues, F., Herrmann, L., Neff, A., Neidhart, S., Pape, J., Sruamsiri, P., et al. (Eds.) (2007). Sustainable Land Use in Mountainous Regions of Southeast Asia: Meeting the Challenges of Ecological, Socio-Economic and Cultural Diversity. Alemania: Springer.
Heidhues, F., & Pape, J. (2007). Sustainable Land Use and Sustainable Rural Livelihoods in Mountainous Regions of Southeast Asia- Meeting the Challenges of Ecological, Socio-Economic and Cultural Diversity. In F. Heidhues, L. Herrmann, A. Neff, S. Neidhart, J. Pape, P. Sruamsiri, et al. (Eds.), Sustainable Land Use in Mountainous Regions of Southeast Asia: Meeting the Challenges of Ecological, Socio-Economic and Cultural Diversity (p. 5). Alemania: Springer.
Heink, U., & Kowarik, I. (2010). What are indicators? On the definition of indicators in ecology and environmental planning. Ecological Indicators (10), 584–593.
Hernández, O., Ojeda, D., Lopez, J., & Arras, A. M. (2010). Abonos orgánicos y su efecto en las propiedades físicas, químicas y biológicas del suelo. Tecnociencia, 4(1).
Hicks, J. R. (1932). Theory of Wages. London: MacMillan and Co.
Heidhues, F., Ludger, H., Andreas, N., Sybille, N., Jens, P., Pittaya, S., et al. (Eds.) (2007). Sustainable Land Use in Mountainous Regions of Southeast Asia. Environmental Science and Engineering, 1st edn. Berlin: Springer.
Hilje, L., & Saunders, J. (2008). Manejo Integrado de plagas en Mesoamérica: aportes conceptuales. Tecnológico de Costa Rica.
Hoffmann, V., Probst, K., & Christinck, A. (2007). Farmers and researchers: How can collaborative advantages be created in participatory research and technology development?. Agriculture and human values, 24(3), 355.
Howarth, R. B., & Norgaard, R. B. (1995). Intergenerational choices under global environmental change. In D. Bromley (Ed.), The Handbook of Environmental Economics (pp. 111–138). Oxford: Basil Blackwell.
Hunt, D. (1989a). Economic theories of development: An analysis of competing paradigms. New York et al.
Hunt, D. (1989b). Economic theories of development. An analysis of competing paradigms. New York.
IFPRI (2007). Formando alianzas público-privadas para la innovación agrícola. Retrieved from International Food Policy Research Institute. http://www.ifpri.org/sites/default/files/publications/sp4sp.pdf.
178
Igata, M., Hendriksen, A., & Heijman, W. (2004). Agricultural outsourcing: A comparison between the Netherlands and Japan. Applied Studies in Agribusiness and Commerce, 2933.
IICA (2009). Una mirada a las experiencias exitosas de agroindustria rural en América Latina. http://www.iica.int/Esp/organizacion/LTGC/agroindustria/Publicaciones%20de%20Agroindustria%20Rural/B1647e.pdf.
IICA (2013). Fondo concursable del IICA para la cooperación técnica: a dos años de su creación. Retrieved from Instituto Interamericano de Cooperación para la Agricultura. http://www.iica.int/Esp/dg/Documentos%20Institucionales/B3114e.pdf.
IICA y CONCOPE (2011a). Enfoques de Asociatividad entre Actores del Sistema Productivo: Conceptos, Casos Reales y Metodologías.
IICA y CONCOPE (2011b). Enfoques de Asociatividad entre Actores del Sistema Productivo: Conceptos, Casos Reales y Metodologías. http://www.iica.int/Esp/regiones/andina/Ecuador/Documentos%20de%20la%20Oficina/libro_enfoques_asociatividad.pdf.http://repiica.iica.int/docs/B2230e/B2230e.pdf
IICD (2006). Las TIC para el sector agrícola. Impacto y lecciones aprendidas de programas apoyados por el IICD. . Retrieved from International Institute for Communication and Development. http://www.iicd.org/files/Livelihoods-impactstudy-Spanish.pdf/.
IIRSA (2012). Metodología de Integración Productiva y Logística (IPrLg). http://www.iirsa.org/admin_iirsa_web/Uploads/Documents/rc_lima12_metodologia_iprlg.pdf.
ILO (2007). Local Value Chain Development for decent work: An operational guide. Retrieved from International Labour Organization. : http://www.ilo.org/wcmsp5/groups/public/---ed_emp/---emp_ent/---ifp_seed/documents/instructionalmaterial/wcms_115490.pdf.
ILO (2012). Rural sector and local development in Latin America and The Caribbean.
INEC (2010). Censo Nacional del Ecuador: Indicadores. http://www.ecuadorencifras.gob.ec/censo-nacional-economico/.
INEC (2012). Instituto Nacional de Estadísticas y Censos: Indicadores Económicos. http://www.ecuadorencifras.gob.ec/censo-nacional-economico/.
INIAP (2015). Instituto Nacional de Investigaciones Agropecuarias: Base de datos. INIAP. http://www.iniap.gob.ec/web/biblioteca/.
179
INNTA (Ed.) (2011). Guia Metodológica de Escuelas de Campo para Facilitadores y Facilitadoras en el proceso de extensión Agropecuaria. Nicaragua.
Jeinić, A., & Wagner, A. (2013). Is There (Anti-) Neoliberal Architecture?. Jovis Verlag
Jijon, A. (2001). Diagnóstico de la Microrregión Zamora Nangaritza. Universidad Nacional de Loja.
Jiménez, F., López-Barjas, Z., & Pérezj, R. (1983). Población y muestra. El muestreo: Pedagogía Experimental II, 2nd edn. Madrid: UNED.
Johnson, D. (2000). Population, food and knowledge. America Economic Review, 90(1), 1–14.
Jost, F., & Gentes, I. (2014). Payment schemes for environmental services: challenges and pitfalls with respect to effectiveness, efficiency and equity. In Forests and Rural Development (pp. 241-263). Springer Berlin Heidelberg
Kamberelis, G., & Dimitriadis, G. (2013). Focus Groups: From Structured Interviews to Collective Conversations: Routledge.
Kanbur, R., & Rauniyar, G. (2009). Conceptualizing Inclusive Development: With Applications to Rural Infrastructure and Development Assistance. http://www.adb.org/sites/default/files/OP7-conceptualizing-inclusive-development.pdf.
Kanji, N., & Greenwood, L. (2001). Participatory approaches to research and development in IIED: Learning from experience. International Institute of Environment and Development (IIED). London.
Kavaratzis, M., & Ashworth, G. J. (2005). City branding: an effective assertion of identity or a transitory marketing trick? Economische en Sociale Geografie, Vol. 96, 506–514.
Keane, D., Nielsen, C., & Dower, C. (2004). Trabajadores Comunitarios de la Salud y Promotores en California. Retrieved from Centro para las profesiones de la salud – Universidad de California, San Francisco. http://www.futurehealth.ucsf.edu/Content/29/2004-09_Community_Health_Workers_and_Promotores_in_California_Spanish_Translation.pdf
Key, N., Sadoulet, E., & Janvry, A. de (2000). Transaction costs and agricultural supply response. Agriculture Economics, 82(2), 245–259.
King, L., & Napa, C. (1998). What makes a life good? Journal of Personality and Social Psychology, 75, 156–165.
180
Kiribati. Ministry of Finance and Economic Planning (2004). Kiribati SAPHE project household survey: Ministry of Finance and Economic Planning, Republic of Kiribati.
Koning, G. de, van de Kop, P, & Fresco, L. (1997). Estimates of sub-national nutrient balances as sustainability indicators for agro-ecosystems in Ecuador. Agr.Ecosyst. Environ., 65, 127–139.
Koning, G. de, Verburg, P., Veldkamp, A., & Fresco, L. (1999). Multi-scale modelling of land use change dynamics in Ecuador. Agroecological Systems, 61, 77–93.
Kowaltowski, D. C., da Silva, V. G., Pina, S. A., Labaki, L. C., Ruschel, R. C., & de Carvalho Moreira, D. (2006). Quality of life and sustainability issues as seen by the population of low-income housing in the region of Campinas, Brazil. Habitat International, 30(4), 1100-1114.
Krantz, Lasse (2001): The sustainable livelihood approach to poverty reduction. In SIDA. Division for Policy and Socio-Economic Analysis.
Krueger, R. A., & Casey, M. A. (2014). Focus Groups: A Practical Guide for Applied Research: SAGE Publications.
Kuntze, H. et al. (1994). Bodenkunde, 5: Auflage. Verlag Eugen Ulmer, Stuttgart.
Lamotte, M. (1985). Fondaments rationnels de l'amenagement d'un territoire, 1st edn. Paris: Masson.
Landa, R., Meave, J., & Carabias, J. (1997). Environmental deterioration in rural Mexico: An examination of the concept. Ecological Applications (7), 316–329.
Larrea, C. (2003). Dolarización, crisis y pobreza en el Ecuador. Quito.
Lassibille, G., & Navarro, L. (2012). Un compendio de investigaciones en economía de la educación. Retrieved from Instituto de Estudios Fiscales. http://www.ief.es/documentos/recursos/publicaciones/revistas/presu_gasto_publico/67_01.pdf.
Le Blanc, D. (2015). Towards integration at last? The sustainable development goals as a network of targets. Sustainable Development, 23(3), 176-187.
Liamputtong, P. (2011). Focus Group Methodology: Principle and Practice: SAGE Publications.
Licandro, O., & Echeverriarza, M. (2006). Reflexiones metodológicas para el diseño de proyectos productivos asistidos. Montevideo: UNESCO.
Lichtinger, V., Székely, A., Fernández, A., & Ríos, R. (2000). Indicadores para la evaluación del desempeño. Reporte Ambiental, 55–71.

181
Llambí, L. (2001). Global-local links in Latin America’s new ruralities. Disappearing peasantries? Rural labour in Africa, Asia and Latin America. Intermediate Technology Publications, 176–191.
Longino, H. (2002). The fate of knowledge. Princeton University Press.
Lopez, V. (2010). No solo “…una forma inteligente, de sembrar el agua para cosechar energía”. Implicaciones del proyecto Coca Codo Sinclair para la Amazonía ecuatoriana. Quito.
López, V. (2006). Amazonía contemporánea: fronteras y espacio global. FLACSO. http://www.flacso.org.ec/docs/i26lopez.pdf.
López-Ridaura, S., Masera, O., & Astier, M. (2002). Evaluation the sustainability of complex socio-environmental systems. The MESMIS framework. Ecological Indicators, 2, 135–148.
Lundberg, M., & Squire, L. (1999). Growth and Inequality: Extracting the lesson for policymakers. Washington: World Bank.
MAGAP (2000). Censo nacional agropecuario.
Maguire, C., & Atchoarena, D. (2008). Educación superior y desarrollo rural: una nueva perspectiva. In D. Atchoarena & L. Gasperini (Eds.), Educación para el desarrollo rural: hacia nuevas respuestas de política (pp. 353–435). Roma: FAO-UNESCO.
Mahecha, L., & Zoot, M. S. (2002). El silvopastoreo: una alternativa de producción que disminuye el impacto ambiental de la ganadería bovina. Revista colombiana de ciencias pecuarias, 15(2), 226–231.
Mäler, K. G. (1995). Economic Growth and the Environment. In C. A. Perrings, K. G. Mäler, C. Folke, C. S. Holling, & B. O. Jansson (Eds.), Biodiversity Loss: Economic and Ecological Issues (pp. 213–224). Cambridge, Cambridge University Press.
Manríquez, V. (2009). PROGRAMA ALIMENTOS FUNCIONALES. Retrieved from Comisión Nacional de Investigación Cinetífica y Tecnológica. http://www.conicyt.cl/fondef/files/2012/09/VictorManriquez2.pdf.
Masera, O., Astier, M., & López, S. (1999). Sustentabilidad y manejo de recursos naturales. El marco de evaluación MESMIS. México. GIRA-Mundi -prensa, 1.
MASRENACE (2013). Fomento de Cadenas de Valor. Retrieved from Programa Manejo Sostenible de los Recursos Naturales y Fomento de Competencias Empresariales. http://masrenace.wikispaces.com/Fomento+de+Cadenas+de+Valor.
182
Mateo, J. P., & García, S. (2014). The Oil Sector in Ecuador. 2000-2010. Problemas del Desarrollo. Madrid: Universidad Complutense de Madrid.
May, R. (1977). Tresholds and breakpoints in ecosystems with a multiplicity of stable states. Nature, 269, 471–477.
Maya, M., Vasquez, P., Naranjo, C., Varela, C., Andrade, R., Valverde, L., Pacheco, I., Perez, F., Muriel, P. (2012). Ley de Economía Popular y Solidaria del Ecuador. Ministerio de Inclusión Económica y Social. Retrived from http://www.economiasolidaria.org/files/Ley_de_la_economia_popular_y_solidaria_ecuador.pdf
McAllister, D. M. (1980). Evaluation in environmental planning: assessing environmental, social, economic and political trade-offs. Cambridge: The MIT Press.
McCallum, J. (1995). National borders matter: Canada-US regional trade patterns. The american economic review, 85, 615–623.
McCauley, L., Anger, W., Keifer, M., Langley, R., Robson, M., & Rohlman, D. (2006). Studying health outcomes in farmworker populations exposed to pesticides. Environmental Health Perspectives, 114, 953–960.
McGinnis, M., & Ostrom, E. (1992). Design principles for local and global commons. Workshop in Political Theory and Policy Analysis. Illinois.
Mckenzie, M. (Ed.) (1994). La política y la gestión de la energía rural: la experiencia del Ecuador. Quito.
Meadows, D., Meadows, D., Randers, J., & Behrens lll, W. (Eds.) (1972). The Limits of Growth. New York: Universe Books.
Meert, H., van Huylenbroeck, G., Vernimmen, T., Bourgeois, M., & van Hecke, E. (2005). Farm household survival strategies and diversification on marginal farms. Journal of Rural Studies(21), 81–97.
Meier, B. (2004). The role of cash flow indicadores in understanding farm households. Agroscope Tänikon, Switzerland.
Meierhofer, U. (2008). RISE-Nachhaltigkeitsanalyse für die Ausgangslage und für den Planzustand 2015 am Beispiel von vier Schweizer Betrieben. Bachelor Thesis.
Meinzen-Dick, R., & Di-Gregorio, M. (2004). Acción colectiva y derechos de propiedad para el desarrollo sostenible. Washington, D.C.: IFPRI.
183
Melillo, J., Palm, C., Houghton, R., Woodwell, G., & Myers, N. (1985). A comparison of two recent stimates of disturbance in tropical forest. Enviromental Conservation, 12, 37–40.
Mellor, J. (1966). Economics of Agricultural Development. New York: Cornell Universitz Press.
Montes, P. (2001a). El ordenamiento territorial como opción de políticas urbanas y regionales en América Latina y el Caribe. CEPAL, 45, 12.
Montes, P. (2001b). El ordenamiento territorial como opción de políticas urbanas y regionales en América Latina y el Caribe. CEPAL, 45, 1–64.
Montesquieu, C.-L. (1748). The Spirit of The Laws, 1st edn. Paris.
Morgan, D. L. (1997). Focus Groups as Qualitative Research: SAGE Publications.
Mosandl, R., Günter, S., Stimm, B., & Weber, M. (2008). Ecuador suffers the highest deforestation rate in South America. In E. Beck, J. Bendix, I. Kottke, F. Makeschin, & R. Mosandl (Eds.), Gradients in a tropical mountain ecosystem of Ecuador. Ecological Studies, vol. 198 (pp. 37–40). Berlin: Springer.
Moseley, M., Cherrett, T., & Cawley, M. (2001). Local partnerships for rural development: Ireland’s experience in context. Irish Geography, vol. 34(2), 176–193.
Mosimann, T., Maillard, A., Musy, A., Neyroud, J., Rüttimann, M., & Weisskopf, P. (1991). Erosionsbekämpfung in Ackerbaugebieten: Ein Leitfaden für die Bodenerhaltung. Themenbericht des Nationalen Forschungsprogramms "Nutzung des Bodens in der Schweiz".
Müller, J. (1993). Development strategies of cooperatives: From the Beginning to the present. Quarterly Journal of International Agriculture, 32(1), 98–104.
Müller, S. (1997). Evaluating the sustentability of agriculture: The case of Reventado river wathershed in Costa Rica. Series V. Peter Lang. Ph.D (Thesis).
Murciano, J., Porrini, L., Bueno, C., & Vélez, C. (2010). Redes de cooperación público-privada y partenariados: retos y pistas para su evaluación: El caso de la Iniciativa Comunitaria Equal en Andalucía. Gestión y Análisis de Políticas Públicas (núm. 4), 161–200.
Myrdal, G. (1957). Economic Theory and Under-Developed Regions. Methuen University Paperbacks.
Neef, A. (2003). For discussion: Participatory approaches under scrutiny: Will they have a future? Quarterly Journal of International Agriculture, 42(4), 493–501.
184
Neef, A. (2005a). Participatory approaches for sustainable land use in Southeast Asia: An overview. Tailandia: White Lotus, 3.
Neef, A. (2005b). Participatory approaches for sustainable land use in Southeast Asia. Tailandia: White Lotus, 5.
Neuman, W. (2000). Social research methods. Qualitative and quantitative approach. London: Boston Mass.
Newby, H., Bell, C., Saunders, P., & Rose, D. (1981). Farming for survival: The small farmer in the contemporary rural class structure. In F. Bechofer & B. Elliott (Eds.), The Petit Bourgeoisie. London: MacMillan.
Niedzielski, A., da Cunha, A., & Bona, L. (2008). Mercados locales para la agricultura ecológica: trayectoria y desafíos. LEISA, revista de Agroecología, 24–27.
Nikolitch, R., & McKee, D. (1965) The Contribution of the Economic classification of farms to the understanding of American agriculture. Agricultural Stabilization and Conservation Service, 1545–1554.
Noordwwijk, J. A schematic view on farmers. In Participatory approaches for sustainable land use in Southeast Asia, vol. 1 (p. 193).
North, D. (1991). Institutions. Journal of Economic Perspectives, 5, 97–112.
Norton, G., Alwang, J., & Masters, W. (2010). Economics of Agricultural Development: World food systems and resources use, 2nd edn. New York: Routledge.
Núñez, J., & Berthelot, S. (2012). Los programas y sellos de certificación en comercio justo: una lectura neo-institucional con ilustraciones canadienses. Revista de Economía Pública, Social y Cooperativa (75), 300–320.
OAS (1993). Sistemas de información geográfica en el manejo de peligros naturales. http://www.oas.org/dsd/publications/Unit/oea65s/ch10.htm.
OECD (1991). Market and intervention failures in the management of forests: Final report.
OECD (2008). Joint Research Centre Handbook on constructing composite indicators: Methodology and user guide.
OECD (2010). Environmental Data. OECD. Retreived from www.oecd.org/document/0,3746,en_2649_201185_46462759_1_1_1_1,00.html.
Oerlemans, N., & Assouline, G. (2004). Enhancing farmers’ networking strategies for sustainable development. Journal of Cleaner Production (12), 469–478.
185
ONUDI y FEDEXPORT (2004). Guía de los consorcios de exportación. Retrieved from Organización de las naciones unidas para el desarrollo industrial. http://www.pnud.or.cr/sicon/sites/default/files/adjuntos_tareas/guia%20de%20consorcios%20(folleto)%20de%20exportacion%20UNIDO%20(1).pdf.
Ordaz, J. L. (2009). México: impacto de la educación en la pobreza rural. Retrieved from CEPAL. http://www.cepal.org/publicaciones/xml/4/35044/Serie_105.pdf.
Osborn, D., & Bigg, T. (1998). Earth summit II, Outcomes and analysis. Earthscan.
Ostrom, E. (1990). Governing the Commons: The evolution of institutions for colective action. Cambridge.
Palm, C., Swift, M., & Woomer, P. (1996). Soil biological dynamics in slash-and-burnagriculture. Agriculture Ecosystems Environment(58), 61–74.
Papademetriou, D. (2000). Labor mobility and human resources development policies. París: OECD publish.
Passet, R. (1989). Que l'économie serve la biosphérè. Le Monde diplomatique, 4–5.
Paulsch, A., & Czimczik, C. (2001). Classification of tropical montane shrub vegetation - a structural approach. Erde, 132, 25–39.
PDYOT (2012). Plan de desarrollo y Ordenamiento Territorial de Zamora Chinchipe. Zamora.
Peck, J., Theodore, N., & Brenner, N. (2010). Postneoliberalism and its Malcontents: Antipode 41(1), 94–116.
Perez, E. (2001). Hacia una nueva visión de lo rural. Santiago: Giarraca.
Perez, J., Enriques, M., Pazos, R., Cruz, L., Reyes, G., Salinas, J., et al. (2007). Mejora al algoritmo de agrupamiento K-means mediante un nuevo criterio de convergencia y su aplicación a bases de datos poblacionales de cáncer. México DF.
Pérez, M., & Clavijo, N. (2012). Experiencias y enfoques de procesos participativos de innovación en agricultura el caso de la corporación PBA en Colombia. Retrieved from FAO. http://www.fao.org/docrep/017/i3136s/i3136s.pdf.
Perrings, C. A., Mäler, K. G., Folke, C., Holling, C. S., & Jansson, B. O. (Eds.) (1995). Biodiversity Loss: Economic and Ecological Issues. Cambridge, Cambridge University Press.

186
Phengvichith, V., Horne, P., Connell, J., & Kerridge, P. (2010). Institutional experiences with participatory technology development in lao PDR. Participatory approaches for sustainable land use in Southeast Asia, 343–356.
Phillippson, M., & Liddon, A. (2006). Common knowledge? An exploration of knowledge transfer: Rural economic and land use programme. University of Newcastle. UK.
Pick, S., García, G., & Leenen, I. (2011). Modelo para la promoción de la salud en comunidades rurales a través del desarrollo de agencia personal y empoderamiento intrínseco. Universitas Psychologica, vol. 10(núm. 2), 327–340.
Pimentel, D., Harvey, C., & Resudarmo, P. (1995). Environmental and economic costs of soil erosion and conservation benefits. Science, 267, 1117–1123.
Piñones, S., Acosta, L., & Tartanac, F. (2006). Alianzas Productivas en Agrocadenas: Experiencias de la FAO en América Latina. Retrieved from FAO. http://www.fao.org/fileadmin/user_upload/ags/publications/Business_parnterships_es.pdf.
Pizarro, J. (2000). La migración internacional y el desarrollo en la era de la globalización e integración: temas para una agenda regional. CEPAL, Serie población y desarrollo, 10.
PNUD (2004). Guia para el establecimiento de partenariados de cooperación descentralizada en el marco de los programas ART. Retreived from http://web.undp.org/geneva/ART/how_to_participate/Guide%20for%20DC%20Es.pdf.
Pohle, P. (2008). The people settled around podocarpus national park. In E. Beck, J. Bendix, I. Kottke, F. Makeschin, & R. Mosandl (Eds.), Gradients in a tropical mountain ecosystem of Ecuador. Ecological Studies, vol. 198 (pp. 25–36). Berlin: Springer.
Porta, C., Lopez-Acevedo, & Roquero, L. (1999). Edafología para la agricultura y el medio ambiente. México D.F.
POTY (2002). Plan de Desarrollo Local del cantón Yantzaza: Caracterización biofísica, diagnóstico y ordenamiento territorial del Cantón Yantzaza. Yantzaza, 15–31.
Pound, B., Snapp, S., McDougall, C., & Braun, A. (Eds.) (2003). Managing natural resources for sustainable livelihoods: Uniting science and participation. London: Earthscan.
Prager, K. (2015). Agri-environmental collaboratives for landscape management in Europe. Current Opinion in Environmental Sustainability, 12, 59-66.
Precedo, A., Orosa, J., & Míguez, A. (2010). Marketing de ciudades y producto ciudad: una propuesta metodológica. Urban Public Economics Review (12), 13–39.
Pretty, J. N. (1994). Alternative systems of inquiry for a sustainable agriculture: Institute of Development Studies Bulletin, Vol. 25, 37–48.
187
Pretty, J. et al. (2008). Multi-year assessment of Unilever's progress towards agricultural sustainability I: indicadores, methodology and pilot farm results. Internat. J. Agric. Sust, 6, 37–62.
Pretzsch, J. (2005). Forest related rural livelihood strategies in national and global development. Forests, Trees and Livelihoods, 15(2), 115–127.
PROEMPRESA (2009). Reseña del impacto de proempresa en Nicaragua. Retrieved from Pymerural. http://www.pymerural.org/uploaded/content/category/946302061.pdf.
Programa de las Naciones Unidas para el Medio Ambiente (2000). GEO América Latina y el Caribe: Perspectivas del medio ambiente 2000. México D.F.: Oficina Regional para América Latina y el Caribe.
Quiroz, R., Darfo Estrada, R., Leon-Velarde, C., & Zandstra, H. (1995). Facing the challenge of the Andean Zone: the role of modelling in developing sustainable management of natural resources. Eco-regional approaches for sustainable land use and food production. Eco-regional approaches for sustainable land use and food production, 13–33.
Radlinsky, A., Theler, C., & Lehmann, B. (2000). Soziale Nachhaltigkeit in der Schweizer Landwirtschaft. Agrarforschung(7), 342–347.
Rainisto, S. (2003). Success factors of place marketing: a study of place marketing practices in Northern Europe and the United States. Retrieved from Aalto University. https://aaltodoc.aalto.fi/bitstream/handle/123456789/2106/isbn9512266849.pdf?sequence=1.
Ramos, L. O., Sevilla, E., Canuto, J., Nobre, H., Le Moal, M., & Souza, T. (2010). Procesos participativos para la generación de innovaciones. Innovaciones Agrícola.
Rao, I., Borrero, V., Ricaurte, J., García, R., & Ayarza, M. (1996). Adaptive attributes of tropical forage species to acid soils: Differences in shoot and root growth responses to varying phosphorus supply and soil type. Journal of Plant Nutrition, 19(2), 323–352.
Rational Chioce Theory (2017). In Business Dictionary. Retrived, March 28, 2017, from http://www.businessdictionary.com/definition/rational-choice-theory-RCT.html.
Raygada, R. (2003). La educación rural a distancia en Latinoamérica. Virtual Educa Miami 2003, 1–15.
Raymond, C., Fazey, I., Reed, M., Stringer, L., Robinson, G., & Evely, A. (2010). Integrating local and scientific knowledge for environmental management. Journal of Environmental Management, 91, 1766–1777.

188
Reij, C., & Waters-Bayer, A. (2014). Farmer innovation in Africa: a source of inspiration for agricultural development. Routledge.
Renart, L. (2002). The Cycle of a Single Company’s Involvement in an Export Consortium (Research Paper No. 477). Barcelona: IESE Business School, Universidad de Navarra.
Rencher, A., & Christensen (2012). Methods of Multivariate Analysis, 5th edn: John Willey and Sons.
Ribeiro, E., & Barbosa, F. (2007). Organizaciones de base, redes intersectoriales y procesos de desarrollo local: el desafío de la sostenibilidad. Retrieved from RedeAmérica. http://www.mapeo-rse.info/sites/default/files/Organizaciones_de_base_redes_intersectoriales_y.pdf.
RISE (2012). MANUAL RISE. In M. E. Chávez (Ed.), Manual RISE 2.0: Haciendo que el desarrollo sostenible sea medible y tangible para los agricultores (p. 22). Switzerland.
Riveiro, J. A., Marey, M. F., Marco, J. L., & Alvarez, C. J. (2008). Procedure for the classification and characterization of farms agricultural production planning; Application in the Northwest of Spain. ScienceDirect(61), 169–178.
Rodríguez, J. (2011). Migración interna y Sistema de ciudades en América Latina, intensidades, patrones, efectos y potenciales determinantes. ECLAC, 105, 3–25.
Rodrik, D. (1995). Growth policy. Getting interventions rigth: how South Korea and Taiwan grew rich. Economic Policy, vol. 20.
Roe, M. (2007). Landscape and sustainability: an overview. In J. Benson & M. Roe (Eds.), Landscape and Sustainability, 2nd ed. pp. 1–15. London: Routledge.
Romero, J., Valarezo, M., Gahona, J., Tambo, W., Valverde Ruiz, D., Castro, K., et al. (2010). Vulnerabilidad a nivel municipal cantón Yantzaza. Loja.
Romero, L. (Ed.) (2004). Agricultura orgánica elaboración y aplicación de abonos orgánicos. Guadalajara.
Romero, R. (2009). Las formas asociativas en la agricultura y las cooperativas. Procuraduría agraria, 37–66.
Roming, D., Jason, M., & Harris R. (1996). Farmer- based assessment of soil quality: a soil health scorecard. In J. Doran & A. Jones (Eds.), Methods for Assessing Soil Quality (pp. 127–158). Madison, Wisconsin, USA: Soil Science Society of America, Inc.
Rosado, J., Porrini, L., Bueno, C., & Vélez, C. (2010). Redes de cooperación público-privada y partenariados: retos y pistas para su evaluación: El caso de la Iniciativa Comunitaria Equal en Andalucía. Gestión y Análisis de Políticas Públicas(núm. 4), 161–200.
189
Rosenberg, N. (1982). Inside the Black Box: Technology and Economics. New York: Cambridge University Press.
Russel, C. S. (2001). Applying economics to the environment. Oxford: Oxford University Press.
Rostow, W. (1960). The stages of economic growth: A non-communist manifiesto. Cambridge University Press.
Rybczynski, Tadeusz M. (1955): Factor endowment and relative commodity prices. In Economica 22 (88), pp. 336–341.
Samuelson, P., & Nordhaus, W. (1992). Economics, 14th edn. New York: McGraw-Hill.
Sanders, D. (1988). Soil and water conservation on steep lands: A summary of workshop discussions. Conservation Farming on Steep Lands. Ankeny, IA: Soil and Water Conservation Society and World Association of Soil and Water Conservation, 275–282.
Santacoloma, P. (2000). An Ecologically and Economically Balanced Development in a Brazilian Savannah Region: The case of Irai de Minas. Farming Systems and Resource Economics in the Tropics, Vol. 36.
Sarandón, S., Zuluaga, M., Cieza, R., Gómez, C., Janjetic, L., & Negrete, E. (2007). Evaluación de la sustentabilidad de sistemas agrícolas de fincas en misiones, Argentina, mediante el uso de indicadores, 19–28.
Scheffer, F., & Schachtschabel, P. et al. (1989). Lehrbuch der Bodenkunde, 12: Auflage. Ferdinand Enke Verlag, Stuttgart.
Schröder, M. (2009). Memoria 2do: Taller Fomento Cadena de Miel del Suroeste. Retrieved from Programa Manejo Sostenible de los Recursos Naturales y Fomento de Competencias Empresariales. http://masrenace.wikispaces.com/file/view/Fomento+de+la+Cadena+de+Valor+Miel+12-13.11.09+-+Rivas.pdf.
Scoones, I. (2009). Livelihoods perspectives and rural development. The Journal of Peasant Studies, 36(1), 171–196.
Selman, P. (2008). What do we mean by sustainable landscape? Sustainability: Science, Practice, & Policy 4(2):23–28. Published online Dec 04, 2008. Retrieved from https://sspp.proquest.com/what-do-we-mean-by-sustainable-landscape-77f72ea83c04
Seminario \"Encuentro de altos directivos sobre la mitigación de la pobreza rural\" (2003). La pobreza rural en América Latina: Lecciones para una reorientación de las políticas. Serie seminarios y conferencias, vol. 27. Santiago de Chile: CEPAL; RIMISP; FAO.
190
Senplades (2016). Planes de Desarrollo y Ordenamiento Territorial. Quito.
Serrat, O. (2008). The sustainable livelihoods approach.
Sevilla, E., Soler, M., Gallar, D., Vara, I., & Calle, Á. (2012). Los canales cortos de comercialización alimentaria en Andalucía. Sevilla-España: Centro de Estudios Andaluces.
Shear, H., Stadler-Salt, N., Bertram, P., Horvatin, P. (2003). The development and implementation of indicators of ecosystem health in the Great Lakes basin. Environmental Monitoring and Assessment 88, 119–152. Shilpia, F., & Umali-Deininger, D. (2008). Market facilities and agricultural marketing: evidence from Tamil Nadu, India. Agricultural economics, 39, 281–294.
Simmonds, N. (1985). Farming Systems Research: A Review. The World Bank, Washington.
Singer, H. (1950). The Distribution of gains between Investing and Borrowing countries. American economic, vol. 40: American economic.
Smartland (2014). Territorios Inteligentes. Loja. Retreived from http://smartland.utpl.edu.ec/
Smith, A. (1776). The wealth of nations, 4th edn. Chicago, 1976: University of Chicago Press.
Smyth, A., & Dumansky, J. (1993). FESLM An international framework for evaluating sustainable land management. FAO World Soil Resources Report, 73.
Solow, R. (1992). An almost practical step toward sustainability. Washington D.C.: Resources for the Future.
Soto, G., & Muñoz, C. (2002). Consideraciones teórico prácticas sobre el compost, y su empleo en la agricultura: Manejo integrado de plagas y Agroecología. Agricultura Ecológica CATIE, 65, 123–125.
Spathelf, P. (2010). Sustainable forest management in a changing world: A European perspective. Managing forest ecosystems, v. 19. Dordrecht: Springer.
Stobbe, T., Eagle, A., & van Kooten, G. (2010). Niche and Direct Marketing in the Rural-Urban Fringe: A Study of the Agricultural Economy in the Lower Mainland and Fraser Valley. BC Studies(núm. 167), 105–134.
Stone, W., & Hughes, J. (2002). Measuring social capital: towards a standardised approach: Paper Presented at the 2002 Australasian Evaluation Society International Conference, Wollongong, Australia, October/November.
191
Stroebel, A., Swanepoel, F., & Pell, A. (2011). Sustainable smallholder livestock systems: A case study of Limpopo Province, South Africa. Livestock Science (139), 186–190.
Szabolcs, I. (Ed.) (1994). The concept of soil resilience: Soil resilience and sustainable land use. Wallingford. U.K.
TAC (1992). Review of CGIAR Priorities and Strategies, part. I. Technical Advisory Committee Secretariat, Food and Agriculture Organization, United Nations, April, pp. 1-250 + Annex I-VII. Taylor C, B., & Gans-Morse. jordan (2009). Neoliberalism: From New Liberal Philosophy to Anti-Liberal Slogan". 44 (2): 137–161. Studies in Comparative International Development, vol. 44.
Terluin, I. (2003). Differences in economic development in rural regions of advanced countries: an overview and critical analysis of theories. Journal of Rural Studies, 19, 327–344.
Terluin, I. J., & Post, J. H. (Eds.) (2000). Employment Dynamics in Rural Europe. Wallingford.
The Commission on Global Governance (1995). Our Global Neighbourhood. London: The Commission on Global Governance.
Thirlwall, A. (2006). Growth & Development: with special reference to developing economies, 8th edn. New York: Palgrave Macmillan.
Todaro, M. P. (1997). Economic development, 6th edn. New York.
Tolba, M. (Ed.) (2001). Our fragile world: Challenges and opportunities for sustainable development. Oxford: Eolss.
Toledo, V. (1993). La racionalidad ecológica de la producción campesina. In E. Sevilla & Gonzáles de Molina, M. (Eds.), Ecología, campesinado e historia (pp. 197–218). La Piqueta, Madrid.
Toro, G., & Espinoza, N. (2003). Los fondos competitivos para la agricultura y el desarrollo rural: Fundamentos, Aplicaciones y Lecciones Aprendidas. San José C. R: IICA.
Torquebiau, E. (1992). Are tropical agroforestry home gardens sustainable? Agriculture, ecosystems and Environment, 41, 189–207.
Tragsatec (2012). Canales cortos de comercialización en el sector agroalimentario. http://www20.gencat.cat/docs/DAR/DE_Departament/DE02_Estadistiques_observatoris/27_Butlletins/02_Butlletins_ND/Fitxers_estatics_ND/2013_fitxers_estatics/0118_2013_IA_CircuitsCurts_Estudio.pdf.
192
UGT (2012). Plan de Desarrollo y Ordenamiento territorial: Territorial Lineamientos del Plan dedesarrollo y ordenamiento. Zamora.
UNICEF (2013). Objetivos de Desarrollo del Milenio: Erradicar la pobreza extrema y el hambre. http://www.unicef.org/spanish/mdg/poverty.html. Accessed 21 August 2013.
Union Nations (1992). Agenda 21. Río de Janeiro.
United Nations (Ed.) (1994). Earth Summit, Agenda 21, the United Nations programme of action from Río. New York.
Union Nations (1998). Kyoto protocol to the United Nations Framework Convention on Climate Change
Union Nations (2003). Johannesburg declaration on sustainable development and plan of implementation of the world summit of sustainable development. New York.
United Nations (2012). Report of the United Nations Conference on Sustainable Development. Rio de Janeiro, Brazil, 20-22 June 2012. United Nations (2013). Chapter 10: Restore and conserve the natural resources essential for food security. Millennium Project Task Force on Hunger. p. 171–183.
Union Nations (2016). Millennium Development Goals. http://www.un.org/millenniumgoals/.
Union Nations (2017). Sustainable Development Goals. 17 Goal to transform our World. Retrieved from http://www.un.org/sustainabledevelopment/. Accessed 14 may 2017.
Van Noordwijk N.; Williams, S., & Verbist, B. (Eds.) (2001b). Towards integrated natural resource mangement in forest margins of the humid tropics: Local action and global concerns. ASB-Lecture Notes 1-12. Bogor, Indonesia. Vaquerizo, R. (2008). Análisis de conglomerados. Un curso introductorio. Clusters.
Villagra, A., Guzman, A., Pandolfi, D., & Leguizamon, G. (2009). Analisis de medidas no-supervisadas de calidad en clusters obtenidos por K-means y particle swarm optimization. Universidad Nacional de la Patagonia Austral. http://www.palermo.edu/ingenieria/Cica2009/Papers/20.pdf.
Vitousek, P., & Walker, L. (1989). Biological invasion by Myrica faya in Hawai: plant demography, nitrogen fixation, ecosystem effects. Ecological Monographs, 59, 247–265.
von Cramon-Taubadel, N. (2011). Global human mandibular variation reflects differences in agricultural and hunter-gatherer subsistence strategies. Proceedings of the National Academy of Sciences, 108(49), 19546-19551

193
Wei, Y., Davidson, B., Chen, D., & White, R. (2009). Balancing the economic, social and environmental dimensions of agro-ecosystems: An integrated modeling approach. Agriculture, ecosystems and Environment (131), 263–273.
Welch, L., & Joynt, P. (1987). Grouping for Export: An Effective Solution? In P. J. Rosson & S. J. Reid (Eds.), Managing Export Entry and Expansion: Concepts and Practice (pp. 54–70). New York: Praeger.
Welsch, D., & Moore, D. (1965). Problems and limitations due to criteria used for economic classification of farms, American Journal of Agricultural Economics, vol. 47(5), 1555–1564.
Wirtz, D., Chiu, C. Y., Diener, E, & Oishi, S. (2009). What constitutes a good life? Cultural differences in the role of positive and negative affect in subjective well-being. Journal of Personality(77), 1167–1196.
Woolcock, M. (2001). The place of social capital in understanding social and economic outcomes: The contribution of Human and Social Capital to Sustained Economic Growth and Well-Being. International Symposium Report. Human Resources Development Canada (HRDC) and OECD, Chapter 5, 65–88.
World Bank (1997). Organizaciones de base para la gestión de recursos en Filipinas. Retrieved from Departamento de evaluación de operaciones del Banco Mundial. http://ieg.worldbankgroup.org/Data/reports/153presp.pdf.
World Bank (1990). World Development Report 1990: poverty. World Bank report, 26–27.
World Bank (1996). Poverty assessmets: a progress review. World Bank report.
World Bank (2001): World development report 2000/2001; Attacking poverty: Oxford University Press.
World Bank (2007). World Development Report 2008. Agriculture for development.
Wright, R. (2005). Environmental Science, 9th edn. United States of América: Pearson.
Yunyan, Y. A. N. G., & Feng, Z. (2009). A Survey of Farmers' Livelihood Capital in the Framework of the Sustainable Livelihood Approach: A Case Study of the Reservoir Zone of the South-to-North Water Transfer (Middle Line) Project [J]. Issues in Agricultural Economy, 3, 58-64.
Zamorano, Escuela Agrícola Panamericana, & Cooperación Suiza en América Central (2012). Manual del Promotor Agrícola: Módulo 2: Métodos de extensión participativa. Retrieved from Zamorano. http://bdigital.zamorano.edu/bitstream/11036/1346/1/01.pdf.
Zeddies, J., & Schonleber, N. (2007). Sustainability of mountainous farming systems. In F. Heidhues, H. Ludger, N. Andreas, N. Sybille, P. Jens, S. Pittaya, et al. (Eds.), Sustainable

194
Land Use in Mountainous Regions of Southeast Asia, vol. 1. Environmental Science and Engineering (pp. 248–262). Berlin: Springer.
Zeller, M., Schrieder, G., Joachim, V., & Heidhues, F. (1997a). Rural Finance for Food Security for the Poor: Implications for Research and Policy. Washington, D.C.: International Food Policy Research Institute, 10.
Zeller, M., Schrieder, G., Joachim, V., & Heidhues, F. (1997b). Rural Finance for Food Security for the Poor: Implications for Research and Policy. Washington, D.C.: International Food Policy Research Institute, 8.
Zimmerman, C. (2007). Ambiguous, circular and polysemous: students' definitions of the balance of nature metaphor. Public Understanding of Science, 16(4), 393–406.
Zingore, S., González-Estrada, E., Delve, R. J., Herrero, M., Dimes, J. P., & Giller, K. E. (2009). An integrated evaluation of strategies for enhancing productivity and profitability of resource-constrained smallholder farms in Zimbabwe. Agricultural Systems (101), 57–68.
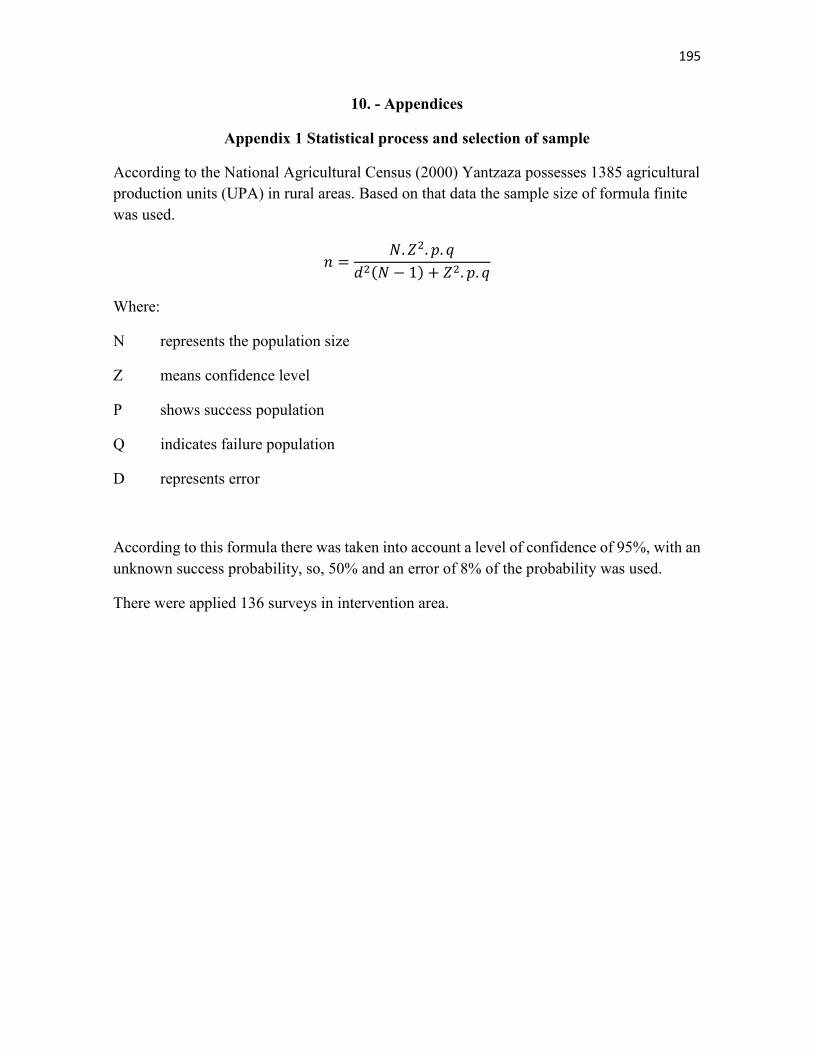
195
10. - Appendices
Appendix 1 Statistical process and selection of sample
According to the National Agricultural Census (2000) Yantzaza possesses 1385 agricultural production units (UPA) in rural areas. Based on that data the sample size of formula finite was used.
𝑛 =𝑁. 𝑍2. 𝑝. 𝑞
𝑑2(𝑁 − 1) + 𝑍2. 𝑝. 𝑞
Where:
N represents the population size
Z means confidence level
P shows success population
Q indicates failure population
D represents error
According to this formula there was taken into account a level of confidence of 95%, with an unknown success probability, so, 50% and an error of 8% of the probability was used.
There were applied 136 surveys in intervention area.

196
Appendix 2 UNIVERSIDAD TÉCNICA PARTICULAR DE LOJA – TECHNISCHE UNIVERSITÄT DRESDEN INSTITUTION OF ECONOMIC RESEARCH SURVEY EVALUATION OF THE ECONOMIC, SOCIAL AND AGROECOLOGICAL SUSTAINABILITY OF ESTABLISHMENTS IN THE AMAZON REGION
Yantzaza, 2012
DAY
I. GEOGRAPHIC LOCATION PROVINCE II. SAMPLE LOCATION CANTON PARISH AREA Urban...........................1 NEIGHBORHOOD Rural …...........................2
HOME N°-
III. HOUSING MANAGEMENT
Address Telephone: Full name of the head of household
IV. CONTROL OF WORK
Pollster observations
Pollster name
Supervisor name Typist name
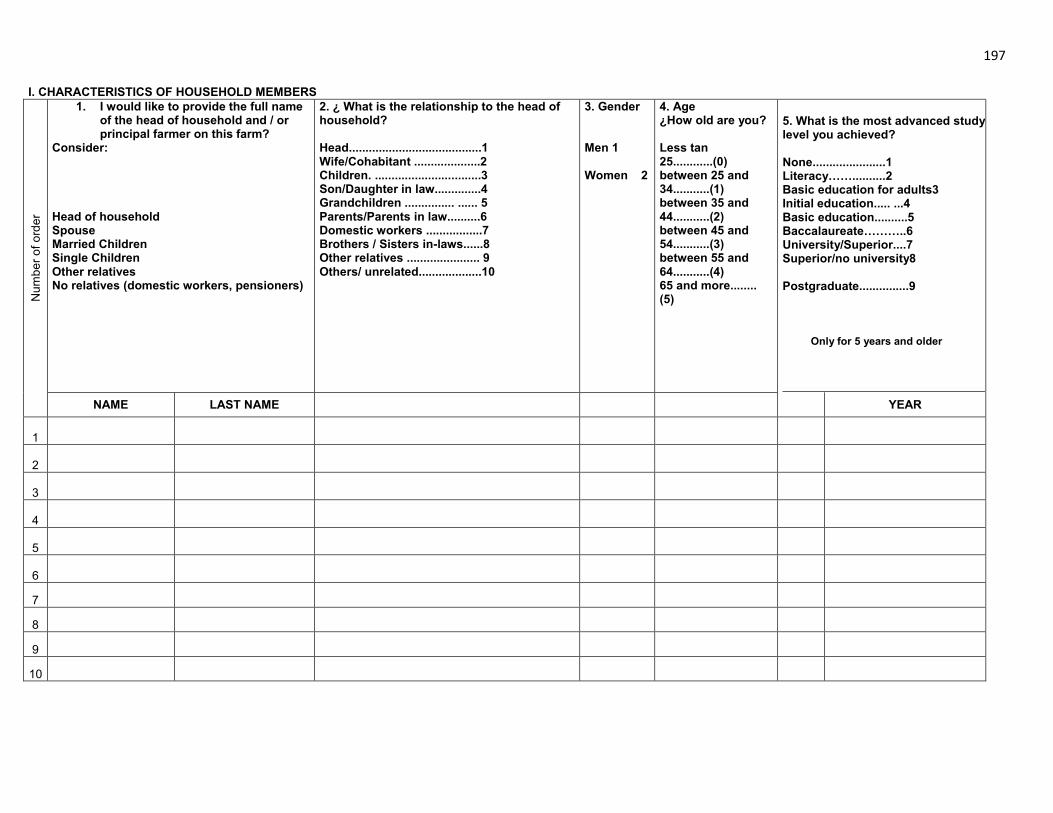
197
I. CHARACTERISTICS OF HOUSEHOLD MEMBERS
Num
ber o
f ord
er
1. I would like to provide the full name of the head of household and / or principal farmer on this farm?
Consider: Head of household Spouse Married Children Single Children Other relatives No relatives (domestic workers, pensioners)
2. ¿ What is the relationship to the head of household? Head........................................1 Wife/Cohabitant ....................2 Children. ................................3 Son/Daughter in law..............4 Grandchildren ............... ...... 5 Parents/Parents in law..........6 Domestic workers .................7 Brothers / Sisters in-laws......8 Other relatives ...................... 9 Others/ unrelated...................10
3. Gender Men 1 Women 2
4. Age ¿How old are you? Less tan 25............(0) between 25 and 34...........(1) between 35 and 44...........(2) between 45 and 54...........(3) between 55 and 64...........(4) 65 and more........ (5)
5. What is the most advanced study level you achieved? None......................1 Literacy……..........2 Basic education for adults3 Initial education..... ...4 Basic education..........5 Baccalaureate………..6 University/Superior....7 Superior/no university8 Postgraduate...............9
NAME LAST NAME YEAR
1
2
3
4
5
6
7
8
9
10
Only for 5 years and older
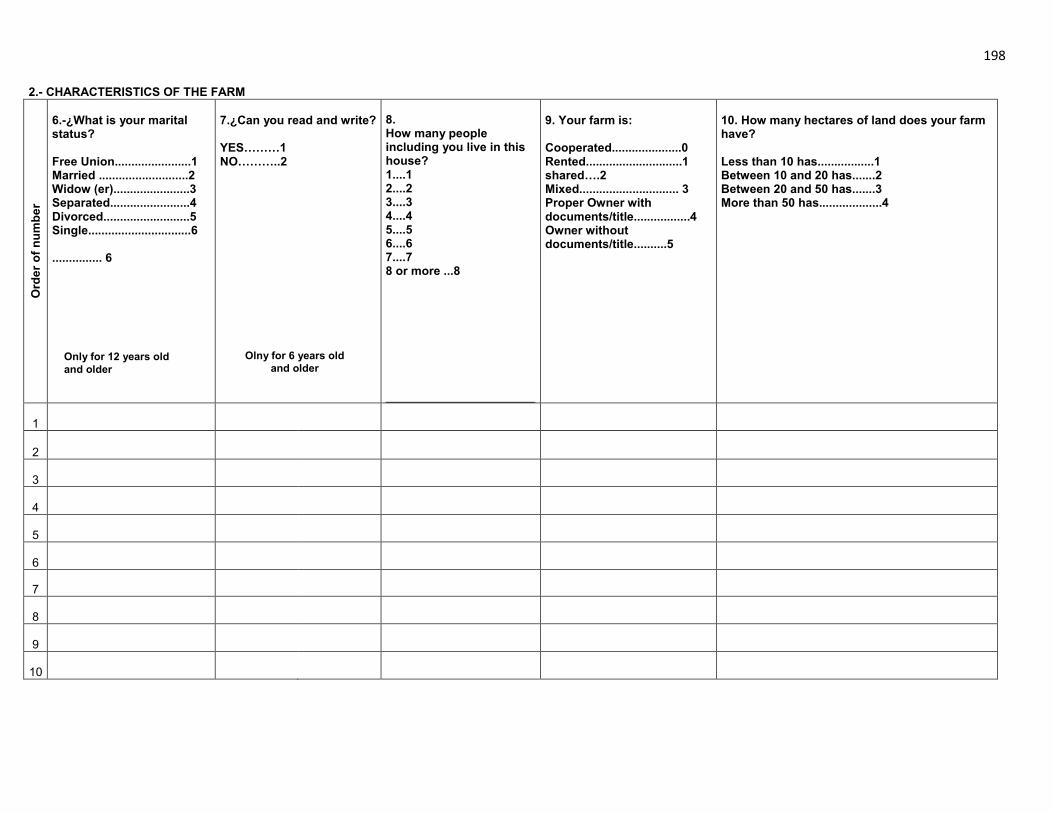
198
2.- CHARACTERISTICS OF THE FARM
Ord
er o
f num
ber
6.-¿What is your marital status? Free Union.......................1 Married ...........................2 Widow (er).......................3 Separated........................4 Divorced..........................5 Single...............................6 ............... 6
7.¿Can you read and write? YES………1 NO………..2
8. How many people including you live in this house? 1....1 2....2 3....3 4....4 5....5 6....6 7....7 8 or more ...8
9. Your farm is: Cooperated.....................0 Rented.............................1 shared….2 Mixed.............................. 3 Proper Owner with documents/title.................4 Owner without documents/title..........5
10. How many hectares of land does your farm have? Less than 10 has.................1 Between 10 and 20 has.......2 Between 20 and 50 has.......3 More than 50 has...................4
1
2
3
4
5
6
7
8
9
10
Olny for 6 years old and older
Only for 12 years old and older
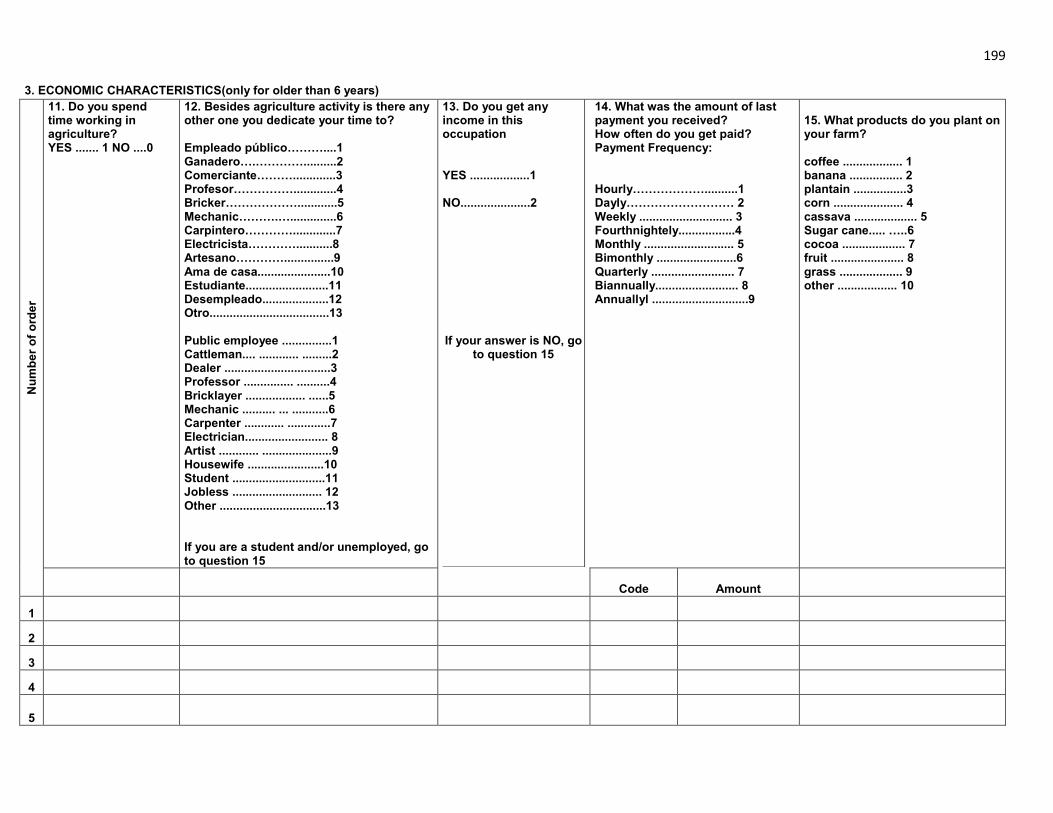
199 3. ECONOMIC CHARACTERISTICS(only for older than 6 years)
Num
ber o
f ord
er
11. Do you spend time working in agriculture? YES ....... 1 NO ....0
12. Besides agriculture activity is there any other one you dedicate your time to? Empleado público………....1 Ganadero….…………..........2 Comerciante……….............3 Profesor…………….............4 Bricker………………............5 Mechanic……….…..............6 Carpintero………….............7 Electricista…………...........8 Artesano…………...............9 Ama de casa......................10 Estudiante.........................11 Desempleado....................12 Otro....................................13 Public employee ...............1 Cattleman.... ............ .........2 Dealer ................................3 Professor ............... ..........4 Bricklayer .................. ......5 Mechanic .......... ... ...........6 Carpenter ............ .............7 Electrician......................... 8 Artist ............ .....................9 Housewife .......................10 Student ............................11 Jobless ........................... 12 Other ................................13
If you are a student and/or unemployed, go to question 15
13. Do you get any income in this occupation YES ..................1 NO.....................2
If your answer is NO, go to question 15
14. What was the amount of last payment you received? How often do you get paid? Payment Frequency: Hourly………………..........1 Dayly……………………… 2 Weekly ............................ 3 Fourthnightely.................4 Monthly ........................... 5 Bimonthly ........................6 Quarterly ......................... 7 Biannually......................... 8 Annuallyl .............................9
15. What products do you plant on your farm? coffee .................. 1 banana ................ 2 plantain ................3 corn ..................... 4 cassava ................... 5 Sugar cane..... …..6 cocoa ................... 7 fruit ...................... 8 grass ................... 9 other .................. 10
Code Amount
1
2
3
4
5

200
3.1 INCOME
Num
ber o
f ord
er
¿How
man
y he
ctar
es d
o yo
u us
e fo
r pla
ntin
g?
16. ¿How much do you plant/grow per year? In hectares.
17. How much do you sell per year? In hectares.
18. What is the average price at which you sell this product? Lbs or kg.
19. What is the annual income you obtain for the product?
20. What is the benefit your farm gets on this product (Lbs / ha or kg)
21. What is the annual income from the sale of milk? (How many liters are produced per month? How much money do you receive per liter of milk?)
22. What is the annual income from the sale of meat? (How much do you get for a cow? How many cows are sold each year? LIVESTOCK
23. What is the annual income from the sale of farm animals? (What animals do you have? How much do you get paid per animal sold?)
Coffee Banana Plantain Corn Cassava
Sugar cane
Cocoa Grass Fruit Total
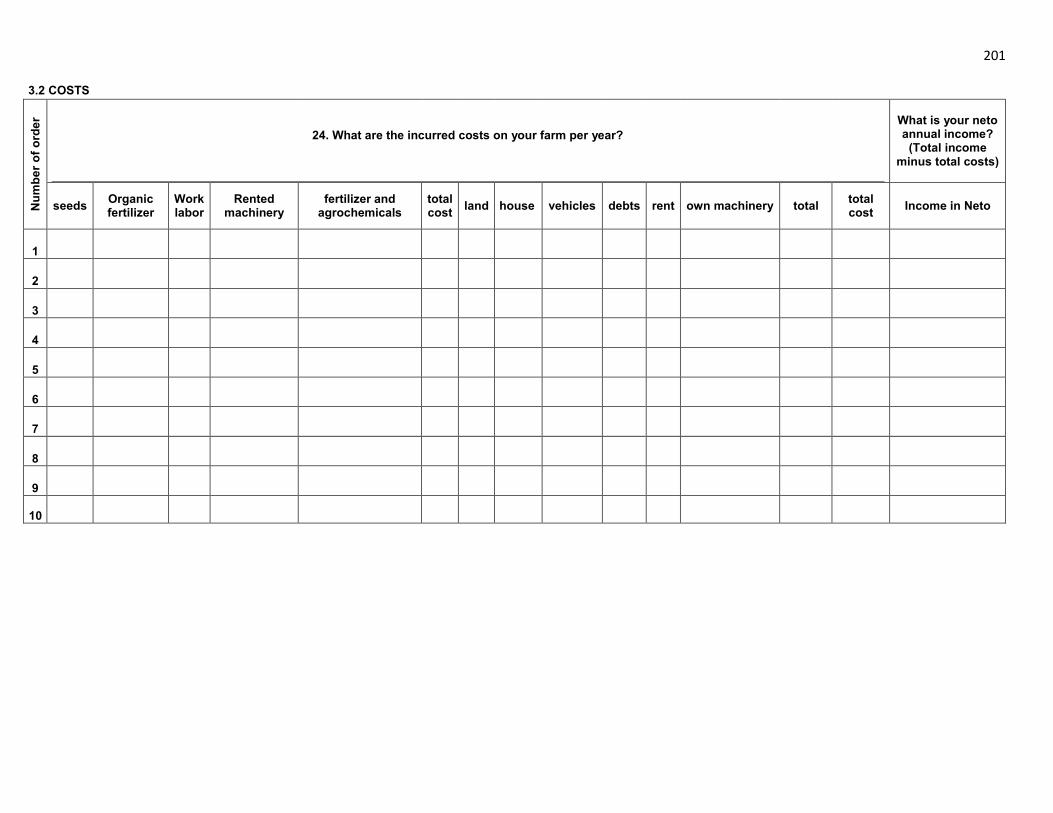
201
3.2 COSTS
Num
ber o
f ord
er
24. What are the incurred costs on your farm per year?
What is your neto annual income?
(Total income minus total costs)
seeds Organic fertilizer
Work labor
Rented machinery
fertilizer and agrochemicals
total cost land house vehicles debts rent own machinery total total
cost Income in Neto
1
2
3
4
5
6
7
8
9
10
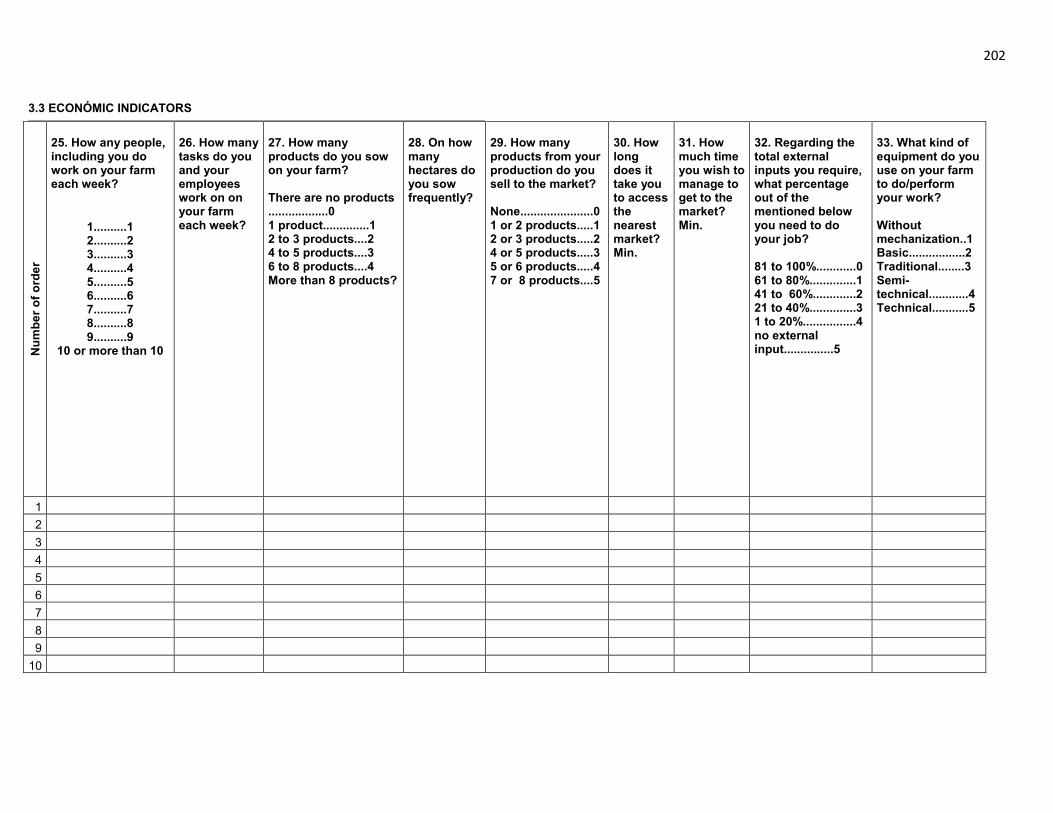
202
3.3 ECONÓMIC INDICATORS
Num
ber o
f ord
er
25. How any people, including you do work on your farm each week?
1..........1 2..........2 3..........3 4..........4 5..........5 6..........6 7..........7 8..........8 9..........9
10 or more than 10
26. How many tasks do you and your employees work on on your farm each week?
27. How many products do you sow on your farm? There are no products ..................0 1 product..............1 2 to 3 products....2 4 to 5 products....3 6 to 8 products....4 More than 8 products?
28. On how many hectares do you sow frequently?
29. How many products from your production do you sell to the market? None......................0 1 or 2 products.....1 2 or 3 products.....2 4 or 5 products.....3 5 or 6 products.....4 7 or 8 products....5
30. How long does it take you to access the nearest market? Min.
31. How much time you wish to manage to get to the market? Min.
32. Regarding the total external inputs you require, what percentage out of the mentioned below you need to do your job? 81 to 100%............0 61 to 80%..............1 41 to 60%.............2 21 to 40%..............3 1 to 20%................4 no external input...............5
33. What kind of equipment do you use on your farm to do/perform your work? Without mechanization..1 Basic.................2 Traditional........3 Semi-technical............4 Technical...........5
1 2 3 4 5 6 7 8 9
10
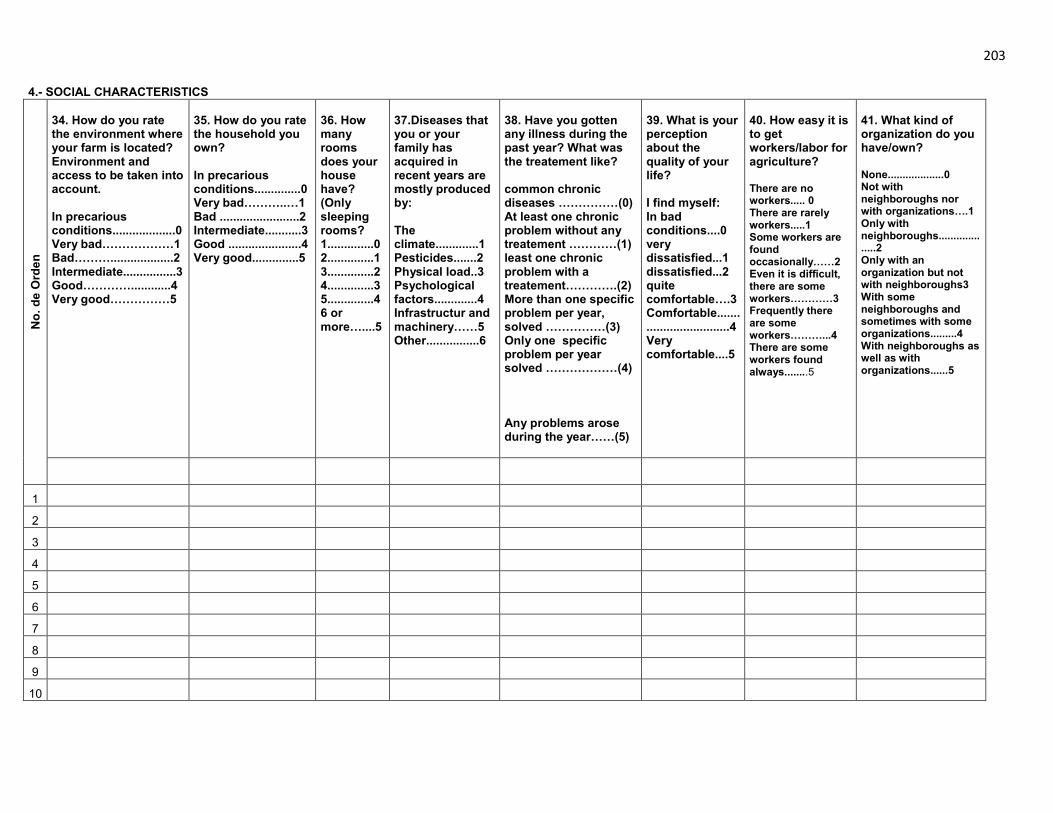
203
4.- SOCIAL CHARACTERISTICS
No.
de
Ord
en
34. How do you rate the environment where your farm is located? Environment and access to be taken into account. In precarious conditions...................0 Very bad………………1 Bad………...................2 Intermediate................3 Good…………............4 Very good……………5
35. How do you rate the household you own? In precarious conditions..............0 Very bad………..…1 Bad ........................2 Intermediate...........3 Good ......................4 Very good..............5
36. How many rooms does your house have? (Only sleeping rooms? 1..............0 2..............1 3..............2 4..............3 5..............4 6 or more…....5
37.Diseases that you or your family has acquired in recent years are mostly produced by: The climate.............1 Pesticides.......2 Physical load..3 Psychological factors.............4 Infrastructur and machinery……5 Other................6
38. Have you gotten any illness during the past year? What was the treatement like? common chronic diseases ……………(0) At least one chronic problem without any treatement …………(1) least one chronic problem with a treatement………….(2) More than one specific problem per year, solved ……………(3) Only one specific problem per year solved ………………(4) Any problems arose during the year……(5)
39. What is your perception about the quality of your life? I find myself: In bad conditions....0 very dissatisfied...1 dissatisfied...2 quite comfortable….3 Comfortable................................4 Very comfortable....5
40. How easy it is to get workers/labor for agriculture? There are no workers..... 0 There are rarely workers.....1 Some workers are found occasionally……2 Even it is difficult, there are some workers…………3 Frequently there are some workers………...4 There are some workers found always........5
41. What kind of organization do you have/own? None...................0 Not with neighboroughs nor with organizations….1 Only with neighboroughs...................2 Only with an organization but not with neighboroughs3 With some neighboroughs and sometimes with some organizations.........4 With neighboroughs as well as with organizations......5
1
2
3
4
5
6
7
8
9
10

204
5. AGROECOLÓGICAL CHARACTERISTICS
Num
ber o
f ord
er
42. What percentage of forest cover taking into account the amount of crops does your farm owns. (Chart) There is no cover……….0 1% to 25%....1 26 % to 50%.2 51% to75%...3 76% to 90%..4 91% to 100%5
43. What kind of crop rotation do you use on your farm? No crop rotation.................0 There is practically no rotation......1 Rotations between 4 and 10 years......... 2 Rotations every 2 or 3 years…………..3 Rotations every year but the ground doesn´t rest...............4 Rotation every year with the soil rest one year and then …………..5
44. What kind of agricultural practice do you perform? Perennial Monoculture perennial......0 isolated monoculture.....1 Little diversification and low association… 2 Average level of diversification with low levels of association .3 High crop diversification with half assosiation between them 4 Total diversification, with associations of crops and natural vegetation…. 5
45. What is the level of soil erosion of your land? (Chart) No erosion....4 Level .............3 Moderate.....2 Several..........1
46. Do you have conservation practices to prevent erosion? Explain the practices applied. Terrace, plow contrary, many trees. yes............1 no...........2
47. What is pending on your land? (Chart) More tan 45% 0 30 to 45 %........1 15 to 30%.........2 5 to 15%...........3 1 to 5%.............4 Flat land...5
48. What type of soil predominates in your Land? Limo ..........5 Clayey ...... 4 Gritty......... 3 Pantanoso.2 Rock…1
49. How do you rate your soil land? Very productive1 Productive2 Little productive3 Regular productive4 Unproductive5
50. What do you do with crop residues? The use of fetilizer.............5 Place waste in the field4 Fed to animas.....2 Outside the farm…..1
51. What kind of manure you use? Animal waste............5 Crop residues4 Compra abono –buy organic fertilizer3 Another type of organic fertilizer Do not use organic fertilizer..........1
1 2 3 4 5 6 7 8 9
10
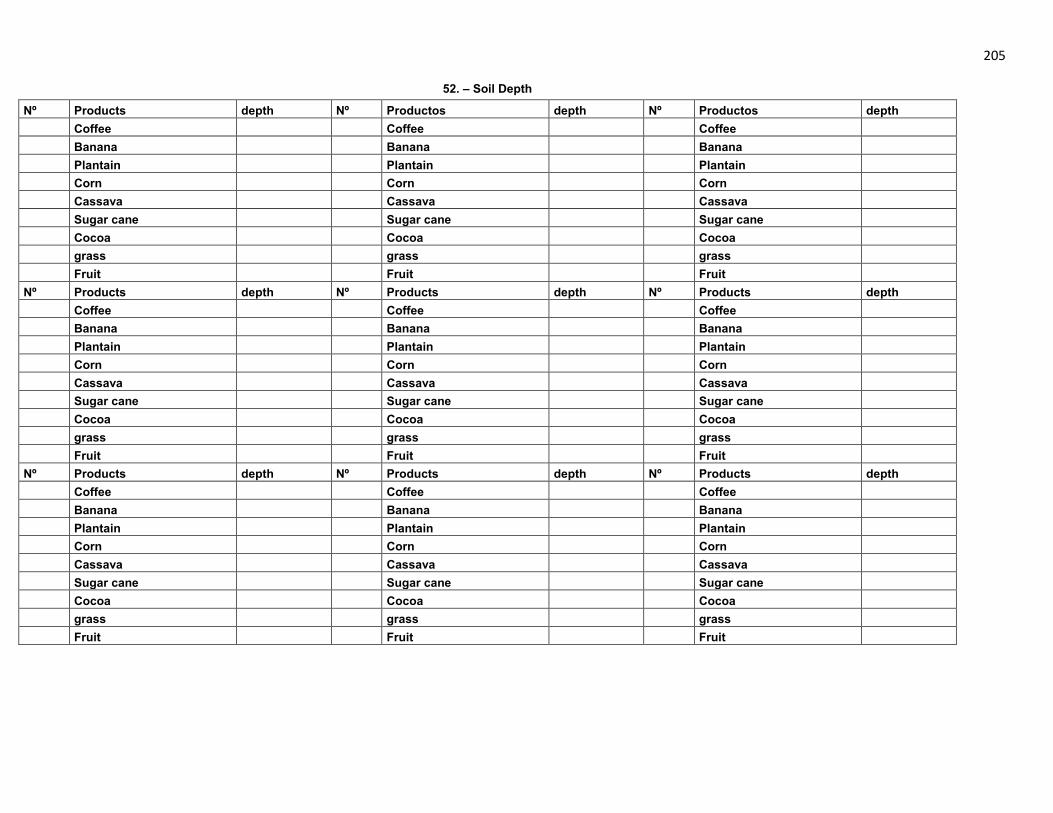
205
52. – Soil Depth
Nº Products depth Nº Productos depth Nº Productos depth Coffee Coffee Coffee Banana Banana Banana Plantain Plantain Plantain Corn Corn Corn Cassava Cassava Cassava Sugar cane Sugar cane Sugar cane Cocoa Cocoa Cocoa grass grass grass Fruit Fruit Fruit Nº Products depth Nº Products depth Nº Products depth Coffee Coffee Coffee Banana Banana Banana Plantain Plantain Plantain Corn Corn Corn Cassava Cassava Cassava Sugar cane Sugar cane Sugar cane Cocoa Cocoa Cocoa grass grass grass Fruit Fruit Fruit Nº Products depth Nº Products depth Nº Products depth Coffee Coffee Coffee Banana Banana Banana Plantain Plantain Plantain Corn Corn Corn Cassava Cassava Cassava Sugar cane Sugar cane Sugar cane Cocoa Cocoa Cocoa grass grass grass Fruit Fruit Fruit
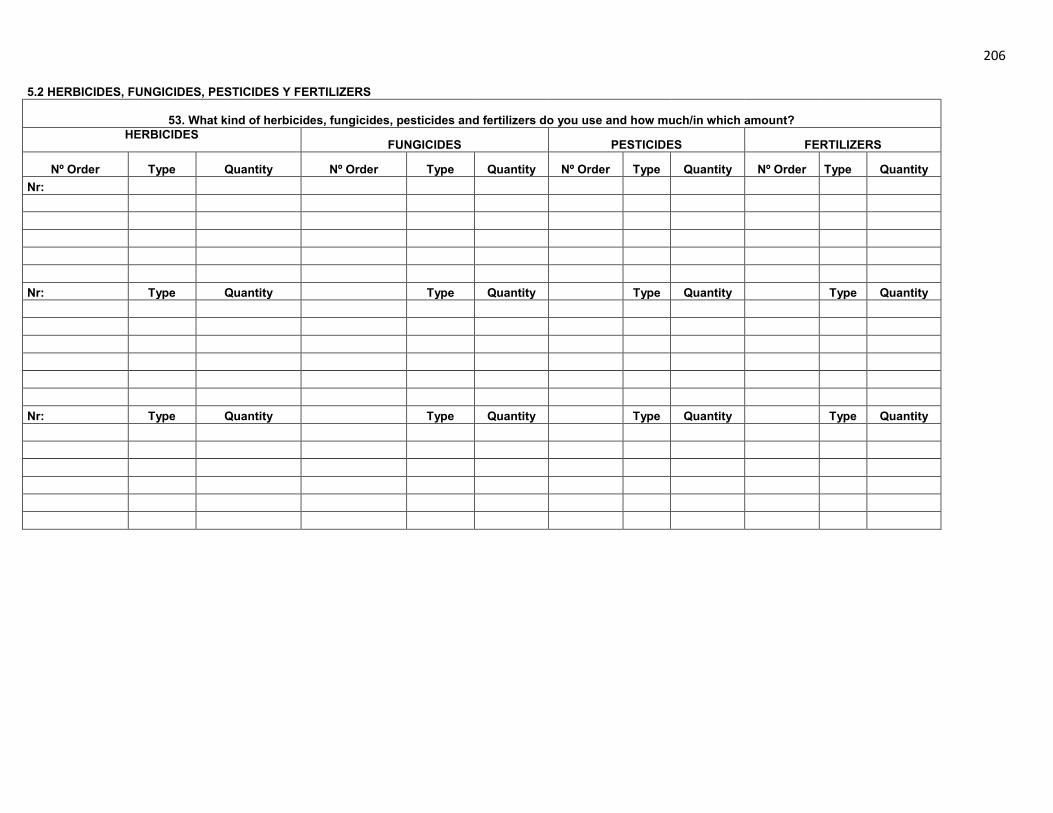
206
5.2 HERBICIDES, FUNGICIDES, PESTICIDES Y FERTILIZERS
53. What kind of herbicides, fungicides, pesticides and fertilizers do you use and how much/in which amount? HERBICIDES
FUNGICIDES PESTICIDES FERTILIZERS
Nº Order Type Quantity Nº Order Type Quantity Nº Order Type Quantity Nº Order Type Quantity Nr:
Nr: Type Quantity Type Quantity Type Quantity Type Quantity Nr: Type Quantity Type Quantity Type Quantity Type Quantity
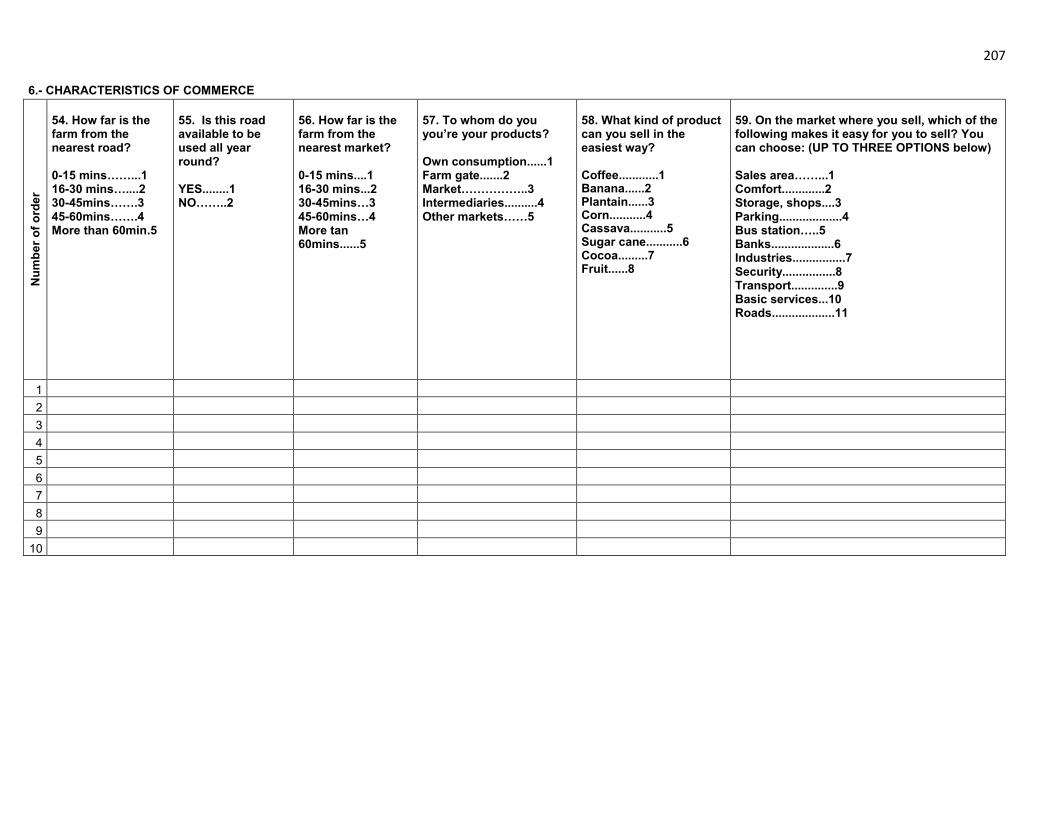
207
6.- CHARACTERISTICS OF COMMERCE
Num
ber o
f ord
er
54. How far is the farm from the nearest road? 0-15 mins……...1 16-30 mins…....2 30-45mins…….3 45-60mins…….4 More than 60min.5
55. Is this road available to be used all year round? YES........1 NO……..2
56. How far is the farm from the nearest market? 0-15 mins....1 16-30 mins...2 30-45mins…3 45-60mins…4 More tan 60mins......5
57. To whom do you you’re your products? Own consumption......1 Farm gate.......2 Market……………..3 Intermediaries..........4 Other markets……5
58. What kind of product can you sell in the easiest way? Coffee............1 Banana......2 Plantain......3 Corn...........4 Cassava...........5 Sugar cane...........6 Cocoa.........7 Fruit......8
59. On the market where you sell, which of the following makes it easy for you to sell? You can choose: (UP TO THREE OPTIONS below) Sales area……...1 Comfort.............2 Storage, shops....3 Parking...................4 Bus station…..5 Banks...................6 Industries................7 Security................8 Transport..............9 Basic services...10 Roads...................11
1 2 3 4 5 6 7 8 9
10
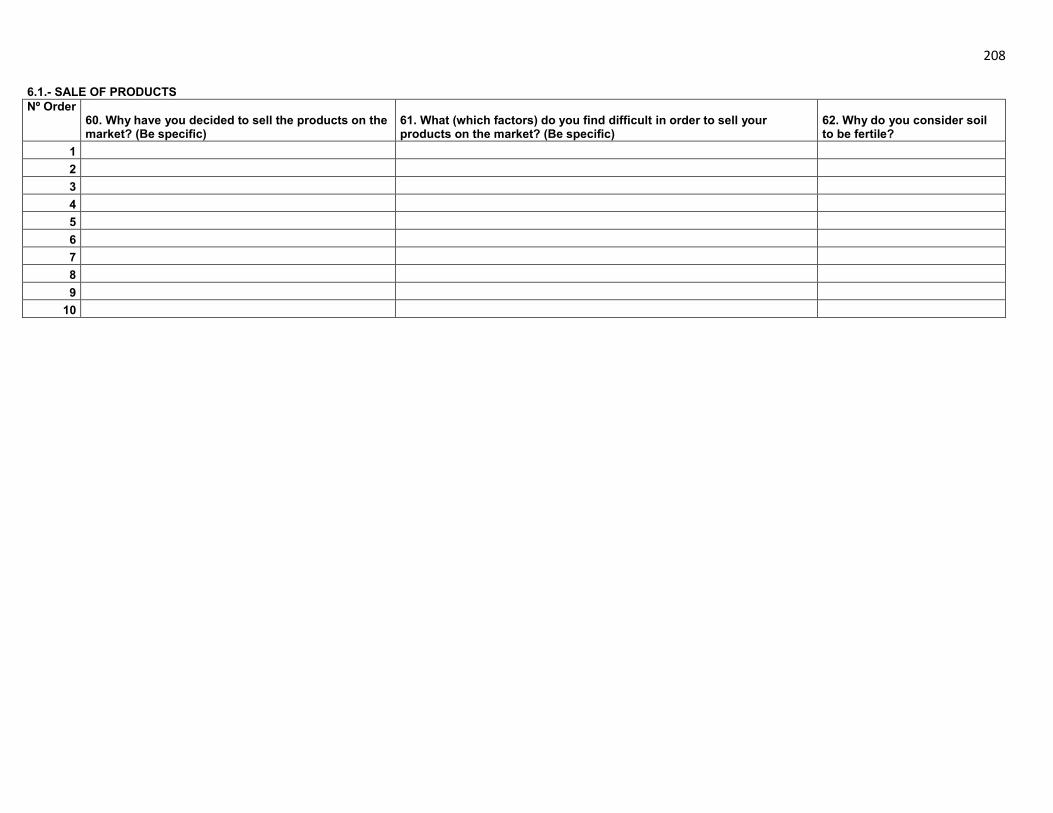
208
6.1.- SALE OF PRODUCTS Nº Order
60. Why have you decided to sell the products on the market? (Be specific)
61. What (which factors) do you find difficult in order to sell your products on the market? (Be specific)
62. Why do you consider soil to be fertile?
1 2 3 4 5 6 7 8 9
10
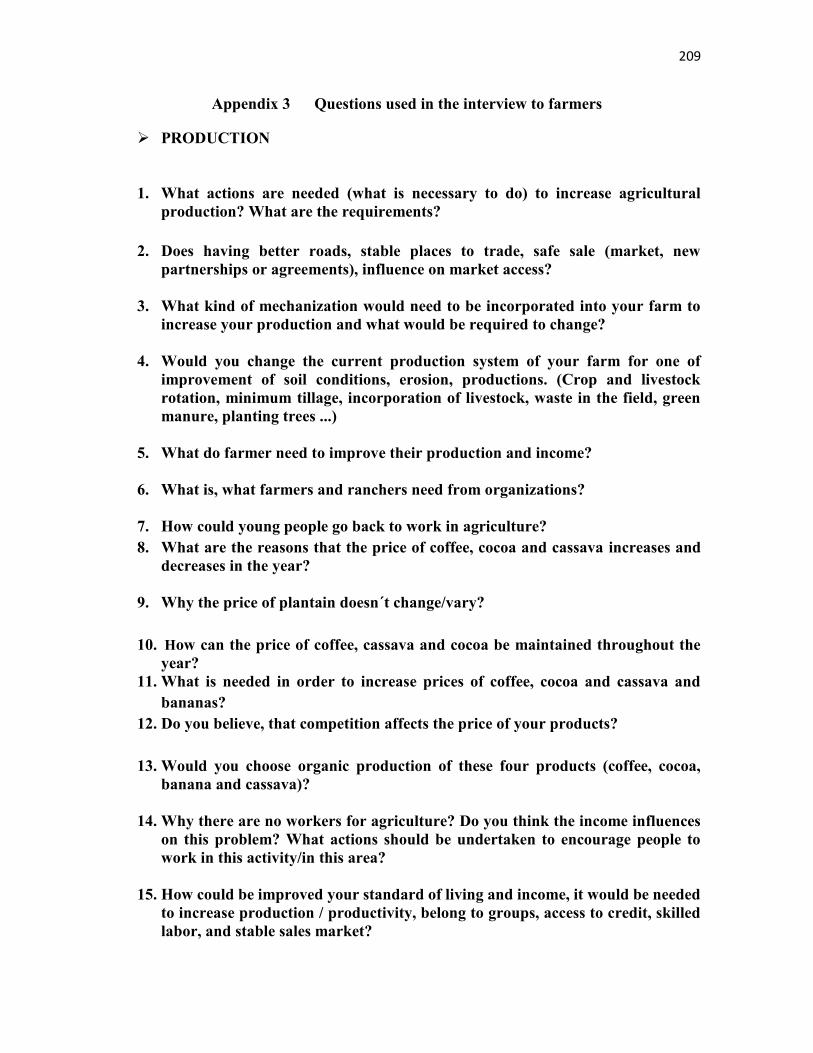
209
Appendix 3 Questions used in the interview to farmers
PRODUCTION
1. What actions are needed (what is necessary to do) to increase agricultural production? What are the requirements?
2. Does having better roads, stable places to trade, safe sale (market, new partnerships or agreements), influence on market access?
3. What kind of mechanization would need to be incorporated into your farm to
increase your production and what would be required to change? 4. Would you change the current production system of your farm for one of
improvement of soil conditions, erosion, productions. (Crop and livestock rotation, minimum tillage, incorporation of livestock, waste in the field, green manure, planting trees ...)
5. What do farmer need to improve their production and income?
6. What is, what farmers and ranchers need from organizations?
7. How could young people go back to work in agriculture? 8. What are the reasons that the price of coffee, cocoa and cassava increases and
decreases in the year?
9. Why the price of plantain doesn´t change/vary?
10. How can the price of coffee, cassava and cocoa be maintained throughout the year?
11. What is needed in order to increase prices of coffee, cocoa and cassava and bananas?
12. Do you believe, that competition affects the price of your products?
13. Would you choose organic production of these four products (coffee, cocoa, banana and cassava)?
14. Why there are no workers for agriculture? Do you think the income influences
on this problem? What actions should be undertaken to encourage people to work in this activity/in this area?
15. How could be improved your standard of living and income, it would be needed
to increase production / productivity, belong to groups, access to credit, skilled labor, and stable sales market?

210
16. How could a better future income be ensured? What does the market or agricultural activity need to make it attractive among other income? What institutions can help in order to know if this goal is met?
MARKETING CHANNELS
17. What are the ways of how the consumer can reach the agricultural products?
18. What are the means of transport used in the transportation of agricultural products?
19. How efficient are these means of transport in terms of price and speed? 20. How can customers reach different agricultural products?
21. Where do you sell your products (on market, farm gate, brokers, intermediaries,
companies)? 22. How efficient is the distribution system? 23. Do you believe that the creation of a company focused on marketing of agricultural
products is necessary? Yes or no, and why? 24. Is there any possibility of exporting some of your products? What are these
products? 25. What is the amount of exported products? 26. What do you do with surplus milk?
27. In case of farmers: What do you do with surplus production? 28. What do you think are the improvements that need rural agricultural markets?
29. What do you think are the existing problems in markets that prevent effective
marketing development?
INSTITUTIONAL
30. What types of organizations exist or have existed in the area (formed by local people)?
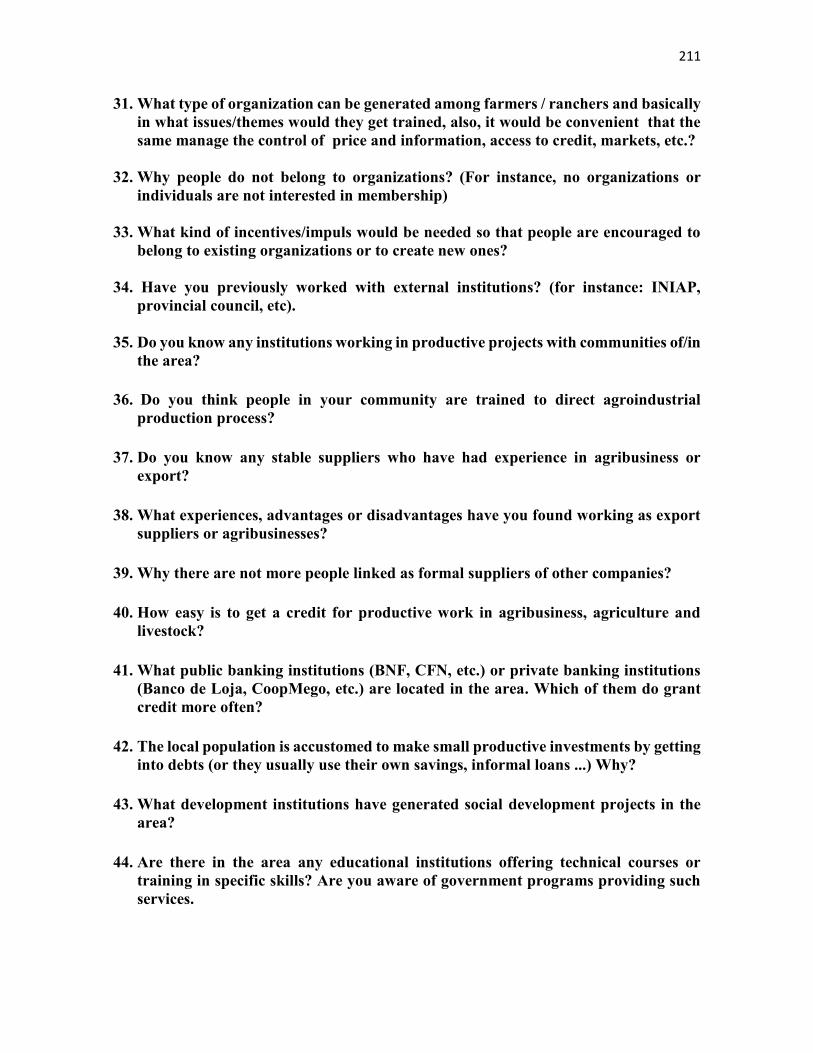
211
31. What type of organization can be generated among farmers / ranchers and basically in what issues/themes would they get trained, also, it would be convenient that the same manage the control of price and information, access to credit, markets, etc.?
32. Why people do not belong to organizations? (For instance, no organizations or
individuals are not interested in membership)
33. What kind of incentives/impuls would be needed so that people are encouraged to belong to existing organizations or to create new ones?
34. Have you previously worked with external institutions? (for instance: INIAP, provincial council, etc).
35. Do you know any institutions working in productive projects with communities of/in the area?
36. Do you think people in your community are trained to direct agroindustrial production process?
37. Do you know any stable suppliers who have had experience in agribusiness or
export?
38. What experiences, advantages or disadvantages have you found working as export suppliers or agribusinesses?
39. Why there are not more people linked as formal suppliers of other companies?
40. How easy is to get a credit for productive work in agribusiness, agriculture and
livestock?
41. What public banking institutions (BNF, CFN, etc.) or private banking institutions (Banco de Loja, CoopMego, etc.) are located in the area. Which of them do grant credit more often?
42. The local population is accustomed to make small productive investments by getting
into debts (or they usually use their own savings, informal loans ...) Why?
43. What development institutions have generated social development projects in the area?
44. Are there in the area any educational institutions offering technical courses or
training in specific skills? Are you aware of government programs providing such services.
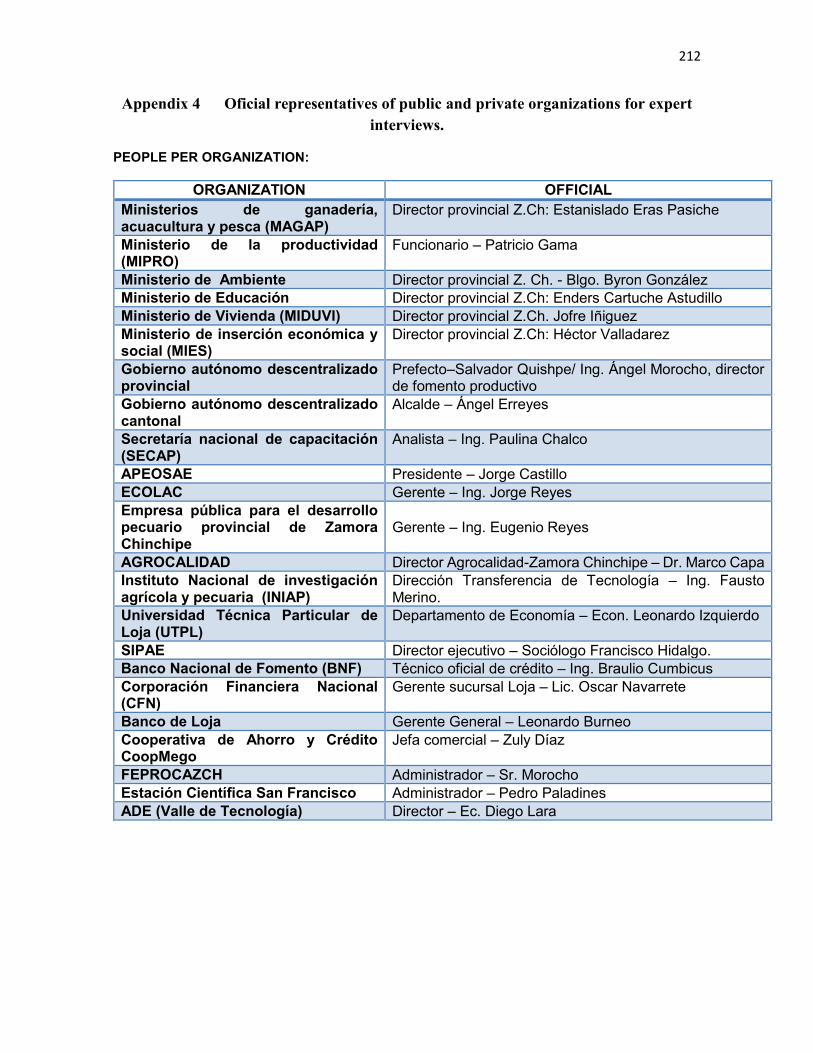
212
Appendix 4 Oficial representatives of public and private organizations for expert interviews.
PEOPLE PER ORGANIZATION:
ORGANIZATION OFFICIAL Ministerios de ganadería, acuacultura y pesca (MAGAP)
Director provincial Z.Ch: Estanislado Eras Pasiche
Ministerio de la productividad (MIPRO)
Funcionario – Patricio Gama
Ministerio de Ambiente Director provincial Z. Ch. - Blgo. Byron González Ministerio de Educación Director provincial Z.Ch: Enders Cartuche Astudillo Ministerio de Vivienda (MIDUVI) Director provincial Z.Ch. Jofre Iñiguez Ministerio de inserción económica y social (MIES)
Director provincial Z.Ch: Héctor Valladarez
Gobierno autónomo descentralizado provincial
Prefecto–Salvador Quishpe/ Ing. Ángel Morocho, director de fomento productivo
Gobierno autónomo descentralizado cantonal
Alcalde – Ángel Erreyes
Secretaría nacional de capacitación (SECAP)
Analista – Ing. Paulina Chalco
APEOSAE Presidente – Jorge Castillo ECOLAC Gerente – Ing. Jorge Reyes Empresa pública para el desarrollo pecuario provincial de Zamora Chinchipe
Gerente – Ing. Eugenio Reyes
AGROCALIDAD Director Agrocalidad-Zamora Chinchipe – Dr. Marco Capa Instituto Nacional de investigación agrícola y pecuaria (INIAP)
Dirección Transferencia de Tecnología – Ing. Fausto Merino.
Universidad Técnica Particular de Loja (UTPL)
Departamento de Economía – Econ. Leonardo Izquierdo
SIPAE Director ejecutivo – Sociólogo Francisco Hidalgo. Banco Nacional de Fomento (BNF) Técnico oficial de crédito – Ing. Braulio Cumbicus Corporación Financiera Nacional (CFN)
Gerente sucursal Loja – Lic. Oscar Navarrete
Banco de Loja Gerente General – Leonardo Burneo Cooperativa de Ahorro y Crédito CoopMego
Jefa comercial – Zuly Díaz
FEPROCAZCH Administrador – Sr. Morocho Estación Científica San Francisco Administrador – Pedro Paladines ADE (Valle de Tecnología) Director – Ec. Diego Lara

213
Appendix 5 Information requested by the organizations
INSTITUTIONS REQUEST
ALL
Programs and services for the agricultural sector Marketing and collection centers Incentives to the agricultural sector Donation of inputs and machinery Associativity (interest groups) Management training of livestock, crops, fertilizers. Management training of erosion, afforestation, reforestation Program for conservation Communal and agricultural credits
SPECIFIC TOPICS:
ORGANIZATION TOPICS MAGAP APEOSAE GAD’S ECOLAC Asociación de ganaderos de Los encuentros; Asociación de ganaderos de Yantzaza; Centro agrícola cantonal Yantzaza
Would the organization be able to associate more producers if they met the requirements of quality and quantity of production?, and would the increase of production diversify markets or in the same way would it act as a repository for new producers? Would there be granted/provided seeds and fertilizers to increase production and bring them on market? Benefits acquired by associating with this institution (or the programs offered) What and how much of agrochemicals (pesticides, herbicides and / or fertilizers) and fertilizers as urea and humus would provide producers? Which way would be used to transfer the seeds, agrochemicals, fertilizers? Via direct producer? Through an intermediary entity (farmers associations, ranchers)? How would the payment of these inputs be handled: cash and discount, donation, or a combination of both? Producers having a basic mechanization, what alternatives would be proposed to the institution to address this problem, so that at least producers have a traditional mechanization (pump, scythe, chainsaw)? ARE ONLY partners would you do it only for assocciation partners? Transportation costs would be handled as: the transport is given by the institution; costs are assumed by the farmer; or jointly?
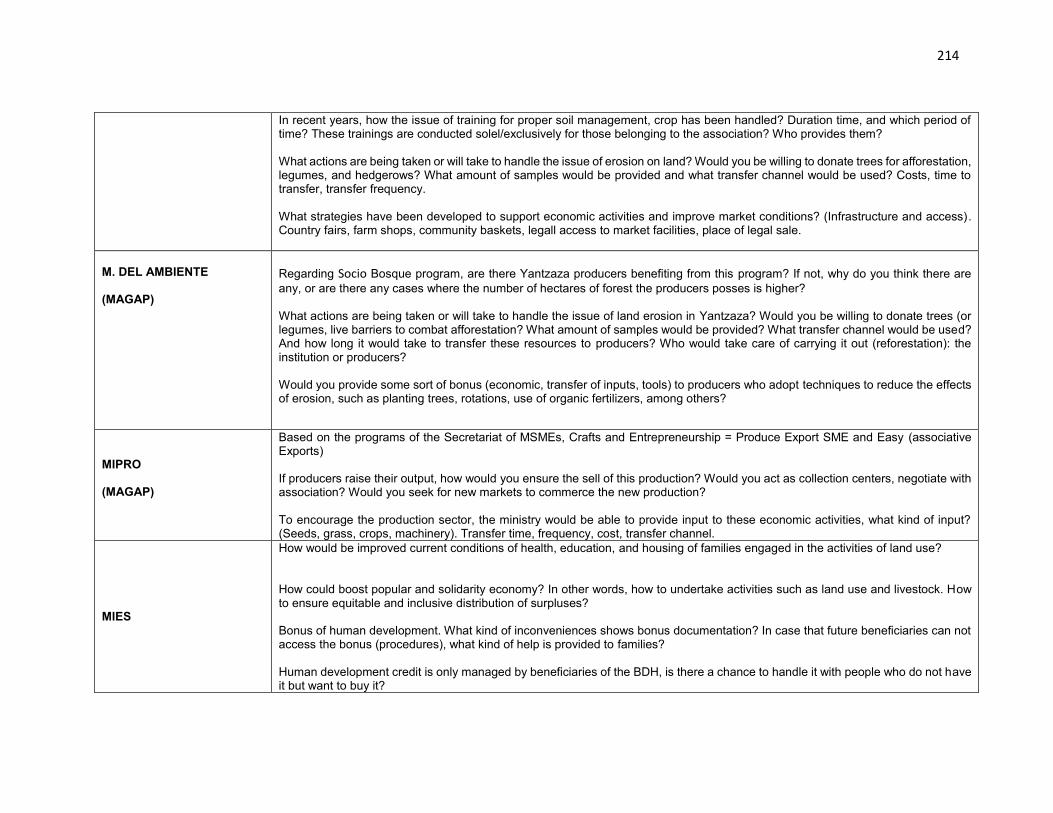
214
In recent years, how the issue of training for proper soil management, crop has been handled? Duration time, and which period of time? These trainings are conducted solel/exclusively for those belonging to the association? Who provides them? What actions are being taken or will take to handle the issue of erosion on land? Would you be willing to donate trees for afforestation, legumes, and hedgerows? What amount of samples would be provided and what transfer channel would be used? Costs, time to transfer, transfer frequency. What strategies have been developed to support economic activities and improve market conditions? (Infrastructure and access). Country fairs, farm shops, community baskets, legall access to market facilities, place of legal sale.
M. DEL AMBIENTE (MAGAP)
Regarding Socio Bosque program, are there Yantzaza producers benefiting from this program? If not, why do you think there are any, or are there any cases where the number of hectares of forest the producers posses is higher? What actions are being taken or will take to handle the issue of land erosion in Yantzaza? Would you be willing to donate trees (or legumes, live barriers to combat afforestation? What amount of samples would be provided? What transfer channel would be used? And how long it would take to transfer these resources to producers? Who would take care of carrying it out (reforestation): the institution or producers? Would you provide some sort of bonus (economic, transfer of inputs, tools) to producers who adopt techniques to reduce the effects of erosion, such as planting trees, rotations, use of organic fertilizers, among others?
MIPRO (MAGAP)
Based on the programs of the Secretariat of MSMEs, Crafts and Entrepreneurship = Produce Export SME and Easy (associative Exports) If producers raise their output, how would you ensure the sell of this production? Would you act as collection centers, negotiate with association? Would you seek for new markets to commerce the new production? To encourage the production sector, the ministry would be able to provide input to these economic activities, what kind of input? (Seeds, grass, crops, machinery). Transfer time, frequency, cost, transfer channel.
MIES
How would be improved current conditions of health, education, and housing of families engaged in the activities of land use? How could boost popular and solidarity economy? In other words, how to undertake activities such as land use and livestock. How to ensure equitable and inclusive distribution of surpluses? Bonus of human development. What kind of inconveniences shows bonus documentation? In case that future beneficiaries can not access the bonus (procedures), what kind of help is provided to families? Human development credit is only managed by beneficiaries of the BDH, is there a chance to handle it with people who do not have it but want to buy it?

215
Food supply program can be covered with goods produced within the agricultural economy of the area, what actions or requirements are needed? (Public purchase of agricultural products)
M. DE EDUCACIÓN Within these projects where are included farmers (parents of families), gift plants, who would direct it, time for execution, duration. MIDUVI
Mainly to improve housing conditions. Drinking water program and rural sanitation: meeting the rural sector, how is it handled currently, results or intervention is needed. Housing: who can benefit from these programs, which requirements are needed, time delay program execution.
MAGAP Asociación de ganaderos
For farmers, what quantity of seeds for grass would you provide for change of grass? And regarding the transition of change of grass, how would be attended the nutritional needs of rancher with additional fodder and rations, what kind of fodder? And in what quantities would they be provided? Since the most common diseases that attack livestock are mastitis and ticks, what kind of vaccine and in what amount would you be willing to grant the institution to farmers? Similarly, what amount of vitamins and minerals would be granted? How often would they be provided? What would be the channel you would use to transfer the seeds, agrochemicals, fertilizers, vitamins, minerals and vaccines? Directly to a producer? Through an intermediary entity (farmers associations)? How would the payment of these inputs be handled: cash and discount, donation, or a combination of both? How much time would be needed to transfer these resources to producers, and how often would it be made (annually, semestrally)? What strategies are being used to ensure domestic food security externally? How could be markets and products diversified, what strategies would be used?
SECAP MAGAP GAD’S
Agriculture training Agricultural and agro-industries
CFN BANCO DE LOJA BANCO DE FOMENTO CACPE LOJA CACPE YANTZAZA
Programs to assist small farmers, and this can develop their activities in land use (program characteristics, amounts, terms, fees, taxes, associations, controls, etc.) Encourage/support savings by investing in assets such as the communal ones: own, increases of the area of cultivation, the land and / or livestock. The access to credit would be more efficient if it is acquired by a farmer or by an organization. If farmers or ranchers were organized through a partnership, the requested credits had some preference in loan portfolios. What type of credit would be preferably available to grant(purchase of livestock, seeds, supplies, consumption, housing) Regarding the method of payment, expenses would be made for organizations.
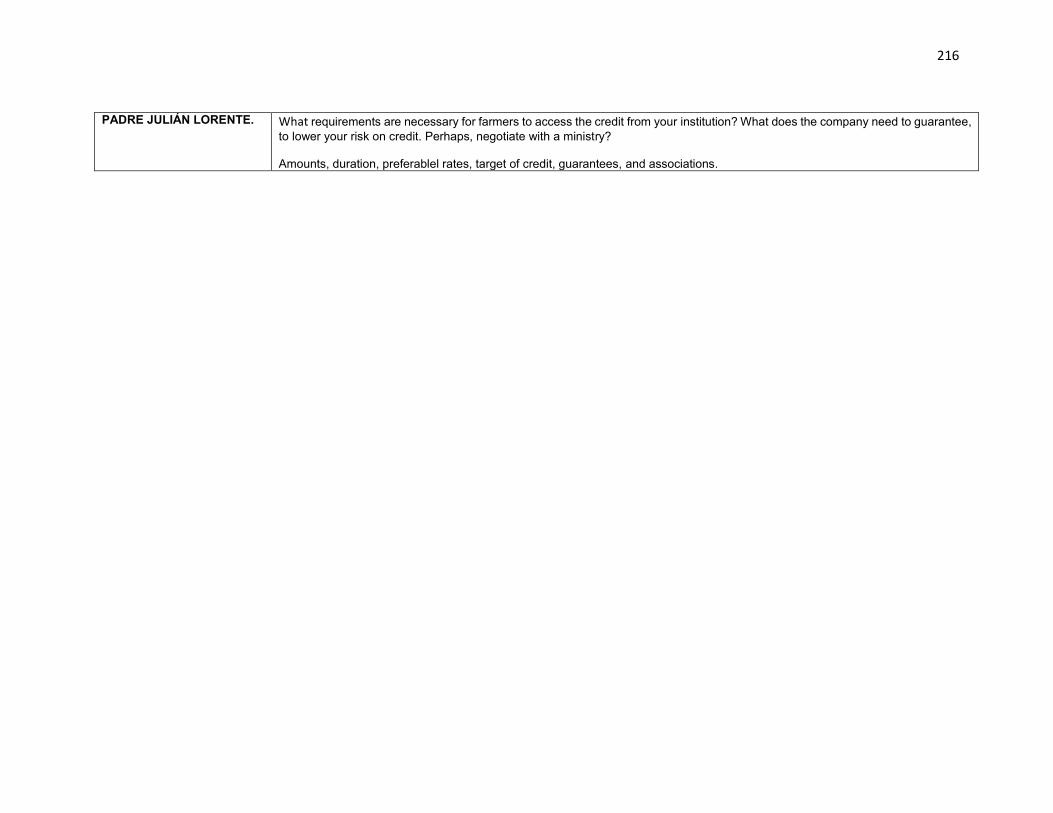
216
PADRE JULIÁN LORENTE.
What requirements are necessary for farmers to access the credit from your institution? What does the company need to guarantee, to lower your risk on credit. Perhaps, negotiate with a ministry? Amounts, duration, preferablel rates, target of credit, guarantees, and associations.

217
Appendix 6 Common scale for standardization of indicators
The need for standardization of such indicators that are homogeneous caused that there was used a common scale. The scale is from 0 to 5. Following 0 being equivalent to low sustainability and 5 being the highest value of the determined scale. The following equation has been used and as a result is defined a sub-index. (González 2009) (Wei et al. 2009).
Sic =Xij−Minij
Maxij−Minij (1)
Where:
Sic is a sub-index of sustainability
For each Xij is the respective value of the variable i in the farm j
Minij is the minimum value i between all farms j
Maxij is the maximum value i between all farms j
Then, the result of the previous formula is indicated in the following table:
Intervals Number
0% - 10% 0,5
11% - 20% 1
21% - 30% 1,5
31% - 40% 2
41% - 50% 2,5
51% - 60% 3
61% - 70% 3,5
71% - 80% 4
81% - 90% 4,5
91% - 100% 5
The appropriate sustainability value varies according to each of the indicators.
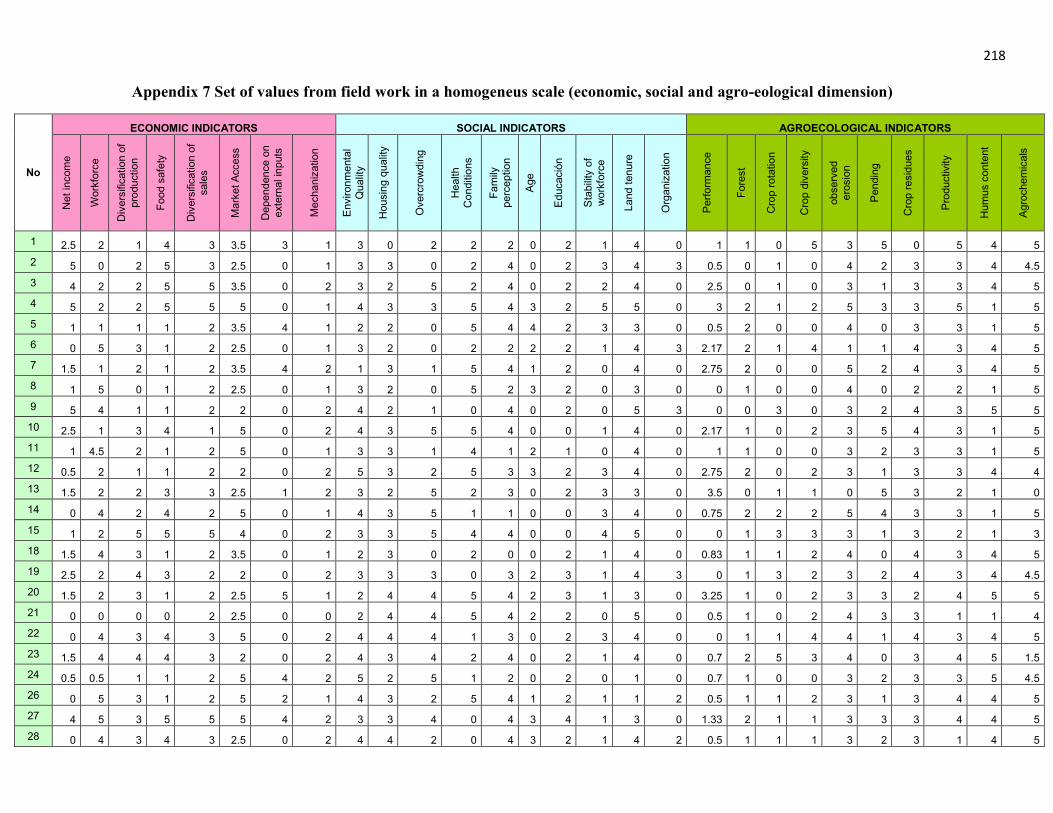
218
Appendix 7 Set of values from field work in a homogeneus scale (economic, social and agro-eological dimension)
No
ECONOMIC INDICATORS SOCIAL INDICATORS AGROECOLOGICAL INDICATORS
Net
inco
me
Wor
kfor
ce
Div
ersi
ficat
ion
of
prod
uctio
n
Food
saf
ety
Div
ersi
ficat
ion
of
sale
s
Mar
ket A
cces
s
Dep
ende
nce
on
exte
rnal
inpu
ts
Mec
hani
zatio
n
Env
ironm
enta
l Q
ualit
y
Hou
sing
qua
lity
Ove
rcro
wdi
ng
Hea
lth
Con
ditio
ns
Fam
ily
perc
eptio
n
Age
Edu
caci
ón
Sta
bilit
y of
w
orkf
orce
Land
tenu
re
Org
aniz
atio
n
Per
form
ance
Fore
st
Cro
p ro
tatio
n
Cro
p di
vers
ity
obse
rved
er
osio
n
Pen
ding
Cro
p re
sidu
es
Pro
duct
ivity
Hum
us c
onte
nt
Agr
oche
mic
als
1 2.5 2 1 4 3 3.5 3 1 3 0 2 2 2 0 2 1 4 0 1 1 0 5 3 5 0 5 4 5 2 5 0 2 5 3 2.5 0 1 3 3 0 2 4 0 2 3 4 3 0.5 0 1 0 4 2 3 3 4 4.5 3 4 2 2 5 5 3.5 0 2 3 2 5 2 4 0 2 2 4 0 2.5 0 1 0 3 1 3 3 4 5 4 5 2 2 5 5 5 0 1 4 3 3 5 4 3 2 5 5 0 3 2 1 2 5 3 3 5 1 5 5 1 1 1 1 2 3.5 4 1 2 2 0 5 4 4 2 3 3 0 0.5 2 0 0 4 0 3 3 1 5 6 0 5 3 1 2 2.5 0 1 3 2 0 2 2 2 2 1 4 3 2.17 2 1 4 1 1 4 3 4 5 7 1.5 1 2 1 2 3.5 4 2 1 3 1 5 4 1 2 0 4 0 2.75 2 0 0 5 2 4 3 4 5 8 1 5 0 1 2 2.5 0 1 3 2 0 5 2 3 2 0 3 0 0 1 0 0 4 0 2 2 1 5 9 5 4 1 1 2 2 0 2 4 2 1 0 4 0 2 0 5 3 0 0 3 0 3 2 4 3 5 5 10 2.5 1 3 4 1 5 0 2 4 3 5 5 4 0 0 1 4 0 2.17 1 0 2 3 5 4 3 1 5 11 1 4.5 2 1 2 5 0 1 3 3 1 4 1 2 1 0 4 0 1 1 0 0 3 2 3 3 1 5 12 0.5 2 1 1 2 2 0 2 5 3 2 5 3 3 2 3 4 0 2.75 2 0 2 3 1 3 3 4 4 13 1.5 2 2 3 3 2.5 1 2 3 2 5 2 3 0 2 3 3 0 3.5 0 1 1 0 5 3 2 1 0 14 0 4 2 4 2 5 0 1 4 3 5 1 1 0 0 3 4 0 0.75 2 2 2 5 4 3 3 1 5 15 1 2 5 5 5 4 0 2 3 3 5 4 4 0 0 4 5 0 0 1 3 3 3 1 3 2 1 3 18 1.5 4 3 1 2 3.5 0 1 2 3 0 2 0 0 2 1 4 0 0.83 1 1 2 4 0 4 3 4 5 19 2.5 2 4 3 2 2 0 2 3 3 3 0 3 2 3 1 4 3 0 1 3 2 3 2 4 3 4 4.5 20 1.5 2 3 1 2 2.5 5 1 2 4 4 5 4 2 3 1 3 0 3.25 1 0 2 3 3 2 4 5 5 21 0 0 0 0 2 2.5 0 0 2 4 4 5 4 2 2 0 5 0 0.5 1 0 2 4 3 3 1 1 4 22 0 4 3 4 3 5 0 2 4 4 4 1 3 0 2 3 4 0 0 1 1 4 4 1 4 3 4 5 23 1.5 4 4 4 3 2 0 2 4 3 4 2 4 0 2 1 4 0 0.7 2 5 3 4 0 3 4 5 1.5 24 0.5 0.5 1 1 2 5 4 2 5 2 5 1 2 0 2 0 1 0 0.7 1 0 0 3 2 3 3 5 4.5 26 0 5 3 1 2 5 2 1 4 3 2 5 4 1 2 1 1 2 0.5 1 1 2 3 1 3 4 4 5 27 4 5 3 5 5 5 4 2 3 3 4 0 4 3 4 1 3 0 1.33 2 1 1 3 3 3 4 4 5 28 0 4 3 4 3 2.5 0 2 4 4 2 0 4 3 2 1 4 2 0.5 1 1 1 3 2 3 1 4 5
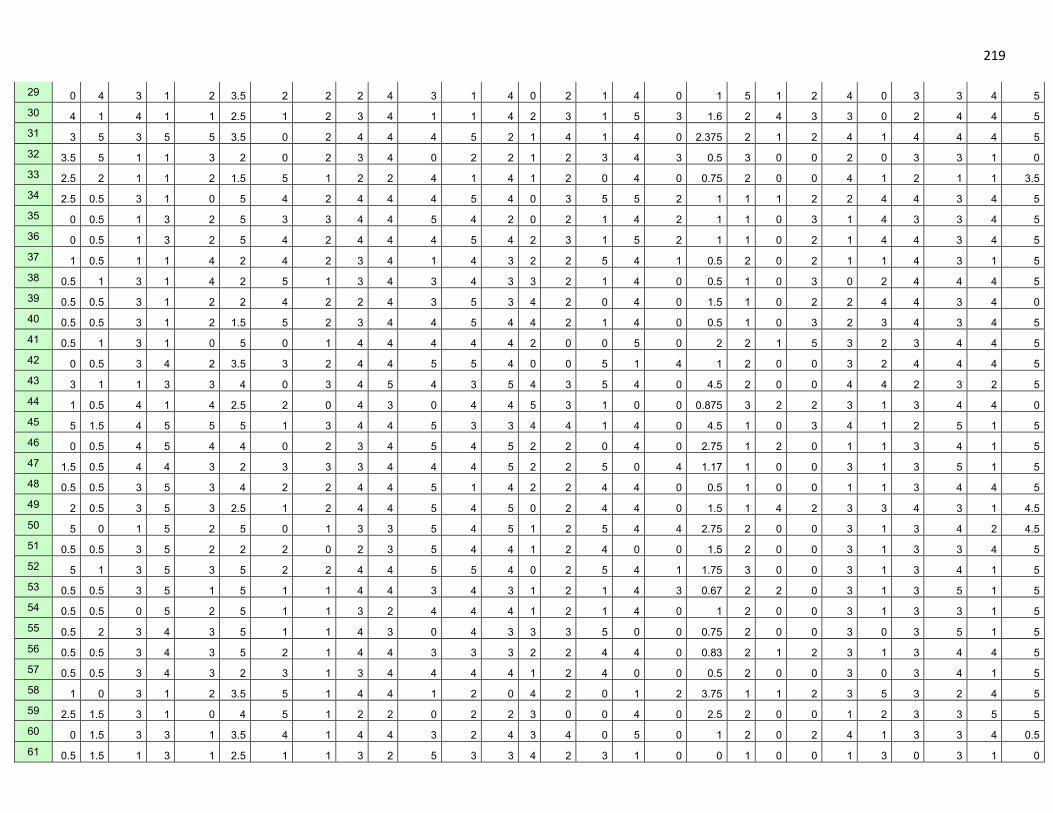
219
29 0 4 3 1 2 3.5 2 2 2 4 3 1 4 0 2 1 4 0 1 5 1 2 4 0 3 3 4 5 30 4 1 4 1 1 2.5 1 2 3 4 1 1 4 2 3 1 5 3 1.6 2 4 3 3 0 2 4 4 5 31 3 5 3 5 5 3.5 0 2 4 4 4 5 2 1 4 1 4 0 2.375 2 1 2 4 1 4 4 4 5 32 3.5 5 1 1 3 2 0 2 3 4 0 2 2 1 2 3 4 3 0.5 3 0 0 2 0 3 3 1 0 33 2.5 2 1 1 2 1.5 5 1 2 2 4 1 4 1 2 0 4 0 0.75 2 0 0 4 1 2 1 1 3.5 34 2.5 0.5 3 1 0 5 4 2 4 4 4 5 4 0 3 5 5 2 1 1 1 2 2 4 4 3 4 5 35 0 0.5 1 3 2 5 3 3 4 4 5 4 2 0 2 1 4 2 1 1 0 3 1 4 3 3 4 5 36 0 0.5 1 3 2 5 4 2 4 4 4 5 4 2 3 1 5 2 1 1 0 2 1 4 4 3 4 5 37 1 0.5 1 1 4 2 4 2 3 4 1 4 3 2 2 5 4 1 0.5 2 0 2 1 1 4 3 1 5 38 0.5 1 3 1 4 2 5 1 3 4 3 4 3 3 2 1 4 0 0.5 1 0 3 0 2 4 4 4 5 39 0.5 0.5 3 1 2 2 4 2 2 4 3 5 3 4 2 0 4 0 1.5 1 0 2 2 4 4 3 4 0 40 0.5 0.5 3 1 2 1.5 5 2 3 4 4 5 4 4 2 1 4 0 0.5 1 0 3 2 3 4 3 4 5 41 0.5 1 3 1 0 5 0 1 4 4 4 4 4 2 0 0 5 0 2 2 1 5 3 2 3 4 4 5 42 0 0.5 3 4 2 3.5 3 2 4 4 5 5 4 0 0 5 1 4 1 2 0 0 3 2 4 4 4 5 43 3 1 1 3 3 4 0 3 4 5 4 3 5 4 3 5 4 0 4.5 2 0 0 4 4 2 3 2 5 44 1 0.5 4 1 4 2.5 2 0 4 3 0 4 4 5 3 1 0 0 0.875 3 2 2 3 1 3 4 4 0 45 5 1.5 4 5 5 5 1 3 4 4 5 3 3 4 4 1 4 0 4.5 1 0 3 4 1 2 5 1 5 46 0 0.5 4 5 4 4 0 2 3 4 5 4 5 2 2 0 4 0 2.75 1 2 0 1 1 3 4 1 5 47 1.5 0.5 4 4 3 2 3 3 3 4 4 4 5 2 2 5 0 4 1.17 1 0 0 3 1 3 5 1 5 48 0.5 0.5 3 5 3 4 2 2 4 4 5 1 4 2 2 4 4 0 0.5 1 0 0 1 1 3 4 4 5 49 2 0.5 3 5 3 2.5 1 2 4 4 5 4 5 0 2 4 4 0 1.5 1 4 2 3 3 4 3 1 4.5 50 5 0 1 5 2 5 0 1 3 3 5 4 5 1 2 5 4 4 2.75 2 0 0 3 1 3 4 2 4.5 51 0.5 0.5 3 5 2 2 2 0 2 3 5 4 4 1 2 4 0 0 1.5 2 0 0 3 1 3 3 4 5 52 5 1 3 5 3 5 2 2 4 4 5 5 4 0 2 5 4 1 1.75 3 0 0 3 1 3 4 1 5 53 0.5 0.5 3 5 1 5 1 1 4 4 3 4 3 1 2 1 4 3 0.67 2 2 0 3 1 3 5 1 5 54 0.5 0.5 0 5 2 5 1 1 3 2 4 4 4 1 2 1 4 0 1 2 0 0 3 1 3 3 1 5 55 0.5 2 3 4 3 5 1 1 4 3 0 4 3 3 3 5 0 0 0.75 2 0 0 3 0 3 5 1 5 56 0.5 0.5 3 4 3 5 2 1 4 4 3 3 3 2 2 4 4 0 0.83 2 1 2 3 1 3 4 4 5 57 0.5 0.5 3 4 3 2 3 1 3 4 4 4 4 1 2 4 0 0 0.5 2 0 0 3 0 3 4 1 5 58 1 0 3 1 2 3.5 5 1 4 4 1 2 0 4 2 0 1 2 3.75 1 1 2 3 5 3 2 4 5 59 2.5 1.5 3 1 0 4 5 1 2 2 0 2 2 3 0 0 4 0 2.5 2 0 0 1 2 3 3 5 5 60 0 1.5 3 3 1 3.5 4 1 4 4 3 2 4 3 4 0 5 0 1 2 0 2 4 1 3 3 4 0.5 61 0.5 1.5 1 3 1 2.5 1 1 3 2 5 3 3 4 2 3 1 0 0 1 0 0 1 3 0 3 1 0

220
62 0.5 1.5 3 1 3 2.5 0 1 4 4 3 2 4 2 2 3 4 0 1 1 1 2 3 3 4 2 4 5 63 2.5 2 1 1 1 2.5 0 1 3 3 4 3 2 4 2 0 4 0 0 1 0 0 3 2 3 4 1 5 64 4 1 3 1 4 2 5 1 4 4 3 4 4 5 3 4 4 2 0.5 1 0 1 1 1 3 3 3 1.5 65 1 1.5 1 5 2 3.5 2 1 2 2 5 0 2 0 0 3 4 0 0 1 0 0 3 1 3 2 1 5
66 3.5 3 3 5 3 5 1 1 3 3 5 5 3 1 2 5 4 0 2.25 2 0 0 1 2 3 3 5 5
68 1 1 3 4 4 2 0 2 3 3 5 5 3 0 2 1 4 3 1.5 2 0 1 2 2 4 3 4 5 69 0.5 2 3 4 3 2.5 3 2 3 4 5 1 3 1 2 4 4 2 2.33 2 2 3 3 2 4 4 4 5 70 1 0.5 3 1 3 2.5 4 1 4 4 4 1 3 4 3 1 4 3 0 1 0 0 4 2 3 3 5 2.5 71 1 1 0 1 2 2.5 3 1 3 3 4 0 3 2 2 4 4 3 1.5 0 0 0 1 2 3 3 1 3.5 72 3 2 3 3 4 2 5 1 3 3 1 1 3 3 2 3 4 3 1.17 2 4 4 1 2 3 2 5 4.25 73 0.5 1.5 4 4 5 2.5 0 1 2 2 0 0 2 3 2 5 4 3 3 1 1 1 2 2 3 3 1 5 74 1.5 2.5 3 1 2 2.5 2 1 3 3 3 0 3 4 2 4 4 2 2.75 1 2 2 3 4 3 2 1 5 75 1 2 1 1 2 2.5 0 1 4 3 2 3 1 3 2 5 0 3 0 2 0 0 3 2 3 2 1 2 76 2 2.5 1 1 2 2.5 2 1 4 3 3 0 3 3 2 3 4 0 2 1 1 2 1 2 3 3 5 3 77 5 2 1 1 3 5 2 2 3 3 0 3 4 2 0 5 4 0 2 1 0 1 1 1 3 2 1 5 78 0.5 1.5 1 1 2 3.5 0 1 4 4 1 3 3 0 0 0 4 0 0.5 1 0 1 1 1 3 2 1 3 79 3 2.5 3 3 4 1.5 0 2 3 3 3 2 3 2 2 3 4 0 4.67 1 2 3 3 2 3 4 1 3
80 2 5 3 4 5 2.5 2 2 5 2 3 2 3 0 2 3 4 0 3.5 2 2 2 4 2 4 5 5 5
81 3 4.5 3 3 2 5 1 2 4 2 3 0 3 4 5 4 4 3 5 1 0 1 3 2 3 2 1 5 82 0 1.5 1 5 3 2.5 2 1 3 3 0 2 4 0 2 4 4 3 0.75 1 1 2 1 3 3 3 5 5
83 0.5 4.5 3 1 3 4 3 1 4 4 5 3 4 0 2 1 4 0 3.5 1 2 3 1 2 3 4 1 4
84 5 4 3 1 2 2.5 2 2 4 4 0 2 4 2 3 5 4 0 3.5 2 5 2 1 3 3 3 1 3 86 4 2 3 1 1 5 3 1 5 3 5 0 2 2 3 5 5 0 5 1 0 0 1 1 3 5 1 5 87 0.5 0.5 3 5 3 5 5 1 3 3 4 2 4 4 3 4 4 2 5 1 0 0 1 0 3 3 4 5 88 0.5 1 3 3 2 5 4 3 4 4 5 2 4 0 2 3 4 2 3 2 1 2 3 1 4 3 4 0 90 3 1.5 5 5 2 3.5 4 1 4 3 3 2 3 2 2 2 4 2 0.5 1 3 3 3 1 4 4 3 5 91 5 1.5 5 4 0 3.5 5 1 2 2 1 5 3 0 2 2 2 2 0 1 0 0 1 1 3 2 4 5 92 5 0.5 3 5 1 1 3 1 4 2 3 5 4 2 2 1 4 2 5 3 0 1 3 1 3 4 4 5 93 2.5 0.5 3 5 4 2.5 3 1 3 3 2 2 3 4 4 2 4 4 0 1 3 3 3 1 2 3 4 5 94 1 1.5 5 3 2 2.5 5 1 4 3 3 5 4 0 2 2 4 2 2 1 1 1 1 2 2 3 4 5 95 4 1.5 4 5 5 3.5 3 1 3 2 2 5 2 4 3 1 4 0 0.5 2 3 3 3 1 3 4 4 4

221
96 3 1 3 5 4 2.5 3 1 4 3 2 5 4 4 2 4 4 2 2 2 1 2 3 1 3 4 4 2.5 97 1 1 3 4 2 2.5 3 1 3 3 1 2 2 1 3 2 1 2 0.83 0 0 0 3 0 3 3 4 5
99 3 1 3 1 2 5 3 1 4 3 3 5 5 5 3 3 1 2 5 1 1 2 1 0 3 4 4 5
100 4.5 1 3 5 1 5 4 2 3 3 0 5 3 4 3 4 4 2 0 1 0 0 3 4 3 2 5 4.5 101 2 1 3 1 1 5 3 1 3 4 4 3 3 0 2 2 4 2 1 1 1 2 1 4 3 4 4 5 102 1 1 3 1 2 5 3 0 3 3 4 2 3 1 2 3 4 2 0.83 1 1 2 1 1 3 3 1 5 103 5 1 3 4 5 5 2 1 4 4 4 5 3 1 2 1 4 4 3.67 3 3 3 3 1 3 5 5 5 104 3.5 1 3 3 5 5 3 1 3 3 4 4 3 4 1 1 4 4 2 1 0 0 3 1 3 5 4 5 105 1.5 1 3 5 3 5 3 1 3 3 1 5 3 1 3 2 4 4 3.5 1 3 3 3 1 3 5 4 5 106 3.5 0 1 5 1 3.5 3 1 3 3 4 2 4 4 4 2 1 2 0 1 0 0 1 3 4 3 5 5 107 0 0.5 4 5 2 5 5 1 3 4 5 3 3 2 3 0 5 0 3 2 0 0 3 1 4 2 1 4.5 108 5 0.5 3 1 4 2.5 3 1 3 2 2 1 0 4 4 0 4 2 2 1 0 0 3 2 0 2 1 5 109 2 0.5 4 5 2 5 0 1 4 4 2 3 3 4 2 4 0 0 0 1 0 0 3 1 0 2 1 5 110 2.5 0 0 5 0 5 0 1 4 2 5 3 1 1 2 2 1 0 0 3 0 0 3 1 3 2 4 5 111 1.5 0.5 3 5 2 5 1 1 3 3 3 3 3 0 2 0 4 0 1.25 1 0 2 4 1 2 3 1 5 112 3 1 1 5 1 4.5 0 1 4 3 3 3 4 0 2 5 0 0 0.5 4 0 0 1 5 4 4 1 5 113 2.5 0.5 3 1 2 2.5 0 1 3 3 5 3 3 4 2 5 0 0 0.67 2 0 0 3 5 3 2 4 1.5 114 3.5 0.5 3 4 4 4 1 1 3 3 2 3 3 4 4 0 4 0 1.17 3 0 0 3 4 3 2 1 5 115 1.5 1.5 4 5 2 5 1 1 4 4 2 3 3 4 3 1 4 0 0 1 3 1 3 1 3 3 3 5 116 5 0.5 1 3 2 2.5 0 1 3 3 3 3 4 4 4 1 3 0 0.5 1 0 0 1 5 3 3 3 3 117 2 0.5 3 5 4 3 1 1 4 3 5 3 3 2 2 1 4 2 1.38 2 2 1 3 2 3 3 1 5 118 3 0.5 3 5 3 3.5 1 2 4 3 4 4 4 4 2 0 4 2 0.83 2 3 0 3 3 3 3 1 5 119 4 0.5 3 5 0 3.5 1 1 3 5 4 3 3 4 2 0 5 0 0.67 2 0 0 3 1 3 3 4 5 120 1 1.5 3 4 2 4 2 1 4 4 4 2 4 0 0 4 5 0 1 4 0 1 4 1 3 2 1 5 121 0 1 4 4 1 4 0 1 3 4 4 3 4 1 2 1 5 0 1.5 3 3 1 4 1 3 2 5 5 122 3.5 0.5 4 3 3 5 0 1 4 4 4 3 3 5 3 1 0 0 0.75 1 3 3 3 2 3 3 4 3 123 3 1 3 5 3 5 0 2 4 4 4 5 4 3 2 1 4 0 2.5 4 5 3 3 0 3 5 4 5 124 5 1 3 5 3 3.5 1 1 3 4 4 2 3 0 2 1 5 0 3.75 3 5 1 3 0 3 3 4 5 125 0 0.5 3 4 2 3.5 0 1 3 3 5 4 3 1 2 4 5 0 1.13 4 5 1 4 1 3 2 4 2.5 126 4.5 0.5 3 5 2 4 1 1 4 4 0 4 3 1 2 1 4 0 1.67 4 5 2 3 0 3 2 4 3.5 127 0 0.5 3 5 1 3.5 1 1 4 4 0 4 4 2 3 3 4 0 2.38 2 0 1 4 1 3 2 4 3.5 128 0 0.5 3 4 1 3 0 1 5 5 5 4 5 2 2 2 5 0 1 2 0 1 3 0 2 2 5 5
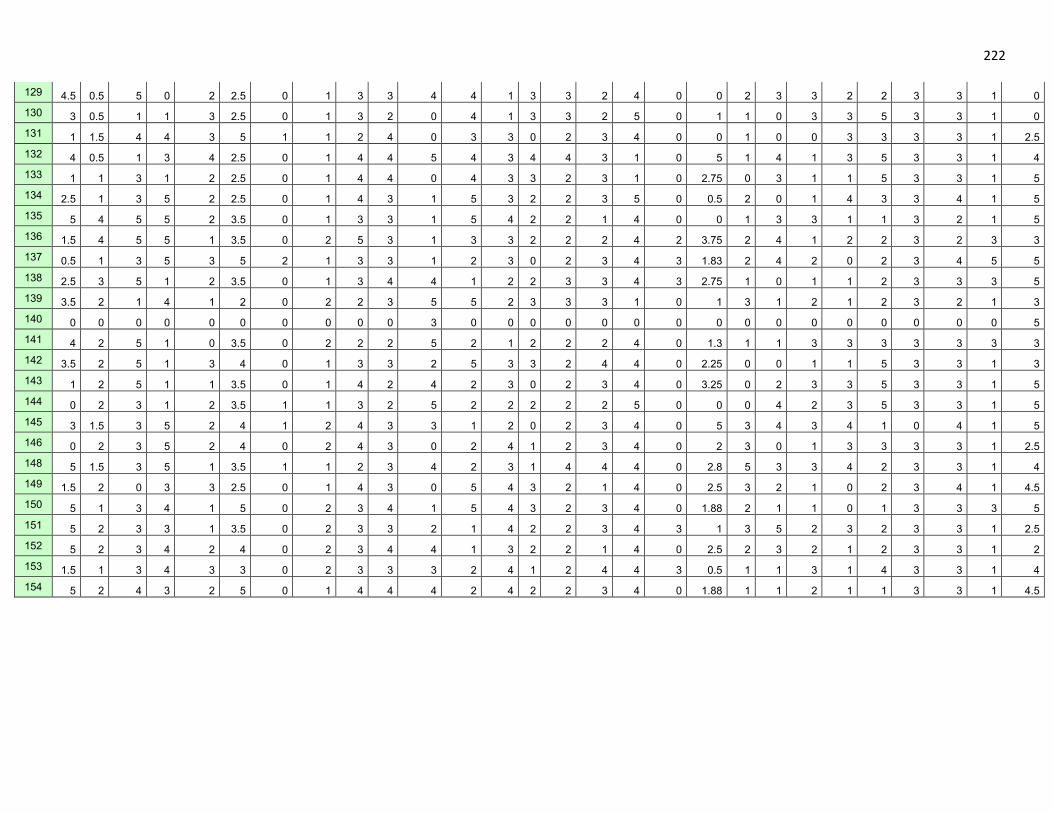
222 129 4.5 0.5 5 0 2 2.5 0 1 3 3 4 4 1 3 3 2 4 0 0 2 3 3 2 2 3 3 1 0 130 3 0.5 1 1 3 2.5 0 1 3 2 0 4 1 3 3 2 5 0 1 1 0 3 3 5 3 3 1 0 131 1 1.5 4 4 3 5 1 1 2 4 0 3 3 0 2 3 4 0 0 1 0 0 3 3 3 3 1 2.5 132 4 0.5 1 3 4 2.5 0 1 4 4 5 4 3 4 4 3 1 0 5 1 4 1 3 5 3 3 1 4 133 1 1 3 1 2 2.5 0 1 4 4 0 4 3 3 2 3 1 0 2.75 0 3 1 1 5 3 3 1 5 134 2.5 1 3 5 2 2.5 0 1 4 3 1 5 3 2 2 3 5 0 0.5 2 0 1 4 3 3 4 1 5 135 5 4 5 5 2 3.5 0 1 3 3 1 5 4 2 2 1 4 0 0 1 3 3 1 1 3 2 1 5 136 1.5 4 5 5 1 3.5 0 2 5 3 1 3 3 2 2 2 4 2 3.75 2 4 1 2 2 3 2 3 3 137 0.5 1 3 5 3 5 2 1 3 3 1 2 3 0 2 3 4 3 1.83 2 4 2 0 2 3 4 5 5 138 2.5 3 5 1 2 3.5 0 1 3 4 4 1 2 2 3 3 4 3 2.75 1 0 1 1 2 3 3 3 5 139 3.5 2 1 4 1 2 0 2 2 3 5 5 2 3 3 3 1 0 1 3 1 2 1 2 3 2 1 3 140 0 0 0 0 0 0 0 0 0 0 3 0 0 0 0 0 0 0 0 0 0 0 0 0 0 0 0 5 141 4 2 5 1 0 3.5 0 2 2 2 5 2 1 2 2 2 4 0 1.3 1 1 3 3 3 3 3 3 3 142 3.5 2 5 1 3 4 0 1 3 3 2 5 3 3 2 4 4 0 2.25 0 0 1 1 5 3 3 1 3 143 1 2 5 1 1 3.5 0 1 4 2 4 2 3 0 2 3 4 0 3.25 0 2 3 3 5 3 3 1 5 144 0 2 3 1 2 3.5 1 1 3 2 5 2 2 2 2 2 5 0 0 0 4 2 3 5 3 3 1 5 145 3 1.5 3 5 2 4 1 2 4 3 3 1 2 0 2 3 4 0 5 3 4 3 4 1 0 4 1 5 146 0 2 3 5 2 4 0 2 4 3 0 2 4 1 2 3 4 0 2 3 0 1 3 3 3 3 1 2.5 148 5 1.5 3 5 1 3.5 1 1 2 3 4 2 3 1 4 4 4 0 2.8 5 3 3 4 2 3 3 1 4 149 1.5 2 0 3 3 2.5 0 1 4 3 0 5 4 3 2 1 4 0 2.5 3 2 1 0 2 3 4 1 4.5 150 5 1 3 4 1 5 0 2 3 4 1 5 4 3 2 3 4 0 1.88 2 1 1 0 1 3 3 3 5 151 5 2 3 3 1 3.5 0 2 3 3 2 1 4 2 2 3 4 3 1 3 5 2 3 2 3 3 1 2.5 152 5 2 3 4 2 4 0 2 3 4 4 1 3 2 2 1 4 0 2.5 2 3 2 1 2 3 3 1 2 153 1.5 1 3 4 3 3 0 2 3 3 3 2 4 1 2 4 4 3 0.5 1 1 3 1 4 3 3 1 4 154 5 2 4 3 2 5 0 1 4 4 4 2 4 2 2 3 4 0 1.88 1 1 2 1 1 3 3 1 4.5
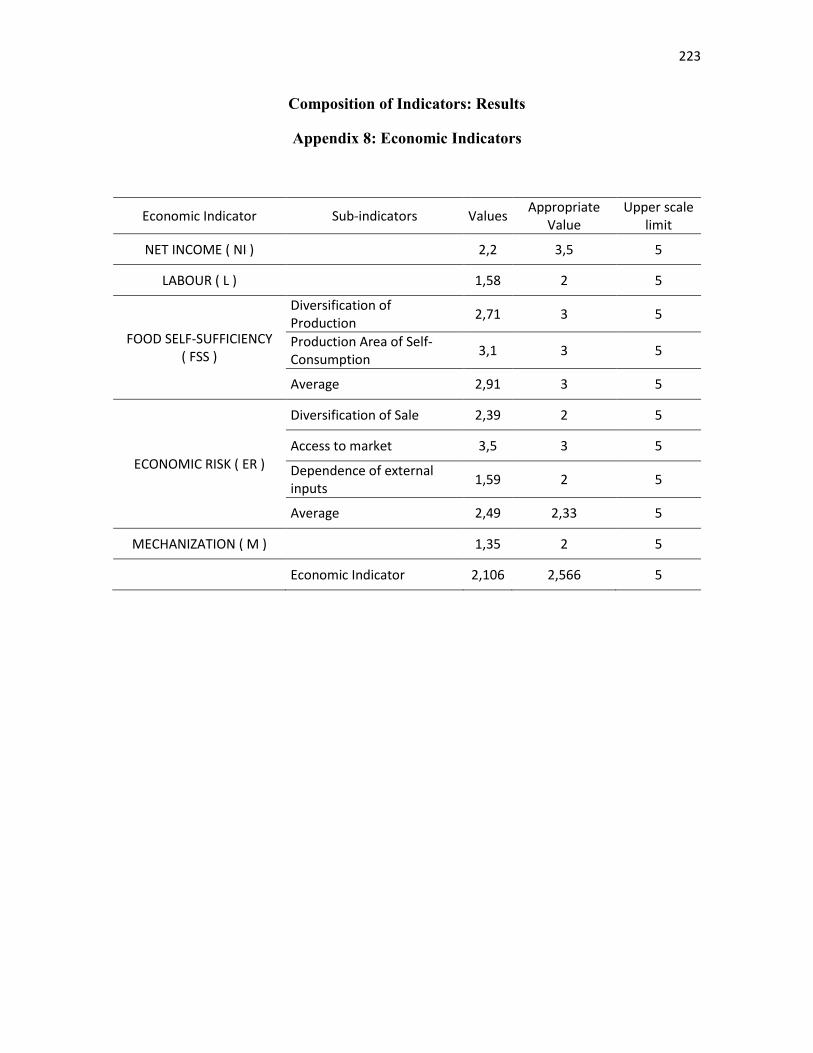
223
Composition of Indicators: Results
Appendix 8: Economic Indicators
Economic Indicator Sub-indicators Values Appropriate
Value Upper scale
limit
NET INCOME ( NI ) 2,2 3,5 5
LABOUR ( L ) 1,58 2 5
FOOD SELF-SUFFICIENCY ( FSS )
Diversification of Production
2,71 3 5
Production Area of Self-Consumption
3,1 3 5
Average 2,91 3 5
ECONOMIC RISK ( ER )
Diversification of Sale 2,39 2 5
Access to market 3,5 3 5
Dependence of external inputs
1,59 2 5
Average 2,49 2,33 5
MECHANIZATION ( M ) 1,35 2 5
Economic Indicator 2,106 2,566 5
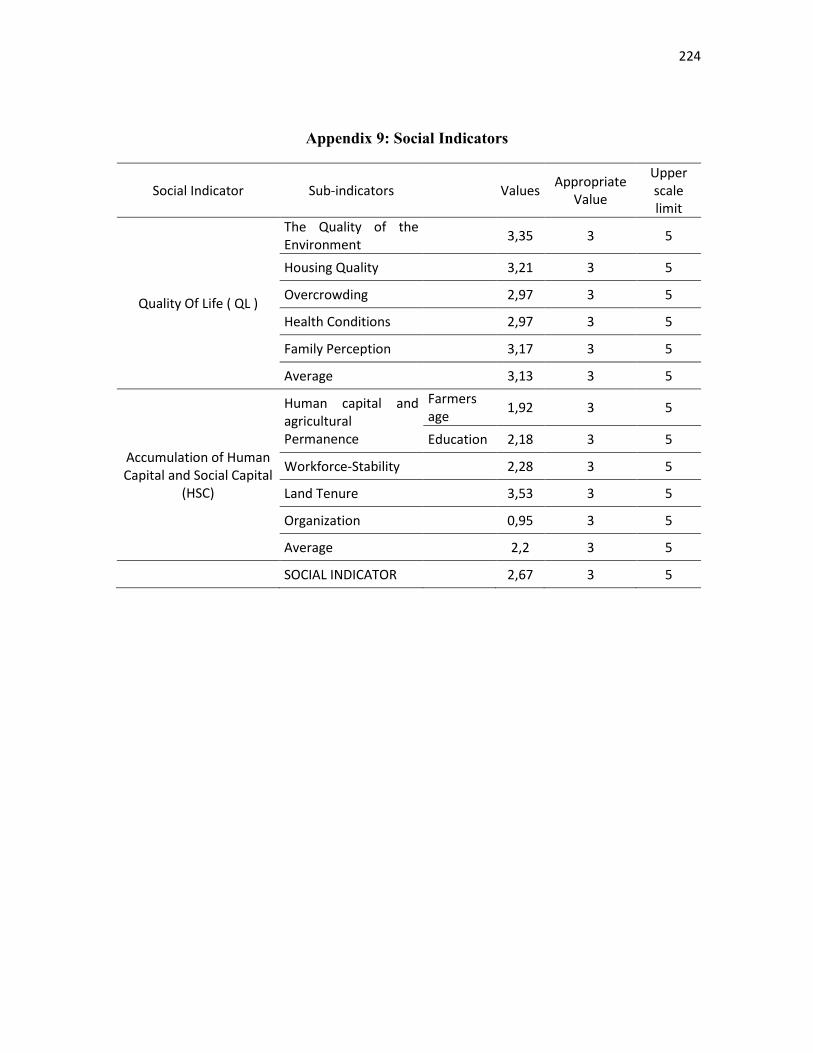
224
Appendix 9: Social Indicators
Social Indicator Sub-indicators Values Appropriate
Value
Upper scale limit
Quality Of Life ( QL )
The Quality of the Environment
3,35 3 5
Housing Quality 3,21 3 5
Overcrowding 2,97 3 5
Health Conditions 2,97 3 5
Family Perception 3,17 3 5
Average 3,13 3 5
Accumulation of Human Capital and Social Capital
(HSC)
Human capital and agricultural Permanence
Farmers age
1,92 3 5
Education 2,18 3 5
Workforce-Stability 2,28 3 5
Land Tenure 3,53 3 5
Organization 0,95 3 5
Average 2,2 3 5
SOCIAL INDICATOR 2,67 3 5
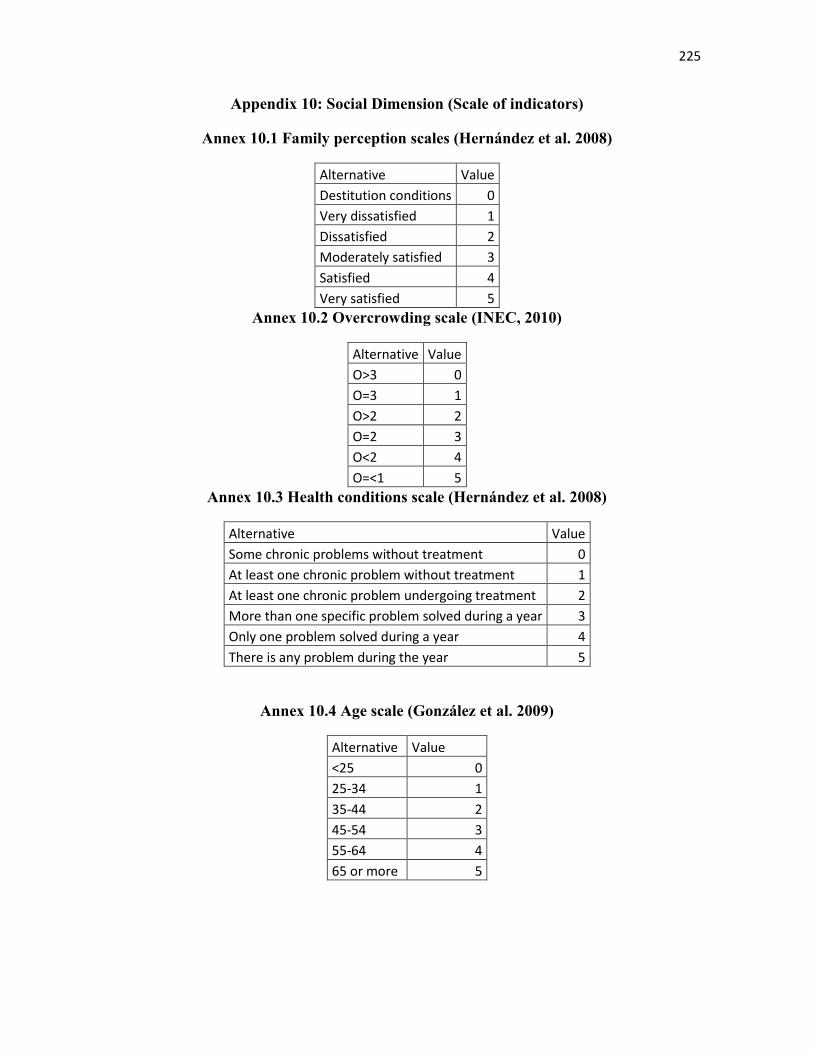
225
Appendix 10: Social Dimension (Scale of indicators)
Annex 10.1 Family perception scales (Hernández et al. 2008)
Alternative Value
Destitution conditions 0
Very dissatisfied 1
Dissatisfied 2
Moderately satisfied 3
Satisfied 4
Very satisfied 5
Annex 10.2 Overcrowding scale (INEC, 2010)
Alternative Value
O>3 0
O=3 1
O>2 2
O=2 3
O<2 4
O=<1 5
Annex 10.3 Health conditions scale (Hernández et al. 2008)
Alternative Value
Some chronic problems without treatment 0
At least one chronic problem without treatment 1
At least one chronic problem undergoing treatment 2
More than one specific problem solved during a year 3
Only one problem solved during a year 4
There is any problem during the year 5
Annex 10.4 Age scale (González et al. 2009)
Alternative Value
<25 0
25-34 1
35-44 2
45-54 3
55-64 4
65 or more 5

226
Annex 10.5 Education level scales (González et al. 2009)
Alternative Value
Nothing 0
Elementary 1
Basic 2
Media 3
University 4
Superior 5
Annex 10.6 Workforce stability scale (Gómez et al. 2007)
Alternative Value
There are not workers for the job 0
There are rarely workers for the job 1
There are found workers for the job occasionally 2
Although it is difficult there are workers for the job 3
There are often found workers for the job 4
There are always found workers for the job 5
Annex 10.7 Land tenure scale
Alternative Value
No form of tenure 0
Rented 1
Cooperated or mixed 2
Provided by a family member 3
Owner without a title 4
Owner with a title 5
Annex 10.8 Organization scale (Chiappe et al. 2008)
Alternative Value
There is no relation with the neighbors and no participation of any kind of organization 0
There is a relation with people 1
There is a relation with the neighbors but, no participation of any organization 2
There is a relation with the neighbors and participation of an organization 3
It is usually related with the neighbors and rarely participates an organization 4
It is usually related with the neighbors and frequently participates an organization 5
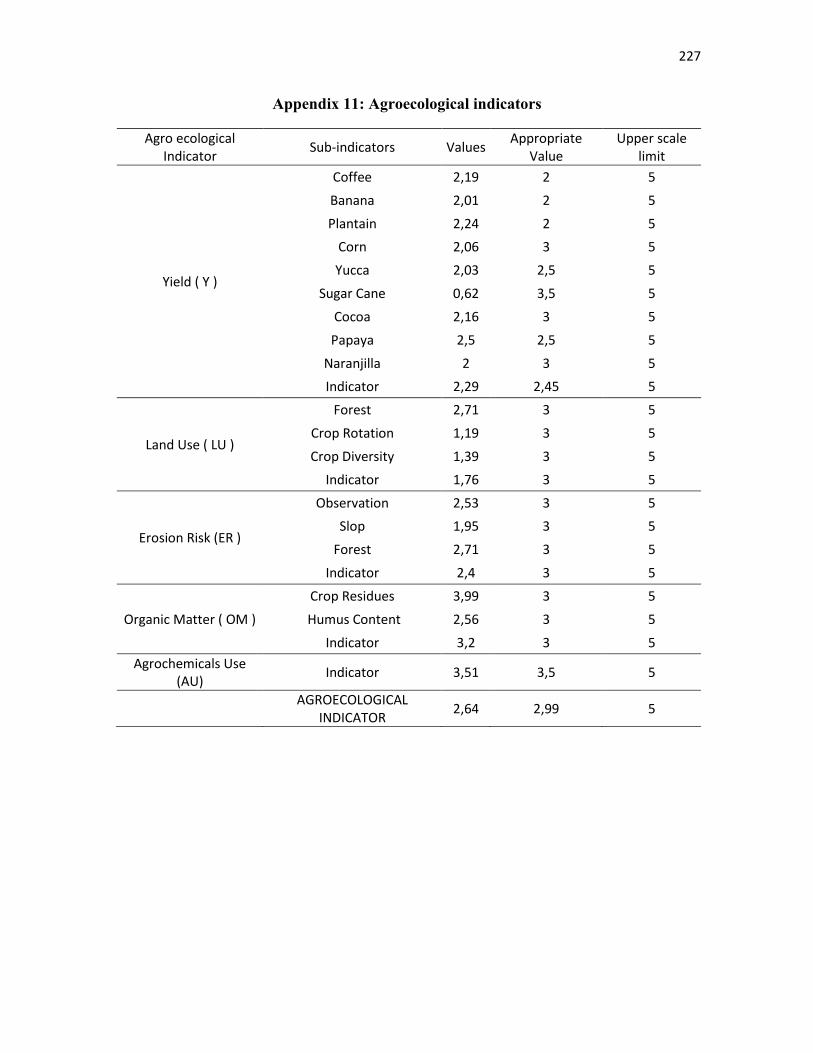
227
Appendix 11: Agroecological indicators
Agro ecological Indicator
Sub-indicators Values Appropriate
Value Upper scale
limit
Yield ( Y )
Coffee 2,19 2 5
Banana 2,01 2 5
Plantain 2,24 2 5
Corn 2,06 3 5
Yucca 2,03 2,5 5
Sugar Cane 0,62 3,5 5
Cocoa 2,16 3 5
Papaya 2,5 2,5 5
Naranjilla 2 3 5
Indicator 2,29 2,45 5
Land Use ( LU )
Forest 2,71 3 5
Crop Rotation 1,19 3 5
Crop Diversity 1,39 3 5
Indicator 1,76 3 5
Erosion Risk (ER )
Observation 2,53 3 5
Slop 1,95 3 5
Forest 2,71 3 5
Indicator 2,4 3 5
Organic Matter ( OM )
Crop Residues 3,99 3 5
Humus Content 2,56 3 5
Indicator 3,2 3 5
Agrochemicals Use (AU)
Indicator 3,51 3,5 5
AGROECOLOGICAL
INDICATOR 2,64 2,99 5
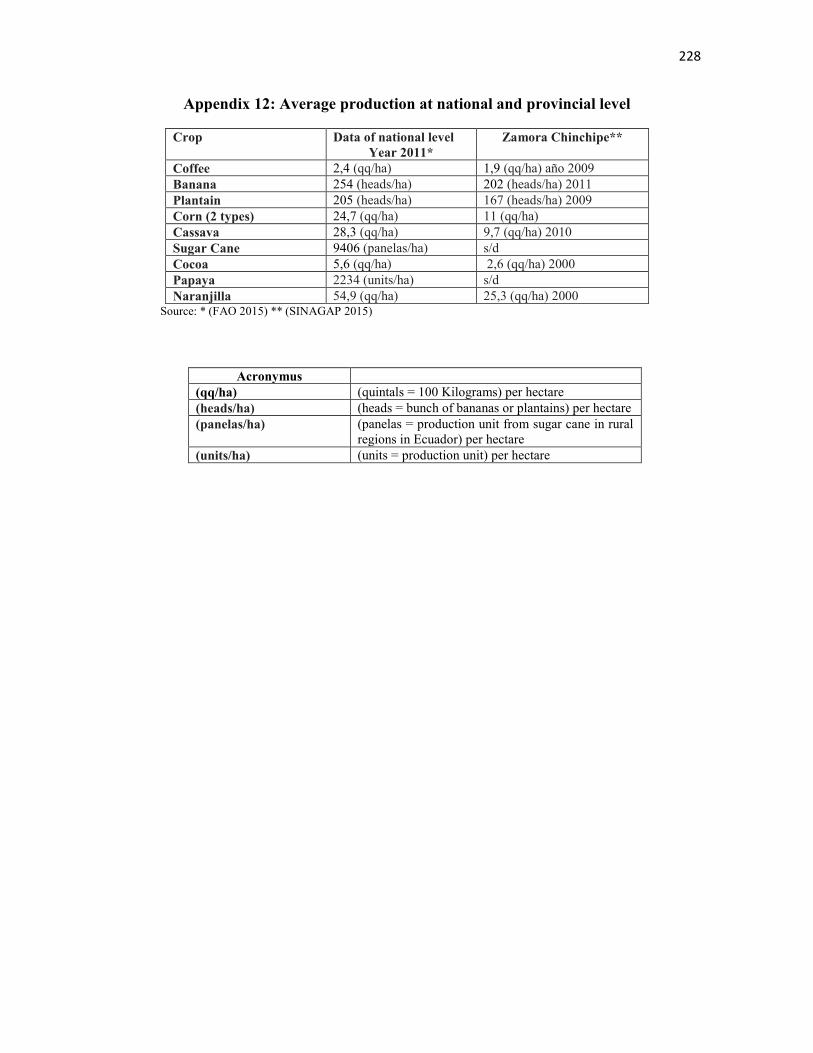
228
Appendix 12: Average production at national and provincial level
Crop Data of national level Year 2011*
Zamora Chinchipe**
Coffee 2,4 (qq/ha) 1,9 (qq/ha) año 2009 Banana 254 (heads/ha) 202 (heads/ha) 2011 Plantain 205 (heads/ha) 167 (heads/ha) 2009 Corn (2 types) 24,7 (qq/ha) 11 (qq/ha) Cassava 28,3 (qq/ha) 9,7 (qq/ha) 2010 Sugar Cane 9406 (panelas/ha) s/d Cocoa 5,6 (qq/ha) 2,6 (qq/ha) 2000 Papaya 2234 (units/ha) s/d Naranjilla 54,9 (qq/ha) 25,3 (qq/ha) 2000
Source: * (FAO 2015) ** (SINAGAP 2015)
Acronymus (qq/ha) (quintals = 100 Kilograms) per hectare (heads/ha) (heads = bunch of bananas or plantains) per hectare (panelas/ha) (panelas = production unit from sugar cane in rural
regions in Ecuador) per hectare (units/ha) (units = production unit) per hectare
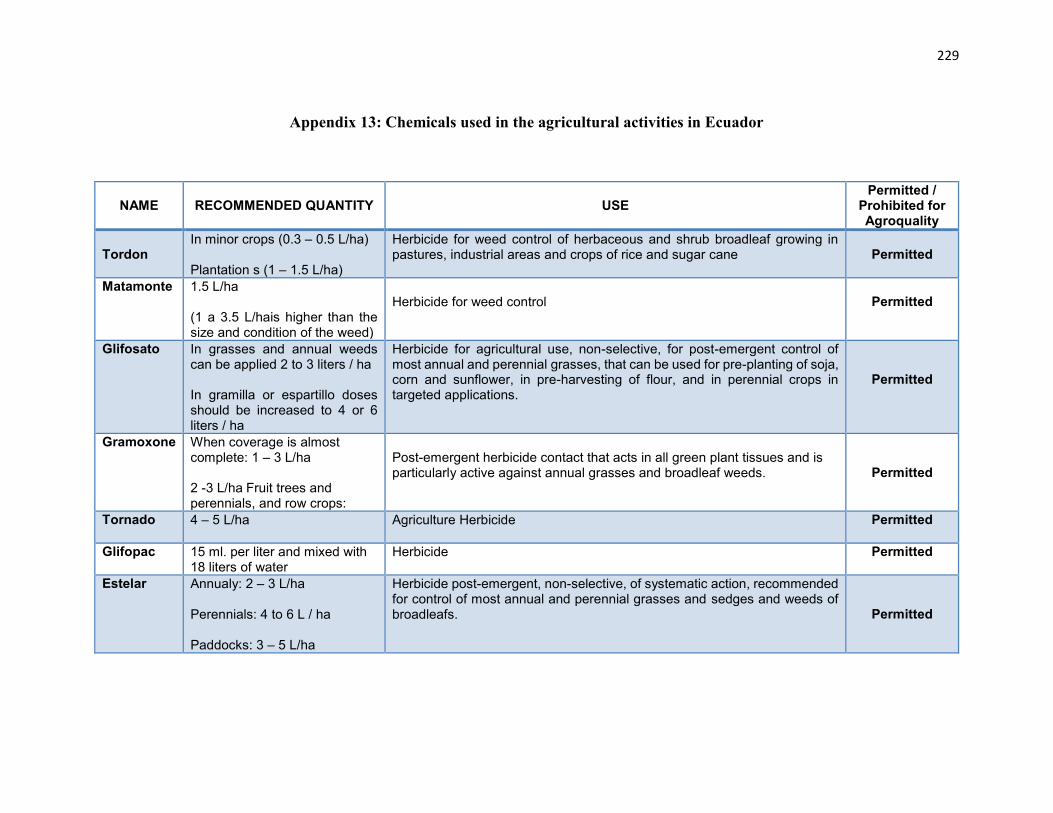
229
Appendix 13: Chemicals used in the agricultural activities in Ecuador
NAME
RECOMMENDED QUANTITY
USE
Permitted / Prohibited for Agroquality
Tordon
In minor crops (0.3 – 0.5 L/ha) Plantation s (1 – 1.5 L/ha)
Herbicide for weed control of herbaceous and shrub broadleaf growing in pastures, industrial areas and crops of rice and sugar cane
Permitted
Matamonte 1.5 L/ha (1 a 3.5 L/hais higher than the size and condition of the weed)
Herbicide for weed control
Permitted
Glifosato In grasses and annual weeds can be applied 2 to 3 liters / ha In gramilla or espartillo doses should be increased to 4 or 6 liters / ha
Herbicide for agricultural use, non-selective, for post-emergent control of most annual and perennial grasses, that can be used for pre-planting of soja, corn and sunflower, in pre-harvesting of flour, and in perennial crops in targeted applications.
Permitted
Gramoxone When coverage is almost complete: 1 – 3 L/ha 2 -3 L/ha Fruit trees and perennials, and row crops:
Post-emergent herbicide contact that acts in all green plant tissues and is particularly active against annual grasses and broadleaf weeds.
Permitted
Tornado 4 – 5 L/ha Agriculture Herbicide
Permitted
Glifopac 15 ml. per liter and mixed with 18 liters of water
Herbicide
Permitted
Estelar Annualy: 2 – 3 L/ha Perennials: 4 to 6 L / ha Paddocks: 3 – 5 L/ha
Herbicide post-emergent, non-selective, of systematic action, recommended for control of most annual and perennial grasses and sedges and weeds of broadleafs.
Permitted
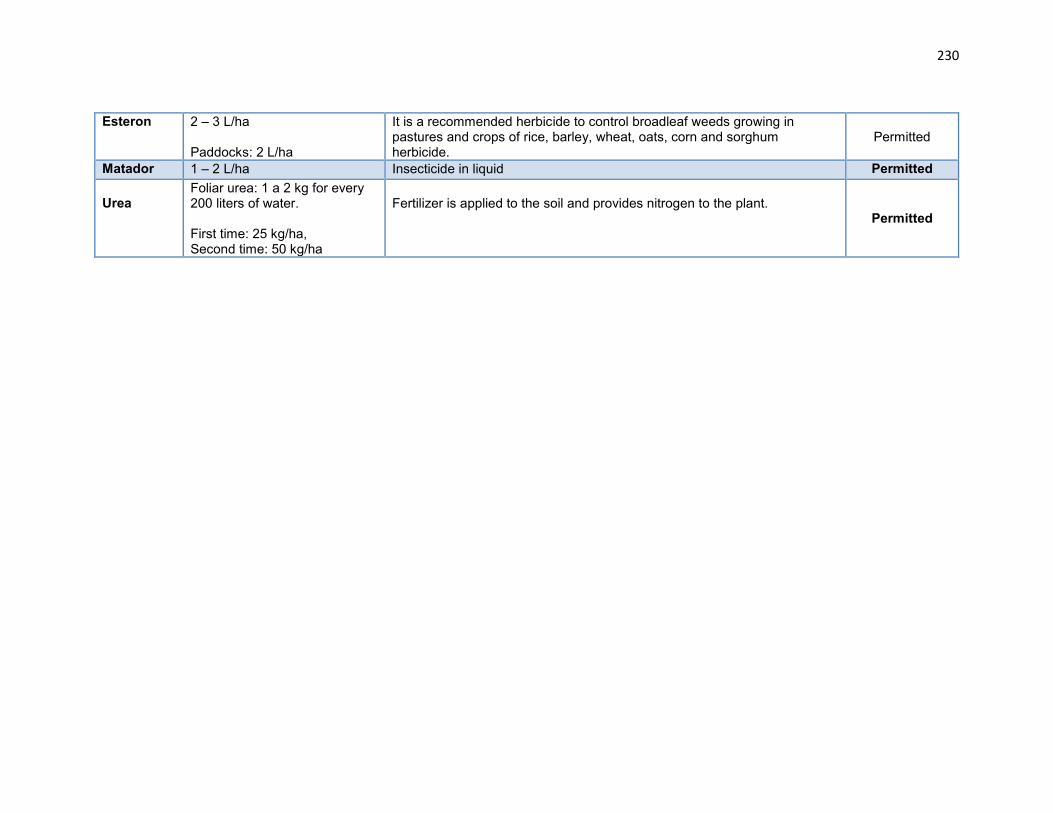
230
Esteron 2 – 3 L/ha Paddocks: 2 L/ha
It is a recommended herbicide to control broadleaf weeds growing in pastures and crops of rice, barley, wheat, oats, corn and sorghum herbicide.
Permitted
Matador 1 – 2 L/ha Insecticide in liquid Permitted Urea
Foliar urea: 1 a 2 kg for every 200 liters of water. First time: 25 kg/ha, Second time: 50 kg/ha
Fertilizer is applied to the soil and provides nitrogen to the plant.
Permitted

231
Appendix 14: Agro ecological Dimension (Scale of indicators)
Annex 14.1 Forest (Sarandon et al. 2007)
Alternative Value
Non Forest cover 0
15 – 25% 1
26% - 50% 2
51% - 75% 3
76% - 90% 4
91 – 100% 5
Annex 14.2 Crop Rotation (Sarandon et al. 2007)
Alternative Value
There is no crop rotation 0
There is virtually no rotation 1
Crop rotates between 4 and 10 years 2
Crop rotates every 2 or 3 years 3
Crop rotates every year, but does not let the soil rest 4
Crop rotates every year and lets the soil rest for one year 5
Annex 14.3 Crop Diversity (Sarandon et al. 2007)
Alternative Value
Perennial monoculture 0
Isolated monoculture 1
Low diversification and low association levels 2
Mid level of diversification with low association levels 3
High diversification of monoculture with mid association among them 4
Total diversification with crop association and natural vegetation 5
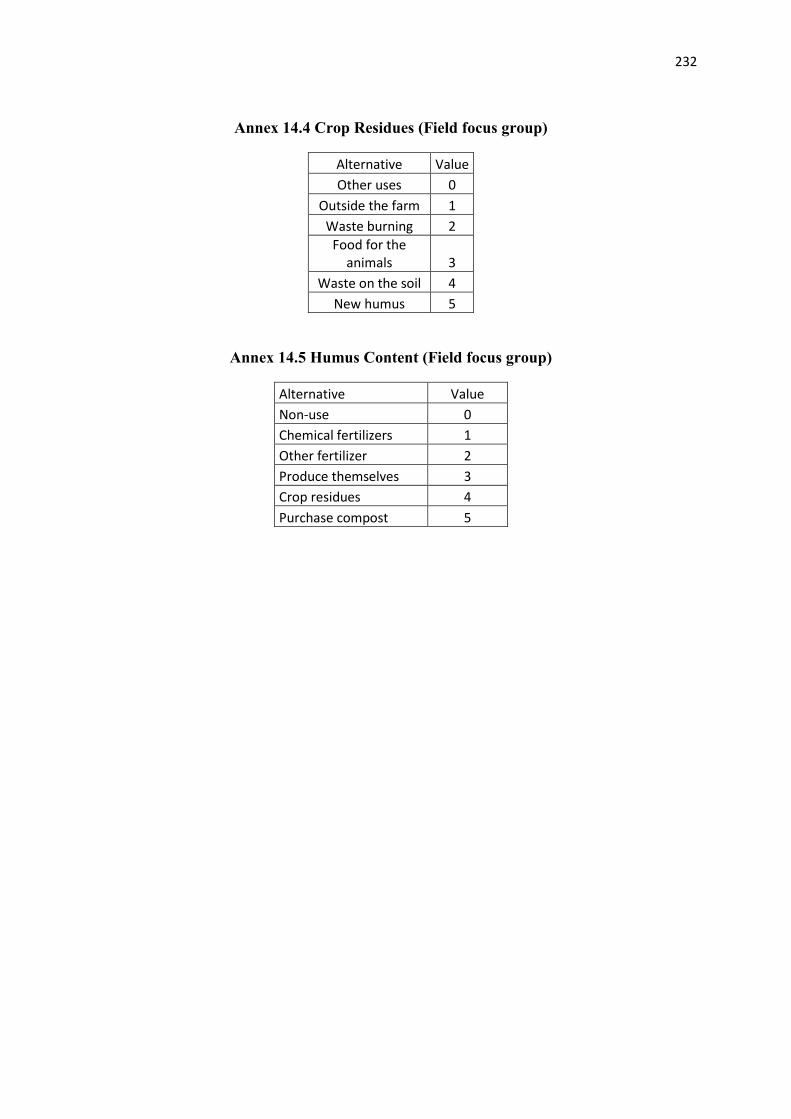
232
Annex 14.4 Crop Residues (Field focus group)
Alternative Value
Other uses 0
Outside the farm 1
Waste burning 2
Food for the animals 3
Waste on the soil 4
New humus 5
Annex 14.5 Humus Content (Field focus group)
Alternative Value
Non-use 0
Chemical fertilizers 1
Other fertilizer 2
Produce themselves 3
Crop residues 4
Purchase compost 5

233
Appendix 15: Erosion risk
The need to measure quickly and easily, the erosion risk led us to use this criterion developed by González (2009). Instead of calculating the loss of erosion by the universal soil loss formula the qualitative indicator is used. The slight erosion means the presence of small grooves, moderate, large grooves associated with small gullies and severe large gullies. The following table encodes.
Erosion level
Level Nomenclature
Without erosion E0
Sligth erosion E1
Moderate erosion E2
Severe erosion E3
There was a need of placing the data in the table determinded for research (0-5). The distinguishing was based on conservation practices performed by farmers. Therefore, there was assigned an assessment, set out in the table below.
Degree of soil erosion the degree of erosion observed and the presence or absence of conservation practices
Level Conservation practices Value
E0 1
5 0
E1 1 4
0 3
E2 1 2
0 1
E3 1
0 0
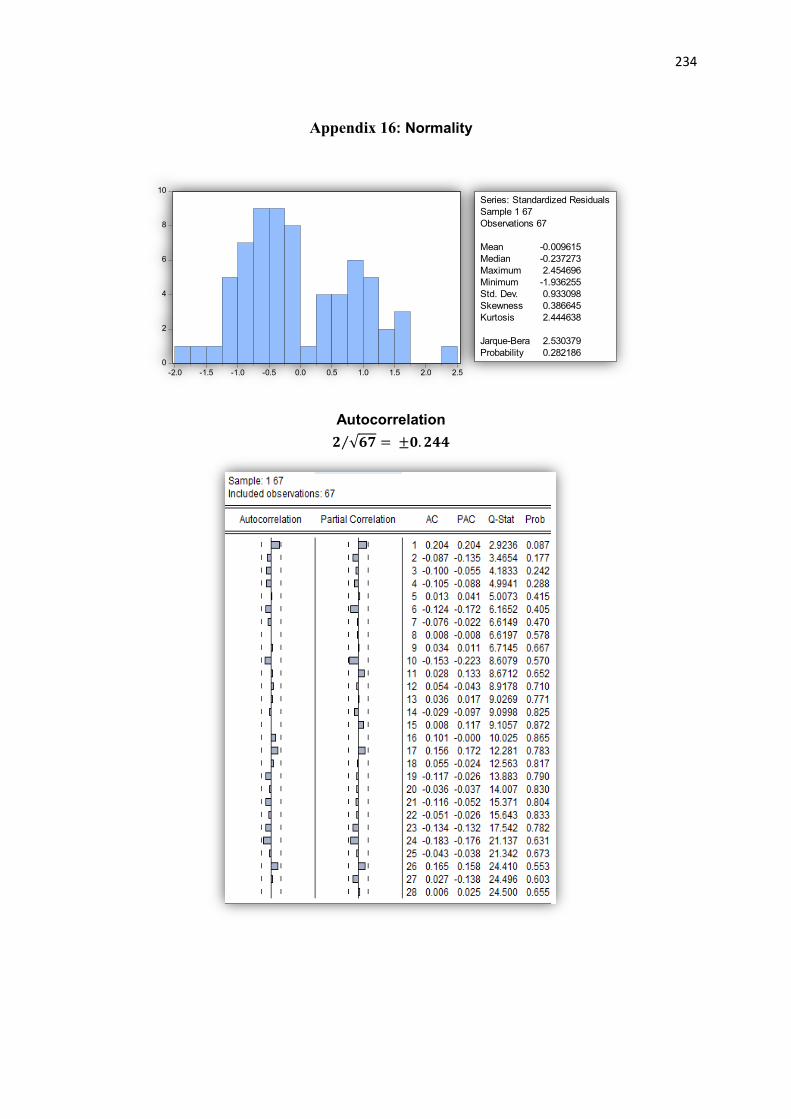
234
Appendix 16: Normality
Autocorrelation 𝟐 √𝟔𝟕⁄ = ±𝟎. 𝟐𝟒𝟒
0
2
4
6
8
10
-2.0 -1.5 -1.0 -0.5 0.0 0.5 1.0 1.5 2.0 2.5
Series: Standardized ResidualsSample 1 67Observations 67
Mean -0.009615Median -0.237273Maximum 2.454696Minimum -1.936255Std. Dev. 0.933098Skewness 0.386645Kurtosis 2.444638
Jarque-Bera 2.530379Probability 0.282186
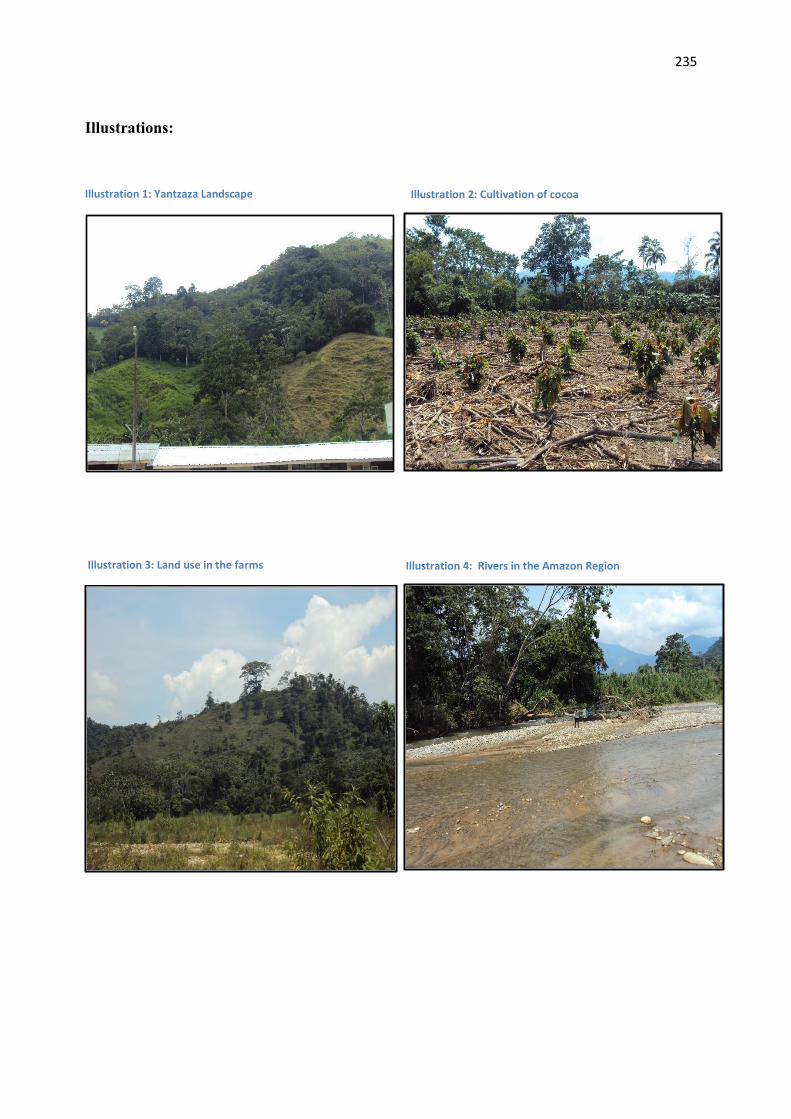
235
Illustration 2: Cultivation of cocoa
Illustration 4: Rivers in the Amazon Region
Illustrations:
Illustration 1: Yantzaza Landscape
Illustration 3: Land use in the farms
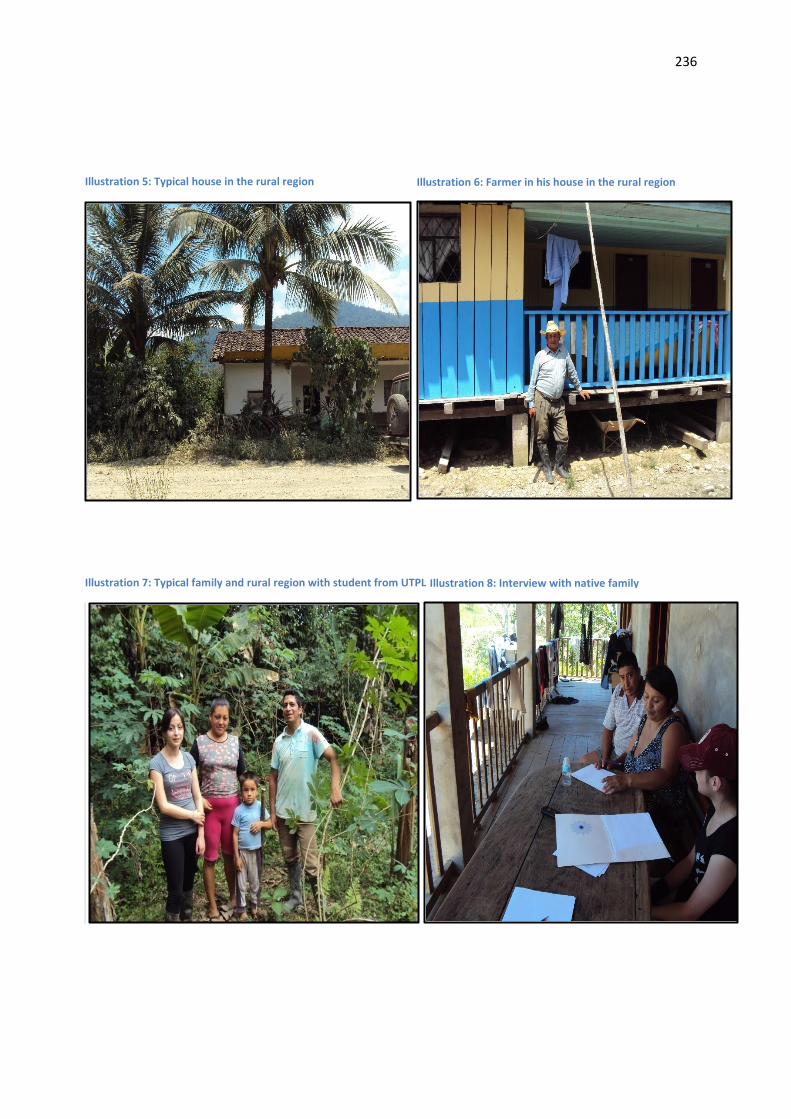
236
Illustration 6: Farmer in his house in the rural region
Illustration 8: Interview with native family
Illustration 5: Typical house in the rural region
Illustration 7: Typical family and rural region with student from UTPL
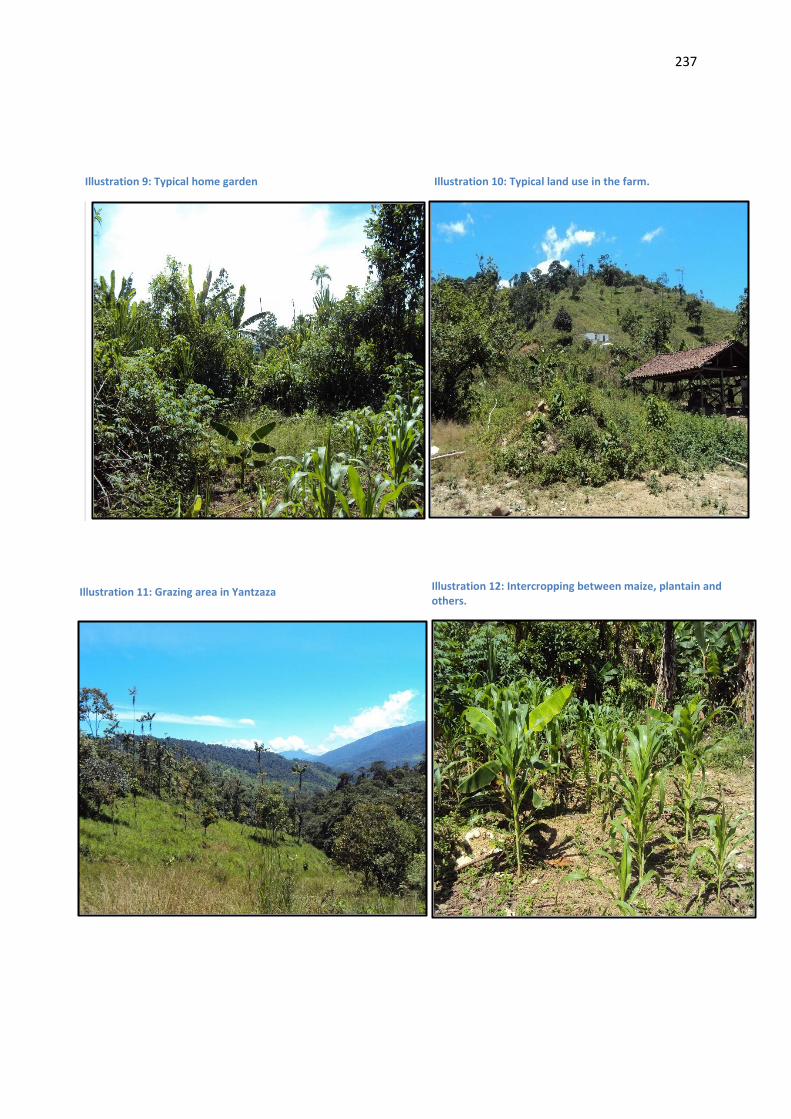
237
Illustration 10: Typical land use in the farm.
Illustration 12: Intercropping between maize, plantain and others.
Illustration 9: Typical home garden
Illustration 11: Grazing area in Yantzaza
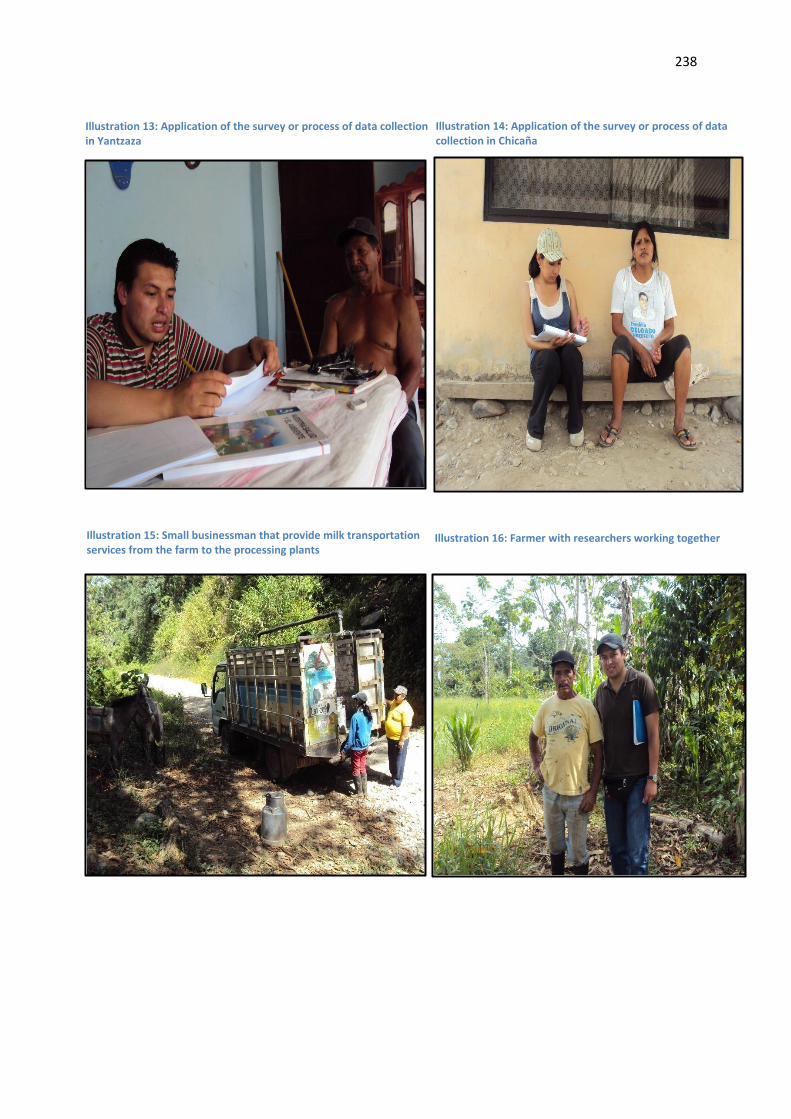
238
Illustration 13: Application of the survey or process of data collection in Yantzaza
Illustration 14: Application of the survey or process of data collection in Chicaña
Illustration 15: Small businessman that provide milk transportation services from the farm to the processing plants
Illustration 16: Farmer with researchers working together
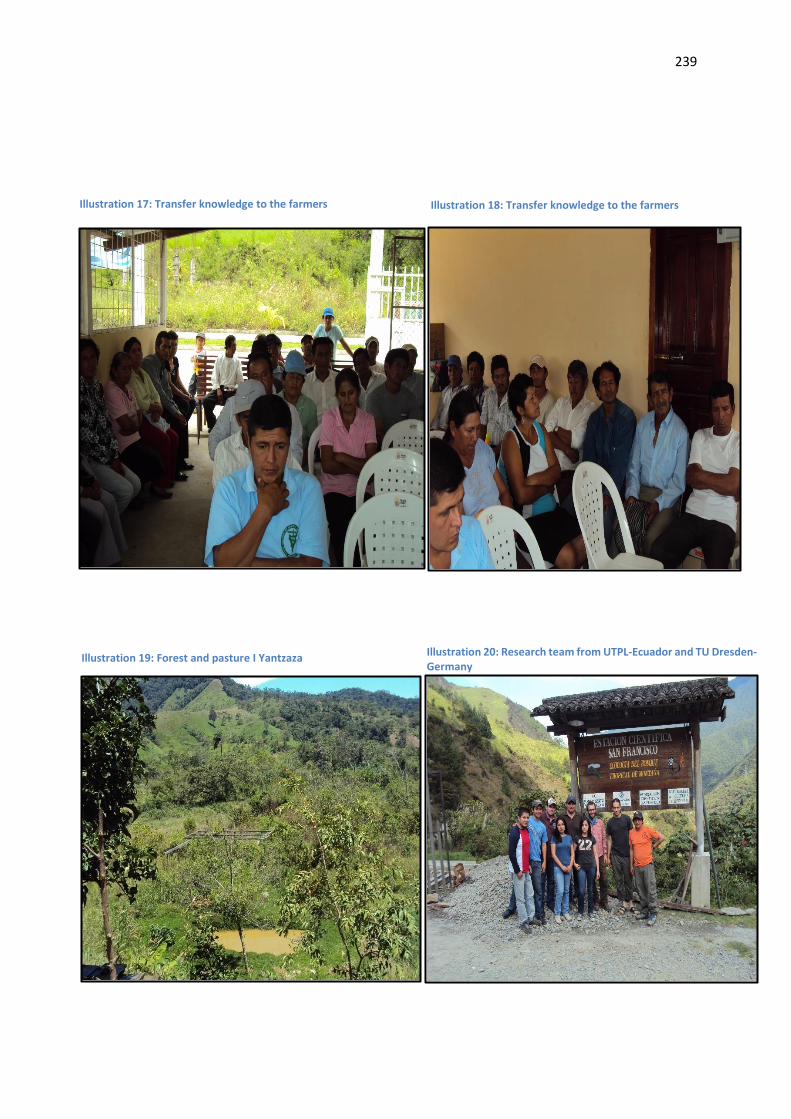
239
Illustration 17: Transfer knowledge to the farmers Illustration 18: Transfer knowledge to the farmers
Illustration 19: Forest and pasture I Yantzaza Illustration 20: Research team from UTPL-Ecuador and TU Dresden- Germany
240
Note on the commencement of the doctoral procedure
1. I hereby assure that I have produced the present work without inadmissible help from third parties and without aids other than those stated; ideas taken directly or indirectly from external sources are identified as such.
2. When selecting and evaluating the material and also when producing the manuscript, I have received support from the following persons: ....
3. No further persons were involved in the intellectual production of the present work. In particular, I have not received help from a commercial doctoral adviser. No third parties have received monetary benefits from me, either directly or indirectly, for work relating to the content of the presented dissertation.
4. The work has not previously been presented in the same or a similar format to another examination body in Germany or abroad, nor has it - unless it is a cumulative dissertation - been published.
5. If this concerns a cumulative dissertation in accordance with Section 10 Para. 2, I assure compliance with the conditions laid down therein.
6. I confirm that I acknowledge the doctoral regulations of the Faculty of Environmental Sciences of the Technische Universität Dresden.
Dresden, July 2017
Gonzalo Izquierdo Montoya Doctoral student’s signatur

241