Sustainable Cities Index - · PDF fileResilience 13 The indicators 15 ... business and...
24
Sustainable Cities Index Ranking Australia’s 20 largest cities in 2010
Transcript of Sustainable Cities Index - · PDF fileResilience 13 The indicators 15 ... business and...
Sustainable Cities IndexRanking Australia’s 20 largest cities in 2010

Copyright 2010 Australian Conservation Foundation. All Rights Reserved
Project Coordinator: Matthew Trigg
Authors: Matthew Trigg, Monica Richter, Sara McMillan, Sean O’Rourke and Virginia Wong
Disclaimer:
This document has been prepared for information purposes only and must not be relied upon for any purpose, including without limitation as professional advice. It is based upon data and information collected and compiled by third parties and neither the Australian Conservation Foundation nor its officers, employees or agents accept any responsibility for any inaccuracy of that information. The index and rankings present performance against the identified indicators (and their supporting criteria) only and not any other indicators or criteria. All indicators are equally weighted in this index.
The Sustainable Australia Team would like to thank the following individuals* without whom this project would not have been possible:
Helen Clarkson, Deputy Director, Forum for the Future
Martin Hunt, Head of Built Environment, Forum for the Future
Patti Whaley, Director of Resources, Forum for the Future
Shay Singh, Director - Green Star, Green Building Council of Australia
A much appreciated thank you to our volunteer reviewers* whose contributions helped to refine and improve the 2010 Index:
Academic reviewers:
Assoc. Prof. Phil McManus, Program Coordinator of Environmental Science, School of Geosciences, University of Sydney
Paul Osmond, Faculty of the Built Environment, University of New South Wales
Prof Bill Randolph, Director, City Futures Research Centre, Faculty of the Built Environment, University of New South Wales
Professional reviewers:
Angus Nardi, Deputy Executive Director, Shopping Centre Council of Australia
Julieanne McIntyre, Executive Officer, Australian Sustainable Built Environment Council
Peter Verwer, Chief Executive, Property Council of Australia
Paul Waterhouse, Executive Director, Policy, Property Council of Australia
Robert Enker, Manager Building Innovation & Sustainability, Regulatory Development Division, Building Commission Victoria
Special thanks also to all the staff at ACF for their invaluable contributions.
*The views contained in the report are not necessarily those of the individuals, reviewers or organisations listed here.

1AuStRAlIAn ConSeRvAtIon FounDAtIon: 2010 SuStainable citieS index
ContentsForeword 2
Australian Conservation Foundation 3
The Sustainable Cities Index: Methodology 4
The results 5
Top performers 6
Mid-table performers 7
The poorer performers 8
Environmental performance 9
Quality of life 11
Resilience 13
The indicators 15
AuStRAlIAn ConSeRvAtIon FounDAtIon: 2010 SuStainable citieS index
Wikipedia Commons - Donaldtong

2 AuStRAlIAn ConSeRvAtIon FounDAtIon: 2010 SuStainable citieS index
The Australian Conservation Foundation (ACF) is committed to inspiring people to achieve a healthy environment for all Australians. For over 40 years we have been a strong voice for the environment, promoting solutions through research, consultation, education and partnerships. ACF is Australia’s leading national not-for-profit environment organisation and we are funded almost entirely by our 40,000 individual members and supporters.
Since 1966, ACF has focussed on the most important and urgent environmental problems. We have played a key role in increasing protection for some of Australia’s most outstanding and iconic natural assets including the Franklin River, Kakadu National Park, the Daintree Rainforest and Great Barrier Reef. Today ACF engages with a broad spectrum of Australian society working with the communities, business and government to build awareness of our great environmental challenges and to protect, restore and sustain our environment.
The ACF Sustainable Cities Index 2010 continues our long history of fostering public debate through independent peer-reviewed research, and explores the relationship between Australia’s natural and built environment to inform the transition toward sustainable cities.
Another primary role of ACF is the creation of successful and productive partnerships to drive public policy in support of good environmental and sound economic outcomes. Key examples include the highly successful Business Roundtable on Climate Change, the influential Southern Cross Climate Coalition, as well as the recent Rapid, Active and Affordable Transport Alliance.
For more information on ACF and our activities visit www.acfonline.org.au.
AuStRAlIAn ConSeRvAtIon FounDAtIon
Wendy Stewart - Tourism Victoria

3AuStRAlIAn ConSeRvAtIon FounDAtIon: 2010 SuStainable citieS index
Australia is one of the most urbanised nations in the world, with our major cities consistently ranked among the most liveable. But liveability does not ensure sustainability. The impact of our cities and wasteful consumption of resources, combined with substantial population growth, poor planning decisions and lack of infrastructure investment, has come at a cost to our economy, society and the environment.
Sustainability is about learning to live within our environmental means while increasing the social cohesion and liveability of our cities. Our car dependent cities, which today fuel asthma, obesity and biodiversity loss, could be transformed into cleaner, more efficient places with great public and active transport and amenity, and happier, healthier residents.
The ACF Sustainable Cities Index provides a snapshot of comparative performance in each of Australia’s 20 largest cities, with the aim of encouraging healthy competition, stimulating discussion and suggesting new ways of thinking about how our cities can be sustainable.
No city has done well across all 15 indicators, with each having its own unique strengths and weaknesses often reflective of their individual
character, context and history. In 2010 Darwin has emerged as Australia’s most sustainable city, followed closely by Sunshine Coast and Brisbane. In contrast, under this comparative analysis, Newcastle, Geelong and finally Perth are Australia’s least sustainable cities of those surveyed.
As centres of industry and commerce, our cities are the key to our future productivity and long term economic prosperity. In the face of developing social and cultural challenges, it is our cities that will form the basis for fostering a healthy and sustainable future for all Australians. Toward this, all of our cities would benefit immediately from increased and better targeted investment to provide:
• Efficient, affordable and healthy transport choices (reducing our oil dependence and vulnerability), and
• Improved energy and water efficiency for both households and workplaces (protecting us against future price rises).
Our Federal Government has the opportunity to provide transformative leadership through a well-designed 10 year retrofit program that builds on
existing government action. Effective collaboration with State governments and the community can improve the planning of our cities and achieve a step change in water and energy efficiency to deliver carbon neutral cities across Australia within 20 years. Implemented well, including with good community participation, these changes will also make our cities more socially cohesive and liveable.
Intended to be updated regularly, we hope that the ACF Sustainable Cities Index will assist by encouraging healthy debate, and promoting interest in and action to achieve more sustainable outcomes across all levels of government, business and the community.
Don Henry CEO, Australian Conservation Foundation
To support our exciting work on creating smarter and more sustainable cities visit: www.acfonline.org.au/donate
FoReWoRD

4 AuStRAlIAn ConSeRvAtIon FounDAtIon: 2010 SuStainable citieS index
The ACF Sustainable Cities Index is a snapshot of the comparative performance of Australia’s 20 largest cities ranked across three ‘baskets’: Environmental Performance, Quality of Life and Resilience. Each basket considers a different dimension of urban sustainability.
Produced by the Australian Conservation Foundation’s Sustainable Australia team, the project methodology is based on ongoing work by Forum for the Future, a sustainable development charity based in London that works in partnership with leading businesses and public sector organisations towards creating an environmentally sustainable and socially just future in the United Kingdom. The approach has been adapted to suit the unique Australian urban topography and framed by the public availability of nationally-consistent data.
For more information on Forum for the
Future’s British Sustainable Cities Index
visit: www.forumforthefuture.org
note: Direct comparison between cities in the different national indexes is not intended or meaningful.
The 20 largest cities have been determined by Statistical Division/Districts from the Australian Bureau of Statistics. The term ‘city’ is used here to denote defined urbanised areas, often including numerous political jurisdictions and taking many different forms, including centralised metropolitan areas, corridor cities along major transportation routes, and regional city systems. While the same city boundaries have been used within each indicator, a number of boundary definitions have had to be employed (LGA, postcode, Statistical Div/Dist, Urban Centre,) in response to varying data sources.
The Index only uses publicly available information, providing a high level of transparency and robustness. This has meant that in many areas the project team’s originally preferred measures were not available or the data could not be broken down to the smaller regional centres, making comparison difficult.
To prevent any value-laden judgments by the project team, weighting (that is, emphasis on one indicator over another) has been intentionally avoided for the 2010 Index. This may change with future versions as a suitable objective weighting system is developed or adopted. Such a move would bring the Index in line with the British Sustainable Cities Index, which is currently weighted.
Through research, debate and discussion the team developed and refined the fifteen indicators that now constitute the 2010 Index. As displayed in the indicator descriptions, further work will occur between now and the next version of the Index to refine and enhance each of the indicators.
Cities are ranked 1 to 20 in order of performance, with the lowest overall score determining which city is comparatively more sustainable. Those cities with equal scores (such as Adelaide and Ballarat in the overall rank) take the same position on the ranking, with subsequent cities immediately following in order to avoid any unfair disadvantage. In the overall ranking this places the least sustainable city, Perth, in 19th rather than 20th place.
The Sustainable Cities Index aims to foster competitive rivalry between the various cities, contribute to the discussion about how urban sustainability is measured, and explore how supporting data is presented and made available to the public.
tHe SuStAInABle CItIeS InDex: metHoDology

5AuStRAlIAn ConSeRvAtIon FounDAtIon: 2010 SuStainable citieS index
overall Ranking
The ACF Sustainable Cities Index tracks progress on sustainability in Australia’s 20 largest cities. It measures 15 different indicators across three broad areas: Environmental Performance; Quality of Life; and Resilience.
In 2010 Darwin has emerged as Australia’s most sustainable city.
Environmental Performance indicators: Air Quality Ecological Footprint Green Building
Water Biodiversity
Quality of Life indicators:Health Density Subjective Wellbeing
Transport Employment
Resilience indicators: Climate Change Public Participation Education
Household Repayments Food Production
Distribution of Scores:
tHe ReSultS
Melbourne 7 142Gold Coast-Tweed 8 143Cairns 9 145Bendigo 10 150Toowoomba 11 152Sydney 12 161Launceston 13 163Adelaide =14 165Ballarat =14 165Albury-Wodonga 15 167Wollongong 16 171Newcastle 17 172Geelong 18 174Perth 19 183
Position ScoreDarwin 1 119Sunshine Coast 2 121Brisbane 3 123Townsville 4 129Canberra-Queanbeyan 5 133Hobart 6 139
0 50 100 150 200 250 300
Scores
Best potential score (15) Worst potential score (300) City

6 AuStRAlIAn ConSeRvAtIon FounDAtIon: 2010 SuStainable citieS index
With four state/territory capitals among the top performers, a distinct ‘capital city advantage’ can be observed. These cities are those which scored between 119 and 140 on the overall ranking.
Darwin performed reasonably well on most indicators, coming on top for Employment with an average unemployment rate of 1.89 per cent, and Household Repayments (less than 23 per cent of household income is spent on loan repayments). It did not fare as well around Ecological Footprint (7.06 hectares/person/year), Health (6.3 per cent of population registered with type 2 diabetes) or Climate Change. Its comparative performance relative to the other cities means Darwin is the most sustainable Australian city for 2010.
In second place is the Sunshine Coast, which shares the top of the Environmental Performance basket with Brisbane. A unique urban form and industry mix have helped the Sunshine Coast claim the top rank on the Air Quality (62 per cent
less particulate matter per cubic metre compared to the lowest city, Newcastle) and Subjective Wellbeing indicators.
The largest of the top performers, Brisbane performed well on a number of indicators, including Green Building (with 40 Green Star certified projects as of February 2010), Education and Food Production, with it coming out on top for the Health indicator (4.02 per cent of population registered with type 2 diabetes). Along with the Sunshine Coast, Brisbane shares the top of the Environmental Performance basket.
Townsville has emerged on top in the Quality of Life basket, with particularly strong performance on the Health indicator (4.14 per cent of population registered with type 2 diabetes). Townsville also took top place on the Biodiversity indicator, displaying a high level of habitat connectivity and relatively low landscape stress.
Canberra-Queanbeyan has displayed some obvious advantages of being associated as the seat of Federal government coming on top for Green Building (with 17 Green Star certified projects in contrast to a relatively low population) and Education (over 63 per cent of people aged over 20 have completed year 12
toP PeRFoRmeRS
0 50 100 150 200 250 300
David Silva - Tourism NT
Scores
Best potential score (15) Worst potential score (300) City

7AuStRAlIAn ConSeRvAtIon FounDAtIon: 2010 SuStainable citieS index
The mid performers include a significant cross-section of cities, including the smallest of the 20 cities, Bendigo. These cities are those which scored between 141 and 163 on the overall ranking.
Melbourne is the first of the mid-table performers in 7th place overall and displaying a consistent performance across the board, with its lowest ranking under Public Participation, with only 12.6 per cent of residents volunteering. Density was Melbourne’s best performing indicator with the city taking third place with 1,808 residents per square kilometre.
The results for Gold Coast-Tweed are much more varied. Despite achieving the top ranking under the Water indicator (on average residential properties receive 162kL of mains water annually), Gold Coast-Tweed performed lowest for Public Participation (only 11.28 per cent of residents volunteer) and Household Repayments (over 38 per cent of household income is spent on loan repayments).
mID-tABle PeRFoRmeRS
or equivalent), whilst performing quite well in areas like Public Participation and Employment (average unemployment rate of 3.01 per cent). Canberra-Queanbeyan has also come out on top for the Resilience basket (score of 33 compared to Wollongong on 72).
Hobart is the only top performing city not to come on top for a single indicator, instead performing comparatively well overall. The Air Quality (61 per cent less particulate matter per cubic meter compared to the lowest city) and Ecological Footprint (5.50 hectares/person/year) indicators were two areas where Hobart performed particularly well.
0 50 100 150 200 250 300
Murray Waite & Assoc - Tourism Queensland
Peter Dunphy - Tourism Victoria
Scores
Best potential score (15) Worst potential score (300) City

8 AuStRAlIAn ConSeRvAtIon FounDAtIon: 2010 SuStainable citieS index
Cairns has presented a consistent mid-rank performance across most indicators with seven ranks between 9 and 15. This was balanced against strong performance for Transport, where Cairns took the top place with just 469 private vehicles per 1000 people at the 2006 Census. Although in this circumstance the current Transport measure does not necessarily indicate that quality active and public transport alternatives exist.
Bendigo presented a strong performance for Air Quality (59 per cent less particulate matter per cubic meter compared to the lowest city), Ecological Footprint (5.66 hectares/person/year) and Subjective Wellbeing, while taking top place for Public Participation with over 17 per cent of its population volunteering in some capacity. These were off-set by Bendigo’s poor performance on the Density indicator with only 701 residents per square kilometre, the lowest of any city in the Index.
Toowoomba had its best ranking as 2nd under Employment (average unemployment rate of 1.91 per cent). In contrast, it performed the lowest for Subjective Wellbeing and Climate Change, with only a “political declaration” and no targets or plan of action being indicated during the data collection period for local climate change policy development under the ICLEI Cities for Climate Protection Five Milestones Process.
Sydney presented a significant gulf between where it did well and where it did poorly, taking top place for Density (2,461 residents per square kilometre) and doing well under Biodiversity and Education (52.9 per cent of people aged over 20 have completed year 12 or equivalent). This contrasts with poor performance under Subjective Wellbeing (second lowest city) and Public Participation (11.7 per cent of residents volunteer).
Coming on top for the Ecological Footprint (5.42 hectares/person/year) allowed Launceston to compensate for an otherwise below-average performance on the majority of other indicators. Its performance on Education was the lowest among the 20 cities, with less than 35 per cent of individuals aged over 20 having completed Year 12 or equivalent.
Phillip Quirk - Tourism NSW

9AuStRAlIAn ConSeRvAtIon FounDAtIon: 2010 SuStainable citieS index
The cities that are ranked comparatively poorly may have done well in one or two indicators, but generally did not perform well overall. These cities are those which scored between 164 and 183 on the overall ranking.
Coming equal 14th, Adelaide performed poorly under Water (on average residential properties receive 194kL annually with a mean annual rainfall of 542.2mm) and Transport (622 private vehicles per 1000 people), but had a decent showing under Green Building (19 Green Star certified projects) and Food Production (2 farmers markets and 23 community gardens listed). More generally, Adelaide faired comparatively worse than many the other capital cities, with the exception of Perth.
Ballarat, equal 14th overall, performed the best under Food Production and comparatively well under Public Participation (16.9 per cent of residents volunteer). This contrasts with lower performance on the indicators of Density (806 residents per square kilometre), Transport (601 private vehicles per 1000 people) and Employment, resulting in Ballarat being the lowest in the Quality of Life basket.
The highest score for Albury-Wodonga was 5th place on the Ecological Footprint indicator with an annual consumption-based impact of 5.8 hectares/person. However, its lowest score was for Health (5.58 per cent of population registered with type 2 diabetes), Climate Change and Education (35.49 per cent of people aged over 20 have completed year 12 or equivalent).
While Wollongong came in 2nd for Water, Transport (475 private vehicles per 1000 people), and Climate Change, it performed poorly under Air Quality (2.5 times more particulate matter per cubic metre compared to the best performing city), Health, Education (just 34.8 per cent of people aged over 20 have completed year 12 or equivalent) and Household Repayments. Wollongong came last in the Resilience basket.
A focus on climate policy, rather than emissions, allowed Newcastle to come out on top for Climate Change. This contrasts with the home of the world’s largest coal exporting harbour achieving the lowest rank for Air Quality, with 2.6 times more particulate matter per cubic metre compared to the Sunshine Coast. This industrial hub also came 2nd under Density with 2,029 residents per square kilometre.
tHe PooReR PeRFoRmeRS
The best scores Geelong achieved were 4th for Density (1,720 residents per square kilometre) and Subjective Wellbeing. Its consistently below-average performance compared to other cities – for example, under Health (5.38 per cent of the population registered with type 2 diabetes) – brought Geelong to the bottom of the 2010 ranking.
Perth has performed lowest under Ecological Footprint (7.66 hectares/person/year), Water and Transport (641 private vehicles per 1000 people), while its best score was 5th for Biodiversity, Employment (average unemployment rate of 3.44 per cent) and Education (52.9 per cent of people aged over 20 have completed year 12 or equivalent). Like Geelong, it is Perth’s comparative performance that has resulted in its position at the bottom of the overall ranking with a score of 183, and also the bottom of the Environmental Performance basket.
0 50 100 150 200 250 300
Peter Dunphy - Tourism VictoriaScores
Best potential score (15) Worst potential score (300) City

10 AuStRAlIAn ConSeRvAtIon FounDAtIon: 2010 SuStainable citieS index
0 10 20 30 40 50 60 70 80 90 100 110
The environmental performance of each city has a direct impact on our ability to achieve a healthy environment for all Australians. The five indicators employed within this basket each present a direct relationship between the natural environment and the ability of our cities to be sustained over time.
The limited difference between many Australian cities in this basket can be seen in the four separate occasions where two cities have obtained an equal score. For instance, Brisbane and the Sunshine Coast have come out on top with equal scores of 35, despite markedly different performances within each individual indicator.
Some cities, such as Wollongong, have performed well for this basket, despite a comparatively bad performance overall. Meanwhile the position of other cities, such as Perth or Hobart, is very similar to what can be seen in the overall ranking. Distribution of Scores:
envIRonmentAl PeRFoRmAnCe
Hobart =5 43Toowoomba =5 43Gold Coast-Tweed 6 46Melbourne 7 47Darwin 8 48Ballarat =9 51Sydney =9 51Albury-Wodonga =10 53Launceston =10 53Newcastle 11 55Canberra-Queanbeyan 12 58Townsville 13 60Geelong 14 61Adelaide 15 62Perth 16 73
Position ScoreBrisbane =1 35Sunshine Coast =1 35Wollongong 2 38Cairns 3 40Bendigo 4 42
LEGEND: TOP MID POOR
Scores
Lowest potential score (5) Highest potential score (100) City

11AuStRAlIAn ConSeRvAtIon FounDAtIon: 2010 SuStainable citieS index
envIRonmentAl PeRFoRmAnCe tABle
City Air Quality Ecological Footprint Green Building Water Biodiversity
Adelaide 13 15 3 19 12Albury-Wodonga 16 5 10 11 11Ballarat 6 4 17 9 15Bendigo 3 3 8 16 12Brisbane 8 17 2 4 4Cairns 11 12 5 3 9Canberra-Queanbeyan 14 19 1 14 10Darwin 4 18 12 12 2Geelong 12 6 15 13 15Gold Coast-Tweed 18 13 7 1 7Hobart 2 2 16 17 6Launceston 7 1 17 15 13Melbourne 9 10 4 10 14Newcastle 20 7 17 8 3Perth 15 20 13 20 5Sunshine Coast 1 9 11 7 7Sydney 17 16 9 6 3Toowoomba 5 11 14 5 8Townsville 10 14 17 18 1Wollongong 19 8 6 2 3
Hobart =5 43Toowoomba =5 43Gold Coast-Tweed 6 46Melbourne 7 47Darwin 8 48Ballarat =9 51Sydney =9 51Albury-Wodonga =10 53Launceston =10 53Newcastle 11 55Canberra-Queanbeyan 12 58Townsville 13 60Geelong 14 61Adelaide 15 62Perth 16 73
LEGEND: TOP MID POOR

12 AuStRAlIAn ConSeRvAtIon FounDAtIon: 2010 SuStainable citieS index
0 10 20 30 40 50 60 70 80 90 100 110
The quality of life for residents in a particular city has a direct correlation with their willingness and motivation to sustain their immediate environment over time, with subsequent consequences, both positive and negative, for the natural environment.
Quality of Life has the highest and lowest scores out of the three baskets, giving it the largest spread of scores overall and only two occasions where cities have achieved the same score.
Townsville’s comparatively low density (it came 18th) has not been enough to prevent it coming out on top overall in this basket. Similarly, with a 12 point difference between its closest rival, Ballarat has done quite poorly, with its highest rank only 9th under the Subjective Wellbeing indicator. This displays the strength of using five comparative indicators, rather than a single measure for Quality of Life within each city.
Distribution of Scores:
QuAlIty oF lIFe
Melbourne 6 46Brisbane 7 47Hobart 8 50Geelong 9 52Sydney =10 53Toowoomba =10 53Cairns 11 54Launceston 12 55Newcastle =13 56Perth =13 56Albury-Wodonga 14 58Wollongong 15 61Adelaide 16 62Bendigo 17 65Ballarat 18 77
Position ScoreTownsville 1 32Darwin 2 34Gold Coast-Tweed 3 39Sunshine Coast 4 41Canberra-Queanbeyan 5 42
LEGEND: TOP MID POOR
Scores
Lowest potential score (5) Highest potential score (100) City

13AuStRAlIAn ConSeRvAtIon FounDAtIon: 2010 SuStainable citieS index
Melbourne 6 46Brisbane 7 47Hobart 8 50Geelong 9 52Sydney =10 53Toowoomba =10 53Cairns 11 54Launceston 12 55Newcastle =13 56Perth =13 56Albury-Wodonga 14 58Wollongong 15 61Adelaide 16 62Bendigo 17 65Ballarat 18 77
City Health Density Subjective Wellbeing Transport Employment
Adelaide 15 6 6 19 16Albury-Wodonga 17 10 12 13 6Ballarat 11 19 9 18 20Bendigo 10 20 3 14 18Brisbane 1 15 13 11 7Cairns 6 12 16 1 19Canberra-Queanbeyan 5 17 8 9 3Darwin 18 9 2 4 1Geelong 16 4 4 16 12Gold Coast-Tweed 3 11 7 7 11Hobart 8 5 11 17 9Launceston 12 13 10 12 8Melbourne 4 3 14 15 10Newcastle 13 2 18 8 15Perth 7 7 17 20 5Sunshine Coast 3 14 1 10 13Sydney 14 1 19 5 14Toowoomba 9 16 20 6 2Townsville 2 18 5 3 4Wollongong 19 8 15 2 17
QuAlIty oF lIFe tABle
LEGEND: TOP MID POOR

14 AuStRAlIAn ConSeRvAtIon FounDAtIon: 2010 SuStainable citieS index
0 10 20 30 40 50 60 70 80 90 100 110
The resilience of a city can be described as its ability to absorb future shocks and adapt to emerging pressures, which are essential elements of an urban environment’s ability to be easily sustained in the long term.
Despite performing poorly on Climate Change, Canberra-Queanbeyan has come out as the most resilient of the 20 cities for 2010. Second and third places were shared by no less than five different cities!
Similarly, with the exception of Wollongong, six cities have collected towards the bottom of the basket with only 5 points between them. This includes Newcastle, where its climate change polices allowed it to come out on top for Climate Change, despite being home to the world’s largest coal exporting port, one of the single largest sources of greenhouse gas emissions in the world.
Distribution of Scores:
ReSIlIenCe
Brisbane =3 41Bendigo 4 43Sunshine Coast 5 45Hobart 6 46Melbourne 7 49Cairns 8 51Perth 9 54Launceston 10 55Albury-Wodonga =11 56Toowoomba =11 56Sydney 12 57Gold Coast-Tweed 13 58Geelong =14 61Newcastle =14 61Wollongong 15 72
Position ScoreCanberra-Queanbeyan 1 33Ballarat =2 37Darwin =2 37Townsville =2 37Adelaide =3 41
LEGEND: TOP MID POOR
Scores
Lowest potential score (5) Highest potential score (100) City

15AuStRAlIAn ConSeRvAtIon FounDAtIon: 2010 SuStainable citieS index
Brisbane =3 41Bendigo 4 43Sunshine Coast 5 45Hobart 6 46Melbourne 7 49Cairns 8 51Perth 9 54Launceston 10 55Albury-Wodonga =11 56Toowoomba =11 56Sydney 12 57Gold Coast-Tweed 13 58Geelong =14 61Newcastle =14 61Wollongong 15 72
City Climate Change Public Participation Education Household
Repayments Food Production
Adelaide 10 11 9 7 4Albury-Wodonga 17 6 17 8 8Ballarat 4 3 15 14 1Bendigo 5 1 18 12 7Brisbane 13 13 4 6 5Cairns 6 15 8 11 11Canberra-Queanbeyan 18 2 1 2 10Darwin 15 9 6 1 6Geelong 16 10 14 15 6Gold Coast-Tweed 3 20 11 20 4Hobart 14 5 10 4 13Launceston 19 8 20 5 3Melbourne 11 16 3 13 6Newcastle 1 14 16 16 14Perth 9 18 5 10 12Sunshine Coast 6 7 12 18 2Sydney 12 19 2 17 7Toowoomba 20 4 13 9 10Townsville 6 12 7 3 9Wollongong 2 17 19 19 15
ReSIlIenCe tABle
LEGEND: TOP MID POOR

16 AuStRAlIAn ConSeRvAtIon FounDAtIon: 2010 SuStainable citieS index
tHe InDICAtoRSTo follow are brief descriptions and the data sources for each of the 15 indicators that constitute the 2010 ACF Sustainable Cities Index.
Reminder: Only publicly available information has been employed.
Air QualityCurrent measure: Level of particulate matter (equal to or less than 10 micrometres) per cubic metre in each urban area. Information sourced with consistent methodology from various state-based organisations (for example, state and territory environment departments and environmental protection authorities), with multiple base years (2001-02 to 2007) reflective of data availability at time of collection.
In the future: Update with latest data and establish a consistent base year for all cities.
ecological FootprintCurrent measure: Total amount of land (hectares per person per year) required to support an average lifestyle. Information sourced from the ACF Consumption Atlas (www.acfonline.org.au/consumptionatlas) which is based on research by Sydney University’s Centre for Integrated Sustainability Analysis (ISA) team. Here, input-output analysis has been used to untangle the complicated interdependencies and material flows between Australian industries and examine the underlying environmental impacts of consumption.
In the future: Update with latest data.
James Lauritz - Tourism Victoria

17AuStRAlIAn ConSeRvAtIon FounDAtIon: 2010 SuStainable citieS index
green BuildingCurrent measure: Number of projects certified under the Green Building Council of Australia’s Green Star suite of rating tools relative to population (as per Australian Bureau of Statistics Urban Centre data).
In the future: Refine to indicate actual delivered green building space relative to urban population (e.g. m2 of verified ‘green’ space/population) and expanded to include multiple national ratings systems for buildings and infrastructure.
WaterCurrent measure: Average residential water supplied per property (as reported by the National Water Commission) relative to mean annual rainfall (as reported by the Australian Bureau of Meteorology).
Water utilities servicing Hobart, Launceston and the Sunshine Coast have, to date, failed to provide the required data to the National Water Commission despite a current intergovernmental agreement. For these cities average residential water supplied per property has been derived as an average of the remaining seventeen cities, creating a distinct comparative disadvantage due to this failure to provide sufficient information.
In the future: Update with latest data and include figures for Hobart, Launceston and the Sunshine Coast when provided to the National Water Commission.
Wikipedia Commons - Unclespitfire

18 AuStRAlIAn ConSeRvAtIon FounDAtIon: 2010 SuStainable citieS index
BiodiversityCurrent measure: Cities were first ranked on the extent of Habitat Connectivity which provides the greatest probability of a species being able to disperse, adapt and breed and therefore increase the biodiversity of the area. The second factor applied is Landscape Stress, used to describe the quality of the habitat. The third factor applied is Number of Reserves, indicating the percentage of land set aside for conservation purposes. Finally, the Percentage of Ecosystems at Risk was used to provide further delineation between the various cities. Information sourced from the Australian Natural Resources Atlas (www.anra.gov.au).
In the future: Update with latest data and explore complementary data sets.
HealthCurrent measure: Prevalence of type 2 diabetes employed as a representative measure of community health through its association with obesity and inappropriate diet, which in turn reflects increasingly sedentary lifestyles. Information sourced Diabetes Australia and the Diabetes National Service Scheme (www.ndss.com.au/Australian-Diabetes-Map/Map)
In the future: Update with latest data and explore complementary data sets that strengthen the connection between health and the built environment.
Tourism Queensland
19AuStRAlIAn ConSeRvAtIon FounDAtIon: 2010 SuStainable citieS index
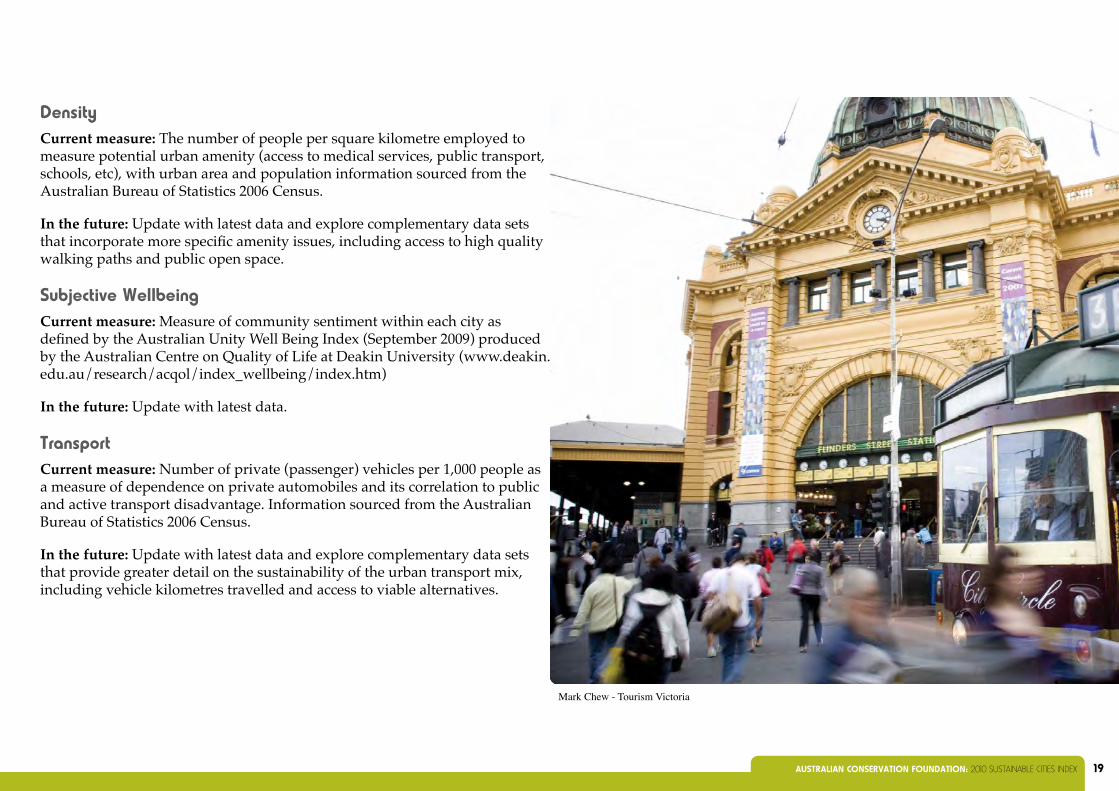
DensityCurrent measure: The number of people per square kilometre employed to measure potential urban amenity (access to medical services, public transport, schools, etc), with urban area and population information sourced from the Australian Bureau of Statistics 2006 Census.
In the future: Update with latest data and explore complementary data sets that incorporate more specific amenity issues, including access to high quality walking paths and public open space.
Subjective WellbeingCurrent measure: Measure of community sentiment within each city as defined by the Australian Unity Well Being Index (September 2009) produced by the Australian Centre on Quality of Life at Deakin University (www.deakin.edu.au/research/acqol/index_wellbeing/index.htm)
In the future: Update with latest data.
transportCurrent measure: Number of private (passenger) vehicles per 1,000 people as a measure of dependence on private automobiles and its correlation to public and active transport disadvantage. Information sourced from the Australian Bureau of Statistics 2006 Census.
In the future: Update with latest data and explore complementary data sets that provide greater detail on the sustainability of the urban transport mix, including vehicle kilometres travelled and access to viable alternatives.
Mark Chew - Tourism Victoria

20 AuStRAlIAn ConSeRvAtIon FounDAtIon: 2010 SuStainable citieS index
employmentCurrent measure: Average unemployment rate over the past 12 months as a measure of local economic strength and long term stability. Information sourced from the Department of Education, Employment and Workplace Relations’ Small Area Labour Markets Australia: September Quarter 2009 (Commonwealth of Australia, 2009).
In the future: Update with latest data and explore inclusion of over-employment.
Climate ChangeCurrent measure: Average of local government performance within each city based on the ICLEI Cities for Climate Protection Five Milestone Process and subsequent reduction targets. The Five Milestone Process is a simple, standardised means of calculating greenhouse gas emissions, establishing targets to lower emissions, reducing greenhouse gas emissions and monitoring, measuring and reporting performance (see www.iclei.org).
In the future: Update in line with developments in the Cities for Climate Protection programme and other complementary data sets.
Public ParticipationCurrent measure: Proportion of individuals who volunteer for a group or organisation employed as a measure of local community strength and the willingness of residents to engage in activities for which they are not renumerated. Information sourced from the Australian Bureau of Statistics 2006 Census.
In the future: Update with latest data and explore complementary data sets.
Tourism Queensland

21AuStRAlIAn ConSeRvAtIon FounDAtIon: 2010 SuStainable citieS index
educationCurrent measure: Percentage of population aged 20 years and over who have completed Year 12 or an equivalent qualification as a measure of social and economic empowerment through education. Information sourced from the Australian Bureau of Statistics 2006 Census.
In the future: Update with latest data and explore complementary data sets.
Household RepaymentsCurrent measure: Percentage of monthly household income a particular population spends on loan repayments as a measure of financial over-extension (for example, gearing) and a surrogate measure for affordable housing/living. Information sourced from the Australian Bureau of Statistics 2006 Census.
In the future: Update with latest data and expand to include affordable living factors.
Food ProductionCurrent measure: Number of farmers’ markets and community gardens with each relative to population then combined as a measure of a city’s ability to produce and distribute locally grown produce. Information sourced from Australian Community Foods (www.communityfoods.org.au) and the Australian Bureau of Statistics.
In the future: Update with latest data and refine to more accurately reflect a wider variety of local food production measures with each community
Richard Eastwood - Tourism Tasmania

Authorised by Don Henry, Australian Conservation Foundation, Level 1, 60 Leicester St, Carlton VIC 3053
Printed on 100 per cent recycled paper using vegetable-based inks
by PrintTogether, 771 Nicholson Street, Carlton North, Victoria 3054
www.acfonline.org.au/citiesindex For further information about the ACF Sustainable Cities Index please contact the project team in either melbourne or Sydney.
melbourne (Head office)First Floor 60 leicester St Carlton vIC 3053 Ph: (03) 9345 1111 or 1800 332 510 [free call] Fax: (03) 9345 1166
Adelaidelevel one 157 Franklin St Adelaide SA 5000 Ph: 1800 332 510
BroomePo Box 1868 (lotteries House) Broome WA 6725 Ph: 08 9192 1936 Fax: 08 9192 1936
CairnsSuite one level one 96 - 98 lake St Cairns QlD 4870 Ph: (07) 4031 5760 Fax: (07) 4031 3610
CanberraPo Box 2699 Canberra City ACt 2601 Ph: (02) 6247 2472
SydneySuite 504 32 york St Sydney nSW 2000 Ph: (02) 8270 9900 Fax: (02) 8270 9988