SUSTAINABLE BANKING STRATEGIES ADOPTED BY INDIAN …1. To review the Sustainable Banking Strategies...
14
Asia Pacific Journal of Marketing & Management Review__________________________________________ ISSN 2319-2836 Vol.2 (1), January (2013) Online available at indianresearchjournals.com 48 SUSTAINABLE BANKING STRATEGIES ADOPTED BY INDIAN BANKS: MEETING THE GLOBAL STANDARDS DR.Y.V.RAO Professor School of Management Studies Vignan University Vadlamudi,Guntur,Andhra Pradesh, India _____________________________________________________________________________________ ABSTRACT In the process of globalization, Indian banks are maintaining prudent banking practices to meet the world class standards to improve the performance of public and private sector banks in terms of reducing net NPAs, follow up of Basel standards to gain competitive advantages trough implementing IT enabled solutions and greater outreach to develop rural banking habits(Financial inclusion). Adhering to the Universal Banking activities of banking, development financing subject to compliance with statutory and other requirements prescribed by RBI, GOI and other enactment. Activities include accepting deposits, granting loans, investing in securities, credit cards, project finance, remittances, payment systems, project counseling, merchant banking, foreign exchange operations, insurance etc. The new business initiatives coupled with changing customer profiles are being partly addressed by technology enabled support infrastructure in banks. To successfully implement its business strategy, banks will need to conduct an organization restructuring initiative to ensure seamless conduct of multiple business processes for every business unit. KEYWORDS: prudent banking practices, Basel standards, customer profiles, technology enabled support infrastructure in banks _____________________________________________________________________________________ INTRODUCTION The competitive environment in the banking sector is likely to result in individual players working out differentiated strategies based on their strengths and market niches. For example, some players might emerge as specialists in mortgage products, credit cards etc. whereas some could choose to concentrate on particular segments of business system, while outsourcing all other functions. Some other banks may concentrate on SME segments or high net worth individuals by providing specially tailored services beyond traditional banking offerings to satisfy the needs of customers they understand better than a more generalist competitor. To be strengthened to ensure transfer of funds on real time basis eliminating risks associated with transactions and settlement process. Banks will have to adopt global standards in capital adequacy, income recognition and provisioning norms. Risk management setup in Banks will need to be strengthened. Benchmark standards could be evolved. Regulatory set-up will have to be strengthened, in line with the requirements of a market-led integrated financial system. Banks
Transcript of SUSTAINABLE BANKING STRATEGIES ADOPTED BY INDIAN …1. To review the Sustainable Banking Strategies...

Asia Pacific Journal of Marketing & Management Review__________________________________________ ISSN 2319-2836 Vol.2 (1), January (2013) Online available at indianresearchjournals.com
48
SUSTAINABLE BANKING STRATEGIES ADOPTED BY INDIAN
BANKS: MEETING THE GLOBAL STANDARDS
DR.Y.V.RAO
Professor School of Management Studies
Vignan University Vadlamudi,Guntur,Andhra Pradesh, India
_____________________________________________________________________________________
ABSTRACT
In the process of globalization, Indian banks are maintaining prudent banking practices to meet
the world class standards to improve the performance of public and private sector banks in terms
of reducing net NPAs, follow up of Basel standards to gain competitive advantages trough
implementing IT enabled solutions and greater outreach to develop rural banking
habits(Financial inclusion). Adhering to the Universal Banking activities of banking,
development financing subject to compliance with statutory and other requirements prescribed
by RBI, GOI and other enactment. Activities include accepting deposits, granting loans,
investing in securities, credit cards, project finance, remittances, payment systems, project
counseling, merchant banking, foreign exchange operations, insurance etc. The new business
initiatives coupled with changing customer profiles are being partly addressed by technology
enabled support infrastructure in banks. To successfully implement its business strategy, banks
will need to conduct an organization restructuring initiative to ensure seamless conduct of
multiple business processes for every business unit. KEYWORDS: prudent banking practices, Basel standards, customer profiles, technology
enabled support infrastructure in banks _____________________________________________________________________________________
INTRODUCTION
The competitive environment in the banking sector is likely to result in individual players
working out differentiated strategies based on their strengths and market niches. For example,
some players might emerge as specialists in mortgage products, credit cards etc. whereas some
could choose to concentrate on particular segments of business system, while outsourcing all
other functions. Some other banks may concentrate on SME segments or high net worth
individuals by providing specially tailored services beyond traditional banking offerings to
satisfy the needs of customers they understand better than a more generalist competitor.
To be strengthened to ensure transfer of funds on real time basis eliminating risks associated
with transactions and settlement process. Banks will have to adopt global standards in capital
adequacy, income recognition and provisioning norms. Risk management setup in Banks will
need to be strengthened. Benchmark standards could be evolved. Regulatory set-up will have to
be strengthened, in line with the requirements of a market-led integrated financial system. Banks

Asia Pacific Journal of Marketing & Management Review__________________________________________ ISSN 2319-2836 Vol.2 (1), January (2013) Online available at indianresearchjournals.com
49
will have to adopt best global practices, systems and procedures. Banks may have to evaluate on
an ongoing basis, internally, the need to effect structural changes in the organization. This will
include capital restructuring through mergers / acquisitions and other measures in the best
business interests. IBA and NABARD may have to play a suitable role in this regard.
The results of the study highlights that the banking sector in India is still vulnerable to crises.
Even though there were remarkable changes in banking sector intended to improve the efficiency
of the sector, the banks are still vulnerable to the financial crisis. The growths of NPA, growth
rate before and after financial crisis are the indicators of its vulnerability. Reforms should be
further strengthened to improve the financial stability of banking sector. The vulnerability of
banking sector is not desirable for the growth of economy, hence require precautionary
measures. The lessons from banking sector which are not affected by the financial crisis should
be incorporated into the banking sector. More researches are desirable which investigates the
methods to reduce the vulnerability in the banking sector. Collectively, this paper provides some
indicators which can show the effect of financial crisis in banking sector. NPA is an important
factor that still prevails as an alarming signal for banking growth and survival. There are other
various other indicators like credit-deposit ratio and other by which the performance of the
banking sector can be analyzed in the era of global crisis.The high level of competition in the
market, increased awareness and quality consciousness of the people, changing social values,
increasing emphasis on good corporate governance, etc. have influenced the changes in the
environment in a significant way.The 21st century will bring about all-embracing convergence of
computing, communications, information and knowledge to radically change the business of
banking. The growth of high speed networks, coupled with the falling cost of computing power,
is making possible applications undreamed of in the past. Voice, data, images, and video may
now be transferred around the world in microseconds. Not only has technology transformed the
internal accounting and management systems of banks, it has also fundamentally changed the
delivery systems they use to interact with their customers. However, the quest for newer and
better technologies continues as worldwide, banks look for ways to meet the challenges and
opportunities of a rapidly-changing environment. They recognize that without the right
technology, they cannot hope to remain globally competitive.The present study investigates
Sustainable Banking Strategies adopted by Indian banks by reviewing the last decade
performance of scheduled commercial banks in India. The development of banking sector and its
stability is essential for the overall development of the economy. The stability of banking sector
is determined on the basis of its performance and quality of assets. This study examines the
various issues of the NPA‟s and asset quality aspects of Indian scheduled commercial banks of
public and private sector. The Indian banking sector underwent structural changes during post
liberalization era with the implementation of prudential norms for income recognition,
provisioning and asset classification. The banking sector is going to implement Basel III
according in the near future. The study has been conducted by using data available for the period
2000-2011. A notable result is the financial stability of public and private sector banks showed a
tremendous improvement by way of minimizing the level of NPA‟s i.e. sub-standard, doubtful
assets, loss assets. In the process of Globalization the role of banks plays an important role to
protect the Public money in one hand and to improve the quality standards in terms of
management of funds, minimization of non-performing assets, asset liability management,
spreads on the other. The introduction of new economic policy, prudential norms by Reserve
Bank of India since 1991 in Public and Private Sector Banks facilitated a progressive
improvement in implementing best prudential practices. This paper presents an analysis of

Asia Pacific Journal of Marketing & Management Review__________________________________________ ISSN 2319-2836 Vol.2 (1), January (2013) Online available at indianresearchjournals.com
50
progressive and qualitative improvement in Public and private sector banks in terms of quality of
assets. In order to bring the Indian banking and finance system will be globally Competitive. For
this the market players will have to be financially strong and operationally efficient. Capital
would be a key factor in building a successful institution. The banking and finance system will
improve competitiveness through a process of minimization of non-performing assets and
efficient and effective funds management.
Objectives
1. To review the Sustainable Banking Strategies adopted by Indian banks
2. To study the role of Public and Private Sector Banks in minimization of non-performing
assets.
3. To analyze the qualitative improvement in asset quality of both public and private sector
banks.
4. To study the impact of prudential norms on public and private sector banks in India
during the last decade
5. To suggest measures for strengthening of Sustainable Banking system of public and
private sector banks in India.
Methodology
The data required for the study has been collected from both primary and secondary sources.
The primary data has been collected through administering a structure questionnaire to the
experts, employees and bankers. The secondary data has been collected from reports of RBI,
Indian Banks Association (IBA) and Journals etc.
Statistical Tools
Descriptive statistics, T-test, correlation tools had applied to analyze the results of public and
private sector banks in terms of evaluating the qualitative improvement in maintaining asset
quality.
IMPACT OF GLOBAL FINANCIAL CRISIS ON PROFITABILITY OF COMMERCIAL
BANKS
In this article it is highlighted whether the financial crisis has impact on the profitability and
quality of assets of scheduled commercial banks or not. The bankgroup wise statistics on major
performance indicators were divided into two periods, from 1999-00 to 2006-07 and 2007-09 to
2010-11. The first period i.e.,1999-07 indicates financial performance before global financial
crisis. The second period i.e., 2007-00 indicates period after the financial crisis. The average
annual growth (AAG) rate is calculated on various performance indicators for the two periods.
Table 1 highlight about the performance of banking sector before and after global crisis.
Asia Pacific Journal of Marketing & Management Review__________________________________________ ISSN 2319-2836 Vol.2 (1), January (2013) Online available at indianresearchjournals.com
51
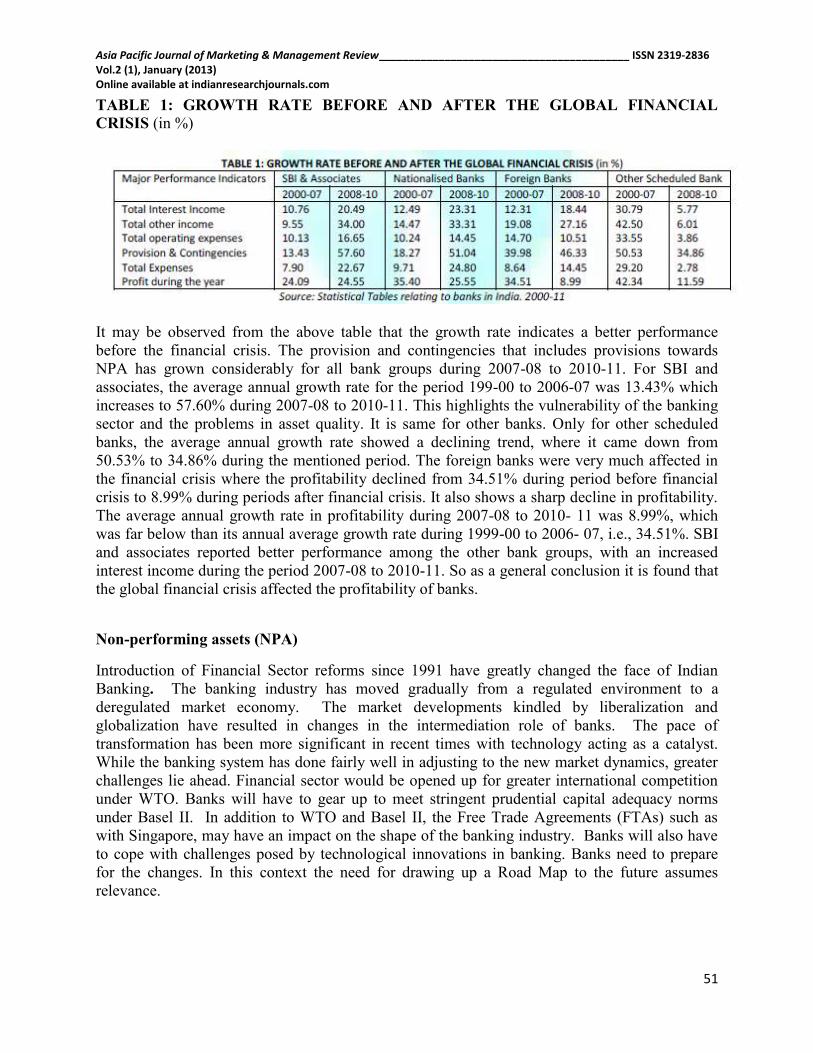
TABLE 1: GROWTH RATE BEFORE AND AFTER THE GLOBAL FINANCIAL
CRISIS (in %)
It may be observed from the above table that the growth rate indicates a better performance
before the financial crisis. The provision and contingencies that includes provisions towards
NPA has grown considerably for all bank groups during 2007-08 to 2010-11. For SBI and
associates, the average annual growth rate for the period 199-00 to 2006-07 was 13.43% which
increases to 57.60% during 2007-08 to 2010-11. This highlights the vulnerability of the banking
sector and the problems in asset quality. It is same for other banks. Only for other scheduled
banks, the average annual growth rate showed a declining trend, where it came down from
50.53% to 34.86% during the mentioned period. The foreign banks were very much affected in
the financial crisis where the profitability declined from 34.51% during period before financial
crisis to 8.99% during periods after financial crisis. It also shows a sharp decline in profitability.
The average annual growth rate in profitability during 2007-08 to 2010- 11 was 8.99%, which
was far below than its annual average growth rate during 1999-00 to 2006- 07, i.e., 34.51%. SBI
and associates reported better performance among the other bank groups, with an increased
interest income during the period 2007-08 to 2010-11. So as a general conclusion it is found that
the global financial crisis affected the profitability of banks.
Non-performing assets (NPA)
Introduction of Financial Sector reforms since 1991 have greatly changed the face of Indian
Banking. The banking industry has moved gradually from a regulated environment to a
deregulated market economy. The market developments kindled by liberalization and
globalization have resulted in changes in the intermediation role of banks. The pace of
transformation has been more significant in recent times with technology acting as a catalyst.
While the banking system has done fairly well in adjusting to the new market dynamics, greater
challenges lie ahead. Financial sector would be opened up for greater international competition
under WTO. Banks will have to gear up to meet stringent prudential capital adequacy norms
under Basel II. In addition to WTO and Basel II, the Free Trade Agreements (FTAs) such as
with Singapore, may have an impact on the shape of the banking industry. Banks will also have
to cope with challenges posed by technological innovations in banking. Banks need to prepare
for the changes. In this context the need for drawing up a Road Map to the future assumes
relevance.

Asia Pacific Journal of Marketing & Management Review__________________________________________ ISSN 2319-2836 Vol.2 (1), January (2013) Online available at indianresearchjournals.com
52
Management of Non-performing assets
A NPA is a loan or an advance where; Interest and/ or installment of principal remain overdue
for a period of more than 90 days in respect of a term loan, the account remains “out of order” in
respect of an overdraft/ cash credit, the bill remains overdue for a period of more than 90 days in
the case of bills purchased and discounted, the installment or interest remains overdue for two
crop seasons in case of short duration crops and for one crop season in case of long duration
crops.
Categories of Non-performing assets
Substandard Assets – Which has remained NPA for a period less than or equal to 12 months.
Doubtful Assets – Which has remained in the sub-standard category for a period of 12 months?
Loss Assets – where loss has been identified by the bank or internal or external auditors or the
RBI inspection but the amount has not been written off wholly.
Prudential Norms
Standard Assets – general provision of a minimum of 0.25%
Substandard Assets – 10% on total outstanding balance, 10 % on unsecured exposures
identified as sub-standard & 100% for unsecured “doubtful” assets.
Doubtful Assets – 100% to the extent advance not covered by realizable value of security. In
case of secured portion, provision may be made in the range of 20% to 100% depending on the
period of asset remaining sub-standard
Loss Assets – 100% of the outstanding
Factors Contributing to NPA’S
The main factors contributing to non-performing assets are Poor Credit discipline, Inadequate
Credit & Risk Management, Diversion of funds by promoters, Funding of non-viable projects.
In the early 1990s PSBs started suffering from acute capital inadequacy and lower/ negative
profitability. The parameters set for their functioning did not project the paramount need for
these corporategoals.
The banks had little freedom to price products, cater products to chosen segments or invest
funds in their best interestNon-performing assets, also called non-performing loans, are loans,
made by a bank or finance company, on which repayments or interest payments are not being
made on time.A loan is an asset for a bank as the interest payments and the repayment of the
principal create a stream of cash flows. It is from the interest payments than a bank makes its
profits. Banks usually treat assets as non-performing if they are not serviced for some time. If
payments are late for a short time a loan is classified as past due. Once a payment becomes
really late (usually 90 days) the loan classified as non-performing. A high level of non-
performing assets compared to similar lenders may be a sign of problems, as may a sudden
increase. However this needs to be looked at in the context of the type of lending being done.
Some banks lend to higher risk customers than others and therefore tend to have a higher
proportion of non-performing debt, but will make up for this by charging borrowers higher
interest rates, increasing spreads. A mortgage lender will almost certainly have lower non-
performing assets than a credit card specialist, but the latter will have higher spreads and may

Asia Pacific Journal of Marketing & Management Review__________________________________________ ISSN 2319-2836 Vol.2 (1), January (2013) Online available at indianresearchjournals.com
53
well make a bigger profit on the same assets, even if it eventually has to write off the non-
performing loans. The asset quality of the banks can be examined by considering the NPAs.
These NPAs should be considered against not just total assets but also against the advances,
because the NPAs primarily arise. When NPAs arise, banks have to make provision for the
same as per the regulatory prescriptions. When the provisions are adjusted against the Gross
NPAs it gives rise to the net NPAs. Provisions reduce the risk exposure arising due to the NPAs
to a reasonable extent as they ensure that the banks sustain the possible loss arising from these
assets. The sharp rise in credit growth continued to be accompanied by a significant
improvement in asset quality. Several options available to banks for dealing with bad loans and
the improved industrial climate in the country helped in recovering a significant amount of
NPAs. Banks were specifically advised to ensure that recoveries of NPAs exceed Write-offs
while bringing down bad debts. An improved industrial climate contributed to a better recovery
position. The recourse to aggressive asset restructuring by banks in 2004-05 also helped in
reducing the level of NPAs.In the global context, the Indian banking system is among the best
in the world because Indian banks are favorable on growth, asset quality and profitability; RBI
and Government have made some notable changes in policies and regulation to help strengthen
the sector. These changes include strengthening prudential norms, enhancing the payments
system and integrating regulations of commercial banks. In terms of quality of assets and
capital adequacy, these banks have clean, strong and transparent balance sheets relative to other
banks in comparable economies in its region. Public and private sector banks need to strengthen
institutional skill levels especially in sales and marketing, service operations, risk management
and the overall organizational performance ethic & strengthen human capital. The best indicator
for the health of the banking industry in a country is its level of Non-performing assets (NPAs).
Reduced NPAs generally gives the impression that banks have strengthened their credit
appraisal processes over the years and growth in NPAs involves the necessity of provisions,
which bring down the overall profitability of banks. The Indian banking sector is facing a
serious problem of NPA. The magnitude of NPA is comparatively higher in public sectors
banks. To improve the efficiency and profitability of banks the NPA need to be reduced and
controlled.The efficiency of a bank is not always reflected only by the size of its balance sheet
but also the level of return on its assets. The NPAs do not generate interest income for banks
but at the same time banks are required to provide provisions for NPAs from their current
profits. The NPAs have destructive impact on the return on assets in the following ways. The
interest income of banks reduced it is to be accounted only on receipt basis. The current profits
of the banks are eroded because the providing of doubtful debts and writing it off as bad debts
and it limits the recycling funds. The capital adequacy ratio is disturbed and cost of capital will
go up. The economic value addition (EVA) by banks gets upset because EVA is equal to the net
operating profit minus cost of capital.
Asia Pacific Journal of Marketing & Management Review__________________________________________ ISSN 2319-2836 Vol.2 (1), January (2013) Online available at indianresearchjournals.com
54
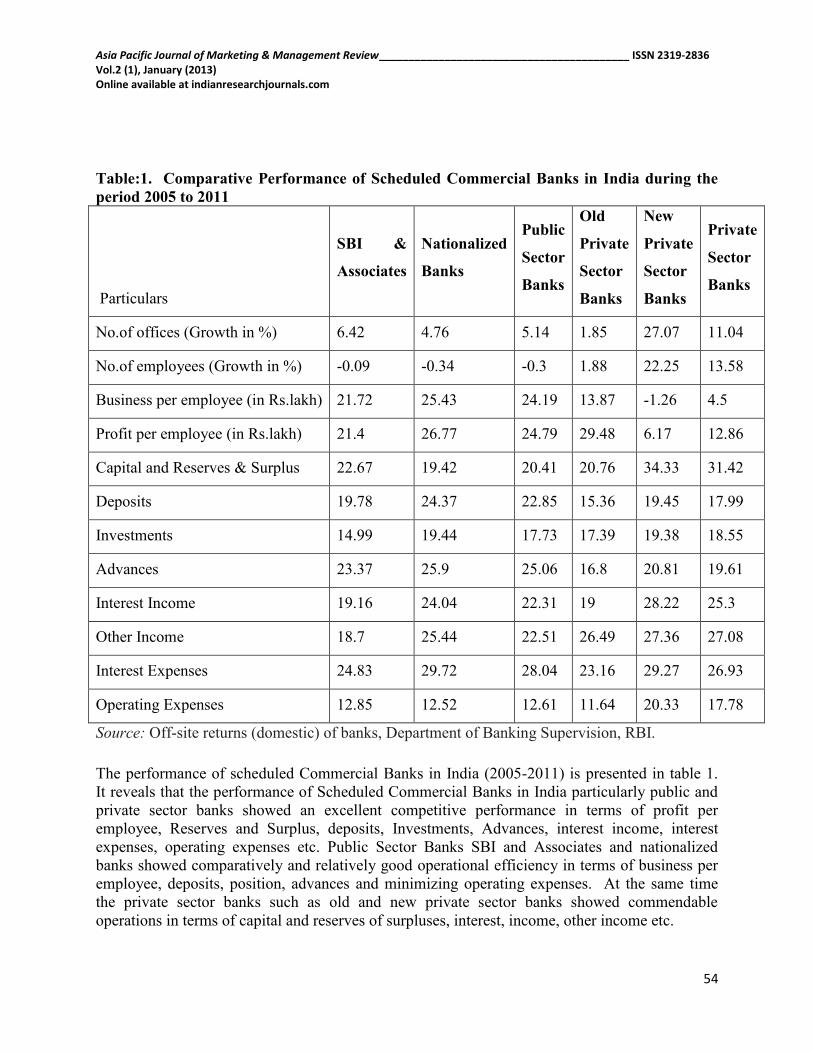
Table:1. Comparative Performance of Scheduled Commercial Banks in India during the
period 2005 to 2011
Particulars
SBI &
Associates
Nationalized
Banks
Public
Sector
Banks
Old
Private
Sector
Banks
New
Private
Sector
Banks
Private
Sector
Banks
No.of offices (Growth in %) 6.42 4.76 5.14 1.85 27.07 11.04
No.of employees (Growth in %) -0.09 -0.34 -0.3 1.88 22.25 13.58
Business per employee (in Rs.lakh) 21.72 25.43 24.19 13.87 -1.26 4.5
Profit per employee (in Rs.lakh) 21.4 26.77 24.79 29.48 6.17 12.86
Capital and Reserves & Surplus 22.67 19.42 20.41 20.76 34.33 31.42
Deposits 19.78 24.37 22.85 15.36 19.45 17.99
Investments 14.99 19.44 17.73 17.39 19.38 18.55
Advances 23.37 25.9 25.06 16.8 20.81 19.61
Interest Income 19.16 24.04 22.31 19 28.22 25.3
Other Income 18.7 25.44 22.51 26.49 27.36 27.08
Interest Expenses 24.83 29.72 28.04 23.16 29.27 26.93
Operating Expenses 12.85 12.52 12.61 11.64 20.33 17.78
Source: Off-site returns (domestic) of banks, Department of Banking Supervision, RBI.
The performance of scheduled Commercial Banks in India (2005-2011) is presented in table 1.
It reveals that the performance of Scheduled Commercial Banks in India particularly public and
private sector banks showed an excellent competitive performance in terms of profit per
employee, Reserves and Surplus, deposits, Investments, Advances, interest income, interest
expenses, operating expenses etc. Public Sector Banks SBI and Associates and nationalized
banks showed comparatively and relatively good operational efficiency in terms of business per
employee, deposits, position, advances and minimizing operating expenses. At the same time
the private sector banks such as old and new private sector banks showed commendable
operations in terms of capital and reserves of surpluses, interest, income, other income etc.
Asia Pacific Journal of Marketing & Management Review__________________________________________ ISSN 2319-2836 Vol.2 (1), January (2013) Online available at indianresearchjournals.com
55
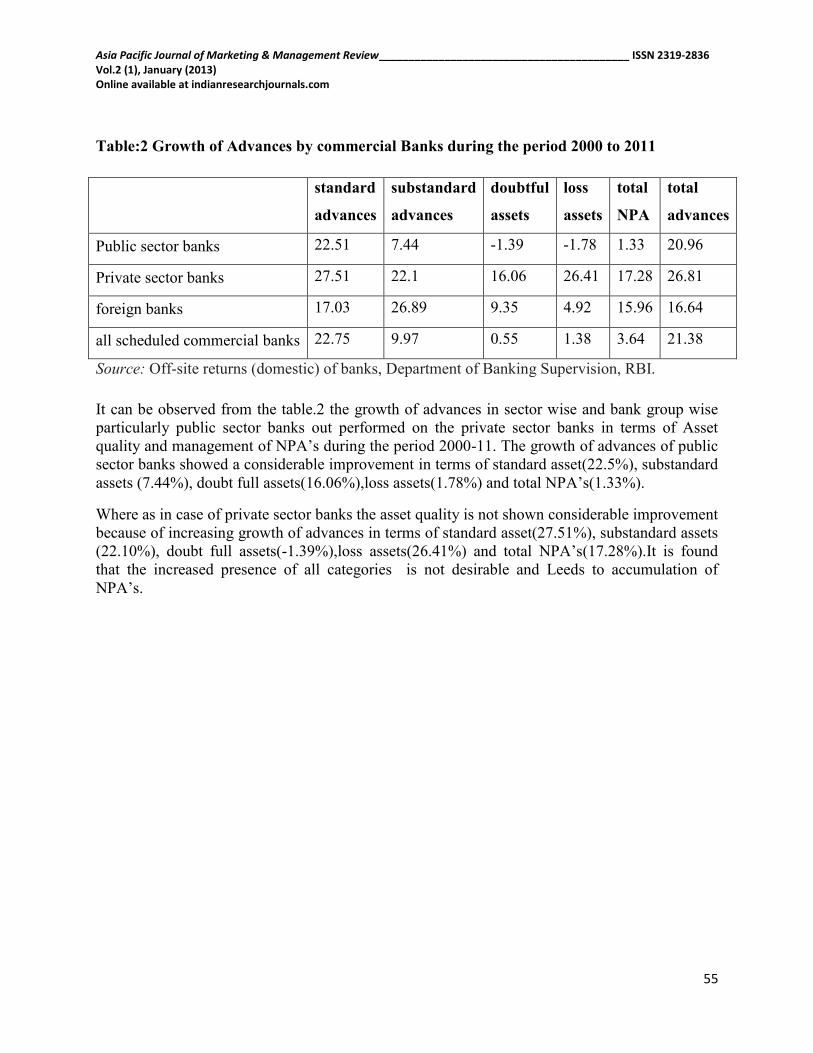
Table:2 Growth of Advances by commercial Banks during the period 2000 to 2011
standard
advances
substandard
advances
doubtful
assets
loss
assets
total
NPA
total
advances
Public sector banks 22.51 7.44 -1.39 -1.78 1.33 20.96
Private sector banks 27.51 22.1 16.06 26.41 17.28 26.81
foreign banks 17.03 26.89 9.35 4.92 15.96 16.64
all scheduled commercial banks 22.75 9.97 0.55 1.38 3.64 21.38
Source: Off-site returns (domestic) of banks, Department of Banking Supervision, RBI.
It can be observed from the table.2 the growth of advances in sector wise and bank group wise
particularly public sector banks out performed on the private sector banks in terms of Asset
quality and management of NPA‟s during the period 2000-11. The growth of advances of public
sector banks showed a considerable improvement in terms of standard asset(22.5%), substandard
assets (7.44%), doubt full assets(16.06%),loss assets(1.78%) and total NPA‟s(1.33%).
Where as in case of private sector banks the asset quality is not shown considerable improvement
because of increasing growth of advances in terms of standard asset(27.51%), substandard assets
(22.10%), doubt full assets(-1.39%),loss assets(26.41%) and total NPA‟s(17.28%).It is found
that the increased presence of all categories is not desirable and Leeds to accumulation of
NPA‟s.

Asia Pacific Journal of Marketing & Management Review__________________________________________ ISSN 2319-2836 Vol.2 (1), January (2013) Online available at indianresearchjournals.com
56
Table:.3 Gross and net NPAs of Commercial banks in India during the period 2000 to
2011
Public sector Banks Private sector
Banks Public sector Banks
Private sector
Banks
Years Gross NPAs(Rs
in Crores)
% of
Gross
NPAs to
gross
advance
Gross
NPAs(Rs
in crores)
% of
Gross
NPAs to
Gross
advances
Net
NPAs(Rs
in crores)
% of Net
NPAs to
net
advances
Net
NPAs
(Rs in
Crore)
% of Net
NPAs to
Net
advance)
2000 52,241 14 4761 8.17 26,107 7.42 3031 5.41
2001 54,672 12.4 5933 8.32 27,977 6.7 3700 2.27
2002 56,473 11.1 11662 9.64 27,958 5.8 6676 2.49
2003 54,089 9.4 11082 8.07 24,868 4.5 3913 2.32
2004 51,541 7.8 10381 5.8 18,860 3 4128 1.32
2005 46,596 5.4 8782 3.9 16,983 2.06 4212 1.85
2006 41,379 3.9 7811 2.6 14,560 1.7 3171 1.09
2007 38,602 2.8 9256 2.4 15,145 1.1 4028 0.97
2008 39,749 2.3 12997 2.7 17,836 0.8 5647 1.2
2009 44,039 2.1 16983 3.2 21,033 0.9 7418 1.29
2010 59,927 2.27 17638 2.97 29,644 1.1 6506 1.03
2011 73,481 2.22 18243 2.28 36,074 1.09 4574 0.57
Source: Off-site returns (domestic) of banks, Department of Banking Supervision, RBI.
Gross and net NPA‟s of Public and Private Sector Banks during the period (2000-2011) is
presented in Table 3, it reveals that both public and private sector banks showed a significant
improvement in respect of minimizing gross and net NPA‟s to gross Advances of Public Sector
Banks during the period 2000-2011.
The Gross NPA‟s to gross Advances, Public Sector Banks during the period 2000-2011 varies
from 14% to 2.2% where as private sector banks varied form 8-17% to 2.28%. In fact both the
banks relatively improved the performance. At the same time percentage of net NPA‟s to net
advances of Public Sector ranged from 7.42% to 1.09% and private sector banks 5.41% to 0.57%
during the period 2000-2011. Therefore this study analyzed and found that both public and
Asia Pacific Journal of Marketing & Management Review__________________________________________ ISSN 2319-2836 Vol.2 (1), January (2013) Online available at indianresearchjournals.com
57
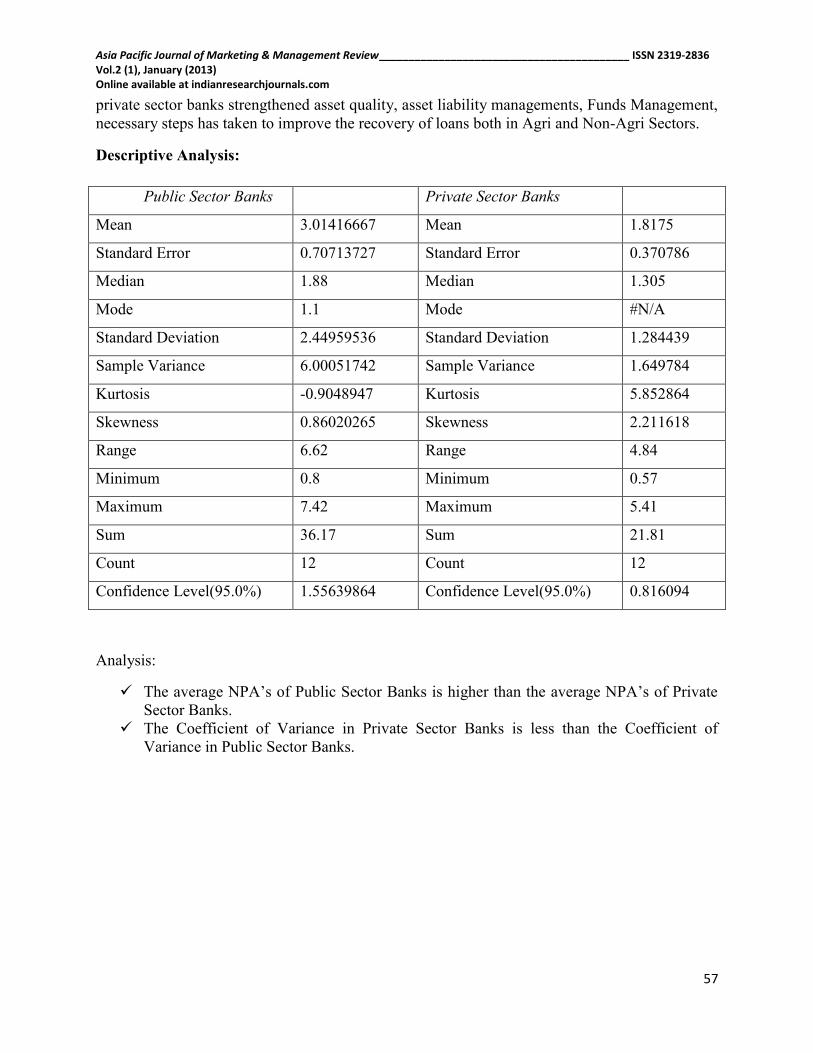
private sector banks strengthened asset quality, asset liability managements, Funds Management,
necessary steps has taken to improve the recovery of loans both in Agri and Non-Agri Sectors.
Descriptive Analysis:
Public Sector Banks Private Sector Banks
Mean 3.01416667 Mean 1.8175
Standard Error 0.70713727 Standard Error 0.370786
Median 1.88 Median 1.305
Mode 1.1 Mode #N/A
Standard Deviation 2.44959536 Standard Deviation 1.284439
Sample Variance 6.00051742 Sample Variance 1.649784
Kurtosis -0.9048947 Kurtosis 5.852864
Skewness 0.86020265 Skewness 2.211618
Range 6.62 Range 4.84
Minimum 0.8 Minimum 0.57
Maximum 7.42 Maximum 5.41
Sum 36.17 Sum 21.81
Count 12 Count 12
Confidence Level(95.0%) 1.55639864 Confidence Level(95.0%) 0.816094
Analysis:
The average NPA‟s of Public Sector Banks is higher than the average NPA‟s of Private
Sector Banks.
The Coefficient of Variance in Private Sector Banks is less than the Coefficient of
Variance in Public Sector Banks.

Asia Pacific Journal of Marketing & Management Review__________________________________________ ISSN 2319-2836 Vol.2 (1), January (2013) Online available at indianresearchjournals.com
58
t-Test: Two-Sample Assuming Unequal Variances:
Particulars Public Sector Private sector
Mean 23087.08 4750.333
Variance 44935534 2108700
Observations 12 12
Hypothesized Mean Difference 0
df 12
t Stat 9.261041
P(T<=t) one-tail 4.08E-07
t Critical one-tail 1.782288
P(T<=t) two-tail 8.16E-07
t Critical two-tail 2.178813
Analysis: The calculated value of„t‟ is > tabulated value reveals that the average NPAs in public
and private sector banks are not homogenous.
Correlation:
particulars Public sector Private sector
Public Sector 1
Private sector 0.839659 1
Analysis:-The correlation between the public and private sector is nearly a positive sign (+1), it
is indicating a high correlation between them.

Asia Pacific Journal of Marketing & Management Review__________________________________________ ISSN 2319-2836 Vol.2 (1), January (2013) Online available at indianresearchjournals.com
59
Table:4 Classification of Advance of Public and Private sector banks
year
Public Sector Banks Private Sector Banks
standard
advances
substan
dard
advance
s
doubtfu
l assets
loss
assets
standard
advance
s
substandar
d advances
doubtfu
l assets
loss
assets
2001 18.54 -9.88 9.66 2.28 22.05 20.96 30.32 -3.42
2002 16.91 7.07 0.52 7.9 67.84 83.29 113.07 -8.02
2003 15.65 -5.57 -3.92 -3.13 20.51 -21.84 30.17 186.67
2004 16.56 13.41 -11.08 -14.09 26.94 -15.55 -24.92 -26.21
2005 26.21 -34.45 5.08 -6.16 32.74 -27.41 -11.27 10.3
2006 33.63 2.8 -17.92 -6.06 33.47 5.56 -21.75 3.25
2007 29.69 24.16 -19.59 -12.93 29.26 82.3 -11.44 0.17
2008 24.07 19.24 -3.9 -17.7 20.06 66.67 13.28 32.15
2009 24.34 15.72 8.08 2.45 9.45 44.58 12.69 8.12
2010 19.53 41.83 19.17 29.6 12.82 -17.57 30.4 61.05
Source: Off-site returns (domestic) of banks, Department of Banking Supervision, RBI.
The detailed analysis of classification of advances of public and private sector banks during the
period 2001-2010 presented in table 4.The performance of public sector banks in respect of asset
quality in terms of standard assets, substandard assets, doubtful assets and loss assets showed a
considerable improvement in terms of growth rate of classification of advances during the period
2001-2010. The absolute growth rate of classification of advances of public sector banks
standard assets ranged from 18.54% in 2001 to 19.53% in 2010, substandard assets 9.88% to
41.83%, doubt full assets 9.66% to 19.17% and loss assets 2.28% to 29.60%. It is found that
there is a lot of fluctuations happened during the period due to cyclical changes in agri and non-
agri lending and recovery problems. The performance of private sector banks is also evidenced
lot of fluctuations in terms of standard, substandard, doubtful and loss assets.

Asia Pacific Journal of Marketing & Management Review__________________________________________ ISSN 2319-2836 Vol.2 (1), January (2013) Online available at indianresearchjournals.com
60
Table:.5 Growth rate of Net NPA’s in Commercial Banks during the period 2001 to 2011
year
Rate of Growth of Net NPA
SBI and
associates
Nationalized
banks
public
sector
banks
foreign
banks
other
scheduled
commercial
banks
all
scheduled
commercial
banks
2001 8.03 5.7 13.73 0.16 17 7.32
2002 -5.15 1.79 -3.36 17.71 16.69 1.62
2003 -13.08 -6.88 -19.95 2.01 62 -0.25
2004 -23.46 -27.63 -51.09 -6.6 -34.16 -27.26
2005 6.64 -14.73 -8.09 -23.71 1.62 -6.73
2006 -4.57 -19.43 -24 24 -29.11 -15.59
2007 4.73 5.57 10.3 13.56 37.01 10.63
2008 32.06 4.04 36.09 36.45 35.56 20.51
2009 29.43 10.28 39.7 140.39 37.76 29.61
2010 18.05 63.46 81.51 -0.7 -12.22 23.96
2011 5.27 2.22 7.48 20.33 13.22 4.38
Source: Off-site returns (domestic) of banks, Department of Banking Supervision, RBI.
Table 5 represents the prime performance indicator of public and private sector banks in terms of
rate of growth of net NPA‟s during the period 2001-2010. It reveals that the increased trend after
2007 due to the various economic fluctuations and also the impact of global meltdown, In spite
of the global crisis and it‟s impact on Indian economy even though public and private sector
banks had taken a prudent banking practices to with stand in the competitive market conditions
and reducing the growth of net NPA‟s.
Findings
1. Business for employee is higher side in public Sector Banks in compared to private sector
banks.
2. Profit per employee high in public sector.
3. Capital and reserves of surplus is high in private sector banks.

Asia Pacific Journal of Marketing & Management Review__________________________________________ ISSN 2319-2836 Vol.2 (1), January (2013) Online available at indianresearchjournals.com
61
4. Deposits are higher in public sector banks.
5. Investments in public and private sectors and equally good.
6. Advances are high in public sector.
7. Interest income higher in private sector banks.
8. Other income higher in private sector.
9. Interest expansions both are equally good.
10. Operating experience higher in private sector.
References
1. Actions taken by the RBI to tackle the accumulation of NPAs, [Online] Available at:
http://www.mbaknol.com/business-finance/actions-taken-by-rbi-to-tackle-the-accumulation-of-
non-performing-assets-npas-in-banks/ [Accessed 28 August 2011].
2. Anurag, 2007. Causes for Non Performing Assets in Public Sector Banks, [Online] Available
at: http://www.123eng.com/forum/viewtopic.php?p=14590. [Accessed 13 March, 2011].
3. Bank reform and the rural sector, C. P. Chandrasekhar, Jayati Gosh, Date: 06/01/2004,
Business line Financial Daily from THE HINDU group of publications. Sunanda Sen, 2008.
Basel norms and Banks Restructuring, [Online] (Updated April 08, 2008) Available at:
http://www.hindu.com/2005/04/08/stories/2005040802331000.htm [Accessed 28 February
2011].
4. Benson Kunjukunju, 2008. Commercial Banks in India: Growth, Challenges and Strategies,
New Century Publications, New Delhi.
JBFSIR Volume 1, Issue 9 (December, 2011) ISSN 2231-4288 Sri Krishna International
Research & Educational Consortium http://www.skirec.com - 84 –
5. G.V.K. Kasthuri, 2009. Basel Norms for Indian Banks, [Online] Available at:
http://gvkk.blogspot.com/ [Accessed 27 July, 2011].
6. Jigar J. Soni, 2009. A Project on Comparative Analysis On Non Performing Assets Of Private
and Public Sector Banks, IBM Ahemadabad.