Sustainability for reef fish resource based on ... · habitat greatly affects fish stocks such as...
14
AACL Bioflux, 2017, Volume 10, Issue 4. http://www.bioflux.com.ro/aacl 861 Sustainability for reef fish resource based on productivity and susceptibility in Wangi-Wangi Island, Southeast Sulawesi, Indonesia 1,2 Mercy Patanda, 1 Sugeng H. Wisudo, 1 Daniel R. Monintja, 1 Budy Wiryawan 1 Faculty of Fisheries and Marine Sciences, Bogor Agricultural University, Kampus IPB Dramaga, Bogor, Indonesia; 2 Faculty of Fisheries and Marine Sciences, Satya Negara Indonesia University, Jakarta, Indonesia. Corresponding author: M. Patanda, [email protected] Abstract. The trend of the fishing activity for the coral fish has increased annually in Wakatobi Island. Yet, data concerning the coral fish species are lacking. The data were needed to support management of the coral fisheries in Wakatobi waters. One of the methods to understand the status of coral fish stock in the poor data condition is by using the Spawning Potential Ratio (SPR) and Productivity and Susceptibility Analysis (PSA). PSA is a fish stock assesement method which allows all units within any of ecological components to be efectively and comprehensively screened for risk to human impact. The result of the research showed that thumbprint emperor (Lethrinus harak), humpback red snapper (Lutjanus gibbus), highfin coralgrouper (Plectropomus oligacanthus) and squaretail coralgrouper (Plectropomus areolatus) were heavily exploited. There should be regulations in the size of fish caught, the number of fishing fleet and the implementation of marine conservation in order to increase the effectiviness of the coral fisheries management. Key Words: reef fish, susceptibility, Lethrinus harak, Lutjanus gibbus, Plectropomus oligacanthus, Plectropomus areolatus. Introduction. Coral reef fishes are the target species in Wangi-Wangi Island. Generally, coral reef fishes which are targeted by fishermen are coral reef fish for consumption. Continuous fishing attempts toward these fish can affect the stock in Wangi-Wangi Island. This condition can be seen from interviews with coral reef fish fishermen who stated that the quantity of fish caught is less and the size is smaller compared to 5 years ago. Suruwaky & Gunaisah (2013) states that one of the indication of over-exploitation or overfishing is that the fish resources have begun to be depleted where large fish with normal size is rarely found and small fish has become a fishing target. The number of fishing fleets and fishing gear in Wakatobi District are increasing from year to year. Based on data from the Marine and Fisheries Department (2015), the amount of fishing fleet in 2011 were amounted of 1711 and increasing to 3430 in 2015, which means that fishing activity in Wakatobi District is rapidly increasing. This fishing activity will affect to the availability of fish resources in the waters of Wakatobi District as there is no limitation toward the quantity of fishing activity in these area. In addition, fishing activities which are not environmentally friendly such as bomb fishing, cyanide fishing, and fishing by using compressor still exist in this area. As Cliftton (2013) points out that the annual total number of cases display little consistent trend, with bomb fishing being the most common category of offenses. The economic drivers for bomb fishing are localized in that this method represents a means of increasing fishing efficiency, particularly where the other techniques of low ends returns as stocks are over- exploited. Similarly, the results of coral reef fishing using cyanide are found in the international market according to the findings of Clifton (2013) where cyanide fishing is connected to the live coral reef fish and ornamental fish trade, the demand for which is centered in Hong Kong, China, Taiwan, Singapore and Japan. Unsustainable fishing
Transcript of Sustainability for reef fish resource based on ... · habitat greatly affects fish stocks such as...
AACL Bioflux, 2017, Volume 10, Issue 4. http://www.bioflux.com.ro/aacl 861
Sustainability for reef fish resource based on productivity and susceptibility in Wangi-Wangi Island, Southeast Sulawesi, Indonesia 1,2Mercy Patanda, 1Sugeng H. Wisudo, 1Daniel R. Monintja, 1Budy Wiryawan
1 Faculty of Fisheries and Marine Sciences, Bogor Agricultural University, Kampus IPB Dramaga, Bogor, Indonesia; 2 Faculty of Fisheries and Marine Sciences, Satya Negara
Indonesia University, Jakarta, Indonesia. Corresponding author: M. Patanda, [email protected]
Abstract. The trend of the fishing activity for the coral fish has increased annually in Wakatobi Island. Yet, data concerning the coral fish species are lacking. The data were needed to support management of the coral fisheries in Wakatobi waters. One of the methods to understand the status of coral fish stock in the poor data condition is by using the Spawning Potential Ratio (SPR) and Productivity and Susceptibility Analysis (PSA). PSA is a fish stock assesement method which allows all units within any of ecological components to be efectively and comprehensively screened for risk to human impact. The result of the research showed that thumbprint emperor (Lethrinus harak), humpback red snapper (Lutjanus gibbus), highfin coralgrouper (Plectropomus oligacanthus) and squaretail coralgrouper (Plectropomus areolatus) were heavily exploited. There should be regulations in the size of fish caught, the number of fishing fleet and the implementation of marine conservation in order to increase the effectiviness of the coral fisheries management. Key Words: reef fish, susceptibility, Lethrinus harak, Lutjanus gibbus, Plectropomus oligacanthus, Plectropomus areolatus.
Introduction. Coral reef fishes are the target species in Wangi-Wangi Island. Generally, coral reef fishes which are targeted by fishermen are coral reef fish for consumption. Continuous fishing attempts toward these fish can affect the stock in Wangi-Wangi Island. This condition can be seen from interviews with coral reef fish fishermen who stated that the quantity of fish caught is less and the size is smaller compared to 5 years ago. Suruwaky & Gunaisah (2013) states that one of the indication of over-exploitation or overfishing is that the fish resources have begun to be depleted where large fish with normal size is rarely found and small fish has become a fishing target.
The number of fishing fleets and fishing gear in Wakatobi District are increasing from year to year. Based on data from the Marine and Fisheries Department (2015), the amount of fishing fleet in 2011 were amounted of 1711 and increasing to 3430 in 2015, which means that fishing activity in Wakatobi District is rapidly increasing. This fishing activity will affect to the availability of fish resources in the waters of Wakatobi District as there is no limitation toward the quantity of fishing activity in these area. In addition, fishing activities which are not environmentally friendly such as bomb fishing, cyanide fishing, and fishing by using compressor still exist in this area. As Cliftton (2013) points out that the annual total number of cases display little consistent trend, with bomb fishing being the most common category of offenses. The economic drivers for bomb fishing are localized in that this method represents a means of increasing fishing efficiency, particularly where the other techniques of low ends returns as stocks are over-exploited. Similarly, the results of coral reef fishing using cyanide are found in the international market according to the findings of Clifton (2013) where cyanide fishing is connected to the live coral reef fish and ornamental fish trade, the demand for which is centered in Hong Kong, China, Taiwan, Singapore and Japan. Unsustainable fishing

AACL Bioflux, 2017, Volume 10, Issue 4. http://www.bioflux.com.ro/aacl 862
activities, in addition to affecting coral reef fish resources, also affect the habitat. Fish habitat greatly affects fish stocks such as habitat where spawning area are damaged will affect to the availability of fish eggs and may affect the breeding of fish and even affect the coral reef fish feeding site. This may affect fish stocks and occurring susceptibility of coral reef fish for consumption. Based on these issues, information that provides an overview of the condition of coral fish susceptibility in the waters of Wakatobi District is needed.
Information related to fish susceptibility conditions are very useful due to limited data, especially data of coral reef fish in Wangi-Wangi Island. This information is needed to get the description of fish stocks condition in Wangi-Wangi Island waters. Based on this information, government and even non government authorities could determine the next fisheries management for Wangi-Wangi Island and give an overview to fishermen in Wangi-Wangi Island to be more vigilant in maintaining fish resources and the environment. In order to obtain the information, a research using Productivity and Susceptibility Analysis (PSA) and spawning potential ratio (SPR) was performed. PSA and SPR analysis can provide the description related to fish susceptibility even in areas with limited data. According to McCully Phillips et al (2015), the level to which PSAs may feed into management measures varies, but as a minimum they can help identifying the most vulnerable species within a fishery. The purpose of this research is to know productivity and susceptibility and to know Length at first capture (Lc) and Length at first maturity (Lm) from coral reef fish at Wangi-Wangi Island, Wakatobi District.
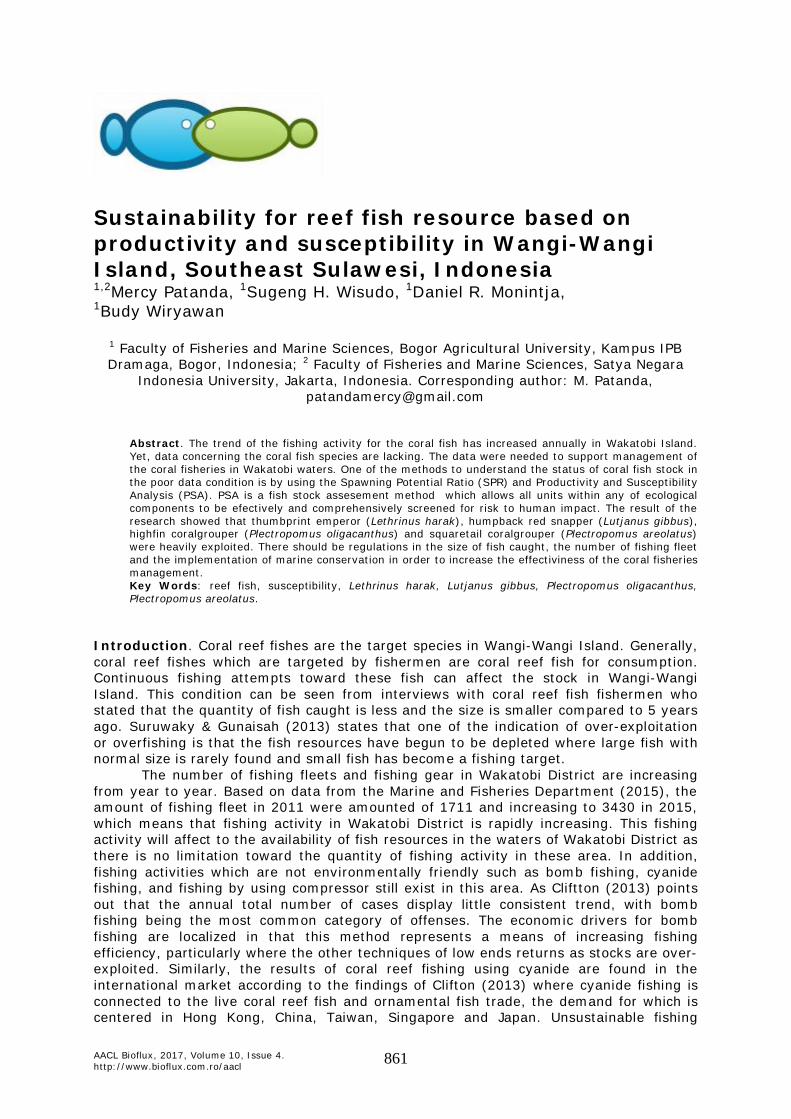
Material and Method Time of research. The research was conducted on May 2015 to May 2016. During this research, 4 types of coral reef fishes (Lethrinus harak, Lutjanus gibbus, Plectropomus oligacanthus and Plectropomus areolatus) were measured to get length and weight data measurement, gastric content collection, gastric content analysis and tropic level, fish eggs calculation. In addition, questionnaires distribution containing susceptibility attributes and data analysis were also carried out. Research location. The research was conducted in Wangi-Wangi Island, Wakatobi District, Indonesia (Figure 1). This island was selected due to its status as conservation area and has coral reef fish resources so that the success of conservation area management will affect the population of coral reef fish in this area.
Figure 1. Research location.

AACL Bioflux, 2017, Volume 10, Issue 4. http://www.bioflux.com.ro/aacl 863
Data collecting method. The data collected in this research consists of primary and secondary data. The data which can be used to determine the condition of coral reef fish are very limited, therefore, the measurement of fish length were performed. Fish length data were used for spawning potential ratio analysis. Fish length measurement is relatively easy to perform and the data can be used to estimate stock of coral reef fisheries, to estimate biological parameters and to understand fish population dynamics (Hordyk et al 2014). Research data for productivity and susceptibility analysis consists of productivity attribute and susceptibility attribute (Table 1). Productivity attributes are maximum size, growth coefficient, measured fecundity, recruitment pattern and tropic level. Susceptibility are stratify management, areal overlap, geographic concentration, vertical overlap, fishing rate relative to M (M/F) (whereas M is natural mortality and F is fishing mortality), morphology affecting capture, survival after capture and release, desirability/value of the fishery and fishery impact to essential fish habitat (EFH) or habitat in general for non targets. Primary data were collected through survey activity in the form of sample measurement such as length and weight of fish, fish eggs calculation and fish gastric content analysis, while susceptibility attribute data were obtained by interviews using questionnaire. Interviews were conducted with 7 respondents, namely 2 from Marine and Fisheries Department (DKP), 2 from Ministry of Marine Affairs and Fisheries (KKP) of Wakatobi District, 1 from Wakatobi National Park (BTNW), 1 from Wakatobi WWF Coordinator and 1 from Lepa Mola Wakatobi. Secondary data were collected from various published literatures such as Research Reports, local government, DKP.
Table 1 PSA attributes used in this analysis
Productivity attributs Source database Output Measured fecundity Fish eggs The number of fish egg
Maximum size Fish base SPR Recruitment pattern Primary data Strategy
Growth coefficient (k) Length measurment SPR Trophic level Gastric content The level of food chain
Susceptibility attributes Source database Output Management strategy Primary data Distribution
Areal overlap Primary data Distribution Vertical overlap Primary data Distribution
Geographic concentration Primary data Distribution Fishing rate relative to M Length measurment SPR
Morphology affecting capture Primary data Fish morphology Survival after capture and release Primary data Fish morphology Desirability/value of the fishery Primary data The price of fish
Fishery impact to essential fish habitat (EFH) or habitat in general for non targets
Primary data Enviromental conditions
Data analysis Productivity and susceptibility analysis (PSA). The productivity and susceptibility analysis (PSA) begins by filling the database in a worksheet of productivity and susceptibility analysis derived from National Oceanic Atmospheric Administration (NOAA). PSA consists of two attributes namely productivity attributes and susceptibility attributes according to Table 2 and Table 3.

AACL Bioflux, 2017, Volume 10, Issue 4. http://www.bioflux.com.ro/aacl 864
Table 2 PSA scoring attributes used in this analysis
Productivity attributes
Attributes High (3) Moderate (2) Low (1) Maximum size < 60 cm 60-150 cm > 150 cm
Growth coefficien (k) > 0.25 0.15-0.25 < 0.15 Measure fecundity > 10e4 10e2-10e3 < 10e2
Recruitment pattern Highly frequent recruitment
success(> 75% of year classes are
succesful)
Moderately frequent recruitment success (between 10% and 75% of year classes
are successful)
Infrequent recruitment success (< 10% of year classes are
successful)
Mean trophic level < 2.5 2.5-3.5 > 3.5 Susceptibility attributes
Attributes Low (1) Moderate (2) High (3) Management strategy Targeted stocks
have catch limits and proactive accountability
measures; non-target stocks are closely monitored
Targeted stocks have catch limits and
reactive accoutability measures
Targetes stocks do not have catch limits or
accontability measures; non-target stocks are not closely
monitored
Areal overlap < 25% of stocks occurs in the area
fished
Between 25% and 50% of the stock occurs in the area
fished
50% of stock occurs in the area fished
Geographic concentration Stock in distrivuted in
> 50% of its total range
Stock is distributed in 25% to 50% its total
Stock is distributed in < 25% of its total
range
Vertical overlap < 25% of stocks occurs in the depths fished
Between 25% and 50% of the stock occurs in the area
fished
Stock is distributed in < 25% of its total
range
Fishing rate relative to M < 0.5 0.5-1.0 > 1 Morphology ffecting
capture Species shows
low selectivity to the fishing gear
Species shows moderate selectivity to the fishing gear
Species shows high selectivity to the
fishing gear Survival after capture and
release Probability of
survival > 67% 33% < probability of
survival, 67% Probability of survival
< 33% Desirability/value of the
fishery
Stock is not highly valued or
desire by the fishery
Stock is moderately valued or desired by
the
Stock is highly valued or desire by the fishery
Fishery impact to essential fish habitat (EFH) or habitat in general for
non-targets
Adverse effects absent minimal or
temporary
Adverse effects more than minimal or
temporary but are mitigated
Adverse effects more than minimal or
temporary and are not mitigated
Parameters of productivity and susceptibility were then weighed with assessment criteria consisting of weighing value, score attributes and quality of data (Table 3).

AACL Bioflux, 2017, Volume 10, Issue 4. http://www.bioflux.com.ro/aacl 865
Table 3 Assessment criteria
Weighing value Weighing value shows the importance of each parameter. This
value is quite subjective and obtained through the researcher's assessment toward which parameters are most
important. The value ranges from 0-4: 0 = not important; 1 = less important;
2 = important; 3 = more important; 4 = very important
Score attribute Divided by two parameters: productivity and susceptibility. The value of each parameter ranges from 1-3:
Productivity: 1 = high;
2 = moderate; 3 = low.
Susceptibility: 1 = low;
2 = moderate; 3 = high
Quality of data Quality of data ranges between 1-5: 1 = data is hugely available and complete; 2 = limited data (temporary and spatially);
3 = data from the same genus/family; 4 = data is in the form of unpublished information;
5 = data is not available
Data were analyzed using PSA to determine susceptibility status due to fishing activity, namely: (1) Productivity and susceptibility: V = √(p-3)2 + (s – 1)2 where: V = vulnerability index; p = productivity; s = susceptibility. (2) Spawning Potential Ratio analysis (SPR): SPR is the proportion of spawning fish that are not caught in fishing policy (Walters & Martell 2004). In other words, the SPR compares the spawning capability (or reproductive capacity) of the stock in a condition of already exploited with the stock of spawning capability (or reproduction capacity) in unexploited conditions. In general, the general formula of the SPR is as follows: spawning stock biomass per recruit (fished) SPR = spawning stock biomass per recruit (unfished) Results and Discussion. Some of coral reef fish demanded by consumers and targeted by fishermen are black spot emperor (L. harak) (Figure 2a), humpback red snapper (L. gibbus) (Figure 2b), highfin coralgrouper (P. oligacanthus) (Figure 2c) and squaretail coralgrouper (P. areolatus) (Figure 2d).

AACL Bioflux, 2017, Volume 10, Issue 4. http://www.bioflux.com.ro/aacl 866
a b
c d
Figure 2. Coral black spot emperor (Lethrinus harak) (a); humpback red snapper (Lutjanus gibbus) (b); highfin coralgrouper (Plectropomus oligacanthus) (c); and
squaretail coralgrouper (Plectropomus areolatus) (d).
PSA is a semi-quantitative analysis that depends on productivity and susceptibility characteristics. This analysis is used to evaluate susceptibility for each fish stock in order to establish annual capture limits. However, it only measures potential vulnerability (risks) rather than real impacts. Meanwhile, to calculate direct impacts appropriately requires data related to fish abundance, demographics and spatial structures, the comparative value of life and death of fish, habitat or community (Micheli et al 2014). Productivity attributes of coral reef fishes in Wangi-Wangi Island is presented in Table 4, while susceptibility attributes is presented in Table 5.
Table 4
Productivity attributes of coral reef fish for consumption caught on Wangi-Wangi Island
No Characteristics Lethrinus harak
Lutjanus gibbus
Plectropomus oligacanthus
Plectropomus areolatus
1 Maximum size 50 cm 50 cm 75 cm 80 cm 2 Growth coefficient (k) 0.1 0.16 0.4 0.4 3 Measured fecundity 28.252-
7.726.156 27.726-65.982
26.201- 958.063
613.679-2.2207.654
4 Recruitment pattern Infrequent recruitment success (<
10% of year classes are successful)
Infrequent recruitment success (<
10% of year classes are successful)
Infrequent recruitment success (<
10% of year classes are successful)
Infrequent recruitment success (<
10% of year classes are successful)
5 Trophic level 2.78 3.7 3.56 3.03

AACL Bioflux, 2017, Volume 10, Issue 4. http://www.bioflux.com.ro/aacl 867
Table 5 Susceptibility attributes of coral reef fish for consumption caught on Wangi-Wangi Island No Attributes Charasteristic 1 Management strategy Targeted stock do not have catch limits or accontability
measures; non-target stocks are not closely monitored 2 Areal overlap > 50% of stock occurs in the area fished 3 Geographic concentration > stock is distributed in > 50% of its total range 4 Vertical overlap > 50% of stock occurs in the depths fished 5 Fishing rate relative to M > 1 6 Morphology affecting capture Species shows high selectivity to the fishing gear 7 Survival after capture and release Probability of survival < 33% 8 Desirability/value of the fishery Stock is highly valued or desired by the fishery 9 Fishery impact to essential
fish habitat (EFH) or habitat in general for non-targets
Adverse effects more than minimal or temporary and are not mitigated
SPR analysis was carried out by using assessment which is web-based in www.barefootecologyst.com. This analysis provides an overview of the length distribution of fish, Lc and Lm of fish and the condition of coral reef fish in Wangi-Wangi Island waters. The results of total productivity and susceptibility value based on PSA analysis and vulnerability index are shown in Table 6 which describes the condition of coral reef fish at Wangi-Wangi Island.
Table 6 Productivity and susceptibility value based on PSA analysis as well as vulnerability index
No Value/Index Lethrinus harak
Lutjanus gibbus
Plectropomus oligacanthus
Plectropomus areolatus
1 Productivity value 1.8 1.8 1.8 2 2 Susceptibility value 2.78 2.78 2.78 2.78 3 Vulnerability index 2.14 2.14 2.14 2.04
Based on Table 6, susceptibility value for 4 coral reef species are > 2 (2.78) which indicates that the risk caused by fishing activity is high. Triharyuni et al (2015) states that if the results of susceptibility value showed an average value of > 2, then this value means that the risk of fishing activity is high. The vulnerability index for all 4 species of coral reef fish are > 1.8 which means that all of these species are indicated to be overfishing. This condition has been reflected in Ministerial Decree No 45 year 2011 which estimated that demersal fish resources in Fisheries management area (WPP 714) have been fully exploited. This condition is caused due to high demand for coral reef fish and for export commodities and also caused by the characteristics of their life cycle which has slow growth, slow maturation and spawning aggregations. Many coral reef fish species are vulnerable to overexploitation due to the growth of the spawning aggregations at predictable sites and times (Robinson et al 2011) of fishing fleet in one fishing management area causing the increasing number of fishing fleets from year to year. Local government only gives permission toward fishing fleet operations. In addition, the demand for coral reef fish is increasing from year to year, especially from abroad such as Hongkong, causing small fish/juveniles being caught without considering to their size. The result of PSA analysis for L. harak, L. gibbus, P. oligacanthus and P. areolatus are presented in Figure 3.

AACL Bioflux, 2017, Volume 10, Issue 4. http://www.bioflux.com.ro/aacl 868
Figure 3. Results of productivity and susceptibility analysis (PSA) (1, 2, 3, 4 indicating fish species
and number 3 is overlapped with no 2 due to the same value).
Figure 3 is a plot of PSA analysis. Red nodes show low data quality due to not all attributes are included in the data analysis. The numbers of 1-4 represent the fish species (number 1 for L. harak, 2 for L. gibbus, 3 for P. oligacanthus and 4 for P. areolatus) while the blue, green, and purple line represent the boundary of a combination of vulnerabilities (Triharyuni et al 2015). High productivity and susceptibility value in Figure 3 shows that there is a risk for coral reef fishery. Stobutzki et al (2002) states that fish with the highest value on both productivity and susceptibility have low sustainability.
In addition to PSA analysis, SPR analysis was performed to find out the condition of coral reef fisheries in Wangi-Wangi Island. SPR analysis was performed to assess the sustainability of each stock in relation to fish mortality rate (Stewart et al 2015). The results of this analysis (Table 7) showed that SPR value for L. harak, L. gibbus, P. oligacanthus and P. areolatus are below 40%, which means that these species are in overfishing conditions (Prince 2014).
Table 7
The value of SPR, standard length at 50% population of mature fish (SL50), standard length at 95% population of mature fish (SL95) and fishing rate relative to mortality (F/M)
No Fish Name SPR(%) SL50 SL95 F/M 1 Lethrinus harak 13 17.74 20.3 2.09 2 Lutjanus gibbus 19 18.48 19.2 1.9 3 Plectropomus oligacanthus 11 32.52 52.39 1.58 4 Plectropomus areolatus 24 31.84 52.1 1.14
Based on the results of PSA analysis, we can see the distribution values of L. harak, L. gibbus, P. oligacanthus and P. areolatus caught during the research (Figure 4). For L. harak and L. gibbus, most of the fish caught have a total length of 20 cm, while for P. oligacanthus and P. areolatus, most of the fish caught have a total length of 40 cm.

AACL Bioflux, 2017, Volume 10, Issue 4. http://www.bioflux.com.ro/aacl 869
a) Lethrinus harak b) Lutjanus gibbus
c) Plectropomus oligacanthus d) Plectropomus areolatus
Figure 4. Length distribution diagram of; a) Lethrinus harak; b) Lutjanus gibbus; c) Plectropomus oligacanthus and; d) Plectropomus areolatus.
Figure 5 shows the comparison of length at first capture (Lc) and length at first maturity (Lm) of L. harak (Figure 5a), L. gibbus (Figure 5b), P. oligacanthus (Figure 5c) and P. areolatus (Figure 5d). All figures show trends in which Lc < Lm, which means that the caught fishes are still immature. According to Noija et al (2014), when the value of Lc < Lm, then this means that generally the caught fishes are still in juvenile state/immature. The value of F/M from the analysis shows that L. harak, L. gibbus, Plectropomus oligacanthus and P. areolatus have F/M values of > 1 which means that the number of fishing mortality is higher than natural mortality due to fishing activity.

AACL Bioflux, 2017, Volume 10, Issue 4. http://www.bioflux.com.ro/aacl 870
a) Lethrinus harak b) Lutjanus gibbus
c) Plectropomus oligacanthus d) Plectropomus areolatus
Figure 5. Comparison of length at first capture (Lc) and Length at first maturity (Lm) of: a) Lethrinus harak; b) Lutjanus gibbus; c) Plectropomus oligacanthus and
d) Plectropomus areolatus.
The result of SPR value toward coral reef fish in Wangi-Wangi Island, Wakatobi district is presented in Figure 6.

AACL Bioflux, 2017, Volume 10, Issue 4. http://www.bioflux.com.ro/aacl 871
a) Lethrinus harak b) Lutjanus gibbus
c) Plectropomus oligacanthus d) Plectropomus areolatus
Figure 6. Spawning Potency Ratio value of: a) Lethrinus harak; b) Lutjanus gibbus; c) Plectropomus oligacanthus and d) Plectropomus areolatus.
Figure 6 above shows that the SPR value for all of 4 species are below 25% which is interpreted in red (below limit 20%) and orange colours (below target 40%). The value of SPR < 25% indicates that ideally only < 25% of fish resources may be utilized. Based on the results of PSA and SPR analysis, it is necessary to manage the coral reef fishery so that the resources will not deplete any further. Managers should consider the geographic and depth distribution of species, along with their life history characteristics, exploitation patterns, and vulnerabilities (Farmer et al 2016).The mitigation action can be started by publishing the legal-size policy (minimum size which is allowed to catch). This policy has been established by UD. Pulau Mas by setting the minimum weight of 600 gram for each coral reef fish caught. Based on this research, the recommendation for legal-size of the catch is ≥ 300 gram with fish length of ≥ 26 cm for L. harak and L. gibbus, ≥ 1600 gram with fish length of ≥ 50 cm for P. oligacanthus and ≥ 1000 gram with fish length of ≥ 42 cm for P. areolatus. These recommendations are made due to the size of fish which already matured in gonad or have spawn.
Management pattern toward captured fish size limitation has been applied in the Great Barrier Reef with a minimum size of 38 cm for P. areolatus, a minimum size of 42-50 cm for duskytail groupers (Epinephelus bleekery) in the Persian Gulf, and nassau grouper (Epinephelus striatus) in Dry Tortugas waters, Florida with a minimum size of 55.9 cm (Ault et al 2007). All of these minimum sizes that may be caught are based on the minimum size of grouper at first maturity (Prasetya 2010). Determination of the minimum size of captured fish is required as stated by Ault et al (2007) that by determining the minimum size of catch will provide the opportunity for the fish to grow

AACL Bioflux, 2017, Volume 10, Issue 4. http://www.bioflux.com.ro/aacl 872
adult, reach biomass and generating their potential, and at least ensuring reproduction with the spawning partner as well as decreased fishing mortality rate and ensuring sustainability of the population.
The attempt to increase the effectiveness of marine protected areas (MPAs) which have been made by COREMAP CTI and the community in Wakatobi District can maintain the environment, especially coral reefs and their ecosystems. Coral reef ecosystems are being rapidly degraded not only due to climate change, but also more direct anthropogenic disturbances, which may undermine the capacity of corals and other reef-associated organisms to acclimate and/or adapt to specific changes in environmental conditions (Hoey et al 2016). Based on the monitoring results, COREMAP CTI DKP (Marine and Fisheries Department 2015) recommends an increase in surveillance in marine protected areas. The improvement toward monitoring the effectiveness on fishing activity, especially for environmentally unfriendly fishing, should be done due to the results of interviews with local fishermen in which the government is less assertive in law enforcement toward the violations. More indigenous institutions need to be established to assist local governments in the monitoring process.
The fishing gear used for catching coral reef fish by fishermen in Wakatobi Regency is handline, trolling line and traps. Among all of those fishing gears, handline is considered to be the most selective fishing gear. Based on interviews with fishermen, handline has the highest productivity with cheap operational cost. The results of financial analysis toward these fishing gears showed that handline has the highest income and profit and the quickest return of investment compared to traps and trolling line. Tadjuddah (2012))states that handline is a selective fishing gear due to the size of the catch which are relatively large, higher percentage of catch which already matured and the catch is still alive so it can be traded at high prices.
The regulation on the use of hook size for handline fishing in Wangi-Wangi Island needs to be applied considering that not all size of hook is effective for catching snapper and grouper. Based on the results of interviews with fishermen: (1) during the day the hook which has the highest effectivity to catch P. oligachantus and P. areolatus is hook no 8 while at night hook no 7 is more effective to use; (2) many L. gibbus is caught at night and the hook used is no 6 or 7; and (3) L. harak is more effectively caught by using hook number 11 or 13.
The number of fishing fleet needs to be maintained in order to preserve fish stock as conducted by the Unitd Kingdom government. Edvardsson et al (2011), states that the United Kingdom undertook trade-based business management measures for cod (Gadus morhua) fisheries which was introduced in 2003 about length restrictions toward cod fishing vessel (vessel size must be ≤ 10 m), tonnage and engine power. In Cilacap, shrimp fishing fleet management is arranged by controlling the addition of fishing vessels in which new vessels are allowed only for replacement of old vessels that are not in operation (Suman & Satria 2013). In addition to the number of fishing fleet management, the number of fishing gear also needs to be controlled. Budiman et al (2006) state that limitation toward the number of fishing gears is equal to the limitation toward the number of fishing vessels and the limitation of fishery business permit by local government. In addition, Quetglas et al (2017) stated that fishing effort reductions should be based on reducing time at sea, either in terms of hours per day or days per week.
Limitation toward international trade or shipment, as the one that have been done on the humphead wrasse (Cheilinus undulatus) fishery, for L. harak, L. gibbus, P. oligacanthus and P. areolatus can help in fishing pressure mitigation. Budiman et al (2006) state that the fishing quota system is one of the alternatives for demersal fish resource management by limiting the total allowable catch in Kendal waters and its surroundings area so that the area does not run out of demersal fish stock.
Diversification of fishery products in fishermen may lead to be one of the programs to divert fishing activities into other alternative work, but the government needs to cooperate with companies to accommodate the fishermen so that they can sell the processed fishery products. Hutubessy et al (2016) state that if there are other livelihoods, fishing efforts will be reduced so that the government needs to work on a

AACL Bioflux, 2017, Volume 10, Issue 4. http://www.bioflux.com.ro/aacl 873
various livelihoods appropriate to local fisherman’s culture in order to reduce the fishing pressure.
Conclusions. The productivity values, vulnerability values and vulnerability index of black spot emperor (Lethrinus harak), humpback red snapper (Lutjanus gibbus), highfin coral grouper (Plectropomus oligacanthus) and squaretail coralgrouper (Plectropomus areolatus) indicated that the resources have experienced overfishing. Therefore, management toward the number of fishing fleet and fish shipment quota is needed.
The length at first caught (Lc) is smaller than the length at first maturity (Lm) for all the four species, L. harak L. gibbus P. oligacanthus and P. areolatus. Therefore, the regulations related to legal-size (length and weight of the catch) are needed in fisheries management.
The condition of coral reef fisheries in Wangi-Wangi Island, Wakatobi district is indicated to be overfishing. Therefore, the quantity of fishing fleet and fish shipments needs to be managed as well as the management toward legal-size of the catch (length and weight of the fish).
Length-weight data retrieval efforts for coral reef fishes have not been widely performed, especially for each fishing season. Therefore, the status of other reef fishes in Indonesia still remains unknown.
Acknowledgements. The authors would like to thank the Directorate General of Education (DIKTI) - Indonesia, who provided funding for this research through the National Postgraduate Scholarship (BPP-DN) Year 2013, Satya Negara Indonesia University for research funding and COREMAP CTI Ministry of Marine Affairs and Fisheries for writing fund of this paper.
References Ault J. S., Smith S. G., Tilmant J. T., 2007 Fishery management analyses for reef fish in
Biscayne National Park: bag and size limit alternatives. Natural Resource Technical Report NPS/NRPC/WRD/NRTR - 2007/064, U.S. Department of the Interior, National Park Service, Natural Resource Program Center, Colorado, 54 pp.
Budiman, Supriharyono, Asriyanto, 2006 [Distribution analysis of demersal fish in Kendal Regency water as management basic of coastal resources]. Jurnal Pasir Laut 2(1):52-63. [in Indonesian]
Clifton J., 2013 Refocusing conservation through a cultural lens: improving governance in the Wakatobi National Park, Indonesia. Marine Policy 41:80-86.
Edvardsson I. R., Tingley D., Asmundsson J., Conides A. J., Drakeford B., Holm D., 2011 Fisheries management systems and risk perception amongst fishermen in Iceland, Faroe Islands, and UK. International Journal of Humanities and Social Science 1(4):31-41.
Farmer N. A., Malinowski R. P., McGovern M. F., Rubec P. J., 2016 Stock complexes for fisheries management in the Gulf of Mexico. Marine and Coastal Fisheries 8:177–201.
Hoey A. S., Howells E., Johansen J. L., Hobbs J. P. A., Messmer V., McCowan D. M., Wilson S. K., Pratchett M. S., 2016 Recent advances in understanding the effects of climate change on coral reefs. Diversity 8 (12); doi:10.3390/d8020012.
Hordyk A., Ono K., Valencia S., Loneragan N., Prince J., 2014 A novel length-based empirical estimation method of spawning potential ratio (SPR) and test of its performance, for small-scale, data-poor fisheries. ICES Journal of Marine Science doi:10.1093/icesjms/fsu004.
Hutubessy B. G., Mosse J. W., Limmon G. V., 2016 [Implementation of ecosystem approach for reef fisheries management into the program of Lumbung Ikan Nasional (Lin) in Maluku]. Jurnal Amanisal PSP FPIK Unpatti Ambon 5(1):26-34. [in Indonesian]
Marine And Fisheries Department, 2015 [Reports of marine and fisheries departmens in 2015]. Wakatobi district of southeast Sulawesi. [in Indonesian]

AACL Bioflux, 2017, Volume 10, Issue 4. http://www.bioflux.com.ro/aacl 874
McCully Phillips R. S., Scott F., Ellis J. R., 2015 Having confidence in productivity susceptibility analyses: a method for underpinning scientific advice on skate stocks? Fisheries Research 171:87-100.
Micheli F., De Leo G., Butner C., Martone R. G., Shester G., 2014 A risk-based framework for assessing the cumulative impact of multiple fisheries. Biological Conservation 176:224-235.
Noija D., Martasuganda S., Murdiyanto B., Taurusman A. A., 2014 [Red snapper (Lutjanus spp.) resources management in northern waters of Cirebon, Java Sea]. Jurnal Teknologi Perikanan dan Kelautan 5(1):65-74. [in Indonesian]
Prasetya R., 2010 [The potency and exploitation rate of grouper resources in the Gulf of Lasongko, Buton Regency, South East Sulawesi Province]. MSc Thesis, Bogor Agricultural Institute, Bogor, Indonesia, 70 pp. [in Indonesian]
Prince J., 2014 A technical report on an SPR size assessment of the blue swimmer crab fishery in Southeast Sulawesi. Technical Report for IMACS, USAID, 30 pp.
Quetglas A., Merino G., Gonzales J., Ordines F., Garau A., Grau A. M., Guijarro B., Oliver P., Massuti E., 2017 Harvest strategies for an ecosystem approach to fisheries management in Western Mediterranean demersal fisheries. Frontiers in Marine Science. doi: 10.3389/fmars.2017.00106.
Robinson J., Samoilys M. A., Grandcourt E., Julie D., Cedras M., Gerry C., 2011 The importance of targeted spawning agrregation fishing to the management of Seychelles’ trap fishery. Fisheries Research 112:96-103.
Stewart D. R., Long J. M., Shoup D. E., 2015 Spatial structuring within a reservoir fish population: implications for management. Marine and Freshwater Research 66: 202-212.
Stobutzki I., Miller M., Heales D., Brewer D., 2002 Assessing the sustainability of elasmobranch by-catch in a prawn trawl fishery: a method for dealing with high diversity and limited information (Elasmobranch Fisheries - Poster). Northwest Atlantic Fisheries Organization, NAFO SCR Doc. 02/82, 13 pp.
Suman A., Satria F., 2013 [Sustainable management strategy of Indonesian deep sea shrimp resources]. Jurnal Kebijakan Perikanan Indonesia 5(1):47-55. [in Indonesian]
Suruwaky A. M., Gunaisah E., 2013 [Identification of exploitation rate of Indian mackerel (Rastrelliger kanagurta) resources from length-weight relationship point of view]. Jurnal Akuatika 4(2):131-140. [in Indonesian]
Tadjuddah M., 2012 [Model of prediction for sustainability of groupers utilization in Wakatobi Marine National Park, Southeast Sulawesi]. Postgraduate Program of Bogor Agricultural University, Bogor, 225 pp. [in Indonesian]
Triharyuni S., Satria F., Wudiano W., 2015 [A vulnerability assessment of some small pelagic fishes in Java Sea]. Jurnal Penelitian Perikanan Indonesia 21(3):139-146. [in Indonesian]
Walters C. J., Martell S. J. D., 2004 Fisheries ecology and management. Princeton University, New Jersey (USA), 448 pp.
*** www.barefootecologyst.com. Received: 05 June 2017. Accepted: 17 July 2017. Published online: 10 August 2017. Authors: Mercy Patanda, Faculty of Fisheries and Marine Science, Satya Negara Indonesia University, Jalan Arteri Pondok Indah, 12240 Jakarta, Indonesia, e-mail: [email protected] Sugeng H. Wisudo, Department of Fishery Resources Utilization, Faculty of Fisheries and Marine Scinces, Bogor Agricultural University, Jalan Agatis, Dramaga 16680 Bogor, Indonesia, e-mail: [email protected] Daniel R. Monintja, Department of Fishery Resources Utilization, Faculty of Fisheries and Marine Scinces, Bogor Agricultural University, Jalan Agatis, Dramaga 16680 Bogor, Indonesia, e-mail: [email protected] Budy Wiryawan, Department of Fishery Resources Utilization, Faculty of Fisheries and Marine Scinces, Bogor Agricultural University, Jalan Agatis, Dramaga 16680 Bogor, Indonesia, e-mail: [email protected] This is an open-access article distributed under the terms of the Creative Commons Attribution License, which permits unrestricted use, distribution and reproduction in any medium, provided the original author and source are credited. How to cite this article: Patanda M., Wisudo S. H., Monintja D. R., Wiryawan B., 2017 Sustainability for reef fish resource based on productivity and susceptibility in Wangi-Wangi Island, Southeast Sulawesi. AACL Bioflux 10(4):861-874.