Sustainability comparisons in the triple bottom line for ...
8
Marine Policy 125 (2021) 104259 Available online 24 October 2020 0308-597X/© 2020 Published by Elsevier Ltd. Sustainability comparisons in the triple bottom line for Chinese fisheries Lijun Liu a , Jingjie Chu b, * , James L. Anderson c, d , Jintao Xu a a National School of Development, Peking University, Beijing 100871, China b Environment, Natural Resources Management, and Blue Economy, The World Bank, Washington, DC 20433, USA c Institute for Sustainable Food Systems, University of Florida, Gainesville, FL 32611, USA d Food and Resource Economics, University of Florida, Gainesville, FL 32611, USA ABSTRACT This paper uses Fishery Performance Indicators (FPIs) to compare nine Chinese fisheries in terms of their triple bottom line (ecological, economic, and community sustainability) with the top 10% performing fisheries within the global FPIs database. The results show the largest differences between the Chinese fisheries and top- performing fisheries globally are in ecological sustainability followed by harvest sector performance and economic performance. The gaps in community sustain- ability and post-harvest performance are smaller. The paper also compares the nine different Chinese fisheries with each other to assess their relative performance. Zhejiang province shows signs of better fishery management with its stronger enforcement and stricter measures to tackle illegal fishing and as a result, scores higher in ecological and some economic and social dimensions. 1. Introduction China is the world’s largest seafood producer, both in capture fish- eries and aquaculture, accounting for 35% of global seafood production [1]. China is highly important in international trade. By value, China is the world’s largest seafood exporter and the third largest importer [1,2]. China is also a significant distant water fishing nation [3,4] with a re- ported catch of 2.26 MMT in 2018 [1]. Hence, what occurs in the Chi- nese seafood sector is important not only for China, but also for global fisheries. However, there is a huge knowledge gap and little research readily available in English to assess the triple bottom line (ecological, social and economic sustainability) of Chinese fisheries. Recent reviews traced China’s fisheries management history back to 1949, when Peo- ple’s Republic of China was established [5,6] and since 1978, the beginning of the Chinese Economic Reforms [7]. These works have characterized the evolution of the fisheries institutions from open access towards regulated restricted access; the transition from planned econ- omy to market economy; and the shift of priorities from economic out- comes to environmental conservation and community welfare enhancement. Our work contributes to the understanding of how the fisheries perform on ecological, economic and community dimensions for different fishery management systems in China and how they perform relative to reference global fisheries. A better understanding of the current performance of Chinese fisheries could contribute to a more sustainable development of the fisheries in China and other parts of the world. In recent years, China has committed to a new national strategy, namely the ‘Ecological Civilization’ as a response for China’s environ- mental degradation and global climate change [8–10]. As part of this national transformation towards environmental sustainability, fishery and aquaculture management authorities have started putting more effort into balancing development and ecological conservation. The administration has gradually shifted its goals from quantitative growth to quality and efficiency improvement. A series of reform actions have been taken to push the institutional change to better defined rights- based fisheries management [5–7,11,12]. Will China’s plans to reform fisheries help China approach the best managed fisheries in the world? In this paper, the Fishery Performance Indicators (FPIs) [13] were used to assess nine Chinese fisheries to understand the evolving trends of the management system in China. We compare these nine fisheries with the top 10% performing fisheries (14 fisheries out of 145) in the global FPIs database for insights as to where the Chinese fisheries have been doing well and where improvements are needed. This paper is organized as follows. In the next section, the method- ology and the details of the nine Chinese fisheries are presented. The top performing fisheries in the FPI database have also been introduced as benchmarks for further comparisons. In the third section, the nine Chinese fisheries are compared with the top performing fisheries to identify gaps for improvement. Comparisons among the nine fisheries are also conducted focusing on the regional differences. Between these two sets of comparisons, a sub-section on Chinese fisheries management is inserted to prepare the reader with basics of Chinese marine fisheries management framework. The last section discusses possible explana- tions of the differences and potential implications. * Corresponding author. Contents lists available at ScienceDirect Marine Policy journal homepage: http://www.elsevier.com/locate/marpol https://doi.org/10.1016/j.marpol.2020.104259 Received 4 May 2020; Accepted 3 September 2020
Transcript of Sustainability comparisons in the triple bottom line for ...

Marine Policy 125 (2021) 104259
Available online 24 October 20200308-597X/© 2020 Published by Elsevier Ltd.
Sustainability comparisons in the triple bottom line for Chinese fisheries
Lijun Liu a, Jingjie Chu b,*, James L. Anderson c,d, Jintao Xu a
a National School of Development, Peking University, Beijing 100871, China b Environment, Natural Resources Management, and Blue Economy, The World Bank, Washington, DC 20433, USA c Institute for Sustainable Food Systems, University of Florida, Gainesville, FL 32611, USA d Food and Resource Economics, University of Florida, Gainesville, FL 32611, USA
A B S T R A C T
This paper uses Fishery Performance Indicators (FPIs) to compare nine Chinese fisheries in terms of their triple bottom line (ecological, economic, and community sustainability) with the top 10% performing fisheries within the global FPIs database. The results show the largest differences between the Chinese fisheries and top- performing fisheries globally are in ecological sustainability followed by harvest sector performance and economic performance. The gaps in community sustain-ability and post-harvest performance are smaller. The paper also compares the nine different Chinese fisheries with each other to assess their relative performance. Zhejiang province shows signs of better fishery management with its stronger enforcement and stricter measures to tackle illegal fishing and as a result, scores higher in ecological and some economic and social dimensions.
1. Introduction
China is the world’s largest seafood producer, both in capture fish-eries and aquaculture, accounting for 35% of global seafood production [1]. China is highly important in international trade. By value, China is the world’s largest seafood exporter and the third largest importer [1,2]. China is also a significant distant water fishing nation [3,4] with a re-ported catch of 2.26 MMT in 2018 [1]. Hence, what occurs in the Chi-nese seafood sector is important not only for China, but also for global fisheries. However, there is a huge knowledge gap and little research readily available in English to assess the triple bottom line (ecological, social and economic sustainability) of Chinese fisheries. Recent reviews traced China’s fisheries management history back to 1949, when Peo-ple’s Republic of China was established [5,6] and since 1978, the beginning of the Chinese Economic Reforms [7]. These works have characterized the evolution of the fisheries institutions from open access towards regulated restricted access; the transition from planned econ-omy to market economy; and the shift of priorities from economic out-comes to environmental conservation and community welfare enhancement. Our work contributes to the understanding of how the fisheries perform on ecological, economic and community dimensions for different fishery management systems in China and how they perform relative to reference global fisheries. A better understanding of the current performance of Chinese fisheries could contribute to a more sustainable development of the fisheries in China and other parts of the world.
In recent years, China has committed to a new national strategy,
namely the ‘Ecological Civilization’ as a response for China’s environ-mental degradation and global climate change [8–10]. As part of this national transformation towards environmental sustainability, fishery and aquaculture management authorities have started putting more effort into balancing development and ecological conservation. The administration has gradually shifted its goals from quantitative growth to quality and efficiency improvement. A series of reform actions have been taken to push the institutional change to better defined rights- based fisheries management [5–7,11,12]. Will China’s plans to reform fisheries help China approach the best managed fisheries in the world?
In this paper, the Fishery Performance Indicators (FPIs) [13] were used to assess nine Chinese fisheries to understand the evolving trends of the management system in China. We compare these nine fisheries with the top 10% performing fisheries (14 fisheries out of 145) in the global FPIs database for insights as to where the Chinese fisheries have been doing well and where improvements are needed.
This paper is organized as follows. In the next section, the method-ology and the details of the nine Chinese fisheries are presented. The top performing fisheries in the FPI database have also been introduced as benchmarks for further comparisons. In the third section, the nine Chinese fisheries are compared with the top performing fisheries to identify gaps for improvement. Comparisons among the nine fisheries are also conducted focusing on the regional differences. Between these two sets of comparisons, a sub-section on Chinese fisheries management is inserted to prepare the reader with basics of Chinese marine fisheries management framework. The last section discusses possible explana-tions of the differences and potential implications.
* Corresponding author.
Contents lists available at ScienceDirect
Marine Policy
journal homepage: http://www.elsevier.com/locate/marpol
https://doi.org/10.1016/j.marpol.2020.104259 Received 4 May 2020; Accepted 3 September 2020

Marine Policy 125 (2021) 104259
2
2. Methods and data
The FPIs are a set of rapid assessment indicators designed to capture the ecological, economic, and community features of individual fisheries and their enabling conditions based on best knowledge available from both data and expert opinions [13]. The FPIs have been used to compare fisheries systems at a global scale [14], for specific species complexes [15] and for specific fisheries management projects [16]. Nine Chinese fisheries have been accessed, representing key characteristics of Chinese fisheries, such as fishery scale, species, region, and gear types (Table 1). The chosen Chinese fisheries do not represent a random sample, but were chosen based on existing projects and the authors’ research network.
These nine Chinese fisheries were assessed by different researchers from 2014 to 2018 through desktop research as well as field trips, workshops, interviews with government officials, industry leaders, community representatives, and researchers of Chinese marine fisheries biology, ecology and policies. The FPI manual (in English and Chinese) was followed for the assessments [17].
These nine fisheries represent about 40% of Chinese total domestic marine fishery harvest. The South China Sea fishery alone counts for approximately 30% of the total domestic marine catch. Seven of these
assessments focus on fisheries with specific gear (e.g., shrimp trawl) or a species group (e.g., swimming crab, mackerels, hairtail) within a prov-ince (first seven in Table 1). Two fisheries have been assessed at a broader scale and consider all fishing activities in the corresponding regions (Wanshan, small islands in Guangdong Province and the vast South China Sea, including Guangdong, Guangxi, and Hainan Provinces) (Fig. 1). Trawling is most commonly used in Chinese waters for almost all species. However, trawling accounts for small proportions of the catch in the gazami crab and mackerel fisheries in Zhejiang and thus catch from trawling was not included in the assessments.
The top 10% performing fisheries in the global FPI database were chose to be as a benchmark for comparison to see where Chinese fish-eries gaps are compared to the best ones (Table 2). They were identified by ranking fisheries according to their total FPI score, calculated by giving equal weight to ecological, economic and social pillars.
After comparing the performances of Chinese fisheries and the top 10% performing fisheries, these nine Chinese fisheries have been grouped into two: those of Zhejiang Province and non-Zhejiang fisheries for further comparisons. The purpose for such comparisons is to identify whether Zhejiang fisheries perform differently with the other Chinese fisheries. Though not reflected in academic literature, Zhejiang is well- known by the practitioners for being more responsible for the fisheries management and having stronger enforcement capacity than other provinces along the Chinese coastlines. Zhejiang is also the first and only province in China with a provincial fishing ground restoration plan [20].
The FPI scores were crossed checked by the staff who manage the global FPI database to control quality and assure standardization in the scoring. One feature of the FPI approach is that the evaluator provides a quality score that reflects evaluator’s confidence in the accuracy of each score.
For the Chinese fisheries the quality scores are either an ‘A′ (assessor is certain of the score) or a ‘B′ (assessor is certain the score is within one point) for 95.4% of the 68 output scores and 98.4% of the 54 input scores. Quality scores of ‘C′ (assessor is highly uncertain of the score) are associated with 4.6% of the output scores and 1.6% of the input scores. The scores with ‘C′ quality are most commonly associated with output indicators related to Fish Stock Health & Environmental Performance, Risks of the Harvest Sector, and Market Performance in the Post-Harvest Sector. The scores with ‘C′ quality with input indicators are associated with Collective Actions, Management Methods, and Markets & Market Institutions. Zhejiang Swimming Crab and Zhejiang Mackerel fisheries
Table 1 Summary of the nine Chinese fisheries assessed.
Location and fishery
Species Gear type Year assessed
Production volume (000 MT)
Zhejiang Swimming Crab
Gazami crab Gillnetter/pot 2017 172
Zhejiang Mackerel
Chub mackerel, blue mackerel
Light luring purse seiner
2017 188
Zhejiang Shrimp Trawl
Spear shrimp, kuruma shrimp, razor mud shrimp, whiskered velvet shrimp
Shrimp trawl 2017 340
Zhejiang Hairtail
Hairtail, small yellow croaker, small pomfret, silver pomfret, Bombay duck
Double trawl/ single trawl/ canvas stow netter^/ longliner
2017 404
Shandong Spanish Mackerel
Spanish mackerel, sting fish, chub mackerel, silvery pomfret, hairtail
Trawl and gillnet
2015 165
Fujian Swimming Crab
Red swimming crabs, three spot swimming crab, ridged swimming crab, crucifix swimming crab, and horse crab
Trawl and gillnet
2014 117
Guangdong Cuttlefish- Squid
Swordtip squid, Indian squid, miter squid, golden cuttlefish, needle cuttlefish
Longline, trawl and purse seine
2014 51
Guangdong Wanshan Islands
Finfish; multi- species
Trawl and purse seine
2016 8.2
South China Sea
Multi-species All gears operating in the region
2015 3757a
Note: ^Canvas stow netter: stow netter with canvas-made spreading devices. a The figure was based on the total domestic marine catch of South China Sea
reported in the China Statistic Yearbook for Fisheries and Aquaculture. This volume includes the catch from Guangdong Province, Guangxi Province, Hainan Province, and about 10% of the catch from Fujian Province [18].
Fig. 1. The nine Chinese fisheries assessed are distributed along the Chinese coastline. Base map is retrieved from the Standard Map Service by Ministry of Natural Resources, P.R. China.
L. Liu et al.

Marine Policy 125 (2021) 104259
3
have the highest score quality (100% of the scores are either ‘A′ or ‘B′
quality) and the South China Sea fishery has the lowest score quality (92.6% of scores were ‘A′ or ‘B′ quality).
3. Results
3.1. Comparison of Chinese fisheries with top-performing fisheries
Fig. 2 shows the average scores in three pillars of sustainability as well as by sector for the Chinese fisheries and top 10% performing fisheries in the FPI database followed by a statistic test to see if there are significant differences between scores. It was found there were signifi-cant differences for the three sustainability pillars and harvest and post- harvest performance (Table 3). The Chinese fisheries scored statistically lower than the top-performing fisheries in all cases. The largest differ-ences between the Chinese and top-performing fisheries are in ecolog-ical sustainability (average score of Chinese fisheries (ACF) was 3.02 and average score of the top-performing fisheries (ATF) was 4.47) followed by harvest sector performance (3.65 vs. 4.18) and economic perfor-mance (ACF 3.47 vs. ATF 3.98). The gaps in community sustainability (ACF 3.92 vs. ATF 4.26) and post-harvest performance (ACF 3.9 vs. ATF 4.15) are smaller but still significant.
Fig. 3 shows the average scores in the 14 output dimensions for Chinese fisheries and the top 10% performing fisheries. Statistically significant differences in means were found for 7 out of the 14 output dimensions (Table 4). The Chinese fisheries scored higher than the top 10% in three dimensions, post-harvest assets performance, managerial returns and local ownership, but the difference was not significantly different.
Significant differences in the performance of the Chinese fisheries systems compared to top-performing fisheries were in the dimensions of stock health (ACF 3.03 vs. ATF 4.47), harvest performance (ACF 3 vs. ATF 4.27) and international trade (ACF 2.86 vs. ATF 4.14), Product form
(ACF 3.63 vs. ATF 4.13), health and sanitation (ACF 4.44 vs. ATF 4.95), local labor (ACF 3.06 vs. ATF 4.07) and career (ACF 3.33 vs. ATF 3.88). The generally poor condition of Chinese fish stocks is not surprising as most Chinese fisheries are overcapitalized, and the past effort to reduce fishing effort has not been effective or poorly designed such as the buyback program in early 2000s [21–23].
Given that China is the largest world’s exporter of seafood, it is somewhat surprising that Chinese fisheries scored below the top- performing fisheries in international trade. Two reasons may contribute to the lower score. First, China is the world’s largest con-sumer of seafood and several of the Chinese fisheries (e.g., swimming crab and hairtail) primarily target the domestic Chinese market instead of export market. In addition, several of the species caught in Chinese fisheries do not have well developed markets in high-income countries. Second, much of China’s exports are from aquaculture, such as shrimp, and other high value exports are actually imports that are processed and re-exported [2,24,25].
Chinese fisheries scores were not significantly different from top- performing fisheries in dimensions of harvest asset performance (ACF 3.59 vs. ATF 3.74), risk (ACF 3.66 vs. ATF 3.78), post-harvest assets (ACF 3.83 vs. ATF 4.07), managerial returns managerial returns (ACF 4.43 vs. ATF 4.42), labor returns (ACF 3.22 vs. ATF 3.57), community services (ACF 4.63 vs. ATF 4.83) and local ownership (ACF 4.33 vs. ATF 4.11). It is interesting that despite the overfished status of several fish stocks and relatively weak harvest performance, Chinese fishers and processors are earning wages above regional averages, like the top- performing fisheries. It is also interesting to note that despite having a slightly higher proportion of local ownership in Chinese fisheries, the proportion of local labor is well below top-performing fisheries. It should be noted that the non-local labor for Chinese fisheries is not foreign immigrant labor, but Chinese labor from the nation’s interior districts. This is due to the better economic development conditions along the coastal regions which motivate the migration of labors from other areas to the coastal areas and this is a general phenomenon for many sectors. It also fits in with the fact that fishers’ wages have to be competitive, as is evident in a number of other countries [26].
Fig. 4 compares the average scores of the 15 input dimensions for the Chinese fisheries and the top 10% performing fisheries. The top- performing fisheries scored statistically higher than the Chinese
Table 2 Top 10% performing fisheries in the global FPIs Database.
Fishery Assessment year
Iceland Nephrops Lobster 2010 Iceland Cod 2017 Australia Western Zone Abalone 2011 US Alaska Pollock 2013 Japan Wagu Lobster 2016 Australia Southern Zone Rock Lobster 2012 Japan Ofunato Set Net Salmon 2016 Australia Spencer Gulf Prawn 2011 Norway Purse Seine Herring and Mackerel 2010 Japan Toyama Bay Set-Net Yellowtail 2016 Norway Whitefish Trawl 2010 New Zealand Hoki 2011 Faroe Islands Distant Water Fleet Cod and Haddock 2018 US California Spot Prawn 2015
4.473.98
4.26 4.18 4.15
3.023.47
3.923.65
3.9
1
2
3
4
5
Ecology Economics Community Harvest Sector Post-HarvestSectorTop 10% China
Fig. 2. China fisheries compared to the Top 10% in the Global FPI Database.
Table 3 Significance tests for differences in mean scores of the three pillars of sustain-ability and harvest and post-harvest performance for China and the top 10% performing fisheries.
t p-value
Ecology − 7.990 < 0.001 Economic − 5.706 < 0.001 Community − 2.524 0.020 Harvest sector − 4.933 < 0.001 Post-harvest sector − 3.420 0.003
L. Liu et al.

Marine Policy 125 (2021) 104259
4
fisheries in all input dimensions except for the gender and infrastructure dimensions, indicating that improvements can be made in many di-mensions (Table 5). The largest differences between the Chinese and top-performing fisheries are in dimensions related to national gover-nance and national economic conditions. This is reflective of the advanced economies and governance conditions that the top-performing
fisheries operate in such as in the United States, Australia, Iceland, Norway and Japan. The Chinese fisheries also score low in harvest rights given none of the Chinese fisheries assessed are managed with harvest rights, such as catch shares. The score for access rights is low for Chinese fisheries given illegal fishing and excess capacity reduces exclusivity of fishing rights and Chinese licenses also have less transferability and flexibility.
The Chinese fisheries scored statistically lower in three out of the four community-related dimensions (collective action, participation and support, and leadership and cohesion), indicating cooperative, bottom- up management is limited in China’s fisheries management. In general, fishers are not well organized in China. Fishery government officials will consult with key fishers or fish leaders for their feedback regarding policies occasionally, but it has not been systematic, and input has not reflected all fishers’ opinion. The leadership score is low partly because some fishermen live in more urban areas which undermines the close relationship among fishers or fishing culture compared to many more underdeveloped rural fishing communities. The score of gender dimension indicate that men are the primary participants in the Chinese fisheries, and this is also the case for the top-performing fisheries worldwide. The Chinese fisheries scored lower on all management- related dimensions compared to the top-performing fisheries. This is not surprising as none of the Chinese fisheries assessed are currently managed using catch limits, the cornerstone of more advanced fisheries management. Chinese fisheries performed as well as the top 10%
1
2
3
4
5
Top 10% China
Fig. 3. Output comparison (Top 10% compared to selected China fisheries).
Table 4 Significance tests for differences in mean scores of output dimensions for China and the top 10% performing fisheries.
t p-value
Stock health − 7.990 < 0.001 Harvest performance − 5.557 < 0.001 Harvest asset performance − 0.939 0.360 Risk − 0.489 0.630 Trade − 5.248 < 0.001 Product form − 2.384 0.033 Post-harvest assets 1.240 0.231 Managerial returns 0.047 0.963 Labor returns − 1.566 0.138 Health and sanitation − 4.577 0.001 Community services − 1.524 0.159 Local ownership 0.644 0.526 Local labor − 3.043 0.008 Career − 3.409 0.004
11.5
22.5
33.5
44.5
5
Nat
iona
lEnv
ironm
ent
Envi
ronm
enta
lRis
k
Nat
iona
lGov
erna
nce
Nat
iona
lEco
nom
icC
ondi
tions
Acce
ssR
ight
s
Har
vest
Rig
hts
Col
lect
iveA
ctio
n
Parti
cipa
tionS
uppo
rt
Lead
ersh
ipC
ohes
ion
Gen
der
Man
agem
entC
apac
ity
Dat
a
Man
agem
entM
etho
ds
Mar
ketIn
stitu
tions
Infra
stru
ctur
e
National Conditions Rights Community Management Marketing andInfrastructure
Top 10% China
Fig. 4. Input comparison (Top 10% compared to selected Chinese fisheries).
L. Liu et al.
Marine Policy 125 (2021) 104259
5
fisheries in the infrastructure dimension, reflecting China’s efficiency in logistics and shipping services. The relatively high score in the infra-structure dimension of China’s fisheries supports high post-harvest sector performance.
China has engaged in several measures that will close much of the gap between Chinese fisheries systems and the world’s best. In the next section, we will explore some of these reforms to address the input factor limitations.
3.2. Chinese fisheries management
The FPI framework includes several components relevant to the es-sentials of fisheries management system. In this section, performances of the nine Chinese fisheries in the following components “Property Rights & Responsibility”, “Community”, and “Management” are discussed to illustrate the variation of China’s domestic fisheries management.
3.3. Property rights and responsibility
The fishing access rights component of FPI is consist of six measures: “Proportion of Harvest Managed Under Limited Access”, “Trans-ferability”, “Security”, “Durability”, “Flexibility”, and “Exclusivity”. The harvest rights component has a similar structure.
The nine Chinese fisheries received an average score of 3.6 for their fishing access rights, which is moderately strong but still significantly less than average score of 4.2 for the top performing fisheries in the FPI database. Specifically,
▪ Proportion of Harvest Managed Under Limited Access: Strong (average score of 4.33). Virtually all the nine Chinese fisheries assessed were managed with restrict access rights. It must be noted that fishing access rights in the FPI include both regula-tory and de facto access rights
▪ Transferability: Weak (average score of 2.55). The fishing li-cense itself is not allowed to transfer [27]. However, the key components of the license (i.e., fishing vessel and horsepower quota of the fishing vessel) can be transferred. Thus, the fishing access is transferable, within limits. There are some limits for the transition. For example, transfers from one province to another or transfers to trawlers, canvas stow netters and deep water seiners are not allowed [28].
▪ Security & Durability: Strong (average scores of 4.55 and 4.33 respectively). The fishing license is required for a renewal for every 5 years. Stakeholders (fishermen, administrators, and researchers) interviewed in this project suggest strong security and durability for the access rights. For trawlers, canvas stow netters and deep-water seiners, their licenses will not be
renewed once the vessels reach certain age, which is a way for China to reduce those destructive fishing methods. If they want to keep fishing, they must change to more environment-friendly fishing methods to receive a license.
▪ Flexibility: Moderate (average score of 3.11). To receive a marine fishing license, the vessel registration and inspection information, fishing methods employed, and fishing grounds where the vessel will operate have to be specified [23].
▪ Exclusivity: Weak (average score of 2.77). This evaluation score is based on the facts that too many licenses were issued and the access rights are not exclusive. The total number for the fishing licenses issued is supposed to be determined by the conditions of the fisheries resource and environmental capacity. However, given that no Total Allowable Catch (TAC) system has been put in place so far, this prerequisite has not directly affect the fishing license distribution [6,7]. The number of fishing license is constrained mainly by the caps for fishing vessels and gears, which is referred as “double control” policy (caps for total count of fishing vessels and total engine power).
Harvest rights are becoming an increasingly important fisheries management tool globally [29]. However, all Chinese fisheries received a score of 1 for the measure “Proportion of Harvest Managed with Rights-Based Management”, as virtually none of the harvest were managed with right-based management. The total allowable catch (TAC) system has been written into law since 2000 [6,27], but up to now no fisheries within the Chinese EEZ have been managed with harvest rights. Since 2017, there have been some attempts to introduce rights- based fishery management approach through experimental pilot pro-jects. From 2017–2019, the four most important provinces for marine fisheries have launched five TAC pilots to cultivate the managerial ca-pacity for rights-based fisheries management. Those projects are rela-tively small to their corresponding fisheries. For example, the first TAC pilot project launched was for the swimming crab fishery in Zhejiang Province in 2017. The total catch from this project was 1612 MT in 2017, less than 1% of the total catch in the province (177,183 MT). In preparation for the right-based management, the fisheries administra-tion also has launched a pilot project for port-based fisheries manage-ment in 2019. Some of its expected deliverables from this pilot, including improving traceability of harvest and the quality of fishing logs and establishing a landing report system, are essential for right- based management.
3.3.1. Community The fisheries communities were assessed for input dimensions:
‘Collective Action,’ ‘Participation,’ ‘Leadership’ and ‘Gender.’ The average for ‘collective action’ was only 2.4 compared to 3.8 for the top performing fisheries. However, the last five-year plan (2016–2020) for fisheries and aquaculture highlighted the promotion of harvester orga-nizations in the fisheries communities [11]. The harvester organizations have a huge potential to influence the fisheries in management and marketing in China, but there is a long way to go. Fisheries cooperatives are common in the fisheries communities. Most of them handle used-to- be government business, like the harvest safety, vessel checks, etc., but only have limited voice on management and access. Coordination for harvest are conducted mostly via interpersonal networks rather than the organizations.
Stakeholder participation and support for fisheries management only scores an average of 2.2 compared to 3.6 for the top performing fish-eries. Stakeholder meetings are rare and irregular. Some fishermen (very small portion of the community) would attend short consultation ses-sions initiated by either the fisheries managers or researchers for feed-backs for specific projects or policies. There is no industry financial support for management, as the administrations are not supposed to receive funds from industry.
Leadership in fisheries communities scored an average of 3.1
Table 5 Significance tests for differences in mean scores of input dimensions for China and the top 10% performing fisheries.
t p-value
National environment − 18.028 < 0.001 Environmental risk − 3.329 0.006 National governance − 50.839 < 0.001 National economics − 25.931 < 0.001 Access rights − 4.027 0.001 Harvest rights − 4.754 < 0.001 Collective action − 5.767 < 0.001 Participation & support − 2.994 0.007 Leadership & cohesion − 4.426 < 0.001 Gender 0.573 0.573 Management capacity − 6.278 0.002 Data − 4.514 < 0.001 Management methods − 3.494 < 0.002 Markets & market institutions − 4.324 < 0.001 Infrastructure − 1.684 0.108
L. Liu et al.

Marine Policy 125 (2021) 104259
6
compared to 4.3 for the top performing fisheries. At village level, fishers or heads of the cooperatives have shown some level of leadership. However, when it comes to the provincial level, no strong leadership has been identified. The fishery communities perform generally well in terms of social cohesion. With the rapid urbanization in China, the fishery communities have been shrinking and less and less young people have stayed in fisheries in the recent decades, leading the average years of experience skewed towards older group.
Overall females have lower influence for business management and resources management, especially for the industrialized fisheries. Participation in harvest is not common. Women are more active in post- harvest sectors.
3.3.2. Management This component in FPIs consists of three dimensions: ‘Management
Capacity’, ‘Data’, and ‘Management Methods.’ Management capacity scored an average of 3.4 compared to 4.4 for the top performing fish-eries. Within the Chinese EEZs, the jurisdictions have been divided into two parts by the “no-trawling” line. The provincial enforcement has jurisdiction over the waters to the continent side of this line, and the three Sea Regions (the Bohai & Yellow Sea, the East China Sea, and the South China Sea) enforcement bodies have jurisdictions of the state water offshore. The enforcement capacity is not enough overall. Among the coastal provinces, Zhejiang Province has the strongest capacity to regulate the fishing activities, but still understaffed and the challenge of coordination for the enforcement in the state water have been raised, especially with the frequent shifts of sea region enforcement bodies.1
Most fishing vessels receive fuel subsidy and some subsidy for renewing the vessels. Chinese government have committed by 2019 to reduce the fuel subsidy to 40% of the level in 2014 and to cancel the fuel subsidy for three types of fishing vessels that pose high threats for the marine environment (paired trawler, canvas stow netter and deep water seiner) in 2020 [30].
The score on Chinese data system was moderate (3.4), but signifi-cantly lower than the top performing fisheries (4.2). Although a landing reporting system has not been established in Chinese domestic fisheries, fishermen are required to fill in fishing logs. However, there is no quality control for the logs. There are no national fisheries resource monitoring program, but some research institutes run regular fisheries-independent surveys and fisheries-dependent monitoring programs that collect har-vest and fishing behavior information with small samples. Fish price data are collected in the major wholesale markets on a daily or weekly basis, varying by the markets and species. These data have not been fully utilized in management.
Management methods scored an average of 2.2, significantly less than the 3.2 for the top performing fisheries. Management methods vary in sea regions and provinces, but in general, input controls are mostly used, such as moratoria, area closures, and mesh size limit. Among these tools, the most important one is the summer moratorium. Additionally, China has been increasing MPAs and sanctuaries, with a target of adding 58 national fisheries resources protected areas and five provincial or national aquatic natural protected areas between 2015 and 2020 [11]. Mesh size limits have been put in place since 2014 [31], however through interviews with practitioners in the field, the enforcement is very challenging.
3.4. Chinese fisheries performance comparison
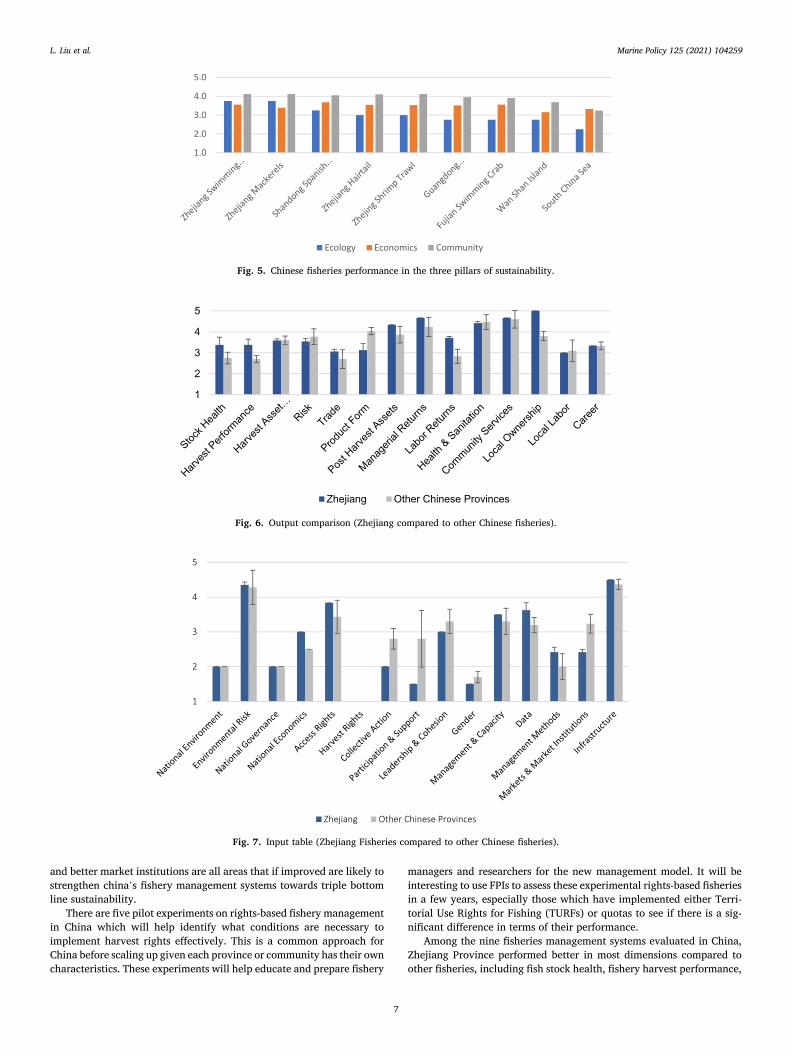
It is interesting to see differences among the nine Chinese fisheries. Fig. 5 shows they performed relatively well in the economic and com-munity pillars with the exceptions of the economic score for Wan Shan Island, and the community score for the South China Sea fisheries (Fig. 5). Zhejiang is selected to compare with other fisheries because two reasons. One is because Zhejiang is considered as one of the best per-forming provinces in terms of marine fishery management in China. Two is that the assessment for Zhejiang’s four fisheries were conducted in 2017, and the other fisheries were assessed between 2014 and 2016 before the China’s acceleration of ecological civilization has been put into action plans for marine fisheries management reform [12].
When looking at output performance in details (Fig. 6), all Chinese fisheries are doing relatively well in the dimensions of harvest assets, risk, post-harvest assets, managerial returns, health and sanitation, and community services (over 3.5). Zhejiang received higher scores on average in stock health, harvest performance, trade, post-harvest assets, labor returns and local ownership and has fallen below in product form. This might be due to the following reasons. First, the assessed fisheries have different scopes. For example, the Wan Shan Island fishery only produces over 8000 MT of fish while South China Sea fisheries involved many more species and areas which is likely to contribute to the lower stock health scores. Second, Zhejiang coastal area may have better natural conditions with higher productivity. Third, three of the Zhejiang fisheries focus on fast growing and short life-span species (crab, mack-erel, and shrimps) and received relatively good scores in ecological performance. The Zhejiang hairtail has a low score in stock health, but it is a recovering fishery with over twenty years of restoration effort. Since 1980s, Zhejiang has started a summer moratorium for trawlers in addition to several MPAs that protect important habitats for the hairtail [32]. The stock is expected to continue recovering. After investing in marine fisheries management and fisheries restoration since 2013 [20], there is some evidence to show a degree of recovery of Zhejiang’s four most famous species, yellow croaker, small yellow croaker, hairtail, and spineless cuttlefish, which have been overfished for decades. In 2019, pelagic finfish landings in Zhejiang have increased four times compared to the landings in the late 1990s [20].
For the input conditions, it is not surprising to see Zhejiang scores higher on management related indicators, such as management and capacity, data, management methods, and access rights. The variation in Management Methods are introduced by the lower scores for MPAs and Sanctuaries in Wanshan and South China Sea fisheries. Two reasons might have caused such differences, the assessors bias and the fact that the South China Sea had shorter moratoria than other sea regions. Zhejiang generally scored lower than other Chinese fisheries in the collective action, participation & support, leadership & cohesion, and gender components (Fig. 7). The lower scores may reflect the fact that Zhejiang fishing fleets are more industrialized compared to other fish-eries (average engine power of fishing vessels in Zhejiang is two times higher than the national average [19]) with less women participation and less organization.
4. Conclusions
China is the largest seafood producing country in the world and has a national objective to improve fisheries management. In this paper, we compare performance of nine Chinese fisheries with the top 10% per-forming fisheries in the global FPI database for the three pillars of sus-tainability as well as harvest and post-harvest performance. All measures indicate that there is a significant room for China to improve. Comparing with the top performing fisheries globally helps identify where the improvements are needed. Input factors such as strengthening harvest rights, stronger fishery community participation and leadership, improved management capacity (enforcement), management methods (setting TAC and spatial management) and data collection and analysis,
1 The enforcement bodies of the sea regions have changed several times in the past few years. For example, in the East China Sea region, the East China Sea Bureau of Fisheries Enforcement, Ministry of Agriculture used to take re-sponsibility of enforcement for the fishing activities in the offshore state water and would coordinate the several provincial enforcement bodies in task forces to combat IUUs. From 2015–2018, the fisheries enforcement body was the East China Sea Coast Guard. The Coast Guard since the government reconstruction in 2018, has been merged into the Armed Policy Force.
L. Liu et al.
Marine Policy 125 (2021) 104259
7
and better market institutions are all areas that if improved are likely to strengthen china’s fishery management systems towards triple bottom line sustainability.
There are five pilot experiments on rights-based fishery management in China which will help identify what conditions are necessary to implement harvest rights effectively. This is a common approach for China before scaling up given each province or community has their own characteristics. These experiments will help educate and prepare fishery
managers and researchers for the new management model. It will be interesting to use FPIs to assess these experimental rights-based fisheries in a few years, especially those which have implemented either Terri-torial Use Rights for Fishing (TURFs) or quotas to see if there is a sig-nificant difference in terms of their performance.
Among the nine fisheries management systems evaluated in China, Zhejiang Province performed better in most dimensions compared to other fisheries, including fish stock health, fishery harvest performance,
1.0
2.0
3.0
4.0
5.0
Ecology Economics Community
Fig. 5. Chinese fisheries performance in the three pillars of sustainability.
1
2
3
4
5
Zhejiang Other Chinese Provinces
Fig. 6. Output comparison (Zhejiang compared to other Chinese fisheries).
1
2
3
4
5
Zhejiang Other Chinese Provinces
Fig. 7. Input table (Zhejiang Fisheries compared to other Chinese fisheries).
L. Liu et al.

Marine Policy 125 (2021) 104259
8
post-harvest performance, managerial returns, labor returns, and degree of local ownership. Some of their management experiences are regarded as role models for other provinces. However, the long-term effectiveness might be compromised by the lack of involving incentives and behavior changes of the fishers in the policy design. Concerns have been raised that once the enforcement has weakened, illegal fishing activities could rapidly come back [33]. As the FPI results suggested, more effort should also focus on the community level which will help achieve the long-term behavior change goal.
Acknowledgements
The authors would like to acknowledge colleagues who conducted the Chinese case studies outside of the Zhejiang province: Fenjie Chen, formerly worked for China Blue, assessed Fujian swimming crab, Guangdong cuttlefish-squid, Yellow Sea Shandong province, Yang Han (formerly worked for Chinese Academy of Fishery Sciences) South China Sea fisheries, and Chu Chu (Graduate students from University of Flor-ida) assessed Guangdong Wan Shan Island fisheries.
This paper was produced with the support from the Environment for Development Initiative at the University of Gothenburg, Sweden; and UF/IFAS, Institute for Sustainable Food Systems with support from the Florida Agricultural Experiment Station, University of Florida, Gaines-ville, FL USA.
References
[1] FAO, The State of World Fisheries and Aquaculture 2020, Sustainability in action, Rome, 2020.
[2] B. Yang, J.L. Anderson, F. Asche, Determinants of China’s seafood trade patterns, Mar. Resour. Econ. 35 (2) (2020) 97–112.
[3] D. Belhabib, U.R. Sumaila, P. Le Billon, The fisheries of Africa: exploitation, policy, and maritime security trends, Mar. Policy 101 (2019) 80–92.
[4] D. Belhabib, U.R. Sumaila, V.W. Lam, D. Zeller, P. Le Billon, E. Abou Kane, D. Pauly, Euros vs. Yuan: comparing European and Chinese fishing access in West Africa, PLoS One 10 (3) (2015), e0118351.
[5] S. Su, Y. Tang, B. Chang, W. Zhu, Y. Chen, Evolution of marine fisheries management in China from 1949 to 2019: how did China get here and where does China go next? Fish Fish. 21 (2) (2020) 435–452.
[6] S. Huang, Y. He, Management of China’s capture fisheries: review and prospect, Aquac. Fish. 4 (2019) 173–182.
[7] L. Cao, Y. Chen, S. Dong, A. Hanson, B. Huang, D. Leadbitter, D.C. Little, E. K. Pikitch, Y. Qiu, Y.S. de Mitcheson, Opportunity for marine fisheries reform in China, Proc. Natl. Acad. Sci. USA 114 (3) (2017) 435–442.
[8] State Council P.R. China, Integrated Reform Plan for Promoting Ecological Cilvilization, Beijing, 2015.
[9] Y. Gu, Y. Wu, J. Liu, M. Xu, T. Zuo, Ecological civilization and government administrative system reform in China, Resour. Conserv. Recycl. 155 (2020), 104654.
[10] B. Jiang, Y. Bai, C.P. Wong, X. Xu, J.M. Alatalo, China’s ecological civilization program–Implementing ecological redline policy, Land Use Policy 81 (2019) 111–114.
[11] Ministry of Agriculture P.R.China, China’s 13th five-year plan for fisheries and aquaculture, Beijing, 2016.
[12] Ministry of Agriculture P.R.China, Notice on further enhancing fishing vessel management and implenmenting total allowable catch for marine fisheries Beijing, 2017.
[13] J.L. Anderson, C.M. Anderson, J. Chu, J. Meredith, F. Asche, G. Sylvia, M.D. Smith, D. Anggraeni, R. Arthur, A. Guttormsen, The fishery performance indicators: a management tool for triple bottom line outcomes, PLoS One 10 (5) (2015), e0122809.
[14] F. Asche, T.M. Garlock, J.L. Anderson, S.R. Bush, M.D. Smith, C.M. Anderson, J. Chu, K.A. Garrett, A. Lem, K. Lorenzen, Three pillars of sustainability in fisheries, Proc. Natl. Acad. Sci. USA 115 (44) (2018) 11221–11225.
[15] J.K. McCluney, C.M. Anderson, J.L. Anderson, The fishery performance indicators for global tuna fisheries, Nat. Commun. 10 (1) (2019) 1–9.
[16] J. Chu, T.M. Garlock, P. Sayon, F. Asche, J.L. Anderson, Impact evaluation of a fisheries development project, Mar. Policy 85 (2017) 141–149.
[17] J.L. Anderson, C.M. Anderson, J. Chu, J. Meredith, Fishery Performance Indicators Manual (Version 1.4), 2016.
[18] Bureau of Fisheries P.R. China. National Fisheries Technology Extension Center, Society of Fisheries, China Statistics Yearbook for Fisheries and Aquaculture, Agriculture Press, Beijing, 2016.
[19] Bureau of Fisheries P.R. China. National Fisheries Technology Extension Center, Society of Fisheries, China Statistics Yearbook for Fisheries and Aquaculture, Agriculture Press, Beijing, 2019.
[20] Zhejiang Province Fisheries Management and Enforcement Department, Accomplishment in Zhejiang Fishing Ground Restoration, 2020. 〈http://www. zjagri.gov.cn/art/2020/4/10/art_1630653_42543076.html〉. (Accessed 4 May 2020).
[21] Z. Zhang, S. Wu, S. Li, J. Cao, S. Ge, Effectiveness evaluation and policy recommendations for China’s fishing vessel "Double Control" system, China Fish. 4 (2018) 34–40.
[22] H. Ou, C. Yu, The research on effectiveness of fishing vessel" Double Control" system, J. Zhejiang Ocean Univ. (Nat. Sci. Ed.) 30 (432–5) (2011) 470.
[23] S. Liu, Reflections and suggestions for improving China’s “Double Control” system, Chin. Fish. 7 (2009) 24–25.
[24] J.L. Anderson, F. Asche, T. Garlock, Globalization and commoditization: the transformation of the seafood market, J. Commod. Mark. 12 (2018) 2–8.
[25] F. Asche, C.A. Roheim, M.D. Smith, Trade intervention: not a silver bullet to address environmental externalities in global aquaculture, Mar. Policy 69 (2016) 194–201.
[26] M. Nielsen, F. Asche, O. Bergesen, J. Blomquist, E. Henriksen, A. Hoff, R. Nielsen, J. R. Viðarsson, S. Waldo, The myth of the poor fisher: evidence from the Nordic countries, Mar. Policy 93 (2018) 186–194.
[27] P.R.C. National People’s Congress, Fisheries and Aquaculture Law of People’s Republic of China, Beijing, 2000.
[28] Minstry of Agriculture and Rural Affairs P.R. China. Fishing License Management Regulation, Beijing, 2018.
[29] A.M. Birkenbach, M.D. Smith, S. Stefanski, Feature—taking stock of catch shares: lessons from the past and directions for the future, Rev. Environ. Econ. Policy 13 (1) (2019) 130–139.
[30] Ministry of Financing P.R. China, Notice on adjusting fuel subsidy and promoting sustainability for domestic fisheries and aquculture, Beijing, 2019.
[31] M.o.A. P.R.China, Notice on implentmening mesh size limits for approved and transitional fishing gears, Beijing, 2013.
[32] H. Xu, Z. Liu, H. Song, Y. Zhou, States of the East China Sea moratorium and Suggestion for Management Improvement, Mod. Fish. Inf. 18 (1) (2003) 22–26.
[33] Z. Nie, B. Shui, K. Tian, J. Qiu, L. Zhang, X. Han, S. Yu, Investigation and research on the rehabilitation and revitalization of Zhejiang fishing grounds taking 4one- three improvement? Speciai enforcement action for example, Mar. Dev. Manag. 6 (2018) 76–81.
L. Liu et al.