Sustainability. Building Shared Value - May 2015
12
May 2015 Sustainability. Building shared value. SUSTAINABILITY POLICIES AND PERFORMANCES AT SNAM IN 2014
Transcript of Sustainability. Building Shared Value - May 2015
May 2015
Sustainability.Building shared value.SUSTAINABILITY POLICIES AND PERFORMANCES AT SNAM IN 2014

Dear shareholders, this third issue of the annual document “Sustainability. Building shared value” aims to keep you updated on the evolution of policies and actions driving Snam stakeholder relations. The document highlights the 2014 initiatives; at the same time last year results are compared with past performances and, whenever possible, benchmarked to Plan’s targets.
The document cannot fully cover the articulated structure of Snam sustainability. In order to obtain more in-depth information we invite you to refer to the 2014 Sustainability Report. For further details on fi nancial performance and Governance issues, please refer both to the 2014 Financial Statements and to “The Snam Shareholder” Guide, which is issued every six months.
Sustainability presented to our investors
Snam is Europe’s leading operator in the creation and integrated management of natural gas infrastructure. It facilitates the conditions for fair-priced energy by effi ciently managing the gas system, developing infrastructure, and offering integrated services for the market. It promotes the integration of European networks, including through strategic partnerships with major operators in the sector along the continent’s main energy corridors.Snam follows an ethical and socially responsible business model that is capable of generating value for both the company and the community in which it operates, based on renowned professionalism and transparent dialogue with all stakeholders, whilst respecting the environment and the local area. A clear and sustainable development strategy based on one of the biggest industrial investment plans in the country allows the Company to attract capital from both Italy and abroad, thus promoting growth and job creation.With over 6,000 employees, Snam is active in natural gas transportation, storage, regasifi cation and urban distribution. We manage a national transportation network that is more than 32,000 km long, including eight storage facilities, one regasifi cation plant and a local distribution network that covers more than 55,000 km in total.
How Snam interprets sustainability
Snam, sustainability and value creation are closely connected concepts. For this reason the sustainability process is structured and embedded into the business model.Snam promotes the dialogue with all stakeholders in an attempt to create fertile ground for the development of projects and initiatives presenting an added value that is consistent with the Company’s business. To do this, Snam has begun to integrate the Shared Value approach into its sustainability path, thus building a stronger link between business and corporate social responsibility. For Snam, creating Shared Value means to innovatively play its traditional role in the Country’s development by favouring a fair increase in the value of resources developed over time in terms of infrastructure, competences and human capital.
Further information about the topics presented in this issue is available in the 2014 Sustainability Report (www.snam.it/en/sustainability/reporting_and_performance/).
The approach to Sustainability
2

In 2014, in a still difficult and unstable environment, with the economic crisis resulting for the fourth consecutive year in a reduction of gas consumptions in Italy, Snam has succeeded in combining its strategic mission for the resurgence of our Country with the ability to create value for its stakeholders, while continuing to manage business activities in a transparent and responsible manner.In this environment, with domestic gas production declining and a high reliance on foreign imports, Snam has focused on the development of interconnection capacity and the integration of European gas networks. This is an essential strategy to ensure secure procurement and greater liquidity
of the gas system, in keeping with the long-term strategy of the European Union.To achieve these goals, in 2014 Snam invested 1.3 billion euro in expanding infrastructure in the Italian gas system and developing new services, and over 500 million euro to acquire 84% of the share capital of Trans Austria Gasleitung GmbH (TAG), the company that owns the Austrian section of the gas pipeline from Russia to Italy. Snam has therefore enhanced its leadership position among European infrastructure operators and will now be able to rely on a new key asset in the East-West energy corridor, including in the context of a potential reverse-flow to Central Europe.Business development has been accompanied
by favourable operating and financial results, by the continuous growth in the stock price and by the successful international placement of corporate bonds. Likewise, Snam continues to enhance results achieved over time with good governance and the ongoing implementation of social and environmental responsibility practices. Such a commitment resulted into the entry of the Snam stock, already a member in the most relevant social responsibility world indices, into the United Nations Global Compact 100 index (GC 100), which incorporates the 100 companies at global level that excel in terms of their focus on both sustainability issues and financial performance. Snam also confirmed its focus on sustainable
growth with active support for the Global Compact, its principles and the Millennium Development Goals.The 2014 Sustainability Report, which covers in a comprehensive manner for the first time the new GRI-G4 standard, contributed to Snam’s success in the “Oscar di Bilancio 2014“, the Financial Statements’ Oscar. This recognition confirms the effectiveness and transparency of information to stakeholders.
Also in 2014, the initiatives pursued and the resulting achievements prove Snam’s attention to sustainable growth. Message from the CEO of Snam
Carlo MalacarneCEO of Snam
3

For the sixth year in a row, the Snam stock has been confi rmed as a member in the Dow Jones Sustainability World Index, the most prestigious index focusing on economic, social and environmental responsibility, and has been included into the Silver Class, the excellence cluster list within this index.
INVESTING INTO A SUSTAINABLE STOCK
DOW JONES SUSTAINABILITY WORLDFTSE4GOOD / ETHIBEL / CAPITAL PARTNERSSTOXX GLOBAL ESG LEADERS INDICESVIGEO WORLD 12O / VIGEO EUROPE 120GC100 / CDLI / OEKOM RESEARCHMSCI GLOBAL SUSTAINABILITY INDEX
Even in 2014, the Snam continuous commitment to integrate sustainability into corporate policies has led to the share inclusion into a growing number of specialised indices, based on criteria assessing fi nancial, social and environmental performances. Thanks to this index membership, Snam enjoys an ever growing visibility among socially responsible investors and, more generally, within the whole fi nancial community. On 31 December 2014, according to the public information available and to the most recent Shareholder Analysis, funds whose investment process takes into account also SRI (Socially Responsible Investing) criteria own approximately 4.4% of Snam share capital, vs. 3% at the end of 2013.
In 2014 the Snam share has been confi rmed in Dow Jones Sustainability World Index as well as in the FTSE4Good index series, in which the Company has been listed since 2002, in the Vigeo World 120 and Vigeo Europe 120 indices and, for the second consecutive year, in the sustainability CDP Italy 100 Climate Disclosure Leadership Index (CDLI), direct emanation of CDP, a non-profi t organisation among the most important entities at the international level addressing the climate change issue. Snam collaboration with CDP dates back to 2007. The Snam share also entered two indices, MSCI World and MSCI ACWI ESG, which include the companies with high sustainability ratings in the reference sector. Snam is moreover a member of the United Nations Global Compact 100 (“GC 100”) Index, developed by the Global Compact of the United Nations, which includes the best 100 companies that distinguished themselves on a global basis by attention paid to ESG issues and is listed in six among the leading ECPI indices, the Stoxx Global ESG Leaders indices, the Oekom Research index and the Ethibel Pioneer and Excellence indices.
An excellence recognition in the fi ght against corruption: in June 2014 Transparency International Italia (an international non-governmental organisation) assigned the maximum score to Snam for its proactive approach and transparency in the management and reporting of programmes and anti-corruption activities.
SNAM MEMBERSHIP IN SUSTAINABILITY INDICES
SNAM, DJ SUSTAINABILITY WORLD AND FTSE4GOOD GLOBAL (BASIS 2 JANUARY 2014=100)2 January 2014 – 15 April 2015
SNAM FTSE4GOOD GLOBE DJSI WORLD
Jan2014
Feb2014
Mar2014
Apr2014
May2014
Jun2014
Jul2014
Aug2014
Sep2014
Oct2014
Nov2014
Dec2014
Jan2015
Feb2015
Mar2015
Apr2015
90
100
110
120
130
140
4
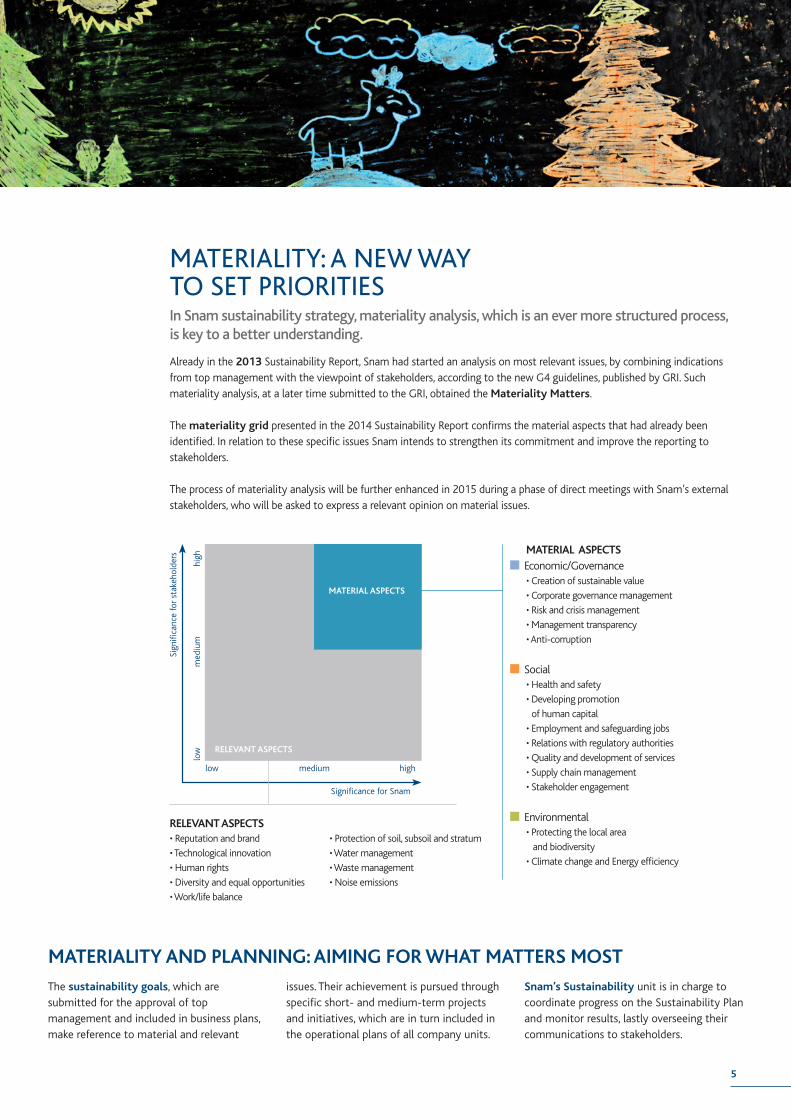
In Snam sustainability strategy, materiality analysis, which is an ever more structured process,is key to a better understanding.
MATERIALITY: A NEW WAY TO SET PRIORITIES
Already in the 2013 Sustainability Report, Snam had started an analysis on most relevant issues, by combining indications from top management with the viewpoint of stakeholders, according to the new G4 guidelines, published by GRI. Such materiality analysis, at a later time submitted to the GRI, obtained the Materiality Matters.
The materiality grid presented in the 2014 Sustainability Report confirms the material aspects that had already been identified. In relation to these specific issues Snam intends to strengthen its commitment and improve the reporting to stakeholders.
The process of materiality analysis will be further enhanced in 2015 during a phase of direct meetings with Snam’s external stakeholders, who will be asked to express a relevant opinion on material issues.
MATERIALITY AND PLANNING: AIMING FOR WHAT MATTERS MOST
The sustainability goals, which are submitted for the approval of top management and included in business plans, make reference to material and relevant
issues. Their achievement is pursued through specific short- and medium-term projects and initiatives, which are in turn included in the operational plans of all company units.
Snam’s Sustainability unit is in charge to coordinate progress on the Sustainability Plan and monitor results, lastly overseeing their communications to stakeholders.
Significance for Snam
low medium high
low
m
ediu
m
high
Sign
ifica
nce
for
stak
ehol
ders
MATERIAL ASPECTS
RELEVANT ASPECTS
MATERIAL ASPECTS Economic/Governance •Creationofsustainablevalue
•Corporategovernancemanagement
•Riskandcrisismanagement
•Managementtransparency
•Anti-corruption
Social •Healthandsafety
•Developingpromotion
of human capital
•Employmentandsafeguardingjobs
•Relationswithregulatoryauthorities
•Qualityanddevelopmentofservices
•Supplychainmanagement
•Stakeholderengagement
Environmental •Protectingthelocalarea
and biodiversity
•ClimatechangeandEnergyefficiency
RELEVANT ASPECTS•Reputationandbrand
•Technologicalinnovation
•Humanrights
•Diversityandequalopportunities
•Work/lifebalance
•Protectionofsoil,subsoilandstratum
•Watermanagement
•Wastemanagement
•Noiseemissions
5

ADDED VALUE DISTRIBUTION
REFLECTIONS OF OUR COMMITMENT TO STAKEHOLDERS
Employees 16.9%
Shareholders33.9%
Resources redistribuited into the system12.5%
Lenders17.1%
Public Administration 19.7%
Distribution of Value AddedIn 2014 Snam distributed to its stakeholders an overall amount of 2,261 million euro, from added value produced of 2,584 million euro.
Communication and engagement toolsSnam is committed to establish long-term relations with all stakeholders, through a wide range of communication tools and engagement inititiatives.
Snam increasingly exploits the web potential in order to pursue a continuous and immediate dialogue with stakeholders. The quality of such commitment is proven by the second best score that Snam has achieved in the Italian Webranking, the most prestigious evaluation of digital corporate and fi nancial communication in Europe that, through Lundquist, assesses corporate websites’ contents according to stakeholder needs. Snam resulted in being also the «best improver» among the 69 ranked companies, thanks to the entity of the increase in its score. In addition to social accounts introduced in 2013 (Twitter, Youtube, LinkedIn, Google+, Flickr and Instagram), in 2014 Snam also opened Slideshare and Facebook accounts.
In 2014 Snam has been awarded the Financial Statement Oscar created by FERPI (Federazione Relazioni Pubbliche Italiana), in the category “Listed Companies and Large Businesses”. In the Snam Report the richness of contents and metrics addressing sustainability topics has played a relevant role among the motivations for the prize.
In 2014 the fi rst edition of the educational project “Stories that Tell the Future” has involved 333 schools and over 1,000 classes all over Italy. Through the new dedicated portal, using the innovative geo-referencing system made available by Google, nearly 2,000 reports produced have been collected; some drawings from the students of the elementary schools have moreover contributed to illustrate the Snam 2014 Sustainability Report.
875 million euro to Shareholders
509 million euro to Public Administration
441 million euro to Lenders
436 million euro to Employees
323 million euro redistributed into the system
6
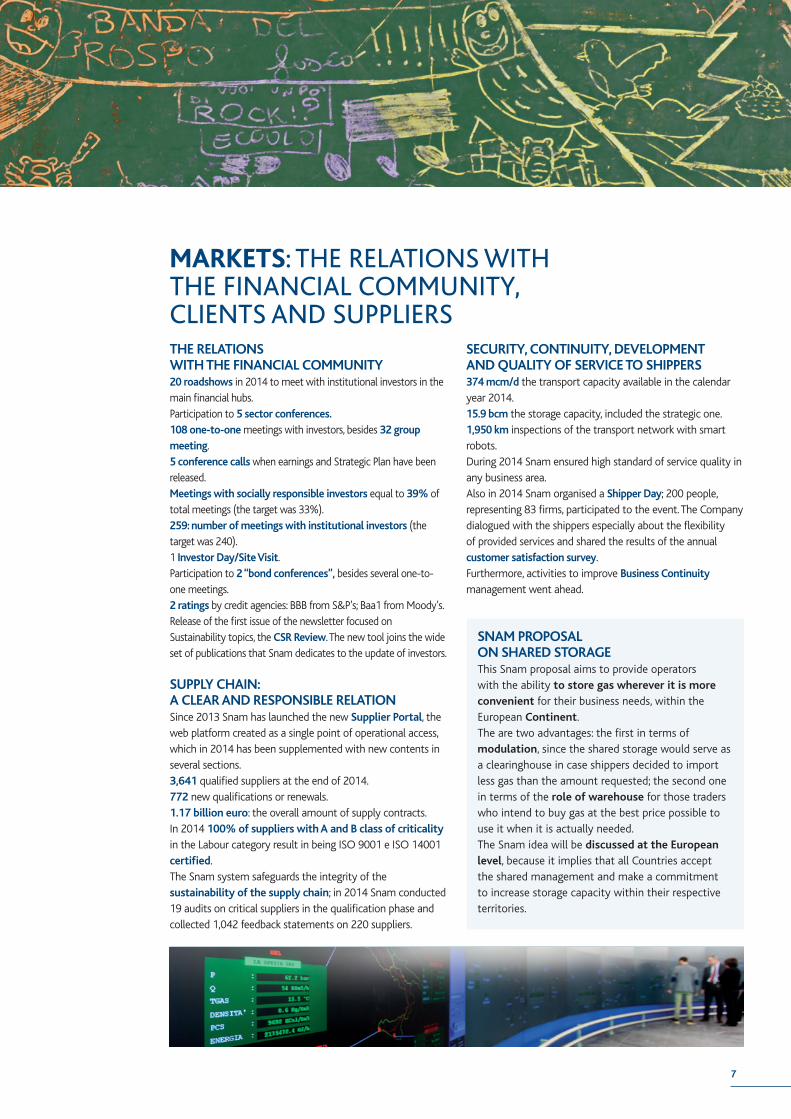
MARKETS: THE RELATIONS WITHTHE FINANCIAL COMMUNITY, CLIENTS AND SUPPLIERSTHE RELATIONS WITH THE FINANCIAL COMMUNITY20 roadshows in 2014 to meet with institutional investors in the main financial hubs.Participation to 5 sector conferences.108 one-to-one meetings with investors, besides 32 group meeting.5 conference calls when earnings and Strategic Plan have been released.Meetings with socially responsible investors equal to 39% of total meetings (the target was 33%).259: number of meetings with institutional investors (the target was 240).1 Investor Day/Site Visit.Participation to 2 “bond conferences”, besides several one-to-one meetings.2 ratings by credit agencies: BBB from S&P’s; Baa1 from Moody’s.Release of the first issue of the newsletter focused on Sustainability topics, the CSR Review. The new tool joins the wide set of publications that Snam dedicates to the update of investors.
SUPPLY CHAIN: A CLEAR AND RESPONSIBLE RELATIONSince 2013 Snam has launched the new Supplier Portal, the web platform created as a single point of operational access, which in 2014 has been supplemented with new contents in several sections.3,641 qualified suppliers at the end of 2014.772 new qualifications or renewals.1.17 billion euro: the overall amount of supply contracts.In 2014 100% of suppliers with A and B class of criticality in the Labour category result in being ISO 9001 e ISO 14001 certified.The Snam system safeguards the integrity of the sustainability of the supply chain; in 2014 Snam conducted 19 audits on critical suppliers in the qualification phase and collected 1,042 feedback statements on 220 suppliers.
SECURITY, CONTINUITY, DEVELOPMENT AND QUALITY OF SERVICE TO SHIPPERS374 mcm/d the transport capacity available in the calendar year 2014.15.9 bcm the storage capacity, included the strategic one.1,950 km inspections of the transport network with smart robots.During 2014 Snam ensured high standard of service quality in any business area. Also in 2014 Snam organised a Shipper Day; 200 people, representing 83 firms, participated to the event. The Company dialogued with the shippers especially about the flexibility of provided services and shared the results of the annual customer satisfaction survey.Furthermore, activities to improve Business Continuity management went ahead.
SNAM PROPOSAL ON SHARED STORAGEThis Snam proposal aims to provide operators with the ability to store gas wherever it is more convenient for their business needs, within the European Continent. The are two advantages: the first in terms of modulation, since the shared storage would serve as a clearinghouse in case shippers decided to import less gas than the amount requested; the second one in terms of the role of warehouse for those traders who intend to buy gas at the best price possible to use it when it is actually needed.The Snam idea will be discussed at the European level, because it implies that all Countries accept the shared management and make a commitment to increase storage capacity within their respective territories.
7

Infrastructure sustainabilitySnam builds and manages its own infrastructure ensuring that establishments are environmentally compatible, also aiming to favour their acceptance by stakeholders. During 2014, 127 meetings were held with local governments and regional associations to present new projects. Donations, sponsorships and local initiatives amounted to 765,000 euro.
Environmental managementSnam is committed to minimise the environmental impacts generated by its activities. The responsibility for implementing the policy of environmental management is shared by the “HSEQ” Corporate Department, which focuses on the functions of coordination and general guidance for the entire Group, and the “HSEQ” structures of the individual companies that have the tasks of specifi c guidance and support for the relative operating units. During 2014 the environmental expenses amounted to 170.1 million euro, of which 155.1 million euro for investments and 15 million euro for management costs.
BiodiversitySnam has always considered it a priority to safeguard the natural value of local areas in which new works are executed. Preliminary investigations on the local areas allow to implement the most appropriate design choices for reducing the impact on biodiversity; once works have been completed, Snam carries out environmental restorations, followed by monitoring for the most signifi cant habitat.
Greenhouse gases and energy effi ciencyThe greenhouse gases (GHG) emitted into the atmosphere by the activities of Snam are carbon dioxide (CO
2) and methane (CH
4).
In addition to using natural gas as its main fuel – with the advantage of a combustion producing less CO
2 than oil products and coal - Snam is
implementing a series of Energy Management initiatives in order to minimise natural gas emissions and energy consumptions, on top of using energy produced by renewable sources. In 2014 total GHG emissions (direct Scope 1, indirect Scope 2 and Scope 3) were approximately 2.34 million tons (-9.1% vs. 2013); direct CO
2eq
emissions (Scope 1) presented a decrease of 203,000 tons (-9.3%).
In 2014 direct natural gas emissions fell by 3.8% compared to 2013, reaching 95.0 Mm3.In 2014 energy consumption was equal to 8,858 TJ (a reduction of 22.8% compared to 2013), 93.8% of which being represented by natural gas. Renewable-source plants of Snam are represented by 1 wind generator and 951 photovoltaic plants. The total energy produced increased signifi cantly, rising from around 202,000 kWh in 2013 to 477,000 kWh in 2014 (+136%); said increase is due both to the 149 plants installed in 2014 and to the connection of plants installed in previous years and that in 2013 had not been connected to the network yet.
In the area of Energy Management, activities aimed to streamline and contain energy consumptions continued, such as improving the energy effi ciency of the gas powered turbines, installing photovoltaic systems in buildings and network plants, adopting LED lightbulbs and automated regulators for lighting plants and installing more effi cient heat generators. As regards Key Performance Indicators, since all energy targets set in 2010 have been accomplished a year in advance, 14 new performance indicators have been established in various corporate sectors in order to provide continuity to the monitoring of initiatives carried out.
LOCAL AREAS AND ENVIRONMENTThe safeguard of the environment is at the heart of Snam investment decisions: Snam follows an approach aimed to combine environmental policies and economic development.
(network km) 2012 2013 2014
Restorations 193 131 78
Reforestation 6 22 16
Plantcare 158 135 124
Environmental monitoring 830 1,063 1,055
Breakdown of 2014 Environmental Expenses
n Climate and air protection
n Soil and subsoil protection
n Landscape and biodiversity protection
n Other environmental activities
n Waste management
43.3%
2.5%
10.8%
37.7%5.7%
TOTAL GHG EMISSIONS - SCOPE 1 (103t)
2,300 -
2,200 -
2,100 -
2,000
2,2342,181
1,978
2012 2013 2014
8
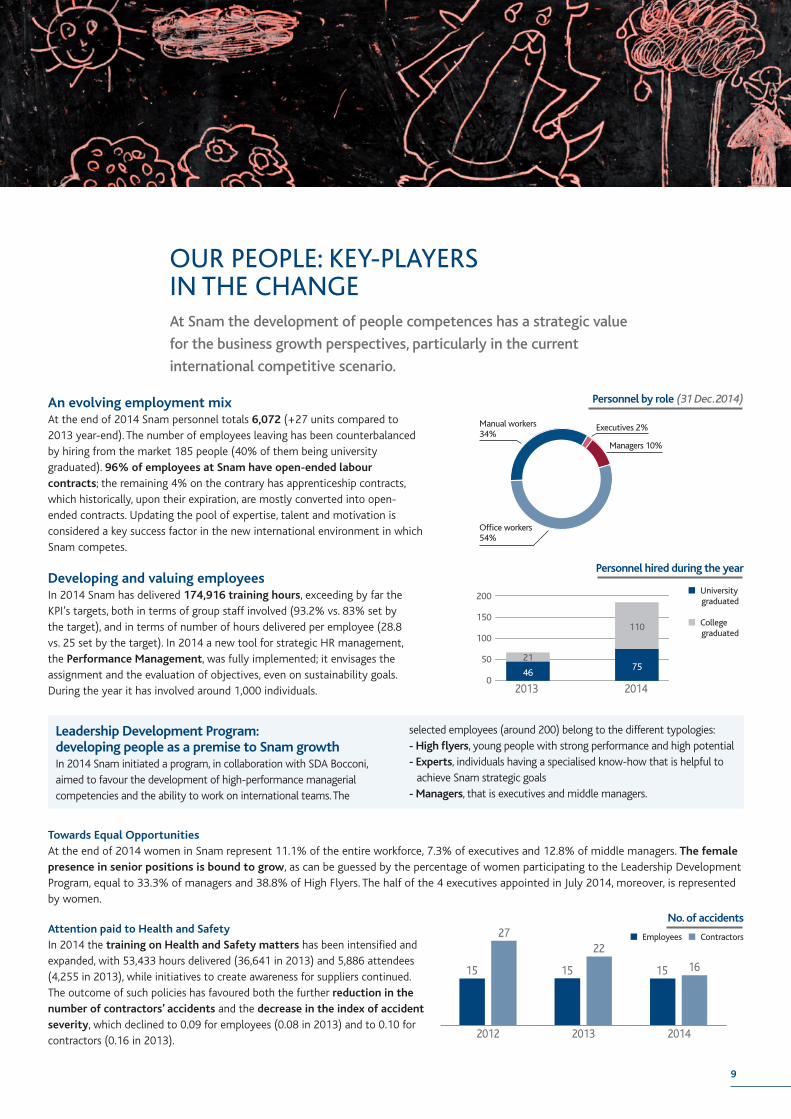
An evolving employment mixAt the end of 2014 Snam personnel totals 6,072 (+27 units compared to 2013 year-end). The number of employees leaving has been counterbalanced by hiring from the market 185 people (40% of them being university graduated). 96% of employees at Snam have open-ended labour contracts; the remaining 4% on the contrary has apprenticeship contracts, which historically, upon their expiration, are mostly converted into open-ended contracts. Updating the pool of expertise, talent and motivation is considered a key success factor in the new international environment in which Snam competes.
Developing and valuing employeesIn 2014 Snam has delivered 174,916 training hours, exceeding by far the KPI’s targets, both in terms of group staff involved (93.2% vs. 83% set by the target), and in terms of number of hours delivered per employee (28.8 vs. 25 set by the target). In 2014 a new tool for strategic HR management, the Performance Management, was fully implemented; it envisages the assignment and the evaluation of objectives, even on sustainability goals. During the year it has involved around 1,000 individuals.
Leadership Development Program: developing people as a premise to Snam growthIn 2014 Snam initiated a program, in collaboration with SDA Bocconi, aimed to favour the development of high-performance managerial competencies and the ability to work on international teams. The
selected employees (around 200) belong to the different typologies:- High flyers, young people with strong performance and high potential- Experts, individuals having a specialised know-how that is helpful to
achieve Snam strategic goals- Managers, that is executives and middle managers.
Towards Equal OpportunitiesAt the end of 2014 women in Snam represent 11.1% of the entire workforce, 7.3% of executives and 12.8% of middle managers. The female presence in senior positions is bound to grow, as can be guessed by the percentage of women participating to the Leadership Development Program, equal to 33.3% of managers and 38.8% of High Flyers. The half of the 4 executives appointed in July 2014, moreover, is represented by women.
Attention paid to Health and SafetyIn 2014 the training on Health and Safety matters has been intensified and expanded, with 53,433 hours delivered (36,641 in 2013) and 5,886 attendees (4,255 in 2013), while initiatives to create awareness for suppliers continued. The outcome of such policies has favoured both the further reduction in the number of contractors’ accidents and the decrease in the index of accident severity, which declined to 0.09 for employees (0.08 in 2013) and to 0.10 for contractors (0.16 in 2013).
OUR PEOPLE: KEY-PLAYERSIN THE CHANGEAt Snam the development of people competences has a strategic value
for the business growth perspectives, particularly in the current
international competitive scenario.
Personnel by role (31 Dec.2014)
Executives 2%
Managers 10%
Office workers 54%
Manual workers 34%
Personnel hired during the year
No. of accidents
n Employees n Contractors
n University graduated
n College graduated
2012
15 15 15 16
2722
2013 2014
0
50
150
100
200
2013 2014
21
110
4675
9

The Report is prepared in accordance with the most recent version of the Reporting Guidelines, GRI-G4, published in May 2013. The self-declared level of adherence of the Snam Report to the G4 standard is “in accordance – comprehensive”, on the basis of the coverage of the “Standard Disclosure” and indicators associated with the material aspects. With regard to the internal scope, material aspects are related to the different business activities on the basis of their relevance and signifi cance. Concerning the external
scope, the analysis assessed the degree of the stakeholders’ impact on the material topics identifi ed by Snam and viceversa. In the coming years, Snam is committed to broaden the reporting scope to the current “G4-omissions”, concerning the material topics for which the reporting has not been extended to the external scope yet.The document publication, simultaneous with that of the consolidated fi nancial statements, follows the approval by the Snam Board of Directors on 11 March 2015.
The Report was subjected to an external audit by the company Reconta Ernst & Young based on the principles and guidelines of the International Standard on Assurance Engagements (ISAE 3000) issued by the International Auditing and Assurance Standards Board (IAASB).
Sustainability Report 2014
THE 2014 SUSTAINABILITY REPORTThe Report was drafted according to the most advanced methodology and verifi ed by a long-range external assurance process. Such an approach allows a thorough evaluation of Snam sustainability performances and enables comparison with other Companies following GRI guidelines.
2012 2013 2014
Employees (no.) 6,051 6,045 6,072Executives (no.) 115 116 124Managers (no.) 560 579 602Offi ce workers (no.) 3,257 3,271 3,280Manual workers (no.) 2,119 2,079 2,066Men (no.) 5,400 5,386 5,397Women (no.) 651 659 675Women/men pay differential (executive category) 1.03 1.04 0.91Women/men pay differential (manager category) 0.95 0.95 0.95Women/men pay differential (offi ce worker category) 0.92 0.92 0.93Employee average age (years) 49 49 48Seniority (years) 23 24 24Recruitment during the year from the market (no.) 47 67 185Other incoming employees (from eni, non-consolidated companies, etc.) (no.) 52 16 213Percentage of university graduates hired (%) 57.4 68.7 40.5Departures during the year (no.) 160 89 371Contractor accident severity index 0.29 0.16 0.10Hours of training (no.)1 160,771 198,357 174,916Hours of training/Employees 26 33 29Hours of training on health and safety matters (no.) 1 26,959 34,641 53,433Hours of training on environmental matters (no.) 1 1,901 1,970 478TotalHSEQauditsperformed(no.) 380 312 314Environmental investigations (no.) 272 260 532
Social performance – Main data
1 – 2014 data do not include A.E.S. (Azienda Energia e Servizi Torino S.p.A.), wholly-owned subsidiary of Italgas since 1 July 2014
10

(million euro) 2012 2013 2014
Total revenue 3,621 3,529 3,566Operating costs 804 726 790EBIT 2,111 2,034 1,973Net profit 779 917 1,198Technical investments 1,300 1,290 1,313Net invested capital at 31 December 18,314 19,320 20,824Shareholders’ equity including minority interests 5,916 5,994 7,172Group shareholders’ equity at 31 December 5,915 5,993 7,171Net financial debt at 31 December 12,398 13,326 13,652Free Cash Flow -390 -92 297Market capitalisation 11,893 13,655 14,383Dividends paid during the period 811 845 507Environmental expenses 1 123.6 166.6 170.1Health and safety expenses 1 44.2 51.7 43.8
2012 2013 2014
Energy consumption (TJ) 12,801 11,467 8,858Natural gas emissions (106 m3) 98.4 98.8 95.0GHG emissions scope 1-2-3 (103 t CO2eq) 2,631 2,574 2,341GHG emissions scope 1 (103 t CO2eq) 2,234 2,181 1,978GHG emissions scope 2 (103 t CO2eq) 33.1 32.2 31.5GHG emissions scope 3 (103 t CO2eq) 360 261 333NOx emissions (t) 985 837 497CO emissions (t) 363 327 265Total waste production (t) 31,865 61,217 57,819Non-hazardous waste production (t) 30,117 58,039 54,144Hazardous waste production (t) 1,748 3,178 3,676Waste recovered from production activities (%) 47 96 54Freshwater procurement (103 m3) 460 281 339Freshwater discharged (103 m3) 199 188 258Sea water procurement (103 m3) 4,000 4,000 4,000Sea water discharged (103 m3) 4,000 4,000 4,000Snam Group CO2 emissions/energy used (kg/GJ) 54.0 54.3 54.0NOx emissions/energy used (kg/GJ) 0.077 0.073 0.056Natural gas transport Energy consumption/energy compressed (%) 0.27 0.25 0.23CO2 emissions/gas compressed (kg/106 m3) 5,991 5,834 5,941Natural gas emissions/km of network (m3/km) 1,288 1,238 1,151NOx emissions/gas compressed (kg/106 m3) 8.3 7.5 6.3Average rated turbine NOx emissions/total installed capacity ([mg/Nm3]/MW) 5.9 5.7 5.4DLE turbine hours of operation/total turbine hours of operation (%) 75 76 87Liquefied natural gas regassification Energy consumption/LNG injected into the network 1.44 (*) (*)CO2eq emissions/LNG injected into the network – (kg/106 m3) 47,553 (*) (*)Natural gas storage Natural gas emissions for storage/gas stored (%) 0.070 0.061 0.067NOx emissions/gas stored (kg/106 m3) 45.6 39.1 28.0Average rated turbine NOx emissions/total installed capacity ([mg/Nm3]/MW) 13.60 9.6 6.2Natural gas distribution Natural gas emissions/km of network (m3/km) 840 828 813CO2eq emissions/gas distributed (kg/106 m3) 96,000 97,712 111,475
Economic performance – Main data
Environmental performance – Main data
1 – 2014 data do not include A.E.S. (Azienda Energia e Servizi Torino S.p.A.), wholly-owned subsidiary of Italgas since 1 July 2014(*) Data not significant due to reduced regasification activity
11

Contacts:Snam S.p.A - Sustainability Piazza Santa Barbara, 720097 San Donato Milanese (MI)Website: www.snam.itTel +39.0237031
To gain greater knowledge:www.snam.it/eng/sustainability/
We welcome your comments and suggestions. Please send them to:[email protected] to [email protected]
The network that respects the future.