Sustainability at The Coca-Cola Company - CEPI · Sustainability at The Coca-Cola Company Water...
19
Sustainability at The Coca-Cola Company Water Stewardship Strategies Ulrike Sapiro, CR Director Environment, The Coca-Cola Company, Europe Group
Transcript of Sustainability at The Coca-Cola Company - CEPI · Sustainability at The Coca-Cola Company Water...

Sustainability at The Coca-Cola Company
Water Stewardship Strategies
Ulrike Sapiro, CR Director Environment, The Coca-Cola Company, Europe Group

We are the world’s largest nonalcoholic beverage companywith the world’s most recognized brand.
Coca-Cola Who?

On a global scale – as a local business
200+
400
1,600,000,000
300
1,000
Countries we operate in
Number of brands, worldwide
Servings per day
Franchise bottling partners
Manufacturing plants
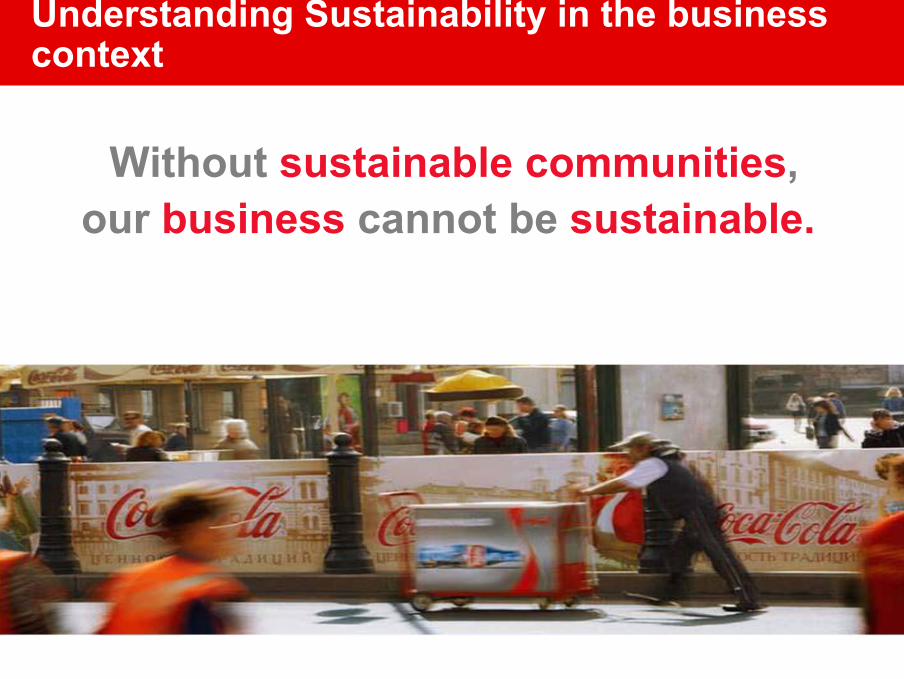
Without sustainable communities, our business cannot be sustainable.
Understanding Sustainability in the business context


Our Water Goal:To safely return to communities and nature an amount
of water equivalent to what we use in all of our products and their production.

REDUCE
Goal: Be the most efficient water user among peer companies. Improve water use efficiency by 20% by 2012 (baseline 2004).
Working in our Operations
RECYCLE
Goal: Align our entire global system with stringent internal wastewater treatment standards. (100% compliance by the end of 2010.)

REPLENISH
Goal: Expand global support of healthy watersheds and sustainable community water partnerships.
Progress: We’re involved in more than 200 community water partnerships in 60 countries to help protect and conserve water resources and improve access to safe water and sanitation.
Working in our Watersheds and Communities
Courtesy of the WWF Danube-Carpathian ProgramDanube River on the Romanian/Bulgarian border. Batin Islands. BulgariaCopyright© Anton VORAUER / WWF-Canon

Lending our voice to the global water policy debate
UN Global Compact’s CEO Water Mandate
World Economic Forum
Global Water Challenge
World Water Forum
Water Footprinting Network

Water Footprinting is a measurement tool to assess the total water use (in volume) of products.
Source: DIE ZEIT, June 09, Golden Section Graphics
A New Dimension: Water Footprinting (WFP)
Source: Hoekstra/Chapagain
What else do we need to know:Which type of water do we use (ground, fossil, rain, surface)?
Where and When is the water used?
What is the impact of the use?
Coca-Cola have helped to set up the Water Footprint Network (WFN) to figure out together with others, how to calculate water footprints and to prioritise areas for action.

Why Water Footprinting?
Part of our commitment to the CEO Water Mandate:To encourage suppliers to improve their water conservation, quality monitoring, wastewater treatmentTo build capacities to analyze and respond to watershed riskTo encourage facilities and suppliers in conducting assessments of water usage and impactsTo share water sustainability practices
Helps to focus on critical areas of greatest impact and to target actions and investment effectively
Assessment of future supply chain risks (availability and quality of water; exposure to future water challenges)
Build awareness of the issues, to generate debate and external engagement

How does WFP change our understanding of water use?
NB: Water use beyond Manufacturing is negligible for a Coca-Cola product
Direct operational water use
Total water footprint
CCC has focused its Water Stewardship Strategy on direct water use, i.e. reducing and recycling water use in our manufacturing processes, protecting our watersheds and helping communities.
ater Footprinting brings in a new and additional dimension: the water we use indirectly, which is embedded in the agricultural products and ingredients we buy or in producing the packaging we need.
e have started on a journey to expand our understanding about these broader impacts and work with stakeholders to manage them in a sustainable way.
Indirect water use in the supply chain

ObjectiveUnderstand a typical Coca-Cola Water Footprint and its key impacts Advance the water footprinting methodology and impact assessment of the Water Footprints
ScopeProduct-specific: water footprint for a 0.5 litre regular Coca-Cola, in a PET bottleLocation-specific: Dongen, The Netherlands
Water Footprint approachSupply Chain Water + Operational Water Footprint blue, green and grey water categorisation
Impact AssessmentAssess local impacts of different water uses
First Water Footprinting Pilot Project
Project Partners:University of Twente
The Coca-Cola Company, Coca-Cola Enterprises

First Breakdown of a Coca-Cola Water Footprint
Preliminary Results based on current methodology and assumptions
What did we learn?
15
Supply ChainAgricultural inputs are largest contributors to Water footprint
Sweeteners (cane, beet, corn)Green water (rain) significant, but not actionableBlue water irrigation location specificGrey water from agrichemicals, limited data
Working with suppliers and other companies is crucial to understand local situation and opportunities in:
Irrigated agriculture (blue water)Pesticides, fertiliser, cooling (grey water)
Agriculture related issues go beyond water – include environmental and social issues
OperationsEffective wastewater treatment delivers real benefits and can reduce grey water to zeroIn-plant water efficiency improvements are not visible in WF
3015
10
5
3315
3115
168
2312
3817
1911
Limburg
Oost-Brabant
Gelderland
Noordelijk dal/
Noordelijk zand
Noordelijke klei
Noordoostpolder
Noord en Zuid-Holland
West-Brabant
Zeeuwse-Eilanden
Zeeuws-Vlaanderen
Oost en Zuid Flevoland
191123
13
2914
188
3015
3015
10
5
3315
3315
3115
3115
168 168
2312
2312
3817
3817
1911 1911
Limburg
Oost-Brabant
Gelderland
Noordelijk dal/
Noordelijk zand
Noordelijke klei
Noordoostpolder
Noord en Zuid-Holland
West-Brabant
Zeeuwse-Eilanden
Zeeuws-Vlaanderen
Oost en Zuid Flevoland
1911 191123
1323
13
2914
2914
188
188
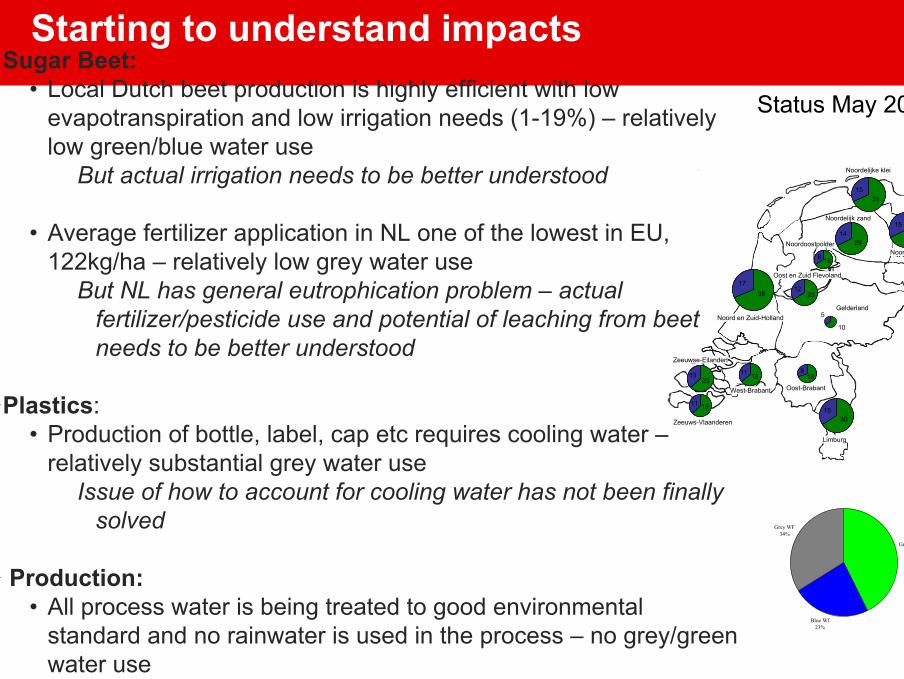
Sugar Beet:• Local Dutch beet production is highly efficient with low
evapotranspiration and low irrigation needs (1-19%) – relatively low green/blue water use
But actual irrigation needs to be better understood
• Average fertilizer application in NL one of the lowest in EU, 122kg/ha – relatively low grey water use
But NL has general eutrophication problem – actual fertilizer/pesticide use and potential of leaching from beet needs to be better understood
Plastics:• Production of bottle, label, cap etc requires cooling water –
relatively substantial grey water useIssue of how to account for cooling water has not been finally
solved
Production:• All process water is being treated to good environmental
standard and no rainwater is used in the process – no grey/green water use
• Only water use impact from production is the blue water in the
Starting to understand impacts
Green Wf43%
Blue Wf23%
Grey WF34%
Status May 2009

Defining a common methodology is critical
17
Scope and methodology of WFP accounting are under discussion and stakeholders take different approaches, notably:- If/How to account for pollution in volume terms (grey)- If/how to account for Rainwater use (green/net green)
Different approaches bring about different results.± 76%

What next?
18
Next Steps
Continue to work on WFPs for key commodities: juice product(s); and nutritive sweeteners – sugar beet, sugarcane, high fructose corn syrup
Reach out to our suppliers, in particular for agricultural commodities, to work together
Continue to engage with stakeholders to engage wider industry and to develop methodologies further:
WFN partners to share experiencesWWF, TNC , others to understand impacts and quantify restoration activitiesCEO Water Mandate, AIM Progress, Suppliers, others to collaborate on mitigation strategiesBSI, SAI, Keystone Center to address wider agriculture sustainability challenges
18