Sustainability and equity aspects of total sanitation … and equity aspects of total sanitation...
47
Report Sustainability and equity aspects of total sanitation programmes A study of recent WaterAid-supported programmes in Nigeria
Transcript of Sustainability and equity aspects of total sanitation … and equity aspects of total sanitation...

Report
Sustainability and equity aspects of total sanitation programmesA study of recent WaterAid-supported programmes in Nigeria

Glossary and abbreviations . . . . . . . . . . . . . . . . . . . . . . . . . . . . . . . . . . . . . . . . . . . . . . . . . . . . . . . . . . . . 2
Executive summary . . . . . . . . . . . . . . . . . . . . . . . . . . . . . . . . . . . . . . . . . . . . . . . . . . . . . . . . . . . . . . . . . . . . . . . . 3
1 Introduction . . . . . . . . . . . . . . . . . . . . . . . . . . . . . . . . . . . . . . . . . . . . . . . . . . . . . . . . . . . . . . . . . . . . . . . . . . . . . . . . . . 11
2 Objectives . . . . . . . . . . . . . . . . . . . . . . . . . . . . . . . . . . . . . . . . . . . . . . . . . . . . . . . . . . . . . . . . . . . . . . . . . . . . . . . . . . . . 12
3 Overview of study plan. . . . . . . . . . . . . . . . . . . . . . . . . . . . . . . . . . . . . . . . . . . . . . . . . . . . . . . . . . . . . . . . . . 13
4 Sanitation sub-sector in Nigeria . . . . . . . . . . . . . . . . . . . . . . . . . . . . . . . . . . . . . . . . . . . . . . . . . . . . 15
5 WaterAid in Nigeria sanitation programme . . . . . . . . . . . . . . . . . . . . . . . . . . . . . . . . . . 225.1 Background in Nigeria . . . . . . . . . . . . . . . . . . . . . . . . . . . . . . . . . . . . . . . . . . . . . . . . . . . . . . . . 225.2 First CLTS pilot project (four communities) . . . . . . . . . . . . . . . . . . . . . . . . . . 235.3 Review of first CLTS pilot project . . . . . . . . . . . . . . . . . . . . . . . . . . . . . . . . . . . . . . . . . . 235.4 Second CLTS pilot project (24 communities) . . . . . . . . . . . . . . . . . . . . . . . . 245.5 CLTS evaluation (2007) . . . . . . . . . . . . . . . . . . . . . . . . . . . . . . . . . . . . . . . . . . . . . . . . . . . . . . . . 245.6 Sanitation data provided for the current study . . . . . . . . . . . . . . . . . . . . 255.7 Features of CLTS in Nigeria . . . . . . . . . . . . . . . . . . . . . . . . . . . . . . . . . . . . . . . . . . . . . . . . . . 27
6 Fieldwork . . . . . . . . . . . . . . . . . . . . . . . . . . . . . . . . . . . . . . . . . . . . . . . . . . . . . . . . . . . . . . . . . . . . . . . . . . . . . . . . . . . . 306.1 Methodology . . . . . . . . . . . . . . . . . . . . . . . . . . . . . . . . . . . . . . . . . . . . . . . . . . . . . . . . . . . . . . . . . . . . . . 34
7 Findings and analysis . . . . . . . . . . . . . . . . . . . . . . . . . . . . . . . . . . . . . . . . . . . . . . . . . . . . . . . . . . . . . . . . . . 397.1 Community boundaries . . . . . . . . . . . . . . . . . . . . . . . . . . . . . . . . . . . . . . . . . . . . . . . . . . . . . . 397.2 Cultural issues . . . . . . . . . . . . . . . . . . . . . . . . . . . . . . . . . . . . . . . . . . . . . . . . . . . . . . . . . . . . . . . . . . . . 427.3 Initial conditions: basic services . . . . . . . . . . . . . . . . . . . . . . . . . . . . . . . . . . . . . . . . . . 437.4 Socio-economic status . . . . . . . . . . . . . . . . . . . . . . . . . . . . . . . . . . . . . . . . . . . . . . . . . . . . . . . . 457.5 CLTS process . . . . . . . . . . . . . . . . . . . . . . . . . . . . . . . . . . . . . . . . . . . . . . . . . . . . . . . . . . . . . . . . . . . . . . 487.6 Open defecation status . . . . . . . . . . . . . . . . . . . . . . . . . . . . . . . . . . . . . . . . . . . . . . . . . . . . . . 487.7 Child excreta disposal . . . . . . . . . . . . . . . . . . . . . . . . . . . . . . . . . . . . . . . . . . . . . . . . . . . . . . . . 527.8 Equity . . . . . . . . . . . . . . . . . . . . . . . . . . . . . . . . . . . . . . . . . . . . . . . . . . . . . . . . . . . . . . . . . . . . . . . . . . . . . . . . 537.9 Latrine use and maintenance . . . . . . . . . . . . . . . . . . . . . . . . . . . . . . . . . . . . . . . . . . . . . . 577.10 Hygienic latrines . . . . . . . . . . . . . . . . . . . . . . . . . . . . . . . . . . . . . . . . . . . . . . . . . . . . . . . . . . . . . . . . 607.11 Sustainability of sanitation outcomes . . . . . . . . . . . . . . . . . . . . . . . . . . . . . . . . . . 637.12 Programmatic issues . . . . . . . . . . . . . . . . . . . . . . . . . . . . . . . . . . . . . . . . . . . . . . . . . . . . . . . . . . 657.13 Cost of sanitation outcomes . . . . . . . . . . . . . . . . . . . . . . . . . . . . . . . . . . . . . . . . . . . . . . . . 67
Running head
1Sustainability and equity aspects of total sanitation programmes
A WaterAid reportJune 2009Written by: Andy RobinsonFront cover image: WaterAid/Suzanne Porter
Contents

WaterAid has been closely linked with Community-led Total Sanitation (CLTS) sincethe development of the approach in Bangladesh by the Village Education ResourceCentre (VERC) in early 2000. WaterAid’s own body of experience includes severalvariants of the CLTS approach with common elements:
a) working with the entire community rather than with selected individuals andhouseholds
b) focusing on the elimination of open defecation rather than on latrine construction.
This report summarises research conducted in Nigeria as part of a study into thesustainability and equity of Total Sanitation programmes supported by WaterAid in Bangladesh, Nepal and Nigeria. The central research hypothesis examined by the study was:
Where possible, the study also explored the additional factors that enhance theprobability that ODF status translates into entrenched behaviour change, as well as the capacity of communities to move onwards up the ‘sanitation ladder’.
Research sampling and methodologyThe research design envisaged the selection of study communities as coming fromthe set of programme villages where WaterAid and its partners have carried outcommunity-wide ODF sanitation programmes and ‘where the period since theintervention is as long as possible’.
WaterAid introduced CLTS into its sanitation programmes in Nigeria in 2005, and forthis reason had covered only 98 communities at the time of the research. Excludingcommunity interventions started in the 2007-08 financial year, 44 project communitiesremained as the sample frame for the study.
Running head
3Sustainability and equity aspects of total sanitation programmes
8 Conclusions . . . . . . . . . . . . . . . . . . . . . . . . . . . . . . . . . . . . . . . . . . . . . . . . . . . . . . . . . . . . . . . . . . . . . . . . . . . . . . . . . . 74
9 Recommendations . . . . . . . . . . . . . . . . . . . . . . . . . . . . . . . . . . . . . . . . . . . . . . . . . . . . . . . . . . . . . . . . . . . . . . . . 78
References . . . . . . . . . . . . . . . . . . . . . . . . . . . . . . . . . . . . . . . . . . . . . . . . . . . . . . . . . . . . . . . . . . . . . . . . . . . . . . . . . . 80
Annex A – Checklist for interviews with Wes Units . . . . . . . . . . . . . . . . . . . . . . . . 81
Annex B – Checklist for focus group discussions . . . . . . . . . . . . . . . . . . . . . . . . . . 83
Annex C – Research tools: example of community form . . . . . . . . . . . . . . . . 85
Annex D – Background data . . . . . . . . . . . . . . . . . . . . . . . . . . . . . . . . . . . . . . . . . . . . . . . . . . . . . . . . . . 86
Glossary and abbreviationsCLTS Community-led Total Sanitation
DHS Demographic and Health Survey
EU European Union
FGD Focus Group Discussion
FGN Federal Government of Nigeria
FMAWR Federal Ministry of Agriculture and Water Resources
JMP Joint Monitoring Programme for Water Supply and Sanitation (WHO-UNICEF)
LEEDS LGA Economic Empowerment Development Strategy
LGA Local Government Authority
MDG Millennium Development Goal
NEEDS National Economic Empowerment Development Strategy
NTGS National Task Group on Sanitation
ODF Open Defecation Free
RWASSA Rural Water Supply and Sanitation Agencies
SEEDS State Economic Empowerment Development Strategy
UNICEF United Nations Children’s Fund
VERC Village Education Resource Centre (Bangladesh NGO)
WASCOM Water and Sanitation Committee
WASH Water, Sanitation and Hygiene (Sector)
WASCOM Water and Sanitation Committee
WASU Water and Sanitation Units
WES Unit Water and Environmental Sanitation Unit (Local government)
WHO World Health Organisation
Running head
2 Sustainability and equity aspects of total sanitation programmes
Executive summary
Achieving ODF status is a necessary but not sufficient condition for the entirecommunity to use and maintain hygienic latrines in the long-term

The research found that only one of the three ODF communities had remained open defecationfree. Heavy rains during the research period caused the collapse and abandonment of latrinepits in Efopu-Ekile, and the research in Duhuwa revealed that, while only one Hausa housholdhad reverted to open defecation, very few of the semi-nomadic Fulani households had everbuilt or used latrines.
Open defecation status among non-ODF communities
Key: OD% = percentage of households practicing open defecation, hhds = households
In the other five study communities, the proportion of households practising opendefecation was generally higher than expected in the median-performing communities,and marginally lower than expected in the low-performing communities.
Equity of sanitation outcomesThe data confirmed relatively equitable outcomes in the three high-performingcommunities: there was no open defecation among disadvantaged households ineither Igba or Efopu-Ekile; and the open defecation rate was only 9% higher amongthe disadvantaged households in Duhuwa. However, the disadvantaged householdsfare less well in the median and low performing cases, with open defecation rates 26%to 59% higher among disadvantaged households than in the rest of the community.
Given that the baseline (pre-intervention) latrine coverage in these communities was largely among rich and middle-income households, it seems likely that thesedifferentials in open defecation rates reflect the starting conditions, with muchhigher open defecation among the poor and disadvantaged, thus that the successfulsanitation interventions have had a significant impact on open defecation ratesamong these disadvantaged groups.
In the high-performing communities, the data also suggested that the disadvantagedhouseholds had generally built similar latrines to those built by the bottom 35% to45% of the community, and had maintained them to a similar standard. While thelatrines built in these communities were fairly basic, these observations suggest that the interventions provide similar opportunities to all income groups, and thatlow-income households are not prejudiced by their lack of resources.
Executive summary
5Sustainability and equity aspects of total sanitation programmes
These 44 project communities were grouped into three categories:
� High performers (latrine coverage > 95%)
� Median performers (30% < latrine coverage < 95%)
� Low performers (latrine coverage <30%).
Three communities were randomly selected from the high performing groups; two communities from the median; and a further three communities from the lowperformers, making a total of eight research communities ( 8% of the total numberof CLTS communities in Nigeria).
In these eight communities, more than 200 household sanitation facilities wereobserved in order to determine proxy indicators of the following:
� Use and maintenance of latrines
� Hygienic status of latrines
� Long term use, repair and replacement of latrines
The observation findings were verified through key informant interviews and Focus Group Discussions (FGDs). In addition, the observation surveys sampleddisadvantaged households and special case (open defecation, collapsed latrineowning) households to assess any differential outcomes among these groups.
Sustainability of sanitation behaviour changePrior to the CLTS interventions, less than 20 percent of households were usinglatrines in all of the research communities except one;1 and neither of the two studycommunities in Jigawa state contained a single latrine. Following the CLTS interventions,three of the communities declared themselves open defecation free (ODF), while the remaining five communities reported between 11% and 86% latrine coverage.
Open defecation status among declared ODF communities
Key: OD% = percentage of households practicing open defecation, hhds = households.
Executive summary
4 Sustainability and equity aspects of total sanitation programmes
1 Igba in Benue State had 41% latrine coverage prior to the CLTS intervention
WaterAid Study Reasons forin Nigeria data open defecationdata
Community Performance State OD% OD%
Igba High Benue 0% 0% –
Efopu-Ekile High Benue 0% 18% Pit collapse, tenants
Duhuwa: High Jigawa 0% 31%Hausa (73 hhds) 1% Pit collapseFulani (71 hhds) 76% Mobility
WaterAid Study Reasons forin Nigeria data open defecationdata
Community Performance State OD% OD%
Mbagbor Median Benue 26% 38%
Molori: Median Jigawa 14% 71%Molori A (34 hhds) 56% 30% collapsed latrinesMolori B (34 hhds) 85% 34% collapsed latrines
Mbaazenger Low Benue 76% 49% 38 new latrines built
Amegu-Ada Low Enugu 79% 78% Only 3 new latrines built
Mburubu Low Enugu 90% 90% No new latrines

fly screen sealing the top of the vent pipe needs to be regularly checked: as a result,75% of the vent pipes in Igba were open; as were 55% of the vent pipes in Efopu-Ekile.Vent pipes attract flies (because of the smell of the exiting gases); open vent pipesprovide a ready fly entry and exit point, and are likely to encourage fly breedinginside the latrine pit.
Latrine use by new and in-migrant householdsAnother important indicator of collective sanitation behaviour (and outcomes) isthe response to new adult or in-migrant households. The data from the observationsurveys suggests that sustainability is good in the three high-performing communities(with the exception of the Fulani households in Duhuwa), as every new householdwas found to be either sharing an existing latrine or using its own latrine. Conversely,50% or more of new households in the low and median performing communities wasfound to be practicing open defecation.
Sanitation behaviour by those with collapsed latrinesThe rebuilding of collapsed latrines or latrine pits, or temporary use of a neighbour’slatrine, are good indicators of sustained sanitation behaviour change. Most of the pitcollapses were due to recent heavy rains, thus none of the households had had timeto rebuild or replace their latrines (although several of the households claimed thatthey would rebuild their latrine when the rainy season ended). In the high-performingcommunities, the majority of the households with collapsed latrines were sharingother people’s latrines; while in the low- and median-performing communities, everyhousehold with a collapsed latrine had reverted to open defecation.
Water supply impact on sanitation outcomesAmong the eight water supply projects in the study communities, only three areworking without problem. The WaterAid handpumps are non-functional in two othercommunities, the WES Unit has been unable to find water in another, and bothcommunities in Enugu complain that, while their handpumps are working, the waterquality is so poor that only a few households use them.
The benefits of an integrated water supply and sanitation approach are called intoquestion by the impact of the failed water supplies on the sanitation interventions.Several of the lower-performing communities stated that the water supply problemshad caused them to lose interest in the sanitation programme. In addition, all of thelatrines are dry (ie no water seal latrines), thus do not require water for flushing.These findings suggest that, even when operational, the water supply investmentshave had a limited impact on sanitation or hygiene behaviour improvements.
Sani-centres: rotating funds and facilities for sanitation improvementThe only successful sani-centre observed was in Duhuwa, where the sani-centre hasbecome the only store in the community, and continues to stock a wide range ofsanitary wares. However, even there, the sani-centre had supplied only four latrineslabs to the community. In all other cases, the sani-centre funds had been used to
Executive summary
7Sustainability and equity aspects of total sanitation programmes
Latrine typesAll of the latrines observed in the study communities were pit latrines. Out of the 109 latrines surveyed, only 5% were pour-flush toilets; fully 95% of the latrines weredry pit latrines. The latrine pit was usually covered with some form of slab. The majoritywere mud-covered timber slabs, with some concrete slabs observed where sani-centres were in operation; and a few slabs made from loose-fitting timber planks.
Shared latrinesShared latrines were common in the study communities. On average, 58% of allhouseholds that used a latrine were sharing it with at least one other household.Typically, shared latrines were used by between two and four households. In mostcases, because of compound household arrangements, the households sharing thelatrine were related to the household that built the latrine. In general, there was littledifference between the quality and hygiene of the shared latrines when compared toprivate household latrines. When questioned, most users of shared latrines notedthat the other households were part of the same family and that sharing the latrinewas therefore not a problem.
Maintenance: cleanliness of latrinesIn the five communities with the lowest open defecation rates, only three latrines out of 93 (3%) were found to be dirty. In the other three communities, seven of the15 latrines observed (47%) were found to be dirty. More than half of these dirtylatrines were constructed prior to the interventions, which suggests that the CLTSlatrines were at least as clean and well-maintained as the existing latrines.
Fly-proof latrinesVery few of the latrines observed in the study communities were fly-proof. During thesurvey, the latrine pits were inspected internally using a torch. In almost every case,the contents of the pit were covered with fly maggots and, in many cases, flies exitedfrom the pit when the cover was lifted. Clearly, this is a significant hygiene issue, as the latrine pits appear to be acting as fly-breeding sites in close proximity to thehome, with a substantial risk that flies will transfer pathogens directly from excretato food consumed by household members. Neither the facilitators nor the householdersappeared aware of the health hazard associated with flies in latrine pits.
Vent pipesThe WES Unit (Water and Environmental Sanitation Unit) in Ado LGA (Local GovernmentAuthority) (Benue State) had encouraged households in Igba and Efopu-Ekile to addvent pipes to their latrines. As a result, the sani-centres provided PVC vent pipesalong with the concrete domed slabs, and other households made their ownbamboo vent pipes.
Every household latrine in Efopu-Ekile had a PVC vent pipe, as did 48% of thelatrines in Igba. Unfortunately, neither the WES Unit nor the community memberswere aware that the gases that vent from pit latrines are extremely corrosive, and the
Executive summary
6 Sustainability and equity aspects of total sanitation programmes

excreta is separated from human contact, but the latrines are hard to keep clean,and generally unpleasant to use.
Unimproved latrines important for achieving ODFA lower proportion of improved latrines was found in the communities that hadlargely stopped open defecation. While this might suggest that reducing opendefecation leads to lower quality latrines, it demonstrates how CLTS allows poorhouseholds to build very low-cost latrines, provided that they stop open defecation.Without this approach, which gets poor households on the first rung of thesanitation ladder, it is extremely difficult to convince poor or disadvantagedhouseholds to build or use latrines.
Limited follow-up reducing sustainabilityThe current approach, with implementation financed by WaterAid but conductedalmost entirely by local government, allows no follow-up after the first year of theintervention. The local government WES Units confirmed that they are reluctant tovisit remote communities unless paid a travel allowance and, once the interventionfinishes, no funds are available for allowances.
The WES Units are relatively new institutions, with little experience of sanitationimprovement, and few incentives to do their jobs well. Moreover, the currentinstitutional arrangements provide little regular support from the WaterAidprogramme staff, other than a couple of training courses every year. This arrangementallows little monitoring of either the process or the outcomes, and is an importantfactor in the large variation in the quality and commitment of the WES Units.
The cost-effectiveness of the interventions could be improved. Similar interventionsin Asia cost approximately US$10 per household latrine, whereas the costs in Nigeriaaverage about $77 per latrine, with another $20 contributed by the household.Efforts need to be made to improve the efficiency of the process: to prune theunsuccessful elements, to monitor the relative cost-effectiveness of the variousactivities, and to focus on the core business of achieving collective sanitationoutcomes that have a real impact on the health and economy of the target communities.
Executive summary
9Sustainability and equity aspects of total sanitation programmes
purchase materials (mostly cement, sand and gravel) which had then been distributedto a small number of households without any charge. Only a handful of households(usually Water and Sanitation Committee (WASCOM) members) claimed to have paidfor the slabs given to them by the sani-centre, and most households using sani-centre slabs were unaware of the price that they were supposed to have paid.
Free latrine slabs were provided to almost every household in one small communitybut, in total, only 16 sani-centre slabs were in use in the other research communities.Therefore, each of the sani-centre slabs in use cost WaterAid in Nigeria aboutUS$300. The main people to benefit from the free slabs were community leaders and committee members, who were generally non-poor households.
WaterAid in Nigeria sanitation costsWaterAid in Nigeria provided data on its sanitation programmes from the centralfinancial system. In terms of cost-efficiency, the project cost per CLTS latrine iscurrently US$71. Almost half of this amount is consumed by support costs, with $31 per latrine reported for software costs. The total cost including externalexpenditures and household contributions is estimated at $98 per latrine, with 72% financed by WaterAid, 7% by other agencies (UNICEF and local government),and 20% contributed by the household itself.
ConclusionsThe WaterAid in Nigeria CLTS programme is only in its third year. As a result, some of the problems uncovered by this study are due, at least in part, to the early stageof the CLTS programme in Nigeria. It should also be noted that the research for thestudy took place in the middle of a severe rainy season. Several of the communitiesvisited were flooded; access roads were almost impassable; and both latrines andhouses were collapsing under the heavy rains.
In general, the CLTS process has been more successful in triggering sustained andequitable sanitation outcomes in the communities that achieved ODF status. Thesecommunities had a better understanding of the reasons for stopping open defecation,and seemed more concerned and upset when exceptions were uncovered. The non-ODF communities tended to have a far more relaxed approach to their sanitationsituation. Open defecation was not considered especially problematic, and therewas less sense of the need to achieve a collective sanitation outcome.
Little upgrading or innovation in latrine designThe research team found that only one household had upgraded its latrine. This findingappears to reflect a lack of technical innovation and knowledge sharing, which hasresulted in very few indigenous latrine designs emerging from the interventions.
Most of the latrines built under the CLTS programme were little different fromexisting traditional latrines; and there was very little variation between households –those that built new latrines tended to build identical models to those already usedby others in the community. As a result, many of the latrines are barely hygienic:
Executive summary
8 Sustainability and equity aspects of total sanitation programmes

WaterAid has been closely linked with Community-led Total Sanitation (CLTS) since thedevelopment of the approach in Bangladesh by the Village Education Resource Centre(VERC) in early 2000. A number of organisations and governments have since adopted,and adapted, the core elements of CLTS as organising principles for wider ruralsanitation programming. Nevertheless, most ‘total sanitation’ programming involves:
‘facilitating a process to inspire and empower rural communities to stopopen defecation and to build and use latrines’ Kar and Pasteur (2005)
WaterAid’s own body of experience includes several variants of the CLTS approach,but with common elements:
a) All approaches attempt to work with the entire community rather than withselected individuals and households
b) The focus is always on the elimination of open defecation rather than on theconstruction of a particular type of latrine.
WaterAid now has significant experience of implementing community-wide ODFsanitation programmes in rural areas. The three WaterAid country programmes withthe broadest experience are Bangladesh, Nepal and Nigeria. WaterAid is now in a position to contribute to the empirical knowledge of CLTS (and its variants) byexamining the rich body of experience in these three countries.
Running head
11Sustainability and equity aspects of total sanitation programmes
Recommendations
a) Develop formal guidelines on community unitsThe definition of the community unit used in the CLTS intervention is critical.WaterAid in Nigeria has already developed informal guidelines that suggestthat large villages should be broken down into smaller units that target ODFstatus one by one, with a separate (but linked) process in each sub-village.
b) Introduce follow-up interventions to review and improve outcomesOne of the key recommendations for improving the sustainability of theoutcomes is to introduce a second phase intervention that aims to review thesanitation outcomes and promote small improvements and upgrades to thesanitation facilities. It is proposed that this intervention should follow aboutone year after the completion of the initial CLTS intervention, and should utilisea sanitation marketing approach.
c) Encourage, capture and disseminate local innovationAt present, little effort is being made to encourage or capture local innovation.It is recommended that each of the State Programmes establishes an annual latrine competition, with prizes awarded to the most innovative andaffordable designs.
d) Separate water supply from sanitation interventionsIt is also recommended that the water supply interventions be de-linked fromthe sanitation interventions. Integrated interventions should allow water to be available for handwashing after defecation, for latrine flushing, and forimproved hygiene, but, in practice, this study confirms that many of the watersupply interventions encounter problems that limit their usefulness andsustainability. In addition, it is difficult to determine genuine demand forsanitation when water supply development is part of the package. Watersupply requirements tend to dominate institutional arrangements, thussidelining those that might contribute significantly to sanitation improvements.
Executive summary
10 Sustainability and equity aspects of total sanitation programmes
Section 1
Introduction

The study will be conducted in three countries. In each case a research team willfollow a similar programme of research, with some variations to allow for differencesin local circumstances. The research team will use a combination of desk review,interviews and fieldwork in sample communities to test the research hypothesis. The philosophy of the study embraces the concepts of self-reflection and internallearning. The design provides for a number of internal meetings to enable staff tocontribute to the study design and to review the lessons arising from the study.
In each country the study will have three phases as follows:
Inception phase: Data review and design of field work (two weeks)WaterAid country teams will collect all relevant records and data on projectcommunities, and carry out a preliminary analysis. This preliminary work will becarried out by the Country Sanitation Specialist or through contracted researchcapacity. The Country Researcher will provide support for this analysis and theinception phase will end with a consultation meeting with the Country ConsultativeGroup. The purpose of the inception consultation meeting will be to cross check thedata analysis and to finalise the selection of communities for fieldwork. At the closeof the inception phase the Country Researcher will be responsible for producing a brief inception report summarising the data analysis.
The inception phase will identify a set of communities (between three and 12) for detailed field study. The communities will be selected from within the set of‘programme villages’ where WaterAid and its partners have carried out community-wide ODF programmes. The exact criteria for selection will be determined in theinception period but to the extent possible, the selection will include communitieswhere the period since the intervention is as long as possible. Broadly the study willidentify communities that have generally comparable contexts (social, economic,geographic). At least one community will be from a group considered to be ‘highperformers’ (ODF), one a ‘low performer’ (non ODF) and one ‘median’ case. Wherethe data set is sufficiently rich, the selection process will also take into accountareas with specific technical challenges such as high water table areas.
Fieldwork phase: Fieldwork and preparation of case studies for selected studyvillages (three weeks)Fieldwork will be carried out by the Country Researcher and the Country SanitationSpecialist. Fieldwork will be focused over a period of two to three days in eachcommunity. Where possible a second visit will be carried out after about a week toprovide an opportunity to triangulate field observations. The fieldwork will include:
Running head
13Sustainability and equity aspects of total sanitation programmes
The purpose of the study is to contribute to the global understanding of community-wide ODF approaches, with a focus on the extent to which these approaches resultin sustained and equitable improvements in sanitation behaviour. The studyexamines a set of similar WaterAid interventions in three countries – Bangladesh,Nepal and Nigeria – to test the following research hypothesis:
Where possible, the study will also explore the additional factors that enhance theprobability that ODF status will translate into entrenched behaviour change, as wellas the capacity of communities to move onwards up the ‘sanitation ladder’.
Key research questions include:
� What sanitation behaviour change has taken place?
� Are sanitation facilities hygienic?
� Does sanitation behaviour change last?
� Does sanitation behaviour change result in lasting benefits?
� Is there any differential sanitation behaviour change (ie do the improvementsinclude all members of the community, even disadvantaged and vulnerable groups)?
� Are the poor able to build durable latrines without any external subsidy?
� Has there been any upgrading or improvement of latrines?
These questions respond both to the global CLTS debate and to WaterAid’s internaldebate on the effectiveness, sustainability and equity of CLTS-based approaches. A number of other current studies, some of which utilise far greater resources andexpertise than is available to WaterAid, are examining CLTS outcomes and impacts,so WaterAid has decided to limit the scope of its assessment. In particular, WaterAidhas decided not to examine wider environmental sanitation outcomes (solid waste,wastewater, drainage); hygiene behaviour change (handwashing, safe water use,food hygiene etc); or health and economic impacts.
Running head
12 Sustainability and equity aspects of total sanitation programmes
Section 2
Objectives
Achieving ODF status is a necessary but not sufficient condition for the entirecommunity to use and maintain hygienic latrines in the long-term
Section 3
Overview of study plan

The text in this section has been extracted (with minor revisions) from eitherthe Federal Government of Nigeria’s Strategy for scaling-up rural sanitationand hygiene to meet the Millennium Development Goal (MDG) in Nigeria, orfrom the National Task Group for Sanitation and Hygiene’s International Year of Sanitation (IYS) 2008 – Action Plan for Nigeria.
Coverage and targetsAccording to the 2003 Demographic and Health Survey (DHS03), 15% of householdsin Nigeria use flush toilets, 57% use traditional pit latrines, and 28% have no facility.Urban households are more than four times as likely to have a modern flush toilet ashouseholds in rural areas (29% and 7% respectively). However, KAP studiesconducted in 1999 indicated that most traditional pit latrines were unsafe.
The majority of rural dwellers still use unsanitary methods of human waste disposalsuch as open defecation, or defecation directly into watercourses. Sullage controland disposal are inadequate, not only in the urban areas, but also in peri-urban andrural areas. Crude dumping is the most popular method of solid waste disposal.From a survey conducted by UNICEF in 1999 for rural households to prioritise theirneeds, lack of potable water was identified as their greatest problem, while the lackof a latrine was considered the least of their problems5. This finding is due to limitedunderstanding of the benefits of improved sanitation (such as reduction of diarrhoeaand other water related disease), and is one reason for the low prioritisation ofsanitation at all government levels.
Nigeria is not on track to meet the MDG target for sanitation of 70% access by 2015.United Nations sources estimate that in the last 15 years, rural sanitation accessrates have risen just 3% from 33% in 1990, to 36% in 2004, while urban sanitationaccess has gone from 51% to 53%.2 (Note that the Federal Ministry of Agricultureand Water Resources (FMAWR) is finalising a new baseline survey that will help todetermine current access levels more accurately).3
Running head
15Sustainability and equity aspects of total sanitation programmes
� Background data collection: facilities and services available in the community(including water supply), previous development interventions, government links,main livelihoods and seasonal variations in community life
� Mapping exercise: produce map (and list) of every household including itssanitation status, its socio-economic status etc. Use (and verify) mapping dataduring transect walk
� General observation of sanitation behaviours – status (ODF or non-ODF) andlatrine use. Application of PRA tools (transect walk etc) to analyse communityviews of the situation
� Detailed observations of a selection of latrines
� Focus group discussions with selected groups (including focus groups designed to work with communities deemed to be ‘at risk’ of exclusion or otherdisadvantage in the programme)
� Interviews with key informants (community facilitators, village leaders, localgovernment officials, local health extension workers)
� Interviews with project staff
� Identify and interview open defecation households/members, households owningnon-functioning sanitation facilities, and early latrine adopters (in a non-stigmatisingand supportive manner)
It is estimated that the fieldwork will take about two and a half weeks in total.
Analysis phase: Review of results and writing up (three weeks)At the end of the fieldwork phase, the Country Researcher and Country SanitationSpecialist will present their preliminary findings to the Country Consultative Group ata half/one day workshop. The group will discuss and agree on general findings fromthe study, including identifying areas of agreement and areas where the data do notallow for indisputable conclusions. The Country Researcher will write up a draft finalreport for comments by the group and a final report after two weeks.
Section 3
14 Sustainability and equity aspects of total sanitation programmes
Section 4
Sanitation sub-sector in Nigeria
2 WHO/UNICEF (2006) Meeting the MDG drinking water and sanitation target : the urban and rural challenge of the decade, Joint MonitoringProgramme for Water Supply and Sanitation (JMP)
3 National Task Group for Sanitation and Hygiene (2008) International Year of Sanitation 2008: Action Plan for Nigeria (draft)

2 Build one million latrines
3 Conduct handwashing campaigns at federal level, in all states, and in all LGAs (to reach 30 million people)
Recent MDG monitoring figures from the WHO/UNICEF Joint Monitoring Programmefor Water Supply and Sanitation (JMP)7 suggest that: assuming an average of 10people per household, 7.75 million toilets need to be built by 2015 in order to meetthe Nigeria MDG sanitation target of 70% coverage by 2015. This figure implies that775,000 household toilets must be constructed every year over the next eight years(including 2008). In practice, more that this number of household latrines will needto be constructed because of the inevitable collapse, breakdown and abandonmentof some low-cost latrines during the period 2008-2015.
Table 1: IYS Action Plan calculation for MDG sanitation progress
Sources: JMP and UN Population Division calculations and estimates
In addition to household latrines, additional latrines and toilets will need to beconstructed in institutions (schools and health centres) and public places (markets,bus stations, autoparks, etc). Current estimates suggest that over half a millionlatrine stances are required in primary schools alone, with more required for healthcentres and in public places. Therefore, the overall target has been set at increasingaccess to improved sanitation facilities by one million new latrines per year.
Interestingly, the draft National Water-Sanitation Policy (discussed further below)notes that the ‘average household size in Nigeria is five persons’, which suggeststhat the number of household latrines required is actually double that calculated bythe IYS Action Plan (which assumed 10 persons per latrine). Using the same targetpopulation of 62 million people, the lower household size suggests that 12.4 millionlatrines are required (to provide improved sanitation facilities to each household),which is equivalent to 1.55 million latrines per year over the next eight years.
Section 4
17Sustainability and equity aspects of total sanitation programmes
While these access and progress rates are comparable to sub-Saharan Africaaverages, Nigeria’s large population means that more people are living withoutsanitation (72 million in 2004)4 than in any other country in Africa. At the currentrate of progress, the MDG target for sanitation will not be met.
Sanitation trends
But more important than targets is the impact of the lack of improved sanitation onNigerian communities. Poor sanitation causes diarrhoea, and the Nigeria diarrhoeaprevalence rate, at 18.8%, is high.5 This disease burden leads to high child mortalityrates due to direct deaths from diarrhoea (diarrhoea is the second largest killer ofchildren in the country, behind malaria) and to other diseases linked to highdiarrhoea prevalence, including acute respiratory infection, cholera, polio andothers. Poor sanitation is also a major contributing factor to low educationenrolment and achievement rates, to malnutrition, to lagging economic and socialdevelopment, and to poverty as a whole.
Institutional sanitation and water coverage rates are also low in Nigeria. A UNICEF-sponsored study in 2003 showed that on average there is only one toilet for every500 students in schools, ten times the widely-used standard of 50 students perlatrine. The study also revealed that safe water sources were available in less than a third of all schools in the country.
The draft Action Plan for the International Year of Sanitation in Nigeria6 containsthree significant and ambitious targets to be achieved by the end of 2008:
1 Develop enabling environments for the sustainable expansion of sanitation andhygiene programmes
Section 4
16 Sustainability and equity aspects of total sanitation programmes
4 WHO/UNICEF (2006) Meeting the MDG drinking water and sanitation target : the urban and rural challenge of the decade, Joint MonitoringProgramme for Water Supply and Sanitation (JMP)
5 National Planning Commission and ORC Macro (2003) Nigeria Demographic and Health Survey (DHS)6 National Task Group for Sanitation and Hygiene (2008) International Year of Sanitation 2008: Action Plan for Nigeria (draft) 7 The WHO/UNICEF Joint Monitoring Programme for Water Supply and Sanitation data are the official figures for monitoring global and regional
MDG progress on water supply and sanitation Nigeria
80%
60%
40%
20%1990 2004 2015
Current rate
Required rate
Continuing at same rate
60%
44%
MDGTarget
49%
70%
Data points Total p0pulation Sanitation coverage(number of people)
1990 JMP data = 44% coverage 91 million 35 million
2004 JMP data 129 million 57 million
2007 FGN estimate 145 million 61 million
2015 MDG target of 70% coverage 176 million 123 million
No. people that need to gain access from 2008 to 2015 62 million
Annual increase in sanitation coverage (over eight years) 7.75 million
No. latrines per year (@ 10 people per latrine) 775,000

Table 2: Key water and sanitation laws, policies and strategies
There is an urgent need to harmonise policy instruments and implementationguidelines related to the sanitation and water sector, and to ensure that they fullycomplement each other. Moreover, in undertaking this harmonisation exercise,it would be most appropriate to draw from the current Rural Water Supply andSanitation Strategic Framework. This document, issued in 2004, was developed withsupport from UNICEF and with wide participation of stakeholders including stategovernments, the EU and the World Bank. The document is comprehensive andincludes sector reform principals such as a zero subsidy approach to householdsanitation, the promotion of technology options, and a clear shift towardsdecentralised programming. It is also the only policy instrument that specificallyincludes hygiene promotion as a sector strategy.
The National Economic Empowerment and Development Strategy (NEEDS) is of keyimportance to the sector since it defines national development priorities, as well asState (SEEDS) and LGA (LEEDS) priorities. As in many other poverty reductionstrategies, WASH is not defined as a full sector in the NEEDS, SEEDS and LEEDSdocuments. However, the sector gets prominent mention, particularly water supplywhich is listed as the number one priority for rural communities. An updated versionof the national document (NEEDS2) is under preparation and this provides a goldenopportunity to ensure that sanitation and hygiene is firmly incorporated into thisnew update.
Sector stakeholders and programmesThe Federal Ministry of Agriculture and Water Resources (FMAWR), which was createdin 2007 by combining the Ministry of Agriculture with the Ministry of Water Resources,is the lead agency in the sector with a mandate that covers sector policy development,coordination, monitoring and evaluation. Activities are carried out primarily throughthe Department of Water Resources and Water Quality, which includes a dedicatedrural water and sanitation division that is divided into four sub-divisions: CommunityMobilisation and Hygiene Education, Sanitation Development, Rural Water Supply, andMonitoring and Evaluation. The department is in the process of setting up a new DonorCoordination Division. The National Water Resources Institute, a parastatal under theFMAWR, is responsible for training, research and information management.
Section 4
19Sustainability and equity aspects of total sanitation programmes
Sanitation policyThe current main policy instrument governing the rural sanitation sector in Nigeria isthe National Water Supply and Sanitation Policy, which was developed by FMAWRand enacted in 2000. The policy is limited in scope, and is notably weak in the areaof rural sanitation. Efforts are currently under way to update this policy, with supportfrom the World Bank.8
In 2004 the FMAWR prepared a draft National Water-Sanitation Policy, which focusesprimarily on sanitation. The term ‘water-sanitation’ refers to water-related sanitation,as opposed to more general environmental sanitation. The draft policy furtherdefines water sanitation as:
‘effective hygiene practice, handling and disposal of excreta, liquid(sewerage, sullage and storm water) and leachates from dump sites(solid wastes) in so far as it affects water sources.’ (Section 1.2)
The National Water-Sanitation Policy, while still in draft form, defines service levels,coverage targets (80% by 2015) and a broad range of strategies, but provides limiteddetails on institutionalisation and financing. The national policy also defines a cost-sharing formula for the three tiers of government and communities.9 A set ofimplementation guidelines is currently being developed for the above policy, ofwhich this scaling-up strategy will form a module of those guidelines. It isanticipated that the policy, and its accompanying implementation guidelines, will beapproved by the Federal Executive Council in the near future.
The National Water-Sanitation Policy defines the following service levels:
Rural:Each household in rural areas (population less than 5,000) shall own and haveaccess to a safe sanitary facility with at least minor improvements that will reduceflies, odour, etc (at least an upgraded pit latrine)
Semi-urban:Each household in semi-urban areas (population of 5,000 to 20,000) shall own andhave access to a safe sanitary facility that is easily adaptable to existing traditionalpit latrines and has a superstructure that blends well with other buildings within thecommunity (at least a sanplat latrine)
Urban:Each household in urban areas (population above 20,000) shall own and haveaccess to a safe sanitary facility that uses suitable and affordable water conveyancesystems (at least a pour-flush toilet)
In 2005, the Federal Ministry of Environment released the National EnvironmentalSanitation Policy. This policy is very broad in scope, and overlaps considerably withthe FMAWR sanitation policy – including policy statements on household excretadisposal and school sanitation. It is fairly generic.
Section 4
18 Sustainability and equity aspects of total sanitation programmes
8 Federal Government of Nigeria (FDN) (2007) Strategy for scaling up rural sanitation and hygiene to meet the Millennium Development Goal in Nigeria
9 The formula for rural sectoral projects is 50% funding by federal government, 25% by state government, 20% by LGAs and 5% by communities.Different funding formulas have been defined for small towns and urban projects
Title Year Lead ministry
Water Resources Decree, No. 101, enacted 1993 –
National Water Supply and Sanitation Policy, enacted 2000 FMAWR
National Water Policy (draft) 2004 FMAWR
National Water-Sanitation Policy (draft) 2004 FMAWR(awaiting approval by Federal Executive Council)
The National Water Resources Management Policy (second draft) 2003 FMAWR
National Environmental Sanitation Policy 2005 Federal Minstry(approval status unclear) of Environment
Rural Water and Sanitation Strategic Framework 2004 FMAWR, (awaiting approval by Federal Executive Council) States
National Water Law (under draft) 2007 FMAWR

WaterAid also has a strong focus on governance issues, and the proposed AfricanDevelopment Bank loan includes strong reform-based conditionalities.
Sector co-ordination and monitoringThe National Task Group on Sanitation (NTGS) was inaugurated in August 2002 aspart of the government’s commitment towards improving the sanitation situation in Nigeria. The NTGS, composed of nine federal ministries and departments, CivilSociety Organisations (eg WaterAid) and development partners (eg UNICEF) was,among other things, given the mandate to develop the National-Water SanitationPolicy and the corresponding implementation strategy. More recently, the task group has also been mandated to develop and implement the International Year of Sanitation Action Plan.
Section 4
21Sustainability and equity aspects of total sanitation programmes
The Ministries of Environment and Health also have sector-related mandates inNigeria. The Ministry of Environment’s mandate impacts on the sanitation and water sector in several ways, especially in the areas of environmental sanitation and water pollution (for which it has formulated a national environmental sanitationpolicy and policy guidance on school sanitation). The Ministry of Health mandateincludes standards formulation and regulation of drinking water quality, as well as policy development, and control and prevention programmes for water andsanitation related diseases through its Public Health Department. Other ministrieswith some involvement in the sector include Education, Women’s Affairs andIntergovernmental Affairs, Youth Development and Special Duties.
At the state level, rural sector programmes are implemented through a variety ofministries, including water resources, and works and public utilities. In 22 of 36states, dedicated Rural Water Supply and Sanitation Agencies (RWASSAs) have beenestablished, in most cases with support from UNICEF. RWASSAs typically have watersupply, sanitation, mobilisation, and monitoring and planning units. In most states,however, RWASSAs do not yet have full departmental status, thus staff are secondedfrom other departments (such as Works and Health).
At present, most LGAs do not have WES Units or departments, except where theyhave been created recently with assistance from UNICEF-supported programmes.With or without WES Units, LGAs generally have limited budget and human resourcecapacity for implementing sector activities, thus tending to rely on external supportfrom state governments and donor agencies.
Civil society participation in the sector is very limited in Nigeria. While someinternational NGOs engage in the sector (notably WaterAid and Concern Universal),national NGOs are few and of limited capacity. Local NGOs and Civil SocietyOrganisations operating at the LGA level are notably absent. However, a NationalCivil Society Network on Water and Sanitation has recently been incorporated (withassistance from WaterAid), and is generating significant interest.
External support agencies with significant ongoing programmes of support in the rural sector are UNICEF, DFID, the EU, WaterAid and JICA. UNICEF has the largest, most comprehensive programme of support; followed by its implementingpartner, WaterAid.
The largest single donor in the rural sub-sector is the EU, with approximately US$45million over five years (all through UNICEF). DFID is the next largest, with about $20 million over six years, implemented through UNICEF and WaterAid. The JICAprogramme focuses on individual states, currently Kano State, with a budget ofabout $3 million. The most significant potential new source of donor funding in thesector is a proposed African Development Bank loan of $75 million for 2006 to 2010.The World Bank is currently active only in urban and small town projects in Nigeria,but may include a rural component in future programmes.
External support programmes, including the UNICEF programme, increasinglypromote a sector reform agenda. The EU Water Supply and Sanitation Sector ReformProgramme, which includes small town and urban components as well as theUNICEF-implemented rural component, is specifically designed to improve watergovernance. The DFID-supported programme implemented through UNICEF and
Section 4
20 Sustainability and equity aspects of total sanitation programmes

5.2 First CLTS pilot project (four communities)On the return of the WaterAid in Nigeria team from Bangladesh, a decision was takento pilot CLTS in two communities – each in Logo and Vandeika LGAs of Benue State.The chosen communities were Abeda and Tse-Ibon in Logo LGA, and Bilaja andMbaikyo in Vandeikya LGA. It is important to note here that the four communitiesinitially selected were not new intervention sites. This meant that the communitieswere already exposed to the subsidy model. The initial plan was to have fourcommunities in each LGA, two where subsidy has been introduced and the other two without subsidy for the CLTS. Two new communities were not however selectedat inception, so CLTS was piloted in communities where some members of thecommunity have benefited from the subsidy to build VIP latrines. Piloting in twoother communities – Maga and Tor Kukwa in Logo LGA – started from January 2006.
Another issue of note is that the WASCOM for each of the communities were alreadyselected as part of the previous project in 2004 and were not selected at theinception of the CLTS. Inception training for four days was conducted for the WASUofficials in the two LGAs by WaterAid in Nigeria. This inception training was followedby training for WASCOM for two days in the LGA/community by WASU officials withsupport from WaterAid in Nigeria in June 2005. The pilot therefore did not begin untilJune 2005.
The initial approach was for the WASU official, together with WASCOM members andcommunity members, to conduct a transect walk to observe the sanitation situationof the community and identify areas of open defecation, then hold a communitymeeting to discuss the harmful effects of open defecation, prepare an action plan to totally eradicate open defecation, set targets, and select youth volunteers. Thesevolunteers were expected to keep baseline information about household toilets andto monitor the implementation of the action plan.
5.3 Review of first CLTS pilot projectIn November 2006, WaterAid in Nigeria conducted an internal evaluation of the pilotphase led by Dr Muhammod Abdus Sabur of WaterAid in Bangladesh (with supportfrom representatives and partners from other West African WaterAid countryprogrammes). Key findings from the evaluation included many positive outcomes as well as a number of challenges:
� Impressive improvement in hygiene and sanitation – many more toiletsconstructed with hand-washing arrangements, refuse disposal, clean premises,clean environment
� Community feel proud about the positive changes yet aware they need to do more
� All the institutions involved are working and aware of their respective roles
� Majority of people involved are committed to the process and goals
� Community has confidence in WASCOM
� People are changing habits – sharing others’ toilets instead of open defecation
� Local materials are used instead of concrete slabs
Section 5
23Sustainability and equity aspects of total sanitation programmes
The majority of this section was extracted (with minor revisions and updates)from two WaterAid internal reports:
WaterAid (2006) Evaluation of Pilot phase of CLTS in Nigeria
Burton S (2007) Community-led Total Sanitation: an evaluation of WaterAid’sCLTS programme in Nigeria
5.1 Background in NigeriaSince establishing a programme in Nigeria in 1995, WaterAid in Nigeria and partnershave tried several approaches to sanitation including hardware subsidies, promotionthrough sani-centres,10 as well as in some communities making the construction of latrines a pre-condition for gaining access to water supply. However, to date,WaterAid in Nigeria and partners have faced many challenges in terms of achievingsustainable changes in the behaviour of local communities, or even the sustaineduse of latrines after the withdrawal of project support.
WaterAid in Nigeria carried out a ‘Looking back’ study in 2003 and an impactassessment of the WaterAid in Nigeria Oju and Obi Project in 2004, both of whichsuggested that projects were not sustainable once subsidies for latrine constructionwere removed. In addition, another study: ‘Sustainable sanitation research: Driversand barriers’ Nigeria Country Report (2005) highlighted that the main enabling factorfor the adoption of latrines was the introduction of Water and Sanitation Units(WASU) who encouraged communities to adopt improved sanitation practices, using a subsidy-based approach.
The outcomes of the impact assessment led WaterAid in Nigeria to seek a moresustainable sanitation promotion model. In October 2004, WaterAid in Nigeria senttwo staff members (Head of Advocacy and Communication and Country ProgrammeHygiene/Sanitation Promotion Focal Person) and a sanitation promotion volunteer(from Oju Project) to Bangladesh to study CLTS, with a view to replicating theapproach in Nigeria.
Running head
22 Sustainability and equity aspects of total sanitation programmes
Section 5
WaterAid in Nigeria sanitation programme
10 Community-based production and sales centres which manufacture concrete latrine slabs and sell the slabs and a range of other sanitarywares to members of the community

The most significant outcome was that community members felt that it was theirprogramme. The ‘software’ in terms of training provided by WaterAid in Nigeria, wasnot considered an external input and although all the communities identified theimportance of water for the success of CLTS, they have developed fund generationand other systems for maintaining the facilities and ensuring sustainability.The evaluation provided wide ranging evidence that that CLTS is an effectiveapproach to establishing hygiene and sanitation practice in Nigeria, but theeffectiveness varied depending on certain conditions which will need to be takeninto consideration when scaling up the initiative.
CLTS is more effective in communities where it is used as the only approach topromoting hygiene and sanitation. In the absence of other initiatives, the initialtriggering activities are more effective in convincing the community to take action.CLTS was not particularly effective in communities that had previously been exposedto the subsidy approach. CLTS was also less effective in more urbanised communities,perhaps due to the limited sense of community and the large number of tenantoccupied houses. CLTS effectiveness was strongly associated with the quality of theentry processes, including a more participatory approach to facilitation, training andstep-down training to community level, clear initial messages, effective formation ofWASCOMs, and establishment of working water points. CLTS also appeared to workbetter in smaller communities (below 3000 people).
5.6 Sanitation data provided for the current studyIn July 2008, WaterAid in Nigeria conducted a survey of its field offices in order to collect up to date data on the status of its CLTS interventions. The survey dataprovided to the consultant team suggested that there is currently a total populationof 98 relevant project communities (ie communities where WaterAid has promoted a community-wide ODF approach) in Nigeria. Of these, 54 community interventionswere started in the 2007-08 financial year, 37 in 2006-07, and the remaining sevenstarted in 2005-06.
The survey data confirm that CLTS is still new to Nigeria. Only seven CLTS interventionsare more than two years old, and several of the LGA WES Units did not receivetraining in the implementation of CLTS until late 2006. As a result, awareness of theapproach, participatory methodologies, and technical solutions to local physicalchallenges are still evolving.
Nevertheless, the survey data confirm that, despite the steadily increasing scale ofthe programme, the performance of the WaterAid CLTS interventions is improving yearon year. As per the research design, the interventions have been categorised into:
� High performers (communities that achieved greater than 95% latrine coverage)
� Median performers (achieved between 30% and 95% latrine coverage)
� Low performers (achieved less than 30% latrine coverage)
Section 5
25Sustainability and equity aspects of total sanitation programmes
5.4 Second CLTS pilot project (24 communities)Responding to the challenges observed, WaterAid in Nigeria redesigned the CLTSmethodology and initiated a second phase of pilot projects in November 2006 in four States: Benue, Enugu, Ekiti and Jigawa. Twelve LGAs were involved across thefour states, with interventions in two communities in each LGA, making a total of 24 communities.
As the second phase proceeded, there were indications of the potential of CLTS to yield better results than any approach previously used in Nigeria. Followingintensive field visits in June 2007, the NTGS drafted a strategy for scaling upsanitation that anticipated that the CLTS methodology would be the basis for scaledup sanitation improvement across the entire country.
The second phase of the pilot followed a number of steps. Representatives ofWASUs and NGOs who had participated in the November 2006 CLTS training carriedout step-down training to other WASU members. WASU members then visited theproject communities, conducted community meetings, guided the formation ofWASCOMs, trained the WASCOMs11 in CLTS methodology, planned the community-led initiative, and together with the WASCOMs, monitored the process of implementationof the CLTS processes. At around the same time, sani-centres were established inmost of the communities, and water points were either renovated or constructed. In each community, artisans were trained on how to construct various types oflatrines. In some communities, Volunteer Hygiene Promoters were also selected tovisit households and promote hygienic practices, although there was a lack of clarityon the different roles of Volunteer Hygiene Promoters and WASCOM members.
5.5 CLTS evaluation (2007)Before moving to a full-scale activity, WaterAid in Nigeria commissioned an evaluationof CLTS to assess the effectiveness, efficiency and relevance of the CLTS programmeand to recommend ways of improving and scaling up the CLTS programme in Nigeria.
Analysis of information gathered from 13 communities in Benue and Jigawa showeda number of positive outcomes of the CLTS programme. There was a significantreduction in the extent of open defecation in the communities with some communitiesdeclaring ODF status. All communities reported health improvements such as fewerskin infections and reduction in diarrhoea and vomiting, particularly amongstchildren. Large numbers of latrines had been constructed with locally availablematerials so that almost half the communities studied had either 100% or nearly100% access to latrines. One of the most significant results was the positive effect of CLTS on the dignity of women and girls who no longer had to risk being assaultedon their way to and from the bush. People felt it was much safer now that they donot have to go to the bush where in the past snake bites were common.
Section 5
24 Sustainability and equity aspects of total sanitation programmes
11 Formation of WASCOM is a requirement in all WaterAid in Nigeria programme planning and implementation

5.7 Features of CLTS in NigeriaThe WaterAid in Nigeria CLTS programme includes several features that differentiateit from more conventional CLTS programmes (which focus exclusively on stoppingopen defecation through participatory and promotional activities).
Water supplyAll CLTS interventions carried out by WaterAid in Nigeria (through their LGA and NGOpartners) include a water supply component. In most cases, WaterAid provides theproject community with a borehole-sourced handpump; the development andinstallation of the water supply usually takes place in parallel with the CLTS activities.
The water supply component of the intervention means that both the technical and managerial aspects of the intervention are significantly different from those of a normal CLTS intervention. Additional requirements include: tests need to beconducted to check the feasibility (and location) of a borehole or well, the WES Unit(of the LGA) must have suitable technical expertise, the WASCOM must be trained in the operation and maintenance of the handpump, a handpump operator andmechanic must be appointed, and funds need to be collected for the maintenanceand repair of the communal water facility.
Importantly, the water supply component also affects community demand for the intervention (as demand for the water supply may influence communityrepresentatives to exaggerate their demand or interest in sanitation), and the long term sustainability of the intervention (as the outcomes of the sanitationimprovements may be influenced by the success and sustainability of the watersupply component).
The 2007 CLTS evaluation found that ‘one of the key entry processes is access to water … communities clearly associated the effectiveness of CLTS to availability of water’.
Hygiene promotionThe WaterAid CLTS interventions also include hygiene improvement components.Each household is encouraged to construct a handwashing station alongside theirlatrine, and to ensure that this station is furnished with a water supply (usually anopen container on a stand beside the latrine) and some soap. The community is alsoencouraged to keep yards clean and dispose safely of solid waste.
Obviously, the promotion of the handwashing stations is closely linked to theavailability of water supply close to the home, thus reinforcing the importance of the success and sustainability of the water supply component.
Section 5
27Sustainability and equity aspects of total sanitation programmes
CLTS performance 2005-2007
The chart above clearly shows that the percentage of high and median performingcommunities has increased from 29% in 2005 to 46% in 2007, despite scaling upimplementation from only seven communities in 2005 to 54 interventioncommunities in 2007:
2005 = 7 communities in 2 states (71% low performers)2006 = 37 communities in 4 states (62% low performers)2007 = 54 communities in 6 states (54% low performers)
However, the real measure of success for a CLTS programme is the proportion of ODFcommunities achieved. The ODF success rate in Nigeria remains relatively low, atapproximately half the rate currently being achieved by total sanitation programmesin other countries:12
Nigeria = 15%–19% ODF rateCambodia = 31% ODF rateIndia = 35% ODF rateIndonesia = 37% ODF ratePakistan = 38% ODF rate
These findings confirm that the CLTS programme in Nigeria remains in a fairly earlystage of its evolution, and that the first two years of the programme (during whichthe interventions to be studied took place) were less effective than the more recent2007-08 interventions.
Section 5
26 Sustainability and equity aspects of total sanitation programmes
12 Based on data collected by the author for the WSP Gates Foundation Total Sanitation and Sanitation Marketing Project (Himachal Pradesh,India; and Indonesia); from Mark Ellery, WSP Pakistan (Pakistan); and Heino Guellemann, Swiss Red Cross Cambodia (Cambodia)
100%
90%
80%
70%
60%
50%
40%
30%
20%
10%
0%2005 2006 2007
29%
71%
22%
16%
62%
20%
26%
54%
Low (< 30%) Average (30% < x < 95%) High (> 95%)

Several Nigerian CLTS practitioners interviewed for the study noted that the faecescalculation, and the disgust that it engenders, is the single most effective tool in theCLTS process. Furthermore, the 2007 CLTS evaluation confirmed that ‘the success of CLTS has been linked to triggering community action as a result of the shame ofseeing and observing their own open defecation. The communities studied clearlyshowed that they had been triggered to be ashamed of the habit of open defecation:‘I was embarrassed that someone from outside had to come and show us therampant defecation in my community – why not we do it ourselves?’”. The 2007 CLTS evaluation also noted the importance of the realisation that ‘we may be eatingpeople’s shit’ and ‘that the fly sitting on my child’s lips could give him diarrhoea’.
One explanation for this contradiction (reports that the process had been radicallychanged versus evidence from the fieldwork that the process retains a reliance on the disgust trigger) is that each country feels the need to put its own imprint on any externally developed process. Nigerians are a proud people, and severalrespondents noted that most Nigerians would not find it acceptable or pleasing that a process developed in Bangladesh should be used without any adaptation inNigeria. Therefore, it appears that CLTS in Nigeria has been repackaged, but withoutaltering the fundamental principles that make CLTS work.
Institutional issuesWaterAid in Nigeria has a relatively small team in each of its focus states. The typicalarrangement is for WaterAid to employ only two programme staff (State Managerand Programme Assistant) in each state, supported by an administration officer. The Programme Assistant is often seconded from the State Rural Water Supply andSanitation Agency. Two zonal offices (North and South) used to provide additionalsupport to the state teams, but the zonal offices were dissolved in 2007, thus allhigher level support is now provided by WaterAid’s headquarters in Abuja.
The planning and implementation of the CLTS interventions are conducted by theWES Units of the LGA, usually without any direct involvement of WaterAid staff. Mostof the WES Units were established in 2004-05, with support and training from theUNICEF programme and WaterAid; thus capacity and experience are fairly limited.Where available, the WES Unit contracts a local NGO to undertake specific tasks,such as the baseline survey, community mobilisation, and some training events.
As a result of their limited capacity, the WaterAid state teams do not generally takean active part in implementation activities, and are heavily reliant on the WES Unitsfor reports of progress and outcomes. WaterAid in Nigeria recently recruited aSanitation Officer who will be based in Abuja, and will be responsible for ensuringstronger technical and monitoring and evaluation support to the state teams.
Section 5
29Sustainability and equity aspects of total sanitation programmes
Establishment of sani-centresIn Nigeria, WaterAid has promoted the establishment of a sani-centre in each projectcommunity. The sani-centre approach was developed to tackle the transport andmarket access problems faced by remote rural communities in Nigeria. The intentionis to establish a production centre selling concrete latrine slabs (manufactured usinga mould provided by WaterAid) and a permanent store selling sanitary wares in eachproject community.
WaterAid trains several community members as artisans (able to construct low costconcrete latrine slabs) and provides each community with N80,000 (US$700) asseed money for the sani-centre. Depending on demand, the seed money is used to buy a mixture of construction materials (mould for slab, cement, aggregate andsand) and household sanitary wares (plastic potties, soap, washing powder, brooms,toothbrushes, water pots, filter cloths, etc). The selection and purchase of thesematerials, as well as the transport of the materials to the community, are supervisedby the LGA WES Unit.
The goods supplied to the sani-centre are supposed to be sold to the communitymembers at affordable prices, with any income used to replenish the material stocksheld by the sani-centre. In most cases, the WES Unit and the WASCOM members setthe price for a concrete latrine slab at about N1,300–N2,000 (US$11.50–$17.70).13
Shame and disgust as triggers for sanitation behaviour changeThe CLTS literature emphasises the importance of shame and disgust as triggers for sanitation behaviour change. Several of the main CLTS tools focus on confrontingcommunity members with: the unpleasantness of defecation sites close to theirhomes (transect walk), the volume of human excreta deposited around thecommunity (excreta calculation), and an increased understanding of thecontamination routes between this excreta and their homes, their food, and theirmouths (contamination mapping).
During the planning meeting for this study (and again in the research design note), it was noted that WaterAid in Nigeria staff had found that shame and disgust werenot effective drivers of change, and that alternative (more culturally appropriate)approaches had been developed within the community-wide facilitated approach.Specific challenges were stated to be the more scattered nature of the ruralsettlements in Nigeria, which mean that it is often difficult to find evidence of open defecation even in communities with very few latrines, and the difficulty ofconducting effective transect walks in scattered communities surrounded by thickbush. It was also suggested that the significant cultural and contextual differencesbetween West Africa and South Asia reduce the relevance and effectiveness of thesetriggers in Nigeria.
However, a review of the CLTS materials developed by WaterAid in Nigeria, as well asdiscussions with staff from WaterAid in Nigeria and from LGA WES Units, confirm thatthe core CLTS tools that trigger shame and disgust (transect walk, faeces calculation,faeco-oral route transmission) remain important parts of the CLTS process in Nigeria.
Section 5
28 Sustainability and equity aspects of total sanitation programmes
13 The exchange rate at the time of the fieldwork was US$1 = Naira 113

eight people per household in Plateau to 14 people per household in Benue; whereasthe DHS03 survey15 suggests that the average household size in rural areas is smaller,at only 5.1 persons per household.
The larger household size found in the WaterAid project communities may be linkedto poverty levels (eg if larger households are found in poorer communities, and ifWaterAid in Nigeria has selected poorer target communities) but insufficient povertydata is available to confirm this hypothesis, as the poverty data reported by WaterAidare relative (based on community assessments of rich, poor and very poor households).
Interestingly, the DHS03 data also suggest that about two-thirds of rural householdsin Nigeria have some form of sanitation facility: either a flush toilet (7%), aventilated improved pit latrine (2%) or a traditional pit toilet (57%). The WHO-UNICEF Joint Monitoring Programme for Water and Sanitation considers that half ofthe traditional pit latrines are unimproved sanitation facilities, thus should not becounted as access to improved sanitation, which explains why the JMP estimatesthat rural sanitation coverage in Nigeria is only 30%.16 However, the DHS03 surveysuggests that more than half the households in a typical rural village should have alatrine, even if it is an unhygienic traditional pit latrine. The DHS03 data also suggestthat open defecation is particularly prevalent (38%) in the North Central Region,which includes Benue and Plateau, compared to a rural average of 34% opendefecation in Nigeria (with only 10% open defecation found in urban areas).
The WaterAid in Nigeria background data suggest that pre-intervention levels oflatrine coverage are almost zero in all of the communities in Jigawa and Plateau; and that average latrine coverage ranges between 22% and 38% in the other focalstates. These data contrast significantly with the DHS03 data, implying that thesample frame contains communities with significantly lower access to sanitationfacilities than is typical in the rural areas.
Community selection criteria for the WaterAid in Nigeria programmeThe community selection criteria used in the WaterAid in Nigeria programmes hasevolved as the LGA WES units have developed and improved their capacity. At theoutset of the CLTS interventions, WaterAid in Nigeria tasked the WES Units withconducting their own vulnerability rankings (based on poverty data, vulnerabilityindicators, and sanitation coverage data). The communities with the highestvulnerability ranking were then supposed to be selected for interventions, subject to any specific LGA or political criteria (such as ensuring equitable distributions ofdevelopment aid across the LGA).
More recently, the LGAs have produced Local Development Plans that provide a formal ranking (based on similar criteria). Where available, the WES Unit now usesthe Local Development Plan as the basis for the selection of intervention communities,subject to approval by the LGA management committee.
Section 6
31Sustainability and equity aspects of total sanitation programmes
The research design envisaged the selection of study communities from the set ofprogramme villages where WaterAid and its partners have carried out community-wide ODF sanitation programmes and ‘where the period since the intervention is as long as possible’. Therefore, the sample frame will exclude all communityinterventions started in the 2007-08 financial year.
The remaining 44 communities will provide the sample frame for the study in Nigeria(community details provided in Annex 1: Background data):
� 7 high performers (latrine coverage > 95%) = 16% sample population
� 14 median performers (30% < latrine coverage < 95%) = 34% sample population
� 23 low performers (latrine coverage <30%) = 52% sample population
Further analysis of these categories reveals that three of the seven high performersare the smallest communities in the sample frame (each comprising less than 300people and 25 or fewer households). Given that the median community size of thesample frame is 150 households, and that only five other communities comprise lessthan 100 households, these three communities are not considered representative ofthe sample frame (or of the larger population of communities in Nigeria). However,given the apparent success of the approach in these small communities, as alsonoted in the 2007 evaluation of WaterAid’s CLTS programme in Nigeria,14 it isrecommended that one of the small, high-performing communities is included in the study sample.
In addition, all of the high performers except one are in either Benue (Ado LGA) or in Jigawa. This finding suggests that either the conditions in these two states aremore conducive to the community-wide ODF approach used; or that the support and facilitation in these states has been substantially better than in the other states.Therefore, the study will also examine communities in one of the lower performingstates (eg Ekiti or Enugu) in order to ascertain whether there are any significantdifferences in either local conditions or implementation.
Otherwise, the data review suggests no substantial differences between thedifferent WaterAid in Nigeria focal states. However, a comparison with data from the 2003 Demographic and Health Survey (DHS03) suggests that the sample framecommunities differ substantially from typical Nigerian rural communities: theaverage household size in the sample frame communities is 13 people, ranging from
Running head
30 Sustainability and equity aspects of total sanitation programmes
15 Based on a cluster randomised survey of 7,225 households16 WHO-UNICEF (2008) Progress on drinking water and sanitation: special focus on sanitation, New York: WHO-UNICEF Joint Monitoring
Programme for Water Supply and Sanitation14 Burton S (2007) Community-led Total Sanitation: an evaluation of WaterAid’s CLTS programme in Nigeria processed
Section 6
Fieldwork

number of latrines in use had increased dramatically from the survey report of 42 household latrines in use, up to 112 household latrines (out of 138 households).The higher sanitation coverage suggests that Molori should have been classified asa ‘median performer’ rather than a low performer. The table below summarises theupdated data set (based on the latest WaterAid in Nigeria monitoring data).
Completed fieldwork scheduleIn practice, the collapse of a road bridge meant that the visit to Tse-Agera (Logo LGA,Benue state) was not possible in the allotted time, thus an alternative low-performingcommunity in Benue state was selected: Mbaazenger (Vandeikya LGA, Benue state).
Table 3: Community data provided by WaterAid in Nigeria (prior to fieldwork)
Source: WaterAid in Nigeria monitoring data (from state programmes)Key: No. = number, Hhd = household
In addition, the WES Unit in Ado LGA informed the research team that, because ofrecent heavy rains, it was unlikely that we would be able to reach either of the twocommunities selected (Efopu-Ekile and Igba) as both were about 20 kilometres fromthe main road down narrow, muddy tracks that become impassable after rain.Despite concerns that these constraints might mean that our time in the communitieswas limited, the research team decided to stick to the randomly selected communitiesin order to preserve the integrity of the sampling process and avoid the risk that thestudy only examined communities that were easily accessible (and thus likely toreceive more regular support and monitoring visits).
Section 6
33Sustainability and equity aspects of total sanitation programmes
The community selection criteria imply that the project communities should besignificantly poorer, and have significantly lower access to sanitation, than anaverage rural community in Nigeria.
Selection of study communities The research design recommends that the sample communities be clustered insimilar physical and social contexts in order to minimise differences between thestudy communities. The limited time available dictates that a maximum of threestates can be included in the fieldwork, and that at most two to three communitiescan be visited in each state.
Benue state provides 23 of the 44 sample frame communities (52% of the total) and, therefore should be one of the states visited during the fieldwork. Enugu state adjoins Benue state, and was one of the two states with particularly poorperformance, thus it is recommended that it should also be visited. Finally, Jigawastate represents the North West Region, with particular interest because of its high success rate: three of the six project communities in Jigawa achieved latrinecoverage of 95% or higher, despite starting from pre-intervention coverage levels of less than 2%.
The random stratified selection of communities in Benue state:
� Two of three high performers in Ado LGA = Efopu-Ekile (small) and Igba (non-small)
� One of eight median performers = Mbagbor (Vandeikya LGA)
� One of twelve low performers = Tse-Agera (Logo LGA)
The random stratified selection of communities in Enugu state:
� Two of seven low performers = Mburubu (Nkanu East LGA) and Amagu-Ada Obollo(Udenu LGA)
The random stratified selection of communities in Jigawa state:
� One of three high performers = Duhuwa (Gumel LGA)
� One of two low performers = Molori (Maigatari LGA)
Consultation meeting with the National Task Force for SanitationWaterAid in Nigeria invited members of the National Sanitation Task Force to theinception consultation meeting on Friday 8 August (held in the Parkview Hotel,Abuja). WaterAid in Nigeria also invited its State Programme Managers from Benue and Jigawa to attend the inception meeting.
The purpose of the meeting was to discuss the objectives and methodology of thestudy, to cross-check the data analysis that formed the basis for the fieldworkdesign, and to finalise the selection of communities for the fieldwork.
During the meeting, the WaterAid State Programme Manager for Jigawa presentedsome updated monitoring data on Molori (Maigatari LGA), which suggested that the
Section 6
32 Sustainability and equity aspects of total sanitation programmes
17 Molori data is based on the revised figures provided by the WaterAid State Manager for Jigawa18 The WaterAid in Nigeria survey data suggested only 91 households in Mbaazenger (household size 46), but further investigation revealed
these were ‘compound households’ and that the correct total was 330 households. In addition, about half of the existing latrines are sharedby several households
19 The current sanitation coverage in Mburubu was not available
Population data Sanitation data (household latrines)
Community Performance State No. No. Hhd size Initial Current Coveragehhds size (No.) (No.) (%)
Duhuwa High Jigawa 1,398 128 10.9 0 128 100%
Efopu-Ekile High Benue 300 15 20.0 3 15 100%
Igba High Benue 2,600 124 21.0 49 124 100%
Molori17 Median Jigawa 1,431 130 11.0 0 112 86%
Mbagbor Median Benue 4,800 264 18.2 24 195 74%
Mbaazenger18 Low Benue 4,180 330 12.7 34 35 38%
Amegu-Ada Low Enugu 5,070 230 22.0 41 48 21%
Mburubu19 Low Enugu 2,720 280 9.7 29 ? ?
Average 2,812 158 19.8 23 94 59%
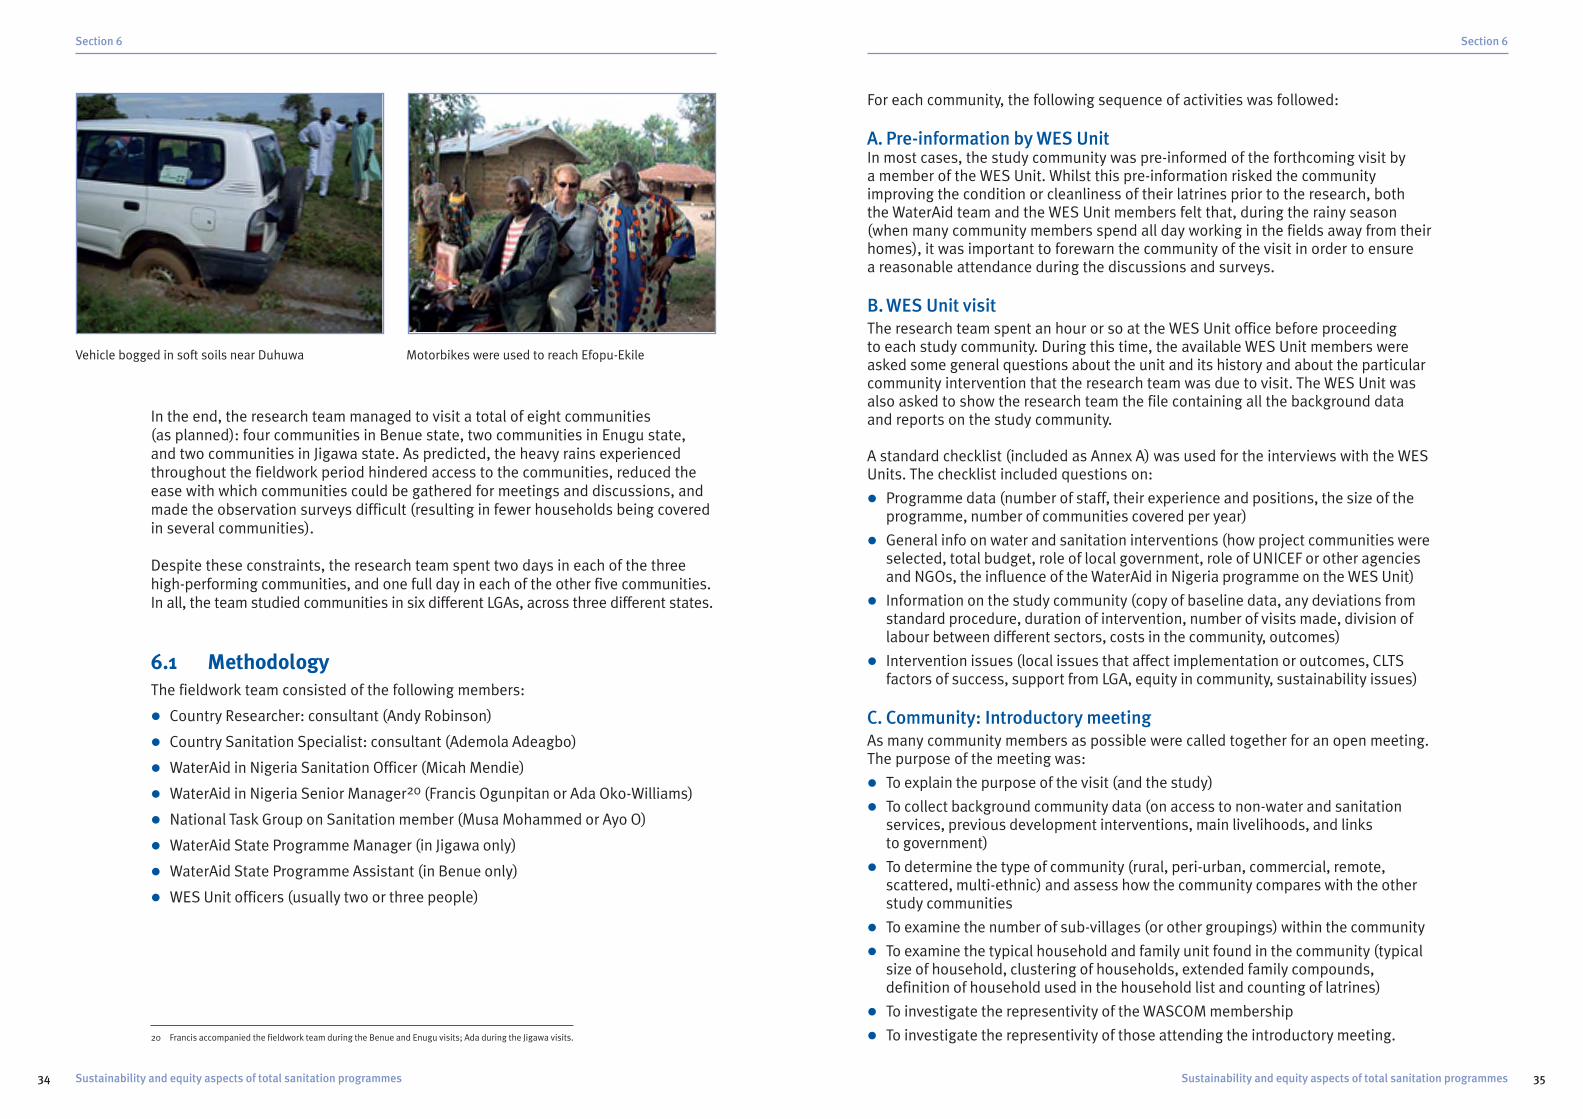
For each community, the following sequence of activities was followed:
A. Pre-information by WES UnitIn most cases, the study community was pre-informed of the forthcoming visit by a member of the WES Unit. Whilst this pre-information risked the communityimproving the condition or cleanliness of their latrines prior to the research, both the WaterAid team and the WES Unit members felt that, during the rainy season(when many community members spend all day working in the fields away from theirhomes), it was important to forewarn the community of the visit in order to ensure a reasonable attendance during the discussions and surveys.
B. WES Unit visitThe research team spent an hour or so at the WES Unit office before proceeding to each study community. During this time, the available WES Unit members wereasked some general questions about the unit and its history and about the particularcommunity intervention that the research team was due to visit. The WES Unit wasalso asked to show the research team the file containing all the background dataand reports on the study community.
A standard checklist (included as Annex A) was used for the interviews with the WESUnits. The checklist included questions on:
� Programme data (number of staff, their experience and positions, the size of theprogramme, number of communities covered per year)
� General info on water and sanitation interventions (how project communities wereselected, total budget, role of local government, role of UNICEF or other agenciesand NGOs, the influence of the WaterAid in Nigeria programme on the WES Unit)
� Information on the study community (copy of baseline data, any deviations fromstandard procedure, duration of intervention, number of visits made, division oflabour between different sectors, costs in the community, outcomes)
� Intervention issues (local issues that affect implementation or outcomes, CLTSfactors of success, support from LGA, equity in community, sustainability issues)
C. Community: Introductory meetingAs many community members as possible were called together for an open meeting.The purpose of the meeting was:
� To explain the purpose of the visit (and the study)
� To collect background community data (on access to non-water and sanitationservices, previous development interventions, main livelihoods, and links to government)
� To determine the type of community (rural, peri-urban, commercial, remote,scattered, multi-ethnic) and assess how the community compares with the otherstudy communities
� To examine the number of sub-villages (or other groupings) within the community
� To examine the typical household and family unit found in the community (typicalsize of household, clustering of households, extended family compounds,definition of household used in the household list and counting of latrines)
� To investigate the representivity of the WASCOM membership
� To investigate the representivity of those attending the introductory meeting.
Section 6
35Sustainability and equity aspects of total sanitation programmes
In the end, the research team managed to visit a total of eight communities (as planned): four communities in Benue state, two communities in Enugu state, and two communities in Jigawa state. As predicted, the heavy rains experiencedthroughout the fieldwork period hindered access to the communities, reduced theease with which communities could be gathered for meetings and discussions, andmade the observation surveys difficult (resulting in fewer households being coveredin several communities).
Despite these constraints, the research team spent two days in each of the threehigh-performing communities, and one full day in each of the other five communities.In all, the team studied communities in six different LGAs, across three different states.
6.1 MethodologyThe fieldwork team consisted of the following members:
� Country Researcher: consultant (Andy Robinson)
� Country Sanitation Specialist: consultant (Ademola Adeagbo)
� WaterAid in Nigeria Sanitation Officer (Micah Mendie)
� WaterAid in Nigeria Senior Manager20 (Francis Ogunpitan or Ada Oko-Williams)
� National Task Group on Sanitation member (Musa Mohammed or Ayo O)
� WaterAid State Programme Manager (in Jigawa only)
� WaterAid State Programme Assistant (in Benue only)
� WES Unit officers (usually two or three people)
Section 6
34 Sustainability and equity aspects of total sanitation programmes
Vehicle bogged in soft soils near Duhuwa Motorbikes were used to reach Efopu-Ekile
20 Francis accompanied the fieldwork team during the Benue and Enugu visits; Ada during the Jigawa visits.

The size of each of the following groups was determined and, wherever possible,individual households (from these groups) were identified on the household list:
� Migrant households (new households from outside)
� New adult households (young adults that have formed new households)
� Female-headed households
� Elderly-headed households
� Orphan households
� HIV/AIDS households
� Households with disabled member(s)
� Landless or extremely poor households (no assets or income)
� Minority ethnic groups
� Minority religious groups
In each case, the sanitation status of the group was determined (number of householdswith improved sanitation facilities, traditional latrines, or practicing open defecation).The focus group were also asked whether any latrine pits had filled, and whether anyhouseholds had built improved latrines with twin pits, or had upgraded their latrinesin any way since the original intervention.
F. Community: Observation surveyThe mapping data and the household list were then used to select a sample ofhouseholds for the observation survey. Wherever possible, the sample set included:
� All of the disadvantaged households identified
� All of the new households identified
� All of the open defecation households
� All of the households with collapsed latrines
� A random sample of the rest of the households
In large communities, or communities where one or more of the disadvantaged orspecial case groups was too large to be visited in the time available, a sample wastaken from the relevant groups.
The random sample was chosen by selecting between one in three and one inseven21 of the non-disadvantaged and non-special households, using intervalsampling (every third to seventh name, depending on the sample fraction chosen)starting from a randomly chosen name on the household list. Where specificdivisions had been identified within the community, for example, the two ethnicgroups in Duhuwa, and the distinct sub-villages in Mbagbor, stratified randomsamples were taken (ie specific groups were identified for visits – three of the eightsub-communities in Mbagbor – and interval samples were selected from within eachof the separate groups).
Section 6
37Sustainability and equity aspects of total sanitation programmes
In each community, the following data were recorded (in addition to the datarequired by the community data form):
� The number of community members at the meeting (men, women, children)
� The number of community members from each sub-village at the meeting (to check representation of the different sub-groups within the community)
� The number of WASCOM members at the meeting (and their sub-village)
A standard pro-forma was used to facilitate collection of data in activities 3-5(community data, water and sanitation information, and mapping data). The formsare included as Annex C.
At the end of this activity, the WASCOM members were asked whether they couldshow the research team their records: the visit book (which should record all visitsby the WES Unit and other support staff ) and the file containing the interventiondocuments (including baseline survey data, wealth ranking, and any lists ofhouseholds detailing changes in sanitation status).
D.Community: Water and sanitation informationThe same community group was used for the next activity: the collection ofinformation on water and sanitation services within the community (see Annex C).
The community group was asked to provide details of the water supply situationbefore and after the intervention and the sanitation situation (number of latrines,number of open defecation households, location of open defecation sites) before andafter the intervention. The women and children in attendance were asked (separately)to confirm that the situation described was accurate, and to note any differences intheir understanding and use of water and sanitation services in the community.
The community group was also asked for details about whether an application wasmade for the intervention and, if so, the reasons for applying, and the main driversof the application and subsequent activities. The community was then asked todescribe the process (the main steps involved) and the sanitation outcomes.
Specific questions were asked about the role of the sani-centre: what was its currentstatus; how many latrine slabs (and other major latrine components) had been sold(for what price), what other goods had been bought, supplied and sold, and whathad been done with any income obtained, or with any unsold materials.
Finally, the community group was asked about any problems faced during theconstruction of the latrines and during the subsequent use and maintenance of thelatrines. In particular, the numbers of collapsed, damaged and abandoned latrines wererecorded, along with the community suggestions as to the cause of these problems.
E. Community: Mapping dataThe mapping exercise was conducted with a smaller group – usually a couple ofWASCOM members, at least one representative from each sub-village in thecommunity, and a couple of women. The purpose of this exercise was to collect andverify more detailed information on different groups within the community. Thestarting point for this exercise is a complete list of the households in the community.
Section 6
36 Sustainability and equity aspects of total sanitation programmes
21 The sampling fraction was chosen to provide an appropriate total number of households to visit (based on the time available for the survey)

Methodology note: Measurement of open defecation statusIn each case, visits were made to sample households from three different categories:� Disadvantaged households (purposively selected from a list of those with known
disadvantages – generally female-headed households, elderly-headed households, or households containing disabled members)
� Special case households (purposively selected from lists of known special cases, such asopen defecation households, households with collapsed latrines, and new households)
� Random households (randomly selected from a community list that excluded thedisadvantaged and special case households, with the sample size determined by the time remaining to complete the observation fieldwork).22
The proportions of open defecation (as reported by the household, or where no latrineobserved by the team), collapsed latrines, shared latrines, and private latrines found ineach of the three observation sample sets were then applied across the entire categorypopulation (eg the percentage of open defecation among the sample disadvantagedhouseholds was applied to the total number of disadvantaged households in thecommunity). These totals were then summed to give the overall open defecation andlatrine status in each community, as reported below.
The research hypothesis is that ‘achieving ODF status is a necessary but not sufficientcondition for the entire community to use and maintain hygienic latrines in the longterm. Therefore, the main focus of the study was intended to be on the long termoutcomes (sustainability and equity) in communities that have declared ODF status.
In Nigeria, only seven communities (from among all of the 45 community interventionsinitiated in 2005 and 2006) have reached ODF status, which limited the extent towhich the research hypothesis could be investigated. Furthermore, the seven ODFcommunities are found in only four of the fifteen LGAs in which WaterAid operates.
Three of the seven ODF communities were included in the study sample; the remainingfive study communities were either median performers or low performers, includedin order to examine the factors that influence the achievement of ODF status.
7.1 Community boundariesRural communities in Nigeria rarely comprise one homogeneous settlement, whichmakes it difficult to decide where one community starts and another ends. Mostcommunities comprise several sub-villages (or hamlets), and the project communitymay form part of a larger community.
The criteria that define a community are important in a community-wide ODFapproach, as the boundaries of the project community define the extent of theintervention and, therefore, the impacts and benefits generated by anyimprovements in sanitation behaviour.
The critical issue for a total sanitation programme is that the community’s defecationsites, hence the contamination routes between these sites and the communitymembers, are generally distinct from those of the neighbouring communities. Whereit becomes difficult to separate the defecation sites or the contamination routes,then it makes more sense to treat the larger, combined settlement as one community.
Efopu-Ekile: not a distinct communityThe visit to Efopu-Ekile (Ado Lga, Benue state), reported to contain only 15households in the WaterAid in Nigeria data, revealed that it is actually a smallhamlet surrounded by a much larger community. Efopu is one of the ten hamlets ofEkile but, unlike some other communities in Benue in which each hamlet is a distinctsettlement, Efopu is bordered on all sides by other hamlets. Akpoge, Ogbilolo and
Running head
39Sustainability and equity aspects of total sanitation programmes
The fieldwork team divided into two groups for the observation surveys in order tocover as many households as possible. In most cases, the survey teams did notmanage to cover the entire list of sample households due to the large distancesbetween settlements in most of the communities, the adverse weather conditions(heavy rain during most of the fieldwork period), and difficulties in finding some of the households on the community list. Nevertheless, 276 households weresurveyed,23 which means that almost one in five (18%) of the households in theeight study communities were visited and observed directly by the research team.
The observation survey also acted as a partial transect walk. The two survey teamsvisited most parts of each community during their search for the samplehouseholds, which enabled them to inspect and verify the facilities and issues raisedduring the earlier community discussions.
G.Community: Focus Group DiscussionsAfter completing the observation surveys, the research team held Focus GroupDiscussions (FGDs) to probe more deeply into any issues uncovered during thecommunity discussions, mapping exercise, and observation surveys. By this stage of the process, the research team had a much better understanding of thecommunity and the key issues, thus the FGDs could be more targeted and effective.The research team usually split into two groups to hold the FGDs.
In general, FGDs were held with a group of women (who were often hard to involve inthe open community discussions), and with any minority groups, for example, withFulani households in Duhuwa community, or with members of sub-villages that hadbelow average access to services. The checklist that was used during the FGDs isincluded as Annex B.
Section 6
38 Sustainability and equity aspects of total sanitation programmes
Section 7
Findings and analysis
22 The number of randomly sampled households visited in each community varied between 17 and 32, except in Amegu-Ada Obollo and Molori(where a smaller number of purposively sampled households were visited, due to time and weather constraints)
23 The survey households included 203 selected households (either randomly or purposively selected) and an additional 73 households foundto be sharing the sanitation facilities of the survey household

Yet, in both Duhuwa and Molori, the Fulani households that live outside the mainsettlement are still considered part of the community. When asked why this was so,the WASCOM members in both communities noted that they share their water supplieswith the Fulani, and that both groups are ruled by the same community head.
Further investigation in Duhuwa revealed that the community is divided more or less equally, with 73 Hausa households living in the main settlement and 69 Fulanihouseholds living largely in scattered family groups within one to three kilometres of the main settlement. The main settlement is closely packed, making it hard topractice open defecation without being observed by a neighbour; but some of theFulani households have no one living within 500 metres of their compound, aresurrounded by fields, and therefore have few external constraints on their behaviour.
In Molori, the community was split between two main Hausa-dominated settlementslocated about one kilometre apart, with scattered Fulani compounds. Each settlementhad its own community headman, but (prior to the intervention) both settlementsshared the use of a single water supply (a 60 metre deep hand-dug well situated inthe fields in between the two settlements), and this common resource use appearsto be the main reason that the two settlements were considered as one community.
Interestingly, the WaterAid in Nigeria data reports a total of 130 households in thecommunity. Unfortunately, the WES Unit was unable to find the relevant file (as all of the documents were either in a huge pile of loose paper, or piled outside theoffice being eaten by termites), and the community was unable to produce anydocumentation that showed a complete list of households. The only relevantdocument uncovered was partial: two pages of the wealth ranking, detailing only 68 households. At the outset, the wealth ranking list of 68 households was assumed to be incomplete (missing the remaining 62 households from the total of 130 households). However, when asked to detail the number of households usinglatrines or practising open defecation, those present at the community meetinglisted only 62 households (and, when asked, confirmed that this included everyhousehold in the community).
Section 7
41Sustainability and equity aspects of total sanitation programmes
Unogwu hamlets border Efopu directly, with some houses less than 10 metres fromthose in Efopu. To an outsider, there is no obvious boundary between the hamlets,which all appear part of a larger, relatively homogeneous community. From a totalsanitation perspective, it is clear that open defecation by any of the adjacenthamlets will impact directly on the inhabitants of Efopu, whether or not this hamlethas managed to become ODF.
The visit to Efopu-Ekile also confirmed another common problem: the exaggerationof the community population by the community representatives. The first baselinesurvey of Efopu-Ekile reported the community population as 2,600, which wouldimply about 300-500 households. However, when compiling the wealth ranking, theWES Unit realised that this was a significant exaggeration and investigated further.The wealth ranking forms listed 36 households but it transpired that even this listhad been exaggerated, as more than half the people on the list (mostly familymembers) lived elsewhere.
The final twist was that, when a list of completed and in-use latrines was compiled,the WASCOM under-estimated the population (at 15 households) in order to claimthat they had achieved ODF status. In fact, whilst all 15 households on the completed‘monitoring checklist for household latrine’ had received latrine slabs and builtlatrines, one of those on the list (who happened to be the WASCOM Chairman’sdaughter) lived several kilometres away in another hamlet of Ekile, and the transectwalk and observation survey revealed that another eight households were not listed,including several tenant households that do not have access to a latrine. The finalpopulation of Efopu-Ekile was estimated at 164 people in 22 households.
Duhuwa and Molori: a tale of two settlement typesAnother important issue was uncovered in the two study communities in Jigawa. Two main ethnic groups are found in the Gumel and Maigatari LGAs: Hausa andFulani. Apart from their cultural differences, the most obvious distinction betweenthe two groups is that many of the Fulani households remain semi-nomadic, shiftingtheir huts and homesteads a short distance every year. Discussions with Fulanihouseholds from the two study communities suggested that they do not normallymove outside of their grazing plots, thus that most annual movements are of lessthan 500 metres.
Some Fulani live in the main Hausa settlements in permanent, closely-clustered,mud-built housing, but the majority live in small clusters of round, thatched huts,which are moved and rebuilt every year. As a result of these distinct living practices,as well as cultural differences, the two groups respond very differently todevelopment interventions.
Section 7
40 Sustainability and equity aspects of total sanitation programmes
Duhuwa: Hausa mud buildings in main settlement Fulani thatched huts in remote compound

In Igba, where there was no common language, all of the discussions had to be held in English and then be translated into Ufia by a member of the community. As the English-speakers were the more educated and influential members of thecommunity, efforts were made to select a translator that was not a member of theWASCOM, as they might be tempted to alter the tone and emphasis of thediscussion in their favour. However, despite our best efforts, the translation situationwas not ideal – the translator appeared to mis-translate some questions andanswers, the translator was not trained in asking open and positive questions in a participatory manner, and the community responded differently to questionsposed by one of their own (including some heckling of the translator’s efforts fromrowdier members at the community meeting).
GenderThe participation and involvement of women in the research discussions andactivities was relatively low, despite the best efforts of the research team. A smallnumber of women (and girls) were present at almost all of the meetings, but wereoften relatives of the WASCOM members (therefore unlikely to raise any issues thatmight cast the WASCOM in a bad light), and rarely contributed unless asked a directquestion by a member of the research team.
FGDs were held with a group of women in several communities, but in somecommunities it was not possible to gather a group of women together. Malecommunity members noted that women were busy working in the fields during therainy season, that women had to cook the meals (when meetings were held duringthe midday period), and generally made it clear that women had little to do with thedecision-making and management of either community or household resources.
Fulani women are not allowed to say the name of their husband, as this practise is thought to bring bad luck, thus it proved difficult to hold detailed discussions with the female members of Fulani households during the observation surveys (for instance, when no male household members were available).
7.3 Initial conditions: Basic servicesThe community background data confirmed significant differences in the context and development status of the study communities. Broadly speaking, the two studycommunities in Enugu state were large, relatively urban in nature, and easilyaccessible by road; with better access to basic services (schools, health posts,electricity, markets) and water supply (majority of households had private hand-dugwells) than found in the other states.
The four study communities in Benue state were more remote, scattered settlementswith lower access to basic services. Small groups of households form open compounds,often with large distances (up to 1 kilometre) between compounds in the samevillage. Access to water supply was variable, with fewer private water sources thanfound in Enugu.
Section 7
43Sustainability and equity aspects of total sanitation programmes
Heavy rain brought a premature end to the visit and meant that it was not possiblefor the research team to explore this discrepancy any further. However, the communityconfirmed during earlier discussions that there were numerous Fulani householdsliving outside the two main settlements, and it seems likely that the larger number(130 households) includes these Fulani settlements, while the smaller numbers (62-68 households) comprise only the population living in the two main settlements.
Mbaazenger and Mbagbor: big, scattered communitiesThe two communities from Vandeikya LGA (Benue state) are both large, scatteredcommunities: the baseline surveys suggest 4,800 people in Mbagbor and 4,180people in Mbaazenger, although these estimates seem on the high side (as averagehousehold size appeared smaller than these population estimates suggest).
Mbagbor is divided into eight sub-villages, each of which contains enough people,and is geographically distinct enough, to comprise a separate community. TheMbagbor community meeting attracted more than 40 people, but 88% of them werefrom only two sub-villages, leaving only five people to represent the other six sub-villages. Within sub-villages, the housing compounds (usually an unfencedcluster of three to six huts) were scattered and the sub-villages were as far as 1000 metres apart in some cases. In general, it appeared that the defecation sites of one sub-village would have little impact on adjacent sub-villages, and that manyof the housing compounds would be unable to observe the sanitation behaviour ofeven the nearest of their neighbours (due to the distance between compounds, andthe relatively dense bush).
In Mbaazenger, the baseline survey reported 330 households, but the more recentWaterAid in Nigeria monitoring data reported only 91 households. It transpires that,following the introduction of the CLTS approach, the WES Unit and the WASCOMmembers decided that each compound household (which comprises an average of three to four individual households living in a small cluster of huts) should share a latrine, and that the compound household should be used as the unit ofmeasurement. While this decision would not affect the declaration of ODF status, as the key issue is use of latrine (rather than use of an individual household latrine),it did make the CLTS process in Mbaazenger appear more successful than it should,as fewer latrines had to be completed before the WES Unit and the community couldreport a high latrine coverage. In order to assess more accurately the proportion ofshared latrines, and any exclusion issues, this study has used the original baselinepopulation of 330 households.
7.2 Cultural issues
LanguageNigeria is a country of more than 500 languages, and communication proved difficultin several communities. For instance, the people in Igba community speak the localUfia dialect, which is so different to other local languages that, not only could noneof the Nigerian members of the research team understand it, even the members ofthe local WES Unit, who live only 50 kilometres away, could not understand a word.
Section 7
42 Sustainability and equity aspects of total sanitation programmes

The pre-intervention data confirm the low access to both water and sanitationservices in Jigawa, as well as the significantly higher access to water supply found inthe study communities in Enugu state. It had been hoped that, because the WaterAidproject communities are selected based on a vulnerability (and development) ranking,there would be relatively little difference in access to services across the states.However, these data make it clear that the starting conditions are different, andsuggest that these factors need to be allowed for in the analysis of the study findings.
7.4 Socio-economic statusWaterAid in Nigeria has trained the LGA WES Units to conduct a thorough baselinesurvey in each project community. The baseline survey includes social mapping andwealth ranking exercises, which should produce a detailed map of the communityand a list of households (with relative wealth ranking scores provided by three orfour key informants from within the community).
These data are supposed to be kept within the files of both the WES Unit and thecommunity WASCOM as they provide valuable reference points for the monitoringand evaluation of the interventions. In practice, it proved difficult to locate either thesocial maps or the wealth ranking data in a number of cases. Several of the WESUnits were unable to locate any of the baseline information regarding the studycommunities (usually due to storage problems, or loss of paperwork followingrelocation of the office), and it became clear that this information was rarelyconsulted or utilised during their normal activities. Unfortunately, the WaterAid stateteams do not keep copies of this information (other than the summary figures).
In addition, a number of anomalies were uncovered regarding the wealth rankingexercise. In several cases, the summary wealth ranking data reported by WaterAid inNigeria (from the WaterAid state offices) did not tally with the baseline survey data,or with the data contained on the original wealth ranking forms. In every case wherethe wealth rankings did not match, the number of poor households reported in thedata held by WaterAid in Nigeria was higher than the original numbers from thewealth ranking forms.
Duhuwa (Gumel LGA, Jigawa) provides a good example of this problem. Three sets ofwealth ranking data were uncovered for Duhuwa: WaterAid in Nigeria data (reportedby the State Programme Manager), baseline data summarised in the WES Unit file,and the original data extracted from the wealth ranking forms (see chart below). The data provided by WaterAid in Nigeria prior to the fieldwork suggested that 76% of the community were classified as very poor, whereas the data extracted from the original wealth ranking forms reports 0% very poor households, and only17% poor households.
Section 7
45Sustainability and equity aspects of total sanitation programmes
The two study communities in Jigawa state were located relatively close (within 10 kilometres) to larger settlements, and both contained primary schools. But theJigawa communities contained no private water supplies, thus every household wasdependent on public water sources.
Table 4: Communities ranked by access to basic services
Source: Focus Group Discussions with community membersKey: Prim.= Primary school, Sec. = Secondary school
Access to water supply and sanitation facilities before the WaterAid in Nigeriainterventions is shown in Table 5. Igba (Ado LGA, Benue) is the only studycommunity in which more than 20 percent of the households used latrines prior tothe intervention, while neither study community in Jigawa contained a single latrinebefore the WaterAid in Nigeria interventions.
Table 5: Access to water supply and sanitation (before intervention)24
Source: Focus Group Discussions with community members Key: HHds No.= number of households
Section 7
44 Sustainability and equity aspects of total sanitation programmes
24 Ranked by proportion of households with private water supplies
Schools Health MarketCommunity Performance State Primary Secondary Post Electricity distance
Amegu-Ada Low Enugu Yes Yes Yes Yes 3 km
Mburubu Low Enugu Yes Yes Yes 0 km
Duhuwa High Jigawa Yes Yes 9 km
Igba High Benue Yes Yes 8 km
Mbagbor Median Benue Yes 3 km
Molori Median Jigawa Yes 20 km
Efopu-Ekile High Benue 25 km
Mbaazenger Low Benue 20 km
Water supplies Sanitation
Community Performance State Hhds Private % Public No. %(No.) latrines
Amegu-Ada Low Enugu 230 150 65 0 41 18
Mburubu Low Enugu 280 150 54 0 29 10
Mbaazenger Low Benue 330 50 15 0 34 10
Mbagbor Median Benue 264 40 15 0 24 9
Igba High Benue 120 6 5 1 49 41
Efopu-Ekile High Benue 19 1 5 0 3 16
Duhuwa High Jigawa 123 0 0 4 0 0
Molori Median Jigawa 62 0 0 1 0 0

Wealth rankings in study communities
The socio-economic data suggest that the wealth ranking for Mburubu, for which nosupporting documentation was available, under-estimates the relative wealth of thecommunity. The baseline survey found that 51% of households lived in cement-blockhouses with zinc-tin roofs, that 15 people (10 teachers and five local governmentworkers) had salaries, and that a wide range of livelihoods were practiced: farming,palm wine tapping, trading (food, materials, gare), artisanry (brickwork, carpentry), andsand quarrying. Yet the wealth ranking suggests that only 1% of the community are richhouseholds (compared to 4%-18% in other study communities), and that only 25% aremiddle-income households (compared to 30%-67% in other study communities).
The wealth ranking chart suggests that Mbaazenger, Mabgbor, and Mburubucontain a significantly higher proportion of poor households (and fewer middle-wealth households) than the other study communities. In practice, this finding doesnot match either the community data (showing high access to water supply in allthree communities) or the observation survey data.
These three communities are the largest of the eight study communities, thus itseems likely that there is a greater range of wealth, and that their wealth rankingscorrespond to different (higher) categories than those used by the other communities.If the poor and middle categories in these three communities are mapped to themiddle and rich wealth ranks, then their wealth rankings would match more closelywith the other communities.
Given these issues, the main usage of the wealth ranking data has been to compareaccess among the different wealth categories. For example, whether those defined asrich households have similar access to sanitation as those defined as poor households.
Section 7
47Sustainability and equity aspects of total sanitation programmes
Duhuwa: Wealth rankings
The reasons for such dramatic variation in the wealth ranking of this communityremain unclear, although it is suspected that either the community or the WESUnit/LGA wished to exaggerate the proportion of poor households reported by thebaseline. For the purposes of this study, the original wealth ranking data has beenused wherever available.
Few other reliable indicators of socio-economic status were readily available forcomparison. The community groups were asked how many community membersreceived salaries, which provided some idea of the level of subsistence within thecommunity, as well as providing a check on the wealth ranking data (see Table 6). In general, the number of rich households maps reasonably well to the number oflatrines in the community prior to the intervention (with the exception of the Jigawacommunities, which had no latrines before the intervention).
Table 6: Socio-economic indicators (pre-intervention)
Key: No. = number, Hhd = household
Section 7
46 Sustainability and equity aspects of total sanitation programmes
100%
90%
80%
70%
60%
50%
40%
30%
20%
10%
0%
Rich Medium Poor Very poor
Num
ber o
f hou
seho
lds
Wang data Baseline file
Different data source
Original forms
No. salaries No. rich No. latrinesCommunity Perform State (%) Hhds (%) (%)
Efopu-Ekile High Benue 4 (18%) 3 (16%) 3 (16%)
Amegu-Ada Low Enugu 20 (9%) 25 (11%) 41 (18%)
Igba High Benue No data 10 (8%) 49 (41%)
Mburubu Low Enugu 15 (5%) 3 (1%) 29 (10%)
Duhuwa High Jigawa 3 (2%) 17 (14%) 0 (0%)
Molori Median Jigawa 2 (3%) 9 (13%) 0 (0%)
Mbagbor Median Benue No data 11 (4%) 24 (9%)
Mbaazenger Low Benue 5 (1%) 60 (18%) 34 (10%)
100%
90%
80%
70%
60%
50%
40%
30%
20%
10%
0%
Rich hhds Middle hhds Poor hhds
Duhuwa Molori Amegu-Ada Efopu-Ekile Igba M’zenger Mbagbor Mburubu
% in
eac
h w
ealt
h ca
tago
ry
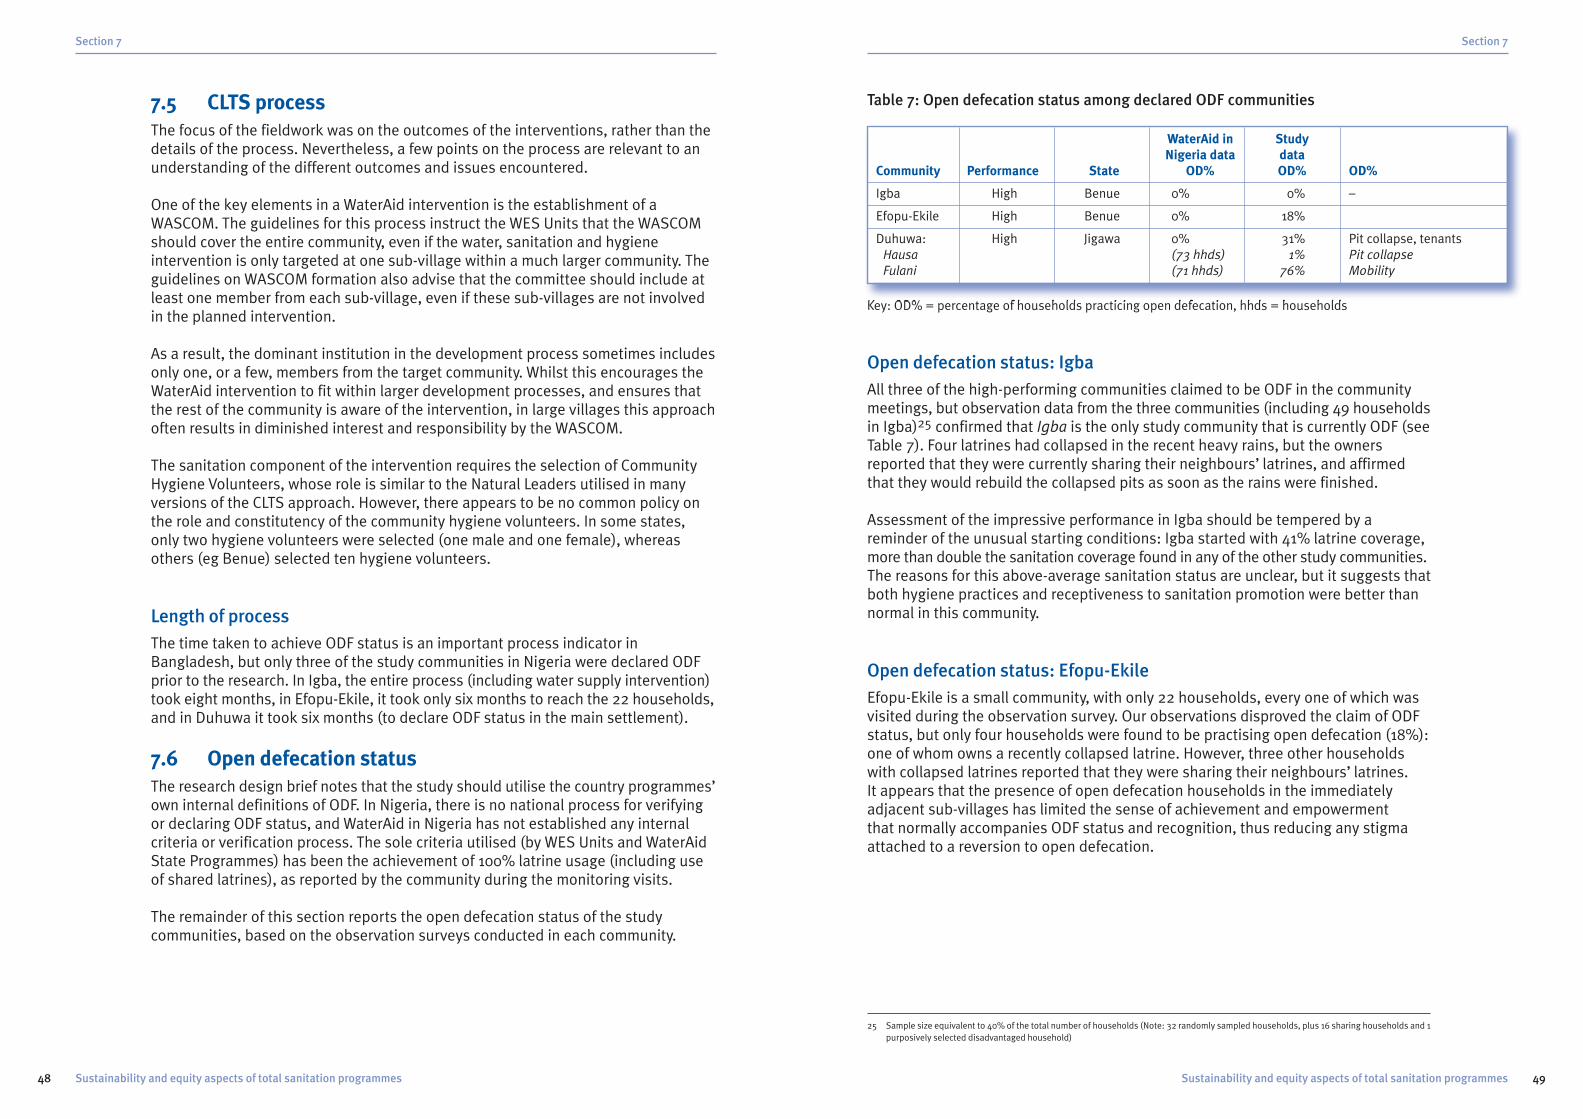
Table 7: Open defecation status among declared ODF communities
Key: OD% = percentage of households practicing open defecation, hhds = households
Open defecation status: IgbaAll three of the high-performing communities claimed to be ODF in the communitymeetings, but observation data from the three communities (including 49 householdsin Igba)25 confirmed that Igba is the only study community that is currently ODF (seeTable 7). Four latrines had collapsed in the recent heavy rains, but the ownersreported that they were currently sharing their neighbours’ latrines, and affirmedthat they would rebuild the collapsed pits as soon as the rains were finished.
Assessment of the impressive performance in Igba should be tempered by areminder of the unusual starting conditions: Igba started with 41% latrine coverage,more than double the sanitation coverage found in any of the other study communities.The reasons for this above-average sanitation status are unclear, but it suggests thatboth hygiene practices and receptiveness to sanitation promotion were better thannormal in this community.
Open defecation status: Efopu-EkileEfopu-Ekile is a small community, with only 22 households, every one of which wasvisited during the observation survey. Our observations disproved the claim of ODFstatus, but only four households were found to be practising open defecation (18%):one of whom owns a recently collapsed latrine. However, three other householdswith collapsed latrines reported that they were sharing their neighbours’ latrines. It appears that the presence of open defecation households in the immediatelyadjacent sub-villages has limited the sense of achievement and empowerment that normally accompanies ODF status and recognition, thus reducing any stigmaattached to a reversion to open defecation.
Section 7
49Sustainability and equity aspects of total sanitation programmes
7.5 CLTS processThe focus of the fieldwork was on the outcomes of the interventions, rather than thedetails of the process. Nevertheless, a few points on the process are relevant to anunderstanding of the different outcomes and issues encountered.
One of the key elements in a WaterAid intervention is the establishment of aWASCOM. The guidelines for this process instruct the WES Units that the WASCOMshould cover the entire community, even if the water, sanitation and hygieneintervention is only targeted at one sub-village within a much larger community. Theguidelines on WASCOM formation also advise that the committee should include atleast one member from each sub-village, even if these sub-villages are not involvedin the planned intervention.
As a result, the dominant institution in the development process sometimes includesonly one, or a few, members from the target community. Whilst this encourages theWaterAid intervention to fit within larger development processes, and ensures thatthe rest of the community is aware of the intervention, in large villages this approachoften results in diminished interest and responsibility by the WASCOM.
The sanitation component of the intervention requires the selection of CommunityHygiene Volunteers, whose role is similar to the Natural Leaders utilised in manyversions of the CLTS approach. However, there appears to be no common policy onthe role and constitutency of the community hygiene volunteers. In some states,only two hygiene volunteers were selected (one male and one female), whereasothers (eg Benue) selected ten hygiene volunteers.
Length of processThe time taken to achieve ODF status is an important process indicator inBangladesh, but only three of the study communities in Nigeria were declared ODFprior to the research. In Igba, the entire process (including water supply intervention)took eight months, in Efopu-Ekile, it took only six months to reach the 22 households,and in Duhuwa it took six months (to declare ODF status in the main settlement).
7.6 Open defecation statusThe research design brief notes that the study should utilise the country programmes’own internal definitions of ODF. In Nigeria, there is no national process for verifyingor declaring ODF status, and WaterAid in Nigeria has not established any internalcriteria or verification process. The sole criteria utilised (by WES Units and WaterAidState Programmes) has been the achievement of 100% latrine usage (including useof shared latrines), as reported by the community during the monitoring visits.
The remainder of this section reports the open defecation status of the studycommunities, based on the observation surveys conducted in each community.
Section 7
48 Sustainability and equity aspects of total sanitation programmes
25 Sample size equivalent to 40% of the total number of households (Note: 32 randomly sampled households, plus 16 sharing households and 1purposively selected disadvantaged household)
WaterAid in StudyNigeria data data
Community Performance State OD% OD% OD%
Igba High Benue 0% 0% –
Efopu-Ekile High Benue 0% 18%
Duhuwa: High Jigawa 0% 31% Pit collapse, tenantsHausa (73 hhds) 1% Pit collapseFulani (71 hhds) 76% Mobility

Open defecation status: MbagborThe WaterAid in Nigeria data for Mbagbor suggested that 195 households wereusing latrines, whereas the observation data suggests that 166 households are usinglatrines (37 households with private latrines and 129 households sharing latrines).
Ten of the forty-three (23%) community members present at the community Mbagbormeeting reported that their household latrines had collapsed during the rainy season,while the mapping exercise confirmed that a total of 15 latrines had collapsed. Giventhat about half the latrines observed were shared (by an average of four households),it seems realistic that these 15 latrine collapses have resulted in about 30 householdsreverting to open defecation (as in every case observed, the latrine collapse hadcaused the households using the latrine to revert to open defecation). In summary, 195households were using latrines at the end of the intervention (estimated total of 78latrines), but 15 latrines (including some shared latrines) have since collapsed, leavingonly 166 households using latrines and 103 households practising open defecation.
Open defecation status: MoloriIn Molori, it appears that the proportion of latrines constructed (and in use) hadbeen over-estimated by the WaterAid in Nigeria monitoring process, in addition tosome confusion over the total number of households in the community.
The baseline survey reported 130 households; the original WaterAid in Nigeriamonitoring data reported 42 households using latrines, but, immediately prior to thefieldwork, the WaterAid State Programme Manager reported that 112 householdswere now using latrines. However, the research team found that the two main Molorisettlements contain only 68 households, while the mapping activity suggested only34 latrines (of which 20 had collapsed in the recent rains).
It seems likely that the original monitoring data was correct: that 42 householdswere using latrines at the end of the intervention and that, due to numerous pit andslab collapses, only 14 households were using latrines at the time of the research.Based on the experience in Duhuwa, the additional 60-70 households (included inthe baseline survey but not listed during the research) are likely to be Fulanihouseholds living outside the main settlements.
The WASCOM confirmed that the Fulani households had not been included in themapping data, and that none of these Fulani households use latrines. Unfortunately,the original list of 130 households could not be found, thus the team was unable toconfirm the exact names and location of those covered by the baseline survey.
The reason for WaterAid in Nigeria reporting higher sanitation coverage than foundin reality (for instance, at the presentation to the NTGS in the inception meeting heldprior to the fieldwork) appears to reflect a mis-communication. It seems likely thatthe WES Unit reported that sanitation coverage in the main settlements hadincreased from the original 67% (42 households out of a total of 62 households),and that the WaterAid State Programme office applied a higher proportion (86%) to the household population held on its files, hence calculating that 112 householdswere now using latrines. This error highlights significant issues within both theWaterAid baseline surveys (which have failed to establish the correct number ofhouseholds in several study communities) and in the WaterAid sanitation monitoringsystem (which has an inadequate checking and verification process).
Section 7
51Sustainability and equity aspects of total sanitation programmes
Open defecation status: DuhuwaAs noted earlier, Duhuwa comprises two distinct ethnic groups. The data above confirmthat 31% of the combined population practices open defecation, but most of this opendefecation takes place in the scattered Fulani settlements (where 76% of householdspractice it). All except one household in the central Hausa settlement use toilets,thus the open defecation proportion drops to only 1% among the Hausa households.
This finding explains why several previous assessments have verified Duhuwa as an ODF community. It appears that previous assessors were unaware that thehouseholds listed in both the baseline wealth ranking (123 households) and,importantly, in the 2007 ‘list of household building a toilet in Duhuwa’ (128households) included a large number of Fulani households living in scatteredcompounds outside the main settlement. As a result, few of the Fulani households(reported to have built a toilet by the WASCOM-prepared list) had been visitedduring previous assessments.
Furthermore, the WES Unit members accompanying the study team confirmed that,while a few Fulani men attended the initial CLTS sessions, little effort had been madeto involve the Fulani in subsequent sessions, to monitor the progress of theintervention among the Fulani households, or to adapt the activities to match thedifferent culture and livelihoods of the Fulani. The WES Unit members also confirmedthat they had not verified in person whether all of the people on the list of those‘building a toilet in Duhuwa’ had actually stopped open defecation and started usinga toilet; instead, the WES Unit monitoring was entirely reliant on the informationprovided by the Duhuwa WASCOM.
Table 8: Open defecation status among non-ODF communities
Key: OD% = percentage of households practicing open defecation, hhds = households
In the other five study communities, the proportion of households practising opendefecation was generally higher than expected in the median-performing communities,and marginally better than expected in the low-performing communities.
Section 7
50 Sustainability and equity aspects of total sanitation programmes
WaterAid in StudyNigeria data data
Community Performance State OD% OD% OD%
Mbagbor Median Benue 26% 38%
Molori: Median Jigawa 14% 71%Molori A (34 hhds) 56% 30% collapsed latrinesMolori B (34 hhds) 85% 34% collapsed latrines
Mbaazenger Low Benue 76% 49% 38 new latrines built
Amegu-Ada Low Enugu 79% 78% Only three new latrines built
Mburubu Low Enugu 90% 90% No new latrines

7.8 EquityWherever possible, disaggregated data were collected in order to allow anassessment of the equity of the interventions.
Equity: Disadvantaged householdsIn six of the study communities, sufficient disaggregated observation data wasavailable to compare the rate of open defecation in disadvantaged households withthat in the rest of the community. The main disadvantaged groups present in thesesix communities were female-headed households, elderly-headed households, andhouseholds with disabled members.
Equity: open defecation
Key OD: open defecation
The data confirm relatively equitable outcomes in the three high-performingcommunities: there is no open defecation among disadvantaged households ineither Igba or Efopu-Ekile and the open defecation rate is only 9% higher among the disadvantaged households in Duhuwa. However, the disadvantaged householdsfare far less well in the median and low performing cases, with open defecation rates 26% to 59% higher among disadvantaged households than in the rest of thecommunity. Given that the baseline (pre-intervention) latrine coverage in thesecommunities was largely among rich and middle-income households (with theexception of Igba, which had 41% latrine coverage), it seems likely that thesedifferentials in open defecation rates reflect the starting conditions, with muchhigher open defecation among the poor and disadvantaged. Therefore, the
Section 7
53Sustainability and equity aspects of total sanitation programmes
Open defecation status: MbaazengerThe research found that the number of households practising open defecation had decreased significantly since the last WaterAid in Nigeria monitoring report. The WaterAid in Nigeria data suggested that only one household had built a newlatrine following the intervention (in addition to the 34 existing latrines before theintervention), whereas the research team found that an additional 38 latrines hadbeen built since the intervention.
The situation in Mbaazenger was further complicated by compound households: the WaterAid in Nigeria monitoring data reported only 91 households, whereas thebaseline survey reported 330 households. Based on the observation data and themapping exercise, the research team estimates that 36 households now use privatelatrines, and another 136 households are sharing latrines. The open defecation rateestimated at 49%, is thus significantly lower than the 76% open defecation rateindicated by the WaterAid in Nigeria monitoring data.
7.7 Child excreta disposalThe difficulty of obtaining reliable data on child excreta disposal (due toconfounding issues when primary carers are asked about excreta disposal practices)and the rapid, observation-based approach used to assess household latrines meantthat little data was collected on child excreta disposal.
In the few cases where primary carers (usually mothers) were available and willing to respond, little of interest was discovered: in households with (or using) latrines,the mothers reported that the child faeces were disposed of into the latrine, inhouseholds practicing open defecation, the mothers reported that the child faeceswere thrown into the bush behind the house (or to the nearest public place). In ahandful of households, the parents reported that they had bought (or been given) a plastic potty from the sani-centre, and that this was used to collect and dispose of infant excreta (either into the latrine or into the bush).
One of the male Fulani household heads in Duhuwa noted that, while the adultswere happy to continue with their life-long practice of open defecation far from thehouse (as, apparently the Fulani do not like anyone to see them defecate or even toknow that they defecate), the young children often defecate in and around the hutsin the compound, especially during episodes of diarrhoea. It was noted that this wasa bad practice, and that the mother, or other women in the household, had to gatherup and dispose of this excreta (to the bush). In answer to a question about whetherhe could see any advantages to latrine use, this Fulani household head noted that itwould be useful to have somewhere for the children to defecate in order to avoidthis problem of child excreta around the compound.
Given the apparent cleanliness of the Fulani people, as evidenced by the well-kemptand tidy compounds found in almost every case, it appears that simple latrinesdesigned for child excreta disposal would be useful as entry points to convinceFulani households that latrine use has some advantages over open defecation.
Section 7
52 Sustainability and equity aspects of total sanitation programmes
Igba
Efopu-Ekile
Duhuwa
Mbagbor
Mbaazenger
Mburubu
0% 20% 40% 60% 80% 100%
% OD indisadvantagedhouseholds
% OD in rest of community

Equity: open defecation by ethnic group
The open defecation rate among Fulani households is more than 50% worse thanthat found in Hausa households. This issue was discussed with the Fulani householdsvisited during the observation surveys, and at an FGD held with Fulani households inDuhuwa. In both discussions, it was noted that the Fulani are semi-nomadic, andthat this mobility prevents them from investing in a permanent latrine. As mentionedearlier, another cultural factor is the Fulani cleanliness and preference to defecate inprivate well away from their home, and even to conceal the practice from the othermembers of their household. As a result, if was felt that the Fulani are reluctant todefecate in a latrine situated close to their home.
It was also stated that, although the Fulani requested to be included in the project,they keep themselves fairly separate from those in the main settlements and tend to stay outside on their farms. Further discussion revealed that only one of the 15-member WASCOM in Duhuwa was a Fulani.
Several Fulani households, generally the richer ones, are more settled and have builtpermanent latrines. The focus group agreed that these Fulani should promote theuse of latrines among the rest of the Fulani households, and work with the WES Unitto develop suggestions for a low-cost mobile latrine that would fit with the Fulanisemi-nomadic lifestyle. It was agreed that, if a Fulani compound household canconstruct six to eight new huts on a new site every year (usually with new materialsto limit termite damage), then it should not be difficult to construct a simple latrine.
Section 7
55Sustainability and equity aspects of total sanitation programmes
successful sanitation interventions have managed to have a significant impact onopen defecation rates among these disadvantaged groups.
In the high-performing communities, the observation data also suggested that thedisadvantaged households had generally built similar latrines to those built by thebottom 35% to 45% of the community, and had maintained them to a similar standard.While the latrines built in these communities were fairly basic, these observationssuggest that the interventions provide similar opportunities to all income groups, andthat low-income households are not substantially prejudiced by their lack of resources.
The only exception was in Efopu-Ekile, where the community had apparently built a latrine for a female-headed household with a disabled member (Grace Ocheje).However, this assisted latrine was generally inferior to the others in the community,and had not been well maintained by the household: the latrine pit was only 0.5metres deep, there was no cover on the squat hole, and the superstructure walls hadcollapsed. It appears that those that had built this free latrine did so because theywere instructed to, rather than because they wanted the community to become opendefecation free (and realised that Grace would be unable to build her own latrine).Given that digging a deeper pit would have taken less than half a day (for a few able-bodied men), this finding is an indicator of limited commitment to the ODF process.
Equity: Ethnic groupsOnly two of the eight study communities contained more than one ethnic group. As commented earlier, the two communities in Jigawa state, Duhuwa and Molori, are both made up of a mix of households from the Hausa and Fulani ethnic groups.
In both cases, the Fulani households comprise about half of the communitypopulation:
� 71 Fulani households out of 144 households in Duhuwa (49%)
� 62 Fulani households out of 130 households in Molori (48%)
Despite an understanding that the CLTS approach requires that every householdstops open defecation, and the inclusion of the Fulani households in the baselinesurvey lists in both communities, it appears that the Fulani households did not playan active part in the CLTS process and, as a result, constructed very few latrines.
Section 7
54 Sustainability and equity aspects of total sanitation programmes
Duhuwa
Molori
0% 20% 40% 60% 80% 100%
76%
1%
48%
Fulani Hausa
100%
30% higher than that claimed by the WASCOM. Nevertheless, it seems clear that theintervention was significantly more effective in sub-villages that contained activeWASCOM members and hygiene promoters.
7.9 Latrine use and maintenance
Shared latrinesShared latrines are common in the study communities. In five of the communities,between 65% and 89% of households using a latrine share it with at least one otherhousehold. Igba, the only ODF community, has the lowest proportion of sharedsanitation, with only 19% of those using latrines sharing with another household.26
Typically, shared latrines are used by between two and four households. In mostcases, because of compound household arrangements, the households sharing the latrine are related to the household that built the latrine (and the sharinghouseholds may also have contributed to the construction of the latrine).
In general, there was little difference between the quality and hygiene of the sharedlatrines (as compared to the private household latrines). In some cases, the sharingof a latrine by a large number of households (five or six) reflected the wealth of thehousehold head and the fact that he had several wives and several adult childrenstill living within his compound. When questioned, most users of shared latrinesnoted that the other households were part of the same family, and that sharing thelatrine was therefore not a problem. However, in one or two cases, the women of thehousehold reported that some of the other households did not clean the sharedlatrine after use, and noted that they did not like having to clean up other people’sexcreta or mess.
Improved sanitation facilitiesThe WHO-UNICEF Joint Monitoring Programme for Water Supply and Sanitation (JMP) define a ‘pit latrine with slab’ as an improved sanitation facility (which countstowards MDG sanitation targets) if the slab is ‘easy-to-clean’, raised above groundlevel, and supported on all sides. The definition of an ‘easy-to-clean’ slab is a matterof some debate among the international water and sanitation community but, for thepurposes of this study, it will be assumed that any slab that is washable (eg concreteor some other impermeable surface) or sweepable (a regular, smooth surface) willbe considered to be ‘easy-to-clean’.
Section 7
57Sustainability and equity aspects of total sanitation programmes
Equity: Relative wealth The household wealth rankings were used to compare open defecation status andlatrine status across the different wealth categories (based on the observation data).The sample sizes in each wealth ranking were relatively small (2-7 rich households, 1-16middle income households, and 3-18 poor households) as some names on the wealthranking list did not match with those surveyed, but the smallest sample comprised 12ranked households in Molori and the largest sample comprised 29 ranked households.
In Mburubu, where the CLTS intervention had no impact (no new latrines or changein open defecation practice), the proportion of improved latrines was higher (33%)among rich households than poor households (8%) and the open defecation ratewas substantially lower (33%) among rich households compared to 83% amongpoor households.
In Duhuwa, the results were equitable among the Hausa households, with zero opendefecation and less than 50% improved latrines in all wealth categories. However,among the Fulani households, where the CLTS intervention had not been effective,the rich households were substantially better off – there was 100% open defecationamong both middle and poor Fulani households, but only 50% open defecationamong the rich Fulani households.
In Igba, all of the rich households had improved sanitation facilities with concreteslabs, compared to only 8% of the middle-ranked households and none of the poorhouseholds. However, open defecation was zero across all wealth categories.
Equity: TenantsMost of the household heads encountered in the study communities were owners(or co-owners) of their homes. However, tenant households were observed in two communities.
In Efopu-Ekile, several of the households practising open defecation were tenantsrenting their houses from absentee landlords. The houses did not have latrines whenthe tenants moved in, and the tenants were reluctant to invest any of their own timeor money in constructing a latrine in a temporary residence owned by someone else.
Similarly, tenants in Mburubu noted that live-in landlords locked the latrine when they were away, forcing the tenants to revert to open defecation during theseshort periods.
Equity: Geographical favouritismIn several of the study communities, the open defecation rate was substantiallyhigher in some sub-villages than in others. For instance, in Mbaazenger, all of thenew latrines were located in the three southern sub-villages, and the only latrinesfound in the northern sub-villages were built prior to the intervention.
In Mbagbor, the WASCOM reported that the open defecation rate varied from zero inTse Nyam to 64% in Tse Anshager. The observation survey (which only covered threeof the eight sub-villages) found that the open defecation rate was, on average, about
Section 7
56 Sustainability and equity aspects of total sanitation programmes
26 Insufficient data was collected to report on the proportion of shared latrines in the two Enugu communities: Mburubu and Amegu-Ada

Maintenance: Cleanliness of latrinesThe observation data includes assessments of latrines that were dirty and badlymaintained. In the five communities where more than ten latrines were surveyed,which also happen to be those with the lowest open defecation rates, only threelatrines out of ninety-three (3%) were found to be excessively dirty.
Only five latrines were inspected in each of the other three communities (due tolimited numbers of latrines, lack of interest by the WASCOM, and time constraints),yet seven of the fifteen latrines observed (47%) were found to be excessively dirty.More than half of these dirty latrines were constructed prior to the interventions,which suggests that, despite being very low-cost, the latrines built under the CLTSapproach are at least as clean and well-maintained as the existing latrines.
Latrine distance to houseHousehold latrines built within large compounds or settlements tended to besituated in or close to the compound (within 5-10 metres). Household latrinesserving Individual houses, or small groups of isolated houses, tended to be locatedsome distance from the house (20-30 metres away). The users of the more distantlatrines usually reported that they were concerned about the smell, or did not wantanyone to know when they were in the latrine, thus locating it some distance fromtheir home.
Section 7
59Sustainability and equity aspects of total sanitation programmes
Improved sanitation facilities
In the five study communities where at least ten latrine observations took place, it isclear that two of the communities with the lowest open defecation rates (Igba andDuhuwa) also have the lowest proportion of easy-to-clean latrine slabs. Whilst thismay seem counter-intuitive, it demonstrates that reducing or eliminating opendefecation is often achieved by allowing some households to build extremely basic,low-cost latrines.
The high proportion of washable (concrete) slabs in Efopu-Ekile reflects the smallsize of the community, which means that the sani-centre budget was sufficient toprovide each household with a domed concrete slab. In Mbagbor and Mbaazenger,38% and 49% of the population (respectively) continue to practice open defecation,which may explain why few unimproved latrines were surveyed. The last populationgroup to be covered often includes the poorest and most reluctant households,usually those most likely to build very low-cost, unimproved latrines.
Section 7
58 Sustainability and equity aspects of total sanitation programmes
Igba
Duhuwa
Mbaazenger
Mbagbor
Efopu-Ekile
0% 20% 40% 60% 80% 100%
Washable Sweepable Not easy cleanImproved latrine: washable slab
Improved latrine: sweepable slab
Unimproved latrine: hard to clean

fly-proofing of the latrines. Either way, it seems apparent that fly nuisance is greaterin Nigeria and, therefore, that greater attention needs to be paid to reducing fly entryand breeding in latrine pits.
Vent pipesThe WES Unit in Ado LGA (Benue state) had encouraged households in Igba andEfopu-Ekile to add vent pipes to their latrines. As a result, the sani-centres providedPVC vent pipes along with the concrete domed slabs, and other households madetheir own bamboo vent pipes.
Every household latrine in Efopu-Ekile had a PVC vent pipe, as did 48% of thelatrines in Igba. Unfortunately, neither the WES Unit nor the community memberswere aware that the gases that vent from pit latrines are extremely corrosive andthat the fly screen sealing the top of the vent pipe needs to be regularly checked. As a result, 75% of the vent pipes in Igba were open, as were 55% of the vent pipesin Efopu-Ekile. Vent pipes attract flies (because of the smell of the exiting gases),hence open vent pipes provide a ready fly entry and exit point and are likely toencourage fly breeding inside the latrine pit.
Ventilated Improved Pit latrines reduce fly nuisance (compared to simple pit latrines)but their successful operation is dependent on three critical features:
� Darkened interior (in order that flies inside the pit are attracted up the vent pipe)
� Flow of air through the open squat-hole and out of the vent pipe (encouraged bysuction at the top of the raised vent pipe, and by air inlets in the superstructure)
� Durable fly screen at the top of the vent pipe
None of these three features were present in the two study communities in Ado LGA.Most of the latrines had no roof (91% in Igba, 82% in Efopu-Ekile), the majority of thelatrines had covers on the squat holes (61% in Igba, 55% in Efopu-Ekile), and, asalready noted, the majority of the vent pipes were not adequately screened. Theobservation data confirms that 27% of the latrines surveyed in Igba had severe flyproblems (indicated by flies exiting the pit immediately on lifting the squat-hole lid,flies seen exiting from the vent pipe, or clouds of flies around the squat-hole), andthat 18% of the latrines in Efopu-Ekile had severe fly problems.
The community members (and WES Unit) agreed that the vent pipes wereencouraging fly nuisance and fly-breeding in the latrine pit, and agreed that theywould ensure that the vent pipes were properly screened in future (using eithercorrosion-resistant plastic mesh or coarse cloth). However, despite the concerns ofthe research team, the community members insisted on two perceived advantagesof the vent pipes (which were deemed significant by the users). Firstly, the ventpipes were thought to reduce smell and, secondly, to reduce ‘heat’ emanating fromthe latrine pit.
The observation data confirm that none of the latrines in Igba or Efopu-Ekile hadproblems with smell (even those without vent pipes).
Section 7
61Sustainability and equity aspects of total sanitation programmes
7.10 Hygienic latrinesThe research design brief identifies four proxy indicators of hygienic latrines:
� Separates human excreta from human contact
� Fly-proof (prevents flies moving from faecal matter to the wider environment)
� Eliminates smell
� Does not contaminate surface water
All of the latrines observed in the study communities were pit latrines. Out of the 109 latrines surveyed, only five (5%) were flush or pour-flush toilets and 95% weredry pit latrines. None of the 109 pit latrines had overflow pipes or effluent outlets,therefore none of them are likely to contaminate surface water.
A few open latrine pits (exposing unconfined excreta) were observed when thelatrine slab or pit had recently collapsed. Several households stated that they werestill using these open pit latrines, although on further questioning it transpired thatthese households were usually defecating at the side of the collapsed latrine andthen sweeping the excreta into the open pit. In these cases, the household wasrecorded as practising open defecation (and owning a collapsed latrine).
In all other cases, the latrine pit was covered with some form of slab. The majority of latrine slabs were mud-covered timber, with some concrete ones observed wheresani-centres were in operation, and a few slabs made from loose-fitting timberplanks. In general, all of the slab-covered latrines examined met the condition that the excreta in the latrine pit were separated from human contact. The onlyexceptions were a handful of cases where an extremely shallow latrine pit (less than0.5 metres deep) had been dug, which meant that the excreta were within reach ofthe squat hole.
The two remaining hygiene parameters examined were whether the latrines were fly-proof, and whether the latrines eliminated smell.
Fly-proof latrinesVery few of the latrines observed in the study communities were fly-proof. During thesurvey, the latrine pits were inspected internally using a torch (wherever possible). In almost every case, the contents of the pit were covered with fly maggots, and, in many cases, flies exited from the pit when the cover was lifted. Clearly, this is a significant hygiene issue as the latrine pits appear to be acting as fly-breedingsites in close proximity to the home, with a substantial risk that flies will transferpathogens directly from excreta to food consumed by household members. Inseveral cases, the fly population within the latrine pit was so large that removal ofthe squat-hole cover released a cloud of buzzing flies. This is likely to be a deterrentto regular use of the latrine.
This finding contrasts significantly with observations of comparable latrines made by Country Researchers in Asian countries, where very few of the latrine pits were infested with fly maggots. This observation may reflect the timing of theobservations during a particularly wet period of the rains, as well as the inadequate
Section 7
60 Sustainability and equity aspects of total sanitation programmes

7.11 Sustainability of sanitation outcomesThe research design brief suggested three proxy indicators of sustainability:
� Full latrine pits are emptied or replaced
� Some households have upgraded and improved their latrines
� New households and in-migrant households are using latrines
� Breakages, pit collapses, and latrine damage are replaced or repaired
Full latrine pitsOne of the most foolproof indicators of latrine usage is a full latrine pit; whathappens after the latrine pit becomes full is a useful indicator of the sustainability ofimproved sanitation behaviour. Unfortunately, the relatively recent initiation of theinterventions in the study communities, and the tendency of many households inNigeria to dig large, deep latrine pits (more than 10% of the latrines observed hadlatrine pits deeper than 3 metres), meant that no full latrine pits were reported.
Therefore, little attention has been paid to what will happen when the latrine pitsbecome full and need to be replaced or emptied. The majority of the latrinesobserved in Nigeria had unlined latrine pits, and relatively simple (easily moved orreplaced) slabs and superstructures. As a result, the best option in most cases willbe to dig a new latrine pit and reconstruct the latrine. WaterAid in Nigeria needs toaddress the issue of latrine replacement and pit emptying in the near future, in order that households know the safe practices to use in emptying latrines (wherenecessary) and that some thought is given to the latrine design in order to simplifyfuture movement or replacement.
Latrine upgrades and improvementsOne of the arguments for the CLTS approach is that, while the first latrines built maybe basic, unimproved sanitation facilities, an important behaviour change has takenplace – the household has chosen to stop open defecation. As the householdbecomes slowly more familiar with using a latrine, it is expected that smallimprovements and upgrades will be made both to the latrine and to the household’ssanitation behaviour.
However, the mapping data and observation surveys report that only one of thelatrines built as a result of the CLTS interventions has been upgraded. In Molori, one rich household used cement plaster to form an impermeable layer on top of itsoriginal mud and timber slab.
This finding suggests that most communities are likely to require some form oftechnical assistance and advice before improving or upgrading their latrines. TheWaterAid State Programme in Benue has already started piloting some latrineimprovements (including appropriate technology pit linings made from bamboo ortimber poles), but there was no evidence of these innovations being adopted in thefour study communities in Benue.
Section 7
63Sustainability and equity aspects of total sanitation programmes
Heat phenomenonThe ‘heat’ issue is a more complex and unusual one. Several members of the researchteam were familiar with this problem from their own experiences, and they characterisedthe issue as hot gases emerging from the pit (usually after lifting the latrine lid) andcausing an unpleasant feeling and a strong, lingering smell. It was suggested thatthis problem was worse on hot days, particularly in the afternoon, and that it wasmost common in institutional latrines with large, lined pits (most references were toschool latrines). A vent pipe would release any hot gases that have collected in thepit, although it may also increase the smell in the vicinity of the latrine.
Apart from being an unusual issue, the research team noted that the heat wasthought to cause illness and infection and that Nigerian girls, in particular, wereoften reluctant to use pit latrines because of the heat problem (and the perceivedrisk of infection). It was also remarked that, because of these experiences, someadults living in urban areas still prefer to defecate in a potty (then empty thecontents into the latrine) rather than sit over a latrine (or even a flush toilet).
In relatively small, unlined latrine pits, any gases that are generated by thedecomposition of the pit contents should, theoretically, be absorbed by the soilsurrounding the latrine pit. The only exceptions would be in impermeable orwaterlogged soils, or where the latrine pit has been solid-lined (so that it acts as a septic tank). However, as far as the research team is aware, there are no diseasetransmission routes (eg that could cause urinary-related infections in users) possiblefrom contact with gases produced by either aerobic or anaerobic decomposition.
The same issue was discussed in several communities, and most of the Nigerianmembers of the research team agreed that it was a common problem. Therefore, it isan issue that needs to be examined and addressed (even if it turns out to be largelya cultural issue, based on urban myths).
SmellFour of the five communities with the lowest open defecation rates had no reports of a smelly latrine. Yet in Duhuwa, fourteen of the twenty latrines surveyed (70%)were reported to be smelly, and five of them (25%) also had serious fly infestations.Furthermore, in Molori, every single latrine inspected was reported to be smelly (100%).
The research team noted that, in general, the hygiene and environmental sanitationconditions in the Hausa households in the two Jigawa communities (Duhuwa andMolori) were not good. Stagnant water was seen sitting in many compounds, flieswere abundant, there was little space between buildings, and animal dung and solidwaste were prevalent inside the walled compounds. The same pattern was evidentwith the latrines, which were generally less well maintained than those seen in othercommunities. In addition, it appeared that some of the latrines were also used aswashing areas, resulting in drainage problems, damage to the mud slabs, andincreased water flow into the pit (with greater risk of collapse).
The lack of private water supplies in these Jigawa communities may be a factor thatlimits good hygiene practice, although the Fulani households within the samecommunity were observed to be substantially cleaner and tidier.
Section 7
62 Sustainability and equity aspects of total sanitation programmes

Table 10: Observed outcomes among households with collapsed latrines
Key: OD% = percentage of households practicing open defecation, Shared = shared latrines, No. = number.
The findings are very similar to those for new households. In the high-performingcommunities, the majority of the households with collapsed latrines are sharingother people’s latrines, while in the low- and median-performing communities, everyhousehold with a collapsed latrine has reverted to open defecation.
In Mbagbor, latrine coverage has dropped 12% since the intervention ended. Themapping data suggest that this drop is entirely the result of 15 collapsed latrines, as all of the households with collapsed latrines have reverted to open defecationsince the collapses.
7.12 Programmatic issues
Water SupplyThe previous (2007) WaterAid in Nigeria CLTS evaluation noted the centrality of watersupply development to the success of the sanitation interventions. However, the watersupply outcomes observed in the eight study communities question this association.
The water supply development ran in parallel with the sanitation intervention in eachof the study communities. In several of the communities, it was suggested that peoplewere asked to dig latrine pits as a condition for the water supply development, and, in general, the relationship between the water supply and the sanitationinterventions, and the relative priority and demand that the community accord toeach, remains unclear.
WaterAid in Nigeria reports that the CLTS interventions are now unconditional, butthe State Programme Manager for Benue noted that 40% latrine coverage is usuallyrequired before the water supply development is started. In Mbagbor, the WASCOMmembers noted that some households dug latrine pits in order to meet the watersupply requirement (of 40% latrine coverage), but abandoned the latrine pits (anddid not finish the latrine construction) once the water supply work was completed.
Section 7
65Sustainability and equity aspects of total sanitation programmes
New households and in-migrant householdsAnother important indicator of collective sanitation behaviour (and outcomes) is the response to new adult or in-migrant households. In a community that genuinelywants to reduce or eliminate open defecation, the new households should bepersuaded either to share an existing latrine, or to construct their own latrine.
Table 9: Observed outcomes among new households
Key: OD% = percentage of households practicing open defecation, Shared = shared latrines, No. = number.
The data from the observation surveys suggests that sustainability is good in thethree high-performing communities (with the exception of the Fulani households inDuhuwa), as every new household was found to be either sharing an existing latrineor using its own latrine. Conversely, 50% or more of the new households in the lowand median performing communities was found to be practicing open defecation.
Collapsed latrinesThe sanitation behaviour of households whose latrine slabs or pits collapse is another good indicator of the sustainability of the sanitation outcomes. Ifhouseholds with collapsed latrines either rebuild their latrine or start sharing aneighbour’s latrine, then the sanitation outcome is deemed sustainable. Conversely,if the household reverts to open defecation after the collapse of its latrine, then thesanitation outcome is deemed questionable.
Observation surveys were conducted at 23 collapsed latrines in six of the studycommunities.27 Most of these pit collapses were due to recent heavy rains andtherefore none of the households had had time to rebuild or replace their latrines(although several of the households claimed that they would rebuild their latrinewhen the rainy season ended).
Section 7
64 Sustainability and equity aspects of total sanitation programmes
27 No collapsed latrines were reported in the two Enugu communities
New households
Community Performance State No. OD% Shared % Latrine %
Igba High Benue 4 0 100 0
Efopu-Ekile High Benue 3 0 100 0
Duhuwa: High Jigawa 19 47 37 16Hausa 9 0 67 33Fulani 10 90 10 0
Mbaazenger Low Benue 2 50 0 50
Mbagbor Median Benue 4 50 50 0
Molori Median Jigawa 6 100 0 0
New households
Community Performance State No. OD% Shared % Latrine %
Igba High Benue 4 0 100 0
Efopu-Ekile High Benue 4 25 75 0
Duhuwa: High Jigawa 3 67 33 0Hausa 2 50 50 0Fulani 1 100 0 0
Mbaazenger Low Benue 1 100 0 0
Mbagbor Median Benue 4 100 0 0
Molori Median Jigawa 7 100 0 0

Community selectionSeveral questions were raised regarding the community selection process. In particular,the two communities studied in Jigawa were sufficiently low on the LGA vulnerabilityranking for their selection to be questionable:
� Duhuwa was ranked number 28 on the vulnerability ranking for Gumel (out of 35 communities, which were the only ones that returned the ranking forms in time– another 54 communities failed to return the forms and were excluded from thevulnerability ranking)
� Molori was not included in the original vulnerability ranking for Maigatari LGA(although the nearby town of Galadi was ranked number 23 out of 40communities) and was only selected because the first choice (Zazzabou) hadalready benefited from a UNICEF subsidy-based sanitation programme.
Institutional latrinesSix of the eight study communities contained primary schools, or had schoolslocated within their larger community. None of these schools had functional latrinesand open defecation was observed immediately behind one of the schools in EnuguState. The WaterAid intervention did not address school sanitation and hygiene, andnone of the communities or WASCOMs noted it as a problem. When asked aboutwhere the students defecated during school hours, the standard response was thatthey went home (or had to wait until they went home).
The one institutional latrine observed was in a recently completed rural health clinicin Duhuwa, where the community was very proud of the fact that a latrine had beenconstructed (in recognition of their efforts to create an ODF settlement).
Barriers to latrine useThe only obvious barrier to latrine use encountered during the fieldwork was amongthe Fulani: both the strong cultural preference for defecation away from sight andhome, and the semi-nomadic lifestyle, create some barriers to latrine use.
There were some reports of gender barriers to latrine use in parts of Benue state,with some communities apparently refusing to allow women to share latrines usedby men. In most cases, only rich households could afford to build two latrines, thusmost other households continue with open defecation rather than tackling thiscultural issue.
7.13 Cost of sanitation outcomesThe financial cost of the WaterAid in Nigeria sanitation programme was examined at two levels: at the WES Unit (based on actual costs reported from the communitylevel activities), and at national level (based on the WaterAid in Nigeria financialreporting system).
Section 7
67Sustainability and equity aspects of total sanitation programmes
Few of the water supply interventions have been successful. Among the eight watersupply projects in the study communities, only three are working without problem.In Mbaazenger, where most households already shared private hand-dug wells, thehandpump is functional but the community estimate that it is used by only about 10 households (3% total population). The other two successful handpumps are inthe two Jigawa communities, where no private water supplies exist and thecommunity water supply is an important resource. However, in Duhuwa, theWaterAid handpump is one of five public handpumps shared by the community, and the community reported that the main utility of the WaterAid handpump was in reducing the length of the queue at the other water points.
The WaterAid handpumps are non-functional in two other communities (boreholeran dry soon after completion in Igba, broken handpump in Mbagbor), and the WESUnit has been unable to find water in Efopu-Ekile, despite twelve borehole attemptsand two failed shallow wells. Finally, both communities in Enugu complain that, whiletheir handpumps are working, the water quality is so poor that only a few householdsuse the handpumps, and even these households use the water only for washing.
In addition, there is little correlation between good sanitation outcomes and goodwater supply outcomes, as the water supplies failed in the two study communitieswith the lowest open defecation rates.
The benefits of an integrated water supply and sanitation approach are called intoquestion by the impact of the failed water supplies on the sanitation interventions.Several of the lower-performing communities stated that the water supply problemshad caused them to lose interest in the sanitation programme. In addition, all of thelatrines are dry (ie no water seal latrines), and therefore do not require water forflushing. There was also little evidence of regular handwashing in any of thecommunities.28 These findings suggest that, even where operational, the watersupply investments have had a limited impact on sanitation or hygiene behaviourimprovements.
The integrated water supply and sanitation approach also complicates the process.The water supply development requires far more technical skills than are needed forthe sanitation intervention and requires a community management structuredesigned to manage and maintain a communal facility, as well as collect money forrepairs. As a result, the WASCOM tends to be designed more for water supply thanfor sanitation, and to be dominated by the more influential male members of thecommunity (rather than by the women that are responsible for most aspects ofdomestic hygiene and sanitation).
Section 7
66 Sustainability and equity aspects of total sanitation programmes
28 Handwashing stands and water containers were present in several communities, but few of them contained water, and when they did,mosquito larvae were generally present (indicating that the water had been sitting in the container for at least a week)

An analysis of the reported investments by households in constructing their latrinessuggests that the average household contribution (including materials, imputed costof labour, and transport costs) was about US$20. This contribution amounts to 28%of the total cost per latrine, with another 7% provided by the local government, andthe remaining 65% provided by the WaterAid programme. The total cost, includinghousehold contributions, is $ 70 per latrine.
The combined sani-centre costs (training and seed money) account for almost 50%of the project costs (excluding household contributions). The software costs includethe training of artisans to build domed concrete slabs (called ‘sanplats’ in Nigeria)and latrine pits. The hardware costs are for the ‘seed money’ provided to thecommunity to establish a small store selling a range of sanitary materials, chosendepending on the local demand.
In Molori (Maigatari LGA, Jigawa), the following materials were supplied to the sani-centre (with purchase and transport arranged by the WES Unit):
� Ten bags cement
� Ten sacks gravel
� One cart of sand
� Three large sacks of Omo washing powder
� Two cartons of soap bars
� Salt
� Batteries
� 40 plastic potties
� 50 rakes
� 50 kettles (plastic water pots with spouts)
� 50 dustpans
� Three shovels
� 60 brooms
� Ten plastic bins
The intention is that the cement, sand and gravel are used to manufacture concretelatrine slabs, each of which requires a half-bag of cement. Therefore, 20 slabs couldbe manufactured with the Molori materials. However, in practice, only one slab wasmade by the Molori sani-centre, and it was provided to the Village Head (who is alsothe WASCOM chairman). The rest of the cement was sold to individuals at N1,600 perbag (US$14), which appears to be a discount as the current price in Maigatari town isN2,600 per bag (US23).
The rest of the sani-centre materials are meant to be sold to the communitymembers, with any income used to re-stock the sani-centre. In practice, thematerials were distributed around the community. Most households appear to havebenefited from the materials, but there was little evidence that anyone had paid foreither the sanitary wares or the bags of cement. As a result, the sani-centre seedmoney is effectively a hardware subsidy.
Section 7
69Sustainability and equity aspects of total sanitation programmes
WES Unit sanitation costsFinancial costs were gathered from four different WES Units. In most cases, theavailable financial data were incomplete, but sufficient data were collected toestablish a reasonable picture of the costs of the sanitation programme at thecommunity and WES Unit levels.
Table 11: Typical WES Unit costs per community: CLTS interventions
All implementation activities are conducted by the local government WES Unit andtherefore some allowance needs to be made for the value of the time spent by theWES Unit on the WaterAid interventions (as a proportion of their salaries). Inaddition, UNICEF has provided some indirect support to the WES Units in the form of capacity building, and the purchase of assets (computers, vehicles, officeequipment). Unfortunately, this cost data was not available, thus it has beenestimated that these external expenditures amount to 10% of the intervention costs.
The financial cost data from the WES Units show that the average external cost percommunity of the CLTS interventions is about $3,000. Given an average communitysize of 165 households, this equates to about US$18 per household (even thoughsome of these households may not have built or used latrines). The household costcompares relatively well with cost data from programmes in Asia, which typicallyaverage about US$10 per household for large-scale CLTS programmes.
However, the cost-effectiveness of the CLTS interventions (cost per outcome) is lessimpressive. The current WaterAid in Nigeria CLTS interventions are only managing toincrease sanitation coverage by about 37% (from initial coverage of 10% up to 47%),equivalent to an average of about 60 new latrines in each community. Based on thisoutcome, the costs provided by the WES Units suggest that the average cost of eachCLTS latrine is about US$50, including $11 in direct support costs (22%), $28 insoftware costs (55%), and $12 in hardware costs (24%).
Section 7
68 Sustainability and equity aspects of total sanitation programmes
29 Based on an average of 60 new latrines per community (calculated from the WaterAid in Nigeria CLTS data for 2006-07 and 2007-08)30 Salaries and resources paid by local government. Expenditure data were unavailable, thus it was estimated that these costs might amount to
10% of the intervention costs
Cost per communityCost per Cost per
Activities Naira N US$ household latrine29
Programme costs (training, baseline) N 45,000 $ 391 $2.40 $ 6.50
Software (hygiene/IEC) N 10,000 $ 87 $0.50 $ 1.40
Software (CLTS and follow-up) N 100,000 $ 870 $5.30 $ 14.50
Software (sani-centre training) N 80,000 $ 696 $4.20 $ 11.60
Hardware (sani-centre) N 80,000 $ 696 $4.20 $ 11.60
Programme Total N 315,000 $ 2,740 $16.00 $ 45.60
Local government expenditure30 N 31,500 $ 247 $1.60 $4.60
Household contributions N 135,600 $1,200 $7.40 $20.00
Total cost N482,100 $4,187 $25 $70.20

Efopu-Ekile was the only community where everyone benefited from the sani-centreslabs. All of the new latrines were built using sani-centre slabs, and several of theexisting latrines were renovated using a new slab. In addition, a slab was provided to the WASCOM Chairman’s daughter (living in another community), and to twohouseholds in the adjoining community. The sani-man claimed that the WASCOMChairman had paid for his slab, and that the Secretary had paid for half of his slab,but agreed that no one else had paid for their slab. On further questioning, the sani-man was unsure of the price paid and could not produce any evidence of the currentstatus or usage of the money collected. It appears that, in this small community, thesani-centre seed money was sufficient to provide a free slab to almost everyhousehold: effectively, a hardware subsidy of US$50 per household.
In total, only 16 sani-centre slabs were found in use in the other seven studycommunities. Assuming that the seed money provided to each sani-centre wasN80,000 (US$700), this means that each of these slabs cost WaterAid in Nigeria aboutUS$300. In addition, the main people to have benefitted from these free slabs are thecommunity heads and WASCOM members, who are generally non-poor households.
WaterAid in Nigeria sanitation costsWaterAid in Nigeria provided data on its sanitation programmes from the centralfinancial system. These costs have been broken down into four categories, as shownin Table 13, which presents the CLTS costs from the financial year 2007-08.
Table 13: WaterAid in Nigeria sanitation costs (2007-08 financial year)
Several interesting findings arise from this examination of costs. Firstly, that thenational costs are allocated differently to the local level costs, as both the CLTSsoftware and sani-centre hardware costs are substantially lower (per community),whereas the hygiene and IEC software costs appear significantly higher.
The WaterAid support costs appear to almost double the cost per household, withUS$16 in local costs increased to a total of US$30 per household. The additionalUS$14 per household is spent on direct support costs such as consultancies,workshops and trainings, studies, and substantial spending on advocacy campaigns.
Section 7
71Sustainability and equity aspects of total sanitation programmes
The problem with this approach is that the WASCOM is left to allocate the materialsgiven to the sani-centre. The only successful sani-centre observed was in Duhuwa,where the sani-centre has become the only store in the community, and continues to stock a wide range of sanitary wares.31 However, even here, the sani-centre hadsupplied only four latrine slabs to the community. In all other cases, the sani-centrefunds had been used to purchase materials (mostly cement, sand and gravel) whichhad then been distributed to a small number of households without any charge.
Table 12: Sani-centre production
Key: No. = number
Only a handful of households (usually WASCOM members) claimed to have paid forthe slabs given to them by the sani-centre, and most households using sani-centreslabs were unaware of the price that they were supposed to have paid. None of thesani-centres (except Duhuwa) were able to provide evidence that any money had beenpaid, or that any money was available to purchase more materials for the sani-centre.
In Amegu-Ada, the sani-centre was reported to have produced 30 concrete slabs, butnot one slab has been sold or put to use (as the community reported that they wereconcerned that the unreinforced concrete slabs would be unsafe). Thirteen of theslabs were lying unused in the grass beside the school building.
Section 7
70 Sustainability and equity aspects of total sanitation programmes
31 Slab-making materials, soap, mosquito coil, potties, permethrin (for impregnating mosquito nets), washing powder, candy, rubber sandals,tools for handpumps, maggi stock cubes, cotton buds, toothpaste
Study community Sani-centre New latrines % householdsslabs in use In use (No.) benefitting
Efopu-Ekile 14 8 100
Igba 9 36 25
Duhuwa 4 42 10
Mbagbor 1 44 2
Molori 1 13 8
Mburubu 1 0 0
Amegu-Ada 0 10 0
Mbaazenger 0 60 0
Total 30 213 14
Activities Annual cost Cost per Cost per Cost per (US$) community household latrine
Programme costs (training, support) $100,058 $1,853 $14 $33
Software (hygiene/IEC) $70,768 $1,311 $10 $23
Software (CLTS and follow-up) $24,699 $457 $3 $8
Hardware (sani-centre) $24,198 $448 $3 $8
WaterAid Total $219,724 $4,069 $30 $ 71
Local government and UNICEF support $22,000 $407 $3 $7
Household contributions $60,640 $1,140 $8 $20
Total $302,364 $5,616 $41 $98

Institutional or financial IncentivesThe provision of a water supply facility with every intervention was a significantincentive to most of the study communities. The poor performance of these water supply facilities appears to have had a negative impact on the outcomes of the interventions.
The only other incentive provided by WaterAid was through the seed moneyprovided to the sani-centre (see section below). This finance was supposed toestablish production centres and sanitary ware shops in project communities, withthe latrine slabs and goods paid for by the community members. In practice, thesani-centre seed money acted as an incentive to the WASCOM members to take partin the intervention (as some of them received free slabs) and to the communitymembers (as some of them received free sanitary wares). Unfortunately, theprovision of the sani-centre funds was not linked in any way to the performance of the CLTS intervention (ie whether the community reached ODF status) or to theperformance of the sani-centre (as no funds had to be repaid, whatever happened to the sani-centre).
No other financial or perfomance-based incentives were present.
Section 7
73Sustainability and equity aspects of total sanitation programmes
According to the national-level accounts, project support costs account for 47% of the sanitation expenditures, software costs for 43%, and hardware costs for 11%of the total sanitation expenditure. However, it remains unclear why the local levelcosts indicate that the sani-centre costs are equivalent to 50% of the implementationcosts, whilst the national accounts suggest only 11% for the sani-centre costs.
In terms of cost-effectiveness, the project cost per CLTS latrine is currently US$71.Almost half of this amount ($33 per latrine) is consumed by support costs, with $31per latrine reported for software costs. These figures compare reasonably well withthe local costs, which suggested $28 per latrine for software costs. However, thetotal cost including external expenditures and household contributions is estimatedat US$98 per latrine, with 72% financed by WaterAid, 7% by other agencies (UNICEFand local government), and 20% contributed by the household itself.
Another measure of cost-effectiveness is the cost per ODF community. To date, only15 ODF communities have been declared by WaterAid in Nigeria, which suggests aproject cost per ODF community of about US$25,000 (although this analysis ignoresthe benefits accrued due to increases in sanitation coverage in non-ODF communities).
Influence of expenditure on outcomesThere was little evidence that expenditure varied across the study communities. Inother words, WaterAid in Nigeria provided similar finance for training, implementationactivities, and support in all of the states and LGAs visited during the research.
However, it was clear that the utilisation of these resources varied across the LGAWES Units. The WES Units in Ado and Gumel LGAs had obviously made numerous,regular visits to the study communities throughout the intervention period. Ingeneral, the CLTS concept was well understood (and acted upon) by thecommunities in these LGAs, suggesting that the participatory triggering activitieshad been implemented effectively.
In contrast, the WES Units in Enugu state appeared less engaged with the intervention.A more top-down process had been utilised, with fewer visits to the community, whichresulted in less interest and engagement by the community. For instance, it remainsunclear why the sani-centres in the Enugu study communities had produced tens ofconcrete slabs, knowing that none of the community members were interested ineither buying or using them, but it seems likely that the WES Unit told the sani-manto produce the slabs without first examining local demand (as per the previoussubsidy approaches). The expenditure was the same as in the other communities,but none of the materials or investment (in artisan training) has ever been used.
The unit costs of the WaterAid in Nigeria CLTS intervention are relatively high, andthe outcomes remain relatively poor. The ODF success rate in Nigeria is only 15 ODFcommunities from 99 CLTS interventions (15%), which compares badly with successrates of 35% to 40% achieved in large-scale programmes in Asia. Furthermore, theobservation surveys found that several of the communities previously declared ODF(notably Duhuwa and Efopu-Ekile) were no longer open defecation free, whichsuggests that the sustained ODF rate is actually lower than 15%.
Section 7
72 Sustainability and equity aspects of total sanitation programmes

and seemed more concerned and upset when exceptions were uncovered. The non-ODF communities tended to have a far more relaxed approach to their sanitationsituation. Open defecation was not considered especially problematic and there wasless sense of the need to achieve a collective sanitation outcome.
Local context and community typeIt was clear that the nature and definition of the intervention communities alsoplayed an important role in the success of the CLTS approach. Several of thecommunities contained multiple sub-villages spread over a large area, which made it hard to convince the community that open defecation was a collective problem.How could open defecation by someone in this sub-village affect the situation orhealth of latrine-using members of another far away sub-village?
The reverse problem was found in Efopu-Ekile, where the defined community wasone tiny sub-village (only 22 households) within a much larger cluster of sub-villages. Open defecation by people living in the immediately adjacent sub-villagesclearly had a direct impact on this community, which limited the sustainability of thecollective outcome (as it is hard to maintain pressure on households to stop opendefecation when their neighbours are practising open defecation with impunity).
The study communities in Enugu showed little interest in the homemade CLTSlatrines that were discussed with them, as many of them aspire to a much higherlevel of service. In communities where individuals own cars and satellite dishes, it isclear that sanitation improvement will require more than just the promotion of mud-floored latrines. Nevertheless, the CLTS concept – of encouraging ODF communities– remains valid, as even non-poor households experience disgust when made awareof the contamination caused by open defecation.
Worse outcomes among semi-nomadic groupsThe preceding sections of this report have referred frequently to the exclusion of the Fulani households from the CLTS interventions in the Jigawa study communities.Once again, the definition of the community created problems, firstly by includingthe Fulani households in the original community and then by failing to extend oradapt the intervention to reach the semi-nomadic Fulani households.
Little upgrading or innovation in latrine designThe research team found that only one household had upgraded its latrine. Thisfinding appears to reflect a lack of technical innovation and knowledge sharing, whichhas resulted in very few indigenous latrine designs emerging from the interventions.
In most other countries, the CLTS approach has encouraged ‘village engineers’ tofind novel uses for local materials and solve local problems with ingenuity ratherthan expensive materials. The designs that emerge from these innovative individualsare then shared with other households and communities, leading to reinforcingcycles of innovation and development. However, there was little evidence of anyinnovation in the CLTS interventions in Nigeria.
Section 8
75Sustainability and equity aspects of total sanitation programmes
The WaterAid in Nigeria CLTS programme is only in its third year. In order to examinethe sustainability of the sanitation outcomes, the study communities were selectedfrom interventions that took place only in the first and second year of the CLTSprogramme. Inevitably, some of the interventions started while the implementationteams were in transition from the previous subsidy-based approach and, therefore,were still learning about the CLTS process.
As a result, some of the problems uncovered by this study are due, at least in part, to the early stage of the CLTS programme in Nigeria. In particular, the WES Units inEnugu noted that, in 2006, they began implementing CLTS several months beforethey attended the CLTS training course. Understandably, both the WES Units and the communities were slightly confused by the transition from a subsidy-basedapproach to a CLTS approach, and it has taken some time for the implementationteams to become comfortable with the new approach.
Seasonality issuesIt should also be noted that the research for the study took place in the middle of asevere rainy season. Several of the communities visited were flooded, access roadswere almost impassable, and both latrines and houses were collapsing under the heavyrains. As a result, the study presents a fairly unflattering view of the sanitation situationin the eight study communities – undoubtedly, some of the collapsed latrines will berebuilt as the dry season sets in and the maintenance of the latrines will be easier.
Validity of the research hypothesisThe findings of the Nigeria study confirm that communities that have declaredthemselves ODF tend to have more equitable and sustainable outcomes than non-ODF communities. However, two of the three study communities that had declaredODF status were no longer open defecation free less than two years after the end of the intervention. In both cases, only a handful of households had reverted to open defecation (four households in Efopu-Ekile, and one household in the mainsettlement of Duhuwa), and several of these had only reverted to open defecationbecause of latrine collapses in the recent heavy rains. Nevertheless, these findingsconfirm that ODF status is not a fixed outcome.
In general, the CLTS process has been more successful in triggering sustained andequitable sanitation outcomes in the communities that achieved ODF status. Thesecommunities had a better understanding of the reasons for stopping open defecation
Running head
74 Sustainability and equity aspects of total sanitation programmes
Section 8
Conclusions

The CLTS process relies on outreach by external and internal facilitators (naturalleaders) to small groups of households, often within clusters of households in smallvillages, or in neighbourhoods within larger settlements. The larger number of activecommunity heath volunteers utilised in the Benue communities was clearly a factorin the success of these sanitation interventions. However, the Jigawa interventionsutilised only two community hygiene volunteers, yet managed similar results. Themore detailed examination provided by this research has highlighted the problem of exclusion of the Fulani households in Jigawa state, and how the outcomes mighthave been different if additional hygiene promoters had been selected from outsidethe main densely-packed settlements.
A number of technical issues were identified: collapse of unlined pits in loose soils,failure to construct easy-to-clean (sweepable) slabs, failure to fly-proof latrines andvent pipes, and the use of latrines as bathrooms. WaterAid in Nigeria has alreadyresponded to the pit collapse problem by developing and piloting a number of low-cost solutions in Benue state, and by encouraging mud-brick linings in Jigawa state.But few of the other technical issues have been addressed.
Role of local governmentThe WES Units are relatively new institutions, with little experience of sanitationimprovement, and few incentives to do their jobs well. Moreover, the currentinstitutional arrangements provide little regular support from the WaterAidprogramme staff, other than a couple of training courses every year. This arrangementallows little monitoring of either the process or the outcomes, and is an importantfactor in the large variation in the quality and commitment of the WES Units.
The WaterAid in Nigeria members of the research team suggested that LGA financialsupport to the WES Unit is an important factor of success. Following impressiveperformance by its WES Unit over the last two years, Ado LGA has agreed to provideN 500,000 of its own funds (US$4,300) to the WES Unit. Whilst the WES Unit agreethat this money will assist in their work, it also pointed out that this amount willbarely pay for a single handpump.
Perverse incentivesWaterAid in Nigeria has promoted two unusual features in its CLTS programme:the water supply interventions and the establishment of sani-centres in eachcommunity. Unfortunately, the findings of this study suggest that both features areunsuccessful distractions from the main business of stopping open defecation. Onlythree out of the eight water supply interventions are functional less than a year afterthe interventions finished, and an expenditure of more than US$11,200 on eightsani-centres in the study communities resulted in only 30 latrine slabs being used –at an average cost of $373 per slab!
Finally, the cost-effectiveness of the interventions could be improved. Similarinterventions in Asia cost approximately $10 per household latrine, whereas thecosts in Nigeria average about $77 per latrine, with another $20 contributed by thehousehold. Efforts need to be made to improve the efficiency of the process, toprune the unsuccessful elements, to monitor the relative cost-effectiveness of thevarious activities, and to focus on the core business of achieving collective sanitationoutcomes that have a real impact on the health and economy of the target communities.
Section 8
77Sustainability and equity aspects of total sanitation programmes
Most of the latrines built under the CLTS programme were little different from existingtraditional latrines and there was very little variation between households. Those thatbuilt new latrines tended to build identical models to those already used by others inthe community. As a result, many of the latrines are barely hygienic – excreta isseparated from human contact, but the latrines are hard to keep clean and generallyunpleasant to use. The lack of variation in latrine design suggests that the processwas fairly top-down, with the latrine designs being promoted by the WES Unit andWASCOM members rather than emerging from the household’s own thoughts on howbest to separate excreta from human contact and utilise the materials to hand.
Unimproved latrines important for achieving ODFA lower proportion of improved latrines was found in the communities that hadlargely stopped open defecation. While this might suggest that reducing opendefecation leads to lower quality latrines, it demonstrates how CLTS allows poorhouseholds to build very low-cost latrines, provided that they stop open defecation.Without this approach, which gets poor households on the first rung of thesanitation ladder, it is extremely difficult to convince poor or disadvantagedhouseholds to build or use latrines. In non-ODF communities, the majority of thelatrines are normally found among non-poor households, those more likely to affordimproved latrines, which explains their higher improved sanitation coverage.
Limited follow-up reducing sustainabilityThe current WaterAid in Nigeria approach allows no follow-up after the first year ofthe intervention. The WES Units are supposed to continue with routine monitoring ofthe water and sanitation situation in their project communities, but the difficulty thatWaterAid in Nigeria faced in collecting up to date sanitation data (prior to the start ofthe study) confirms that this monitoring produces little useful data. The WES Unitsconfirmed that they are reluctant to visit remote communities unless paid a travelallowance and, once the intervention finishes, no funds are available for allowances(other than those provided by the LGA).
The lack of any formal follow-up is a serious constraint to sustainability. Even thehigh-performing communities benefitted from the review and discussion held withthe research team. New issues (such as the risk of fly breeding caused by open ventpipes) were raised, and suggestions for latrine improvements were discussed.
Additional factors that may assist entrenched behaviour changeAnother important factor was the timing of the intervention. The timing of theWaterAid in Nigeria financial year tends to release funds in the middle of the rainyseason, when latrine pits are difficult to dig and people are working in their fields,which limits the effectiveness of the intervention. One of the critical factors (found in other CLTS interventions) is the intensity of the initial activities; once triggeringhas taken place, and people are interested in building latrines and solving theirsanitation problems, it is important that support is on hand to encourage and assistin the process. The current timing of the release of funds tends to result in gaps inthe process, which reduces the intensity and effectiveness of the activities.
Section 8
76 Sustainability and equity aspects of total sanitation programmes
c) Encourage, capture and disseminate local innovationAt present, little effort is being made to encourage or capture local innovation.It is recommended that each of the State Programmes establishes an annuallatrine competition, with prizes awarded to the most innovative and affordabledesigns. In Cambodia, the latrine prize winners have their designs added to alatrine catalogue, which is updated annually to show any local innovations, aswell as low-cost solutions to common latrine design and sustainability problems.
d) Separate water supply from sanitation interventionsIt is also recommended that the water supply interventions be de-linked fromthe sanitation interventions. Integrated interventions should allow water to be available for handwashing after defecation, for latrine flushing, and forimproved hygiene but, in practice, this study confirms that many of the watersupply interventions encounter problems that limit their usefulness andsustainability. In addition, it is difficult to determine genuine demand forsanitation when water supply development is part of the package. Watersupply requirements tend to dominate institutional arrangements, thussidelining those that might contribute significantly to sanitation improvements.
Sanitation coverage currently lags behind water supply coverage bothnationally and at community level. It is unlikely to catch up unless somesanitation-only interventions are designed and implemented. Furthermore, the failure to tackle sanitation problems (such as open defecation) results in a far greater concentration of pathogens in the community, which tends toreduce the benefits available from water supply investments. Finally, there isincreasing support for interventions designed to focus on only one or twobehaviour changes. These interventions are simpler, making performancemonitoring easier, and creating more accountability for outcomes and impacts.
All communities need an ODF intervention, whereas not all communities needa water supply intervention. One of the members of the Ado LGA WES Unitmade the point that sanitation improvement would work much better ifseparate from water supply. To quote, he said that “you should focus onsanitation, and change your name to SanitationAid”!
Section 8
79Sustainability and equity aspects of total sanitation programmes
a) Develop formal guidelines on community unitsThe definition of the community unit used in the CLTS intervention is critical.WaterAid in Nigeria has already developed informal guidelines that suggestthat large villages should be broken down into smaller units that target ODFstatus one-by-one, with a separate (but linked) process in each sub-village.The overall aim should still be for the entire village to achieve ODF status, but the process is likely to work better if enacted in smaller, more closely-clustered settlements (where the evidence and practice of open defecation ismore visible and relevant to the other inhabitants). WaterAid in Nigeria shoulddevelop formal guidelines on how best to determine the community units usedin the CLTS process.
b) Introduce follow-up interventions to review and improve outcomesOne of the key recommendations for improving the sustainability of theoutcomes is to introduce a second phase intervention that aims to review thesanitation outcomes and promote small improvements and upgrades to thesanitation facilities. It is proposed that this intervention should follow aboutone year after the completion of the initial CLTS intervention, and should utilisea sanitation marketing approach.
After one year of latrine use, some of the households will be more familiar andcomfortable with the use of their facilities, and more willing to invest time andresources in improving them. The research suggests that WaterAid in Nigeriamay be able to reduce unit costs significantly by removing the sani-centreelement of the CLTS intervention. The sani-centres consume 50% of the localimplementation costs and, as shown in Table 12, the benefits generally reachless than 10% of the community, most of whom are non-poor households.
Some of the good ideas that went into the unsuccessful sani-centre approachcould be better utilised during the second phase, provided that any productionor manufacture is run on a commercial basis. The finance of these secondphase interventions could be partially sourced by removing the sani-centreinvestments from the initial interventions, and by using the sani-centre fundsto finance the marketing of low-cost products, short-term promotions anddiscounts, and business development training for local sanitation enterprises(masons, retailers, manufacturers).
Section 8
78 Sustainability and equity aspects of total sanitation programmes
Section 9
Recommendations

Location
State/LGA/town
Staff data: names, positions and time with WaterAid in Nigeria (of those present at interview)
Note: OK if more than one respondent present at interview (as few of the topics arelikely to be overly sensitive or subjective)
Programme data
Size of programme: number of staff in state office (plus levels/positions)
Programme reach: number of LGAs covered (number in state), number ofcommunities (number in each LGA, and number in state) = percentage coverage of WaterAid in Nigeria programme in this area
General information on interventions
Start date of current (non-subsidy) interventions
Number of LGAs/communities covered since the start of the CLTS interventions?
What defines the number of communities covered per year (who sets the total)?
Selection criteria for project communities.
Budget: total amount spent per year, amount spent on the interventions that included CLTS elements? Note difference between budget figures and actual expenditures
Role of local government: LGA WES Unit (when established, current capacity), other local government partners/requirements?
Role of other international agencies: UNICEF involvement? Other agencies/NGOs?
Role of local partners: local NGOs/CBOs?
Intervention data for study communities
** collect copy of baseline data for study communities **
Anything unusual about the study communities?General process followed – any deviations from WaterAid in Nigeria standardprocess (due to local difference/context)?
Duration of interventions: when was last visit made?
Running head
81Sustainability and equity aspects of total sanitation programmes
Burton S (2007) An evaluation of WaterAid’s Community-led Total Sanitationprogramme in Nigeria, Abuja: WaterAid in Nigeria
Demographic and Health Surveys (2003) Demographic and Health Survey: Nigeria
Federal Government of Nigeria (2004) National water sanitation policy, Abuja:Federal Republic of Nigeria, Federal Ministry of Water Resources, (draft report)
Federal Government of Nigeria (2008) International Year of Sanitation Action Plan for Nigeria: draft report, Abuja: Federal Ministry of Agriculture and Water Resources,Department of Water Supply and Quality Control (processed)
WHO/UNICEF (2006a) Coverage estimates: Improved sanitation, Nigeria, JointMonitoring Programme for Water Supply and Sanitation, www.wssinfo.org
WHO/UNICEF (2006b) Meeting the Millennium Development Goal drinking waterand sanitation target: the urban and rural challenge of the decade, Geneva and NewYork: Joint Monitoring Programme for Water Supply and Sanitation
WHO/UNICEF (2008) Progress on drinking water and sanitation: special focus onsanitation, Geneva and New York: Joint Monitoring Programme for Water Supply and Sanitation
Kar K, Pasteur K (2005) Subsidy or self-respect? Community-led Total Sanitation: an update on recent developments, Brighton: University of Sussex, Institute ofDevelopment Studies, IDS Working Paper 257
National Task Group for Sanitation and Hygiene (2007) Strategy for scaling up ruralsanitation and hygiene to meet Millennium Development Goal Nigeria: Final Report,Abuja: Federal Government of Nigeria (processed)
National Task Group for Sanitation and Hygiene (2008) Community-led Total Sanitation:a manual for programme planners, managers, facilitators and service providers inNigeria, Abuja: Federal Government of Nigeria
WaterAid (2006) Evaluation of pilot phase of Community-led Total Sanitation inNigeria, Abuja: WaterAid in Nigeria
Section 9
80 Sustainability and equity aspects of total sanitation programmes
Section 1
References
Annex A
Checklist for interviews with WES Units

Location
State/LGA/community name
Present at FGD: note criteria for selecting FGD members and number
Community data
Present summary of the community data collected so far. Ask the FGD members if this information is correct/representative/up-to-date
Verify specific information about the FGD members (number of households,household sizes, sanitation access, types of latrine, open defecation practices)
Intervention process
Ask the FGD members about their involvement in (or exclusion from) the interventionprocess. What was their role? How did they interact with others? How were theyinformed of the purpose and nature of the intervention? Have any groups in thecommunity been excluded from the process? If so, why? What has been the role oflocal government in the process?
Intervention outcomes
Is there any open defecation in the community?
If none: how are the FGD members certain that there is no open defecation – how isit monitored?
If some: who practices open defecation? Where? And why?
What happens when people spend time outside the household – where do they defecate?
How does open defecation affect the members of the FGD?
Has the intervention produced a good outcome for the FGD members?
What do the FGD members think of their latrines (if they are using latrines)?
How do the latrines of the FGD members compare to those of others in thecommunity? Is there any difference – if so, why?
Does anyone share a latrine (use someone else’s latrine)?
What about migrants – any new households? If so, do they use latrines?
Annex A
83Sustainability and equity aspects of total sanitation programmes
Number of visits: by WaterAid in Nigeria staff, by LGA WES Unit, by others?
Division of labour between water supply, sanitation and hygiene: possible toestimate proportion of time (or specific visits) spent on each sub-sector?
Costs: typical cost for one visit (number of staff, transport, fuel, per diems,community payments, other)?
Costs: direct cost elements – water supply scheme, sani-centre, payments to LGA?
Costs: cost estimate for each study community (number visits, plus direct costs and other)
Costs: covered by others eg UNICEF expenditures (WES Unit)?
Intervention issues
Any local issues that affect interventions?
Why CLTS is successful in some communities but not others?
Why it’s successful in some states (eg Jigawa) but not others (eg Enugu)?
Is there any difference in facilitation quality?
What about buy-in by LGA (and other support agencies)?
How equitable are interventions (reaching disadvantaged groups)?
How could the sustainability of the sanitation improvements be improved?
Running head
82 Sustainability and equity aspects of total sanitation programmes
Annex B
Checklist for Focus Group Discussions
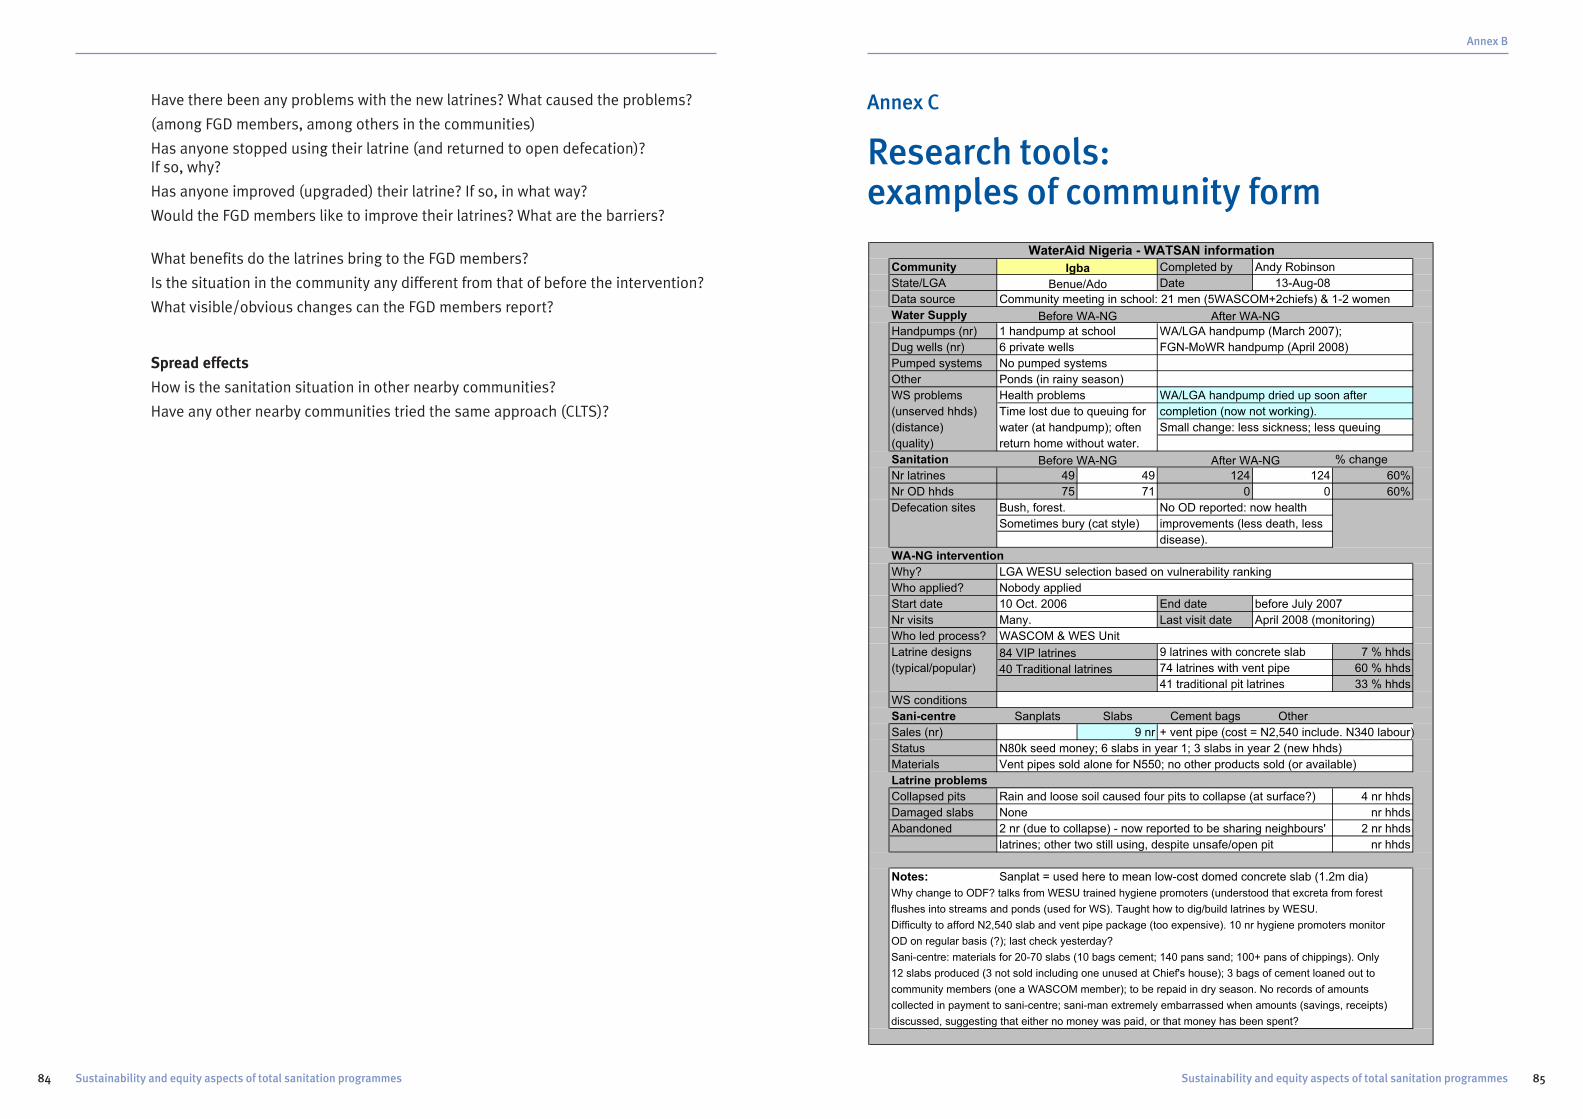
Annex B
85Sustainability and equity aspects of total sanitation programmes
Have there been any problems with the new latrines? What caused the problems?
(among FGD members, among others in the communities)
Has anyone stopped using their latrine (and returned to open defecation)? If so, why?
Has anyone improved (upgraded) their latrine? If so, in what way?
Would the FGD members like to improve their latrines? What are the barriers?
What benefits do the latrines bring to the FGD members?
Is the situation in the community any different from that of before the intervention?
What visible/obvious changes can the FGD members report?
Spread effects
How is the sanitation situation in other nearby communities?
Have any other nearby communities tried the same approach (CLTS)?
Running head
84 Sustainability and equity aspects of total sanitation programmes
Annex C
Research tools: examples of community form
Community Completed by Andy Robinson
State/LGA Date 13-Aug-08
Data source Community meeting in school: 21 men (5WASCOM+2chiefs) & 1-2 women
Water Supply
Handpumps (nr) 1 handpump at school WA/LGA handpump (March 2007);
Dug wells (nr) 6 private wells FGN-MoWR handpump (April 2008)
Pumped systems No pumped systems
Other Ponds (in rainy season)
WS problems Health problems WA/LGA handpump dried up soon after
(unserved hhds) Time lost due to queuing for completion (now not working).
(distance) water (at handpump); often Small change: less sickness; less queuing
(quality) return home without water.
Sanitation % change
Nr latrines 49 49 124 124 60%
Nr OD hhds 75 71 0 0 60%
Defecation sites Bush, forest. No OD reported: now health
Sometimes bury (cat style) improvements (less death, less
disease).
WA-NG intervention
Why? LGA WESU selection based on vulnerability ranking
Who applied? Nobody applied
Start date 10 Oct. 2006 End date before July 2007
Nr visits Many. Last visit date April 2008 (monitoring)
Who led process? WASCOM & WES Unit
Latrine designs 9 latrines with concrete slab 7 % hhds
(typical/popular) 74 latrines with vent pipe 60 % hhds
41 traditional pit latrines 33 % hhds
WS conditions
Sani-centre Sanplats Slabs Cement bags Other
Sales (nr) 9 nr + vent pipe (cost = N2,540 include. N340 labour)
Status N80k seed money; 6 slabs in year 1; 3 slabs in year 2 (new hhds)
Materials Vent pipes sold alone for N550; no other products sold (or available)
Latrine problems
Collapsed pits Rain and loose soil caused four pits to collapse (at surface?) 4 nr hhds
Damaged slabs None nr hhds
Abandoned 2 nr (due to collapse) - now reported to be sharing neighbours' 2 nr hhds
latrines; other two still using, despite unsafe/open pit nr hhds
Notes: Sanplat = used here to mean low-cost domed concrete slab (1.2m dia)
Why change to ODF? talks from WESU trained hygiene promoters (understood that excreta from forest
flushes into streams and ponds (used for WS). Taught how to dig/build latrines by WESU.
Difficulty to afford N2,540 slab and vent pipe package (too expensive). 10 nr hygiene promoters monitor
OD on regular basis (?); last check yesterday?
Sani-centre: materials for 20-70 slabs (10 bags cement; 140 pans sand; 100+ pans of chippings). Only
12 slabs produced (3 not sold including one unused at Chief's house); 3 bags of cement loaned out to
community members (one a WASCOM member); to be repaid in dry season. No records of amounts
collected in payment to sani-centre; sani-man extremely embarrassed when amounts (savings, receipts)
discussed, suggesting that either no money was paid, or that money has been spent?
Before WA-NG After WA-NG
84 VIP latrines
40 Traditional latrines
WaterAid Nigeria - WATSAN information
Igba
Benue/Ado
Before WA-NG After WA-NG

Annex C
87Sustainability and equity aspects of total sanitation programmes
WaterAid in Nigeria Community-wide ODF sanitation interventions in the financialyears 2005-06 and 2006-07
Running head
86 Sustainability and equity aspects of total sanitation programmes
Annex D
Background data
State LGA Community Approach Year Population Hhds Size Before After Initial Cover Incr Status Notes1 Benue Ado Unogwu (Replication) CLTS 2006 210 10 21.0 2 10 20% 100% 80% Completed Excluded as not WaterAid in Nigeria intervention2 Benue Ado Efopu-Ekile CLTS 2006 300 15 20.0 3 15 20% 100% 80% Completed3 Benue Okpokwu Ubegba CLTS 2006 148 25 5.9 4 35 16% 140% 124% Completed 38 in Evaluation4 Benue Logo Tse-Yugh CLTS 2006 442 54 8.2 4 9 7% 17% 9% Completed5 Benue Logo Abur Norsua CLTS 2006 235 74 3.2 4 8 5% 11% 5% Completed6 Benue Logo Ruam Nyam CLTS 2006 668 88 7.6 40 0% 45% 45% Completed7 Benue Vandeikya M/Zenger/Sharagba CLTS 2006 4,180 91 45.9 34 35 37% 38% 1%8 Benue Logo Tse-Agera CLTS 2006 1,428 104 13.7 13 20 13% 19% 7% Completed9 Benue Logo Tse-Ikyule CLTS 2006 951 113 8.4 16 19 14% 17% 3% Completed10 Benue Vandeikya Mbaaji CLTS 2006 1,550 123 12.6 21 80 17% 65% 48%11 Benue Ado Igba CLTS 2006 2,600 124 21.0 49 124 40% 100% 60% Completed12 Benue Okpokwu Ondo CLTS 2006 742 124 6.0 10 67 8% 54% 46% Ongoing13 Benue Ogbadibo Ipiga CLTS 2006 1,129 129 8.8 42 94 33% 73% 40% Semi-urban (Eval: 4,205 in 313 hhds=57 latrines)14 Benue Vandeikya Ikyumbur CLTS 2005 4,200 149 28.2 16 42 11% 28% 17%15 Benue Vandeikya B. Atser CLTS 2005 3,450 159 21.7 40 103 25% 65% 40%16 Benue Logo Ubaver CLTS 2006 1,308 184 7.1 2 24 1% 13% 12% Completed17 Benue Vandeikya M/Kyulen CLTS 2005 1,932 190 10.2 18 48 9% 25% 16%18 Benue Vandeikya Anongo CLTS 2005 3,905 200 19.5 36 95 18% 48% 30%19 Benue Vandeikya Jape CLTS 2005 3,290 213 15.4 36 99 17% 46% 30%20 Benue Vandeikya Idyegh CLTS 2005 1,060 221 4.8 34 169 15% 76% 61%21 Benue Vandeikya Mbagbor CLTS 2006 4,800 264 18.2 24 195 9% 74% 65%22 Benue Vandeikya Alakali CLTS 2006 4,646 282 16.5 24 98 9% 35% 26%23 Benue Vandeikya Gusha CLTS 2006 4,982 331 15.1 26 60 8% 18% 10%24 Benue Vandeikya M/Adigan CLTS 2006 4,996 1048 4.8 40 766 4% 73% 69%25 Ekiti Ekiti South West Iro CLTS 2006 821 102 8.0 23 39 23% 38% 16% On-going26 Ekiti Ilejemeje Ijesamodu CLTS 2006 3,837 222 17.3 13 69 6% 31% 25% On-going27 Ekiti Ekiti South West Oke-Ode CLTS 2006 1,802 363 5.0 37 126 10% 35% 25% On-going28 Ekiti Ikole Irele CLTS 2006 2,542 388 6.6 9 15 2% 4% 2% On-going29 Ekiti Ilejemeje Iludun CLTS 2006 7,510 390 19.3 25 49 6% 13% 6% On-going30 Ekiti Ikole Ootunja CLTS 2006 3,501 568 6.2 119 129 21% 23% 2% On-going31 Enugu Igbo-Etiti Ezi-idoha CLTS 2006 439 80 5.5 50 68 63% 85% 23%32 Enugu Igbo-Etiti Ozeachara-Ekwegbe CLTS 2006 576 108 5.3 8 14 7% 13% 6%33 Enugu Udenu Amagu-Ada Obollo CLTS 2006 5,070 230 22.0 41 48 18% 21% 3%34 Enugu Nkanu East Ovuorie-Ugbawka CLTS 2006 2,798 280 10.0 34 70 12% 25% 13%35 Enugu Nkanu East Mburubu CLTS 2006 2,720 280 9.7 29 10% 0% -10%36 Enugu Udenu Ugbabe-Uwani CLTS 2006 4,352 304 14.3 29 96 10% 32% 22%37 Enugu Nkanu East Amankanu CLTS 2005 870 38 Jigawa Suletakankar Darare CLTS 2006 929 102 9.1 1 90 1% 88% 87%39 Jigawa Gumel Duhuwa CLTS 2006 1,398 128 10.9 0 128 0% 100% 100%40 Jigawa Suletakankar Bagade CLTS 2006 1,284 137 9.4 3 135 2% 99% 96%41 Jigawa Maigatari Molori CLTS 2006 1,431 138 10.4 0 42 0% 30% 30%42 Jigawa Maigatari Bagware CLTS 2006 2,314 151 15.3 0 36 0% 24% 24%43 Jigawa Gumel Dan’Ama CLTS 2006 2,325 247 9.4 0 234 0% 95% 95%
44 Plateau Kanke Gwang CLTS 2006 152 19 8.0 0 18 0% 95% 95%45 Plateau Kanke Piri CLTS 2006 1,928 241 8.0 0 2 0% 1% 1%
Totals 101,751 8,793 12 919 3,663 10% 42% 31%Average: 2,261 200 13 21 85 12% 48% 36%Median: 1,802 150 10 18 60 12% 40% 28%
Benue 23 Average: 2,215 180 14 22 94 15% 53% 39%Median: 1,489 127 13 21 54 13% 47% 34%
Ekiti 6 Average: 3,336 339 10 38 71 11% 24% 12%Median: 3,022 376 7 24 59 8% 27% 19%
Enugu 7 Average: 2,404 214 11 32 59 20% 29% 9%Median: 2,720 255 10 32 68 11% 23% 12%
Jigawa 6 Average: 1,614 151 11 1 111 1% 73% 72%Median: 1,415 138 10 0 109 0% 91% 91%
Plateau 2 Average: 1,040 130 8 0 10 0% 48% 48%Median: 1,040 130 8 0 10 0%
Key:
LGA = Local Government Authority,
Hhds = Households,
Size = average household size,
Before = number of latrines beforeintervention,
After = number of latrines afterintervention,
Initial = latrine coverage beforeintervention,
Cover = latrine coverage afterintervention,
Incr = increase in latrine coverage arisingfrom intervention

Notes
Running head
88 Sustainability and equity aspects of total sanitation programmes
WaterAid’s vision is of a world where everyone has access to safe water and sanitation.
For more information please contact:WaterAid46-49 Durham StreetLondon SE11 5JDTelephone: +44 (0)845 6000 433Facsimile: +44 (0)20 7793 4545Email: [email protected]
Registered charity numbers 288701(England and Wales) and SC039479(Scotland)
June 2009www.wateraid.org