Sustainability Accounting Standards Board - TCFD...Sustainability Accounting Standards Board...
24
Transcript of Sustainability Accounting Standards Board - TCFD...Sustainability Accounting Standards Board...
© 2016 SASB™
Sustainability Accounting Standards Board
Industry-Based Standards to Guide Disclosure and
Action on Material Sustainability Information
Jean Rogers, PhD
CEO and Founder
Presentation to the Task Force on Climate-Related Financial Disclosure
London, UK
February 9, 2016
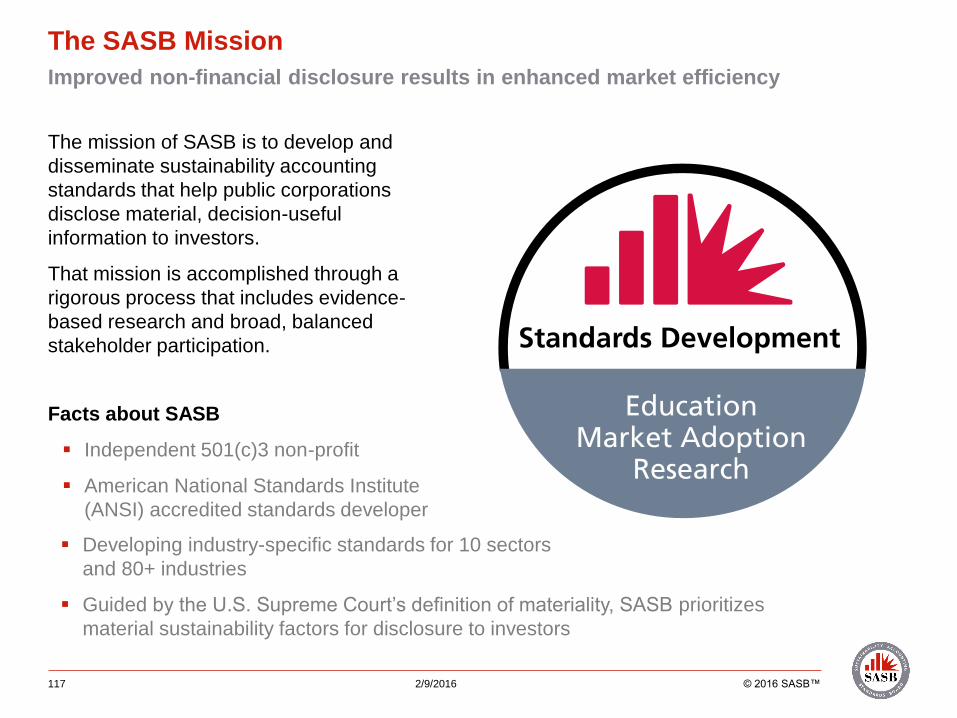
The SASB Mission
Improved non-financial disclosure results in enhanced market efficiency
117
The mission of SASB is to develop and
disseminate sustainability accounting
standards that help public corporations
disclose material, decision-useful
information to investors.
That mission is accomplished through a
rigorous process that includes evidence-
based research and broad, balanced
stakeholder participation.
Facts about SASB
Independent 501(c)3 non-profit
American National Standards Institute
(ANSI) accredited standards developer
Developing industry-specific standards for 10 sectors
and 80+ industries
Guided by the U.S. Supreme Court’s definition of materiality, SASB prioritizes
material sustainability factors for disclosure to investors
2/9/2016 © 2016 SASB™
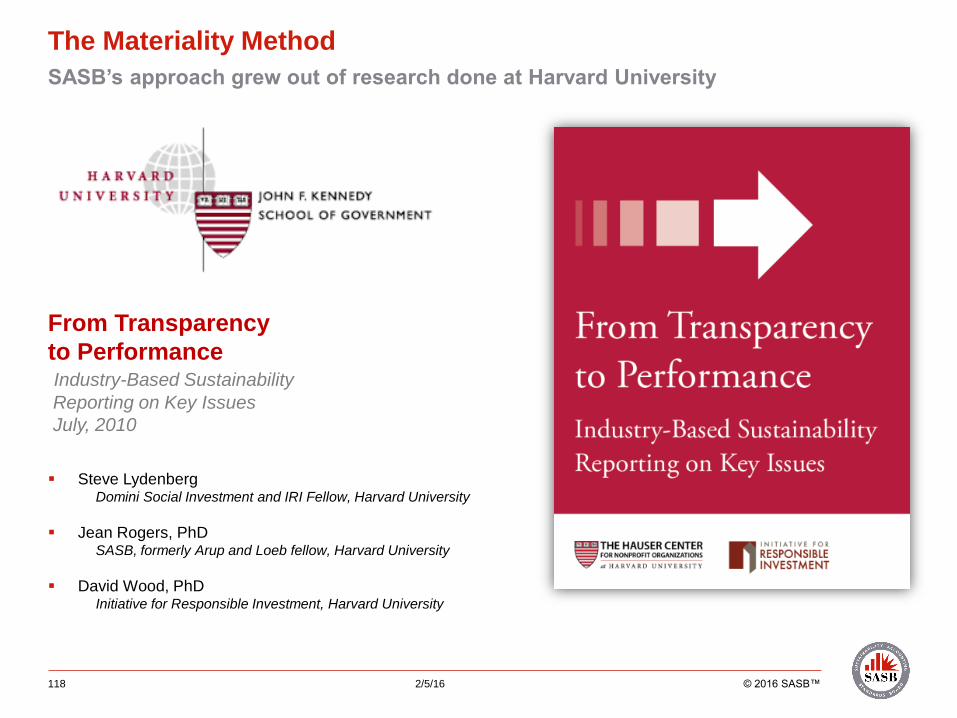
The Materiality Method
SASB’s approach grew out of research done at Harvard University
From Transparency
to PerformanceIndustry-Based Sustainability
Reporting on Key Issues
July, 2010
Steve LydenbergDomini Social Investment and IRI Fellow, Harvard University
Jean Rogers, PhDSASB, formerly Arup and Loeb fellow, Harvard University
David Wood, PhDInitiative for Responsible Investment, Harvard University
118 2/5/16 © 2016 SASB™
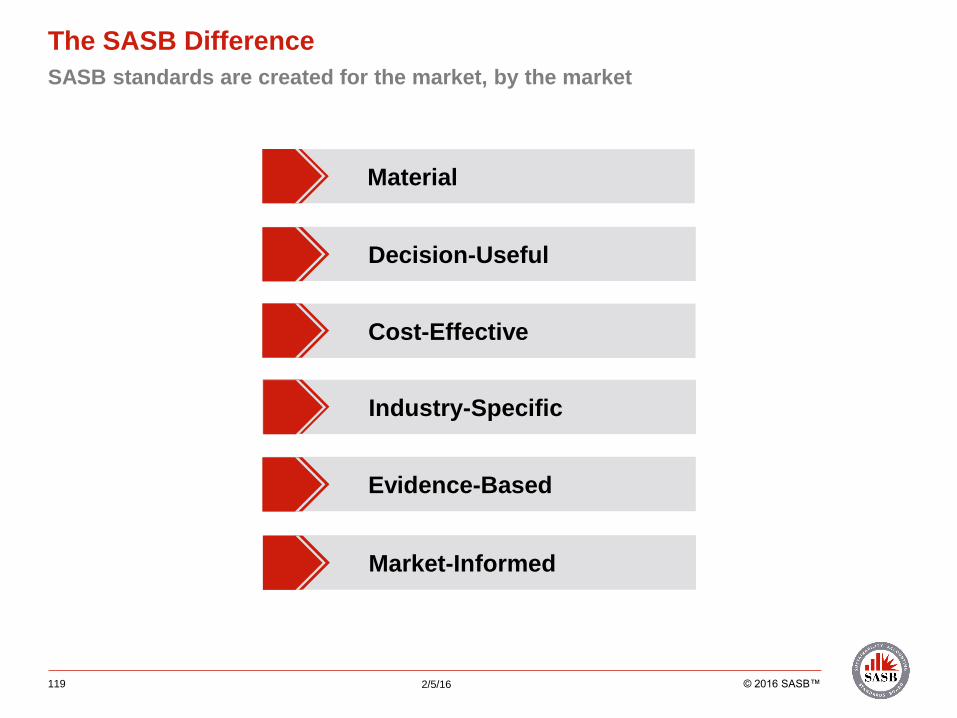
The SASB Difference
SASB standards are created for the market, by the market
Decision-Useful
Cost-Effective
Material
Industry-Specific
Evidence-Based
Market-Informed
2/5/16119 © 2016 SASB™
120
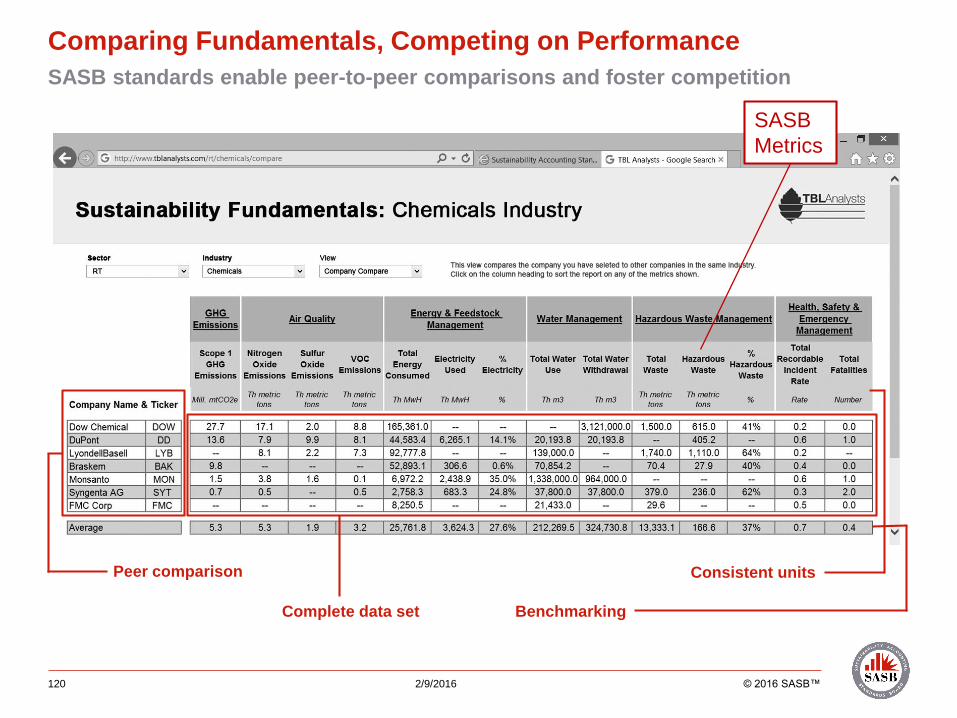
Comparing Fundamentals, Competing on Performance
SASB standards enable peer-to-peer comparisons and foster competition
2/9/2016 © 2016 SASB™
Benchmarking
SASB
Metrics
Peer comparison
Complete data set
Consistent units
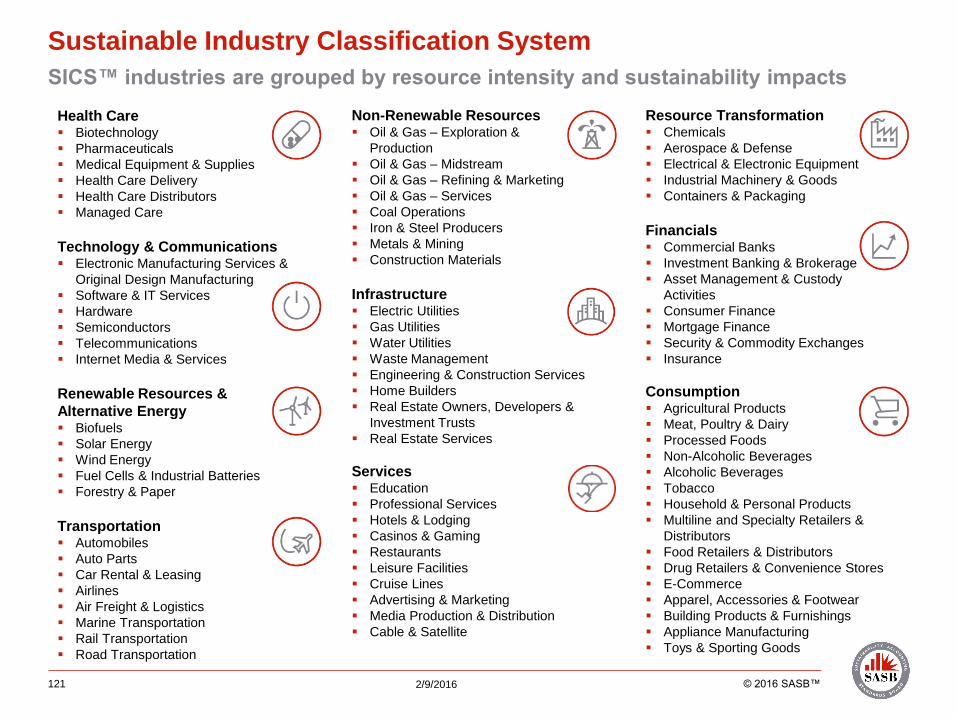
Sustainable Industry Classification System
SICS™ industries are grouped by resource intensity and sustainability impacts
2/9/2016121
Health Care Biotechnology
Pharmaceuticals
Medical Equipment & Supplies
Health Care Delivery
Health Care Distributors
Managed Care
Technology & Communications Electronic Manufacturing Services &
Original Design Manufacturing
Software & IT Services
Hardware
Semiconductors
Telecommunications
Internet Media & Services
Renewable Resources &
Alternative Energy Biofuels
Solar Energy
Wind Energy
Fuel Cells & Industrial Batteries
Forestry & Paper
Transportation Automobiles
Auto Parts
Car Rental & Leasing
Airlines
Air Freight & Logistics
Marine Transportation
Rail Transportation
Road Transportation
Non-Renewable Resources Oil & Gas – Exploration &
Production
Oil & Gas – Midstream
Oil & Gas – Refining & Marketing
Oil & Gas – Services
Coal Operations
Iron & Steel Producers
Metals & Mining
Construction Materials
Infrastructure Electric Utilities
Gas Utilities
Water Utilities
Waste Management
Engineering & Construction Services
Home Builders
Real Estate Owners, Developers &
Investment Trusts
Real Estate Services
Services Education
Professional Services
Hotels & Lodging
Casinos & Gaming
Restaurants
Leisure Facilities
Cruise Lines
Advertising & Marketing
Media Production & Distribution
Cable & Satellite
Resource Transformation Chemicals
Aerospace & Defense
Electrical & Electronic Equipment
Industrial Machinery & Goods
Containers & Packaging
Financials Commercial Banks
Investment Banking & Brokerage
Asset Management & Custody
Activities
Consumer Finance
Mortgage Finance
Security & Commodity Exchanges
Insurance
Consumption Agricultural Products
Meat, Poultry & Dairy
Processed Foods
Non-Alcoholic Beverages
Alcoholic Beverages
Tobacco
Household & Personal Products
Multiline and Specialty Retailers &
Distributors
Food Retailers & Distributors
Drug Retailers & Convenience Stores
E-Commerce
Apparel, Accessories & Footwear
Building Products & Furnishings
Appliance Manufacturing
Toys & Sporting Goods
© 2016 SASB™
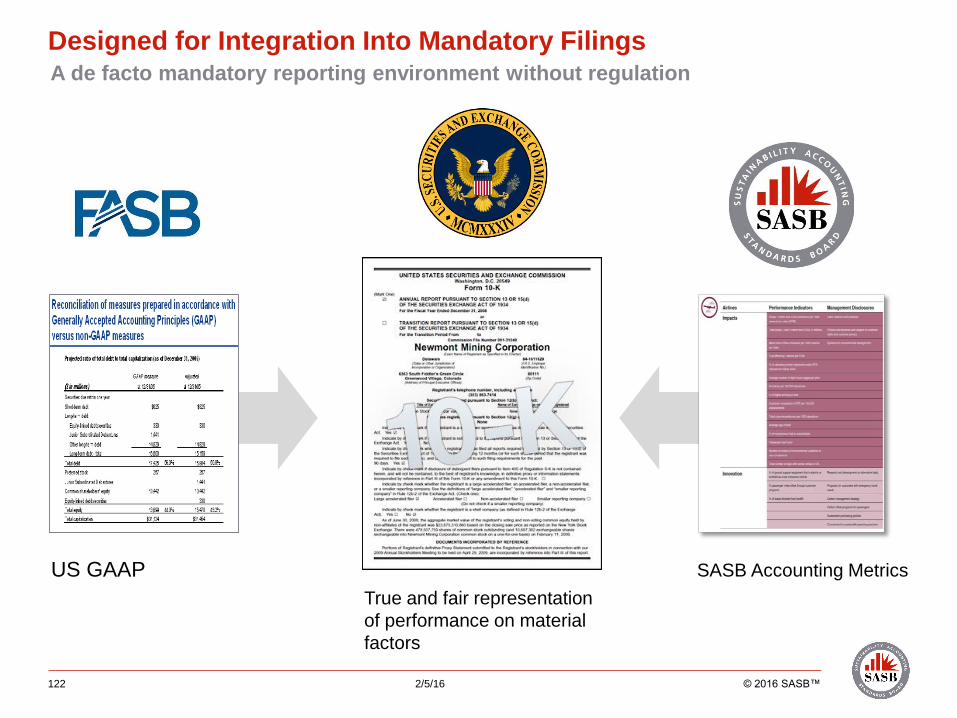
True and fair representation
of performance on material
factors
Designed for Integration Into Mandatory Filings
SASB Accounting MetricsUS GAAP
A de facto mandatory reporting environment without regulation
122 2/5/16 © 2016 SASB™

A Market-Driven Response
SASB addresses needs of all market participants—both investors and issuers
123
Issuers A minimum set of disclosure topics that are
likely to have material impacts on companies
in an industry, and a model for disclosing
information on those factors in a decision-
useful way to investors
A method to understand and improve
performance on ESG-related value drivers
A way to better satisfy the requirements of
Regulation S-K in the U.S. and Directive
2014/95/EU in Europe
Investors Comparable data for benchmarking
and evaluating performance
Standardized, decision-useful
information in a trusted channel
(i.e., 10-K and 20-F)
Tools and resources to analyze and
understand sustainability risk at the
portfolio level
Guidance for more focused
corporate engagement efforts
2/9/2016 © 2016 SASB™
$11.0T
SASB INDUSTRY WORKING GROUPS REFLECT BROAD-BASED INTEREST
PARTICIPANTS
>2,800ASSETS UNDER MANAGEMENT
$23.4TMARKET CAP
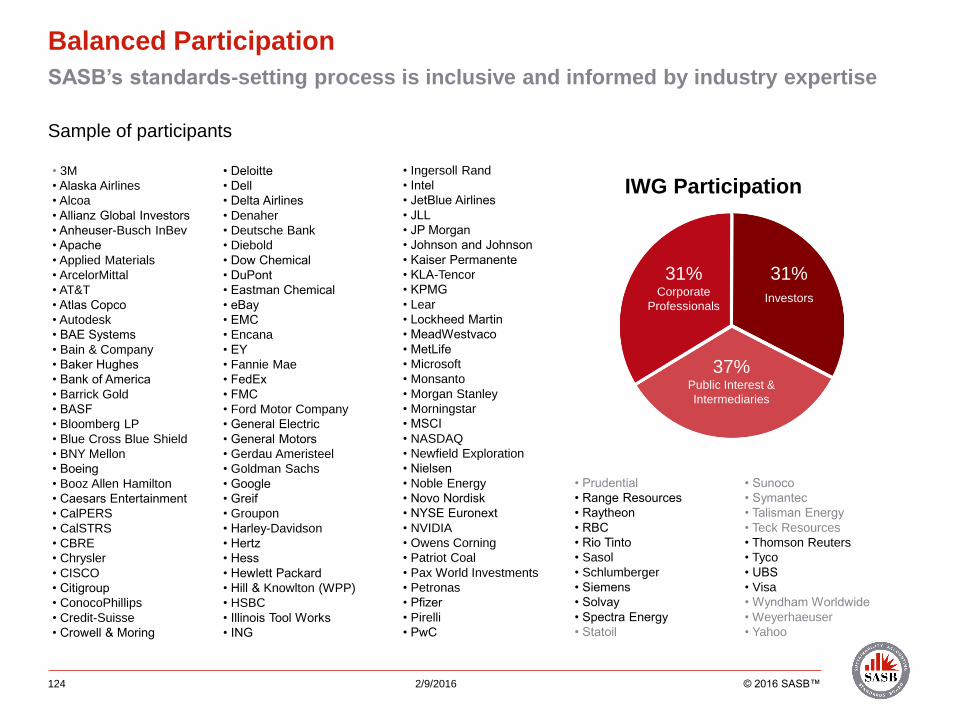
Balanced Participation
SASB’s standards-setting process is inclusive and informed by industry expertise
2/9/2016 © 2016 SASB™124
• 3M
• Alaska Airlines
• Alcoa
• Allianz Global Investors
• Anheuser-Busch InBev
• Apache
• Applied Materials
• ArcelorMittal
• AT&T
• Atlas Copco
• Autodesk
• BAE Systems
• Bain & Company
• Baker Hughes
• Bank of America
• Barrick Gold
• BASF
• Bloomberg LP
• Blue Cross Blue Shield
• BNY Mellon
• Boeing
• Booz Allen Hamilton
• Caesars Entertainment
• CalPERS
• CalSTRS
• CBRE
• Chrysler
• CISCO
• Citigroup
• ConocoPhillips
• Credit-Suisse
• Crowell & Moring
• Ingersoll Rand
• Intel
• JetBlue Airlines
• JLL
• JP Morgan
• Johnson and Johnson
• Kaiser Permanente
• KLA-Tencor
• KPMG
• Lear
• Lockheed Martin
• MeadWestvaco
• MetLife
• Microsoft
• Monsanto
• Morgan Stanley
• Morningstar
• MSCI
• NASDAQ
• Newfield Exploration
• Nielsen
• Noble Energy
• Novo Nordisk
• NYSE Euronext
• NVIDIA
• Owens Corning
• Patriot Coal
• Pax World Investments
• Petronas
• Pfizer
• Pirelli
• PwC
• Deloitte
• Dell
• Delta Airlines
• Denaher
• Deutsche Bank
• Diebold
• Dow Chemical
• DuPont
• Eastman Chemical
• eBay
• EMC
• Encana
• EY
• Fannie Mae
• FedEx
• FMC
• Ford Motor Company
• General Electric
• General Motors
• Gerdau Ameristeel
• Goldman Sachs
• Greif
• Groupon
• Harley-Davidson
• Hertz
• Hess
• Hewlett Packard
• Hill & Knowlton (WPP)
• HSBC
• Illinois Tool Works
• ING
• Prudential
• Range Resources
• Raytheon
• RBC
• Rio Tinto
• Sasol
• Schlumberger
• Siemens
• Solvay
• Spectra Energy
• Statoil
Sample of participants
IWG Participation
31%Corporate
Professionals
31%
Investors
37%Public Interest &
Intermediaries
• Sunoco
• Symantec
• Talisman Energy
• Teck Resources
• Thomson Reuters
• Tyco
• UBS
• Visa
• Wyndham Worldwide
• Weyerhaeuser
• Yahoo
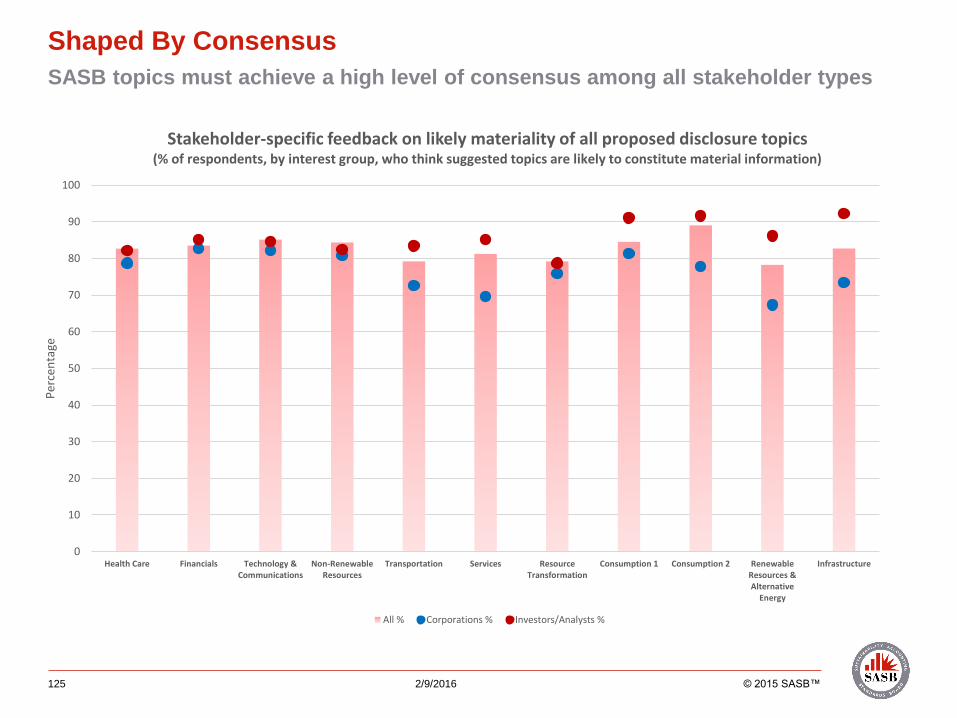
Shaped By Consensus
SASB topics must achieve a high level of consensus among all stakeholder types
125 2/9/2016 © 2015 SASB™
0
10
20
30
40
50
60
70
80
90
100
Health Care Financials Technology &Communications
Non-RenewableResources
Transportation Services ResourceTransformation
Consumption 1 Consumption 2 RenewableResources &Alternative
Energy
Infrastructure
Per
cen
tage
Stakeholder-specific feedback on likely materiality of all proposed disclosure topics(% of respondents, by interest group, who think suggested topics are likely to constitute material information)
All % Corporations % Investors/Analysts %
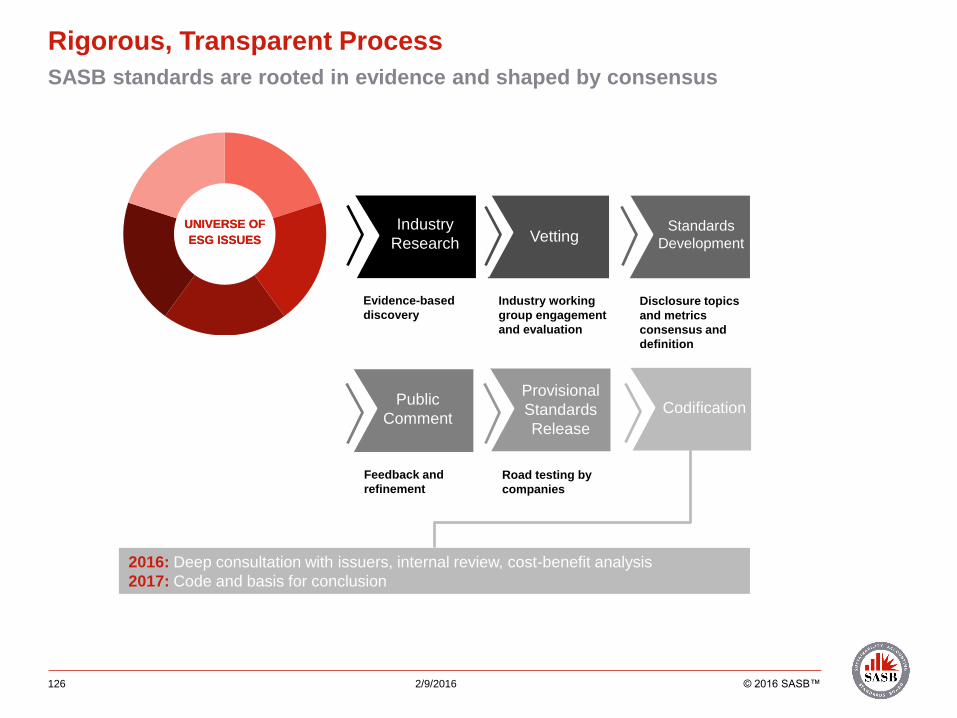
Rigorous, Transparent Process
SASB standards are rooted in evidence and shaped by consensus
126
Industry
Research Vetting
Public
Comment
Provisional
Standards
Release
Standards
Development
Evidence-based
discovery
Industry working
group engagement
and evaluation
Disclosure topics
and metrics
consensus and
definition
Feedback and
refinement
Road testing by
companies
UNIVERSE OF
ESG ISSUES
UNIVERSE OF
ESG ISSUES
Codification
2/9/2016 © 2016 SASB™
2016: Deep consultation with issuers, internal review, cost-benefit analysis
2017: Code and basis for conclusion
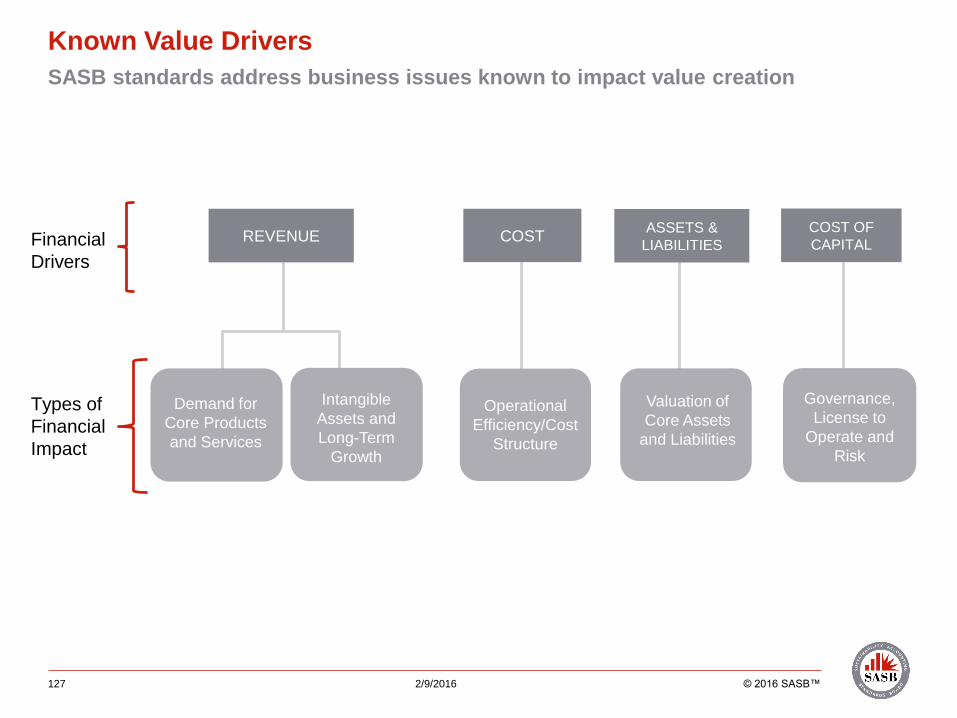
Known Value Drivers
SASB standards address business issues known to impact value creation
127
Financial
Drivers
Types of
Financial
Impact
COST OF
CAPITALREVENUE COST
ASSETS &
LIABILITIES
Demand for
Core Products
and Services
Intangible
Assets and
Long-Term
Growth
Operational
Efficiency/Cost
Structure
Valuation of
Core Assets
and Liabilities
Governance,
License to
Operate and
Risk
2/9/2016 © 2016 SASB™
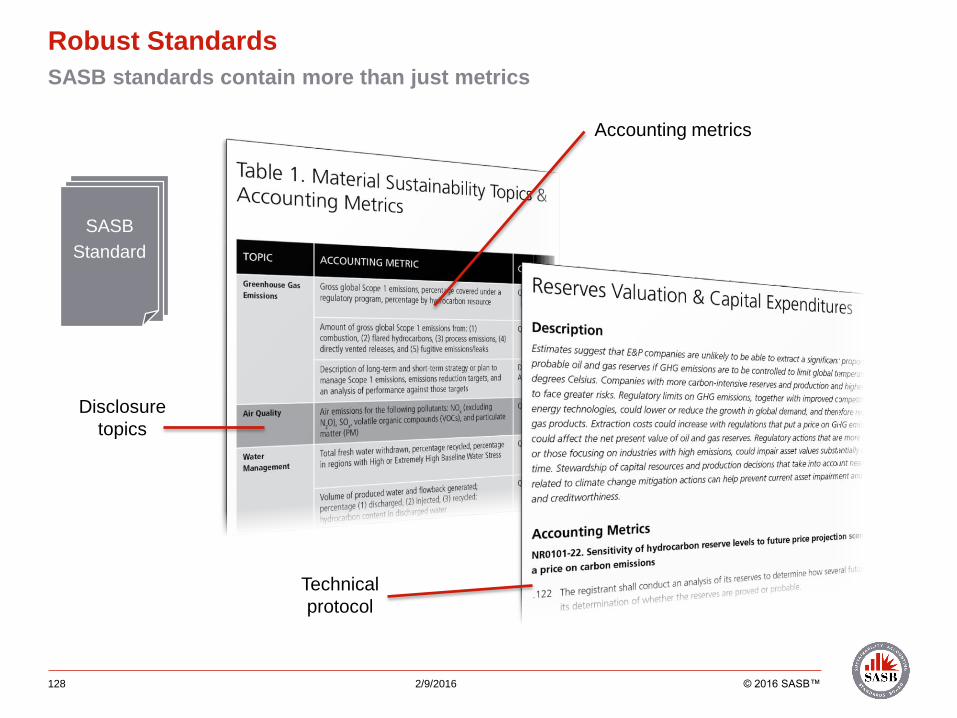
Robust Standards
SASB standards contain more than just metrics
128 2/9/2016 © 2016 SASB™
SASB
Standard
Disclosure
topics
Technical
protocol
Accounting metrics
129
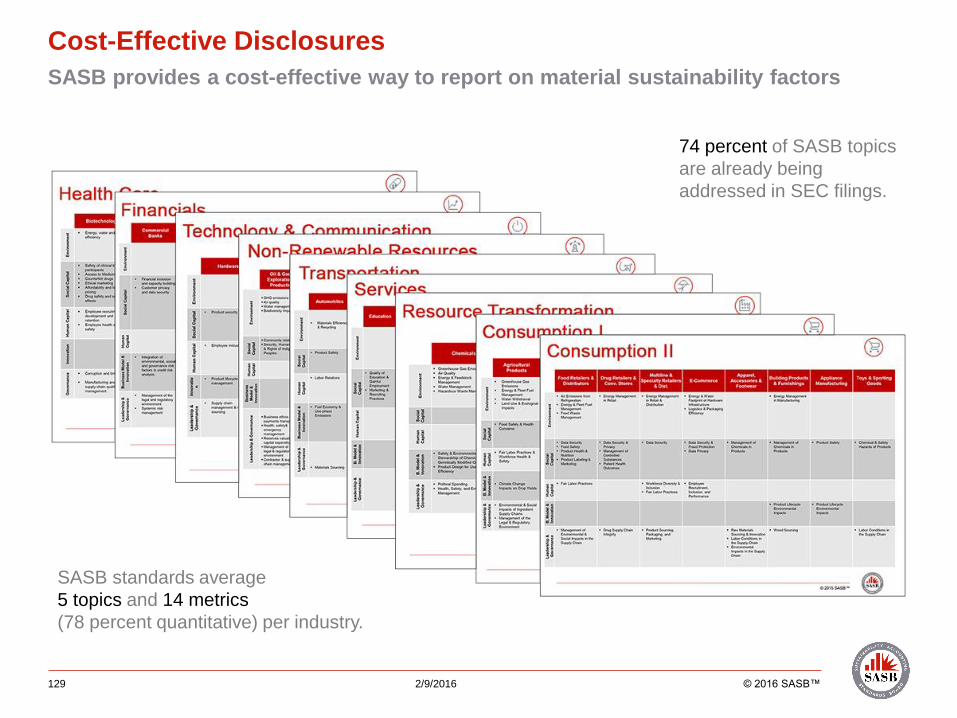
Cost-Effective Disclosures
SASB provides a cost-effective way to report on material sustainability factors
SASB standards average
5 topics and 14 metrics
(78 percent quantitative) per industry.
2/9/2016 © 2016 SASB™
74 percent of SASB topics
are already being
addressed in SEC filings.
130 2/9/2016 © 2016 SASB™
Consumption II
Renewable Energy
Infrastructure
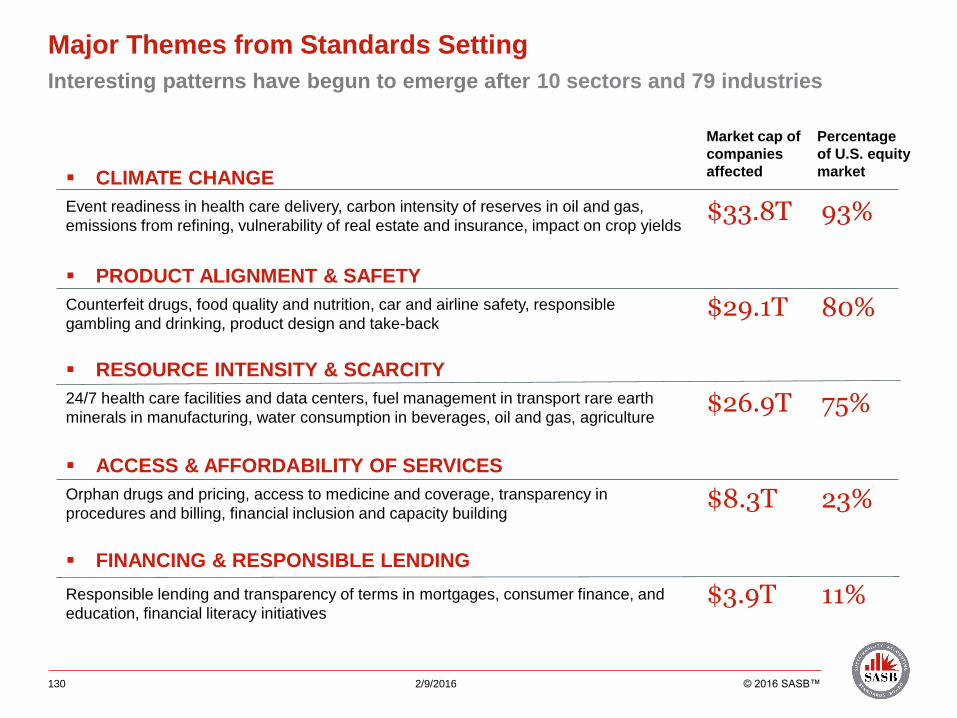
Major Themes from Standards Setting
Interesting patterns have begun to emerge after 10 sectors and 79 industries
CLIMATE CHANGE
Event readiness in health care delivery, carbon intensity of reserves in oil and gas,
emissions from refining, vulnerability of real estate and insurance, impact on crop yields
PRODUCT ALIGNMENT & SAFETY
Counterfeit drugs, food quality and nutrition, car and airline safety, responsible
gambling and drinking, product design and take-back
RESOURCE INTENSITY & SCARCITY
24/7 health care facilities and data centers, fuel management in transport rare earth
minerals in manufacturing, water consumption in beverages, oil and gas, agriculture
ACCESS & AFFORDABILITY OF SERVICES
Orphan drugs and pricing, access to medicine and coverage, transparency in
procedures and billing, financial inclusion and capacity building
FINANCING & RESPONSIBLE LENDING
Responsible lending and transparency of terms in mortgages, consumer finance, and
education, financial literacy initiatives
$33.8T
$29.1T
$26.9T
$8.3T
$3.9T
Market cap of
companies
affected
Percentage
of U.S. equity
market
93%
80%
75%
23%
11%
131 2/9/2016 © 2016 SASB™
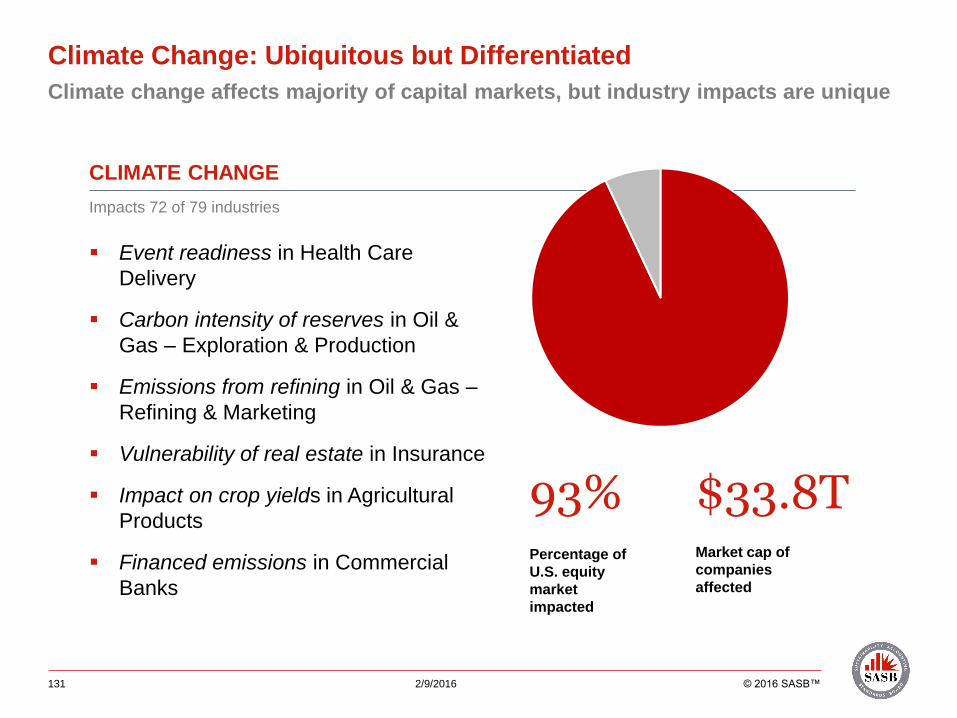
Climate Change: Ubiquitous but Differentiated
Climate change affects majority of capital markets, but industry impacts are unique
Event readiness in Health Care
Delivery
Carbon intensity of reserves in Oil &
Gas – Exploration & Production
Emissions from refining in Oil & Gas –
Refining & Marketing
Vulnerability of real estate in Insurance
Impact on crop yields in Agricultural
Products
Financed emissions in Commercial
Banks
$33.8TMarket cap of
companies
affected
Percentage of
U.S. equity
market
impacted
93%
CLIMATE CHANGE
Impacts 72 of 79 industries
132 2/9/2016 © 2016 SASB™
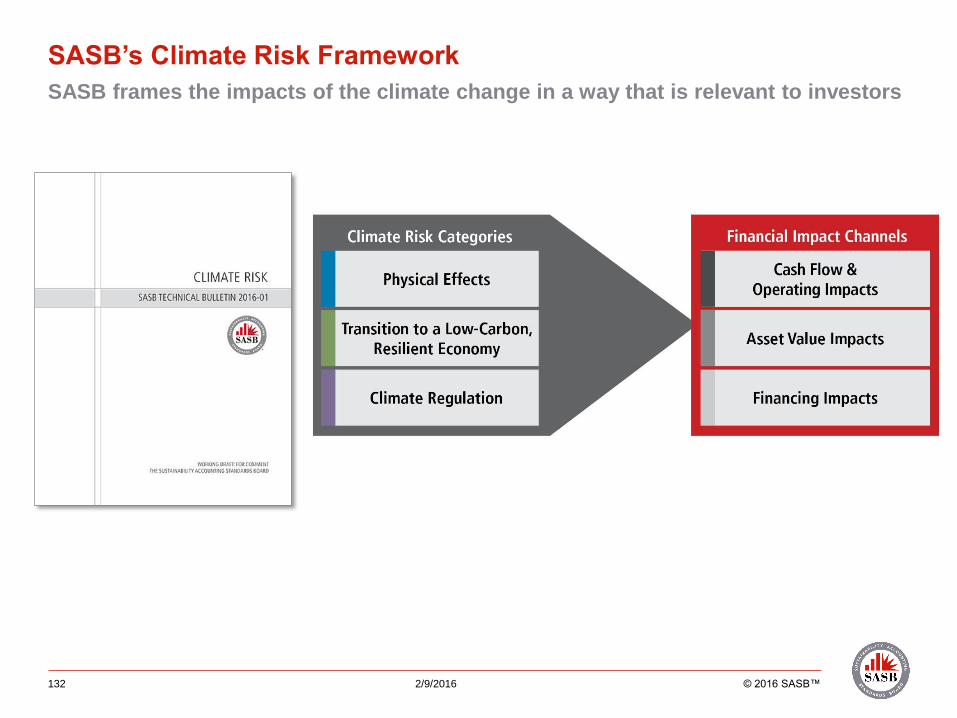
SASB’s Climate Risk Framework
SASB frames the impacts of the climate change in a way that is relevant to investors
133 2/9/2016 © 2016 SASB™
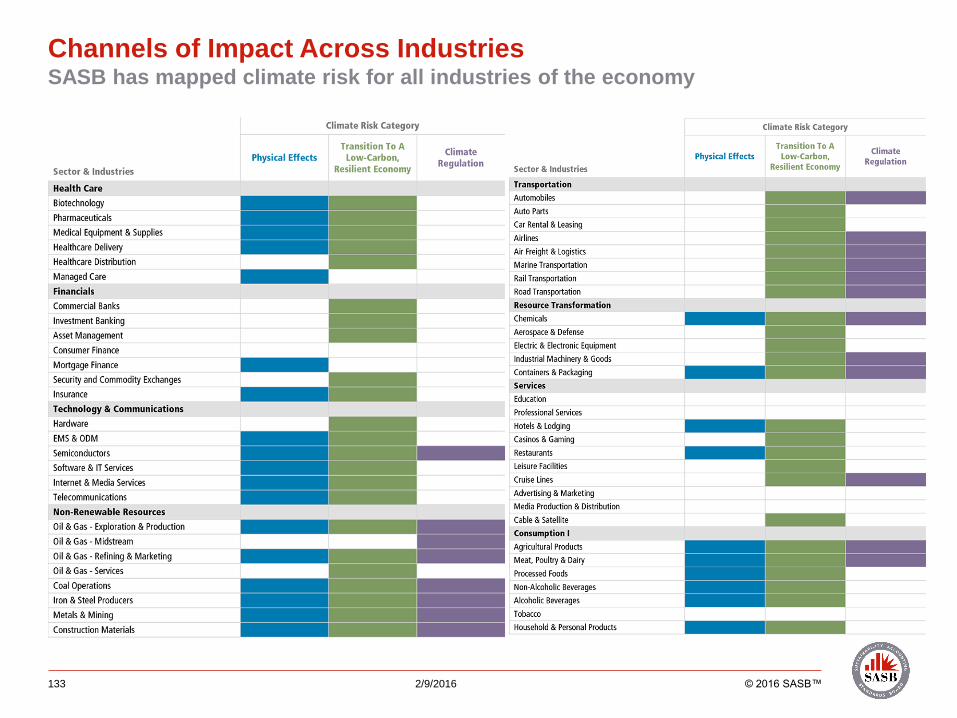
Channels of Impact Across IndustriesSASB has mapped climate risk for all industries of the economy
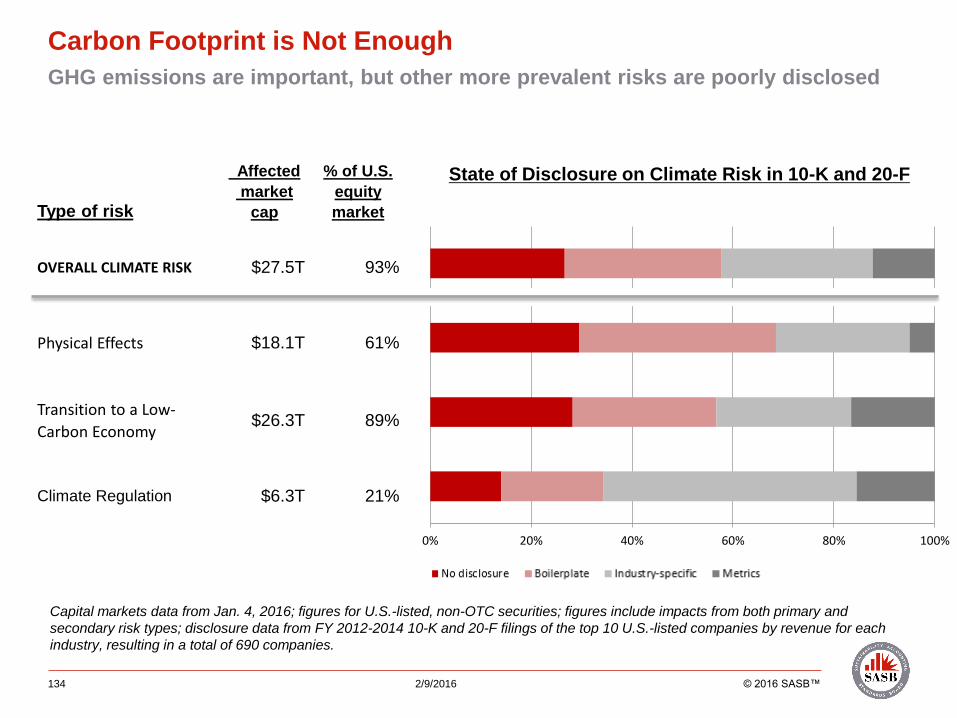
Carbon Footprint is Not Enough
GHG emissions are important, but other more prevalent risks are poorly disclosed
2/9/2016 © 2016 SASB™134
0% 20% 40% 60% 80% 100%
Type of risk
Affected
market
cap
% of U.S.
equity
market
OVERALL CLIMATE RISK $27.5T 93%
Physical Effects $18.1T 61%
Transition to a Low-
Carbon Economy$26.3T 89%
Climate Regulation $6.3T 21%
Capital markets data from Jan. 4, 2016; figures for U.S.-listed, non-OTC securities; figures include impacts from both primary and
secondary risk types; disclosure data from FY 2012-2014 10-K and 20-F filings of the top 10 U.S.-listed companies by revenue for each
industry, resulting in a total of 690 companies.
State of Disclosure on Climate Risk in 10-K and 20-F
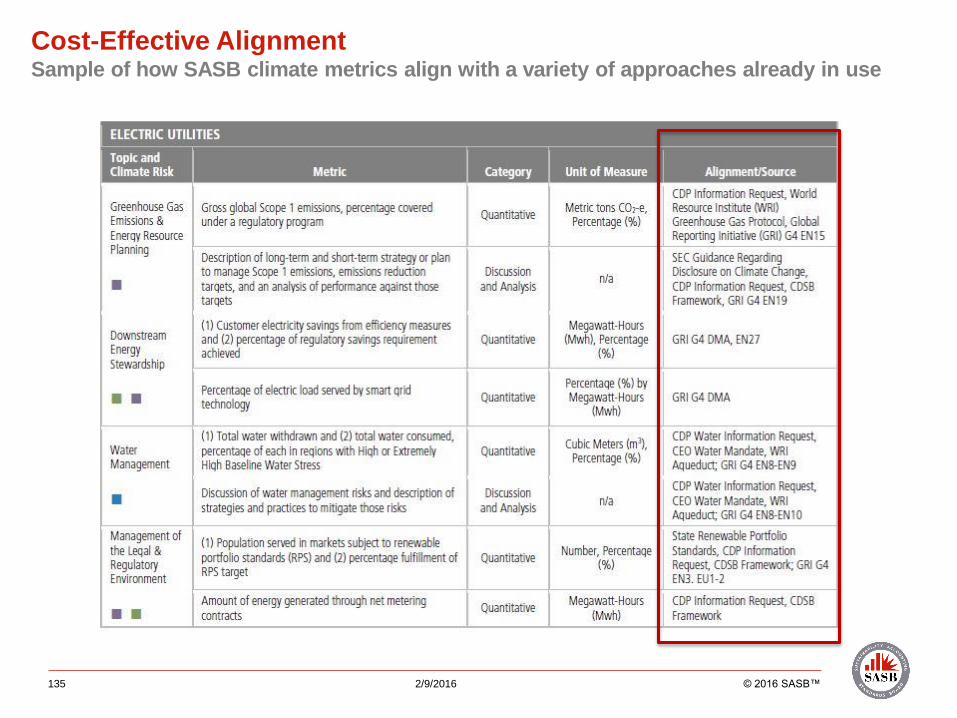
Cost-Effective AlignmentSample of how SASB climate metrics align with a variety of approaches already in use
2/9/2016 © 2016 SASB™135

Climate risk manifests differently in each industry
Understanding climate risk requires specialized disclosures
Climate risk is systemic in nature
SASB and Climate Risk
A look at investor exposure to climate risk and an analysis of corporate disclosure
136 2/9/2016 © 2016 SASB™
Climate risk has tangible, identifiable financial implications
Climate risk is not adequately disclosed