HOME ZONES THE WEST SUSSEX EXPERIENCE ALEX SHARKEY WEST SUSSEX COUNTY COUNCIL.

1
SUSSEX COUNTY WASTEWATER MANAGEMENT PLAN UPDATE
SUSSEX COUNTY WATER QUALITY MANAGEMENT PLANNING AREA
UPPER DELAWARE WATERSHED MANAGEMENT AREA
WALLKILL WATERSHED MANAGEMENT PLANNING AREA PASSAIC WATERSHED MANAGEMENT PLANNING AREA
DESIGNATED WASTEWATER MANAGEMENT PLANNING AGENCY: SUSSEX COUNTY BOARD OF CHOSEN FREEHOLDERS PREPARED BY: SUSSEX COUNTY DEPT. OF ENGINEERING & PLANNING SUSSEX COUNTY ADMINISTRATIVE CENTER ONE SPRING STREET NEWTON, N.J. (973) 579-0500 PRELIMINARY ADOPTION: NOVEMBER 7, 2007

2
TABLE OF CONTENTS I. Introduction…………………………………………………….. pg 4
A. Wastewater Planning B. Watershed Management Areas
II. Summary Table of Significant Actions…………….……...….. pg 6 WMP Amendments Approved since Sept. 2001
III. Discussion of Wastewater Facilities and Septic Management.. pg 7 A. Water Quality Issues B. Alternative Treatments and Septic Management
IV. Summary of Environmental Assessment and Analysis……… pg 8 A. Aquifer Recharge B. Carrying Capacity of the Land C. Environmental Analyses 1. Environmental Constraints/ Build-out Analysis
2. Nonpoint Source Pollutant Loading 3. Point Source Pollutant Loading Analysis 4. Groundwater Discharges (Nitrate Dilution) 5. Depletive/ Consumptive Water Use Analysis 6. Riparian Corridor Analysis 7. Endangered/ Threatened Species Analysis 8. Alternatives Analysis
V. Discussion of Justification of Service Area Delineations……... pg 15
VI. Existing and Future Wastewater Treatment Facilities……… pg 19 A. Narrative of NJPDES Wastewater Treatment Facilities B. Facilities Tables Exhibit 1: Sussex County Wastewater Plan Amendments………. pg 17
Approved since Sept. 2001 Exhibit 2: Sewer Allocations for Sussex County……………….. pg 18
Municipal Utilities Authority (MUA) and Musconetcong Sewerage Authority (MSA) APPENDIX A – Total Maximum Daily Load (TMDLs) for Stream Segments And Lakes within Sussex County APPENDIX B – Population APPENDIX C – Natural Resources Inventory
APPENDIX D – List of Source Documents APPENDIX E – Summary of Wastewater Treatment Facilities

3
Maps for Sussex County Wastewater Management Plan
Map #1: Planning Area Map #2: Existing Wastewater Facilities and Service Areas Map #3: Future Wastewater Facilities and Service Areas Map #4: Generalized Zoning Map Map #5: Environmental Features a. Highlands Preservation and Planning Areas, Public Open Space and Recreation, Conservation Lands (incl. Preserved Farms) b. Stream Classifications, Stream Buffers, Flood Prone Areas c. Watershed Boundaries (for HUC-11 and HUC-14), Wetlands d. Natural Heritage Priority Sites e. Landscape Project Areas (Rank 3, 4 and 5) Map #6: Sussex County Strategic Growth Management Plan – Landscapes Map #7: Wellhead Protection Areas in Sussex County
4
I. INTRODUCTION The purpose of this document is to provide a comprehensive Wastewater Management Plan (WMP) for Sussex County. The WMP has been submitted to the New Jersey Department of En-vironmental Protection for approval so that it may be incorporated into the Sussex County Water Quality Management Plan via the plan amendment procedure (N.J.A.C. 7:15). Section 208 of the Clean Water Act Amendments of 1972 requires the development of area-wide Water Quality Management Plans (WQMP) as an overall document relating to water quality, and included as part of the WQMP is a Wastewater Management Plan. The Sussex County WMP, referred to as the “plan” in this document, includes maps and narratives depicting the location, capacity, ownership, operator, and type of all wastewater treatment facilities in the County. The plan also sets out the framework for the control and mitigation of non-point source pollution from human activities such as urban development, agriculture, failing septic systems and the like. When the first WQMP was prepared in 1976, Sussex County was the area-wide designated Wa-ter Quality Planning Agency with jurisdiction outside the County in parts of Jefferson, Mt. Ar-lington, Mount Olive and Roxbury that lie in the Musconetcong watershed. Sussex County is currently the designated agency for wastewater planning, but only within the County boundary. A. Wastewater Planning In accordance with State Water Quality Management Planning rules (N.J. Administrative Code 7:15), the Sussex County Board of Chosen Freeholders are a Designated Agency for Water Qual-ity Management Planning. In 1976, Sussex County decided to take on that responsibility, and prepared a Water Quality Management Plan, revised in 1987. Few counties have done that in New Jersey, and Sussex County has been active in protecting water quality while planning for sewer service areas and infrastructure for treating wastewater. The Sussex County Water Quality Policy Advisory Committee (commonly referred to as the “208 PAC”) advises the Freeholder Board on wastewater plan amendments and other water quantity and quality issues. In 2001, the Sussex Countywide Wastewater Management Plan (WMP) was compiled, then ap-proved by the County Freeholders and the NJ Dept. of Environmental Protection. The existing Sussex Countywide WMP is a summary of all municipal wastewater plans approved by DEP, as of September 2001. There have also been approved amendments after September 2001, which are included in this plan update. The current plan is a summary of existing and future (approved but not yet built) sewer service areas and NJPDES Permit locations. A NJPDES (New Jersey Point Discharge Elimination System) Permit for wastewater discharge cannot be issued by DEP unless it is consistent with the approved Wastewater Management Plan. The wastewater dis-charge is either to surface water or ground water, and is measured in gallons per day.
The Sussex County Municipal Utilities Authority (SCMUA) operates the largest sewer treatment plant in Sussex County, located in Hardyston Twp. The “Upper Wallkill Valley Water Pollution Control Plant” is permitted for 3 million gallons per day (gpd) discharge to the Wallkill River, and its sewer service area extends into Franklin, Hamburg, Hardyston, Vernon, Sussex, Wantage, and Sparta. In 2005, the DEP approved a discharge to ground water in Vernon Twp. of 265,000 gpd -- the wastewater will be treated at the SCMUA facility in Hardyston and then piped back to Vernon for discharge. SCMUA also operates other wastewater facilities in the County, including
5
Hampton Commons facility in Hampton Twp. Each municipality in the sewer service area has an allocation for their use, and excess allocation may be transferred to another municipality upon mutual agreement and amendment to the wastewater plan. The Town of Newton is the owner and operator of its own wastewater treatment plant that has a permitted wastewater flow of 1.4 million gallons per day (gpd) discharge to surface water. As of 2001, existing flow was about 1 million gpd, so there is additional capacity available in that plant. The Musconetcong Sewer Authority owns and operates a wastewater treatment plant located in Morris County, with a permitted discharge of 5.9 million gpd. Its sewer service area extends into Stanhope, Byram and most recently, Hopatcong with the construction of sewers into the Bor-ough. There are also smaller package treatment plants located throughout Sussex County that serve schools, commercial and industrial sites, and are typically less than 20,000 gpd discharge to ground water. B. Watershed Management Areas
The streams listed below all originate or have headwaters in Sussex County. Headwaters are characterized by steep gradients, large cobbles and rocks on the stream bed, and narrow flood-ways. Waters of this type tend to be clear, cool and swiftly flowing, and often provide habitat for trout and other cold water species. The Wallkill River has an unusual characteristic, as it is one of the few rivers that flows North. It flows thru New York State and eventually drains into the Hudson River. WATERSHED
MANAGEMENT AREAS SUBWATERSHEDS
UPPER DELAWARE Delaware (direct drainage to river) (WMA #1) Shimmers Brook
Flat Brook Van Campens Paulins Kill Pequest River Musconetcong River
WALLKILL Wallkill River
(WMA #2) Papakating Creek Pochuck Creek
UPPER PASSAIC/ Pequannock River
ROCKAWAY Rockaway River (WMA #6)

6
II. SUMMARY TABLE OF SIGNIFICANT ACTIONS This WMP update is designed to meet the requirements of the DEP but it also is a planning document tied to implementation of the Strategic Growth Plan. By agreement with DEP staff, potential centers and associated central utility services are identified and discussed in general terms. The WQMP and Strategic Growth Plan (SGP) do not show these with specific area boundaries. They are included as there must be a direct connection between center-oriented de-velopment and essential utility services. This WMP update is somewhat unusual as it removes some areas of proposed sewer service in the County in order to bring consistency between the County WQMP, the draft Highlands Re-gional Master Plan and the County Endorsed Strategic Growth Plan. The following Significant Actions will be in effect once the WMP is approved:
Modification of the Wastewater Planning Area Jurisdiction – The change proposed in this plan reduces the area to only Sussex County itself. This would remove the municipalities in Morris County that were part of the Sussex County 2001 WMP: Mt. Arlington, Jeffer-son, Roxbury and Netcong. They are part of the Musconetcong Sewerage Authority WMP and would most likely become part of a Morris County WMP in the future.
Reduction in Future Sewer Service Area – This plan proposes to delete certain areas des-
ignated as “2,000 to 20,000 gallons per day discharge to ground water” on the Future Sewer Service Areas map of the 2001 WMP, in accordance with DEP regulations. Areas can remain where sewer service is an existing or permitted system or if located within an existing or proposed center or node.
Link Future Sewer Service Areas to Smart Growth Forms – All future sewer service areas are proposed to be restricted to existing centers and nodes, those new or expanded centers and nodes proposed by municipal petitions for plan endorsement, facilities required to al-leviate a demonstrated public health hazard, and special cases.
Provide Standardized Criteria for Alternative Wastewater Disposal – As aerobic and
other alternative septic system technology is accepted by the NJDEP and is available “off-the-shelf”, use of these systems is encouraged in municipalities with active septic management programs. Future septic management responsibility could be provided for municipal governments by Sussex County as are current health inspection and ISSDS re-view and approval services.
Evaluation of Carrying Capacity – As individual plan endorsement petitions are submit-
ted by municipal governments, a carrying capacity analysis will be required where spe-cific service area boundaries and flows are identifiable. For areas not served by central sewer service, the Trela-Douglas Modified Nitrate Dilution Model should be used to de-termine appropriate land use intensities.
The Existing Sewer Service Area maps and Facilities Tables are updated to show new
NJPDES Permits issued and sewer infrastructure that was constructed since September 2001, when the previous Sussex County WMP was submitted.

7
The updated Sussex County WMP also includes WMP Amendments and Revisions that were approved by the Sussex County Board of Chosen Freeholders in accordance with the Plan Amendment Procedure, and most Amendments already have DEP approval. Approved amendments from September 2001 and up to November 2007 are included in this WMP update (see Exhibit 1).
The Sussex County WMP is revised in accordance with Highlands Regulations, which
included removal of Future Sewer Service Areas in the Highlands Preservation Areas where wastewater infrastructure was not constructed as of August 10, 2004.
To correct a prior mapping error, there are two sites on Route 23 in Wantage that are be-
ing shown as “Over 2,000 gallons per day discharge to groundwater”. This will correct the discrepancy that occurred in 2001 between the Wantage Township WMP and the Sussex County 2001 WMP. Wantage Township Committee has endorsed this by resolu-tion for both Mountain View Manor and Wantage Heights projects.
Vernon Township has requested a minor revision to their Future Sewer Service Area
boundary, in a letter from Gene Osias, Health Director, dated 7/23/07, with a detailed list-ing by Block and Lot. The listing shows a few lots to be removed or added, and the revi-sion supports the Vernon Town Center development to manage growth. A correction of a mapping error in Andover Borough is also included in this WMP
update, to accurately show the Future Sewer Service Area boundaries as shown in the Andover Borough WMP dated 1996 and previously approved by DEP. Existing lots in Andover Borough along both sides of Route 206 are being added to correct the mapping error that occurred in the 2001 County WMP.
This plan also includes mapping of wellhead protection areas as delineated by the NJ
DEP. This mapping is included as important guidance to municipalities, indicating that both existing and proposed wells must be evaluated for threats to water quality.
III. DISCUSSION OF EXISTING AND FUTURE WASTEWATER FACILITIES As indicated in the Strategic Growth Plan, additional development always has an impact. Where that development is located in compact centers or nodes, the impact is deemed acceptable, given the counterbalancing preservation of land in the environs. This is anticipated to be effected via farmland and open space preservation, transfer of development rights and the creation of stew-ardship programs in existing protected open space tracts. This plan also specifically contemplates off-site facilities where deemed appropriate to focus growth in a center. This is consistent with the science behind area-wide recharge characteristics. A brief narrative has been provided in Section VI for all existing and proposed wastewater treatment facilities in Sussex County that require a NJPDES Permit. This is supplemented by detailed information in the Facilities Tables for NJPDES Permits. As a result of construction of new sewers since 2001 in Sparta and Hopatcong, some smaller wastewater facilities with NJPDES Permits were abandoned and the wastewater is now conveyed to the larger sewer

8
plants. The narrative also describes some NJPDES permitted facilities in Branchville and Frank-ford, for example, that will be abandoned in the future when those areas are sewered. A. Water Quality Issues Water quality in Sussex County is generally very good. With the vast majority of the County relying on ground water supplies for drinking water and potable water uses, land use regulations and methods of detecting pollution must be as advanced as possible. The Federal Act requires that existing and potential water quality problems within the planning area be assessed. This assessment shall include identification of the type and degree of problems and the sources of pollutants contributing to the problems. Sussex County has been very fortu-nate in benefiting from the research and resource protection efforts of the two largest Watershed Management Area (WMA) agencies in the County: the Upper Delaware and Wallkill WMA’s occupy the majority of the geographic area of the County. Portions of two other watersheds in the Passaic Basin (Rockaway, Pequannock) occupy the remainder. Since 2001, new construction of sewers in Sparta and especially Hopatcong have allowed for abandonment of failing septic systems and thereby improved the water quality of streams and lakes. Existing development that was built prior to the environmental regulations of the 1970s is often on small lots, especially in lake communities, and strains the capacity of the soils to handle the septic systems. In lake communities such as Lake Hopatcong, cottages that were originally built for seasonal use have been converted to year-round housing and protecting the water quality in these areas is a critical issue in Sussex County. B. Alternative Treatments and Septic Management Standardized Criteria for Alternative Wastewater Disposal – Sussex County is host to many ar-eas, particularly lake communities, where individual subsurface disposal systems (ISSDS) fail to operate properly. Generally, there is little a homeowner or small business operator can do to im-prove the system when limited to traditional ISSDS (septic) technology. Even optimally func-tioning systems discharge wastes at levels requiring substantial quantities of recharge for dilu-tion. One of the more important opportunities for environmental stewardship is coupled with the County’s economic development program. As the alternative septic technology using aerobic systems has been proven effective and can be implemented at the individual lot level in addition to being adaptable for groups of dischargers, these systems will be actively encouraged as part of the Sussex County Water Quality Management Plan and Wastewater Management Plan. There is little room for debate that the densities of development in many areas of the County are inappropriate, given the capacity of soils and recharge to return the effluent to acceptable levels. This is particularly true in the various lake communities in the County. Any property owner in a municipality with an active septic management program would be eligible to install or repair a waste disposal system meeting the standards of those currently available and used in New Jersey and the nation. Per discussions with representatives of the NJDEP over many years, the quality of effluent discharged from these systems is near potable and far higher than conventional sys-tems. As a result greater flows can be safely accommodated in all areas of the County and re-

9
pairs to substandard, malfunctioning systems can be made yielding real results rather than simply replacing the system that failed with another of the same utility. Where flows would exceed the NJPDES threshold of 2,000 gallons per day, these systems would be considered consistent with the adopted WQMP/WMP, meeting the specifications already set by the NJDEP and move through the review process expeditiously. As aerobic and other alternative ISSDS technology is accepted by the NJDEP and is available “off-the-shelf”, use of these systems for individual land uses or combinations of land uses on one or more lots is encouraged in municipalities with active septic management programs, such as Lake Mohawk in Sparta Township. Future septic management responsibility could be provided for municipal governments by Sussex County as are current health inspection and ISSDS review and approval services. IV. SUMMARY OF ENVIRONMENTAL ASSESSMENT AND ANALYSIS This plan provides a first level calculation of available water supply. This is based directly on the assumptions made in the Endorsed Strategic Growth Plan. The assumptions are: (1) average annual recharge across the County as reported and mapped by the NJDEP (2) average household size 3.0 persons, (3) twenty percent of the recharge is available for withdrawal and (4) one inch/acre of water equals 27,000 gallons. .The following is an excerpt from the Strategic Growth Plan at page 151: A. Aquifer Recharge
The capacity of an aquifer to yield water is only a part of the picture. The other side of the equa-tion is, to what extent can an aquifer be recharged once that water has been withdrawn? Other than in the glacial drift formations, this is a function of soil type and topography. The more po-rous soils more readily accept precipitation and runoff. The more steep soils are less able to ac-cept recharge. This is due to the fact that increased slopes increase the velocity of stormwater flows. This reduces the time available for infiltration. This is particularly critical in the areas of relatively resistant bedrock (the Highlands, Kittatinny Ridge), already limited by their character as sources of water. Areas of greatest recharge are found in the valleys while lesser recharge is found along the ridges, and most particularly, in the Highlands. Interestingly, one inch per acre of recharge equals approximately 27,000 gallons. Even in the areas of lowest recharge, there are substantial quantities of water reaching the aquifer. Only a portion of the water reaching the aquifer as recharge is available for consumption, particularly in times of drought without adversely affecting stream base flows and existing withdrawals. For example, six inches of recharge per year over an acre provides approximately 160,000 gallons to the aquifer. Of this, no more than 32,000 gallons (twenty percent) is available for consumption. A single family, utilizing approximately 250 gallons per day, will consume slightly more than 90,000 gallons per year. From a recharge perspective, an acre receiving sixteen inches of re-charge per year will sustain this hypothetical single family. As the amount of recharge dimin-ishes, the contributing area must correspondingly increase. This may be somewhat offset in ar-eas served by septic systems or other waste treatment facilities which discharge treated effluent to ground water.” Generally, the result suggests that there is adequate water supply to support twice the current population of the County along with business and industrial withdrawals.
10
B. Carrying Capacity of the Land In addition to water supply, wastewater disposal is a critical element of carrying capacity. The Strategic Growth Plan contemplates that the majority of future development in centers and nodes. These will rely on central wastewater treatment facilities. As a general rule, 1.25 square feet of land area is required for treated effluent disposal per gallon of wastewater discharged. As the level of treatment available is significant, near potable water is being recharged to the ground-water, significantly offsetting any withdrawal impact. This general analysis of carrying capacity will be of use in areas where existing centers are candidates for expansion and/or inten-sification and where new centers may be proposed and is provided to point out significant oppor-tunities and constraints to development. Where future sewer service is proposed to support the establishment or expansion of centers in accordance with Plan Endorsement granted by the State Planning Commission, the methods for evaluating the resource base and carrying capacity shall incorporate assimilative capacity of soils for groundwater discharge and the safe sustained yield of water supplies. It is understood that the protections afforded floodplains, wetlands, and areas where it has been documented that en-dangered and/or threatened species are resident shall be addressed in evaluating any new or ex-panded center. As individual plan endorsement petitions are submitted by municipal governments, a carrying capacity analysis will be required where specific service area boundaries and flows are identifi-able. For areas not served by central sewer service, the Trela-Douglas Modified Nitrate Dilution Model should be used to determine appropriate land use intensities. C. Environmental Analyses 1. Environmental Constraints/Build-out Analysis
The build-out analysis prepared for the Strategic Growth Plan takes into account current municipal zoning, constrained lands (steep slopes, wetlands, wetlands and riparian transi-tion areas, flood plains) across the entire county. Generally, it appears that there is ade-quate water supply and that either existing facility capacity is adequate or that future fa-cilities can be constructed with ground water discharge to serve estimated development.
2. Non point Source Pollutant Loading/Hydro modification Analysis
Sussex County has developed a model to determine the degree to which nonpoint source pollution is generated from various build-out scenarios. Where new development is pro-posed in centers, the consideration of alternative designs shall be linked to water quality protection and enhancement.
3. Point Source Pollutant Loading Analysis
Surface Water Discharge (Antidegradation Analysis):
Any proposal to increase a wastewater discharge to surface water must be carefully as-sessed relative to antidegradation requirements. First, alternatives must be considered

11
which will achieve the goal of no groundwater for incremental flow or a beneficial reuse of effluent, such as at a golf course. If an analysis of the alternative indicate there is no feasible means to prevent an increase in load or concentration of parameters of concern. If this is not feasible, then a stream study would be required, the scope of which would need to be approved by the Department before proceeding. Through such a study the pa-rameters of concern and effluent requirements to achieve the standard of antidegradtion would be identified. Treatment options may be available to meet the antidegradation re-quirements and would need to be presented and evaluated. If all options have been ex-plored and a lowering of water quality is still foreseen, the applicant would have to dem-onstrate why such a lowering should be permitted. This would include an identification of the socially and economically important development that would be affected if this lowering is not allowed. The social and economical impact must be compared to the ex-pected impact on the existing water quality, as well as the effect on the existing uses and designated uses for the receiving water (as established in the N.J.A.C. 7:9B, Surface Wa-ter Quality Standards.
4. Groundwater Discharges (Nitrate Dilution):
With regard to ground water quality impacts as new or expanded discharges are pro-posed, they will be evaluated through the NJPDES permitting process. For areas desig-nated DGW <2,000 gpd, to demonstrate conformance with the objective of protecting groundwater quality, application of the nitrate dilution model will be required. The goal of this analysis is to meet antidegradation for ground water or 5.2 mg/l whichever is more stringent. Please be aware the Highlands target will be established by regulation consis-tent with the statutory requirement. There are two acceptable methods to meet this objec-tive:
a. Apply the nitrate dilution model for the designated areas to determine the minimum lot size that would support conformance with the groundwater quality standards. Adjust zoning in the designated areas to conform with this lot size determination. b. Adopt a zoning overlay ordinance that requires, as part of the subdivision and site plan approval process, that the nitrate dilution analysis be applied to ensure that the number of units allowed, regardless of underlying zoning, supports conformance with the groundwa-ter standards.
The nitrate dilution model is available on the Department’s website at http://www.nj.gov/dep/watershedmgt/wmp_rule_model.htm
5. Depletive/Consumptive Water Use Analysis.
Along with a map showing all known water purveyor service areas and the tabular data including name, well allocation or water diversion permit numbers and rates, any deple-tive/consumptive water use analysis will require a demonstration that the proposed in-creased use will not adversely impact the source water resource or existing uses. If a new or expanded water allocation permit is required for the water supply, this analysis will be conducted as part of the Water Allocation permitting process to be conducted concur-rently with the amendment process. Applicant must submit separate application to the

12
Bureau of Water Allocation. Otherwise, if the increased use remains less than 100,000 gpd, or 50,000 gpd in the Highlands Protection Area an analysis is required as part of the amendment process.
a) Surface water or surficial aquifer source
For the purpose of this analysis, depletion of baseflow is presumed to be equal to the amount of water which has been diverted or otherwise removed from a body of water or surficial groundwater without being returned. New water use may not exceed a net reduction of 10 percent of the aquifer recharge over the area extent of the proposed project area. If the demand exceeds this amount, then methods and measures to off set the excess decrease in surface water baseflow, must be identified and implemented. Such methods and measures my include: reducing existing water demands/uses through conservation or other means, increasing in-filtration or storm water, reuse of treated effluent for recharge or irrigation pur-poses, use of water supply from non-critical areas, adopting conservation-based outside water use ordinances or any other reasonable actions. The application must identify the implementation plan for measures that are feasible, timing and responsible entity.
b) Confined aquifer source:
Must determine if the proposed increase or new source is consistent with any re-strictions or other provisions of any of the following that apply to the area: Criti-cal Water Supply Areas 1 or 2; South Jersey PRM; Pinelands out of basin trans-fer.
6. Riparian Corridor Analysis
The objective to be served by this analysis is no loss of value due to potential short term or long term disturbance of these corridors. The no loss of value objective must follow the “avoid minimize mitigate” approach: efforts to avoid all negative impacts should be attempted first; where total avoidance is not feasible, then effectively minimizing those negative impacts may be undertaken; lastly, measures to mitigate remaining nega-tive impacts can be offered. The stream corridor, or area of concern, for the purpose of this analysis, is 300 feet from top of bank (or centerline of a first order stream where no bank is apparent) for waters designated as Category One or within the Highlands Preser-vation Area, 150 feet for waters designated FW 1 and FW 2-Trout Protection and 75 feet for all other FW classifications. Please note that streams are identified as blue lines on quad sheets or on the County Soil maps. The objective of the no loss of value can be achieved by ensuring that there is no disturbance with in the applicable 75, 150, 300 foot area of concern. Otherwise, where there is proposed encroachment within stream corri-dors, including storm water outfalls, demonstrate that the functions of the existing stream corridors won’t be impaired by the proposed development, or if there will be impairment, how this impairment will be minimized/mitigated. These functions include but are not limited to filtering of storm water runoff, nutrient uptake, groundwater storage and re-charge, forest canopy, vegetative litter, wildlife habitat, bank stabilization, and flood pro-tection. Because this is a WMP, adoption, by the municipality, of a stream corridor pro-
13
tection ordinance designed to achieve the stated objectives and the removal of SSA from the corridor are the means to ensure that stream corridors will not be compromised through changes in land use.
7. Endangered/Threatened Species Analysis
To demonstrate conformance with the stated environmental objective, all sewer service area must be removed from Ranks 3 (State Threatened), 4 (State Endangered) and 5 (Federal Threatened and/or Endangered) and a municipal site development ordinance(s) must be crafted which will require that a Threatened or Endangered Species Habitat Analysis be conducted to provide supporting documentation indicating if Federal or State listed endangered or threatened species habitat is present on the site of any new construc-tion proposed within the Township and SSA. The Threatened or Endangered Species Habitat Analysis shall include, but not necessarily be limited to the following:
a) All applicants of proposed development projects within the Township must screen for the existence or nonexistence of endangered or threatened species habitat on the project site by utilizing the NJDEP “Landscape Project.” b) If specific species habitat of concern as depicted by the NJDEP Landscape Project Maps and Rank 3, 4, and 5 habitat areas is identified, the applicant may choose to have a qualified Environmental Scientist/Biologist or Ecologist perform a site specific analysis to identify or confirm all species and the approximate loca-tion of the habitat within the project location. c) If the proposed development falls within the Landscape Project Area Rank 3, 4, or 5, measures to avoid any negative impacts to confirmed critical habitat ar-eas identified shall be the primary goal of the project design and are to be taken into consideration first. d) The submission of a Conservation Plan is required for all unavoidable im-pacts to critical habitat areas that have been identified. The Conservation Plan shall provide measures to permanently protect those critical habitat areas from fu-ture impacts from development. Measures should include protection of identified areas with a conservation/deed restriction.
With specific reference to Landscape Project Areas 3, 4, and 5, the following language, also part of the SGP will guide analysis of the relative benefits of center based develop-ment and concurrent environs protection: “With respect to the habitat concerns, the fol-lowing are the additions to the SGP developed with DEP staff:
Page 66 - Where habitat suitable for threatened or endangered species is to be developed as part of a Center, offsetting habitat management practices shall be incorporated.
Page 166 - It is essential that the County achieves a balance between the State Plan Cen-ter based development and the inevitable elimination of plant and wildlife habitat in those areas deemed appropriate for Center development. As nearly all of Sussex County, not only the Highlands, is identified as habitat considered to be suitable for Federal or State threatened or endangered species of plants and animals, it is not likely that the important benefits of reduced sprawl, stormwater runoff, prevention of recharge loss and reduced
14
fragmentation of habitat will be realized without some environmental impacts in areas of the County identified for growth.
That said, an appropriate mechanism is to provide that, where a center is proposed or ex-panded and such proposal or expansion would result in an impact to habitat for endan-gered and threatened plants and animals, these impacts should be avoided and minimized to the extent practicable and that conservation measures be implemented to avoid a net loss of habitat "value".
Habitat value is a function of the area and quality of existing habitat, or resulting habitat. Diminished habitat value for agricultural lands, grassland, forestland and wetland habitats in Sussex County may be offset through tools such as best management practices for ag-riculture, preservation, deed restriction, conservation and habitat enhancement.
Agricultural land, open space, and general open space and recreation facilities may be improved as an off-set to the gross loss of an area of habitat caused by development through implementation of habitat enhancement and best management practices. For in-stance, there are many areas of conservation easements, preserved open space and pre-served farmland where management of the habitat quality is not practiced or in some cases, is prohibited. As a consequence, multiflora rose, autumn olive, purple loosestrife, barberry, thistle and other invasive species encroach and eventually overwhelm the land area. The open space values sought to be preserved are thus negated/destroyed.
The character of the County is dependent on the retention and maintenance of open space and agriculture. Simply leaving agricultural land to revert to forest and failing to imple-ment best agricultural management practices may leads to degradation of the habitat value of the land for those species that depend upon grasslands, pasturelands or other human-maintained or early successional habitats. This is a waste of the taxpayer dollars used to purchase the land or easement in the first place. It impairs the educational and open air experience of open space lands. In order to adequately address these important issues, all center/node based development proposals should be conditioned upon the peti-tioner taking reasonable steps to secure the benefits of the transferred densities and con-sequent open space/preserved farmland as part of the overall plan for development to en-sure no net loss of habitat value. In the same vein, no proposal for open space acquisition should be without a feasible management plan.”
8. Alternatives Analysis Will apply to proposed amendment to this WMP by project.
15
V. DISCUSSION OF JUSTIFICATION OF THE SERVICE AREA DELINEATIONS Throughout this plan, the emphasis has been on reducing sprawl, and concentrating development in designated centers, nodes and future growth areas. The analysis provided in this document as well as that outlined for future amendments comprise a complete and reasonable evaluation of the natural resource base, and the benefits and costs of development in traditional or smart growth configurations. The result will be a vast improvement on historical development pat-terns, greatly enhanced threatened and endangered species habitat protection, and a better under-standing of the means by which development impact must be considered and offset in order to maintain our quality of life in Sussex County. Historically, there was little coordination between sewer service and regional land use matters. Other than the State Development Guide Plan, there was no state-wide plan nor was there any strong effort to coordinate county and municipal planning. The original municipal wastewater plans were based on the individual municipal zoning ordinances and maps. Today, the planning focus in New Jersey is significantly different. The first State Development and Redevelopment Plan was adopted in 1992 and the second in 2001. The third set of amend-ments are currently undergoing cross acceptance. Additionally, the Water Quality Management Rules adopted by the NJ Department of Environmental Protection (DEP) state that, following adoption of the County wastewater plan, municipal wastewater plans are no longer used by the DEP for consistency determinations. Sussex County has, in accordance with the procedures of the State Planning Commission (SPC) and Office of Smart Growth (OSG), submitted its Strategic Growth Plan (SGP) and received Plan Endorsement. The Strategic Growth Plan is the result of more than five years of intensive discussion with the entire County community, numerous public hearings and adoption by the Strategic Growth Advisory Committee, the County Planning Board and Board of Chosen Free-holders. The central tenet of the Strategic Growth Plan (SGP) is that growth be focused into compact cen-ters and nodes rather than scattered throughout the county, particularly as strip development along highways. The most important change to the entire water quality planning process in Sus-sex County is the close coordination between the goals, objectives and policies of the Strategic Growth Plan and this plan. Where there are existing or designated centers (e.g. Franklin, New-ton), sewer service creation and expansion is appropriate and supported. Where an area is not a designated or existing center, this plan does not propose that there be sewer services beyond in-dividual subsurface disposal facilities accommodating 2,000 or fewer gallons per day (septic sys-tems). As a result of this very different approach, some of the proposed sewer service areas shown in the 2001 WMP have been removed, as they would have promoted a sprawl-type of development pattern continuing along the major roads in the County. When and if a municipality or other en-tity provides the necessary data and justification for the creation of an additional center or node or for the expansion of an existing center or node, this plan shall also be amended to allow the provision of necessary infrastructure. There are, for example a number of existing centers (Sus-sex, Franklin, Hamburg, and Ogdensburg) that are not formally designated centers by the State Planning Commission. Additionally, the probable centers at Ross’ Corner in Frankford, Crystal
16
Springs and industrial parks in Hardyston and Sparta and one or more centers in Hampton Town-ship are depicted as Strategic Growth Centers in this plan. Once they have been submitted to the State Planning Commission for Plan Endorsement, they will also be proposed, simultaneously, for inclusion in this plan. As the densities required of most centers will require sewer service, this will require delineation in this plan as part of any Plan Endorsement granted by the SPC. Population and Natural Resource Elements have been brought up to date and are incorporated in the Strategic Growth Plan and appended hereto. These, together with circulation, employment, open space and recreation, farmland preservation and historic preservation serve as the basis for the County’s provision of the framework for local land use policies and implementation. It will be up to municipal government to develop plans and programs within this framework in accor-dance with their authority under the Municipal Land Use Law. The Existing and Future Sewer Service Area boundaries show the approved service areas and were delineated using parcel maps for each municipality. If a lot is served by a wastewater facil-ity, then the entire lot is shown within the sewer service area.

17
Exhibit 1 Sussex County Wastewater Management Plan Amendments and Revisions
Approved by County WMP Agency Since September 2001 WMP Amendments Since Sep-tember 2001
Description of Plan Amendment/ Revision
Newton Water Treatment Facility, Sparta Twp.
Discharge to surface water (DSW) for Morris Lake water treatment filter backwash
Blue Heron Project, Sparta Twp.
Increase discharge from 16,500 to 26,000 gallons per day (gpd) discharge to groundwater (DGW)
Allocation transfer from Sussex Borough To Hardyston Twp.
Transfer of 25,000 gpd allocation within SCMUA service area
Allocation transfer for Sparta Commons, Route 616, Sparta Twp.
Transfer from SCMUA reserves to Sparta Commons of 25,000 gpd, project already in sewer service area
Allocation transfer within Hardyston MUA from Wallkill Val-ley High School to YMCA
Transfer of 25,000 gpd allocation within SCMUA service area
TMB Partners, Route 15, Lafayette Twp.
Increase to 8,600 gpd for discharge to groundwater (DGW)
Mt. Creek and Vernon Center, Vernon Twp.
Proposed DGW of 265,000 gpd at site on Route 94 in Black Creek watershed in Vernon Twp. after treatment at SCMUA plant
Lafayette Federated Church Route 15, Lafayette Twp.
To serve expansion of church, septic DGW increase to 3,000 gpd
Branchville Borough And Frankford Twp.
To provide for sewer service to Branchville Borough and three sites in Frankford Township with 211,854 gallons per day (gpd) DGW located in Frankford Township
Crossed Keys Inn, Route 603, Green Twp.
Proposed DGW of 5,000 gpd for banquet facility
County of Sussex Homestead Com-plex, Route 655, Frankford Twp.
Addition of 3.5 acres to sewer service area for two Youth Shelter facilities
Lake Mohawk Golf Club, Sparta Twp.
Proposed DGW of 5,350 gpd for expansion of clubhouse and new pro shop
Mountain View Manor, Route 23, Wantage Twp.
Proposed project with 115 age-restricted units and retail space and DGW of 19,700 gpd
Wantage Heights, Route 23, Wantage Twp.
Proposed mixed-use project with 72 residential units, 16,150 square feet of retail space and one boarding house with DGW of 19,945 gpd
Martin Property, Route 206, Hampton Twp.
Proposed commercial development and expansion of existing treatment plant from 19,980 to 102,552 gpd discharge to groundwater (DGW)

18
Exhibit 2 Sussex County Municipal Utilities Authority
Upper Wallkill Valley Pollution Control Plant Sewer Capacity Allocations
Municipality or Utility SCMUA Allocation
(Gallons Per Day) Average Monthly Flow 2005 (Gallons Per Day)
Franklin Borough 785,000 510,000Hamburg Borough 420,000 350,000Hardyston Township MUA (Wallkill Basin)
515,000
Hardyston Township (Wallkill Sewer Co.)
155,000 83,000
Vernon Township (Vernon Valley Sewer Co.)
380,000 208,000
Sussex Borough 464,000 345,000Sparta Township 200,000 35,000SCMUA Landfill Leachate 35,000SCMUA Sludge/Septage Recycle 36,000Wantage Township 10,000 3,000Total Flow 3,000,000 GPD
Discharge to Surface Water (Wallkill River)
Expansion for Vernon Center and Mountain Creek
265,000 GPDDischarge to Ground
Water in Vernon Twp.
Musconetcong Sewerage Authority Water Pollution Control Plant
Allocations for Sussex County Municipalities Municipality Allocation
(Gallons Per Day)Current Flow
(Gallons Per Day)Byram 100,000 45,000Hopatcong 580,000 350,000Stanhope 541,000 360,000

19
EXISTING AND FUTURE WASTEWATER TREATMENT FACILITIES Pursuant to N.J.A.C. 7:15-5.16, this chapter will serve to describe all NJPDES permitted dis-charges within the Sussex County Water Quality Management Planning area. These permitted discharges will include municipal, commercial, and industrial wastewater treatment facilities, as well as, landfill monitoring. Appendix A contains the facility tables for all of the treatment plants within the planning area. The following notes are included pursuant to the requirements set forth under N.J.A.C. 7:15: 1. All existing, new, or expanded industrial pretreatment facilities requiring Significant In-
direct User (SIU) permits and/or Treatment Works Approvals, and which are located within the specified sewer service area, are deemed to be consistent.
2. Individual subsurface sewage disposal systems (ISSDS) for individual residences can
only be constructed in depicted sewer service areas if legally enforceable guarantees are provided, before such construction, that use of such systems will be discontinued when the depicted sewer service becomes available. This applies to ISSDS that require certifi-cation from the Department under the Realty Improvement Sewerage and Facilities Act (N.J.S.A. 58:11-23) or individual Treatment Works Approval or New Jersey Pollutant Discharge Elimination System Permits (under N.J.A.C. 7:14A). It also applies to ISSDS which require only local approvals if the WMP acknowledges adequate arrangements for enforcement of the requirement (such as through a municipal or sewerage authority ordi-nance).
3. Development in areas mapped as wetlands, flood prone areas, designated river areas, or
other environmentally sensitive areas may be subject to special regulation under Federal or State statutes or rules. Interested persons should check with the Department of Envi-ronmental Protection for the latest information. Depiction of environmental features is for general information purposes only, and shall not be construed to define the legal geo-graphic jurisdiction of such statutes or rules.
4. Pre-existing grant conditions and requirements (from Federal and State grants or loans for
sewerage facilities) which provide for restriction of sewer service to environmentally sensitive areas, are unaffected by adoption of this WMP and compliance is required.
5. Nondegradation water areas shall be maintained in their natural state (set aside for poster-
ity) and are subject to restrictions including, but not limited to, the following: 1) DEP will not approve any pollutant discharges to an FW1 stream, with the exception of up-grades to or continued operation of existing facilities serving existing development. 2) DEP will not approve any pollutant discharge to ground water nor approve any human activity which results in a degradation of natural quality except for the upgrade or contin-ued operation of existing facilities serving existing development. For additional informa-tion please see the Surface Water Quality Standards at N.J.A.C. 7:9B, and/or the Ground Water Quality Standards at N.J.A.C. 7:9-6.
20
Andover Borough – Andover Wastewater Treatment Facility This proposed wastewater treatment facility (NJPDES Permit No. NJ0134490) would be de-signed to serve the 235-acre mixed-use development and existing residential and commercial buildings in western Andover Borough. The annual average flow for this facility is estimated at 251,000 GPD. It is anticipated that the treated wastewater will be discharged to the Andover Junction Brook classified as FW2-TM. The treatment plant will be owned and operated by the Sussex County Municipal Utilities Authority.
Andover Borough - Wastewater Treatment Facility for Water Supply Treatment This proposed wastewater treatment facility would be designed to treat the backwash from any treatment process for Andover Borough’s water supply if the NJDEP should require such treat-ment. It is anticipated that the treated wastewater will be discharged to ground water. The treatment plant will be owned and operated by Andover Borough.
Andover Township - Andover Nursing Home This existing wastewater treatment facility (NJPDES Permit No. NJ0090069) serves the Andover Nursing Home, Intermediate Care Center, and the Rolling Hills Condominium Complex. The current annual average flow for this facility is 180,000 GPD which exceeds the permitted flow of 140,000 GPD. The facility is designed for discharge to ground water, however, due to the higher ground water table in the area, the discharge currently goes to a pond. The NJ Dept. of Envi-ronmental Protection has issued a Notice of Violation for the facility, and is working with the owners to investigate the problem and for corrective action to be taken. The treatment plant is owned and operated by the Andover Nursing Home, Inc.
Andover Township - Long Pond School This existing wastewater treatment facility (NJPDES Permit No. NJ0020419) serves the Long Pond School. The current annual average flow for this facility is 2,000 GPD and the future an-nual average flow is projected to be 6,000 GPD. The treated wastewater is discharged to an un-named tributary to Lake Illiff classified as FW2-TM. The treatment plant is owned and operated by the Andover Regional Board of Education.
Andover Township - St. Paul’s Abbey
This existing wastewater treatment facility (NJPDES Permit No. NJ0023132) serves St. Paul’s Abbey, a church instruction/retreat facility, and the Willow Glen Academy, an educational de-velopment complex, both located on Route 206. The current annual average flow for this facility is 7,500 GPD and the permitted flow is 20,000 GPD. The treated wastewater is discharged to ground water. The treatment plant is owned and operated by St. Paul’s Abbey.
Andover Township - Ascot Park Garden Apartments This existing wastewater treatment facility (NJPDES Permit No. NJ0060321) serves the Ascot Park Garden Apartments located on Mulford Road. DEP Permit approval is pending, since the facility must meet current standards for monitoring its flow and discharge. The current annual
21
average flow for this facility was 9,360 GPD in 2001 and the permitted flow is 10,000 GPD. The treated wastewater is discharged to ground water. The treatment plant is owned and oper-ated by Martin and Faul Ltd.
Andover Township - Life Care Mews
This wastewater treatment facility (NJPDES Permit No. NJ0129542) was built to serve the pro-posed Life Care Mews, a senior citizens complex near the intersection of Mulford and Limecrest Roads. However, the disposal bed area is being affected by the higher ground water table in the area, which occurred after a nearby quarry ceased pumping out ground water as part of their op-erations. The projected annual average flow for this facility is estimated at 65,200 GPD, to be discharged to ground water. The treatment plant is owned and operated by the Sussex and War-ren Holding Corporation.
Branchville Borough - Selective Insurance Company of America This existing wastewater treatment facility (NJPDES Permit No. NJ0073873) serves the Selec-tive Insurance Company of America. The current annual average flow for this facility is 20,000 GPD, and the permitted flow is 50,000 GPD. Treated wastewater is discharged to ground water using two disposal fields. This treatment facility is owned and operated by the Selective Insur-ance Company of America. It will be abandoned in the future when the sewers are constructed in Branchville.
Branchville Borough – Franklin Mutual Insurance Company
Two existing septic systems (NJPDES Permit No. NJ0078743) presently serve the company and its employees, with a current annual average flow of 1,900 GPD. From the septic systems, the wastewater is discharged to ground water. It will be abandoned in the future when the sewers are constructed in Branchville.
Frankford Township - Sussex County Health Department This existing wastewater treatment facility (NJPDES Permit No.NJ0022063) serves the Sussex County facilities located in Frankford Township, including the Homestead, Fire Academy, Main Library, Youth Shelter, and other facilities. The current annual average flow is 18,200 GPD and the permitted flow for this facility is 50,000 GPD. The treated wastewater is discharged to the Paulins Kill River classified as FW2-NT, Category One. The treatment plant is owned and oper-ated by the County of Sussex.
Frankford Township - Skylands Park Management This existing wastewater treatment facility (NJPDES Permit No. NJ0103748) serves the 28-acre Skylands Park minor league baseball stadium located at Ross’s Corner, on Route 206 and Route 565. The current annual average flow is 1,800 GPD, and the permitted flow for this facility is 24,000 GPD. The treated wastewater is discharged to ground water. The treatment plant is owned and operated by Skylands Park Management.
22
Frankford Township - Branchville Wastewater Facility This proposed wastewater treatment facility would be designed to serve Branchville Borough and three sites in Frankford Township: Frankford Twp. Elementary School, Methodist Manor Nursing Home and Pines Nursing Home. The future wastewater flow is projected at 176,000 GPD for Branchville and 30,000 GPD for the sites in Frankford, for a total of 206,000 GPD. The treated wastewater will be discharged to ground water in disposal beds located on both sides of Route 206 in Frankford Twp. The treatment plant will be owned and operated by the Sussex County Municipal Utilities Authority.
Fredon Township - Bear Brook Golf Village This wastewater treatment facility (NJPDES Permit No. NJ0109576) was designed to serve 86 residential units and the golf club facilities at Bear Brook Golf Village located at Route 94, Fre-don-Greendell Road, and Fredonia Road. The current annual average flow is 8,000 GPD, and the permitted flow for this facility is 30,000 GPD. Treated wastewater is discharged to ground water. The treatment plant is owned and operated by Aqua New Jersey for the Bear Brook Golf Village.
Green Township - NJ Conference 7th Day Adventist (Garden State Academy) This existing wastewater treatment facility (NJPDES Permit No. NJ0099171) serves the 100 stu-dents and staff of the NJ Conference 7th Day Adventist (Garden State Academy). This facility is located on 352 acres of land on Route 517. The current annual flow for this facility is 4,800 GPD and projected annual average flow for this facility is 17,500 GPD. The treated wastewater is discharged to ground water. The treatment plant is owned and operated by the NJ Conference 7th Day Adventist.
Green Township -Crossed Keys Banquet Hall
The proposed wastewater treatment facility will serve the Crossed Keys Banquet Hall located on Block 22, Lot 2.02 on Pequest Road. This facility will consist of a 15,458 sq. ft. Banquet Hall to be served by a subsurface sanitary disposal system with discharge to ground water and an aver-age annual flow of 4,450 GPD.. The proposed Banquet Hall will accommodate 200 seats and 30 employees. The facility will be owned and operated by Pequest 202, LLC.
Hamburg Borough – Ames Rubber Corp. The company owns and operates a ground water remediation treatment facility (NJPDES Permit No. NJ0000141) and 108,000 GPD of treated effluent is discharged to the Wallkill River, classi-fied as FW2-NT. In addition, Ames Rubber conveys sanitary wastes to the Upper Wallkill SCMUA facility.
Hamburg Borough - Accurate Forming
This facility (NJPDES No. NJ0103667) discharges approximately 5,400 GPD of treated effluent to the Wallkill River classified at FW2-NT. Accurate Forming also operates under the

23
NJPDES/SIU Permit No. NJ0103667 to convey sanitary and process wastes to the Upper Wall-kill Valley SCMUA facility. This facility is owned and operated by Accurate Forming Corp..
Hampton Township - Big N Shopping Center This existing wastewater treatment facility (NJPDES Permit No. NJ0024163) serves the Big N Shopping Center, Wal-Mart, and McDonalds located along Route 206. The current annual aver-age flow for this facility is 14,250 GPD. The treated wastewater is discharged to a tributary of the Paulins Kill River classified as FW2-NT. The treatment plant is owned and operated by Kere Associates. Subject to an agreement between the two owners, the proposed expansion of the NEMSA facility would allow for the transfer of wastewater flow from Big N facility in order to close this older treatment plant. Hampton Township – Northwest Environmental Maintenance (NEMSA) Facility This wastewater treatment facility (NJPDES Permit No. NJ0135160) will serve existing and pro-posed commercial development on the Martin property on Route 206, such as big-box retail, banks, fitness center, and other uses. The permitted annual average flow is 19,980 GPD with a proposed expansion to 102,552 GPD discharge to ground water. The treatment plant is owned and operated by Northwest Environmental Maintenance Security Association (NEMSA). Sub-ject to an agreement between the two owners, the proposed expansion of the NEMSA facility would allow for the transfer of wastewater flow from Big N facility.
Hampton Township - Hampton Commons This existing wastewater treatment facility (NJPDES Permit No. NJ0050580) serves approxi-mately 300 townhouse units of the Hampton Commons development located off Route 206 on Cherry Lane. The Hampton Commons development is at full build-out occupancy. The facility also serves the Lowe’s store and a proposed restaurant on Route 206 in Hampton Township (Block 3501, Lots 37 and 38) and provides for service to Hampton Township for the utilization of Block 3603, Lot 20.08. The current annual average flow for this facility is approximately 38,000 GPD, and the permitted flow is 50,000 GPD. The treated wastewater is discharged to a tributary of the Paulins Kill River classified as FW2-NT. The treatment plant is owned and operated by the Sussex County Mu-nicipal Utilities Authority. Hampton Township - Kittatinny Regional H.S. This existing wastewater treatment facility (NJPDES Permit No. NJ0028894) serves the 1,950 students and staff of Kittatinny Regional High School located on Halsey-Myrtle Grove Road. The current annual average flow for this facility is 13,000, and permitted flow is 45,000 GPD. The treated wastewater is discharged to the Paulins Kill River classified as FW2-NT. The treat-ment plant is owned and operated by the Kittatinny Board of Education.

24
Hampton Township - Carriage Acres Mobile Home Park This facility (NJPDES Permit No. NJ0067806) serves a mobile home park located on Route 94. The current annual average flow for this facility is 1,460 GPD and the permitted flow is 4,400 GPD, with a discharge to ground water. The Carriage Acres Mobile Home Park is owned and operated by the Carriage Mobile Homes, Inc.
Hardyston Township – Skylands Ice World This existing wastewater treatment facility (NJPDES Permit No. NJ0132284) serves the Sky-lands Ice World ice skating rink located on Route 23. The skating rink had been closed, but re-opened last year. The permitted annual average flow is ___ GPD. The treated wastewater is dis-charged to ground water, and the facility is owned and operated by Playbiz LLC.
Hardyston Township – Ballyowen Golf Club This existing facility (NJPDES Permit No. NJ0138720) serves the golf club facilities located on Wheatsworth Road. The current average annual flow is 1,940 GPD and the facility is owned and operated by the Ballyowen Golf Club.
Hardyston Township – Middle School
This existing facility (NJPDES Permit No. NJ0140210) serves the Twp. Middle School on Wheatsworth Road with 550 students and a staff of 50. The maximum daily flow of wastewater generated is 11,750 GPD, and it is discharged to ground water via four disposal beds. The facil-ity is owned and operated by Hardyston Twp. Board of Education.
Hardyston Township – Future SCMUA Expansion In the future, the expansion of the Sussex County MUA treatment facility will be proposed for an additional flow of 300,000 gallons per day through the Wastewater Plan Amendment process. The additional sewage treatment capacity allocation generated by the increase in plant capacity will be committed to the Hardyston Township Municipal Utilities Authority. This additional al-location will be reserved by the Hardyston Township MUA for Crystal Springs to serve the build-out of the Crystal Springs community on lands included in the existing sewer service area of Hardyston Township. The treated effluent will be conveyed to suitable locations for ground water discharge. The treatment, conveyance and discharge facilities will be owned, operated and maintained by the Sussex County MUA. The proposed expanded build-out of Crystal Springs is endorsed by Hardyston Township and said build-out will be included in their proposed Plan Endorsement Application. A hydrogeological study for suitable discharge sites has been initiated. A feasibility study for the conceptual plant expansion is underway. An agreement for the allocation increase and the Upper Wallkill System expansion between Sussex County MUA and Hardyston Township MUA and a parallel agreement between Hardyston Township MUA and Crystal Springs will be exe-

25
cuted upon completion of the feasibility study and concurrence with the conclusions by all par-ties. Hardyston Township - Upper Wallkill Valley Water Pollution Control Facility This existing wastewater treatment facility (NJPDES Permit No. NJ0053350), located in Hardyston Township, serves Hamburg Borough, Franklin Borough, parts of Hardyston Town-ship, parts of Vernon Township (Vernon Sewage Transmission Company), the Wallkill Sewer Company, Wallkill Valley Regional High School, Sussex Borough, parts of Sparta Township, a small area in Wantage Township, and leachate from the SCMUA Landfill. The current annual average flow for this facility is approximately 1.8 Million GPD and the permitted flow is 3 Mil-lion GPD for discharge to the Wallkill River, classified as FW2-NT. The treatment plant is owned and operated by the SCMUA. The approved expansion for Vernon Township consists of the transmission of treated wastewater back to Vernon Township for discharge to ground water of 265,000 GPD within the Black Creek watershed, at a location just north of McAfee on Route 94 (NJPDES Permit No. NJG0140091).
Hopatcong Borough – Weldon Quarry Co. This existing discharge (NJPDES Permit No. NJ0052418) serves the Weldon Quarry Company located on Route 181. This discharge is to a stormwater detention basin which percolates to ground water. The facility is owned by Weldon Materials Inc.
Hopatcong Borough - West Shore Villa Condominiums Sewer infrastructure now serves the site and the wastewater is now conveyed to the Musconet-cong Sewerage Authority Water Pollution Control Facility. The prior wastewater treatment fa-cility (NJPDES Permit No. NJG0108693) was abandoned -- it once served the 15 residential units and community room of the West Shore Villa located on Lakeside Boulevard with a dis-charge to ground water of 5,250 GPD.
Lafayette Township - Schering Corporation This existing wastewater treatment facility (NJPDES Permit No. NJ0005711) and percolation pond (NJPDES Permit No. NJ0101788) serves a 188,000 sq. ft. building owned by the Schering Corporation located on Route 94. The treated wastewater is discharged to a tributary to Paulins Kill River classified as FW2-TM and the percolation pond discharges to ground water . The fa-cility is owned and operated by Schering Corporation.
Lafayette Township – Hamm’s Landfill (HSL Inc.) The existing closed HAMM’s Landfill, located off of Old Beaver Run Road, utilizes ground wa-ter monitoring wells (NJPDES Permit No. NJ0053449) to monitor ground water. Approximately 650 GPD of leachate is produced and trucked monthly to an approved wastewater treatment fa-cility.

26
Lafayette Township - Lafayette Township Elementary School This proposed wastewater treatment facility would be designed to serve the 350 student and staff of the Lafayette Township Elementary School located on Beaver Run Road. The projected an-nual average flow for this facility is estimated at 8,760 GPD. It is anticipated that the treated wastewater will be discharged to ground water. The treatment plant will be owned and operated by Lafayette Township Board of Education.
Lafayette Township - Sussex County Municipal Utilities Authority - Solid Waste Facility This existing facility, located on Route 94, operates under four different NJPDES Permit num-bers. The first permit (NJ0066184) is for a discharge to a stormwater detention basin which flows into a tributary of the Paulins Kill River classified at FW2-NT. The second permit (NJPDES/SIU Permit No. NJ0103811) is to haul leachate to the SCMUA’s Upper Wallkill Val-ley Water Pollution Control Facility. The third permit (NJ0107689) is for the landfill monitoring wells, and the last permit (NJ0128091) is for discharge to ground water. These facilities are owned and operated by the SCMUA.
Lafayette Township - TMB Partners Commercial Site This proposed wastewater treatment facility (NJPDES Permit No. NJ0136280) would be de-signed to serve a restaurant, convenience store, bank, and retail stores located at the intersection of Route 15, Route 94, and Route 623. The permitted annual average flow for this facility is 8,686 GPD, and the treated wastewater will be discharged to ground water. The treatment plant will be owned and operated by Sussex County Municipal Utilities Authority.
Lafayette Township – Lafayette Federated Church This existing facility (NJPDES Permit No. NJ0155047) serves the expansion of the church lo-cated on Route 15 from 600 to a seating capacity of 1,003 people. The permitted average annual flow is 3,000 GPD and the treated wastewater is discharged to ground water. The facility is owned and operated by Lafayette Federated Church.
Montague Township - High Point Country Club WWTP This proposed wastewater treatment facility was originally planned to serve 3,460 new residen-tial units and the existing High Point Country Club. The projected annual average flow for this facility was estimated at 720,000 GPD, however, that permitted flow may be reduced subject to further studies of the proposed disposal sites required by the County in its conditional approval of the plan in 1992. The treated wastewater will be discharged to ground water.
Montague Township - Montague Township Elementary School STP This wastewater treatment facility (NJPDES Permit No. NJ0105058) serves the 400 students and staff of the Montague Elementary School located off Route 206. The annual average flow for this facility is approximately 9,000 GPD. The treated wastewater is discharged to ground water. The treatment plant is owned and operated by the Montague Board of Education.

erenzio & Panaro, P.C.
27
Mt. Olive Township - Musconetcong Sewerage Authority: Water Pollution Control Plant This existing wastewater treatment facility (NJPDES Permit No. NJ0027821) currently serves Mt. Olive Township, Mt. Arlington Borough, Netcong Borough, Roxbury Township, Stanhope Borough, Byram Township and Hopatcong Borough. The current annual average flow for this facility is __ Million GPD, and the permitted flow is 5.9 Million GPD. The treated wastewater is discharged to the Musconetcong River classified as FW2-TM. The treatment plant is owned and operated by the Musconetcong Sewerage Authority.
Town of Newton - Newton Wastewater Treatment Plant This existing wastewater treatment facility (NJPDES Permit No. NJ0020184) serves the Town of Newton. The permitted annual average flow for this facility is 1.4 Million GPD. The treated wastewater is discharged to Moore’s Brook classified at FW2-NT. The treatment plant is owned and operated by the Town of Newton.
Sandyston Township - New Jersey School of Conservation This existing wastewater treatment facility (NJPDES Permit No. NJ0069116) serves the New Jersey School of Conservation located in Stokes State Forest. The school may at any time house a maximum of approximately 300 students on a short term basis, along with a staff of approxi-mately 40 employees. The current and future projected annual average flow for this facility is 20,100 GPD. The treated wastewater is discharged to ground water classified as GW-2. The treatment plant is owned and operated by Montclair State University.
Sparta Township - White Deer Plaza This existing wastewater treatment facility (NJPDES Permit No. NJ0027057), located at the north end of Lake Mohawk, serves the downtown commercial areas and the Knoll Heights Sen-ior Citizens Complex. The current annual average flow for this facility is 32,290 GPD and the projected future annual average flow for this facility is 50,000 GPD. The treated wastewater is discharged to the Wallkill River classified as FW2-NT. The treatment plant is owned by Sparta Township.
Sparta Township - Alpine Elementary School This existing wastewater treatment facility (NJPDES Permit No. NJ0027065), located on Ando-ver Road, serves the Alpine Elementary School. The permitted annual average flow of this facil-ity is 25,000 GPD. The treated wastewater is discharged to a tributary of the Pequest River clas-sified as FW2-NT. The treatment plant is owned by the Sparta Township Board of Education.
Sparta Township - Pope John XXIII High School
This existing wastewater treatment facility (NJPDES permit No.NJ0027049), located on Ando-ver Road, serves the Pope John XXIII High School, Our Lady of the Lake Church, and Reverend George A. Brown School. The permitted annual average flow for this facility is 22,000 GPD.

erenzio & Panaro, P.C.
28
The treated wastewater is discharged to an unnamed tributary to Fox Hollow Lake, tributary to the Paulins Kill. This facility is owned by Pope John XXIII High School.
Sparta Township - Sussex County Technical School This existing wastewater treatment facility (NJPDES Permit No. NJ0050806) serves the Sussex County Technical School, located on Route 94. The permitted annual average flow is 18,000 GPD. The treated wastewater is discharged to ground water. This facility is owned by the Sus-sex County Technical School.
Sparta Township -Lake Mohawk Golf Club
This wastewater treatment facility serves the Lake Mohawk Golf Club. The Club's formal dining room has a seating capacity of 121, and its grill room has a seating capacity of 79. The Club also has 2,000 sq. ft of retail space for use by its members and guests. A separate on-site maintenance building is also being constructed, which will be utilized by approximately 20 employees, and have its own septic. The existing average flow is 1,495 GPD, and the planning flow for this facil-ity is 5,350 GPD. The treated wastewater will be discharged to ground water. The individual subsurface sewage disposal systems are owned and operated by the Club. Sparta Township - Tri-County Water Conditioning Company, Inc. The wastewater is now conveyed to the SCMUA’s Upper Wallkill Valley WPCF since sewers were extended into parts of Sparta, and this facility no longer discharges into the Wallkill River. This facility (NJPDES Permit No. NJ0033472) located on 8 Station Road, once served the Tri-County Water Conditioning Company.
Sparta Township – Morris Lake Water Treatment Plant This facility (NJPDES Permit No. NJ0136603) is located at the Morris Lake reservoir, off of Glen Road in Sparta, which provides the water supply for the Town of Newton. The water filtra-tion system treats the raw water from its intake, and the wastewater from the membrane filter backwash is discharged back into Morris Lake. The current average annual flow is 104,333 GPD and the permitted average annual flow is 200,000 GPD. The facility is owned and operated by the Town of Newton.
Sparta Township – Crest Aggregates Quarry This existing wastewater treatment facility (NJPDES Permit No.NJ0004791), located on Lime-crest Road, serves the existing quarry. The discharge is from the quarry and for non-contact cooling water. At one time during the full quarry operation, the annual average flow was 6 Mil-lion GPD, and the water was discharged to the Paulins Kill, classified as FW2-TP (C1). Cur-rently, the pumping from the quarry and discharge to the stream has nearly ceased, causing the ground water table to rise in the area and restore its natural condition after decades of dewatering the quarry. This facility is owned and operated by Limestone Quarry Dev. LLC.
erenzio & Panaro, P.C.
29
Sparta Township – Greentree Village This existing wastewater treatment facility (NJPDES Permit No. NJG0102768) serves a residen-tial townhouse development on Sparta Stanhope Road.
Sparta Township - Blue Heron Senior Housing This proposed wastewater treatment facility (NJPDES Permit No. NJ0077127) would be de-signed to serve the planned senior housing development of 256 units (both independent and as-sisted living) on Blue Heron Road, off Route 15. The permitted annual average flow for this fa-cility is 26,000 GPD, and the treated wastewater will be discharged to ground water. The treat-ment plant will be owned by DTH 15, LLC.
Stillwater Township - Fairview Lake YMCA This wastewater treatment facility (NJPDES Permit No. NJG0132578) is designed to serve the Fairview Lake YMCA. The current annual average flow for this facility is 1,370 GPD, due to the seasonal nature of its use. The treated wastewater is discharged to ground water. The treatment plant will be owned and operated by the Metropolitan YMCA of the Oranges.
Stillwater Township - Stillwater Township School This wastewater treatment facility (NJPDES Permit No. NJG0159204) would be designed to serve the Stillwater Township School located at the intersection of Maple Avenue and Stillwater Road. It is anticipated that the treated wastewater will be discharged to ground water. The treatment plant will be owned and operated by the Stillwater Township Board of Education.
Vernon Township - Legends Resort Hotel This existing wastewater treatment facility serves the Legends Resort Hotel. The current annual average flow for this facility is 200,000 GPD and the future annual average flow is projected to be 350,000 GPD. The treated wastewater is discharged to Black Creek classified as FW2-NT in a Surface Water Permit (NJPDES Permit No. NJ0023949) and to ground water classified as GW-2 (NJPDES Permit No. NJ0082511). The treatment plant is owned and operated by the Legends Resort Hotel.
Vernon Township - Vernon Township High School This existing wastewater treatment facility (NJPDES Permit No. NJ0091260) serves 1,970 peo-ple at the Vernon Township High School located on Loundsberry Road. The future annual av-erage flow is projected to be 45,000 GPD. Although the projected flow is 10,000 GPD higher than the design capacity, no expansion of the STP will be required within the 20 year time pe-riod. The treated wastewater is discharged to ground water. The treatment plant is owned and operated by the Vernon Township Board of Education.

erenzio & Panaro, P.C.
30
Vernon Township - Rolling Hills School / Lounsberry Hollow School - Cedar Mountain This existing wastewater treatment facility (NJPDES Permit No. NJ0023841) serves 1,718 stu-dents at the Rolling Hills School and Lounsberry Hollow School located near Cedar Mountain. The current annual average flow for this facility is 26,000 GPD and the future annual average flow is projected to be 42,000 GPD. Although the projected flow is 10,000 GPD higher than the design capacity, no expansion of the STP will be required within the 20 year time period. The treated wastewater is discharged to Lounsberry Hollow Brook classified as FW2-TM. The treatment plant is owned and operated by the Vernon Township Board of Education.
Vernon Township - Waywayanda Day Facility This proposed wastewater treatment facility would be designed to serve the Waywayanda Day Facility located on Waywayanda Road. The projected annual average flow for this facility is es-timated at 10,000 GPD. It is anticipated that the treated wastewater will be discharged to ground water. The treatment plant will be owned and operated by the Waywayanda State Park.
Wantage Township - Regency at Sussex Apartments This existing wastewater treatment facility (NJPDES Permit No. NJ0029041) serves the 100 apartment units of the Regency at Sussex Apartments located on Layton Road. The current an-nual average flow for this facility is 15,000 GPD and the future annual average flow is projected to be 80,000 GPD. The treated wastewater is discharged to Layton Brook. The treatment plant is owned and operated by L.F. Rush, Inc..
Wantage Township - High Point Regional High School This existing wastewater treatment facility (NJPDES Permit No. NJ0031585) serves 1,000students of the High Point Regional High School located on Pidgeon Hill Road. The cur-rent annual average flow for this facility is 10,000 GPD and the future annual average flow is projected to be 14,000 GPD. The treated wastewater is discharged to a tributary of Papakating Creek. The treatment plant is owned and operated by the High Point Regional High School/ Board of Education.
Wantage Township - Simmons Lake Water Company This proposed wastewater treatment facility would be designed to serve the Simmons Water Company located off Ruth Drive. Projected wastewater flow is not known at this time. The treatment plant will be owned and operated by the Simmons Water Company.
Wantage Township – Wantage Village
The proposed mixed-use development located at McCoy’s Corner would be served by a waste-water treatment facility with discharge to groundwater. The project (located on Block 116 Lot 10.01) would consist of 106 housing units, including age-restricted and affordable housing, and 12,000 sq. ft. commercial space.

erenzio & Panaro, P.C.
31
Wantage Township - Baldwin Well Drilling Company
This proposed wastewater treatment facility would be designed to serve the Baldwin Well Drill-ing Company located off Courtland Drive. The treated wastewater will be discharged to ground water. Projected wastewater flow is not known at this time. The treatment plant will be owned and operated by the Baldwin Well Drilling Company.
Wantage Township - Ames Rubber Corporation This existing facility (NJPDES No. NJ0085561) discharges approximately 49,000 GPD of treated effluent to the Wallkill River classified as FW2-NT. The facility is owned and operated by the Ames Rubber Corporation.
Wantage Township - Borough of Sussex Water Treatment Facility
This existing water treatment facility, located off Route 23, serves the Borough of Sussex for its water supply from Lake Rutherford. After the water is treated, the backwash residue produced is decanted and recycled. This facility is owned and operated by the Borough of Sussex.
Wantage Township – Clove Hill Manor This existing facility (NJPDES Permit No. NJ0137031) serves an age-restricted housing devel-opment on Route 23. The current average annual flow is 6,000 GPD and the permitted average annual flow is 19,800 GPD that would serve 117 housing units at full build-out. The treated wastewater is discharged to ground water, and the facility is owned and operated by the Sussex County Municipal Utilities Authority.
Wantage Township – Wantage Heights Facility
This proposed water reclamation facility would be designed to serve the wastewater needs of the “Wantage Heights” project located on State Route 23 and Cemetery Road (Block 11 Lots 6.02 and 7), which is being developed by Rachel Manor Properties, LLC. The mixed-use project of townhouses and condominiums will have 72 residential units (24 are age-restricted), retail store (10,350 sq. ft.), food market, gas station and a boarding home. The projected annual average flow for this facility is estimated at 19,945 GPD. The treated wastewater will be discharged to ground water. The owner and operator of the water reclamation facility are to be determined.
Wantage Township – Mountain View Manor Facility
This proposed wastewater treatment facility will serve the residential and commercial project located on Route 23 for 115 age-restricted residential units and commercial space. The projected wastewater flow will be 19,700 GPD and will be discharged to groundwater. The owner and op-erator of the facility are to be determined. The future sewer service area shown includes Block 4 Lot 1.01 and Lots 1.05 – 1.10.

erenzio & Panaro, P.C.
32

erenzio & Panaro, P.C.
33
VI. MAPPING PROVIDED Mapping in accordance with the requirement of the NJDEP are being provided on a CD and will also be available on the Sussex County website in a GIS mapping viewer. A full printed set of maps will be available in the County Planning office as well. The USGS maps were used as a base map for the data, at a scale of 1:12,000. For each Wastewater Plan Map #1 – 5, there are 11 sheets that cover the entire County.

erenzio & Panaro, P.C.
34
erenzio & Panaro, P.C.
35
APPENDIX A
TOTAL MAXIMUM DAILY LOAD (TMDLs)
FOR STREAM SEGMENTS AND LAKES
WITHIN SUSSEX COUNTY

erenzio & Panaro, P.C.
36
APPENDIX
TMDLS that Address Stream Segments and Lakes within Sussex County Percent reductions required in the 2003 and 2005 Fecal Coliform TMDLs on streams segments within Sussex County.
Table 1 Fecal Coliform TMDL Percent Reductions (NJDEP, 2003)
Load Allocation (LA) and Margin of Safety (MOS)
WM
A Water
Quality Stations Station Names
Sum
mer
N
Sum
mer
geo
met
ric
mea
n C
FU/1
00m
l
MO
S as
a p
erce
nt o
f the
targ
et c
on-
cent
ratio
n
Perc
ent r
educ
tion
with
out M
OS
Perc
ent r
educ
tion
with
MO
S
TMDL 1 01443370 Dry Brook at Rt. 519 near Branch-ville
5 652 48% 5% 95% 95%
1 01443440 Paulins Kill at Balesville 8 1537 53% 2% 98% 98%
1 01444970, 01445000
Pequest River at Rt. 206 Below Springdale, Peqest River at Hunts-ville
9 342 45% 9% 89% 89%
1 01443500, 01443600
Paulins Kill at Blairstown, Jackson-burg Creek near Blairstown
38 216 29% 9% 78% 78%
1 01456200 Musconetcong River at Beat-tystown
8 502 45% 6% 93% 93%
2 01367625, 01367700
Wallkill River at Sparta, Wallkill River at Franklin
21 362 48% 9% 90% 90%
2 01367715, 01367770
Wallkill River at Scott Rd at Frank-lin, Wallkill River near Sussex
34 596 36% 4% 93% 93%
2 01367780 Papakating Creek near Wykertown 10 483 46% 6% 92% 92%
2 01367800 Papakating Creek at Pelletown 14 1172 28% 2% 96% 96%
2 01367850 WB Papakating Creek at McCoys Corner
5 5054 60% 1% 99% 99%
2 01367860, 01367910
Papakating Creek near Sussex, Pa-pakating Creek at Sussex
13 2425 47% 1% 99% 99%
2 01368000 Wallkill River near Unionville 8 765 46% 4% 95% 95%
2 01368820 Double Kill at Waywayanda 19 70 46% 44% 47% 47%

erenzio & Panaro, P.C.
37
Load Allocation (LA) and Margin of Safety (MOS)
WM
A Water
Quality Stations Station Names
Sum
mer
N
Sum
mer
geo
met
ric
mea
n C
FU/1
00m
l
MO
S as
a p
erce
nt o
f the
targ
et c
on-
cent
ratio
n
Perc
ent r
educ
tion
with
out M
OS
Perc
ent r
educ
tion
with
MO
S
TMDL 2 01368950 Black Creek near Vernon 8 2137 54% 2% 99% 99%
9 01405340, 01405400
Manalapan Brook at Federal Rd. near Manalapan, Manalapan Brook near Spotswood
28 403 37% 83% 89% 89%
1 01443250 Paulins Kill at Warbasse Junction Rd near Lafayette
10 831 42% 92% 95% 95%
1 01455801 Musconetcong River at Lockwood 46 256 27% 73% 81% 81%
MOS as a percent of target is equal to: mlCFU
e100/200
or mlCFU
e100/68
where “e” is defined as the MOS in Section 7.2
Percent Reductions and Loadings required by the Total Phosphorus TMDLs for
Stream Segments in Sussex County (NJDEP, 2005) Wasteload allocations (WLA) and load allocations (LA) for sources within the drainage area of the impaired segments within Sussex County based on the 2004 and 2005 Total Phosphorus TMDL for the Northwest Water region are presented in Tables 2 – 4.
Papakating Creek Watershed: (NJDEP,2004)
The determination of required load reduction for the Papakating Creek watershed ex-cluding the Clove Acres Lake watershed was calculated, considering the load reduction that will occur from implementation of the Clove Acres Lake watershed TMDL.

erenzio & Panaro, P.C.
38
Table 2. Load allocation for the portion of Papakating watershed, excluding the Clove Acres Lakeshed
Papakating Excluding Clove Acres Lake Estimated kg TP/yr % of LC % reductionLoading capacity (LC) 5274.9 100% n/a Stormwater Point Sources Mixed density residential 7.4 0.1% 31% Medium / high density residential 164.5 3.1% 31%
Low density / rural residential 518.3 9.8% 31%
commercial 76.1 1.4% 31% industrial 11.1 0.2% 31%
Mixed urban / other urban 112.0 2.1% 31% Nonpoint sources
agricultural 3365.3 63.8% 31% forest, wetland, water 590.5 11.2% 0%
barren land 32.7 0.6% 0% air deposition onto lake surface - 0.0% 0%
High Point High School 45.2 0.8% 0% County Concrete Company 1.4 0.03% 0% Margin of Safety 350.5 6.6%
Black Creek Near Vernon Site #’s 01368950, 01367620, Wallkill H, Wallkill F, and Wall-kill G (NJDEP, 2005)
In the Black Creek watershed, the wasteload allocation for the Lounsberry Hollow Middle School and Legends Golf Discharge were calculated using full permitted flow and the final per-mit limit for phosphorus as it is identified in the existing NJPDES permit for each facility. The NJPDES permit for Lounsberry Hollow Middle School identifies the phosphorus limit to be 0.5 mg/l. The future allocation assigned to Lounsberry Hollow Middle School at the full permitted flow was calculated to be an annual load of 22.09 kg/yr of phosphorus. The permit for Leg-ends Resort and Country Club (NJ0023949) allows for a permitted flow of 0.35 MGD, with a final phosphorus concentration of 0.211 mg/l, effective in June 2008. The future allocation for this facility at the TP permit limit of 0.211 mg/l and the permitted flow of 0.35 MGD is 42.18 kg/yr. No additional phosphorus reductions are directed as a result of WLAs

erenzio & Panaro, P.C.
39
Table 3 TMDL calculations for the Black Creek Watershed (Black Creek at Vernon) Current Load Load Capacity
kg TP/yr (lbs/yr) kg TP/yr (lbs/yr) % of LC
Load distribution Load allocation
% reduc-tion
Point Sources other than Stormwater*
Lounsberry Hollow MS 4.85 (10.67) 22.09 (48.59) 1.2 0
Legends Golf Discharge 7.71 (16.96) 42.18 (92.79) 2.3 0
Nonpoint and Stormwater Sources
medium / high density residential 459.5 (1010) 229.45 (504.79) 12.8 50
low density / rural residential 419.4 (922.7) 209.44 (460.76) 11.7 50
Commercial 199.4 (438.7) 99.58 (219.07) 5.5 50
Industrial 26.80 (58.96) 13.38 (29.43) .7 50
mixed urban / other urban 393.1 (864.9) 196.31 (431.88) 10.9 50
Agricultural 851 (1872) 425.48 (934.89) 23.7 50
forest, wetland, water 472.0 (1038) 472.0 (1038.4) 26.3 0
barren land 22.1 (48.7) 22.1 (48.7) 1.2 0
Margin of Safety n/a 74.5 (163.9) 4.2 n/a
Total: 2856 (6283) 1807 (3975) 100 37.2
* Notes: (1) From the NJPDES Permit NJ0023949, Legends Resort and Country Club, the current effluent limit for phosphorus is 1.0 mg/l. After 4/1/2008 the monthly average concentration will be 0.211 mg/l. (2) Discharge from Legends Resort and Country Club (NJ0023949) to the Black Creek is allowed from November through March.
New Jersey part of Wawayanda/Pochuck River Watershed Site # 01368900 (NJDEP,2005)
In the Wawayanda Creek watershed, the load allocations and associated percent reductions for the New Jersey portion of the watershed are shown in the tables below. For the New York por-tion of the watershed, the load is given as a loading capacity on an annual basis (kg TP/yr). The assignment of load reductions to point and nonpoint sources, as well as any further refinements to the load estimates from New York, will be undertaken by the State of New York in the future. However, regardless of the allocation of load within New York, New York is ultimately respon-sible for assuring that the New Jersey SWQS criteria of 0.1 mg/l of total phosphorus is met at the state boundary.

erenzio & Panaro, P.C.
40
Table 4 TMDL calculations for the New Jersey part of Wawayanda/Pochuck River Water-shed Site # 01368900
Current Load * Loading capacity
kg TP/yr ** % re-duction kg TP/yr % of LC
Total Loadings 9,757 (21465.4) 47 5,170.3 (11374.66)
na
Load from New York State 7,873 (17320.6) **** 3,898.6 (8576.92)
na
Nonpoint and Stormwater Sources from New Jersey part of watershed
High density residential *** 148.7 (327.14) 71 43.4 (95.48) 3.4
Low density / rural residen-tial***
371.5 (817.3) 71 108.4 (238.48)
8.5
Commer-cial/industrial/transportation***
126.1 (277.42) 71 36.8 (80.96) 2.9
Deciduous Forest*** 158 (347.6) 0 158 (347.6) 12.4
Emergent herbaceous wet-lands***
4 (8.8) 0 4 (8.8) 0.3
Evergreen forest*** 62 (136.4) 0 62 (136.4) 4.9
Mixed forest*** 321 (706.2) 0 321 (706.2) 25.3
Open water*** 50 (110) 0 50 (110) 3.9
Pasture/hey*** 484.1 (1065.02) 71 141.3 (310.86)
11.1
Row crops*** 113.3 (249.26) 71 33.1 (72.82) 2.6
mixed urban / other urban*** 14.3 31.46) 71 4.2 (9.24) 0.3
Woody wetlands*** 30 (66) 0 30 (66) 2.4
barren land*** 0.3 (.66) 0 0.3 (.66) 0.0
Margin of Safety*** na na 279 (613.8) 22
TOTAL 1,883 (4142.6) 32.5 1271.7 (2797.74)
100
Notes: * Current Loadings were calculated using Unit Aerial Loadings (UAL), see Table 9. ** Percent reductions shown for individual sources are necessary to achieve overall reductions calculated from FIRE method. *** Loadings associated with each land use are for a New Jersey part of the watershed excluding loadings from the New York state part of the watershed). ****Load allocated to NY is the allocable load less the New Jersey reductions based on FIRE and applied to unit area loadings

erenzio & Panaro, P.C.
41
Additional Measures Each impaired watershed was assessed for the applicability of a mandatory low phosphorous fer-tilizer ordinance to aid in the reduction of phosphorus loading from nonpoint sources.
In the Black Creek and Wawayanda Creek Watersheds, it was determined that the low phospho-rus fertilizer ordinance was required.
Therefore, all municipalities with contributory drainage area into the impaired stream segments of the Black Creek and Wawayanda Creek will be required to adopt an ordinance as an addi-tional measure that prohibits the outdoor application of fertilizer other than low phosphorus fer-tilizer, consistent with a model ordinance provided by the Department. Fertilizer does not in-clude animal or vegetable manure or compost. This model ordinance has been posted on www.njstormwater.org (NJDEP, 2005)
Municipal Stormwater Permits and Identification of Tier A or B Classification for the Black Creek and Wawayanda impaired streamsheds
NJPDES Permit Number Municipality Discharge Type Additional Measures
NJG0149691 Vernon Twp Tier B - Municipal Stormwater General
Permit
Low phosphorus ordinance
NJG0152269 Hardyston Twp Tier B - Municipal Stormwater General
Permit
Low phosphorus ordinance
NJG0148806 West Milford Twp Tier A - Municipal Stormwater General
Permit
Low phosphorus ordinance
TMDL to Address Arsenic in the Wallkill River and Papakating Creek (NJDEP, 2004) The TMDLs will be expressed in terms of the loading capacity of the stream segments at
a 75 percent duration design flow (i.e., flow which is exceeded 75 percent of the time) as
specified in section N.J.A.C. 7:9B-1.5(c)2. The existing loading was calculated using the
average of available concentration data for each impaired segment, multiplied by the 75
percent flow duration for that segment. An average concentration was used in accordance with N.J.A.C. 7:9B-1.14(c)13. The loading capacity was determined by multiplying the 75 percent flow duration for each segment by the SWQS of 0.017 µg/l.
The loading values are depicted in Figure 8. The available data suggest that all of the
load is contributed by nonpoint sources. Therefore, the WLA for arsenic is zero. It is
not possible at this point to differentiate the existing or future loads between types of
nonpoint sources. This differentiation will be the outcome of the in-depth study of
arsenic sources which is currently underway. (NJDEP, 2005)

erenzio & Panaro, P.C.
42
Wasteload and Load reductions with a 5 percent margin of safety.
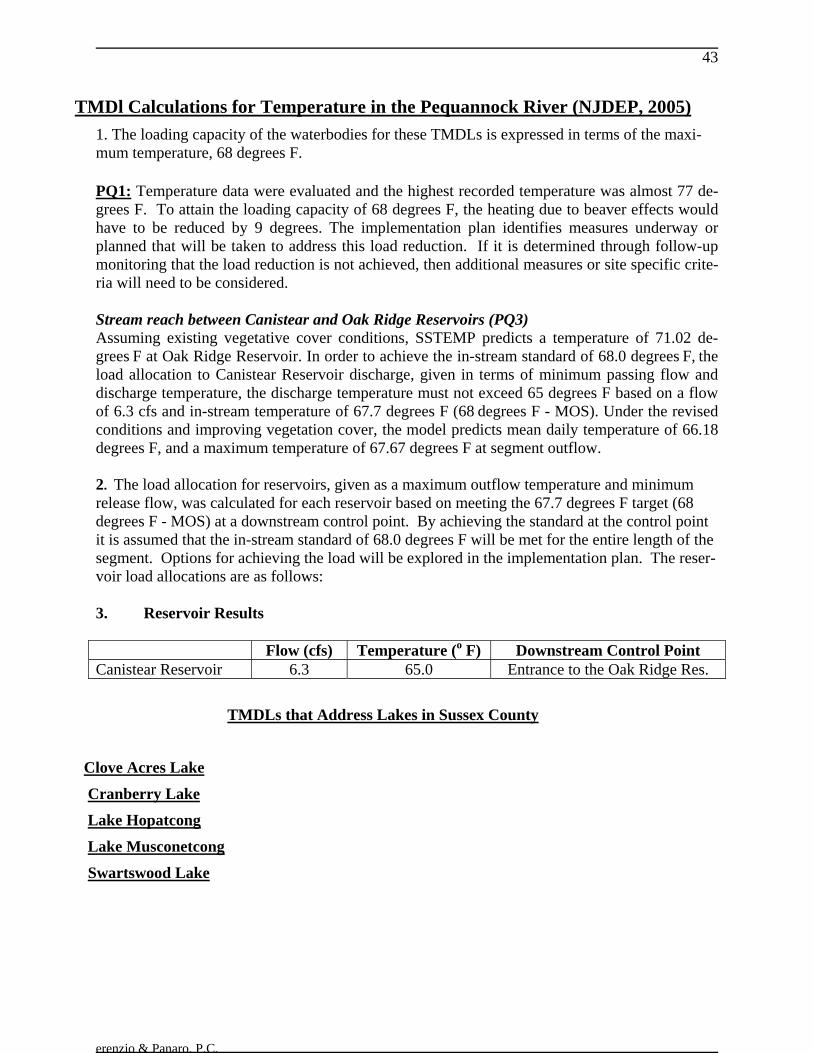
erenzio & Panaro, P.C.
43
TMDl Calculations for Temperature in the Pequannock River (NJDEP, 2005) 1. The loading capacity of the waterbodies for these TMDLs is expressed in terms of the maxi-mum temperature, 68 degrees F. PQ1: Temperature data were evaluated and the highest recorded temperature was almost 77 de-grees F. To attain the loading capacity of 68 degrees F, the heating due to beaver effects would have to be reduced by 9 degrees. The implementation plan identifies measures underway or planned that will be taken to address this load reduction. If it is determined through follow-up monitoring that the load reduction is not achieved, then additional measures or site specific crite-ria will need to be considered. Stream reach between Canistear and Oak Ridge Reservoirs (PQ3) Assuming existing vegetative cover conditions, SSTEMP predicts a temperature of 71.02 de-grees F at Oak Ridge Reservoir. In order to achieve the in-stream standard of 68.0 degrees F, the load allocation to Canistear Reservoir discharge, given in terms of minimum passing flow and discharge temperature, the discharge temperature must not exceed 65 degrees F based on a flow of 6.3 cfs and in-stream temperature of 67.7 degrees F (68 degrees F - MOS). Under the revised conditions and improving vegetation cover, the model predicts mean daily temperature of 66.18 degrees F, and a maximum temperature of 67.67 degrees F at segment outflow. 2. The load allocation for reservoirs, given as a maximum outflow temperature and minimum release flow, was calculated for each reservoir based on meeting the 67.7 degrees F target (68 degrees F - MOS) at a downstream control point. By achieving the standard at the control point it is assumed that the in-stream standard of 68.0 degrees F will be met for the entire length of the segment. Options for achieving the load will be explored in the implementation plan. The reser-voir load allocations are as follows: 3. Reservoir Results Flow (cfs) Temperature (o F) Downstream Control Point Canistear Reservoir 6.3 65.0 Entrance to the Oak Ridge Res.
TMDLs that Address Lakes in Sussex County
Clove Acres Lake
Cranberry Lake
Lake Hopatcong
Lake Musconetcong
Swartswood Lake
erenzio & Panaro, P.C.
44
References Total Maximum Daily Loads for Fecal Coliform to Address 28 Streams in the Northwest Water Region, NJDEP 2003 Total Maximum Daily Load to Address Arsenic in the Wallkill River and Papakating Creek Northwest Water Region, NJDEP, 2004. Total Maximum Daily Load to Address Temperature in the Pequannock River Northeast Water Region, NJDEP, 2004. Total Maximum Daily Load to Address Phosphorus in the Clove Acres Lake and Papakating Creek Northwest Water Region, NJDEP 2004. Total Maximum Daily Loads for Phosphorus to Address Seven (7) Stream Segments in the Northwest Water Region, NJDEP 2005.

erenzio & Panaro, P.C.
45
APPENDIX B
POPULATION TRENDS
IN SUSSEX COUNTY

erenzio & Panaro, P.C.
46
POPULATION ELEMENT
This appendix provides an analysis of the history and trends of population change in the County. This, together with build-out calculations, is essential to understanding wastewater treatment re-quirements now and for the future. These have not been revised to consider the impact of the Highlands Water Protection and Planning Act. As the Regional Master Plan is not complete and the draft must undergo substantial revision, its impact, while substantial, is not part of this ap-pendix. Both Highlands and County staff have agreed to revisit this portion of the plan and build-out calculations once the RMP has been adopted and submitted to the State Planning Commission for Plan Endorsement. Population Trends and Projections for Sussex County Analysis of the population trends of Sussex County and its municipalities will show where growth has occurred, and also relate Sussex County to its neighboring counties, including those in New York and Pennsylvania. Age, race, income, and other demographic characteristics are described, and population densities show the development patterns that have occurred. Then, us-ing past trends and local planned growth, population projections are provided for Sussex County and its municipalities to the years 2010 and 2020. Growth Trends: From the early 1800s, the population of Sussex County was fairly stable for a century; there was an increase of only 7,500 from 1830 to 1930, to a population of 27,850 in 1930. Since 1950, the population has increased more rapidly, as shown in Figure 2. The growth rate was highest from 1960 to 1970 at 57.4% and the greatest increase in number occurred from 1970 to 1980 with 38,537 new residents. For each decade since 1980, the population increased about 14,000, to 144,166 in 2000. According to a national study that compared growth rates among counties, Sussex County is a “Metropolitan Growth County”, one of 124 counties in the U.S. that experienced growth rates of at least 10% each decade since 1950. These growth counties have developed at low densities of single-family homes and consequently have longer commutes, they are a typical “bedroom community”. Comparison of Counties: The following chart shows the population growth from 1990 - 2000 that occurred in northwestern counties of New Jersey, Monroe and Pike County, PA, and Orange County, NY. All of the counties experienced above-average growth, compared to 7.7% growth rate for New Jersey from 1990 to 2000.
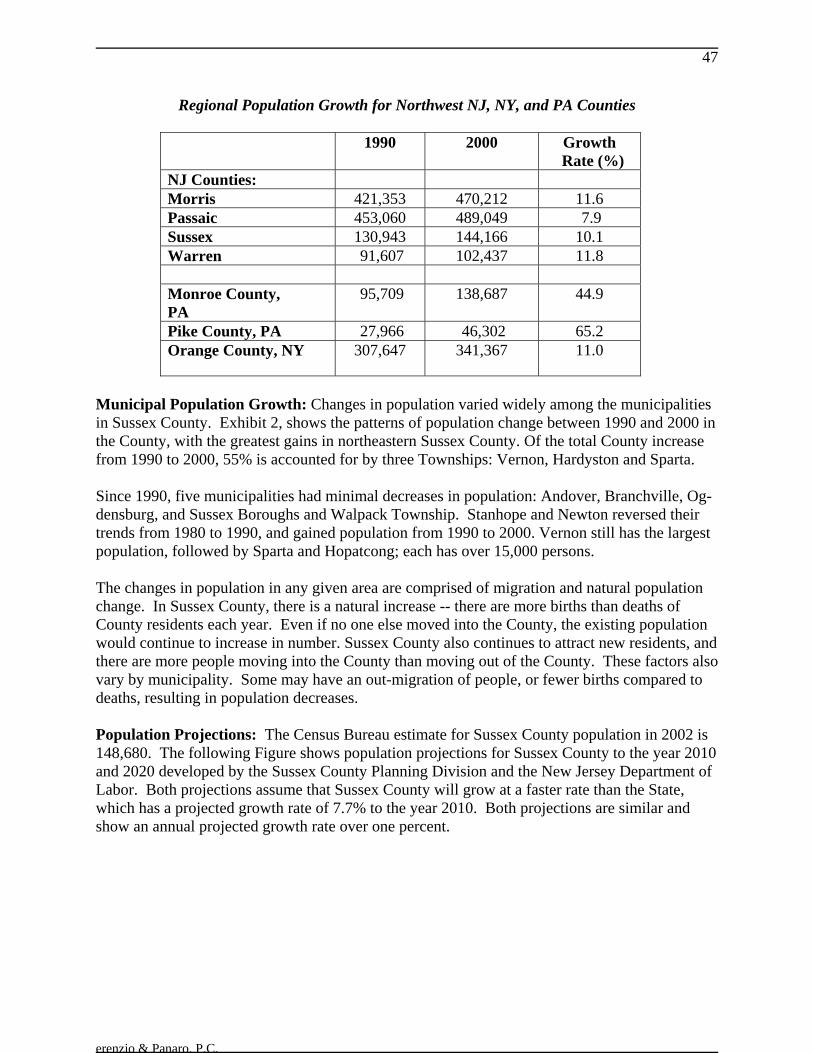
erenzio & Panaro, P.C.
47
Regional Population Growth for Northwest NJ, NY, and PA Counties
1990 2000 Growth Rate (%)
NJ Counties: Morris 421,353 470,212 11.6 Passaic 453,060 489,049 7.9 Sussex 130,943 144,166 10.1 Warren 91,607 102,437 11.8 Monroe County, PA
95,709 138,687 44.9
Pike County, PA 27,966 46,302 65.2 Orange County, NY 307,647 341,367 11.0
Municipal Population Growth: Changes in population varied widely among the municipalities in Sussex County. Exhibit 2, shows the patterns of population change between 1990 and 2000 in the County, with the greatest gains in northeastern Sussex County. Of the total County increase from 1990 to 2000, 55% is accounted for by three Townships: Vernon, Hardyston and Sparta. Since 1990, five municipalities had minimal decreases in population: Andover, Branchville, Og-densburg, and Sussex Boroughs and Walpack Township. Stanhope and Newton reversed their trends from 1980 to 1990, and gained population from 1990 to 2000. Vernon still has the largest population, followed by Sparta and Hopatcong; each has over 15,000 persons. The changes in population in any given area are comprised of migration and natural population change. In Sussex County, there is a natural increase -- there are more births than deaths of County residents each year. Even if no one else moved into the County, the existing population would continue to increase in number. Sussex County also continues to attract new residents, and there are more people moving into the County than moving out of the County. These factors also vary by municipality. Some may have an out-migration of people, or fewer births compared to deaths, resulting in population decreases. Population Projections: The Census Bureau estimate for Sussex County population in 2002 is 148,680. The following Figure shows population projections for Sussex County to the year 2010 and 2020 developed by the Sussex County Planning Division and the New Jersey Department of Labor. Both projections assume that Sussex County will grow at a faster rate than the State, which has a projected growth rate of 7.7% to the year 2010. Both projections are similar and show an annual projected growth rate over one percent.

erenzio & Panaro, P.C.
48
Comparison of Population Projections for 2010 and 2020
AGENCY
Projected Increase
2000 – 2010
2010 Projection
Projected Increase
2010 - 2020
2020 Projection
Sussex County Planning Division
+17,715
161,881
+16,754
178,635
NJ Dept. of Labor
+13,934
158,100
+18,600
176,700
Municipal projections (Figure 7) were prepared for Years 2010 and 2020 by Sussex County Planning Division using building permit data, past population trends, and planned development, based on site plan and subdivision applications. It was also assumed that future growth would increase in centers and approved sewer service areas, and that commuter train service would be restored to the Erie-Lackawanna line in the southern part of the County. By Year 2020, some municipalities (such as Branchville, Newton and Sussex Borough) are approaching their maxi-mum build-out, based on remaining available land. Population Density: Although the population density has increased to 277 persons per square mile in Year 2000, Sussex County remains a sparsely populated area. Population density in New Jersey is 1,134 persons/square mile, making it the most densely populated state in the U.S. The older areas that were built up 40 - 50 years ago with town centers (such as Sussex, Newton and Hamburg) remain the most densely populated. Rural and Urban Population: The definitions of rural and urban areas come from the U.S. Census Bureau, and depend upon the population size and density of an area. The County ranks 18th of 21 counties in New Jersey in its percentage of urban population, with 60% of the popula-tion defined as living in urban areas. Sussex County contains two types of “urban areas”, where population densities range from 500 – 1,000 persons per square mile or higher:
• Urbanized area: Contiguous municipalities in the southeastern part of Sussex County, including most of Hopatcong, Stanhope, Byram, Sparta, Andover Township and Newton. In Sussex County, there are 50,208 residents in urbanized areas.
• Urban Clusters: Other isolated areas are classified as "urban clusters" due to their den-
sity, though they are not part of a larger urbanized area: most of Franklin, Hamburg, Og-densburg, Vernon, and parts of Sparta and Hardyston. There are 36,830 residents in ur-ban clusters. The rest of the County is considered as "rural". There is a continuum which runs between urban and rural. Somewhere between these two lies suburban development, characterized by the service inefficiencies of rural development with none of the advan-tages of urban concentration.

erenzio & Panaro, P.C.
49
Population, Housing Units and Density: 2000
Area in square miles Density per square mile of land area
Geographic area Population Housing
units Total area
Water area
Land area Population
Housing units
Andover Borough 658 273 1.47 0.01 1.46 451.90 187.50 Andover Township 6,033 1,968 20.75 0.57 20.18 298.90 97.50 Branchville 845 377 0.59 0.00 0.59 1,421.60 634.30 Byram 8,254 3,078 22.18 1.11 21.07 391.80 146.10 Crandon Lakes CDP 1,180 492 2.67 0.13 2.53 466.10 194.40 Frankford 5,420 2,295 35.43 1.31 34.11 158.90 67.30 Franklin 5,160 1,997 4.55 0.06 4.49 1,150.20 445.10 Fredon 2,860 1,019 17.94 0.19 17.76 161.10 57.40 Green 3,220 1,069 16.31 0.13 16.18 199.00 66.10 Hamburg 3,105 1,233 1.16 0.01 1.16 2,686.60 1,066.90 Hampton 4,943 2,026 25.31 0.69 24.62 200.70 82.30 Hardyston 6,171 2,690 32.64 0.55 32.09 192.30 83.80 Highland Lake CDP 5,051 2,283 6.07 1.03 5.04 1,001.80 452.80 Hopatcong 15,888 6,190 12.34 1.38 10.96 1,449.70 564.80 Lafayette 2,300 799 18.06 0.03 18.02 127.60 44.30 Lake Mohawk CDP 9,755 3,940 6.15 1.15 5.00 1,951.20 788.10 Montague 3,412 1,588 45.34 1.33 44.01 77.50 36.10 Newton 8,244 3,425 3.10 0.01 3.10 2,661.70 1,105.80 Ogdensburg 2,638 903 2.30 0.02 2.28 1,154.70 395.30 Sandyston 1,825 907 43.31 0.70 42.61 42.80 21.30 Sparta 18,080 6,590 39.22 1.83 37.39 483.50 176.20 Stanhope 3,584 1,419 2.21 0.34 1.87 1,913.60 757.70 Stillwater 4,267 2,030 28.37 1.26 27.12 157.30 74.90 Sussex 2,145 961 0.62 0.02 0.60 3,597.90 1,611.90 Vernon 24,686 9,994 70.54 2.14 68.39 360.90 146.10 Vernon Valley CDP 1,737 560 2.68 0.04 2.64 657.20 211.90 Walpack 41 34 24.72 0.65 24.07 1.70 1.40 Wantage 10,387 3,663 67.54 0.42 67.12 154.80 54.60
Note: CDP is Census Designated Place Source: U.S. Census 2000

erenzio & Panaro, P.C.
50
MUNICIPAL POPULATION, 1990 - 2002 MUNICIPALITY
1990
CENSUS
2000
CENSUS
CHANGE 1990-2000
2002 CENSUS
ESTIMATE ANDOVER BOROUGH
712
658
- 54
660
ANDOVER TOWNSHIP
5,424
6,033
+609
6,317
BRANCHVILLE BOROUGH
851
845
- 6
845
BYRAM TOWNSHIP
8,109
8,321*
+212
8,425
FRANKFORD TOWNSHIP
5,114
5,420
+306
5,549
FRANKLIN BOROUGH
4,977
5,160
+183
5,207
FREDON TOWNSHIP
2,763
2,860
+ 97
2,999
GREEN TOWNSHIP
2,709
3,220
+511
3,385
HAMBURG BOROUGH
2,566
3,105
+539
3,386
HAMPTON TOWNSHIP
4,438
4,943
+505
5,057
HARDYSTON TOWNSHIP
5,275
6,171
+896
7,124
HOPATCONG BOROUGH
15,586
15,888
+302
15,980
LAFAYETTE TOWNSHIP
1,902
2,300
+398
2,378
MONTAGUE TOWNSHIP
2,832
3,412
+580
3,494
NEWTON, TOWN OF
7,521
8,244
+723
8,338
OGDENSBURG BOROUGH
2,722
2,638
- 84
2,641
SANDYSTON TOWNSHIP
1,732
1,825
+ 93
1,856
SPARTA TOWNSHIP
15,098
18,013*
+2,915
18,766
STANHOPE BOROUGH
3,398
3,584
+186
3,626
STILLWATER TOWNSHIP
4,253
4,267
+ 14
4,359
SUSSEX BOROUGH
2,201
2,145
- 56
2,158
VERNON TOWNSHIP
21,211
24,686
+3,475
25,236
WALPACK TOWNSHIP
67
41
- 26
41
WANTAGE TOWNSHIP
9,487
10,387
+ 900
10,853
SUSSEX COUNTY
130,943
144,166
+13,223
148,680
* Revised population, 2000 Census Compiled by Sussex County Planning Division, Newton, NJ

erenzio & Panaro, P.C.
51
MUNICIPAL POPULATION PROJECTIONS SUSSEX COUNTY, 2000 - 2020
MUNICIPALITY
2000 CENSUS
PROJECTED POPULATION 2010
PROJECTED CHANGE 2000-2010
PROJECTED POPULATION 2020
PROJECTED CHANGE 2010-2020
ANDOVER BOROUGH
658
910
+252
1,760
+850
ANDOVER TOWNSHIP
6,033 7,217 +1,184 8,200 +983
BRANCHVILLE BORO.
845 900 + 55 960 +60
BYRAM TOWNSHIP
8,321 8,975 +654 9,600 +625
FRANKFORD TOWNSHIP
5,420 6,000 +580 6,900 +900
FRANKLIN BOROUGH
5,160 5,607 +447 6,400 +793
FREDON TOWNSHIP
2,860 3,149 +289 3,500 +351
GREEN TOWNSHIP
3,220 3,620 +400 4,000 +380
HAMBURG BOROUGH
3,105 3,555 +450 3,850 +295
HAMPTON TOWNSHIP
4,943 5,507 +564 6,000 +493
HARDYSTON TOWNSHIP
6,171 7,900 +1,729 10,100 +2,200
HOPATCONG BOROUGH
15,888 16,355 +467 16,800 +445
LAFAYETTE TOWNSHIP
2,300 2,754 +454 3,200 +446
MONTAGUE TOWNSHIP
3,412 3,992 +580 4,800 +808
NEWTON, TOWN OF
8,244 8,838 +594 9,400 +562
OGDENSBURG BORO.
2,638 2,791 +153 3,000 +209
SANDYSTON TOWNSHIP
1,825 1,956 +131 2,100 +144
SPARTA TOWNSHIP
18,013 20,913 +2,900 23,000 +2,087
STANHOPE BOROUGH
3,584 3,976 +392 4,250 +274
STILLWATER TWP.
4,267 4,309 +42 4,400 +91
SUSSEX BOROUGH
2,145 2,358 +213 2,500 +142
VERNON TOWNSHIP
24,686 28,686 +4,000 31,400 +2,714
WALPACK TOWNSHIP
41 26 -15 15 -11
WANTAGE TOWNSHIP
10,387 11,587 +1,200 12,500 +913
SUSSEX COUNTY
144,166 161,881 +17,715 178,635 +16,754
Population projections by Sussex County Planning Division, Newton, NJ Prepared January 2004.

erenzio & Panaro, P.C.
52
Demographic Profile of Sussex County For Sussex County compared to New Jersey as a whole, there are some interesting differences in population characteristics, as shown in the following comparative Figure:
DEMOGRAPHIC PROFILES AND COMPARISON, 2000 CENSUS
Characteristics SUSSEX COUNTY NEW JERSEY Age: Median Age (years) 37.1 36.7 Persons under age 18 27.9% 24.8% Persons over 65 9.1% 13.2% Race/ Ethnicity: White Persons 95.7% 72.6% Hispanic Ethnicity 3.3% 13.3% Black 1.0% 13.6% Asian 1.2% 5.7% Education: High school graduates (% age 25 or older)
89.8% 82.1%
Bachelors degree Or higher
27.2% 29.8%
Income: Median household income, 1999
$65,266 $55,146
Persons Below Poverty Level, 1999
4.0% 8.5%

erenzio & Panaro, P.C.
53
APPENDIX C
NATURAL RESOURCES INVENTORY

erenzio & Panaro, P.C.
54
NATURAL RESOURCES INVENTORY Introduction By virtue of a request from the New Jersey Department of Environmental Protection for informa-tion to support the successful Sussex County application for Plan Endorsement, the natural re-source studies undertaken by the County as part of the Strategic Growth Plan and the Open Space and Recreation Plan have been separately constituted as a Natural Resources Inventory. This document provides a stand-alone discussion of natural resource issues that affect develop-ment, conservation, and the economic vitality of Sussex County. This document also serves as an essential link in the wastewater planning process. Resource availability and capacity are criti-cal to the implementation of the Sussex County Planning program. One of the principal concerns underlying the Sussex County planning program is our ability to define and quantify the resources at hand. These resources include our natural resources, exist-ing development, population, economic systems and the like. This report is prepared to consider the natural resources available to the County and its’ constituent municipalities and the ability of those resources to sustain development and redevelopment. As this is a combination of data presented in adopted County publications, individual portions of the relevant reports are presented below. Note that the format has been changed for consistency and readability and citations are omitted – please refer to the original documents. Location Sussex County is located in northwestern New Jersey. The county is bordered to the west by the Delaware River and Pennsylvania; to the north by Orange County, New York; to the east and southeast by Passaic and Morris Counties, respectively; and to the southwest by Warren County. Sussex County is approximately 336,000 acres, or 525 square miles, in area. The County gener-ally takes the shape of a north-south rectangle tilted 45 degrees to the east. Sussex County’s topography is among the most diverse in the state. As Map 1: Physiographic Provinces & Ridgelines in Sussex County shows, the eastern one-third of the county lies in the Highlands physiographic province. The Highlands runs in a northeast belt from Reading, Penn-sylvania, across New Jersey and into southern New York and western Connecticut. The region is characterized by forested ridges and glacially sculpted valleys that provide habitat for more than 240 species of wildlife. The region also contains significant water resources affecting over 11 million residents, approximately 4 million of whom reside in New Jersey. Ten of the twenty-four municipalities Sussex County fall within the Highlands. The remainder of the County falls within the Ridge and Valley physiographic province. This region is characterized by parallel northeast-southwest trending ridges with fertile valleys in be-tween. The Ridge and Valley area of New Jersey is geologically similar to the Appalachian prov-inces of western Virginia, Maryland and Pennsylvania. The capstone of the Ridge and Valley in

erenzio & Panaro, P.C.
55
Sussex County is the Kittatinny Ridge. The

erenzio & Panaro, P.C.
56
Kittatinny Ridge runs approximately 40 miles through the county, hugging its western margin. The ridge has elevations generally between 1,200 and 1,500 feet above sea level, and an average width of five miles. At High Point, which is the northernmost extent of the Kittatinny Ridge in Sussex County, the elevation tops out at 1,803 feet, the highest point in New Jersey. The lowest points in Sussex County are along the Delaware River at the mouth of the Flat Brook (300 feet), and along the Wallkill River at the New York State line (380 feet). The Kittatinny Valley, located between the Highlands and the Kittatinny Ridge, has elevations gener-ally between 600 and 700 feet. It is in this area that the county’s agricultural economy is primar-ily based. Geology The Highlands The Highlands is part of the larger New England Upland, which includes the Green Mountains of Vermont and the Berkshires of western Massachusetts. The Highlands cuts across parts of Hunterdon, Warren, Sussex, Somerset, Morris, Passaic and Bergen Counties, and is comprised of northeast-trending ridges that rise generally 300 to 500 feet above the parallel river valleys.

erenzio & Panaro, P.C.
57
Bedrock Geology Highlands bedrock is comprised predominantly of granite, gneiss and, to a lesser extent, marble (See Map 2: Geology in Sussex County). The rocks date to the Precambrian, and are the oldest in New Jersey. They formed between 1.3 billion and 750 million years ago. These igneous rocks were formed through the intense heat, compression and deformation of the preexisting rock. This process was the earliest event in the formation of the Appalachian Mountains. Within the general assemblage of Precambrian rock, there are several northeast-running belts of Paleozoic rocks, including sandstone, shale and limestone. The origin of these sedimentary rocks, which are much younger than the surrounding rock, can be traced to a series of gravel, sand and silt outwashes from nearby mountains, as well as from the calcareous sediments of ma-rine animals deposited in inland seas created when the continent broke apart. These depositions occurred between 550 million and 350 million years ago, and completely covered the older Pre-cambrian rock. Three mountain-building episodes, occurring about 1,000, 450, and 300 million years ago, shaped the current Highlands bedrock geology. Intense pressure folded the Highlands region and thrust the area westward on a series of faults. The first episode lifted the landscape to elevations near those of the present-day Rocky Mountains. This action also trapped the sedimentary Paleo-zoic rocks between faulted blocks of Precambrian rock. This assemblage of northeast-southwest running belts of Paleozoic rock within the larger Precambrian rock is the modern structure of the Highlands. Surficial Geology Erosion of the Highlands province began in earnest in the Mesozoic, around 190 million years ago. However, it was not until 10 million years ago, in the Miocene, that the Highlands’ current form began to take shape. Originally, drainage patterns in the Highlands were to the southeast, but from 10 million years ago until 2 million years ago, the pattern shifted gradually to the southwest, as streams and other forces eroded channels in the belts of weak sedimentary rocks. Once streams were entrenched in the southwest-trending valleys, stream erosion continued to deepen the valleys. The Precambrian rock, being more resistant to erosion, eventually formed the ridges. Rivers, such as the Musconetcong and the South Branch of the Raritan River and the Black River outside of Sussex County but within the Highlands region, exemplify this southwest pattern through broad river valleys. The Wallkill River and its valley also conform to this pattern, al-though it flows northeast rather than southwest. Ridge and Valley The Ridge and Valley physiographic province occupies a small portion of New Jersey. The east-ern boundary of the Ridge and Valley extends northeasterly from the Delaware River north of

erenzio & Panaro, P.C.
58
Phillipsburg, to the New York State line approximately where the Wallkill River enters New York State. The Ridge and Valley province, so named for its topographic features of long parallel ridges and wide fertile valleys, extends southwestward into Pennsylvania where the Kittatinny Ridge continues nearly to Harrisburg. The Kittatinny Ridge becomes Blue Mountain in Pennsylvania, and the Blue Ridge further south in Maryland and Virginia. The Ridge and Valley province also extends northeastward into New York State, where the Kittatinny Ridge becomes Shawangunk Mountain. The Ridge and Valley province in total extends from northeastern Alabama through Virginia, Pennsylvania, New Jersey, and north through the Hudson, Champlain and Saint Lawrence Valleys. Bedrock Geology The land of New Jersey was originally part of a larger continent that broke up in Precambrian and Mesozoic time. As this occurred, ocean water infiltrated the rifts, depositing sand, silt and carbonate sediments. Because of this, the underlying rock of the Ridge and Valley is sedimen-tary. It consists primarily of sandstone, shale and limestone deposited between 550 and 350 mil-lion years ago (see Map 2). The rocks were flat-lying, until pressure from the southeast compressed them in a series of folds during the three major episodes of mountain-building. The most recent episode took place roughly 300 million years ago. Volcanic activity accompanied mountain building in Sussex County. Evidence of this activity can be found southwest of Colesville in Wantage Township, where the neck of an old volcano remains. The neck is the part of the volcano through which lava rises to the surface. Once the mountains were formed, erosion, weathering and glaciation shaped the landscape today. Surficial Geology As with the Highlands, the different rocks that comprise the Ridge and Valley have various de-grees of resistance to weathering. The most resistant is conglomerate and sandstone, which not coincidentally underlies the Kittatinny Ridge and Walpack Ridge. The weaker rocks are shale and limestone, and these underlie the upper Delaware Valley and the Kittatinny Valley. Within the Kittatinny Valley, there are two different elevation levels that correspond to the un-derlying material. Those parts of the Valley that are underlain by shale are several hundred feet higher than those underlain by limestone. Limestone areas in the Kittatinny Valley are the most erosion-prone rocks in the county. Because of their susceptibility to erosion, and their slight solubility in water, limestone areas in Sussex harbor great biological diversity and contain sig-nificant natural value. The Kittatinny Valley Limestone areas are among the most productive bedrock aquifers in the county.

erenzio & Panaro, P.C.
59
Water and Wind Gaps For its entire 35-mile length in New Jersey, the Kittatinny Ridge is remarkably consistent. It is substantially broken only once over that length, at Culvers Gap. The other major gap in New Jer-sey is the Delaware Water Gap, located in Warren County at the New Jersey-Pennsylvania bor-der. The Delaware Water Gap, which is a textbook example of a water gap, was formed when the Kittatinny Ridge rose around the preexisting river. The river’s power to cut through the emerging mountain was greater than the mountain’s rise, and the Delaware maintained its course through the ridge. Culvers Gap was formed the same way as the Delaware Water Gap, most likely by a branch of the Paulins Kill cutting through the emerging Kittatinny Ridge. Over time the stream flowing through the gap was diverted, or captured, by the Flat Brook system, which flows on the west side of the Kittatinny Ridge and was eroding its headwall more quickly than the stream flowing through Culvers Gap. This had the effect of redirecting the stream into the Flat Brook, thus leav-ing Culvers Gap dry. Scenarios like this are quite common throughout the Appalachian Moun-tains. Wind gaps are formed wherever larger rivers erode their basins more quickly and capture the streamflow of smaller waterways by literally breaking through to a different drainage basin. Glaciation In addition to stream erosion, glaciers have given shape to the current landscape. Over the past 1.5 million years three distinct periods of glaciation have occurred in northern New Jersey, all of which have covered Sussex County’s entire land area. The first two glacial episodes, called the pre-Illinoian and Illinoian, occurred more than 800,000 years ago and about 150,000 years ago, respectively. Little is known about these periods. The most recent glaciation was the Wisconsinan, occurring about 20,000 years ago. This episode has left the most profound mark on the Highlands and Ridge and Valley landscape. Ice in the Wisconsinan glacier is believed to have been almost 3,000 feet thick. The glacier flowed over northern New Jersey, scouring away pre-glacial soil from Wawayanda and Hamburg Mountains and the Kittatinny Ridge, exposing bedrock outcroppings. The Wisconsinan glacier also further defined pre-existing stream valleys by plucking out weaker rocks on the sides of the ridges and broadening the flood plains. Throughout Sussex County many glacial features can be observed, indicating the extent to which glaciers have shaped the present landscape. Besides the craggy ridgetops previously mentioned, glaciers have created many features including drumlins, moraines and glacial lakes. Drumlins are tear-drop shaped mounds of till that indicate the direction in which glaciers flowed over the land. These are found throughout Kittatinny Valley and on Kittatinny Mountain in areas of thick till. Moraines are mounds of till and other debris deposited at the end and sides of glaciers, as well as at points along the glaciers recession. There are two major recessional moraines in Sussex County: the Ogdensburg-Culvers Gap-Dingmans Ferry moraine and the Augusta-Montague mo-raine. Both of these moraines originate in Kittatinny Valley, cross Kittatinny Mountain and con-tinue to the Delaware River.

erenzio & Panaro, P.C.
60
Glacial Lakes were formed when till plugged river drainages. These lakes included Lake Wall-kill, Lake Hamburg, Lake North Church and Lake Sparta, in the eastern part of the county, and Lakes Newton, Stillwater and Millbrook in the central and northwestern part. Most glacial lakes are gone; however, two that exist today are Swartswood Lake and Lake Owassa. The lakes are located on the eastern flank of the Kittatinny Ridge, in Stillwater and Frankford Townships, re-spectively. A comparison of glaciated and non-glaciated landscapes reveals the extent to which the Wis-consinan glaciation has shaped the landscape. North of the Wisconsinan’s terminal moraine, the Highlands landscape is rugged, with thin soils and on ridgetops, steepwalled valleys and numer-ous bedrock outcroppings and glacial erratics. South of the moraine, the features are much gen-tler: river valleys are broad, ridgetops remain thickly forested and relief between valley and ridgetop is much less extreme. The Ridge and Valley province contains similar features. The Kittatinny Ridge has thin, rocky soils, supporting pitch pine and chestnut oak, while the valleys contain glacial sediment and have developed productive agricultural economies based on the land’s fertility. Map 3: Glacial Sediment in Sussex County depicts glacial remnants throughout the county. These features are an important component of the region’s natural history.

erenzio & Panaro, P.C.
61
Economic Resources Beginning about the early 18th century humans began exploiting the rich deposits of iron, zinc and graphite in the Highlands. Within the region’s Precambrian rocks, many mines have oper-ated over the last 250 years, extracting materials that have played important roles in American history. The most famous is the role of iron. The presence of magnetite iron ore deposits throughout the Highlands allowed numerous mines to flourish, and at one time New Jersey led the nation in production. Much of the raw material went to producing stoves, steel, guns, and munitions for the Revolutionary War effort. Iron mines operated throughout the Highlands of Sussex County. Additionally, zinc was mined in Ogdensburg and Franklin. Franklin Mine and Sterling Hill Mine in Ogdensburg are world fa-mous for the minerals extracted there. More than three hundred different minerals were discov-ered at Franklin and Sterling Hill, of which forty-two were new to science. Quarries were also common throughout the Highlands, and to a lesser extent, the Ridge and Val-ley. Precambrian granite and gneiss were quarried for crushed stone at Hamburg; marble was quarried extensively in the Franklin area north to McAfee. Paleozoic limestone and slate were quarried at numerous locations in the Ridge and Valley. Glacial sand and gravel pits were mined in the Highlands and Ridge and Valley. Water Resources Surface Water The New Jersey Department of Environmental Protection (NJDEP) has organized New Jersey into 20 Watershed Management Areas (WMA) based on physical characteristics and stream drainage patterns. Each WMA is named for one or more prominent rivers that drain that particu-lar watershed. Each WMA contains several sub-watersheds that highlight the importance of smaller streams in delivering water to the larger waterways of the watershed. The logic of ap-proaching water quality from a watershed perspective is apparent. Only by considering all ac-tions in upstream locations that drain to a common waterway can the impact on the stream from development, wildlife populations and other natural and cultural actors be analyzed. There are four WMAs within Sussex County. These areas delineate the principal stream systems that drain the county’s land area. The largest watershed in the county by area is WMA 1, the Up-per Delaware River Watershed. The waters of WMA 1 drain west and southwest to the Delaware River. Second in area in Sussex County is WMA 2, the Wallkill River Watershed. The Wallkill, which flows north into Orange County, New York, drains the north-central and northeastern sec-tion of Sussex County. WMA 3 (Pequannock River Watershed) and WMA 6 (Rockaway River Watershed) both drain to the southeast, and comprise small parts of the County. Map 4: Water-shed Management Areas in Sussex County shows the location of Sussex County’s four WMAs.

erenzio & Panaro, P.C.
62
The Department of Environmental Protection has classified each of the state’s freshwater bodies as either FW1 (Fresh Water 1) or FW2 (Fresh Water 2). FW1 waters are those that possess ex-emplary natural significance, aesthetic value or water supply significance and are to be “main-tained in their natural state of quality and not subjected to any manmade wastewater discharges.” These waters are all located wholly within publicly preserved lands. FW1 designation confers upon a water body the highest level of protection currently available in New Jersey. All other freshwater in New Jersey, with the exception of Pinelands waters, is classified as FW2. See Map 5: FW1 and FW2 Surface Water in Sussex County.
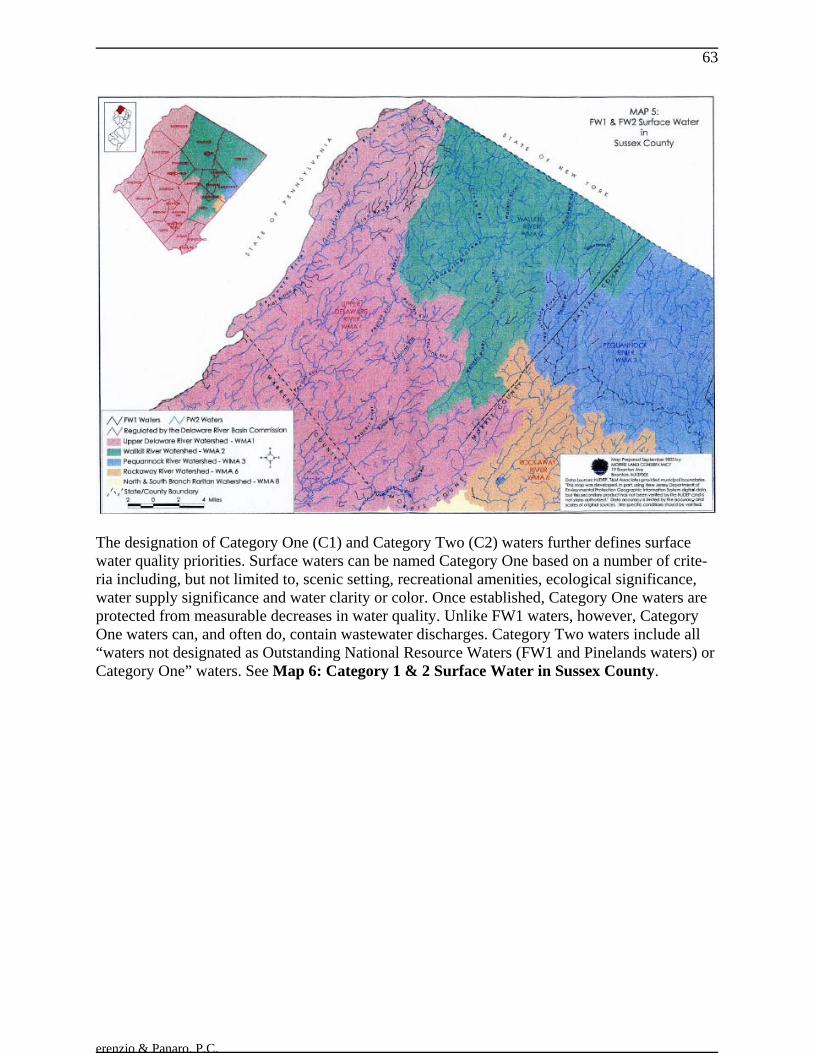
erenzio & Panaro, P.C.
63
The designation of Category One (C1) and Category Two (C2) waters further defines surface water quality priorities. Surface waters can be named Category One based on a number of crite-ria including, but not limited to, scenic setting, recreational amenities, ecological significance, water supply significance and water clarity or color. Once established, Category One waters are protected from measurable decreases in water quality. Unlike FW1 waters, however, Category One waters can, and often do, contain wastewater discharges. Category Two waters include all “waters not designated as Outstanding National Resource Waters (FW1 and Pinelands waters) or Category One” waters. See Map 6: Category 1 & 2 Surface Water in Sussex County.

erenzio & Panaro, P.C.
64
NJDEP has also classified all freshwater bodies in New Jersey as either “non-trout,” “trout main-tenance” or “trout production.” • “Non trout” waters are those that do not support trout because of physical, biological or chemi cal characteristics. • “Trout-maintenance” waters are those that support trout throughout the year. • “Trout production” waters are used by trout “for spawning or nursery purposes during their first summer.” Trout is used as an indicator species for water quality because of its sensitivity to certain water quality factors, such as water temperature and dissolved oxygen. Trout presence in a stream, or its use of that stream for reproduction directs the state’s water quality goals for that particular stream segment. The state has set three baseline water quality standards for the three “trout” classes. “Non-trout” waters are the least stringent and “trout production” waters are the most stringent. Criteria for the baselines include: dissolved oxygen; ammonia; temperature; and suspended solids. All waters must meet at least the minimum standards for its classification. See Map 7: Trout/Non-Trout Surface Water in Sussex County for the location of trout waters throughout the county.

erenzio & Panaro, P.C.
65
The Delaware River is managed outside of the above-mentioned scheme, by the Delaware River Basin Commission (DRBC). The DRBC was established in 1961 to consolidate the management of the Delaware River and its drainage basin, which span 330 miles and four states. Roles of the Commission include: “water quality protection, water supply allocation, regulatory review (per-mitting), water conservation initiatives, watershed planning, drought management, flood control, and recreation.” The Delaware River is the longest un-dammed river east of the Mississippi. Watershed Management Area 1 – Upper Delaware River Located in the western and southern sections of Sussex County, the Upper Delaware River Wa-tershed comprises greater than half of the county’s land area. All precipitation that falls within WMA 1 drains to the Delaware River. Principal waterways in Sussex County’s portion of WMA 1, listed north to south in the order in which they meet the Delaware River, include: the Flat Brook; the Paulins Kill; the Pequest River and a short stretch of the Musconetcong River. All of these waterways run southwesterly, roughly parallel to one another. See Map 4. Montague and Sandyston contain the largest number of FW1 waterways. These streams are part of the Big and Little Flat Brook systems. The upper half of the Big Flat Brook flows through High Point State Park and Stokes State Forest. Clove Brook, and Mill Brook also contain FW1 stretches. Further south in Walpack Township, tributaries of the Flat Brook draining the west slope of the Kittatinny Ridge have been designated FW1. See Map 5.

erenzio & Panaro, P.C.
66
Category 1 freshwater bodies are located throughout WMA1. Almost the entire Flat Brook sys-tem is designated C1, as well as Mill Brook and Clove Brook in Montague Township. In addi-tion, several stretches and tributaries of the Paulins Kill, Pequest River and Musconetcong River in Stillwater, Fredon, Green and Byram Townships have been designated as C1 waters. See Map 6. The western slope of the Kittatinny Ridge is also where the highest concentration of trout waters can be found. Upstream of the confluence of the Big and Little Flat Brooks, both rivers are clas-sified trout production waters. Other trout production waters include Clove Brook, which flows north into New York near Port Jervis, and branches of the Paulins Kill. Trout maintenance wa-ters of WMA 1 include several stretches of the Flat Brook below the confluence of the Little Flat Brook and the Flat Brook, as well as parts of Pequest River, Kymer Brook, Lubbers Run and the Paulins Kill. See Map 7. Watershed Management Area 2 – Wallkill River The Wallkill River watershed occupies the northern and northeastern parts of Sussex County, extending south through Sparta and northern Byram Townships. The Wallkill River flows north-east into New York State, where it empties into the Hudson River near Kingston. Major tributaries of the Wallkill River include Papakating Creek, which begins its run in Frank-ford Township, and Clove Brook, which flows south from northern Wantage Township. Pochuck Creek, which drains parts of Vernon and Hardyston Townships east of Pochuck Mountain, enter the Wallkill several miles into New York State. See Map 4. Hamburg Mountain Wildlife Management Area in Vernon and Hardyston Townships contains FW1-classified streams. Small sections of Waywayanda Creek and the headwaters of Pochuck Creek also contain FW1 waters. The upper reaches of Clove Brook in Wantage Township are classified as FW1. See Map 5. Clove Brook in Wantage also has C1 classifications in the northwestern corner of the Township. In Vernon, parts of Pochuck Creek and Waywayanda Creek have been designated C1 waters. Additionally, tributaries of the Wallkill River draining Sparta and Hamburg mountains are des-ignated C1. See Map 6. The Wallkill River and the majority of its tributaries are non-trout streams. The exceptions are those tributaries that drain forested, hilly areas. Clove Brook and its tributaries in Wantage are trout maintenance waters. Several branches of Black Creek in Vernon are also trout maintenance waters. Several branches of Waywayanda Creek are trout production waters. See Map 7. Watershed Management Area 3 – Pequannock River The Pequannock River Watershed occupies a small area of eastern Sussex County. Flowing south out of Vernon Township, the Pequannock River continues into Hardyston Township where it turns southeast, forming the border between Morris and Passaic Counties. The Pequannock’s confluence with the Passaic River occurs at the eastern end of Great Piece Meadows, where Mor-

erenzio & Panaro, P.C.
67
ris, Passaic and Essex counties meet. For most of its run in Sussex County the Pequannock River flows through Newark’s water supply management lands. Although these lands are not protected in perpetuity, there is a current state moratorium on the sale of water supply management lands. The Pequannock contains relatively few tributaries in Sussex County. See Map 4. A stretch of the upper Pacack Brook and almost the entire main stem of the Pequannock River in Sussex County are classified as FW1 streams. A tributary to the Pequannock, located in Hardyston Township, has been designated a C1 stream. The entire main stem of the Pequannock contains trout production waters. Its few tributaries in Sussex County are mostly classified as trout production and trout maintenance waters, except for the waters that flow into Canistear Reservoir. See Map 5, 6 and 7. Watershed Management Area 6 – Rockaway River Although the Rockaway River itself begins in Jefferson Township, the river system’s upper reaches are in eastern Sparta Township, where several streams merge to form Russia Brook. Russia Brook flows into Jefferson where it meets the Rockaway below Lake Swannanoa. From there the Rockaway River flows to the Passaic River. See Map 4. None of the Rockaway River’s tributaries in Sussex County contain a C1 or FW1 designation. Additionally, they are all classified as “non-trout.” See Maps 5, 6 and 7. Reservoirs and Lakes Sussex County’s lakes are found generally in two areas of the county: along the eastern slope of the Kittatinny Ridge and in the Highlands province of eastern Sussex County. It is here that to-pography and geology support the development of lakes. Most of Sussex County’s lakes serve recreational purposes, and were developed as vacation ar-eas in years past. The most prominent lakes in the county are Lake Hopatcong, Culvers Lake, Lake Owassa, Big Swartswood Lake, Lake Mohawk, Highland Lake, and Wawayanda Lake. Lake Hopatcong is the largest lake in New Jersey. In addition to the larger recreational lakes just mentioned, the five following surface water bod-ies are used for potable water supply purposes. See Map 4. • Morris Lake, in Sparta – used by Newton. • Lake Rutherford, in Wantage – used by Sussex Borough. • Branchville Reservoir, in Frankford – used by Branchville. • Franklin Pond, in Franklin – used by Franklin as an emergency water supply. • Lake Hopatcong - an emergency water supply for several towns. • Canistear Reservoir, in Vernon – contained on the Newark water supply management lands. • Heaters Pond, in Ogdensburg – an emergency water supply

erenzio & Panaro, P.C.
68
Groundwater Groundwater is any precipitation that percolates into the soil. Groundwater recharge is water that moves as subsurface runoff to wetlands, springs, streams etc., or into water filled layers of po-rous geologic formations called aquifers. In New Jersey, aquifers might be a few feet below the surface of the Earth, or several hundred feet underground, depending on underlying geologic formations. The rate at which groundwater reaches an aquifer is influenced by natural features such as soil type and bedrock geology. Human influence also has an affect; impervious surfaces, for example, will change the way water flows or will prevent storm water from soaking directly into the ground to become groundwater. Approximately 95% of Sussex County residents rely on groundwater for consumption. Ground-water is pumped to County residents from aquifers through either private on-site wells, commu-nity wells, or municipal wells. The long-term sustainability of the county’s groundwater supply will depend on safeguarding water quality and quantity by employing the proper land use prac-tices in areas with high groundwater recharge and aquifer productivity. Safeguarding community and municipal well heads is also an important component of long-term sustainability. Groundwater Recharge Groundwater recharge has been estimated by the New Jersey Geological Survey using 1995/97 Landuse/Landcover data, soils data, and local climatological data. This information was com-bined to generate an estimated groundwater recharge in inches per year, which was then con-verted to a ranking system of eight categories (A-E, L, W and X). The highest estimated recharge occurs in two parallel belts through the county. See Map 8: Groundwater Recharge in Sussex County. The first runs northeasterly through the western margin of the county, in Walpack Valley and the Upper Delaware Valley. The largest areas of that belt are located in northwestern Sandyston and western Montague Townships. The second belt runs northeasterly through the east-central region of the county, along the base of Sparta, Hamburg and Wawayanda mountains. This belt is generally located in the upper Wallkill Valley and Vernon Valley. The second tier of estimated groundwater recharge is located throughout the remainder of the county in isolated patches. Two notable concentrations, however, are in Stillwa-ter and Hampton Townships, and in Sandyston and Montague Townships. The lowest estimated groundwater recharge occurs along the Kittatinny Ridge and in the Highlands, where soils have been scoured away by glacial activity, exposing numerous bedrock outcroppings.

erenzio & Panaro, P.C.
69
Aquifer Rank The New Jersey Geological Survey ranks aquifers by their ability to yield groundwater to high capacity wells. This rank corresponds to the median yield an aquifer can be expected to produce and is expressed in gallons per minute. The yield of an aquifer is also taken as a reliable indicator of the aquifer’s ability to absorb, store and transmit water. Aquifer rank is broken into five cate-gories (A through E) corresponding to a range of gallons per minute. There is no aquifer in Sus-sex County in the A range. Thus in Sussex County aquifers are ranked B through E; Sussex County’s highest-ranking aquifers are not commensurate with the highest ranking aquifers state-wide. As with groundwater recharge, the areas of highest aquifer rank also include parts of the Wal-pack Valley, Upper Delaware Valley, Wallkill Valley and Vernon Valley. Several areas throughout the Kittatinny Valley contain the highest rank as well. Two belts of the second tier of aquifer rank in Sussex County run through eastern Stillwater, central Hampton and Frankford Townships, and along the base of Allamuchy, Sparta, Hamburg and Wawayanda mountains, be-coming smaller and more discontinuous in the northern part of the county. Part of the latter belt is interwoven with areas of highest aquifer yield. The vast majority of the remainder of the county contains the third level of aquifer rank. See Map 9: Aquifer Rank in Sussex County.

erenzio & Panaro, P.C.
70
Potential Aquifer Recharge Although groundwater recharge data is a good indicator of rates of infiltration, it does not neces-sarily represent areas where precipitation will percolate to an aquifer. However, by combining groundwater recharge data with aquifer rank data, the relative value of potential aquifer recharge areas can be delineated. The logic of this model is that the greatest potential for aquifer recharge is likely to be located where a high amount of groundwater recharge occurs, and also where aqui-fer rank (yield) is high. One important assumption of this model however, is that all groundwater reaches the underlying aquifer, when in fact some will discharge as subsurface runoff to streams, wetlands etc. No absolute numbers are provided for potential aquifer rank; rather the data is de-picted as areas where groundwater recharge ranks (A-E, L, W and X) intersect with aquifer ranks (B-E). This produces 19 relative values for potential aquifer recharge in Sussex County (There are not 20 because there is no area overlap of the E groundwater recharge and E aquifer rank). The highest potential aquifer recharge areas are located along the Delaware River, and along the run of the Big and Little Flat Brook, extending north into Montague Township. Western Sparta and western Hardyston Townships also contain the highest potential aquifer recharge. Several small, isolated patches in the central valley round out the highest areas of potential aquifer re-charge. Two large belts, which correspond almost exactly with the aquifer rank data, provide a second tier of potential aquifer recharge. One belt runs northeast through eastern Stillwater, cen-tral Hampton and southern Frankford Townships; another runs along the base of Allamuchy,

erenzio & Panaro, P.C.
71
Sparta, Hamburg and Wawayanda Mountains, becoming patchy and discontinuous towards the northern end of the county. See Map 10: Aquifer Recharge Potential in Sussex County.
Land Use The New Jersey Department of Environmental Protection has developed a Geographic Informa-tion System (GIS) data layer called 1995/97 Landuse/Landcover. This layer was created from the analysis and interpretation of color infrared (CIR) imagery from 1995/97 and contains detailed information regarding vegetation type and land use in New Jersey. At present this GIS data layer is the most accurate and up-to-date source for land use/land cover information in New Jersey.

erenzio & Panaro, P.C.
72
Maps 11, 13, 15 and 17, as well as the
information and statistics that follow are all derived from this data layer (except where noted), which lists the total acreage of Sussex County as 343,445 acres. (Please note: any changes in land use that have occurred after 1997 are not reflected in the following information.) Forest In 1995/97 Sussex County had 194,259 acres in upland forest; this amounts to 57% of the County’s land area. This is the largest land cover type in Sussex County. These forested areas include upland forest only, and do not include forested wetlands. Sussex County is the most for-ested county in New Jersey by percentage of land in forest. According to Map 11: Upland For-est in Sussex County, the majority of upland forest falls within the state and federal parks in the eastern and western section of the county. Throughout the county’s central section, forested ar-eas are less frequent, occurring in discontinuous patches. Limestone Forests Although forested areas in general provide wildlife habitat and water quality protection, lime-stone forests have unique characteristics that make them especially important. Limestone forests occur in karst landscapes, which are underlain by limestone bedrock and contain sinkholes, sink-hole ponds, caves and springs. These communities support rare plant and animal species adapted to the soils and water cycle of the hydrogeologically dynamic region. Limestone outcroppings

erenzio & Panaro, P.C.
73
within the forests provide habitat for ferns, worts and other rare native plants as well as migra-tory birds and raptors. Data for Map 12: Potential Locations of Limestone Forest in Sussex County, is sourced from NJGS’s geologic data and the NJDEP’s 1995/97 Landuse/Landcover data. It represents all for-ested lands that overlie limestone bedrock and thin glacial till. This map has not been field veri-fied and provides an indication of potential areas where limestone forest is located.
According to Map 12, limestone forests occur in three distinct regions in Sussex County. The first is located adjacent to the Delaware River, on the western slope of the Kittatinny Ridge. This area extends from the Walpack Bend north into Montague. The second area extends northward from southeastern Stillwater through Hampton into southern Branchville. The third area extends northward from Green through to Vernon with concentrated areas located in the Green, Fredon, Andover region, the Lafayette, Hardyston, Hamburg, Franklin region and central Vernon. Wetlands Wetlands are the next most frequent land cover. In 1995/97, a total of 47,670 acres, or 14%, of the County land area was wetland. Of this total wetland acreage, 30,744 acres, or 9% of the County is forested wetland, and 16,926 acres, or 5% of the County is other wetland such as her-baceous wetland, disturbed wetland or agricultural wetland. Map 13: Wetlands in Sussex County illustrates the location of forested wetland and ‘other’ wetland.

erenzio & Panaro, P.C.
74
The largest concentration of wetlands occurs along the Wallkill River. Following the river for about 8 miles upstream from its entrance into New York State along the Wantage-Vernon border the Wallkill River has a large floodplain with wetland areas. Other prominent areas of wetlands include the region surrounding the Paulins Kill in Hampton, Andover Township and Lafayette, the region surrounding Pochuck Creek in central Vernon, the region surrounding the Wallkill River in Sparta and Ogdensburg and along the Papakating Creek in Wantage Township. Limestone Fens and Sinkhole Ponds Portions of the valleys in Sussex County are underlain by limestone, creating the potential for sinkhole ponds and limestone fens. Limestone fens are similar to limestone forests except that they are related to wetland complexes as opposed to forested areas. Although fens can occur on other geologic units, the greatest extent of these unique features are found where glacial till over-lies limestone formations in the Ridge and Valley physiographic province. This unique environ-ment supports plants that tolerate alkaline conditions and other species associated with these plants. Data for Map 14: Potential Locations of Limestone Fens & Ponds in Sussex County, is sourced from NJGS’s geologic data and NJDEP’s soils data. It represents areas where Carlisle muck soils overlay limestone bedrock and thin glacial till (as fen sites are muck based). This map
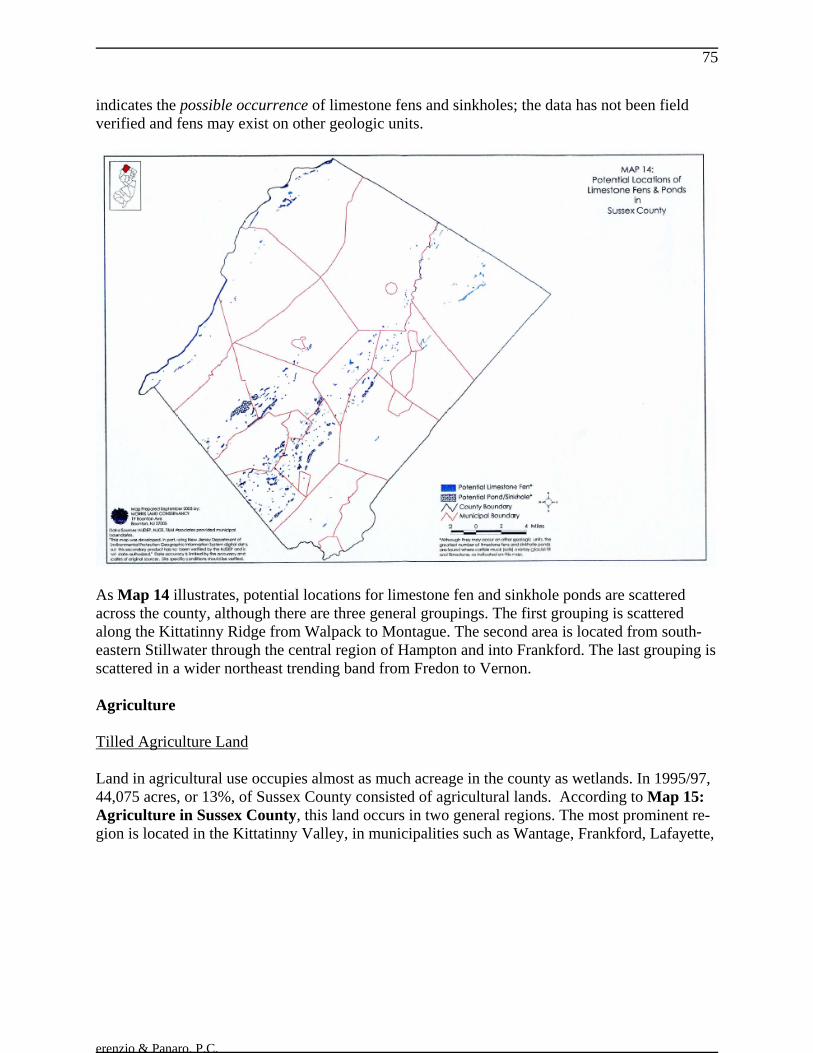
erenzio & Panaro, P.C.
75
indicates the possible occurrence of limestone fens and sinkholes; the data has not been field verified and fens may exist on other geologic units.
As Map 14 illustrates, potential locations for limestone fen and sinkhole ponds are scattered across the county, although there are three general groupings. The first grouping is scattered along the Kittatinny Ridge from Walpack to Montague. The second area is located from south-eastern Stillwater through the central region of Hampton and into Frankford. The last grouping is scattered in a wider northeast trending band from Fredon to Vernon. Agriculture Tilled Agriculture Land Land in agricultural use occupies almost as much acreage in the county as wetlands. In 1995/97, 44,075 acres, or 13%, of Sussex County consisted of agricultural lands. According to Map 15: Agriculture in Sussex County, this land occurs in two general regions. The most prominent re-gion is located in the Kittatinny Valley, in municipalities such as Wantage, Frankford, Lafayette,

erenzio & Panaro, P.C.
76
Hampton, Fredon and Green Townships. The
second region is on the west slope of the Kittatinny Ridge, in Walpack, Sandyston and Montague Townships. The data that NJDEP derived from the interpretation of color infrared imagery can only account for pasture, cropland and buildings associated with agriculture such as barns or greenhouses. It does not take into account areas that are under woodland management (these areas are consid-ered forested on infrared images) and which are considered to be ‘farmland’ or ‘agriculture’ from a legal standpoint (e.g. tax assessment). Therefore, although the 1995/97 Landuse/Landcover data provides an account of ‘tilled’ agriculture, it does not illustrate all ‘farmland’ or farm as-sessed property in the county. Farm Assessed Property & Woodland Management A more inclusive source for the total acreage of farmland is county tax records. Tax data for 2002 indicate that a total of 115,127 acres of land is assessed as Class 3A and 3B farm assessed property. This total includes ‘tilled’ lands as well as woodland managed lands, which, as previ-ously mentioned, are forested. Map 16: Farm Assessed Property in Sussex County shows similar trends as Map 15 but includes more land throughout the Kittatinny Valley and in High-lands municipalities such as Byram, Hardyston and Sparta Townships.

erenzio & Panaro, P.C.
77
Land that is under woodland management receives the favorable farmland tax assessment rate in exchange for the planned harvest of the property’s timber resources. According to the New Jer-sey Department of Agriculture’s New Jersey Farmland Data Report for the tax year 2002, a total of 56,272 acres in Sussex county are classified as woodland/wetlands and 35,129 of these acres are non-appurtentant woodlands, i.e. those not attached to other lands that are farmed. Urban Land / Barren Land / Water Urban land accounts for 42,445 acres, or 12% of Sussex County’s land area. Included in the ‘Ur-ban’ category are any anthropogenic features or structures. This includes roads, parking lots, homes, offices, schools, stores and utility facilities. The remaining 4% of the county is comprised of ‘Water’ and ‘Barren Land’. ‘Water’, which in-cludes lakes, rivers, ponds and reservoirs, accounts for 12,827 acres. ‘Barren Land’ accounts for 2,169 acres and includes any land devoid of vegetative cover. This includes mines and quarries, such as those located on the Sparta/Hopatcong border and in Hardyston as illustrated by Map 17: Urban Land, Barren Land & Water in Sussex County.

erenzio & Panaro, P.C.
78
A summary of land use according to data derived from the NJDEP’s 1995/97 Lan-duse/Landcover data layer is as follows: Total Upland Forest: 194,259 acres 57% Total Wetlands: 47,670 acres 14% Forested Wetlands (30,744 acres 9%) Herbaceous Wetlands (16,926 acres 5%) Tilled Agriculture: 44,075 acres 13% Urban Land: 42,445 acres 12% Water: 12,827 acres 4% Barren Land: 2,169 acres <1% Total: 343,445 Acres 100% Steep Slopes Occurring across all of the previously mentioned land use/land cover categories are steep slopes. The benefit of mapping steep slopes lies in the ability to catalog topographic trends and to use that information in making informed land use decisions. According to Map 1 8: Slope Catego-ries in Sussex County, the most striking occurrence of steep slopes is along Kittatinny Moun-tain, and along the escarpment of Sparta, Hamburg and Wawayanda Mountains.
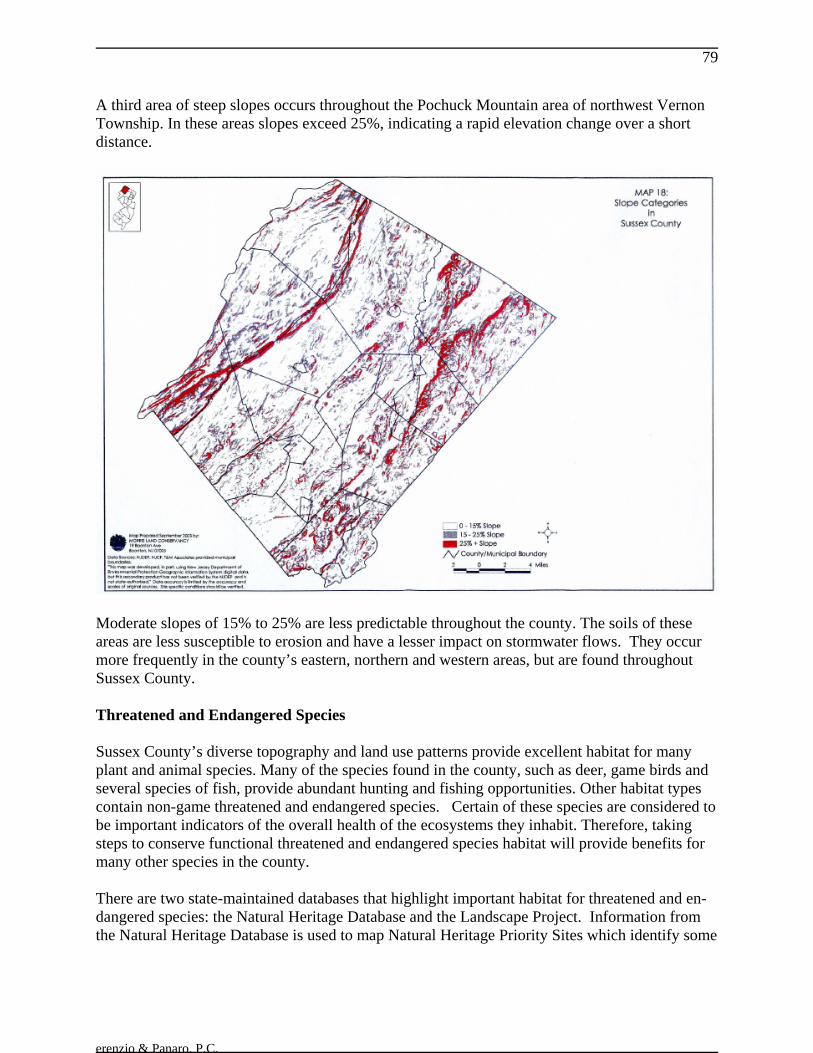
erenzio & Panaro, P.C.
79
A third area of steep slopes occurs throughout the Pochuck Mountain area of northwest Vernon Township. In these areas slopes exceed 25%, indicating a rapid elevation change over a short distance.
Moderate slopes of 15% to 25% are less predictable throughout the county. The soils of these areas are less susceptible to erosion and have a lesser impact on stormwater flows. They occur more frequently in the county’s eastern, northern and western areas, but are found throughout Sussex County. Threatened and Endangered Species Sussex County’s diverse topography and land use patterns provide excellent habitat for many plant and animal species. Many of the species found in the county, such as deer, game birds and several species of fish, provide abundant hunting and fishing opportunities. Other habitat types contain non-game threatened and endangered species. Certain of these species are considered to be important indicators of the overall health of the ecosystems they inhabit. Therefore, taking steps to conserve functional threatened and endangered species habitat will provide benefits for many other species in the county. There are two state-maintained databases that highlight important habitat for threatened and en-dangered species: the Natural Heritage Database and the Landscape Project. Information from the Natural Heritage Database is used to map Natural Heritage Priority Sites which identify some
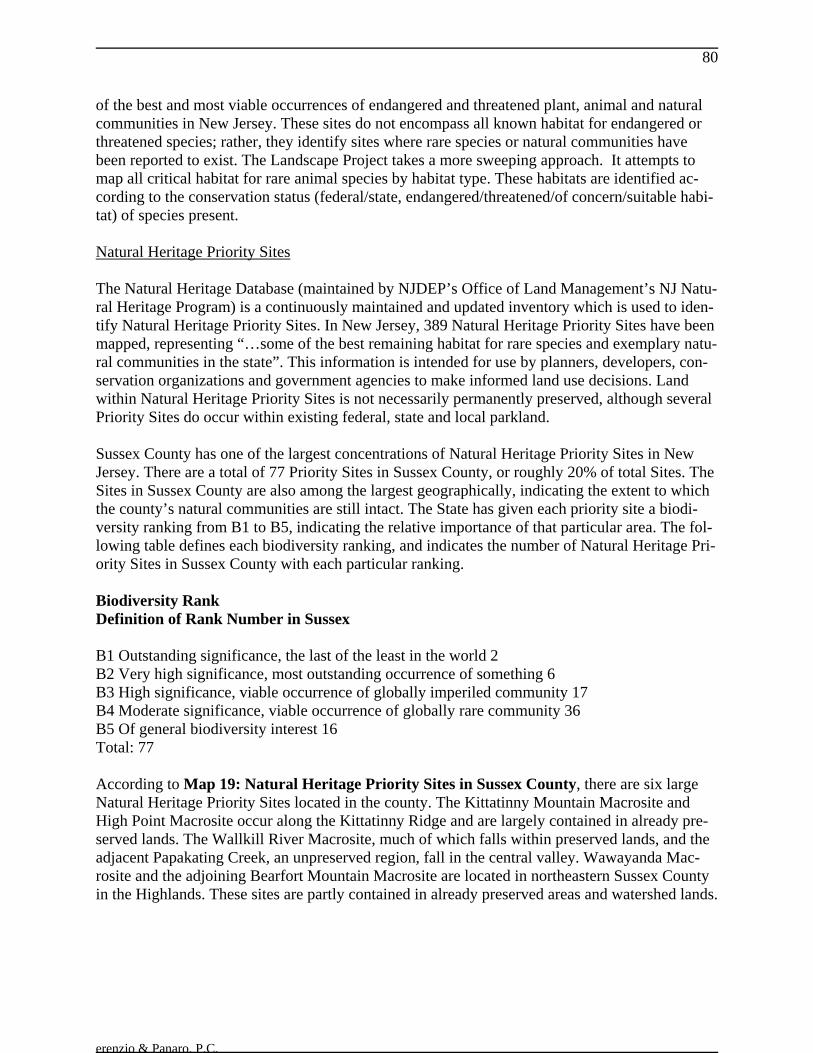
erenzio & Panaro, P.C.
80
of the best and most viable occurrences of endangered and threatened plant, animal and natural communities in New Jersey. These sites do not encompass all known habitat for endangered or threatened species; rather, they identify sites where rare species or natural communities have been reported to exist. The Landscape Project takes a more sweeping approach. It attempts to map all critical habitat for rare animal species by habitat type. These habitats are identified ac-cording to the conservation status (federal/state, endangered/threatened/of concern/suitable habi-tat) of species present. Natural Heritage Priority Sites The Natural Heritage Database (maintained by NJDEP’s Office of Land Management’s NJ Natu-ral Heritage Program) is a continuously maintained and updated inventory which is used to iden-tify Natural Heritage Priority Sites. In New Jersey, 389 Natural Heritage Priority Sites have been mapped, representing “…some of the best remaining habitat for rare species and exemplary natu-ral communities in the state”. This information is intended for use by planners, developers, con-servation organizations and government agencies to make informed land use decisions. Land within Natural Heritage Priority Sites is not necessarily permanently preserved, although several Priority Sites do occur within existing federal, state and local parkland. Sussex County has one of the largest concentrations of Natural Heritage Priority Sites in New Jersey. There are a total of 77 Priority Sites in Sussex County, or roughly 20% of total Sites. The Sites in Sussex County are also among the largest geographically, indicating the extent to which the county’s natural communities are still intact. The State has given each priority site a biodi-versity ranking from B1 to B5, indicating the relative importance of that particular area. The fol-lowing table defines each biodiversity ranking, and indicates the number of Natural Heritage Pri-ority Sites in Sussex County with each particular ranking. Biodiversity Rank Definition of Rank Number in Sussex B1 Outstanding significance, the last of the least in the world 2 B2 Very high significance, most outstanding occurrence of something 6 B3 High significance, viable occurrence of globally imperiled community 17 B4 Moderate significance, viable occurrence of globally rare community 36 B5 Of general biodiversity interest 16 Total: 77 According to Map 19: Natural Heritage Priority Sites in Sussex County, there are six large Natural Heritage Priority Sites located in the county. The Kittatinny Mountain Macrosite and High Point Macrosite occur along the Kittatinny Ridge and are largely contained in already pre-served lands. The Wallkill River Macrosite, much of which falls within preserved lands, and the adjacent Papakating Creek, an unpreserved region, fall in the central valley. Wawayanda Mac-rosite and the adjoining Bearfort Mountain Macrosite are located in northeastern Sussex County in the Highlands. These sites are partly contained in already preserved areas and watershed lands.
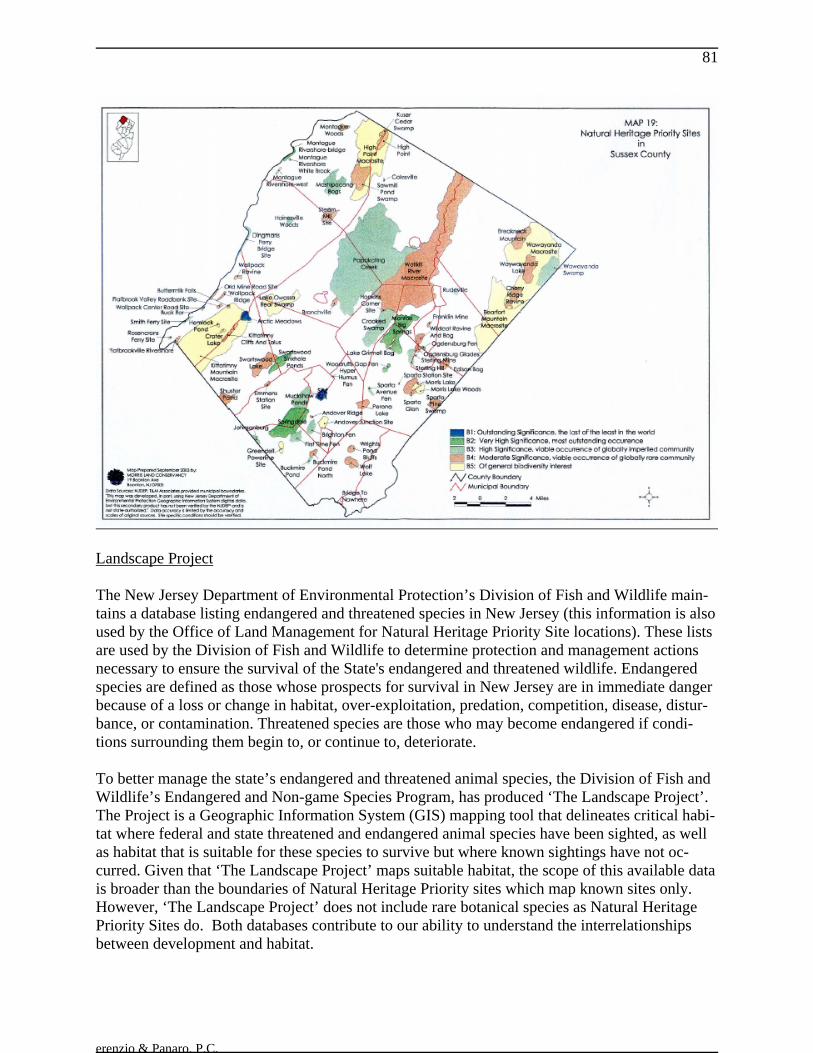
erenzio & Panaro, P.C.
81
Landscape Project The New Jersey Department of Environmental Protection’s Division of Fish and Wildlife main-tains a database listing endangered and threatened species in New Jersey (this information is also used by the Office of Land Management for Natural Heritage Priority Site locations). These lists are used by the Division of Fish and Wildlife to determine protection and management actions necessary to ensure the survival of the State's endangered and threatened wildlife. Endangered species are defined as those whose prospects for survival in New Jersey are in immediate danger because of a loss or change in habitat, over-exploitation, predation, competition, disease, distur-bance, or contamination. Threatened species are those who may become endangered if condi-tions surrounding them begin to, or continue to, deteriorate. To better manage the state’s endangered and threatened animal species, the Division of Fish and Wildlife’s Endangered and Non-game Species Program, has produced ‘The Landscape Project’. The Project is a Geographic Information System (GIS) mapping tool that delineates critical habi-tat where federal and state threatened and endangered animal species have been sighted, as well as habitat that is suitable for these species to survive but where known sightings have not oc-curred. Given that ‘The Landscape Project’ maps suitable habitat, the scope of this available data is broader than the boundaries of Natural Heritage Priority sites which map known sites only. However, ‘The Landscape Project’ does not include rare botanical species as Natural Heritage Priority Sites do. Both databases contribute to our ability to understand the interrelationships between development and habitat.

erenzio & Panaro, P.C.
82
The Landscape Project is publicly available and can be a useful tool for public and private or-ganizations when decisions about setting priorities for land preservation and land use are made. The goal of the project is to protect biological diversity in New Jersey, “…by maintaining and enhancing rare wildlife populations within healthy, functioning ecosystems.” Data from the Landscape Project may be used in a number of different ways. For example, it is possible to determine if sightings of endangered species have been made in a particular region, or it can be used to rank different regions against each other according to the conservation category of endangered species (e.g. federally endangered or state threatened) located there. The data are also potentially useful as part of a comprehensive open space plan. Lands of particular impor-tance can receive high priority for purchase of development easements, alternative development design, or transfer of development rights. To determine what kinds of endangered and threatened species exist in Sussex County, it is use-ful to break the county into three regions, the Kittatinny Ridge, the Kittatinny Valley and the Highlands, which, respectively, lie west to east in the county. The largest of these areas is the Kittatinny Valley, which occupies approximately half of the county’s land area. This is also the area of the county with the least amount of protected land. The landscape in this section is comprised of farm fields, wooded ridges and numerous stream corridors. The grasslands of abandoned and fallow farmland provide excellent habitat for threat-ened and endangered grassland bird species, such as bobolink, Savannah sparrow, vesper spar-row and grasshopper sparrow. The edge environments afforded by agricultural landscapes also foster larger mammals, such as coyote, bobcat and deer. Despite its human-sculpted appearance, the Kittatinny Valley is a region of tremendous biological diversity. The western and eastern margins of the county. the Kittatinny Ridge and the Highlands. are for-ested and mountainous. These regions harbor concentrations of forest dwelling species, such as black bear, timber rattlesnake, barred owl and the elusive bobcat. These species thrive on large, contiguous patches of habitat. Nearly the entire extent of the Kittatinny Ridge is protected by federal and state agencies. In the Highlands, however, select state parks, wildlife management areas and water supply management lands protect discontinuous patches of habitat. The following table lists threatened and endangered species by county region.
Endangered and Threatened Wildlife of Sussex County Region of Sussex County
Kittatinny Ridge Kittatinny Valley Highlands
Timber rattlesnake (SE) Wood turtle (SE) Timber rattlesnake (SE)
Wood turtle (SE) Bog turtle (SE) Wood turtle (SE) Bog turtle (SE) Bobcat (SE) Bog turtle (SE)
Bobcat (SE) Great blue heron (ST) Bobcat (SE) Red-shouldered hawk (SE, Br) Barred owl (ST) Red-shouldered hawk (SE, Br)
Great blue heron (ST) Northern harrier (SE, Br) Great blue heron (ST)

erenzio & Panaro, P.C.
83
Barred owl (ST) Cooper’s hawk (ST) Barred owl (ST) Northern goshawk (SE, Br) Bobolink (ST) Northern goshawk (SE, Br)
Savannah sparrow (ST, Br) Northern harrier (SE, Br) Vesper sparrow (ST, NB) Bobolink (ST)
Grasshopper Sparrow (ST, Br) Savannah sparrow (ST, Br) Red-headed woodpecker (ST) Vesper sparrow (ST, NB)
Grasshopper sparrow (ST, Br)
SE = State Endangered Species ST = State Threatened Species Br = Breeding Population Only
NB=Non-breeding Population Only Pied-billed grebe (SE, Br) In order to evaluate the importance of different regions according to the conservation status of species present, The Landscape Project divides critical habitat into five habitat types: forest, grassland, forested wetland, emergent wetland and beach and dune. Each type is then ranked ac-cording to the conservation status of species present. The rank of conservation status for all habi-tat types from highest to lowest is as follows: federally threatened and endangered species, state endangered species, state threatened species, species of special concern and suitable habitat. Therefore, it is possible to identify and map which areas of forest habitat contain federally threatened or endangered species, which contain state endangered species and so on. Maps 20, 21, 22, & 23 identify, delineate and rank habitat type as outlined above. This informa-tion allows users to identify the locations of critical habitat for federal and state endangered and threatened species, along with habitat for species of concern and areas that might be suitable as habitat. Map 20: Forested Habitat for Threatened & Endangered Species in Sussex County outlines and ranks the location of critical habitat for forest dependent species. There is one large area of the highest ranking critical forest habitat for federal threatened and endangered species. This area is located in the eastern region of Sparta and the southern region of Hardyston. Much of this region is encompassed by Sparta Mountain Wildlife Management Area, the Wallkill River Preserve and Weldon Brook Wildlife Management Area.

erenzio & Panaro, P.C.
84
The second highest ranking critical forest habitat for state endangered species encompasses a large portion of the county. The largest area of this ranking runs in a large swathe along the Kit-tatinny Ridge and falls within the Delaware Gap National Recreation Area, High Point State Park, Stokes State Forest, Flatbrook Wildlife Management Area and Walpack Wildlife Manage-ment Area. Another area of this ranking is located in eastern Vernon and Hardyston, parts of which are included within Waywayanda State Park and Hamburg Mountain Wildlife Manage-ment Area. A third area of critical habitat for state endangered species is located at the southern tip of the county, centered around Byram. A fourth area is located in western Vernon Township near the Wallkill River National Wildlife Refuge. Other smaller areas of this ranking are scat-tered through the Kittatinny Valley in central Sussex County. The remaining rankings, which include state threatened species, species of special concern and areas of suitable habitat for forest dependent species are also predominantly located in the Kit-tatinny Valley. A significant swathe of habitat for state threatened species runs southwest from the Borough of Franklin through to Green. A further area of state threatened species is located in Hampton reaching southwest through Stillwater and Fredon. There is one small patch of species of special concern located in Fredon and areas of suitable habitat scattered throughout the valley. Map 21: Forested Wetland Habitat for Threatened & Endangered Species in Sussex County outlines and ranks the location of critical habitat for forested wetland dependent species. There may be areas of overlap between forested habitat and forested wetland; some spe-cies are exclusively dependent on each habitat type. To generate accurate information, these
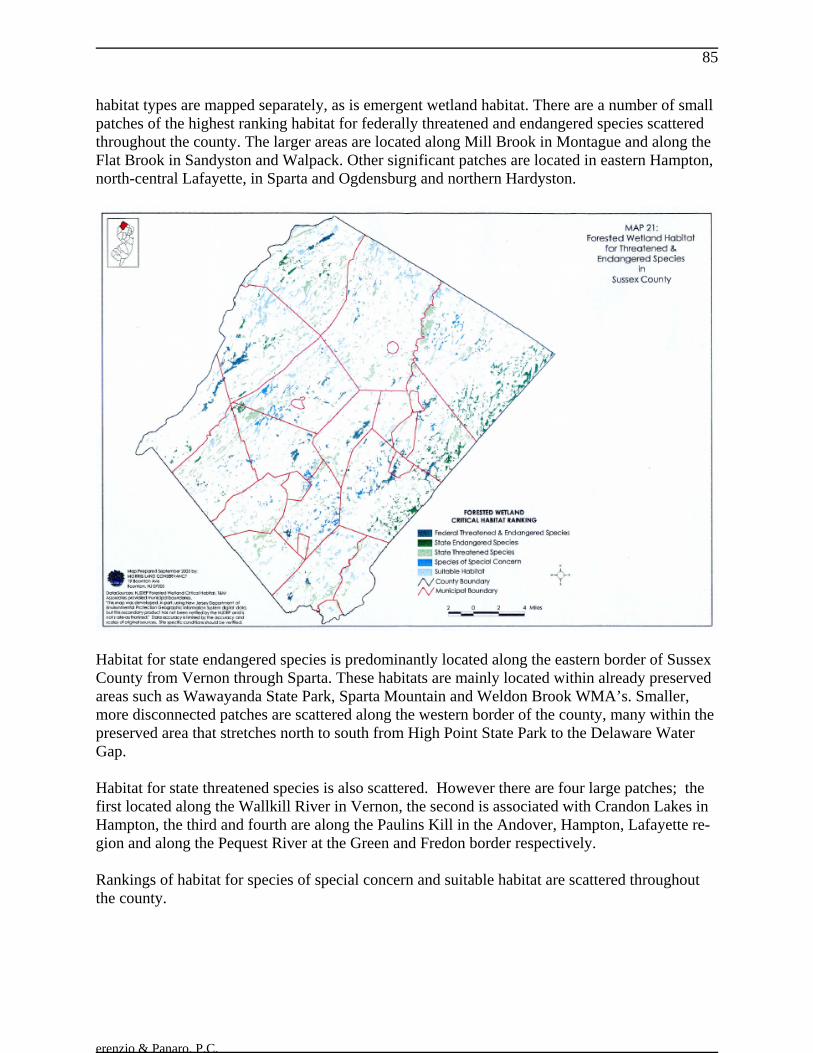
erenzio & Panaro, P.C.
85
habitat types are mapped separately, as is emergent wetland habitat. There are a number of small patches of the highest ranking habitat for federally threatened and endangered species scattered throughout the county. The larger areas are located along Mill Brook in Montague and along the Flat Brook in Sandyston and Walpack. Other significant patches are located in eastern Hampton, north-central Lafayette, in Sparta and Ogdensburg and northern Hardyston.
Habitat for state endangered species is predominantly located along the eastern border of Sussex County from Vernon through Sparta. These habitats are mainly located within already preserved areas such as Wawayanda State Park, Sparta Mountain and Weldon Brook WMA’s. Smaller, more disconnected patches are scattered along the western border of the county, many within the preserved area that stretches north to south from High Point State Park to the Delaware Water Gap. Habitat for state threatened species is also scattered. However there are four large patches; the first located along the Wallkill River in Vernon, the second is associated with Crandon Lakes in Hampton, the third and fourth are along the Paulins Kill in the Andover, Hampton, Lafayette re-gion and along the Pequest River at the Green and Fredon border respectively. Rankings of habitat for species of special concern and suitable habitat are scattered throughout the county.

erenzio & Panaro, P.C.
86
Map 22: Emergent Wetland Habitat for Threatened & Endangered Species in Sussex County outlines and ranks the location of critical habitat for herbaceous wetland dependent spe-cies. Critical emergent herbaceous wetland is predominantly associated with waterways and oc-curs in smaller, often contiguous patches in the eastern section of the county. Along the Pochuck Creek in central Vernon there are significant contiguous (or almost contiguous) areas of habitat for federally threatened and endangered species, state endangered, and state threatened species; some of which falls within preserved areas associated with the Appalachian Trail. Similarly, there are large areas of critical habitat for federally threatened and endangered species, state en-dangered, state threatened and species of special concern located along the Wallkill River within the Wallkill River WMA.
A significant habitat area for federally threatened and endangered species is located in Lafayette Township. Much of this area is located in municipally preserved open space or preserved farm-land. There are also two sizeable habitat areas for state threatened species. The first is located along the Hampton, Andover Township and Newton border; the second spans border between Fredon and Green and is encompassed within Whittingham WMA. Habitat for species of special con-cern and areas of suitable habitat are scattered in smaller disconnected patches, mostly within the Kittatinny Valley and Highlands region of the county. Map 23: Grassland Habitat for Threatened & Endangered Species in Sussex County out-lines and ranks the location of critical habitat for grassland dependent species. Much of the criti-cal grassland habitat in Sussex County is located in the Kittatinny Valley.

erenzio & Panaro, P.C.
87
Smaller areas are located in the Pochuck Mountain region in Vernon, with still smaller areas lo-cated along the western side of the Kittatinny Ridge.
A significant area of habitat for federally threatened and endangered species, and state endan-gered and state threatened species is located in Wantage. There is also a large patch of these rankings located in the center of the county, encompassing parts of Frankford, Lafayette, Hardyston, Hampton, Andover and Sparta Townships. A smaller patch of these rankings is lo-cated in the Pochuck Creek area of central Vernon Township. In northern Montague significant areas of habitat exists for federal threatened and endangered species and state threatened species. Similar areas can also be found in western Sandyston and Walpack Townships. Vernal Pools New Jersey has recently adopted legislation to protect vernal pools. These pools are “confined wetland depressions, either natural or man-made, that hold water for at least two consecutive months out of the year, and are devoid of breeding fish population….These unique ecosystems provide habitat to many species of amphibians, insects, reptiles, plants and other wildlife.”59 As of August 2003, initial research by Rutgers University to identify the location of these special resources has found 840 sites in the Ridge and Valley geophysical region and 728 in the High-lands. Many of these sites are located in Sussex County.

erenzio & Panaro, P.C.
88
Biodiversity A report compiled in 2003 by The Morris Land Conservancy for the Sussex County Open Space and Recreation Plan further identifies the biodiversity enjoyed in the County. Sussex County has 29 species and communities that can be classified as globally rare. The county leads the nation in dragonfly and damselfly diversity with 142 documented species. The county also supports a high concentration of breeding birds. The Kittatinny Ridge and Delaware River serve as impor-tant routes for neotropical migrants and migrating raptors. Sussex County is home to over 160 species of birds, 72 fish species, 49 species of amphibians/reptiles, 83 butterfly species, 292 spe-cies of trees and shrubs, and 33 mammals including black bear, red fox, gray fox, bobcat and coyote. Function of the Natural Resources Inventory Carrying Capacity The foregoing discussion has highlighted the scope and variation of the natural resource base in Sussex County. As this document is prepared in a larger context, the following discussion re-lates the strengths and weaknesses of the available natural resources to their ability to support development and redevelopment. This ability is termed carrying capacity. Carrying capacity is a function of topography, geology, available water supply, the ability of soils to accept effluent treated to one extent or another, necessary protections for surface water bodies, and accommoda-tion to wildlife needs. Of these, the most critical is available water supply. Water Supply Water supply is critical to agriculture, residential and commercial development and recreation development. Attempting to use land beyond the ability of the area to supply sufficient water during periods of drought is a guarantee of hardship during times of short supply. Available wa-ter is a function of geology, soils and recharge. The geology of an area defines the ability of the rock or unconsolidated material to store water. Soils directly affect the ability of an area to allow recharge of precipitation and treated wastewater, making possible the densities required for Cen-ter creation. This is of particular importance in Sussex County, where there are few surface wa-ter supplies. Those that do exist are limited and comprise; Franklin Pond, Heaters Pond, Lake Rutherford and Morris Lake. These serve Franklin and Ogdensburg as back up supply and Sus-sex and Newton as principal sources. Creation of additional surface water impoundments may prove beneficial from the standpoint of supply, as well as storm water management. As an example of the changing impact on resources, the former Limecrest Quarry in Andover, Sparta and Lafayette Townships once diverted five to seven million gallons of water per day from the subsurface aquifer generally feeding the Pequest watershed and discharging it on the surface in the Paulinskill watershed. That has now changed with water table impact felt on exist-ing development and an equilibration period required of the Paulinskill. In the Highlands Physiographic Province, described earlier in this report, we made the point that the geology of the area is of resistant, dense rock. These kinds of rock do not function well as

erenzio & Panaro, P.C.
89
sources of water. While there are some wells drilled in the Highlands which produce substantial quantities of water, overall the area is a very poor aquifer.
Moving west into the Kittatinny Valley, the Martinsburg and Kittatinny formations are generally better yielding, although, again, the occasional high-productive well is offset by many marginal supplies. Here again, distribution and supply is not uniform. Wells which intercept solution channels and caverns in the Kittatinny formation may be highly productive, while others inter-cepting low yield units may produce no water at all. There is an additional concern with regard to the highly productive elements of the Kittatinny formation, and that is that access to them brings with it the potential introduction of pollutants and consequent degradation of a significant water supply.
West of the Kittatinny Valley, the Shawangunk and High Falls formations are again resistant, dense formations. These, in Sussex County, are limited to the vast areas owned by State and Federal governments. Dropping into the Delaware River Valley and more soluble limestone, the rock aquifers become higher yielding, although with the same variability exhibited by the Kit-tatinny supergroup in central Sussex County.
The last significant aquifer in the County is the most highly productive and vulnerable aquifer. This aquifer, comprised of sands and gravels, laid down by the Illinoisan and Wisconsin glaciers are the only formations which exhibit what is known as primary porosity. These formations store water in and amongst its components, rather than simply in cracks, fractures and solution features. Notwithstanding the fact that this is a highly productive aquifer, yielding, in many cases, wells supplying hundreds of thousands of gallons of water per day, it is also highly sus-ceptible to drought events and the introduction of pollutants. This formation tends to be found in northeast/southwest trending valleys in Hardyston, Sparta, Frankford, Andover, Lafayette, Green and Stillwater Townships and Andover Borough. Aquifer Recharge
The capacity of an aquifer to yield water is only a part of the picture. The other side of the equa-tion is the extent to which an aquifer can be recharged once that water has been withdrawn. Other than in the glacial drift formations, this is a function of soil type and topography. The more porous soils more readily accept precipitation and runoff. The steeper soils are less able to accept recharge. This is due to the fact that increased slopes increase the velocity of storm water flows, thereby reducing the time available for infiltration. This is particularly critical in the areas of relatively resistant bedrock (the Highlands, Kittatinny Ridge), already limited by their charac-ter as sources of water. See Map 8 Aquifer Recharge in Sussex County. This exhibit illus-trates the point that areas of greatest recharge are found in the valleys while lesser recharge is found along the ridges, and most particularly, in the Highlands. Interestingly, one inch per acre of recharge equals approximately 27,000 gallons. Even in the areas of lowest recharge, there are substantial quantities of water reaching the aquifer. Only a portion of the water reaching the aquifer as recharge is available for consumption, particularly in times of drought without adversely affecting stream base flows and existing withdrawals. For example, six inches of recharge per year over an acre provides approximately 160,000 gallons to
erenzio & Panaro, P.C.
90
the aquifer. Of this, no more than 32,000 gallons (twenty percent) is available for consumption. A single family, utilizing approximately 250 gallons per day, will consume slightly more than 90,000 gallons per year. From a recharge perspective, an acre receiving sixteen inches of re-charge per year will sustain this hypothetical single family. As the amount of recharge dimin-ishes, the contributing area must correspondingly increase. This may be somewhat offset in ar-eas served by septic systems or other waste treatment facilities which discharge treated effluent to ground water.
Topography
Topography, the mix of slopes, ridges and valleys, has been a significant influence on the pat-terns of settlement throughout the County. The ridges and valleys in the County trend north-east/southwest. (See Map 18, Slope Categories in Sussex County) This has led to most road patterns following the line of least resistance, with relatively few crossing the ridges west to east. In addition to determining the primary road network, the soils located on relatively steep (25% or greater) slopes are typically thin and highly erodable. To that instability is added the increased force of storm water flows moving at high velocities in steep areas. The net result of these cu-mulative conditions is a general desire that they not be disturbed. In this way, we avoid loss of vegetation, soil and increased downstream impact from storm water flows. As indicated earlier, Sussex County lies in two of the four physiographic provinces in the State, the Highlands and the Ridge and Valley. The highly accessible broad valleys are the least sus-ceptible to environmental damage through disturbance and are also the most highly productive agricultural lands. They contain the valley fill sand and gravel deposits which are the County’s most productive aquifers. The ridges are highly visible, vulnerable to erosion when disturbed and steeply sloping. The Highlands are resistant, poor aquifers, generally steeply sloping, mantled with soils of modest productivity. (Map 1, Physiographic Provinces and Ridgelines). In New Jersey, the Highlands are more conventionally designated pursuant to legislation adopted in 2004.
Slopes reduce the ability of land adjacent to streams to filter sediments and act as a sink for nu-trients. In developing stream protection mechanisms, the degree of engineering necessary to achieve a particular standard increases with slope where the slope runs to the stream. Access to steeply sloping land requires the disturbance of substantially more area than is needed in gentler terrain.
Water Availability as Determinant of Development Density
Where there are waste treatment plants, the waste dilution capacity limitation on an individual site is removed. In the event a Sewage Treatment Plant (STP) offsets the waste load impact, available water supply becomes the environmentally limiting factor.
Safe sustained yield in drought conditions is the appropriate standard to use in estimating water use effects. Under this standard, aquifers in Sussex generally receive between eight and twenty inches of recharge per year. Recharge, over and above its use for human consumption, is critical

erenzio & Panaro, P.C.
91
to the health of streams, lakes, ponds, etc. Of the total recharge, no more than 20% is available for consumption, according to the New Jersey Geologic Survey.
Water supply is calculated on the basis of gallons per square mile rather than per acre. Under these circumstances, the most productive areas in the County may be expected to safely yield, on average, no more than 300 gallons of water per acre per day. Depending on the specific aquifer, a 100,000 square foot commercial facility would require thirty two to eighty acres to support its consumption. Although a particular aquifer may produce substantial quantities of water from some wells, much of the availability is based upon recharge from remote sites.
From the above, we may calculate the amount of water which may be taken from any given aqui-fer without a substantial adverse effect. Maps 2, 3 and 8, depict bedrock and surficial geology and aquifer recharge. These, taken together, form a picture of the capacity of the County to sup-port existing and future development. This has wide ranging implications. Existing develop-ment, other than that in the Town of Newton (served by Morris Lake), or Sussex Borough (served by Lake Rutherford) depends entirely on ground water resources. When the existing de-mand is allocated, the remainder becomes the available supply for all future growth. In some instances, the supply is impressively small. For example, the County of Burlington is in the process of carefully controlling the remaining six percent of water supply it calculates is avail-able for future development.
For a general idea of the water yielding capacity of the County, turn to Map 8, Groundwater Re-charge. The County is divided into two major areas, corresponding generally to the Highlands and the Ridge and Valley Province. The former includes approximately one-third of the County. For purposes of calculation, an annual average of ten inches of recharge is assigned to the High-lands and eighteen inches to the Valley and Ridge. Not only are the soils in the Highlands less able to accept recharge, but the severe topography limits the recharge of that which would be available.
Individual waste water discharges, if overly concentrated in an area, tend to generate a septic “plume”. This concentration of effluent may reach the ground water Figure before infiltrating precipitation dilutes it to an appropriate standard, degrading the resource and creating a potential hazard to public health.
Water supplies, on the other hand, are not parcel specific, being calculated in gallons per day per square mile. The calculations are not confined to the square mile in all aquifers as many, such as cavernous limestone and some of the glacial deposits, draw from a larger region. Here the wa-tershed is the appropriate area of delineation.
Using the non-residential criterion of 0.125 gallons per square foot, a 100,000 square foot facility would require 12,500 gallons per day. This amounts to 4,562,500 gallons per year. This would require 168 acres at one inch of recharge or 52 acres at an overall rate of sixteen inches per year (yielding 3.2 inches per acre per year for consumption). This information will be of interest in the review of the build-out calculations by municipality found farther along in this report.

erenzio & Panaro, P.C.
92
Water Quality
Recent work undertaken by the NJDEP in addressing pristine streams has yielded another, more stringent standard. In such a Category 1 watershed, nitrate concentrations are to be consistent with naturally occurring “background” levels. In this case, the level used for regulatory purposes is two milligrams per liter of nitrate. This change in input value reduces the resultant density substantially. Depending on the soil, the area required to adequately serve a residential lot or small non-residential facility could increase to between four and ten acres. The rationale for the two milligram value is that, at background levels, no other pollutants contributed by human ac-tivities are expected. The water thus reached is pristine. All this ties directly into the carrying capacity and build-out analysis. From a zoning perspective, the overall zoned density required to achieve these densities runs between 2.8 and 7.0 acres per unit.
With the 300 foot Category 1 stream buffer, some of the additional negative economic effects could be avoided by allowing density calculations to include land within that buffer, as with tran-sition areas and transferring those densities in a cluster development. By the same token, these credits could be transferred to a receiving area. If the buffer is located in a developed or desig-nated center, a waiver of the width, predicated on alternative means to accomplish the objectives, would be appropriate.
Highlands Water Quality Maintaining the high quality of Highlands' water is tremendously important, both for protecting New Jersey’s drinking water supply and for preserving the fragile ecosystems that depend on the water. Recent U.S. Geological Survey studies have concluded that some parameters of surface water quality concern in the area are improving while others are worsening. While the trend for am-monia, phosphorus and nitrogen is toward improvement, nitrate concentrations have increased. Degraded water quality trends were also noted for dissolved solids, sodium and chloride. The DEP conducts sampling of aquatic communities in the region as part of its Ambient Bio-monitoring Network (AMNET). The 1999 round of sampling found that 67 percent of the re-gion’s sites were not impaired, while 33 percent exhibited some impairment (although only one percent rated as severe). This is nearly the opposite of the remainder of the state where 67 per-cent show some degree of impairment. The impaired rivers in the region include the Whippany, Rockaway, Wallkill, Musconetcong, the upper reaches of the Pequannock, and the Pohatcong Creek. It is likely that the degradation is the result of a variety of factors that modify habitat or other environmental factors such as land use, point and non-point sources of pollution, and changes in stream flow – both higher and lower. Other studies have shown statistically that the percentage of urban land within a watershed in conjunction with the amount of upstream wastewater dis-charges correlates to the rate of impaired rivers in a watershed.
erenzio & Panaro, P.C.
93
The Highlands' water quality helps improve the quality of degraded downstream surface waters as well. For example, a major fraction of the main stem of the Passaic River is comprised of treated wastewater during drought. If not for less affected Highlands Region water, the main stem of the Passaic River would be comprised of an even larger overall percentage of treated wastewater during drought. As for ground water, the natural water quality of the Highlands region’s aquifers is generally good. Some wells exceed drinking water standards for naturally occurring substances such as manganese and iron. The one drinking water standard that is consistently a problem in High-lands' ground water is radon, which is a naturally occurring element in much of the rock forma-tions. Ninety percent of the 565 samples taken during one study in the Highlands exceeded the proposed standard for radon-222. Over time new development in the Highlands could affect the amount of water being withdrawn from reservoirs and aquifers, while at the same time reducing the flow of water in streams and rivers that is vital to aquatic ecosystems. New pavement and impervious surface cover will also decrease recharge of aquifers and increase runoff into surface water, leading to poor ground wa-ter quality and increased incidents of flooding. Degradation of the drinking water supply due to new development may eventually lead to a dra-matic increase in water costs for residents throughout northern New Jersey, not just those living in the Highlands region. The North Jersey District Water Supply Commission estimates that the Highlands water purveyors currently spend an estimated $14.3 million to treat 550 million gal-lons of water per day. Degradation of water quality will require the water purveyors to upgrade existing plants and purchase additional chemicals. The Commission estimates that if develop-ment continues without a change in policy, treatment costs will reach $30.3 billion by 2054. Moreover, costly investments for additional water sources and treatment plants will be necessary to supply increased demand. Implementation of a regional plan may offer the resident ratepayers a substantial savings in treatment costs, may eliminate the need for new water sources and treat-ment plants. Forests More than half of the Highlands region contains rich and diverse forests occupying 370,000 acres of land. Much of these forests remain in large, unfragmented pieces, some exceeding 5,000 acres in size. Most of the forestland is dominated by oak-hickory forest with northern hardwoods, hemlock, and swamp hardwoods. These forests contribute to the region's clean wa-ter and air, wildlife habitat, recreational resources, and serve as an excellent timber resource. The most current data from the USDA Forest Service in New York and New Jersey estimates that there are between 50,000 and 75,000 private forestland ownerships in the Highlands region. A majority of the forest is owned by private citizens and organizations with the remainder owned by public agencies. Most forestland ownerships are small with more than 50% of them smaller than 10 acres, and more than 90% smaller than 50 acres in size. Much of the private ownership is simply because it is part of an individual’s property for enjoyment of green space and wildlife. However, a significant amount is owned as a real estate investment. The publicly owned forest-

erenzio & Panaro, P.C.
94
lands are predominately owned to provide the general public with clean drinking water, recrea-tional opportunities, and to provide habitat for wildlife and rare species. The publicly owned lands are unlikely to be converted to other land uses. Whereas a majority of forestland is in private ownership, only 5,600 acres are enrolled in the USDA Forest Service’s Forest Stewardship Program, a preferential assessment program that gives landowners a reduced tax rate in exchange for their promise not to develop the land. The primary focus of the Program is the development of comprehensive, multi-resource management plans that provide landowners with the information they need to manage their forests for a vari-ety of products and services while maintaining forest health and vigor. Actively managed forests provide timber, wildlife habitat, watershed protection, recreational opportunities and many other benefits for landowners and society. Continued suburban development, and increased fragmentation of large contiguous forest tracts and land ownerships will result in fewer parcels of a size that is efficient for forestry manage-ment. Clearing of land will also affect water quality and critical habitat of the Highlands unique wildlife. As the Highlands core areas are now protected, nearly all the land not now developed will remain forested to replenish and purify groundwater and protect critical habitat.
It is essential that the County achieves a balance between the State Plan Center based develop-ment and the inevitable elimination of plant and wildlife habitat in those areas deemed appropri-ate for Center development. As nearly all of Sussex County, not only the Highlands, is consid-ered to be suitable for Federal or State threatened or endangered species of plants and animals, there is no way for the important benefits of reduced sprawl, stormwater runoff, loss of recharge, and fragmentation of habitat to be realized without environmental impact. That said, an appropriate mechanism is to provide that, where a center is proposed or expanded, there be no net loss of habitat “value”. As habitat value is a function of the area quality of exist-ing or resulting habitat, best management practices for agriculture, general open space and rec-reation facilities may be improved as a off-set to the gross loss of area of habitat caused by de-velopment. For instance, there are many areas of conservation easement, preserved open space and preserved farmland where management of the habitat quality is prohibited. As a conse-quence, multiflora rose, autumn olive, purple loostrife, barberry, thistle and other invasive spe-cies encroach and eventually overwhelm the land area. The open space values sought to be pre-served are thus destroyed. The character of the County is dependent on the retention and maintenance of open space and agriculture. Simply leaving land to revert to forest and failing to implement best agricultural management practices leads to degradation of the value of the land. This is a waste of the tax-payer dollars used to purchase the land or easement in the first place. It impairs the educational and open air experience of open space lands. In order to adequately address these important issues, all center/node based development propos-als should be conditioned upon the petitioner taking reasonable steps to secure the benefits of the transferred densities and consequent open space/preserved farmland as part of the overall plan

erenzio & Panaro, P.C.
95
for development. In the same vein, no proposal for open space acquisition should be without a feasible management plan.

erenzio & Panaro, P.C.
96

erenzio & Panaro, P.C.
97
APPENDIX D
LIST OF SOURCE DOCUMENTS

erenzio & Panaro, P.C.
98
MUNICIPALITY
SOURCE DOCUMENTS USED FOR COUNTY WMP UPDATE 2007
PROPERTY LOCATION
ANDOVER BOROUGH To correct sewer service boundary area: 1996 Andover Borough Municipal WMP
Municipality
BRANCHVILLE BOROUGH
Branchville WMP Amendment, Sept. 2006, prepared by Cerenzio & Panaro, DEP Approval on 1/17/07
Municipality
BYRAM TOWNSHIP MSA Plant Re-rating, allocation of 100,000
GPD for Byram Township (see “MSA”) Byram WMP Amendment (to reduce future sewer service area), May 2005, prepared by Cerenzio & Panaro
Municipality Municipality
FRANKFORD TOWNSHIP
Sussex County Homestead WMP Revision, January 2006, Cerenzio & Panaro DEP Approval on 9/11/06
Block 22 Lots 5 and 7C
GREEN TOWNSHIP Crossed Keys Inn WMP Amendment,
January 2005, prepared by PMK Group DEP Approval on 1/23/07
Block 22 Lot 2.02
HAMPTON TOWNSHIP WMP Amendment for Martin Property,
Hampton Twp., June 2007, prepared by Aqueonics Inc. DEP Approval pending with County WMP Update
Block 3501, Lots 30.01, 30.03- 30.10 and Block 3603 Lots 25.03-25.05, 25.10- 25.14
HARDYSTON TOWNSHIP
WMP Revision for 25,000 GPD Sewer Al-location Transfer (within Hardyston for YMCA), April 2003, prepared by Guerin & Vreeland Engineering, DEP Approval on 5/18/04 WMP Revision for 25,000 GPD Sewer Al-location Transfer from Sussex Borough to Hardyston Twp., September 2002, prepared by Guerin & Vreeland Engineering, DEP Approval on 2/7/03
Municipality Municipality

erenzio & Panaro, P.C.
99
HOPATCONG BOROUGH
MSA Plant Re-rating, allocation of 80,000 GPD for Hopatcong MSA Plant Expansion for Phase IIA, pro-vided total allocation of 580,000 GPD for Hopatcong (see “MSA”)
Municipality Municipality
LAFAYETTE TOWNSHIP
Lafayette Federated Church WMP Revision, November 2003, prepared by Cerenzio & Panaro, DEP Approval on 3/10/05 WMP Amendment for TMB Partners, La-fayette Twp., November 2002, prepared by Suburban Consulting Engineers, DEP Approval on 3/13/03
Block 18 Lot 10.02 Block 9 Lots 25 and 21.03
SPARTA TOWNSHIP WMP Amendment for Sparta Twp. (for
Newton Water Treatment Plant), May 2000, prepared by H. Pellow & Assoc. DEP Approval on 1/29/02 WMP Amendment for Lake Mohawk Golf Club, Sparta prepared by LAN Associates, DEP Approval in 2007 Hydrogeologic Technical Report for Blue Heron Project, Sparta, September 2000, pre-pared by Mid-Atlantic Geosciences, DEP Approval of WMP Revision and NJPDES Permit Modification, 7/19/05 WMP Amendment for Sparta Township, (for Sparta Commons), March 2004, pre-pared by Sparta Twp. Engineering, DEP Approval on 7/1/05
Block 7 Lot 15 Morris Lake Res-ervoir Block 80 Lots 1.01, 1.02 Block 127 Lot 6 “Sparta Com-mons”

erenzio & Panaro, P.C.
100
SUSSEX BOROUGH WMP Revision for 25,000 GPD Sewer Al-
location Transfer from Sussex Borough to Hardyston Twp., September 2002, prepared by Guerin & Vreeland Engineering, DEP Approval on 2/7/03
Municipality
VERNON TOWNSHIP Vernon Township WMP Amendment, Feb-
ruary 2003, prepared by Hatch Mott Mac-Donald, DEP Approval on 2/23/05 Letter from Vernon Twp. Health Director dated 7/23/07 with minor changes for future sewer service area
Municipality Various tax lots listed
WANTAGE TOWNSHIP Request for Map Correction, “Mountain View Manor at Wantage” project WMP Amendment for “Wantage Heights”, October 2006, prepared by Applied Water Management
Block 4 Lots 1.01, and 1.05 – 1.10 Block 11 Lots 6.02 and 7
SEWER AUTHORITY DOCUMENTS USED FOR COUNTY
WMP UPDATE 2007
Musconetcong Sewerage Au-thority (MSA) Wastewater Management Plan
MSA Plan Revision for Re-rating of Plant Flow and Discharge Allocation Certificate dated February 2000, prepared by Lee T. Purcell Associates Re-rating for 180,000 GPD flow, addi-tional allocation for Byram and Hopat-cong, DEP Approval on 1/29/02 MSA Plant Expansion for Phase IIA, ad-ditional 500,000 GPD plant capacity, DEP Approval on 1/23/03
erenzio & Panaro, P.C.
101
APPENDIX E
SUMMARY OF
WASTEWATER TREATMENT FACILITIES