Susceptibility Potential Surface for Phytophthora alni ssp ... · PDF fileUnited States in 1...
34
Page 1 of 34 Susceptibility Potential Surface for Phytophthora alni ssp alni Data format: Raster Dataset - ESRI GRID File or table name: Susceptibility Coordinate system: Albers Conical Equal Area Theme keywords Forest Pathogen, Forest Pest, Exotic, Invasive Species, Phytophthora alni, Phytophthora alni ssp alni, Alder pathogen, , P. alni, Susceptibility Potential Abstract: The Susceptibility Potential Surface for Phytophthora alni ssp alni was produced for the conterminous United States in 1 square kilometer (km²) units by the U.S. Forest Service, Forest Health Technology Enterprise Team’s (FHTET) Invasive Species Steering Committee. FGDC and ESRI Metadata: • Identification Information • Data Quality Information • Spatial Data Organization Information • Spatial Reference Information • Entity and Attribute Information • Distribution Information • Metadata Reference Information Metadata elements shown with blue text are defined in the Federal Geographic Data Committee's (FGDC) Content Standard for Digital Geospatial Metadata (CSDGM) . Elements shown with green text are defined in the ESRI Profile of the CSDGM. Elements shown with a green asterisk (*) will be automatically updated by ArcCatalog. ArcCatalog adds hints indicating which FGDC elements are mandatory; these are shown with gray text. Identification Information: Citation: Citation information: Originators: Forest Health Technology Team (FHTET) USDA Forest Service Title: Susceptibility Potential Surface for Phytophthora alni ssp alni *File or table name: suscept1 (GRID) *File or table name: p_alni_estab.mdx Tool name: p_alni Model Name: suscept Publication date: 9/28/2007 *Geospatial data presentation form: raster digital data
Transcript of Susceptibility Potential Surface for Phytophthora alni ssp ... · PDF fileUnited States in 1...

Page 1 of 34
Susceptibility Potential Surface for Phytophthora alni ssp alni
Data format: Raster Dataset - ESRI GRID
File or table name: Susceptibility
Coordinate system: Albers Conical Equal Area
Theme keywords Forest Pathogen, Forest Pest, Exotic, Invasive Species, Phytophthora alni, Phytophthora alni ssp alni, Alder pathogen, , P. alni, Susceptibility Potential
Abstract: The Susceptibility Potential Surface for Phytophthora alni ssp alni was produced for the conterminous United States in 1 square kilometer (km²) units by the U.S. Forest Service, Forest Health Technology Enterprise Team’s (FHTET) Invasive Species Steering Committee.
FGDC and ESRI Metadata:
• Identification Information • Data Quality Information • Spatial Data Organization Information • Spatial Reference Information • Entity and Attribute Information • Distribution Information • Metadata Reference Information
Metadata elements shown with blue text are defined in the Federal Geographic Data Committee's (FGDC) Content Standard for Digital Geospatial Metadata (CSDGM). Elements shown with green text are defined in the ESRI Profile of the CSDGM. Elements shown with a green asterisk (*) will be automatically updated by ArcCatalog. ArcCatalog adds hints indicating which FGDC elements are mandatory; these are shown with gray text.
Identification Information:
Citation: Citation information: Originators: Forest Health Technology Team (FHTET) USDA Forest Service
Title: Susceptibility Potential Surface for Phytophthora alni ssp alni *File or table name: suscept1 (GRID) *File or table name: p_alni_estab.mdx Tool name: p_alni
Model Name: suscept
Publication date: 9/28/2007 *Geospatial data presentation form: raster digital data

Page 2 of 34 Series information: Series name: Version 2.0 Issue identification: 9/28/2007 Publication information: Publication place: Fort Collins, Colorado Publisher: Marla C. Downing Online linkage: http://www.fs.fed.us/foresthealth/technology/invasives_phytophthoraalni_riskmaps.shtml Larger work citation: Citation information: Originators: Forest Health Technology Enterprise Team (FHTET) USDA Forest Service
Title: Susceptibility Potential Surface for Phytophthora alni ssp alni
Publication date: 9/28/2007 Edition: 2.0 Geospatial data presentation form: map
Online linkage: http://www.fs.fed.us/foresthealth/technology/invasives_phytophthoraalni_riskmaps.shtml
Description The Susceptibility Potential Surface for Phytophthora alni ssp alni (PAA) was produced for the conterminous United States in 1 square kilometer (km²) units by the U.S. Forest Service, Forest Health Technology Enterprise Team’s (FHTET) Invasive Species Steering Committee. The product’s intended use is to develop a detection strategy for PAA. The Susceptibility Potential Surface was produced by combining the PAA Establishment and Introduction Potential Surfaces in a final equal weighted overlay. Supporting information for this product was taken from Exotic Forest Pest (ExFor) website (http://www.spfnic.fs.fed.us/exfor/data/pestreports.cfm?pestidval=28&langdisplay=english). The datasets used in the Introduction and Establishment can be seen below. Website URL: http://www.fs.fed.us/foresthealth/technology/invasives_phytophthoraalni_riskmaps.shtml
Establishment The Establishment Potential Surface for Phytophthora alni ssp alni (PAA) was produced for the Conterminous United States (CUS) in 1-square-kilometer (km2) units by the U.S. Forest Service, Forest Health Technology Enterprise Team's (FHTET) Invasive Species Steering Committee (Table 1). The product’s intended use in conjunction with the Introduction Potential Surface is to develop a Susceptibility Potential Surface for PAA. Supporting information was taken from Exotic Forest Pest (ExFor) website (http://www.spfnic.fs.fed.us/exfor/data/pestreports.cfm?pestidval=28&langdisplay=english). Three primary datasets were used as variables in the analysis: alder host, flood-prone areas, and slopes less than 11 percent. The output values range from 0 to 10 with 10 having the highest establishment potential. These data were then grouped into four classes: 1) Little or No, 2) Low, 3) Medium, and 4) High potential for establishment. The process began by creating a presence/absence surface of alder host using modeling techniques. Then, the modeled alder host data was filtered for slopes less than 11 percent. Finally, the alder host was attributed with values from 0 to 10 according to

Page 3 of 34 flood-prone areas. The Forestry Inventory and Analysis (FIA) alder data was not filtered for slopes less than 11 percent. Purpose: The product’s intended use in conjunction with the Introduction Potential Surface is to develop a Susceptibility Potential Surface for PAA. Supplemental information: Alder host. Source dataset at FHTET, Fort Collins, Colorado. The combination of the USDA Plants Herbarium data that are coincident with perennial streams plus the FIA alder data were used to create the final alder host surface.
Herbarium Data. Source: Plants database by the USDA. Depicts counties that contain Alnus species. These counties provided the basis for the Alnus – Alder Range map. In addition, assumptions were made to include counties in the Alder Range Surface that were reported as not having alder present, but were surrounded by counties that did have alder present. For a list of additional counties see Appendix I.
FIA Alder. Source: US Forest Service FIA alder distribution data. Perennial Streams. Source: Environmental Systems Research Institute (ESRI). A subset of the data set named ‘dtl_riv’ for perennial streams was used (Appendix II). These data were then converted to 1 km2 GRID cells.
Flood-Prone Areas. Source: FHTET, Fort Collins, Colorado. Six data sets were used: 1) Soil Dryness Index (Schaetzl et al. 1986), 2) aspect, 3) curvature, 4) slope, 5) topographic position, and 6) solar radiation. A logistic regression equation was created using 3,130 sample points dictated by the presence of a freshwater wetland polygon as defined by the National Wetlands Inventory (NWI). These NWI polygons were stratified by 16 map zones as defined by the United States Geological Survey (USGS). Cell values were collected at these sample point locations from six spatial data sets (listed above). The data values from these spatial data sets were used to create a *logistic regression equation designed to predict flood-prone areas throughout the entire lower 48 states of The United States at a scale of one-kilometer squared. Values range from 0 to 10, with 0 = Little or no Flooding and 10 = High Flooding potential.
Spatial Data Sets used in the logistic regression equation 1. Soil Dryness Index ** (DI) (Values from 0 – 100) 2. Aspect *** (ASP) = ((cos θ) + 1) *1000 (Note that θ is the Aspect angle in degrees using an azimuths
scale) 3. Curvature **** (CUR) (negative values = Concave areas; positive values = Convex areas; and zero values
= flat areas.) All values were multiplied by 1000. 4. Slope (SLO) (in degrees multiplied by 1000) 5. Topographic Position***** (TPO) (relative slope position on a continuous scale, lower values are at the
bottom of the slope and larger values are near mountain tops) 6. Solar Radiation****** (SRA) ((watts/m²) * 1000)
*Logistic Regression Equation:
/ 1 +
Kappa = 0.575 Ability to predict a wetland (Assumption that 0.5 is a threshold value):

Page 4 of 34 77.4% wetland 80.3% non-wetland
**Soil Dryness (DI) (Schaetzl et al.) used data from the Natural Resources Conservation Service (NRCS) Soil Survery Geographic Database (SSURGO). This resulted in a DI at a spatial resolution of 30 meters by 30 meters partitioned by State. Where SSURGO data were missing, we used data from the NRCS State Soil Geographic (STATSGO) data to fill in the data gaps. A DI was created by Schaetzl et al. for the STATSGO data using the same scale and parameters with respect to the SSURGO DI. The SSURGO DI data were resampled to 1000 meter by 1000 meter cell size using the “Aggregrate” command in Arc/INFO ver 9.2 with the median option. The STATSGO data DI were rasterized to 1000 by 1000 meter cell size. All the state data were assembled into a single DI data set at 1000 meter resolution for the lower 48 states. To determine the DI of a soil, you must know one or two facts about it: (1) its taxonomic subgroup, e.g., Typic Hapludalf, or Vitrandic Torripsamment, (2) the slope class within which it is mapped, e.g., 0-2% slopes, or 12-18% slopes. Slope class is an optional entry.
References
Schaetzl, R.J. 1986. A soilscape analysis of contrasting glacial terrains in Wisconsin. Annals Assoc. Am. Geogs. 76:414-425. http://www.drainageindex.msu.edu/ See Appendix III for more details on DI.
*** Aspect
Reference
Beers, T. W., P. E. Dress, and L. C. Wensel. 1966. Aspect transformation in site productivity research. J. Forest. 64: 691-692.
**** Curvature
The follow text are from the help files from Environmental Systems Research Institute (ESRI) ArcGIS ver 9.2 help file from the topic listed above.
The curvature of a surface is calculated on a cell-by-cell basis. For each cell, a fourth-order polynomial of the form: Z = Ax²y² + Bx²y + Cxy² + Dx² + Ey² + Fxy + Gx + Hy + I is fit to a surface composed of a 3 x 3 window. The coefficients a, b, c, and so on, are calculated from this surface. The relationships between the coefficients and the nine values of elevation for every cell numbered as shown on the diagram are as follows:
A = [(Z1 + Z3 + Z7 + Z9) / 4 - (Z2 + Z4 + Z6 + Z8) / 2 + Z5] / L4 B = [(Z1 + Z3 - Z7 - Z9) /4 - (Z2 - Z8) /2] / L3 C = [(-Z1 + Z3 - Z7 + Z9) /4 + (Z4 - Z6)] /2] / L3 D = [(Z4 + Z6) /2 - Z5] / L2 E = [(Z2 + Z8) /2 - Z5] / L2 F = (-Z1 + Z3 + Z7 - Z9) / 4L2
Page 5 of 34 G = (-Z4 + Z6) / 2L H = (Z2 - Z8) / 2L I = Z5
The output of the Curvature tool is the second derivative of the surface—for example, the slope of the slope—such that:
Curvature = -2(D + E) * 100
From an applied viewpoint, the output of the Curvature tool can be used to describe the physical characteristics of a drainage basin in an effort to understand erosion and runoff processes. The slope affects the overall rate of movement downslope. Aspect defines the direction of flow. The profile curvature affects the acceleration and deceleration of flow and, therefore, influences erosion and deposition. The planform curvature influences convergence and divergence of flow.
References
Moore, I.D., R. B. Grayson, and A. R. Landson. 1991. Digital Terrain Modelling: A Review of Hydrological, Geomorphological, and Biological Applications. Hydrological Processes 5: 3–30. Zeverbergen, L. W., and C. R. Thorne. 1987. Quantitative Analysis of Land Surface Topography. Earth Surface Processes and Landforms 12: 47–56.
*****Topographic Position Purpose: This AML generates a hierarchically scaled assessment of topographic position, based on relative differences be- tween actual pixel elevation and mean local elevation at different spatial scales (search windows). Usage: &r toposcale ------------------------------------------------------------------------
- Notes: Keep in mind that this procedure is relatively slow. When large search windows are submitted, the program gets in-
creasingly slow. ------------------------------------------------------------------------
- Input: DEM Output: unsmoothed and smoothed, hierarchically scaled topographic exposure maps [<outfile>, and <outfile>s] ------------------------------------------------------------------------
- History: Niklaus E Zimmermann - 9/18/1997 - Original coding Niklaus E Zimmermann - 4/14/1999 - Improved user interface
******Solar radiation calculation or Global Radiation

Page 6 of 34 The following text are from the help files from Environmental Systems Research Institute (ESRI) ArcGIS ver 9.2 help file from the topic listed above. The solar radiation analysis tools calculate insolation across a landscape or for specific locations, based on methods from the hemispherical viewshed algorithm developed by Rich et al. (Rich 1990, Rich et al. 1994), as further developed by Fu and Rich (2000, 2002). The total amount of radiation calculated for a particular location or area is given as global radiation. The calculation of direct, diffuse, and global insolation are repeated for each feature location or every location on the topographic surface producing insolation maps for an entire geographic area.
Global radiation (Globaltot) is calculated as the sum of direct (Dirtot) and diffuse (Diftot) radiation of all sunmap and skymap sectors, respectively.
Globaltot = Dirtot + Diftot
Direct radiation calculation
Total direct insolation (Dirtot) for a given location is the sum of the direct insolation (Dirθ,α) from all sunmap sectors:
Dirtot = ΣDirθ,α (1)
The direct insolation from the sunmap sector (Dirθ,α) with a centroid at zenith angle (θ) and azimuth angle (α) is calculated using the following equation:
Dirθ,α = SConst * βm(θ)* SunDurθ,α * SunGapθ,α * cos(AngInθ,α) (2)
where: SConst is the solar flux outside the atmosphere at the mean earth-sun distance, known as solar constant. The solar constant used in the analysis is 1367 WM-2. This is consistent with the World Radiation Center (WRC) solar constant. β is transmisivity of the atmosphere (averaged over all wavelengths) for the shortest path (in the direction of the zenith); m(θ) is the relative optical path length, measured as a proportion relative to the zenith path length (see equation 3 below). SunDurθ,α is the time duration represented by the sky sector. For most sectors, it is equal to the day interval (for example, a month) multiplied by the hour interval (for example, a half hour). For partial sectors (near the horizon), the duration is calculated using spherical geometry; SunGapθ,α is the gap fraction for the sunmap sector; AngInθ,α is the angle of incidence between the centroid of the sky sector and the axis normal to the surface (see equation 4 below). Relative optical length (m(θ)) is determined by the solar zenith angle and elevation above sea level. For zenith angles less than 80o, it can be calculated using the following equation:
m(θ) = EXP(-0. 000118 * Elev - 1. 638 * 10-9 * Elev2) /cos(θ) (3)
where: θ is the solar zenith angle; Elev is elevation above sea level in meters. The effect of surface orientation is taken into account by multiplying by the cosine of the angle of incidence. Angle of incidence (AngInSkyθ,α) between the intercepting surface and a given sky sector with a centroid at zenith angle and azimuth angle is calculated using the following equation:
AngInθ,α= acos[Cos(θ)*Cos(Gz)+Sin(θ)*Sin(Gz)*Cos(α-Ga)] (4)

Page 7 of 34 where: Gz is the surface zenith angle; Ga is the surface azimuth angle. (For zenith angles greater than 80° refraction is important).
Diffuse radiation calculation
For each sky sector, the diffuse radiation at its centroid (Dif) is calculated, integrated over the time interval, and corrected by the gap fraction and angle of incidence using the following equation:
Difnθ,α = Rglb * Pdif * Dur * SkyGapθ,α * Weightθ,α * cos(AngInθ,α) (5)
where: Rglb is the global normal radiation (see equation 6 below); Pdif is the proportion of global normal radiation flux that is diffused. Typically it is approximately 0.2 for very clear sky conditions and 0. 7 for very cloudy sky conditions; Dur is the time interval for analysis; SkyGapθ,α is the gap fraction (proportion of visible sky) for the sky sector; Weightθ,α is the proportion of diffuse radiation originating in a given sky sector relative to all sectors (see equation 7 and 8 below); AngInθ,α is the angle of incidence between the centroid of the sky sector and the intercepting surface. The global normal radiation (Rglb) can be calculated by summing the direct radiation from every sector (including obstructed sectors) without correction for angle of incidence, then correcting for proportion of direct radiation, which equals to 1- Pdif:
Rglb = (SConst Σ(βm(θ)))/ (1 - Pdif) (6)
For the uniform sky diffuse model, Weightθ,α is calculated as follows: Weightθ,α = (cosθ2- cos θ1) / Divazi (7)
where: θ1 and θ2 are the bounding zenith angles of the sky sector; Divazi is the number of azimuthal divisions in the skymap. For the standard overcast sky model, Weightθ,α is calculated as follows: Weightθ,α = (2cosθ2+ cos2θ2- 2cosθ1- cos2θ1) / 4 * Divazi (8) Total diffuse solar radiation for the location (Diftot) is calculated as the sum of the diffuse solar radiation (Dif) from all the skymap sectors: Diftot = ΣDifθ,α (9)
Reference
Fu, P. 2000. A geometric solar radiation model with applications in Landscape ecology. PhD. Thesis, Department of Geography, University of Kansas, Lawrence Kansas, USA. Fu, P. and P.M. Rich. 2000. The Solar Analyst 1.0 Manual. Helios Environmental Modeling Institute (HEMI), USA. Fu, P., and P.M. Rich. 2002. A geometric solar radiation model with applications in agriculture and forestry. Computers and Electronics in Agriculture 37:25-35. Rich, P.M., R. Dubayah, W.A. Hetrick, and S.C. Saving. 1994. Using Viewshed models to calculate intercepted solar radiation: applications in ecology. American Society for Photogrammetry and Remote Sensing Technical Papers, pp 524-529.
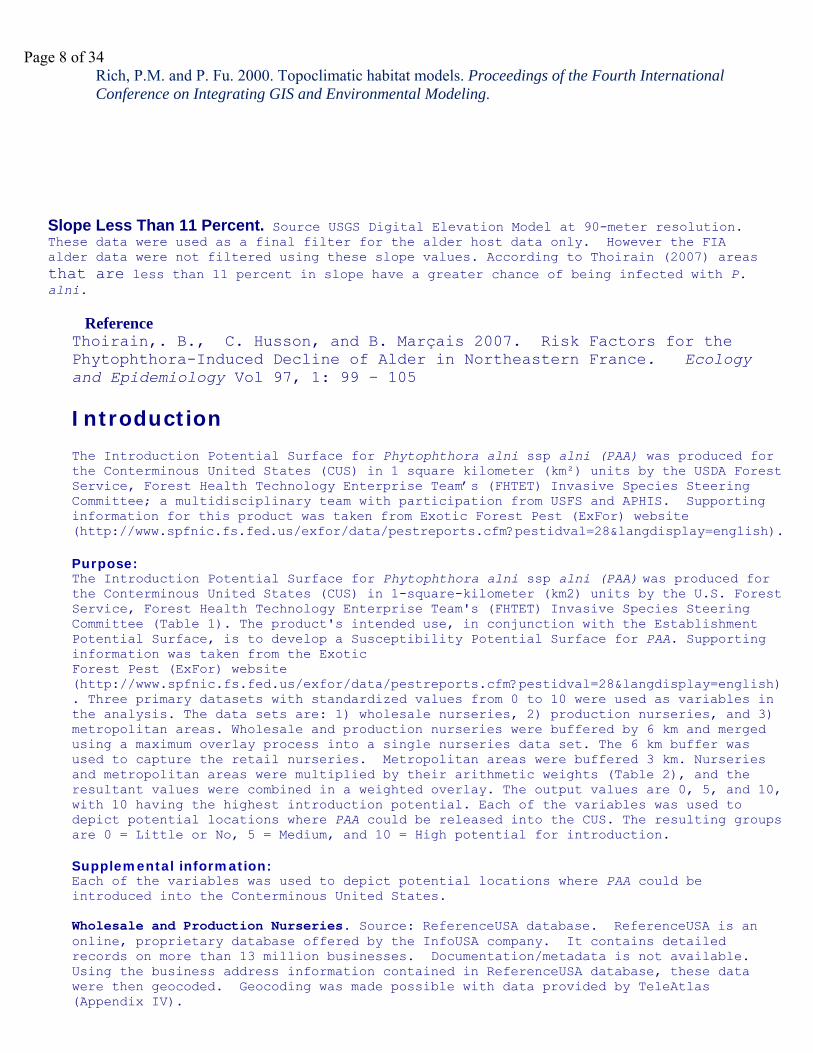
Page 8 of 34 Rich, P.M. and P. Fu. 2000. Topoclimatic habitat models. Proceedings of the Fourth International Conference on Integrating GIS and Environmental Modeling.
Slope Less Than 11 Percent. Source USGS Digital Elevation Model at 90-meter resolution. These data were used as a final filter for the alder host data only. However the FIA alder data were not filtered using these slope values. According to Thoirain (2007) areas that are less than 11 percent in slope have a greater chance of being infected with P. alni.
Reference
Thoirain,. B., C. Husson, and B. Marçais 2007. Risk Factors for the Phytophthora-Induced Decline of Alder in Northeastern France. Ecology and Epidemiology Vol 97, 1: 99 – 105
Introduction The Introduction Potential Surface for Phytophthora alni ssp alni (PAA) was produced for the Conterminous United States (CUS) in 1 square kilometer (km²) units by the USDA Forest Service, Forest Health Technology Enterprise Team’s (FHTET) Invasive Species Steering Committee; a multidisciplinary team with participation from USFS and APHIS. Supporting information for this product was taken from Exotic Forest Pest (ExFor) website (http://www.spfnic.fs.fed.us/exfor/data/pestreports.cfm?pestidval=28&langdisplay=english).
Purpose: The Introduction Potential Surface for Phytophthora alni ssp alni (PAA) was produced for the Conterminous United States (CUS) in 1-square-kilometer (km2) units by the U.S. Forest Service, Forest Health Technology Enterprise Team's (FHTET) Invasive Species Steering Committee (Table 1). The product's intended use, in conjunction with the Establishment Potential Surface, is to develop a Susceptibility Potential Surface for PAA. Supporting information was taken from the Exotic Forest Pest (ExFor) website (http://www.spfnic.fs.fed.us/exfor/data/pestreports.cfm?pestidval=28&langdisplay=english). Three primary datasets with standardized values from 0 to 10 were used as variables in the analysis. The data sets are: 1) wholesale nurseries, 2) production nurseries, and 3) metropolitan areas. Wholesale and production nurseries were buffered by 6 km and merged using a maximum overlay process into a single nurseries data set. The 6 km buffer was used to capture the retail nurseries. Metropolitan areas were buffered 3 km. Nurseries and metropolitan areas were multiplied by their arithmetic weights (Table 2), and the resultant values were combined in a weighted overlay. The output values are 0, 5, and 10, with 10 having the highest introduction potential. Each of the variables was used to depict potential locations where PAA could be released into the CUS. The resulting groups are 0 = Little or No, 5 = Medium, and 10 = High potential for introduction. Supplemental information: Each of the variables was used to depict potential locations where PAA could be introduced into the Conterminous United States. Wholesale and Production Nurseries. Source: ReferenceUSA database. ReferenceUSA is an online, proprietary database offered by the InfoUSA company. It contains detailed records on more than 13 million businesses. Documentation/metadata is not available. Using the business address information contained in ReferenceUSA database, these data were then geocoded. Geocoding was made possible with data provided by TeleAtlas (Appendix IV).

Page 9 of 34 Metropolitan Areas. Source: Environmental Research Institute (ESRI) in Redlands, California, World at Night (*Imhoff et al. 1997) represents a nighttime view of the Earth produced by mosaicking Defense Meteorological Satellite Program (DMSP) Operational Linescan System (OLS) satellite images. This system was originally designed to view clouds by moonlight and to map the locations of permanent lights on the Earth's surface. These data are derived from nine months of observations superimposed on a darkened land surface. ESRI georeferenced these data to a real-world coordinate system.
Table 1 Steering Committee Marla C. Downing, FHTET Lead Daniel M. Borchert, APHIS PPQ Kerry Britton USFS Research Frank H. Koch, USFS SRS Frank J. Krist Jr., USFS FHTET Frank J. Sapio, USFS FHTET Bill D. Smith, USFS SRS Borys M. Tkacz, USFS FHP Robert C. Venette USFS NRS Contractor Support Michael F. Tuffly Information Technology Experts, INC (ITX)
Table 2 Introduction Variables and Arithmetic Weights Variables Weight
Nurseries 50% Metropolitan areas 50%
References
*Imhoff M. L., Lawrence, W. T., Stutzer, C.S., and Elvidge, C.D., 1997. Remote Sensing and Environ 61:361-379
Susceptibility potential related to the product of: 1. Establishment Potential 2. Introduction Potential
Spatial Data Organization Information:
*Direct spatial reference method: Raster
Raster object information: *Image format: ESRI GRID *Number of bands: 1
*Row count: 3080 *Column count: 5047 *Vertical count: 1
Page 10 of 34
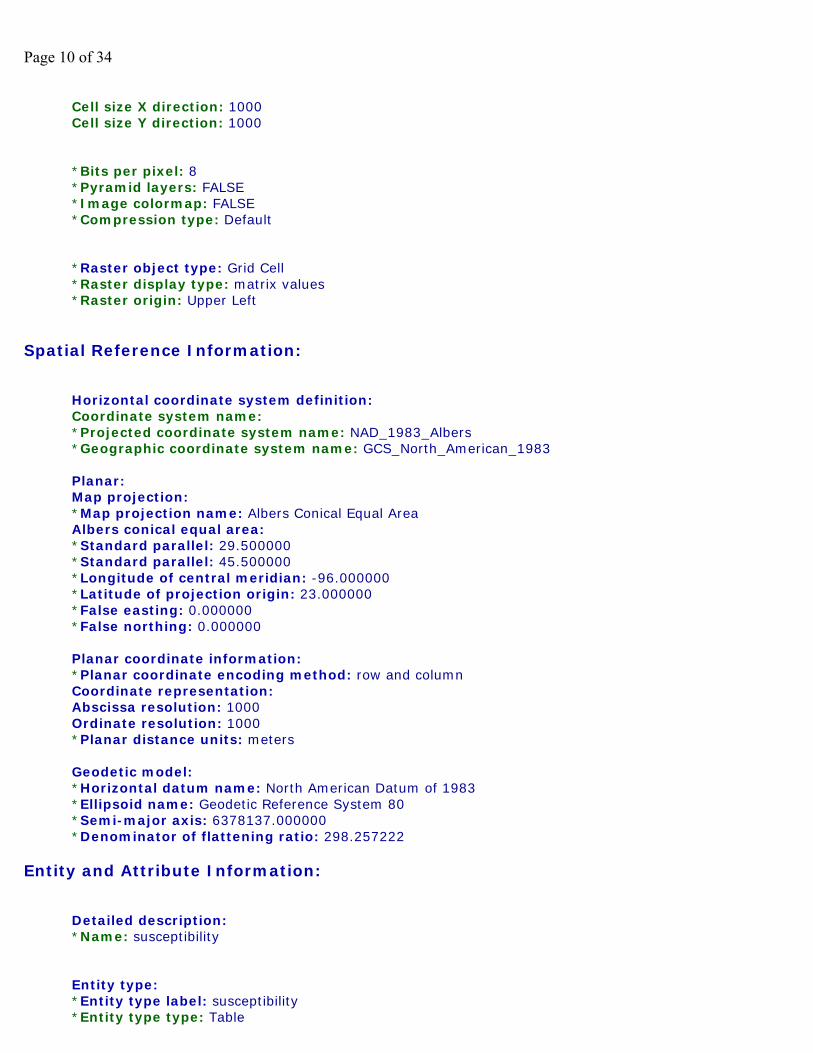
Cell size X direction: 1000 Cell size Y direction: 1000
*Bits per pixel: 8 *Pyramid layers: FALSE *Image colormap: FALSE *Compression type: Default
*Raster object type: Grid Cell *Raster display type: matrix values *Raster origin: Upper Left
Spatial Reference Information:
Horizontal coordinate system definition: Coordinate system name: *Projected coordinate system name: NAD_1983_Albers *Geographic coordinate system name: GCS_North_American_1983 Planar: Map projection: *Map projection name: Albers Conical Equal Area Albers conical equal area: *Standard parallel: 29.500000 *Standard parallel: 45.500000 *Longitude of central meridian: -96.000000 *Latitude of projection origin: 23.000000 *False easting: 0.000000 *False northing: 0.000000 Planar coordinate information: *Planar coordinate encoding method: row and column Coordinate representation: Abscissa resolution: 1000 Ordinate resolution: 1000 *Planar distance units: meters Geodetic model: *Horizontal datum name: North American Datum of 1983 *Ellipsoid name: Geodetic Reference System 80 *Semi-major axis: 6378137.000000 *Denominator of flattening ratio: 298.257222
Entity and Attribute Information:
Detailed description: *Name: susceptibility
Entity type: *Entity type label: susceptibility *Entity type type: Table
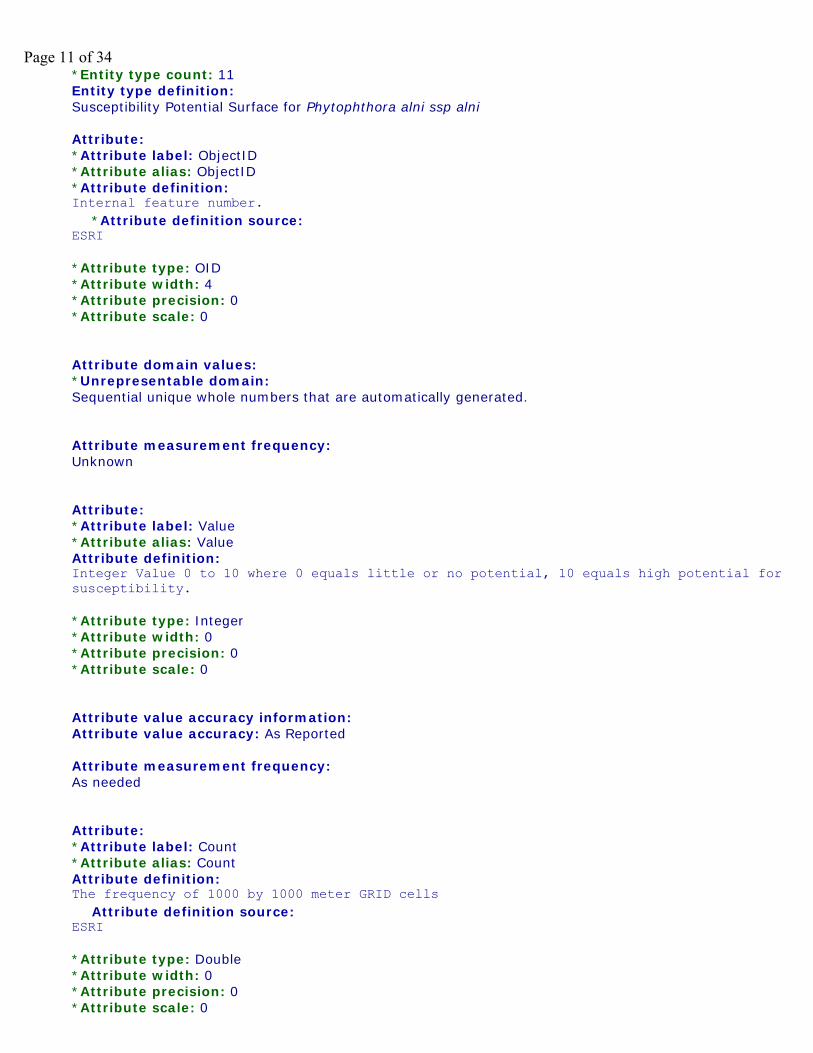
Page 11 of 34 *Entity type count: 11 Entity type definition: Susceptibility Potential Surface for Phytophthora alni ssp alni Attribute: *Attribute label: ObjectID *Attribute alias: ObjectID *Attribute definition: Internal feature number.
*Attribute definition source: ESRI
*Attribute type: OID *Attribute width: 4 *Attribute precision: 0 *Attribute scale: 0
Attribute domain values: *Unrepresentable domain: Sequential unique whole numbers that are automatically generated.
Attribute measurement frequency: Unknown
Attribute: *Attribute label: Value *Attribute alias: Value Attribute definition: Integer Value 0 to 10 where 0 equals little or no potential, 10 equals high potential for susceptibility.
*Attribute type: Integer *Attribute width: 0 *Attribute precision: 0 *Attribute scale: 0
Attribute value accuracy information: Attribute value accuracy: As Reported Attribute measurement frequency: As needed
Attribute: *Attribute label: Count *Attribute alias: Count Attribute definition: The frequency of 1000 by 1000 meter GRID cells
Attribute definition source: ESRI
*Attribute type: Double *Attribute width: 0 *Attribute precision: 0 *Attribute scale: 0

Page 12 of 34
Attribute measurement frequency: As needed
Back to Top
Distribution Information:
Resource description: Downloadable Data
Standard order process: Digital form: Digital transfer information: *Transfer size: 14.82 MB *Dataset size: 14.82 MB
Back to Top
Metadata Reference Information:
*Metadata date: 20070928 Metadata review date: 20070928 *Language of metadata: en
Metadata contact: Contact information: Contact organization primary: Contact person: Marla C. Downing Contact organization: Forest Health Technology Enterprise Team (FHTET) USDA Forest Service Contact position: FHTET, Lead and Biological Scientist
Contact address: Address type: mailing and physical address Address: 2150 Centre Avenue, Bldg A, Suite 331
City: Fort Collins State or province: Colorado Postal code: 80526-1891 Country: USA Contact voice telephone: 970-295-5843
Contact electronic mail address: [email protected]
Hours of service: 9:00 AM - 5:00 PM MT
*Metadata standard name: FGDC Content Standards for Digital Geospatial Metadata *Metadata standard version: FGDC-STD-001-1998

Page 13 of 34 *Metadata time convention: local time
Metadata security information: Metadata security classification: Unclassified Metadata extensions: *Online linkage: http://www.esri.com/metadata/esriprof80.html *Profile name: ESRI Metadata Profile
Language of dataset: en
Time period of content: Time period information: Single date/time: Calendar date: 9/28/2007 Currentness reference: publication date
Status: Progress: Planned Maintenance and update frequency: As needed Spatial domain: Bounding coordinates: *West bounding coordinate: -128.011472 *East bounding coordinate: -51.920726 *North bounding coordinate: 51.656290 *South bounding coordinate: 17.299188 Local bounding coordinates: *Left bounding coordinate: -2549760.64354 *Right bounding coordinate: 2497239.35646 *Top bounding coordinate: 3267052.87047 *Bottom bounding coordinate: 187052.870471 Keywords: Theme: Theme keywords: Forest Pathogen, Forest Pest, Exotic, Invasive Species, Phytophthora alni ssp alni, Alder pathogen, Phytophthora alni, P. alni, Susceptibility Potential. Place: Place keywords: Conterminous United States Place keyword thesaurus: Lower 48 States Access constraints: None Use constraints: None
Point of contact: Contact information: Contact organization primary: Contact person: Marla C. Downing Contact organization: Forest Health Technology Enterprise Team (FHTET) Forest Health Protection Contact position: FHTET Lead, Biological Scientist

Page 14 of 34
Contact address: Address type: mailing and physical address Address: 2150 Centre Avenue, Bldg A, Suite 331
City: Fort Collins State or province: Colorado Postal code: 80526-1891 Country: USA Contact voice telephone: 970-295-5843
Contact electronic mail address: [email protected]
Hours of service: 9:00 AM - 5:00 PM MT
Data set credit: Michael F. Tuffly, Information Technology Experts, INC (ITX) Steering Committee: Marla C. Downing, FHTET Lead Daniel M. Borchert, APHIS PPQ Kerry Britton USFS Research Frank H. Koch, USFS SRS Frank J. Krist Jr., USFS FHTET Frank J. Sapio, USFS FHTET Bill D. Smith, USFS SRS Borys M. Tkacz, USFS FHP Robert C. Venette USFS NRS
Security information: Security classification: Unclassified *Native dataset format: Raster Dataset *Native data set environment: Microsoft Windows XP Version 5.1 (Build 2600) Service Pack 2; ESRI ArcCatalog 9.1.0.722
Cross reference: Citation information: Originators: Forest Health Technology Enterprise Team (FHTET) USDA Forest Service
Title: Susceptibility Potential Surface for Phytophthora alni ssp alni
Publication date: 9/28/2007 Edition: 2.0 Geospatial data presentation form: map *File or table name: estab (GRID) *File or table name: p_alni_estab.mdx Tool name: p_alni
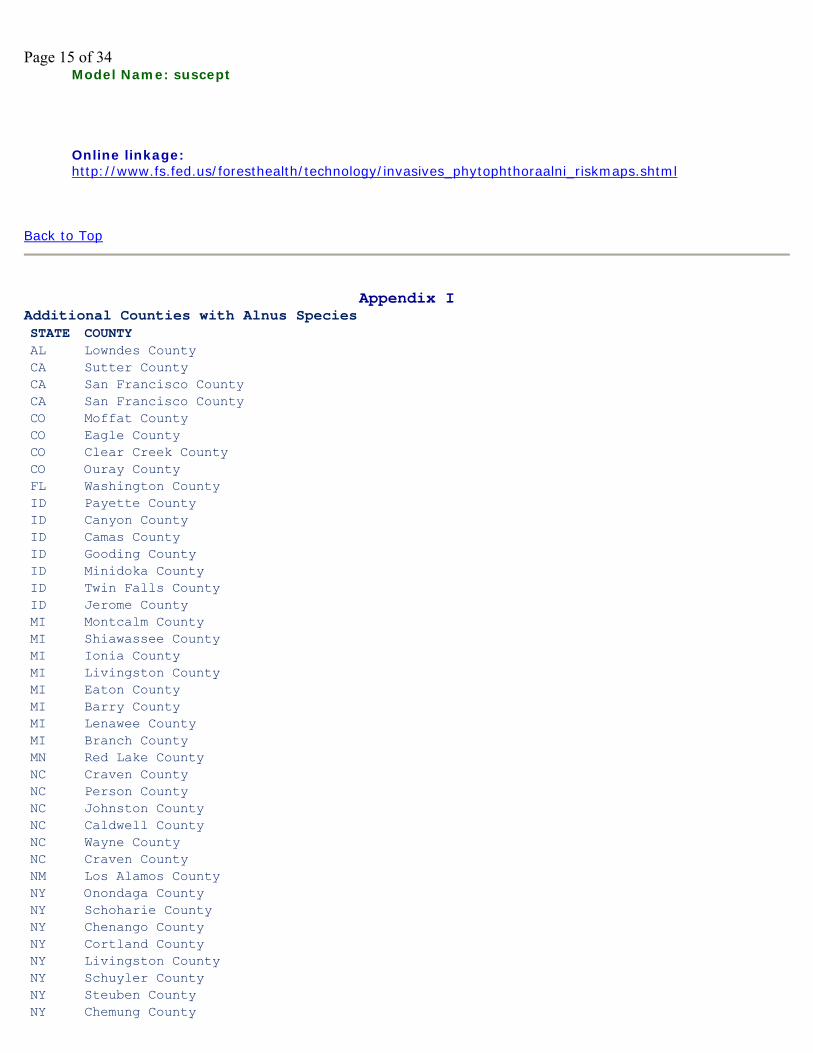
Page 15 of 34 Model Name: suscept
Online linkage: http://www.fs.fed.us/foresthealth/technology/invasives_phytophthoraalni_riskmaps.shtml
Back to Top
Appendix I Additional Counties with Alnus Species STATE COUNTY AL Lowndes County CA Sutter County CA San Francisco County CA San Francisco County CO Moffat County CO Eagle County CO Clear Creek County CO Ouray County FL Washington County ID Payette County ID Canyon County ID Camas County ID Gooding County ID Minidoka County ID Twin Falls County ID Jerome County MI Montcalm County MI Shiawassee County MI Ionia County MI Livingston County MI Eaton County MI Barry County MI Lenawee County MI Branch County MN Red Lake County NC Craven County NC Person County NC Johnston County NC Caldwell County NC Wayne County NC Craven County NM Los Alamos County NY Onondaga County NY Schoharie County NY Chenango County NY Cortland County NY Livingston County NY Schuyler County NY Steuben County NY Chemung County

Page 16 of 34 SC Saluda County UT Rich County VA Danville City WA Kitsap County WV Jefferson County WV Pendleton County WY Sublette County WY Sweetwater County
Appendix II
FGDC and ESRI Metadata:
• Identification Information • Data Quality Information • Spatial Data Organization Information • Spatial Reference Information • Entity and Attribute Information • Distribution Information • Metadata Reference Information • Geoprocessing History • Binary Enclosures
Metadata elements shown with blue text are defined in the Federal Geographic Data Committee's (FGDC) Content Standard for Digital Geospatial Metadata (CSDGM). Elements shown with green text are defined in the ESRI Profile of the CSDGM. Elements shown with a green asterisk (*) will be automatically updated by ArcCatalog. ArcCatalog adds hints indicating which FGDC elements are mandatory; these are shown with gray text.
Identification Information:
Citation: Citation information: Originators: U.S. Geological Survey in cooperation with U.S. Environmental Protection Agency, ESRI
Title: U.S. Rivers and Streams *File or table name: dtl_riv
Publication date: 20050401 Edition: 2005 *Geospatial data presentation form: vector digital data
Series information: Series name: ESRI® Data & Maps Issue identification: 2005 Publication information: Publication place: Redlands, California, USA Publisher: ESRI Other citation details: Location: \usa\hydro
*Online linkage: \\LTDEGPR3T71\F$\US_GIS_Data\Base\geodatabases\usa_base.gdb

Page 17 of 34 Description: Abstract: U.S. Rivers and Streams represents detailed rivers and streams in the United States. Purpose: U.S. Rivers and Streams provides a database of linear water features that interconnects and identifies the stream segments or reaches that comprise the surface water drainage system of United States. Supplemental information: Largest scale when displaying the data: 1:24,000. *Language of dataset: en
Time period of content: Time period information: Single date/time: Calendar date: 2004 Currentness reference: publication date Status: Progress: Complete Maintenance and update frequency: Matches software update releases Spatial domain: Bounding coordinates: *West bounding coordinate: -160.220853 *East bounding coordinate: -66.988396 *North bounding coordinate: 49.376613 *South bounding coordinate: 18.922673 Local bounding coordinates: *Left bounding coordinate: -160.220853 *Right bounding coordinate: -66.988396 *Top bounding coordinate: 49.376613 *Bottom bounding coordinate: 18.922673 Keywords: Theme: Theme keywords: line, rivers, streams, hydrography, inlandWaters Theme keyword thesaurus: None Place: Place keywords: United States Place keyword thesaurus: None Temporal: Temporal keywords: 2004 Temporal keyword thesaurus: None Access constraints: Access granted to Licensee only. Use constraints: The data are provided by multiple, third party data vendors under license to ESRI for inclusion on ESRI Data & Maps for use with ESRI® software. Each data vendor has its own data licensing policies and may grant varying redistribution rights to end users. Please consult the redistribution rights below for this data set provided on ESRI Data & Maps. As used herein, “Geodata” shall mean any digital data set consisting of geographic data coordinates and associated attributes.

Page 18 of 34 The redistribution rights for this data set: Redistribution rights are granted by the data vendor for hard-copy renditions or static, electronic map images (e.g. .gif, .jpeg, etc.) that are plotted, printed, or publicly displayed with proper metadata and source/copyright attribution to the respective data vendor(s). Geodata is redistributable with a Value-Added Software Application developed by ESRI Business Partners on a royalty-free basis with proper metadata and source/copyright attribution to the respective data vendor(s). Geodata is redistributable without a Value-Added Software Application (i.e., adding the sample data to an existing, [non]commercial data set for redistribution) with proper metadata and source/copyright attribution to the respective data vendor(s). The terms and conditions below apply to all the data sets provided on ESRI Data & Maps. Proprietary Rights and Copyright: Licensee acknowledges that the Data and Related Materials contain proprietary and confidential property of ESRI and its licensor(s). The Data and Related Materials are owned by ESRI and its licensor(s) and are protected by United States copyright laws and applicable international copyright treaties and/or conventions. Limited Warranty and Disclaimer: ESRI warrants that the media upon which the Data and Related Materials are provided will be free from defects in materials and workmanship under normal use and service for a period of ninety (90) days from the date of receipt. THE DATA AND RELATED MATERIALS ARE EXCLUDED FROM THE LIMITED WARRANTY, AND THE LICENSEE EXPRESSLY ACKNOWLEDGES THAT THE DATA CONTAINS SOME NONCONFORMITIES, DEFECTS, OR ERRORS. ESRI DOES NOT WARRANT THAT THE DATA WILL MEET LICENSEE'S NEEDS OR EXPECTATIONS; THAT THE USE OF THE DATA WILL BE UNINTERRUPTED; OR THAT ALL NONCONFORMITIES, DEFECTS, OR ERRORS CAN OR WILL BE CORRECTED. ESRI IS NOT INVITING RELIANCE ON THIS DATA, AND THE LICENSEE SHOULD ALWAYS VERIFY ACTUAL DATA. EXCEPT FOR THE LIMITED WARRANTY SET FORTH ABOVE, THE DATA AND RELATED MATERIALS CONTAINED THEREIN ARE PROVIDED "AS-IS," WITHOUT WARRANTY OF ANY KIND, EITHER EXPRESS OR IMPLIED, INCLUDING, BUT NOT LIMITED TO, THE IMPLIED WARRANTIES OF MERCHANTABILITY AND FITNESS FOR A PARTICULAR PURPOSE. Exclusive Remedy and Limitation of Liability: The entire liability of ESRI or its licensor(s) and Licensee's exclusive remedy shall be to terminate the Agreement upon Licensee returning the Data and Related Materials to ESRI with a copy of Licensee's invoice/receipt and ESRI returning the license fees paid to Licensee. IN NO EVENT SHALL ESRI AND/OR ITS LICENSOR(S) BE LIABLE FOR COSTS OF PROCUREMENT OF SUBSTITUTE GOODS OR SERVICES; LOST PROFITS, LOST SALES, OR BUSINESS EXPENDITURES, INVESTMENTS, OR COMMITMENTS IN CONNECTION WITH ANY BUSINESS; LOSS OF ANY GOODWILL; OR FOR ANY INDIRECT, SPECIAL, INCIDENTAL, EXEMPLARY, OR CONSEQUENTIAL DAMAGES ARISING OUT OF THIS AGREEMENT OR USE OF THE DATA AND RELATED MATERIALS, HOWEVER CAUSED, ON ANY THEORY OF LIABILITY, AND WHETHER OR NOT ESRI OR ITS LICENSOR(S) HAVE BEEN ADVISED OF THE POSSIBILITY OF SUCH DAMAGE. THESE LIMITATIONS SHALL APPLY NOTWITHSTANDING ANY FAILURE OF ESSENTIAL PURPOSE OF ANY EXCLUSIVE REMEDY. Third Party Beneficiary: ESRI's licensor(s) has (have) authorized ESRI to (sub)distribute and (sub)license its (their) data as incorporated into the Data and Related Materials. As an intended third party beneficiary to this Agreement, the ESRI licensor(s) is (are) entitled to directly enforce, in its own name, the rights and obligations undertaken by the Licensee and to seek all legal and equitable remedies as are afforded to ESRI. In the event that the data vendor(s) has (have) granted the end user permission to redistribute the Geodata, please use proper proprietary or copyright attribution for the various data vendor(s), and provide the associated metadata file(s) with the Geodata. In compliance with FGDC metadata standards, ESRI has attempted to practice proper metadata methodologies by providing any data source information, descriptions, and file names to assist in this effort.
Point of contact:

Page 19 of 34 Contact information: Contact organization primary: Contact person: Data Team Contact organization: ESRI Contact address: Address type: mailing and physical address Address: 380 New York Street City: Redlands State or province: California Postal code: 92373-8100 Country: USA Contact voice telephone: 909-793-2853 Contact facsimile telephone: 909-793-5953
Contact electronic mail address: [email protected]
Hours of service: 8:00 a.m.–5:30 p.m. Pacific time, Monday–Friday Contact instructions: In the United States– Please direct all inquiries regarding software/data pricing and consulting services to your local ESRI Regional Office. For support, you may contact Technical Support by telephone (voice) between 6:00 a.m. and 5:00 p.m. Pacific time, Monday through Friday, by dialing 909-793-3774; facsimile (fax) available at 909-792-0960; electronic mail (e-mail) [email protected]; or visit http://support.esri.com; ESRI holidays excluded. Outside the United States– Please direct all inquiries regarding software/data pricing, sales, support, and consulting services to your local ESRI International Distributor. This information can be found at http://gis.esri.com/intldist/contactint.cfm. For other questions or comments, you may contact ESRI headquarters by e-mail, telephone, or fax or write to us.
*Native dataset format: File Geodatabase Feature Class *Native data set environment: Microsoft Windows 2000 Version 5.0 (Build 2195) Service Pack 4; ESRI ArcCatalog 9.2.2.1350
Back to Top
Data Quality Information:
Logical consistency report: No duplicate features are present. The shapefile is converted to SDC (Smart Data Compression) format in ArcSDE®. This verifies and validates the geometry. Completeness report: After processing, the data set is checked for drawing display and number of records and file sizes compared with source materials. Some of the cartographic disparities with this data, inherent in the original 1:100,000 source data, remain in that the density of features can change abruptly. [From National Hydrography Dataset (NHD) documentation - The completeness of the data reflects the content of the sources, which, in the initial release of the National Hydrography Dataset, most often are U.S. Geological Survey topographic maps. Features found on the ground may have been eliminated or generalized on the source graphic because of scale and legibility constraints. In general, streams longer than one mile (approximately 1.6 kilometers) were collected. Most streams that flow from a lake were collected regardless of length. Only definite channels were collected so not all swamp/marsh features have

Page 20 of 34 stream/rivers delineated through them. Lake/ponds having an area greater than 6 acres (approximately 2.4 hectares) were collected. Note, however, that these general rules were applied unevenly among maps during compilation. Some map quadrangles have a much sparser pattern of hydrography than do adjoining maps and these differences continue in the digital rendition of these features. Transport reaches are defined on nearly all features of type stream/river, canal/ditch, artificial path, pipeline, and connector. Waterbody reaches are defined on the subset of lake/pond features that were identified as waterbodies during the development of Reach File Version 3. Most attention in applying geographic names was given to transport reaches that follow stream/rivers and waterbody reaches. Near the international boundaries with Canada and Mexico, only the parts of features within the United States are delineated. Detailed capture conditions are provided for every feature type in the Standards for National Hydrography Dataset (USGS, 1999), available online through http://geography.usgs.gov/standards/.]
Positional accuracy: Horizontal positional accuracy: Horizontal positional accuracy report: The data set originally comes from several sources. Most of the data is from U.S. Geological Survey topographic quadrangle maps or sources that exceed its horizontal accuracy. These maps were compiled to meet National Map Accuracy Standards. For horizontal accuracy, this standard is met if at least 90 percent of points tested are within 0.02 inch (at map scale) of their true position. At 1:100,000 scale, 0.02 inch is approximately 167 feet (50.8 meters). Lineage: Source information: Source citation: Citation information: Originators: U.S. Geological Survey in cooperation with U.S. Environmental Protection Agency
Title: National Hydrography Dataset
Publication date: 2004 Geospatial data presentation form: vector digital data
Publication information: Publication place: Reston, Virginia, USA Publisher: U.S. Geological Survey Other citation details: The tiles were downloaded in December 2004. National Hydrography Dataset is an ongoing project with Alaska being worked on currently.
Online linkage: http://nhd.usgs.gov/ Online linkage: ftp://nhdftp.usgs.gov/SubRegions/Medium/
Source scale denominator: 100000 Type of source media: online Source citation abbreviation: NHD Source contribution: Attribute and geospatial data Source time period of content: Time period information: Single date/time: Calendar date: 2004 Source currentness reference: publication date
Page 21 of 34 Process step: Process description: Convert DLG [Digital Line Graph] data to features: This process converted DLG data to features and associated characteristics and converted the coordinate system to geographic (longitude-latitude) coordinates in NAD83 in five steps: 1. The USGS's [U.S. Geological Survey] "Batch DLG-3 to DLG-F Conversion System" converted DLG-3 nodes, lines, areas, and associated attribute codes to temporary features and associated characteristics. Known conditions for which conversions could not be reliably made were flagged for later inspection. Only known conversion problems were flagged, and no additional steps were taken to detect or repair discrepancies in the original DLG-3 or the converted NHD [National Hydrography Dataset]. 2. A default value of a characteristic was added in cases where the description was incomplete. 3. All instances in which data were flagged were inspected and resolved interactively. 4. Feature delineation rules were applied to the temporary features in a batch process to create the final version of features. 5. Coordinate values were converted to geographic coordinates and to the NAD83 using the NADCON software version 2.1 (National Geodetic Survey, n.d.). This process generated the "features" data. Build reaches: The basic steps for building reaches are as follows: 1. Convert RF3 [Reach File Version 3] to RF3" (RF3 double prime). This batch operation processed Reach File Version 3 to delete duplicate reaches, reassign reaches to the correct cataloging unit, validate geographic names assigned to reaches against data from the Geographic Names Information System (December 1996 extract), apply updates supplied by the States of California and Arizona, redelineate reaches on the basis of standards used for the NHD, and identify inflow/outflow points where transport reaches entered and exited waterbodies. 2. Create artificial paths. Using waterbodies from the feature data and inflow/outflow points extracted from RF3", this process automatically generated the centerlines used to delineate artificial paths within waterbodies by using subroutines within the ARC/INFO® GRID module. 3. Blind pass. This batch step conflated features and RF3" reaches and transferred reach information (reach code, reach date, name, stream level, and flow relationships) to the features. It also integrated the artificial paths generated in the previous step with the other features, built reaches on the artificial paths, and assigned geographic names (February 1995 extract) to waterbodies. 4. Quadrangle-based visual pass. During this interactive step, analysts ensured that the data developed in the previous batch processes conformed to reach delineation rules and that reaches were assigned to the appropriate cataloging unit. Batch procedures identified and developed a list of possible errors. (Errors not detected by the software may continue in the data.) Using the list, software presented each case to analysts to make appropriate edits to the data. Analysts recorded notes about repairs that could not be made and about other errors in the data. (These notes are encoded in the cataloging unit digital update units.) 5. Build superquads. After the quadrangle-based visual pass was complete, all quadrangles that cover all or part of each cataloging unit were paneled into a superquad. In this batch process, reaches that cross quad boundaries were corrected to conform to reach delineation rules. 6. Cataloging unit-based visual pass. As they did with the quadrangle-based visual pass, analysts ensured that reaches conformed to reach delineation rules. Batch procedures identified and developed a list of possible errors. (Errors not detected by the software may continue in the data.) Analysts examined each error and corrected the data. Analysts recorded notes about repairs that could not be made and about other errors in the data. (These notes are encoded in the cataloging unit digital update units.) 7. Central quality assurance/quality control. This step (1) confirmed that integrity checks were performed successfully during the visual pass activity, and (2) assessed statistics gathered during the earlier processes to determine if additional review of data was needed. A check of data from the cataloging unit-based visual pass was run in batch; any data that did not pass the procedure were reviewed interactively. If substantive changes were required, the data were reprocessed using procedures (as required) described in previous steps. The edited data then were rechecked using the central quality assurance/quality control process. 8. Data preparation and database load. This batch procedure performed final processing to the data emerging from the quality assurance/quality control step. Some of the activities included assigning the final reach codes, building waterbody reaches, adding final artificial paths in waterbodies, and implementing any recent changes in standards for the NHD. The spelling of geographic names was

Page 22 of 34 replaced using the March 1999 data extract from the Geographic Names Information System. After this, reaches, features, characteristics, geographic names, and relations were loaded into the database that holds the NHD. 9. Flow relation correction and validation. The flow relations were checked for consistency through a batch procedure, which generated a list of possible errors. Software presented possible errors to analysts, who corrected flow relations and, occasionally, the delineation of reaches. Changes were posted to the database. 10. Extract distribution copies of data. Data for a cataloging unit were extracted from the database and converted into an ARC/INFO® workspace containing coverages and other files. Data available in the Spatial Data Transfer Standard format were developed from the workspaces. The workspaces and the Spatial Data Transfer Standard-formatted files were made available to the public. Modified flow relationships for a subbasin. Updated stream level attributes based on flow relationships produced by the flow validation process. Stream level updates were based upon names for named reaches and the arbolate sum for unnamed reaches. Arbolate sum for any reach on the network is the sum of the lengths of all upstream reaches connected to that reach through flow relationships. Modified Names: Added names to NHD reaches by comparing them to the GNIS [Geographic Names Information System] coordinates using ArcView NHD Tools. Modified Flow Relationships using NHD ArcView Tools: Performed flow quality assurance/control and repaired flow relationships, as needed. Modified Names using NHD ArcView Tools: Added names to NHD reaches and waterbodies by comparing them to the GNIS coordinates. Replaced branched and disjoint (disconnected) reaches with linear reaches in NHDFlowline. This change occurred during the conversion to the geodatabase model. Each NHDFlowline that was part of a branched or disjoint reach was assigned to a new reach. The ComID of the NHDFlowline was unchanged. The change information from the old reach to the new reach was captured in the NHDReachCrossReference table. Each new reach has M values assigned from 0 to 100. Merged and/or split area features (NHDWaterbody, NHDArea, region.wb, region.lm) and updated associated artificial path WBAreaComID (wb_com_id) values. This change occurred during the conversion to the geodatabase model. If adjacent or overlapping area features had identical classifications, including ReachCode where applicable, the features were merged. If an area feature exceeded 100 sq. km. (25 sq. km. for canal/ditch, stream/river, or submerged stream) and crossed a subbasin boundary, the feature was split at the subbasin boundary. If any sliver polygons of a size of less than 5 sq. km. adjoined the split features, the slivers were merged back into the larger area feature. Merged or split area features were assigned a new ComID. Deleted name and GNIS Id values from NHD features where GNIS feature type is valley. This update, at the request of the GNIS staff, is to remove the possible application of a valley name (hypsographic feature) to a stream/river (hydrographic feature). In most instances, the valley name cannot be presumed to apply to the stream/river. Where the name does apply to the stream/river, the GNIS name must be updated from valley to a hydrographic feature type in order for the name to be valid in the NHD.
Process software and version: ARC/INFO®, ArcView® GIS 3 Process date: 1994-2004
Source produced citation abbreviation: NHD
Process step: Process description: The following steps were performed by ESRI: Downloaded the over 200 compressed files from ftp://nhdftp.usgs.gov/SubRegions/Medium/ and extracted them. Used the NHDFlowline source feature

Page 23 of 34 class from each NHD source tile. Merged all NHD source tiles into a single data set. Replaced the numeric values with text strings for the attribute FTYPE. Added the attribute AP_WITHIN. For features where attribute FTYPE is "Artificial Path", attribute AP_WITHIN is populated with the value from the FTYPE attribute of the U.S. Water Bodies that the feature falls within. For all other features, attribute AP_WITHIN is blank. Added attributes METERS and FEET and calculated their values. Created ArcGIS® layer file (.lyr), projection file (.prj), and spatial indices. Process software and version: ArcView® GIS 3, ArcGIS® 9 Process date: 20050328
Source used citation abbreviation: NHD
Process step: Process description: Dataset copied. Source used citation abbreviation:
Back to Top
Spatial Data Organization Information:
*Direct spatial reference method: Vector
Point and vector object information: SDTS terms description: *Name: dtl_riv *SDTS point and vector object type: String *Point and vector object count: 0 ESRI terms description: *Name: dtl_riv *ESRI feature type: Simple *ESRI feature geometry: Polyline *ESRI topology: FALSE *ESRI feature count: 0 Spatial index: TRUE *Linear referencing: FALSE Feature description: U.S. River or Stream
Back to Top
Spatial Reference Information:
Horizontal coordinate system definition: Coordinate system name: *Geographic coordinate system name: GCS_North_American_1983 Geographic: *Latitude resolution: 0.000000 *Longitude resolution: 0.000000 *Geographic coordinate units: Decimal degrees Geodetic model: *Horizontal datum name: North American Datum of 1983 *Ellipsoid name: Geodetic Reference System 80 *Semi-major axis: 6378137.000000

Page 24 of 34 *Denominator of flattening ratio: 298.257222
Back to Top
Entity and Attribute Information:
Detailed description: *Name: dtl_riv
Entity type: *Entity type label: dtl_riv *Entity type type: Feature Class *Entity type count: 0 Entity type definition: The lines represent the detailed rivers and streams in the United States. Entity type definition source: ESRI Attribute: *Attribute label: OBJECTID_1 *Attribute alias: OBJECTID_1 *Attribute definition: Internal feature number. *Attribute definition source: ESRI *Attribute type: OID *Attribute width: 4 *Attribute precision: 0 *Attribute scale: 0
Attribute domain values: *Unrepresentable domain: Sequential unique whole numbers that are automatically generated.
Attribute: *Attribute label: ObjectID *Attribute alias: ObjectID *Attribute definition: Internal feature number. *Attribute definition source: ESRI *Attribute type: OID *Attribute width: 4 *Attribute precision: 0 *Attribute scale: 0
Attribute domain values: *Unrepresentable domain: Sequential unique whole numbers that are automatically generated.
Attribute: *Attribute label: NAME *Attribute alias: NAME Attribute definition: The name of the river or stream. Attribute definition source:
Page 25 of 34 ESRI *Attribute type: String *Attribute width: 99 *Attribute precision: 0 *Attribute scale: 0
Attribute domain values: Unrepresentable domain: Names for the features.
Attribute: *Attribute label: FTYPE *Attribute alias: FTYPE Attribute definition: The feature type of river or stream. Attribute definition source: ESRI *Attribute type: String *Attribute width: 24 *Attribute precision: 0 *Attribute scale: 0
Attribute domain values: Enumerated domain: Enumerated domain value: ARTIFICIAL PATH Enumerated domain value definition: The linear water feature allows connectivity through areal features (for example, lake/ponds and stream/rivers). Enumerated domain value definition source: U.S. Geological Survey in cooperation with U.S. Environmental Protection Agency Enumerated domain: Enumerated domain value: CANAL/DITCH Enumerated domain value definition: The linear water feature is a canal (1-dimensional) or ditch (1-dimensional). Enumerated domain value definition source: U.S. Geological Survey in cooperation with U.S. Environmental Protection Agency Enumerated domain: Enumerated domain value: CONNECTOR Enumerated domain value definition: The linear water feature is a connector (fill gaps in the delineation of features through which water flows). Enumerated domain value definition source: U.S. Geological Survey in cooperation with U.S. Environmental Protection Agency Enumerated domain: Enumerated domain value: PIPELINE Enumerated domain value definition: The linear water feature is a pipeline. Enumerated domain value definition source: U.S. Geological Survey in cooperation with U.S. Environmental Protection Agency Enumerated domain: Enumerated domain value: STREAM/RIVER Enumerated domain value definition: The linear water feature is a stream (1-dimensional) or river (1-dimensional).

Page 26 of 34 Enumerated domain value definition source: U.S. Geological Survey in cooperation with U.S. Environmental Protection Agency Attribute: *Attribute label: FCODE *Attribute alias: FCODE Attribute definition: The feature code (five-digit) for the river or stream. The first three digits encode the feature type; the last two digits encode values for a set of characteristics associated with the feature. Attribute definition source: U.S. Geological Survey in cooperation with U.S. Environmental Protection Agency *Attribute type: Double *Attribute width: 0 *Attribute precision: 12 *Attribute scale: 0
Attribute domain values: Codeset Ddomain: Codeset name: The National Hydrography Dataset, Concepts and Contents - Appendix B. Feature code and description field structures and definitions Codeset source: U.S. Geological Survey in cooperation with U.S. Environmental Protection Agency Attribute: *Attribute label: FCODE_DESC *Attribute alias: FCODE_DESC Attribute definition: The description of the feature code for the river or stream. Attribute definition source: ESRI *Attribute type: String *Attribute width: 130 *Attribute precision: 0 *Attribute scale: 0
Attribute domain values: Codeset Ddomain: Codeset name: The National Hydrography Dataset, Concepts and Contents - Appendix B. Feature code and description field structures and definitions Codeset source: U.S. Geological Survey in cooperation with U.S. Environmental Protection Agency Attribute: *Attribute label: STRM_LEVEL *Attribute alias: STRM_LEVEL Attribute definition: The numeric code that identifies the path level of water flow through a drainage network for the river or stream. The lowest value ["1" for rivers or streams that terminate at the Atlantic, Pacific, or Arctic Oceans, the Gulf of Mexico, or the Caribbean Sea; "2" for rivers or streams that terminate at the Great Lakes or the Great Salt Lake; "3" for rivers or streams that terminate at the boundary of the United States with Canada or Mexico; "4" for rivers or streams that terminate at any other place (isolated drainage).] for stream level is assigned to a river or stream at the end of a flow and to upstream rivers and streams that trace the main path of flow back to the head. The stream level value is incremented by one and is assigned to all rivers and streams that terminate at this path (that is, all tributaries to the path) and to all rivers and streams that trace the main path of the flow along each tributary back to its head. The stream level value is incremented again and is assigned to rivers and streams that trace the main path of the tributaries to their heads. This process is continued until all rivers and streams for which flow is encoded are assigned a stream level.

Page 27 of 34 Attribute definition source: U.S. Geological Survey in cooperation with U.S. Environmental Protection Agency *Attribute type: Double *Attribute width: 0 *Attribute precision: 12 *Attribute scale: 0
Attribute domain values: Range domain: Range domain minimum: 1 Range domain maximum: 99 Attribute domain values: Enumerated domain: Enumerated domain value: 428 Enumerated domain value definition: The linear water feature is unspecified. Enumerated domain value definition source: U.S. Geological Survey in cooperation with U.S. Environmental Protection Agency Attribute: *Attribute label: AP_WITHIN *Attribute alias: AP_WITHIN Attribute definition: The feature type of the water body that the linear water feature allows connectivity through. Only pertains to linear water features that have a feature type of "Artificial Path". Attribute definition source: ESRI *Attribute type: String *Attribute width: 24 *Attribute precision: 0 *Attribute scale: 0
Attribute domain values: Enumerated domain: Enumerated domain value: Canal/Ditch Enumerated domain value definition: The areal water feature is a canal (2-dimensional) or ditch (2-dimensional). Enumerated domain value definition source: U.S. Geological Survey in cooperation with U.S. Environmental Protection Agency Enumerated domain: Enumerated domain value: Ice Mass Enumerated domain value definition: The areal water feature is an ice mass. Enumerated domain value definition source: U.S. Geological Survey in cooperation with U.S. Environmental Protection Agency Enumerated domain: Enumerated domain value: Inundation Area Enumerated domain value definition: The areal water feature is an inundation area. Enumerated domain value definition source: U.S. Geological Survey in cooperation with U.S. Environmental Protection Agency Enumerated domain:

Page 28 of 34 Enumerated domain value: Lake/Pond Enumerated domain value definition: The areal water feature is a lake or pond. Enumerated domain value definition source: U.S. Geological Survey in cooperation with U.S. Environmental Protection Agency Enumerated domain: Enumerated domain value: Playa Enumerated domain value definition: The areal water feature is a playa. Enumerated domain value definition source: U.S. Geological Survey in cooperation with U.S. Environmental Protection Agency Enumerated domain: Enumerated domain value: Reservoir Enumerated domain value definition: The areal water feature is a reservoir. Enumerated domain value definition source: U.S. Geological Survey in cooperation with U.S. Environmental Protection Agency Enumerated domain: Enumerated domain value: Stream/River Enumerated domain value definition: The areal water feature is a stream (2-dimensional) or river (2-dimensional). Enumerated domain value definition source: U.S. Geological Survey in cooperation with U.S. Environmental Protection Agency Enumerated domain: Enumerated domain value: Swamp/Marsh Enumerated domain value definition: The areal water feature is a swamp or marsh. Enumerated domain value definition source: U.S. Geological Survey in cooperation with U.S. Environmental Protection Agency Attribute: *Attribute label: METERS *Attribute alias: METERS Attribute definition: The length of the river or stream in meters. Attribute definition source: ESRI *Attribute type: Double *Attribute width: 0 *Attribute precision: 12 *Attribute scale: 0
Attribute domain values: Unrepresentable domain: Calculated lengths for the features.
Attribute: *Attribute label: FEET *Attribute alias: FEET Attribute definition: The length of the river or stream in feet. Attribute definition source: ESRI

Page 29 of 34 *Attribute type: Double *Attribute width: 8 *Attribute precision: 10 *Attribute scale: 0
Attribute domain values: Unrepresentable domain: Calculated lengths for the features.
Attribute: *Attribute label: Shape *Attribute alias: Shape *Attribute definition: Feature geometry. *Attribute definition source: ESRI *Attribute type: Geometry *Attribute width: 0 *Attribute precision: 0 *Attribute scale: 0
Attribute domain values: *Unrepresentable domain: Coordinates defining the features.
Attribute: *Attribute label: Shape_Length *Attribute alias: Shape_Length *Attribute definition: Length of feature in internal units. *Attribute definition source: ESRI *Attribute type: Double *Attribute width: 8 *Attribute precision: 0 *Attribute scale: 0
Attribute domain values: *Unrepresentable domain: Positive real numbers that are automatically generated.
Back to Top
Distribution Information:
Distributor: Contact information: Contact organization primary: Contact organization: ESRI; ESRI International Distributors Contact address: Address type: mailing and physical address Address: 380 New York Street City: Redlands

Page 30 of 34 State or province: California Postal code: 92373-8100 Country: USA Contact voice telephone: 800-447-9778
Contact instructions: In the United States, contact the ESRI Telesales staff at 800-447-9778 for more information about our software and data. Outside the United States, please direct all inquiries to your local ESRI International Distributor. This information can be found at http://gis.esri.com/intldist/contactint.cfm.
Resource description: Offline Data
Distribution liability: See use constraints. Standard order process: Digital form: Digital transfer information: Format name: SDC Format specification: The SDC file contains the geospatial and attribute data. The SDI file contains the spatial and attribute indexes. The PRJ file contains the coordinate system information (optional). The XML file (*.sdc.xml) contains the metadata describing the data set (optional). File decompression technique: ArcGIS® software *Transfer size: 293.265 *Dataset size: 293.265 Digital transfer option: Offline option: Offline media: DVD–ROM Recording capacity: Recording density: 4.38 Recording density Units: GB (gigabytes) Recording format: ISO 9660 Offline option: Offline media: CD–ROM Recording capacity: Recording density: 650 Recording density Units: MB (megabytes) Recording format: ISO 9660 Fees: Software purchase price Ordering instructions: ESRI Data & Maps is available only as part of ESRI® software.
Technical prerequisites: To use this data requires software that supports SDC files.
Back to Top
Metadata Reference Information:
*Metadata date: 20070830

Page 31 of 34 *Language of metadata: en
Metadata contact: Contact information: Contact organization primary: Contact person: Data Team Contact organization: ESRI Contact address: Address type: mailing and physical address Address: 380 New York Street City: Redlands State or province: California Postal code: 92373-8100 Country: USA Contact voice telephone: 909-793-2853 Contact facsimile telephone: 909-793-5953
Contact electronic mail address: [email protected]
Hours of service: 8:00 a.m.–5:30 p.m. Pacific time, Monday–Friday
*Metadata standard name: FGDC Content Standards for Digital Geospatial Metadata *Metadata standard version: FGDC-STD-001-1998 *Metadata time convention: local time
Metadata extensions: *Online linkage: http://www.esri.com/metadata/esriprof80.html *Profile name: ESRI Metadata Profile
Back to Top
Geoprocessing History:
Process: *Process name: FeatureClassToFeatureClass_1 *Date: 20070723 *Time: 150058 *Tool location: C:\Program Files\ArcGIS\ArcToolbox\Toolboxes\Conversion Tools.tbx\FeatureClassToFeatureClass *Command issued: FeatureClassToFeatureClass F:\sample_test2\shapefiles\dtl_riv.shp F:\regression_fin\dbase\p_alin_data1.gdb dtl_riv # "ObjectID ObjectID true false false 9 Long 0 9 ,First,#,F:\sample_test2\shapefiles\dtl_riv.shp,ObjectID,-1,-1;NAME NAME true false false 65 Text 0 0 ,First,#,F:\sample_test2\shapefiles\dtl_riv.shp,NAME,-1,-1;FTYPE FTYPE true false false 60 Text 0 0 ,First,#,F:\sample_test2\shapefiles\dtl_riv.shp,FTYPE,-1,-1;FCODE FCODE true false false 10 Double 0 10 ,First,#,F:\sample_test2\shapefiles\dtl_riv.shp,FCODE,-1,-1;FCODE_DESC FCODE_DESC true false false 60 Text 0 0 ,First,#,F:\sample_test2\shapefiles\dtl_riv.shp,FCODE_DESC,-1,-1;STRM_LEVEL STRM_LEVEL true false false 10 Double 0 10 ,First,#,F:\sample_test2\shapefiles\dtl_riv.shp,STRM_LEVEL,-1,-1;AP_WITHIN AP_WITHIN true false false 24 Text 0 0 ,First,#,F:\sample_test2\shapefiles\dtl_riv.shp,AP_WITHIN,-1,-1;METERS METERS true false false 10 Double 0 10 ,First,#,F:\sample_test2\shapefiles\dtl_riv.shp,METERS,-1,-1;FEET FEET true false false 10 Double 0 10 ,First,#,F:\sample_test2\shapefiles\dtl_riv.shp,FEET,-1,-1" # F:\regression_fin\dbase\p_alin_data1.gdb\dtl_riv
Process: *Process name: FeatureClassToFeatureClass_1

Page 32 of 34 *Date: 20070830 *Time: 110635 *Tool location: C:\Program Files\ArcGIS\ArcToolbox\Toolboxes\Conversion Tools.tbx\FeatureClassToFeatureClass *Command issued: FeatureClassToFeatureClass E:\regression_fin\dbase\p_alin_data1.gdb\dtl_riv F:\US_GIS_Data\Base\geodatabases\usa_base.gdb dtl_riv # "ObjectID ObjectID true true false 4 Long 0 0 ,First,#,E:\regression_fin\dbase\p_alin_data1.gdb\dtl_riv,ObjectID,-1,-1;NAME NAME true true false 65 Text 0 0 ,First,#,E:\regression_fin\dbase\p_alin_data1.gdb\dtl_riv,NAME,-1,-1;FTYPE FTYPE true true false 60 Text 0 0 ,First,#,E:\regression_fin\dbase\p_alin_data1.gdb\dtl_riv,FTYPE,-1,-1;FCODE FCODE true true false 8 Double 0 0 ,First,#,E:\regression_fin\dbase\p_alin_data1.gdb\dtl_riv,FCODE,-1,-1;FCODE_DESC FCODE_DESC true true false 60 Text 0 0 ,First,#,E:\regression_fin\dbase\p_alin_data1.gdb\dtl_riv,FCODE_DESC,-1,-1;STRM_LEVEL STRM_LEVEL true true false 8 Double 0 0 ,First,#,E:\regression_fin\dbase\p_alin_data1.gdb\dtl_riv,STRM_LEVEL,-1,-1;AP_WITHIN AP_WITHIN true true false 24 Text 0 0 ,First,#,E:\regression_fin\dbase\p_alin_data1.gdb\dtl_riv,AP_WITHIN,-1,-1;METERS METERS true true false 8 Double 0 0 ,First,#,E:\regression_fin\dbase\p_alin_data1.gdb\dtl_riv,METERS,-1,-1;FEET FEET true true false 8 Double 0 0 ,First,#,E:\regression_fin\dbase\p_alin_data1.gdb\dtl_riv,FEET,-1,-1;Shape_Length Shape_Length false true true 8 Double 0 0 ,First,#,E:\regression_fin\dbase\p_alin_data1.gdb\dtl_riv,Shape_Length,-1,-1" # F:\US_GIS_Data\Base\geodatabases\usa_base.gdb\dtl_riv
Appendix III
From : http://www.drainageindex.msu.edu/
The DI, originally named the "natural soil wetness index" (Schaetzl 1986), is a measure of the wetness of a soil. It is designed to represent, as an ordinal number, the amount of water that a soil contains and makes available to plants under normal climatic conditions. It is not meant to mimic the concept of "plant available water", which is mostly dependent upon soil texture. The DI only loosely/secondarily takes soil texture into consideration. The main factors affecting the DI are macroclimate (soil moisture regime), depth to the water table (natural soil drainage class) and the soil volume available for rooting. The DI concept was first initiated by Hole (1978) and Hole and Campbell (1985), and expanded upon by Schaetzl (1986).
The DI ranges from 0 to 99. The higher the DI, the more water the soil can and does, theoretically, supply to plants. Sites with DIs of 99 are, essentially, open water. A soil with a DI of 1 is so thin and dry as to almost be bare bedrock. In our system, bare bedrock obtains a DI of zero. The DI is derived from the soil's taxonomic subgroup classification in the US system of Soil Taxonomy, and (optionally) its soil map slope class. Because a soil's taxonomic classification is not (initially) affected by such factors as irrigation or artificial drainage, the DI does not change as soils become irrigated or drained (unless the long-term effects of this involve a change in the soil's taxonomic classification). Instead, the DI reflects the soil's NATURAL wetness condition. Each soil SERIES has, in theory, its own unique DI.
Appendix IV
The wholesale and production nursery data were taken from the ReferenceUSA database. ReferenceUSA is an online, proprietary database offered by the InfoUSA company. It contains detailed records on more than 13 million businesses. Documentation/metadata is not available. But through a series of phone calls it was determined that the datum of the geographic coordinates listed with each record is NAD 83, and that the geocoding is possibly provided by TeleAtlas. Field Descriptions and some qualifying information describing those fields. NAME ADDRESS CITY

Page 33 of 34 ST ZIPCODE ZIP_4 COUNTY MSA = metropolitan statistical area PHONE FAX_PH TOLL_FREE = if they have a toll-free phone number EMP_SIZE = # of employees, in classes (1 to 4, 5 to 9, etc.) CORP_EMP = # of corporate employees SALES = in classes (less than $500,000, $500,000 to $1 million, etc.) BUS_STATUS = single location or branch location PARENT_NO = if a branch location, then ID number associated with parent company, not sure what it is PARENT_CO = if a branch location, name of parent company LASTNAME = last name of primary contact FIRSTNAME = first name of primary contact TITLECODE = title of primary contact (manager, owner, president, CEO, etc.) GENDER = gender of primary contact CREDIT_RAT = credit rating (good, very good, unknown, etc. IUSA = code number assigned to the business by InfoUSA HOLD_STAT = hold status -- not sure about this one TICKER_SYM = if publicly traded, ticker symbol STOCK_CODE = if publicly traded, stock code FOREIGN_PAR = if company has foreign parent RANKING = not sure URL = if have URL, would be listed here, but I've generally truncated NAICS = North American Industrial Classification System code (primary means of search/query) NAICS_DESC = NAICS textual description CREDIT_SC = credit grade (A, B+, etc.) CREDIT_NUM = looks to be out of 100 NO_OF_PCS = # of computers SQ_FT = square footage of business OWN_LEASE = own or lease LATITUDE LONGITUDE PSIC_CODE = primary Standard Industrial Classification Code (another means of search/query) PSIC_DESC = primary SIC textual description The next set of fields has to do with Yellow Pages listings -- repeats several times -- a business may offer numerous services, so they may be listed in several Yellow Pages sections -- ADSIZE_01 YR01 SIC_02 DESC_02 ADSIZE_02 YR02 ... The next set of fields has to do with executives/contacts -- repeats several times -- CONTACT_LAST_NAME_01 CONTACT_FIRST_NAME_01 EXECUTIVE_TITLE_01 EXECUTIVE_GENDER_01 .... Similar to above, but director information -- repeats several times --

Page 34 of 34 DIRECTOR_LASTNAME_01 DIRECTOR_FIRSTNAME_01 DIRECTOR_TITLE_01 DIRECTOR_GENDER_01 ... As mention above, some business locations offer multiple services, under different NAICS categories -- if so, they're listed in the following set of fields -- NAICS_CD1 NAICS_DES1 NAICS_CD2 NAICS_DES2 NAICS_CD3 NAICS_DES3 NAICS_CD4 NAICS_DES4 The wholesale nurseries layer was created by querying the ReferenceUSA database for all business locations who reported North American Industrial Classification System (NAICS) code 424930 (nursery stock wholesalers) as one of their activities Note: This is not necessarily the business’ primary activity. The nursery and tree production businesses in the U.S. was compiled using a similar process, but using the using the NAICS code 111421. The process required downloading comma-delimited files from ReferenceUSA (only 10 - 100 files may be downloaded each time). These files were concatenated using the Unix code. Then all files were converted to a DBF using SAS. The DBF was converted into shapefiles based on the lat/long coordinates included with every business location in the ReferenceUSA database.