Survival, abundance, and capture rate of eastern cottontail rabbits in an urban park
14
Survival, abundance, and capture rate of eastern cottontail rabbits in an urban park Victoria M. Hunt & Seth B. Magle & Chino Vargas & Alison W. Brown & Eric V. Lonsdorf & Allison B. Sacerdote & Evan J. Sorley & Rachel M. Santymire # Springer Science+Business Media New York 2013 Abstract Eastern cottontail rabbits (Sylvilagus floridanus) are common, conspicuous denizens of urban environments. They are associated with human-wildlife conflict due to vegetation damage. Prior to this study, population dynamics of this species in urban environments remained largely uncharacterized. For three consecutive winters, we used classic field ecology methods (mark-recapture and mark–resight surveys) to estimate demographic parameters of rabbits in a city park in Chicago, Illinois. Rabbits occurred in densities as high as 16.3 rabbits/ha, which is comparatively high for the Midwestern United States. An annual survivor- ship of 30.4±12.9 % SE was similar to that observed in natural environments in similar climates. This result refuted our hypothesis that urban rabbits would have higher annual survival rates than rabbits in natural settings due to food subsidies supplied by landscaping in parks. Mean distance between trap locations for rabbits trapped three or more times was 43.14± 30.01 m SD, suggesting that rabbits in the urban study area had smaller home ranges than rabbits in non-human-dominated habitats. This study contributes to our understanding of population dynamics of a human-wildlife conflict species in urban environments and provides useful information for managers dealing with damage caused by rabbits. The mark-resight method employed here could be used by managers to estimate pre- and post-management population sizes of other conflict species, for example Canada geese (Branta Canadensis), in parks and green spaces, provided that the species is trappable, visible, and individuals have relatively small home ranges. Keywords Chicago . Eastern cottontail rabbit . Human-wildlife conflict . Population dynamics . Sylvilagus floridanus . Urban wildlife Urban Ecosyst DOI 10.1007/s11252-013-0334-z Electronic supplementary material The online version of this article (doi:10.1007/s11252-013-0334-z) contains supplementary material, which is available to authorized users. V. M. Hunt (*) University of Illinois at Chicago, 845 W Taylor Street, Chicago, IL 60607, USA e-mail: [email protected] S. B. Magle : C. Vargas : A. W. Brown : E. V. Lonsdorf : A. B. Sacerdote : E. J. Sorley : R. M. Santymire Lincoln Park Zoo, 2001 N Clark Street, Chicago, IL 60614, USA
Transcript of Survival, abundance, and capture rate of eastern cottontail rabbits in an urban park
Survival, abundance, and capture rate of easterncottontail rabbits in an urban park
Victoria M. Hunt & Seth B. Magle & Chino Vargas &Alison W. Brown & Eric V. Lonsdorf & Allison B. Sacerdote &
Evan J. Sorley & Rachel M. Santymire
# Springer Science+Business Media New York 2013
Abstract Eastern cottontail rabbits (Sylvilagus floridanus) are common, conspicuous denizensof urban environments. They are associated with human-wildlife conflict due to vegetationdamage. Prior to this study, population dynamics of this species in urban environmentsremained largely uncharacterized. For three consecutive winters, we used classic field ecologymethods (mark-recapture and mark–resight surveys) to estimate demographic parameters ofrabbits in a city park in Chicago, Illinois. Rabbits occurred in densities as high as 16.3rabbits/ha, which is comparatively high for the Midwestern United States. An annual survivor-ship of 30.4±12.9 % SE was similar to that observed in natural environments in similarclimates. This result refuted our hypothesis that urban rabbits would have higher annualsurvival rates than rabbits in natural settings due to food subsidies supplied by landscaping inparks. Mean distance between trap locations for rabbits trapped three or more times was 43.14±30.01 m SD, suggesting that rabbits in the urban study area had smaller home ranges thanrabbits in non-human-dominated habitats. This study contributes to our understanding ofpopulation dynamics of a human-wildlife conflict species in urban environments and providesuseful information for managers dealing with damage caused by rabbits. The mark-resightmethod employed here could be used by managers to estimate pre- and post-managementpopulation sizes of other conflict species, for example Canada geese (Branta Canadensis), inparks and green spaces, provided that the species is trappable, visible, and individuals haverelatively small home ranges.
Keywords Chicago . Eastern cottontail rabbit . Human-wildlife conflict . Population dynamics .
Sylvilagus floridanus . Urban wildlife
Urban EcosystDOI 10.1007/s11252-013-0334-z
Electronic supplementary material The online version of this article (doi:10.1007/s11252-013-0334-z)contains supplementary material, which is available to authorized users.
V. M. Hunt (*)University of Illinois at Chicago, 845 W Taylor Street, Chicago, IL 60607, USAe-mail: [email protected]
S. B. Magle : C. Vargas :A. W. Brown : E. V. Lonsdorf : A. B. Sacerdote : E. J. Sorley : R. M. SantymireLincoln Park Zoo, 2001 N Clark Street, Chicago, IL 60614, USA
Introduction
Wildlife damage in North America costs approximately $3 billion per year (Conover et al. 1995)and human-wildlife conflicts are on the rise (Conover and Decker 1991), particularly in urbanareas (Messmer 2000). Herbivore damage to commercial property including crops, timber(Conover et al. 1995), and nurseries (Mason et al. 1999) contributes to these losses. Herbivoresincluding eastern cottontail rabbits (Sylvilagus floridanus) (Feinstein 2011), white-tailed deer(Odocoileus virginianus) (Conover et al. 1995) and Canada geese (Branta canadensis)(Washburn and Seamans 2012) can damage vegetation in urban green spaces and gardens.
Recent literature on rabbit management focuses on European rabbits (Oryctolaguscuniculus), which have been widely introduced and are invasive (Smith and Boyer 2008),especially in Australia (Conover 2010; Williams et al. 2007). In Australia, European rabbitscompete with livestock, cause soil erosion (Conover 2010), damage crops, and threaten nativespecies (Conover 2010; Williams et al. 2007). Consequently, Australia engages in rabbitpopulation control using poison baiting (Mcilroy and Gifford 1991; Twigg et al. 2001),immunocontraception (McLeod et al. 2007; Williams et al. 2007) and introduced diseases(Bruce and Twigg 2005). In Great Britain, rabbits damage crops resulting in loss of £115 M peryear (Smith et al. 2007) and are controlled by fumigating burrows, trapping, and electric fencing(Conover 2010; Smith et al. 2007). In the European rabbit’s native range on the IberianPeninsula, the species is beneficial as prey for endangered predators (Ferreira 2012), anddetrimental as an agricultural pest (Barrio et al. 2010b, 2011, 2013; Ferreira 2012).
Relative to the European rabbit, there is a dearth of recent research on eastern cottontail rabbitmanagement, even though the two species cause similar problems, for example damage tocommercial property (Conover et al. 1995;Mason et al. 1999). Like European rabbits (Letty et al.2000), eastern cottontail rabbits are a game species and most early research on eastern cottontailrabbits focuses on this (Allen 1938; Boland and Litvaitis 2008; Chapman and Trethewey 1972;Haugen 1942; Rose 1977), or on rabbits as disease reservoirs (Lepitzki et al. 1992; McGowanet al. 1979; McKeever et al. 1958; Peavey et al. 1997; Smith and Cheatum 1944; Woolf et al.1993). In the winter, snow cover limits grazing options and eastern cottontail rabbits resort toforaging on bark and woody perennials (Schwartz et al. 2002), causing damage to urban parks(for example, see Ford 2003). Eastern cottontail rabbits increasingly colonize urban garden areas(Feinstein 2011), resulting in aesthetic and monetary damage (Hygnstrom 2010).
The Chicago metropolitan area, in addition to serving as home to 8.4 million people(Chicago Metropolitan Agency for Planning 2011), contains expansive green spaces(Moskovits et al. 2004) and provides ample opportunity to study human–wildlife conflict.Long–term urban wildlife research initiatives in the Chicago area include the Cook County,Illinois, Coyote Project (Gehrt et al. 2009) and Project Squirrel (van der Merwe et al. 2005).Rabbit damage at Grant Park, a 129 ha public green space in Chicago, cost $50,000 in asingle winter and fall (Ford 2003) and cost $19,000 annually at our 13.4 ha study site inChicago, as estimated by horticulture surveys.
We hypothesized that eastern cottontail rabbits inhabiting urban parks would have higherpopulation densities than cottontails in natural areas due to higher food availabilities. Thispatterns has been documented for brown rats (Rattus norvegicus) (Traweger et al. 2006) andraccoons (Procyon lotor) (Graser et al. 2012). We used mark-resight surveys which havepreviously been used for estimating population abundance of color-marked eastern cottontailrabbits (Edwards and Eberhardt 1967). Mark-recapture would likely yield similar results,and has been used to determine population abundance in rabbits (Woolf et al. 1993) butrequires significantly more effort and resources, as animals must be captured repeatedlywithin a short window of time (White and Burnham 1999).
Urban Ecosyst
Alternative methods for estimating rabbit (multiple species) population densities includewarren counts (Palomares 2001; Rueda et al. 2008), pellet counts (Palomares 2001; Ruedaet al. 2008), line transects (Palomares 2001) and counts of individuals, including roadsidecounts (Woolf et al. 1993) and spotlight counts (Barrio et al. 2010a). Warren counts are notpossible for eastern cottontail rabbits because they do not dig burrows (Schwartz et al. 2002)and pellet counts are unreliable (Palomares 2001). Line transects depend on habitat type(Palomares 2001) and in our study area, visual obstructions preclude their use. Lastly,counting individuals is labor intensive and involves extensive trapping (Palomares 2001).
Humans in urban areas provide food for herbivores via landscaping, and thereforewe expectedthat rabbits in our study area would have higher survival rates, as is true for Canada geese (BrantaCanadensis) (Balkcom 2010). Survival rates of rabbits (multiple species) have previously beendetermined using radio-marked animals (Cabezas et al. 2007; Woolf et al. 1993), mark recapturesurveys (Rose 1977; Williams et al. 2007), and mark resight surveys (Letty et al. 2000).
In the multi-year study presented herein, we used classic field ecology methods (mark-recapture and mark-resight surveys) to characterize demographic processes of eastern cottontailrabbits in an urban park. Our objectives were to: 1) estimate population density, 2) estimatesurvival rates and 3) characterize movement and spatial distribution of rabbits in the study area.We sought to meet these three objectives in a manner that could be applied elsewhere to studyurban wildlife and inform human-wildlife conflict management.
Materials and methods
Study area
Our study area consisted of the main grounds of the Lincoln Park Zoo, Chicago, Illinois(41°55′17.25″N 87°38′0.28″W). A metal fence enclosed the property, but eastern cottontailrabbits (hereafter, rabbits) were able to pass under the fence and were observed doing sowhen flushed from hiding. Gardening staff continually maintained vegetation in the park,which consisted of turf, and both native and non-native ornamental shrubs and trees. Forty–one percent of the 13.4 ha property consisted of green space, defined as any non-path, non-building area that appeared qualitatively green in an aerial map. Selected trap locations wereaccessible to research staff, out of public view, protected from the elements on at least oneside, and were distributed so as to survey the entire property.
Population dynamics
Capture and mark-resight
For three successive winters in late January to early March we live-trapped rabbits across thestudy area. We trapped on 840 trap-nights: 228 in 2010, 384 in 2011, and 228 in 2012. Thenumber of traps deployed per night (mean 24.7±5.8 SD, range: 18–32 traps) depended onavailable equipment and weather (see supplemental information for details). Traps were set outin an array across the study area, and were moved at weekly intervals to reduce predation. Weinferred the presence of predator species in the park using motion-triggered video cameras(Bushnell Trophy Cam HD Max Game Camera; Bushnell, Overland Park, KS), which wereemployed as part of another study.
We used baited 1–door traps (model #1078; Havahart, Lititz, PA) with dimensions of61 cm×18 cm×18 cm. Bait was refreshed daily, and consisted of lettuce and vegetables in
Urban Ecosyst
2010 and 2011, and apples, timothy hay (Phleum pratense) and apple cider in 2012. Thechange in type of bait was due to the lack of snow cover and subsequent lack of food-motivation in the rabbits in 2012. The more appealing bait in 2012 achieved a comparablepercentage trap success as observed in 2011 and 2010. Changing the bait did not affectcomparability of our population estimates across years, as the estimates did not depend ontrapping rates, but depended instead on the proportion of marked to unmarked rabbitsobserved in resight surveys.
Researchers wearing latex gloves and protective barrier clothing restrained unanesthetizedrabbits with a cloth sack during processing.We sterilized all tagging equipment (ear tags and tagapplicators) with rubbing alcohol. When a rabbit was caught for the first time, we appliedindividually numbered monel ear tags (model #1005-3; National Band and Tag Company,Newport, KY) to both ears (Edwards and Eberhardt 1967; Haugen 1942). After the first year,tags were marked with colored nail polish indicating year of capture to differentiate releasecohorts during resight surveys.
Estimates of population size were derived from resight surveys, rather than recapturesurveys, allowing us to avoid extensive recapturing. If field-readable marks can be applied,as is true for rabbits, resight surveys have many advantages over recapture surveys: they are lessexpensive, less invasive, and less stressful (White and Burnham 1999). We conducted resightsurveys in the 2 weeks immediately following trapping (see supplemental information fordetails) during two time periods: mornings between 8:00 h and 10:00 h, and afternoons between15:30 h and 17:00 h. At these times, rabbits were relatively inactive and we were able to detectrabbits without flushing them out, which reduced the likelihood of double counting. Duringresight surveys, researchers performed walking transects along paths through the study area andcounted marked and unmarked rabbits seen with the aid of binoculars. We were unable to readindividually labeled ear tags from a distance and therefore we treated tagged rabbits from agiven year as a release cohort based on color of ear tags. We used a double-observer approach(Borchers et al. 1998; Melville et al. 2008) to validate our resight procedure. The secondobserver never detected a rabbit that was missed by the first observer.
Analysis
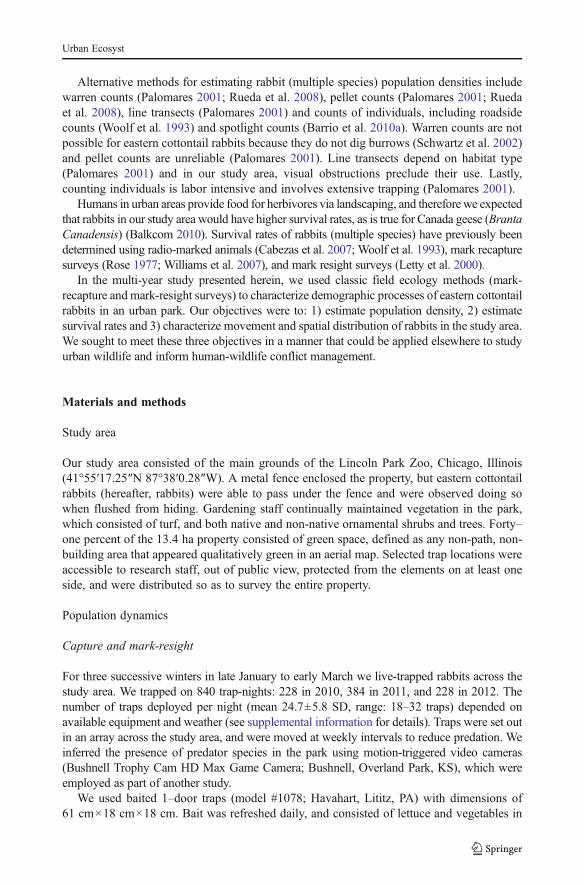
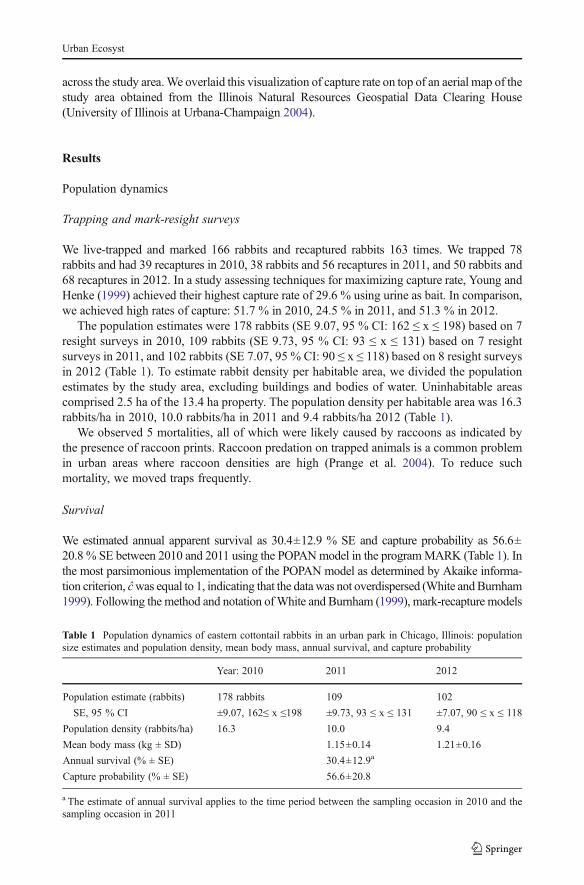
Rabbit population size per year was estimated using the Joint Hypergeometric Estimator(JHE) as implemented in the Mark-Resight model in the program MARK (White andBurnham 1999). JHE, a maximum likelihood estimator used to determine populationabundance from mark-resight survey data, assumes that all animals in the population haveequal probability of resighting on all sampling occasions (White 1996). Due to the brevity ofthe period in which we conducted resight surveys each year (mean 8±1 day SD) weassumed a provisionally closed population for the purposes of population abundanceestimation (see supplemental information for details). Figure 1 shows a schematic of theexperimental design used for population abundance estimation.
We determined annual survival rates for urban rabbits using mark-recapture surveys in2010, 2011 and 2012. Encounter histories for survival analysis were based on one primarysampling period per winter for each of the three winters in which we live-trapped rabbits(see process model in Fig. 1). The sampling periods were 21 January to 17 February in2010, 19 January to 4 March in 2011, and 31 January to 17 February in 2012. Eachencounter history included three sampling occasions: winter 2010, winter 2011 and winter2012. Using these encounter histories, we implemented the POPAN (POPulation ANalysis)model (Arnason and Schwarz 1995) in the program MARK to estimate apparent survival(White and Burnham 1999).
Urban Ecosyst
We assessed survival between winters, not within each sampling period (Fig. 1). Whenthe entire winter sampling period was considered, we made every effort to equally survey theentire property. In contrast, we periodically relocated traps within our primary samplingperiods because we lacked adequate equipment to cover the entire study area concurrently.Consequently, the probability of trapping a given rabbit was unequal within the samplingperiod, as we were more likely to trap a given rabbit when traps were situated within therabbit’s home range. By summarizing trap nights per winter into primary sampling periods,we avoided location bias. Thus, the manner in which we formulated our recapture encounterhistories both addressed our focal question of annual survival and compensated for alimitation in our study design.
We used POPAN, a model based on Jolly-Seber estimation (White and Burnham 1999),to analyze survival. In the POPAN model, encounter histories consisted of multiple samplingoccasions. At each sampling occasion, captured unmarked animals were marked withuniquely identifiable tags and any captured marked animals were recorded. The modelassumed that unmarked animals were equally likely to be captured as marked animals(White and Burnham 1999). The proportion of marked animals that were recaptured at agiven sampling occasion was a product of apparent survival (ϕ) and the probability of beingcaptured (p), given that the animal was alive (White and Burnham 1999).
Fig. 1 Schematic of experimental design for population estimation (top) and process model for survivalanalysis (bottom). Population estimation (top) was based on resight surveys (Resight) performed within the2 weeks following marking of rabbits (Mark) for each year of study. Resight survey data was analyzed usingthe JHE (Joint Hypergeometric Estimator) to determine population size (N) per year. Survival analysis(bottom) was conducted using encounter histories for rabbits wherein rabbits were marked during the firstwinter sampling period (Mark), and each winter of trapping constituted one sampling occasion (Recap).Model POPAN (POPulation ANalysis) in the program MARK was used to analyze encounter histories andgenerate estimates of apparent survival (ϕ), probability of entrance (b) and capture rate (p) for an urbanpopulation of eastern cottontail rabbits in Lincoln Park, Chicago, Illinois
Urban Ecosyst
By using POPAN, we assumed that the marked animals used for survival analysiscomprised a sample taken from a super-population. Not all individuals in the super-population were expected to be trappable at any particular encounter occasion. The POPANmodel was appealing because it did not assume population closure and we knew that rabbitscould enter and exit the study area through the property’s fence. Additionally, we expectedthat over the course of the 3-year study, individuals were born into the population. ThePOPAN model included a parameter for probability of entrance (PENT; b) in addition toapparent survival (ϕ) and probability of capture (p). We tested a suite of six POPAN modelsin MARK varying 1) designation of parameters as variable over time or constant, 2) linkfunctions for apparent survival (ϕ) and probability of capture (p), and 3) method ofvariance estimation (see supplemental information for details). The most parsimoniousmodel given the encounter histories was determined by corrected Akaike informationcriterion (see supplemental information for details). White and Burnham (1999) advocateuse of corrected Akaike information criterion for determining the model that best explainsvariation in the data using the minimum number of parameters. We used ĉ to assessoverdispersion, where ĉ>1 reflected lack of fit (White and Burnham 1999).
Body mass
Each time a rabbit was captured, it was weighed with a spring scale accurate to 0.1 kg. Toestimate body mass for each rabbit, masses for the same rabbit over multiple captures in thesame winter were averaged. The period over which masses for each rabbit per year wereaveraged comprised relatively short time intervals: 21 January to 17 February in 2010, 19January to 4 March in 2011, and 31 January to 17 February in 2012. Due to the brevity of thesampling window, we did not expect that averaging the masses taken from repeatedmeasurements on individuals masked any actual change in size. Averaging reduces potentialerrors from misreading the spring scale or from double counting individuals when estimatingthe overall mean mass of the population. Mean masses of individuals were averaged todetermine the overall mean mass.
Gender of live-trapped rabbits was not determined due to difficulties in sexing rabbits inthe winter when the testes of male rabbits were not reliably detectable (Haugen 1942;Petrides 1951). Utilizing previously published data (Boyd and Henry 1991), we attemptedto assign age-classes to rabbits according to an established weight classification scheme.However, in our study system, known adult rabbits (rabbits that were captured in multipleyears) were misclassified as juveniles at an unacceptable rate (86 %) using this scheme.Without a tool to reliably assess age, we do not report age-classes of rabbits.
Spatial variability in activity
We used spatial variability in capture rate as an index of spatial use by the population (Hill 2005)across the study area. Trap locations at which we caught rabbits on at least one occasion, and forwhich we had data on three or four occasions were included in the spatial analysis. All other traplocations, for example trap locations where we trapped on only one occasion, were excludedfrom the spatial analysis. The capture rate for each sampled trap location was calculated asincidents of capture divided by number of sampling occasions. Bait and trap odors mayinfluence capture rate (Boitani and Fuller 2000). To minimize this potential bias, we used thesame bait across the study area.
We performed kriging in the ArcGIS 10.1 extension Spatial Analyst (EnvironmentalSystems Research Institute, Redlands, CA) to interpolate capture rate from sampled locations
Urban Ecosyst
across the study area.We overlaid this visualization of capture rate on top of an aerial map of thestudy area obtained from the Illinois Natural Resources Geospatial Data Clearing House(University of Illinois at Urbana-Champaign 2004).
Results
Population dynamics
Trapping and mark-resight surveys
We live-trapped and marked 166 rabbits and recaptured rabbits 163 times. We trapped 78rabbits and had 39 recaptures in 2010, 38 rabbits and 56 recaptures in 2011, and 50 rabbits and68 recaptures in 2012. In a study assessing techniques for maximizing capture rate, Young andHenke (1999) achieved their highest capture rate of 29.6 % using urine as bait. In comparison,we achieved high rates of capture: 51.7 % in 2010, 24.5 % in 2011, and 51.3 % in 2012.
The population estimates were 178 rabbits (SE 9.07, 95 % CI: 162 ≤ x ≤ 198) based on 7resight surveys in 2010, 109 rabbits (SE 9.73, 95 % CI: 93 ≤ x ≤ 131) based on 7 resightsurveys in 2011, and 102 rabbits (SE 7.07, 95 % CI: 90 ≤ x ≤ 118) based on 8 resight surveysin 2012 (Table 1). To estimate rabbit density per habitable area, we divided the populationestimates by the study area, excluding buildings and bodies of water. Uninhabitable areascomprised 2.5 ha of the 13.4 ha property. The population density per habitable area was 16.3rabbits/ha in 2010, 10.0 rabbits/ha in 2011 and 9.4 rabbits/ha 2012 (Table 1).
We observed 5 mortalities, all of which were likely caused by raccoons as indicated bythe presence of raccoon prints. Raccoon predation on trapped animals is a common problemin urban areas where raccoon densities are high (Prange et al. 2004). To reduce suchmortality, we moved traps frequently.
Survival
We estimated annual apparent survival as 30.4±12.9 % SE and capture probability as 56.6±20.8 % SE between 2010 and 2011 using the POPANmodel in the programMARK (Table 1). Inthe most parsimonious implementation of the POPAN model as determined by Akaike informa-tion criterion, ĉwas equal to 1, indicating that the data was not overdispersed (White andBurnham1999). Following the method and notation ofWhite and Burnham (1999), mark-recapture models
Table 1 Population dynamics of eastern cottontail rabbits in an urban park in Chicago, Illinois: populationsize estimates and population density, mean body mass, annual survival, and capture probability
Year: 2010 2011 2012
Population estimate (rabbits) 178 rabbits 109 102
SE, 95 % CI ±9.07, 162≤ x ≤198 ±9.73, 93 ≤ x ≤ 131 ±7.07, 90 ≤ x ≤ 118
Population density (rabbits/ha) 16.3 10.0 9.4
Mean body mass (kg ± SD) 1.15±0.14 1.21±0.16
Annual survival (% ± SE) 30.4±12.9a
Capture probability (% ± SE) 56.6±20.8
a The estimate of annual survival applies to the time period between the sampling occasion in 2010 and thesampling occasion in 2011
Urban Ecosyst
including POPAN operate on the premise that proportion of marked animals recaptured at a givensampling occasion, also referred to as return rate (R), is a product of apparent survival (ϕ) andprobability of capture given that the animal is alive (p).
R ¼ ϕ� p
It follows that the estimate for annual apparent survival (ϕ) from the POPAN model couldbe compared to an estimate derived from the observed return rate, to assess whether the twoare roughly in agreement. This was possible because in addition to observed return rates, wehad population size estimates for the study population generated using resight surveys andthe Joint Hypergeometric Estimator (JHE). In 2010, 78 rabbits were trapped and 11 (14.1 %)were recaptured the following year. On the basis of resight surveys, the population estimatefrom 2011 was 109 rabbits. The probability of capture for 2011 was 34.9 %, as we capturedand marked a total of 38 rabbits in 2011, out of a total of 109 rabbits estimated to be in thepopulation. We divided the observed return rate of 14.1 % by the 34.9 % probability ofcapture to estimate apparent survival as 40.4 %. This crude secondary estimate fell withinone standard error of the survival estimate obtained with POPAN, suggesting that our annualsurvival estimate was reasonable.
Body mass
Mean body mass of rabbits was 1.18±0.15 kg SD, ranging from 0.8 kg to 1.6 kg. We used a2–tailed t-test to compare masses of rabbits in 2011 and 2012 (Table 1). Body masses in2012 were greater than body masses in 2011 (P=0.02, df=94).
Spatial characteristics
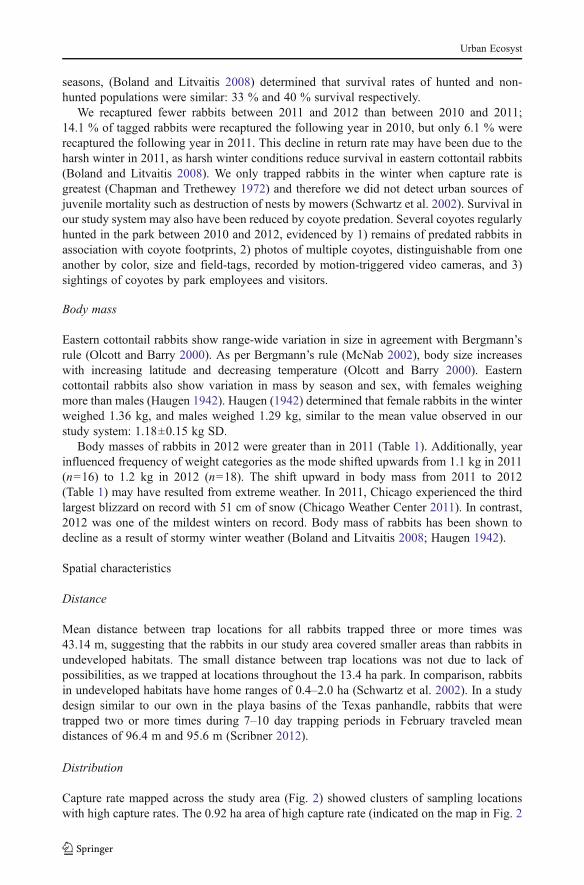
Mean distance between recaptures for rabbits captured three or more times was 43.14±30.01 m SD, n=41. To illustrate spatial variation in capture rate across our study area, weperformed kriging in the ArcGIS 10.1 extension Spatial Analyst (Environmental SystemsResearch Institute, Redlands, CA). We used the output to interpolate a map of capture rateacross the study area (Fig. 2). Overall, we achieved high capture rates: 51.7 % in 2010,24.5 % in 2011, and 51.3 % in 2012.
Discussion
This comprehensive study quantitatively investigated population dynamics and spatial habitatuse in eastern cottontail rabbits in an urban park setting, the Lincoln Park Zoo in Chicago,Illinois. The methods used here could be applied to determine rabbit population density in arange of urban, suburban, and even rural situations in which rabbit damage to gardens oragricultural crops is of concern. Rabbits in the study area occurred in dense populations: 9.4 to16.3 rabbits/ha. Annual apparent survival in the study population was 30.4±12.9 % SE and themean body mass was 1.18±0.15 kg SD, both of which are similar to populations in naturalhabitats in the same season. Mean distance between capture locations for rabbits trapped threeor more times was only 43.14 m, suggesting that the rabbits in our study area covered a smallerarea than rabbits in undeveloped habitats. Spatial distribution of capture rate across the studyarea (Fig. 2) showed fine scale variation, supporting the generalization that urbanization canheighten spatial variation in abundance (Marchetti et al. 2006; Trubl et al. 2012).
Urban Ecosyst
Population dynamics
Population density
The population density in our study site was 16.3 rabbits/ha in 2010, 10.0 rabbits/ha in 2011,and 9.4 rabbits/ha in 2012 (Table 1). For comparison, in an undeveloped habitat in Michiganin the fall, rabbit densities were 0.08–0.35 rabbits/ha (Haugen 1942). In an agroecosystem innorthern Italy (37.1 % cropland), density of eastern cottontail rabbits was 0.54 rabbits/ha,determined by spotlight counts along transects (Rosin et al. 2010). Edwards and Eberhardt(1967) report densities of 1.2 rabbits/ha and 1.6 rabbits/ha. Density estimated for rabbits inthe playa lake basins of the Texas panhandle matched more closely with our own: 8.2rabbits/ha and 11.6 rabbits/ha (Scribner 2012). Hence, for the Midwestern United States, thedensity of rabbits in our study area was comparatively high.
Survival
Annual apparent survival of adult rabbits in our system was 30.4±12.9 % SE (Table 1),which is similar to annual survival of populations in natural areas. Haugen (1942) deter-mined that in undeveloped settings, approximately 20 % of juvenile rabbits survived untilthe fall in the year of their birth. Rose (1977) reported that annual survival of adult rabbitswas 25 % in populations without hunting. By following radio-collared rabbits at Cape CodNational Seashore in Massachusetts for an 8.5 month period in 2006 between hunting
Fig. 2 The 13.4 ha study area in Lincoln Park, Chicago, Illinois, is outlined (left and right). Black dots depictlocations of traps (samples) where we caught a rabbit on at least one occasion, and for which we had datapertaining to capture rate for three or four sampling occasions (left). White dots depict locations of all othertraps (restricted samples). Capture rate at sampled locations (excluding restricted samples) is interpolatedusing kriging (right). The capture rate for each sampled trap location was calculated as incidents of capturedivided by number of sampling occasions
Urban Ecosyst
seasons, (Boland and Litvaitis 2008) determined that survival rates of hunted and non-hunted populations were similar: 33 % and 40 % survival respectively.
We recaptured fewer rabbits between 2011 and 2012 than between 2010 and 2011;14.1 % of tagged rabbits were recaptured the following year in 2010, but only 6.1 % wererecaptured the following year in 2011. This decline in return rate may have been due to theharsh winter in 2011, as harsh winter conditions reduce survival in eastern cottontail rabbits(Boland and Litvaitis 2008). We only trapped rabbits in the winter when capture rate isgreatest (Chapman and Trethewey 1972) and therefore we did not detect urban sources ofjuvenile mortality such as destruction of nests by mowers (Schwartz et al. 2002). Survival inour study system may also have been reduced by coyote predation. Several coyotes regularlyhunted in the park between 2010 and 2012, evidenced by 1) remains of predated rabbits inassociation with coyote footprints, 2) photos of multiple coyotes, distinguishable from oneanother by color, size and field-tags, recorded by motion-triggered video cameras, and 3)sightings of coyotes by park employees and visitors.
Body mass
Eastern cottontail rabbits show range-wide variation in size in agreement with Bergmann’srule (Olcott and Barry 2000). As per Bergmann’s rule (McNab 2002), body size increaseswith increasing latitude and decreasing temperature (Olcott and Barry 2000). Easterncottontail rabbits also show variation in mass by season and sex, with females weighingmore than males (Haugen 1942). Haugen (1942) determined that female rabbits in the winterweighed 1.36 kg, and males weighed 1.29 kg, similar to the mean value observed in ourstudy system: 1.18±0.15 kg SD.
Body masses of rabbits in 2012 were greater than in 2011 (Table 1). Additionally, yearinfluenced frequency of weight categories as the mode shifted upwards from 1.1 kg in 2011(n=16) to 1.2 kg in 2012 (n=18). The shift upward in body mass from 2011 to 2012(Table 1) may have resulted from extreme weather. In 2011, Chicago experienced the thirdlargest blizzard on record with 51 cm of snow (Chicago Weather Center 2011). In contrast,2012 was one of the mildest winters on record. Body mass of rabbits has been shown todecline as a result of stormy winter weather (Boland and Litvaitis 2008; Haugen 1942).
Spatial characteristics
Distance
Mean distance between trap locations for all rabbits trapped three or more times was43.14 m, suggesting that the rabbits in our study area covered smaller areas than rabbits inundeveloped habitats. The small distance between trap locations was not due to lack ofpossibilities, as we trapped at locations throughout the 13.4 ha park. In comparison, rabbitsin undeveloped habitats have home ranges of 0.4–2.0 ha (Schwartz et al. 2002). In a studydesign similar to our own in the playa basins of the Texas panhandle, rabbits that weretrapped two or more times during 7–10 day trapping periods in February traveled meandistances of 96.4 m and 95.6 m (Scribner 2012).
Distribution
Capture rate mapped across the study area (Fig. 2) showed clusters of sampling locationswith high capture rates. The 0.92 ha area of high capture rate (indicated on the map in Fig. 2
Urban Ecosyst
as the quarter equal interval polygon with capture rate of 69–79 %) included a service yardbehind a building, adjacent to a fenced woodland habitat. The map of capture rate suggestedfine scale variation in population abundance that supported the generalization that urbanareas can heighten spatial variation, as has been documented in black widows (LatrodectusHesperus) (Trubl et al. 2012) and some fish species (Marchetti et al. 2006).
We suggest using giving-up densities (GUDs) to investigate the unevenness of populationabundance suggested by our interpolated map of capture rate (Abu Baker and Brown 2009;Brown 1988). Abu Baker and Brown (2009) used GUDs to characterize the response ofcottontail rabbits to resource patch characteristics including substrate depth and prey rich-ness (Abu Baker and Brown 2009). Predation risk also affects giving up densities (Brown1988) as foragers facing increased predation risk may react by increasing vigilance behaviorat the expense of foraging. Therefore, giving up densities increase (more food is left behindin the patch) with increased predation risk. If rabbits perceived the 0.92 ha area of highcapture rate, which included a service yard and associated woodland habitat, as beingparticularly safe, this perception could be assessed using GUDs.
Implications for rabbit management in urban landscapes
Little has been formally studied about urban rabbits, with a noteworthy exception: AbuBaker and Brown (2009). However, Abu Baker and Brown (2009) focused exclusively onforaging behavior. Herein, we expand the knowledge base of urban wildlife populationdynamics by documenting the use of visual mark-resight surveys to obtain precise popula-tion estimates for rabbits in an urban setting. This method could be used by managers toestimate pre- and post-management population sizes of rabbits or other conflict species inparks and green spaces. Mark-recapture would likely yield similar results but requiressignificantly more effort and resources (White and Burnham 1999).
Mark-resight allowed us to obtain a rabbit population estimate with adequate precision totheoretically inform management. This technique, paired with damage surveys, could beused to determine the relationship between population size and vegetative damage. Reduc-tion in the number or density of a nuisance species is a common response to human-wildlifeconflict (Messmer 2009), but without data supporting the relationship between populationsize and damage, efforts to reduce population size may not meet management objectives.Also, removal of rabbits may be complicated in high density areas, because adjacent areasmay provide a source for rabbits following removal (Conover 2010). Notwithstanding thedifficulties associated with removal of rabbits, if population size and damage are correlated,management programs with the objective of ameliorating vegetative damage caused byrabbits should focus on reducing population size.
This research adds to a growing body of knowledge about the function of urbanecosystems, and the role of one of its most commonly encountered urban wildlife inhabi-tants, the cottontail rabbit. While there is an increasing interest in urban wildlife (Magleet al. 2012), information on this common and conspicuous species is lacking. The chiefobjective of this research was to provide background information that would inform soundmanagement decisions. The mark-resight method employed here could be used by man-agers to estimate pre- and post-management population sizes of conflict species in parksand green spaces, e.g. Canada geese (Branta Canadensis), provided that the species istrappable, visible, and individuals have relatively small home ranges. This type of small-scale research is an example of applying scientific rigor to improve understanding of ahuman-wildlife conflict and has the potential to serve as a model for institutions that faceherbivore damage-management challenges.
Urban Ecosyst
Acknowledgments The authors thank Dr. J. Brown, Dr. S. Thompson, and an anonymous reviewer forhelpful comments. Lincoln Park Zoo and the Davee Foundation provided funding. Lincoln Park Zoo’sInstitutional Animal Care and Use Committee approved our protocol.
References
Abu Baker MA, Brown JS (2009) Patch area, substrate depth, and richness affect giving-up densities: a testwith mourning doves and cottontail rabbits. Oikos 118:1721–1731
Allen DL (1938) Breeding of the cottontail rabbit in Southern Michigan. Am Midl Nat 20:464–469Arnason AN, Schwarz CJ (1995) POPAN-4: enhancements to a system for the analysis of mark-recapture data
from open populations. J Appl Stat 22:785–800Balkcom GD (2010) Demographic parameters of rural and urban adult resident Canada geese in Georgia. J
Wildl Manag 74:120–123Barrio IC, Acevedo P, Tortosa FS (2010a) Assessment of methods for estimating wild rabbit population
abundance in agricultural landscapes. Eur J Wildl Res 56:335–340Barrio IC, Bueno CG, Tortosa FS (2010b) Alternative food and rabbit damage in vineyards of southern Spain.
Agric Ecosyst Environ 138:51–54Barrio IC, Villafuerte R, Tortosa FS (2011) Harbouring pests: rabbit warrens in agricultural landscapes. Wildl
Res 38:756–761Barrio IC, Bueno CG, Villafuerte R, Tortosa FS (2013) Rabbits, weeds and crops: can agricultural intensifi-
cation promote wildlife conflicts in semiarid agro-ecosystems? J Arid Environ 90:1–4Boitani L, Fuller TK (2000) Research techniques in animal ecology: controversies and consequences.
Columbia University Press, New YorkBoland KM, Litvaitis JA (2008) Role of predation and hunting on eastern cottontail mortality at Cape Cod
National Seashore, Massachusetts. Can J Zool 86:918–927Borchers DL, Zucchini W, Fewster RM (1998) Mark-recapture models for line transect surveys. Biometrics
54:1207Boyd RC, Henry JJ (1991) Cottontail rabbit habitat use on Delaware wildlife area, Ohio. Ohio J Sci 91:148–153Brown JS (1988) Patch use as an indicator of habitat preference, predation risk, and competition. Behav Ecol
Sociobiol 22:37–47Bruce JS, Twigg LE (2005) The reintroduction, and subsequent impact, of rabbit haemorrhagic disease virus
in a population of wild rabbits in south-western Australia. Wildl Res 32:139–150Cabezas S, Blas J, Marchant TA, Moreno S (2007) Physiological stress levels predict survival probabilities in
wild rabbits. Horm Behav 51:313–320Chapman JA, Trethewey DEC (1972) Factors affecting trap responses of introduced eastern cottontail rabbits.
J Wildl Manag 36:1221–1226Chicago Metropolitan Agency for Planning (2011) Latino population growth drives metropolitan Chicago’s
population growth. In: CMAP Moving Forward. http://www.cmap.illinois.gov/moving-forward.Accessed 10 Apr 2013
Chicago Weather Center (2011) Blizzard of 2011: 3rd snowiest. In: Chicago Weather Center.articles.chicagobreakingnews.com. Accessed 6 Apr 2013
Conover MR (2010) Resolving human-wildlife conflicts: the science of wildlife damage management. CRCPress, Boca Raton
Conover MR, Decker DJ (1991) Wildlife damage to crops: perceptions of Agricultural and Wildlife Profes-sionals in 1957 and 1987. Wildl Soc Bull 19:46–52
Conover MR, Pitt WC, Kessler KK et al (1995) Review of human injuries, illnesses, and economic lossescaused by wildlife in the United States. Wildl Soc Bull 23:407–414
Edwards WR, Eberhardt L (1967) Estimating cottontail abundance from livetrapping data. J Wildl Manag31:87–96
Feinstein J (2011) Field guide to urban wildlife. Stackpole Books, MechanicsburgFerreira C (2012) European rabbit research in the Iberian Peninsula: state of the art and future perspectives.
Eur J Wildl Res 58:885–895Ford L (2003) Rabbits plundering plants in Grant Park. Chicago TribuneGehrt SD, Anchor C, White LA (2009) Home range and landscape use of coyotes in a metropolitan landscape:
conflict or coexistence? J Mammal 90:1045–1057
Urban Ecosyst
Graser WH, Gehrt SD, Hungerford LL, Anchor C (2012) Variation in demographic patterns and populationstructure of raccoons across an urban landscape. J Wildl Manag 76:976–986
Haugen AO (1942) Life history studies of the cottontail rabbit in southwestern Michigan. Am Midl Nat28:204–244
Hill D (2005) Handbook of biodiversity methods: survey, evaluation and monitoring. Cambridge UniversityPress, Cambridge
Hygnstrom SE (2010) Prevention and control of wildlife damage: a handbook for people who deal withwildlife damage problems. DIANE Publishing Inc., Collingdale
Lepitzki DAW, Woolf A, Bunn BM (1992) Parasites of cottontail rabbits of Southern Illinois. J Parasitol78:1080–1083
Letty J, Marchandeau S, Clobert J, Aubineau J (2000) Improving translocation success: an experimental studyof anti-stress treatment and release method for wild rabbits. Anim Conserv 3:211–219
Magle SB, Hunt VM, Vernon M, Crooks KR (2012) Urban wildlife research: past, present, and future. BiolConserv 155:23–32
Marchetti MP, Lockwood JL, Light T (2006) Effects of urbanization on California’s fish diversity: differen-tiation, homogenization and the influence of spatial scale. Biol Conserv 127:310–318
Mason JR, Hollick J, Kimball BA, Johnston JJ (1999) Repellency of deer away big game repellent® to EasternCottontail Rabbits. J Wildl Manag 63:309–314
McGowan MJ, Camin JH, McNew RW (1979) Field study of the relationship between skin-sensitizingantibody production in the cottontail rabbit, sylvilagus floridanus, and infestation by the rabbit tick,haemaphysalis leporispalustris (acari: ixodidae). J Parasitol 65:692–699
Mcilroy J, Gifford E (1991) Effects on nontarget animal populations of a rabbit trail-baiting campaign with1080-poison. Wildl Res 18:315–325
McKeever S, Schubert JH, Moody MD et al (1958) Natural occurrence of tularemia in marsupials, carnivores,lagomorphs, and large rodents in Southwestern Georgia and Northwestern Florida. J Infect Dis 103:120–126
McLeod SR, Saunders G, Twigg LE et al (2007) Prospects for the future: is there a role for virally vectoredimmunocontraception in vertebrate pest management? Wildl Res 34:555–566
McNab BK (2002) The physiological ecology of vertebrates: a view from energetics. Cornell UniversityPress, Ithaca
Melville GJ, Tracey JP, Fleming PJS, Lukins BS (2008) Aerial surveys of multiple species: critical assump-tions and sources of bias in distance and mark-recapture estimators. Wildl Res 35:310–319
Messmer TA (2000) The emergence of human–wildlife conflict management: turning challenges into oppor-tunities. Int Biodeterior Biodegrad 45:97–102
Messmer TA (2009)Human–wildlife conflicts: emerging challenges and opportunities. HumWildl Conflicts 3:10–17Moskovits DK, Fialkowski C, Mueller GM et al (2004) Chicago wilderness—a new force in urban conser-
vation. In: AlfsenNorodom C, Lane BD, Corry M (eds) Urban biosphere and society: partnership of cities.New York Academy of Sciences, New York, pp 215–236
Olcott SP, Barry RE (2000) Environmental correlates of geographic variation in body size of the easterncottontail (Sylvilagus floridanus). J Mammal 81:986–998
Palomares F (2001) Comparison of 3 methods to estimate rabbit abundance in a Mediterranean environment.Wildl Soc Bull 29:578–585
Peavey CA, Lane RS, Kleinjan JE (1997) Role of small mammals in the ecology of Borrelia burgdorferi in aperi-urban park in north coastal California. Exp Appl Acarol 21:569–584
Petrides GA (1951) The determination of sex and age ratios in the cottontail rabbit. Am Midl Nat 46:312–336Prange S, Gehrt SD, Wiggers EP (2004) Influences of anthropogenic resources on raccoon (Procyon lotor)
movements and spatial distribution. J Mammal 85:483–490Rose GB (1977) Mortality rates of tagged adult cottontail rabbits. J Wildl Manag 41:511–514Rosin AV, Meriggi A, Perez SS (2010) Density and habitat requirements of introduced Eastern cottontail
Sylvilagus floridanus in northern Italy. Acta Theriol 55:139–151Rueda M, Rebollo S, Bravo LG (2008) Age and season determine European rabbit habitat use in Mediter-
ranean ecosystems. Acta Oecol 34:266–273Schwartz CW, Schwartz ER, Missouri Dept. of Conservation (2002) The wild mammals of Missouri.
University of Missouri Press, ColumbiaScribner KT (2012) Population ecology and genetics of the eastern cottontail rabbit on west Texas playa
basins. Dissertation, Texas Tech UniversitySmith AT, Boyer AF (2008) Oryctolagus cuniculus. IUCN Red List of Threatened Species. Version 2013.1Smith RH, Cheatum EL (1944) Role of ticks in decline of an insular cottontail population. J Wildl Manag
8:311–317Smith GC, Prickett AJ, Cowan DP (2007) Costs and benefits of rabbit control options at the local level. Int J
Pest Manag 53:317–321
Urban Ecosyst
Traweger D, Travnitzky R, Moser C et al (2006) Habitat preferences and distribution of the brown rat (Rattusnorvegicus Berk.) in the city of Salzburg (Austria): implications for an urban rat management. J Pest Sci79:113–125
Trubl P, Gburek T, Miles L, Johnson JC (2012) Black widow spiders in an urban desert: Population variationin an arthropod pest across metropolitan Phoenix, AZ. Urban Ecosyst 15:599–609
Twigg LE, Gray GS, Massam MC et al (2001) Evaluation of bait stations for control of urban rabbits. WildlRes 28:299–310
University of Illinois at Urbana-Champaign (2004) The Illinois Natural Resources Geospatial Data Clearing-house, Illinois. http://www.isgs.uiuc.edu/nsdihome/. Accessed 2 May 2012
Van der Merwe M, Brown JS, Jackson WM (2005) The coexistence of fox (Sciurus niger) and gray (S.caroliniensis) squirrels in the Chicago metropolitan area. Urban Ecosyst 8:335–347
Washburn BE, Seamans TW (2012) Foraging preferences of Canada geese among turfgrasses: implications forreducing human–goose conflicts. J Wildl Manag 76:600–607
White GC (1996) NOREMARK: population estimation from mark-resighting surveys. Wildl Soc Bull 24:50–52White GC, Burnham KP (1999) Program mark: survival estimation from populations of marked animals. Bird
Study 46(Supplement):120–138Williams CK, Davey CC, Moore RJ et al (2007) Population responses to sterility imposed on female European
rabbits. J Appl Ecol 44:291–301Woolf A, Shoemaker DR, Cooper M (1993) Evidence of tularemia regulating a semi-isolated cottontail rabbit
population. J Wildl Manag 57:144–157Young JG, Henke SE (1999) Effect of domestic rabbit urine on trap response in cottontail rabbits. Wildl Soc
Bull 27:306–309
Urban Ecosyst