SURVEY TRAINING INSTITUTE CADASTRAL SURVEY GEOSPATIAL INTEROPERABILITY AND WEB ENABLED GIS by...
57
SURVEY TRAINING INSTITUTE CADASTRAL SURVEY GEOSPATIAL INTEROPERABILITY AND WEB ENABLED GIS by B.N.Dash
-
date post
20-Dec-2015 -
Category
Documents
-
view
227 -
download
2
Transcript of SURVEY TRAINING INSTITUTE CADASTRAL SURVEY GEOSPATIAL INTEROPERABILITY AND WEB ENABLED GIS by...
SURVEY TRAINING INSTITUTE
CADASTRAL SURVEY GEOSPATIAL INTEROPERABILITY
AND WEB ENABLED GIS
by
B.N.DashSuperintending Surveyor

CADASTRAL SURVEY
Historical Background:Historical Background:
The Moghul revenue administration demanded precise measurement of productive cultivated land.
They used llahi Gaz a measure of length which was divided into 24 equal parts and each was called tussuz. However ,there was a variation of Gaz in Moghal India.
The Bigha was a land of 60*60 Gaz.The larger unit was the Kos each consisting of 50 llahi Gaz or 400 poles.
Each pole was of length 12.5 Gaz.Thus Kos was a length of 5000 Gaz.
During Chola period in Tamilnadu, the smallest unit used was a Viral(finger) 12virals makes a chain, 24virals makes a muzham(cubit).
Muzhakot was a 9 ft or 12 ft long used as measuring rod.The smallest land plot was 12 ft square called KUZHI.
Hundred Kuzhi make a Kaani.Five Kannis was VELI. Similarly in Western India there was a different system of measurement for assessing the tax.
British used Distance & Angular measurement for route map.
In India the Triangulation by George Everest could make a better accurate map.
But the states of India have different procedures for making maps and till now the whole India has not been brought into one system.
VARIOUS PROCEDURE TILL NOW ADOPTED:• Plane table traverse
• Theodolite Traverse(Angle by Vernior Theodolite)
• Rectification of Photographs
• Photogrammetry from Large scale photographs
• Digital photogrammetry using photos
• Digital photogrammetry using Satellite Imagery
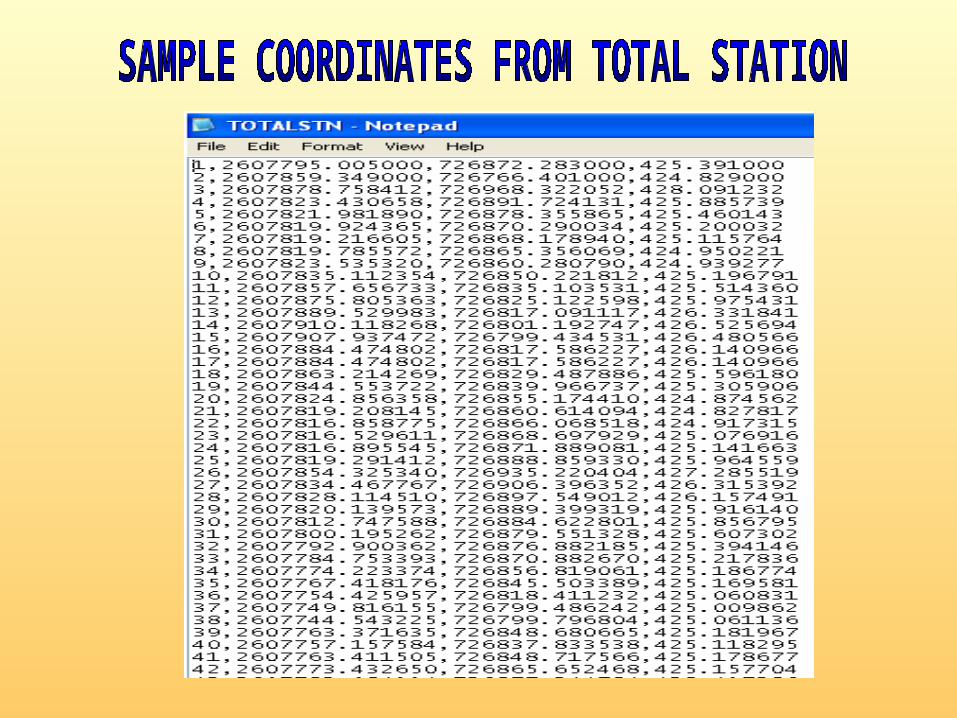
• Coordinate based through total station
• Coordinate based through GPS

Different Scales of Cadastral Map
F.P.S Metric PurposeF.P.S Metric PurposeSystemSystem SystemSystem
16 16 " to 1 Mile 1:4,000 " to 1 Mile 1:4,000 For CultivatedFor Cultivated Fields Fields
32 32 " to 1 Mile 1:2,000 " to 1 Mile 1:2,000 For smaller field plots For smaller field plots
small towns small towns ,,costlycostly
landslands
64 64 " to 1 Mile 1:1,000 " to 1 Mile 1:1,000 For towns and citiesFor towns and cities
128128" to 1 Mile 1:500 " to 1 Mile 1:500 For very large citiesFor very large cities
REQUIREMENT OF HARDWARE:
PENTIUM 4
SCANNER A0 SIZE
PLOTTER A0 SIZE
INKJET PRINTER A4 SIZE

REQUIREMENT OF SOFTWARE:
CAD SOFTWARE LIKE AUTOCAD/MICROTATION
EDGE ADJUSTMENT SOFTWARE
PROJECTION MAKING SOFTWARE
ARCINFO/GRAM++/GEOMEDIA FOR LIS/GIS
INDIGENOUS SOFTWARES FOR PLOTMAPS
INDIGENOUS SOFTWARES TO MEET SPECIFIC REQUIREMENTS
The Land information system is aGovernment integrated infrastructure deliverysystem to facilitate the user urban and Ruralpeople and to the Government officials for smart decision making.

In this scenario the Central and State government should come forward to make an integrated system. The government of India and the state governments should come forward to have a land information system. It is also required to change the old policy framework which coordinates the collection, display, access to Land information system. At the end the integrated system can be put in the web for easy accessing.
Inaccurate Finding out area is a raw procedure Procedure followed inaccurate (Plane table traverse, Vernier theodolite). Adjustments not done between starts and ends Error thrown to government areas like (Forest areas / Waste land) Updation is difficult Apparatus used were very inaccurate
Adjustments by Amins (in the hands of under matriculate people)
Play/Adjustment can be made with divider by amins
More litigations arose in Rural area than Urban area
Cannot be printed to any scale
More and more inadvantageous
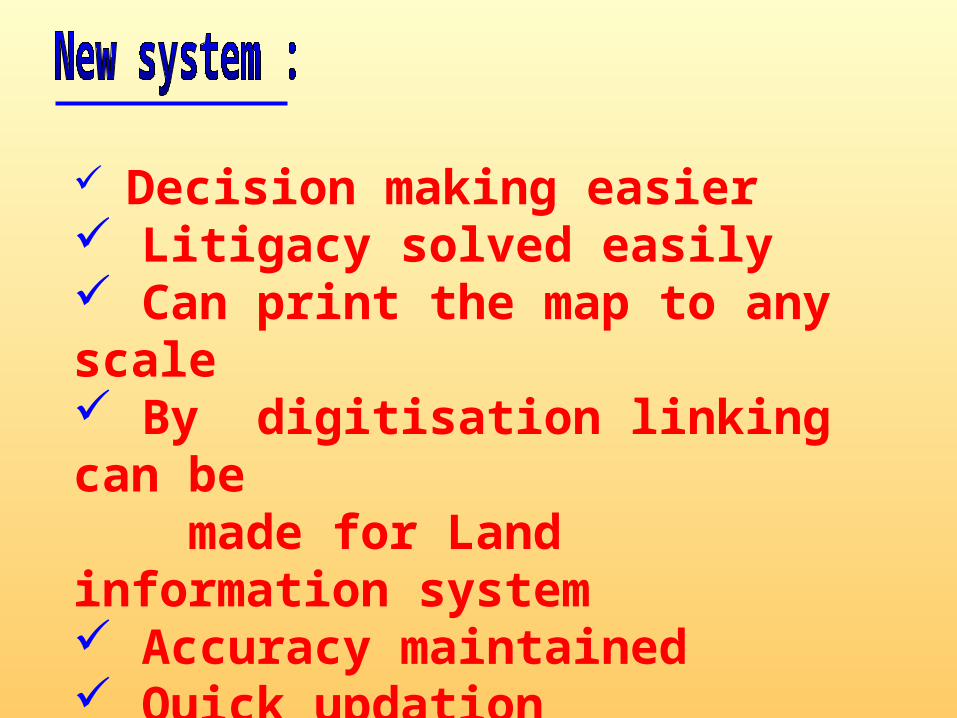
Decision making easier Litigacy solved easily Can print the map to any scale By digitisation linking can be made for Land information system Accuracy maintained Quick updation
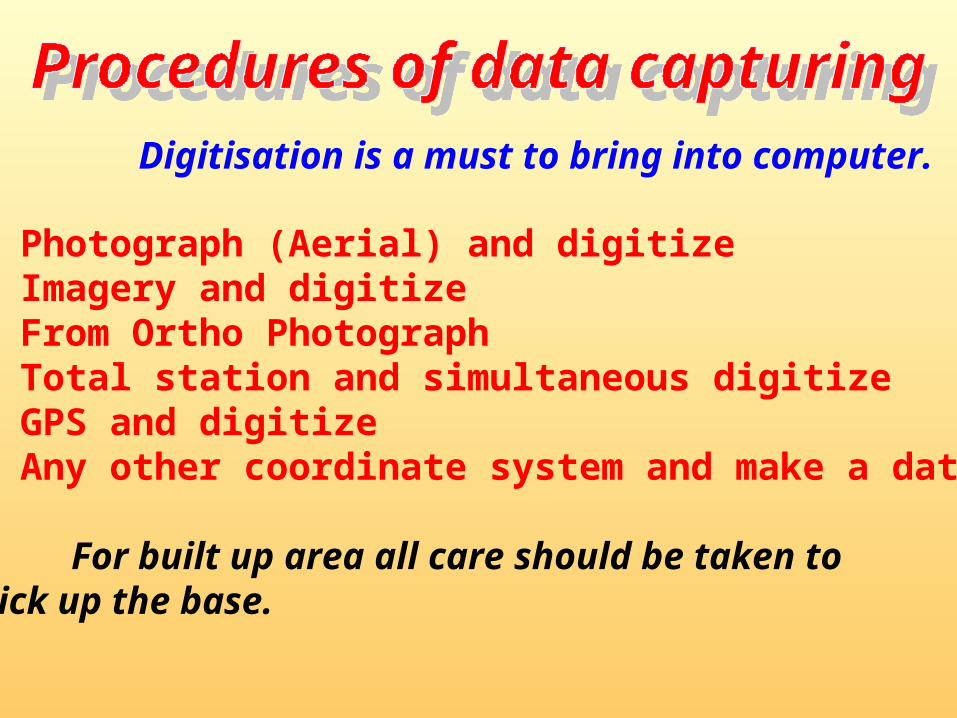
Digitisation is a must to bring into computer.
• Photograph (Aerial) and digitize• Imagery and digitize• From Ortho Photograph• Total station and simultaneous digitize• GPS and digitize• Any other coordinate system and make a database
For built up area all care should be taken topick up the base.
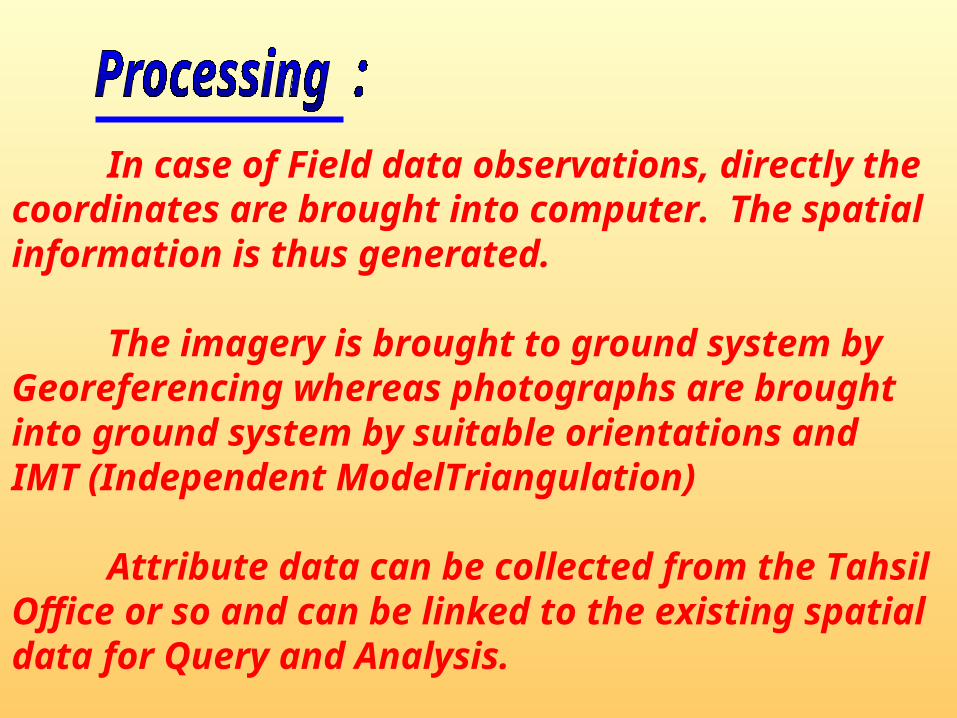
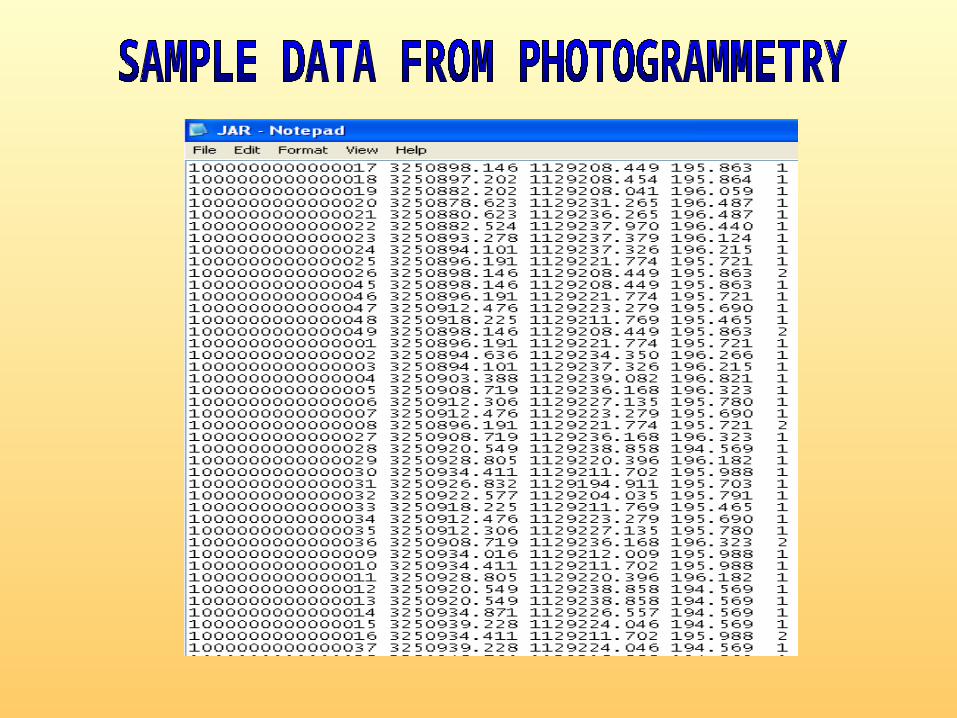
In case of Field data observations, directly the coordinates are brought into computer. The spatialinformation is thus generated.
The imagery is brought to ground system by Georeferencing whereas photographs are broughtinto ground system by suitable orientations andIMT (Independent ModelTriangulation)
Attribute data can be collected from the TahsilOffice or so and can be linked to the existing spatialdata for Query and Analysis.

Imagery / Photographs : The area covered by trees, water & shadow
is a problem which should be again collected by sending the field hands to field by Field measurement observation (through optical square/Total Station/GPS).
Built up area : Here the cost is high. All care should be taken to capture the coordinates by ground method.

Ground truth : The owner does have belief with his old area and does not accept the change in area in any form though his land binding is intact.
However, it has been proved with 0.5 metre accuracy established from the photograph (10,000 scale)and correction / insertion / deletion made by field measurement observation.
The survey from imagery (IKONOS & QUICKBIRD)will give correct result if the georeferencing is made withshort interval and feet that one data of QUICKBIRD maybe divided in A4 size of data and made the referencing.
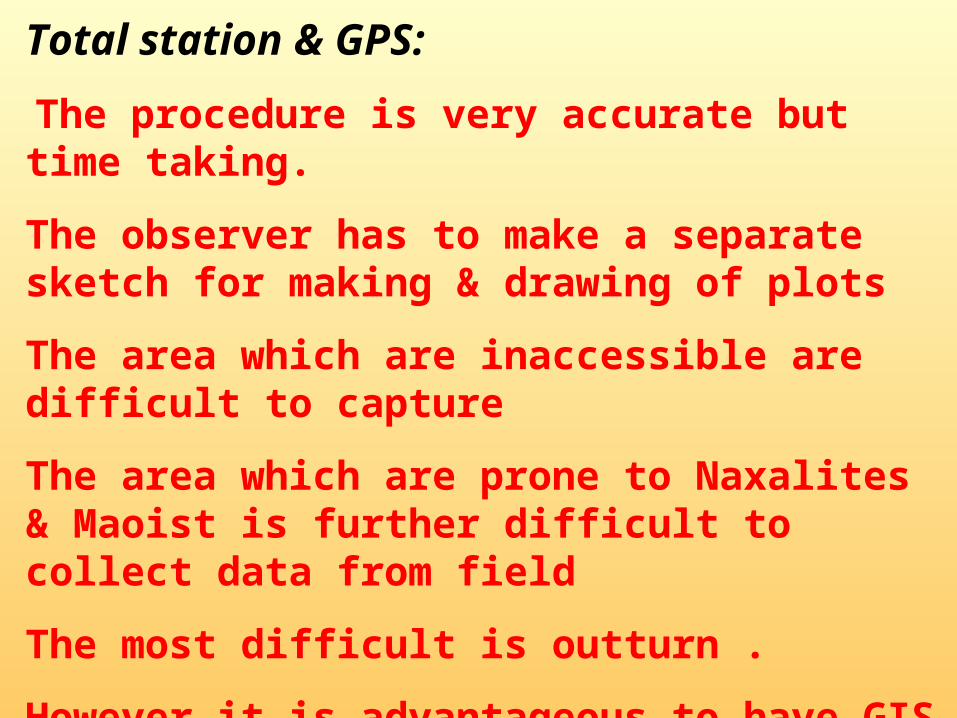
Total station & GPS:
The procedure is very accurate but time taking.
The observer has to make a separate sketch for making & drawing of plots
The area which are inaccessible are difficult to capture
The area which are prone to Naxalites & Maoist is further difficult to collect data from field
The most difficult is outturn .
However it is advantageous to have GIS attributes simultaneously.

Change of course of the river Government plots like roads, waste land area may be more or less which is not be acceptable to Govt. heads. Survey of village boundary are not shown/destroyed Old policy a bottle neck Some imaginary line drawn for dividing plots not traceable on ground To incorporate the missing details arose by Photogrammetry / Imagery Outurns Manpower Educating in current system
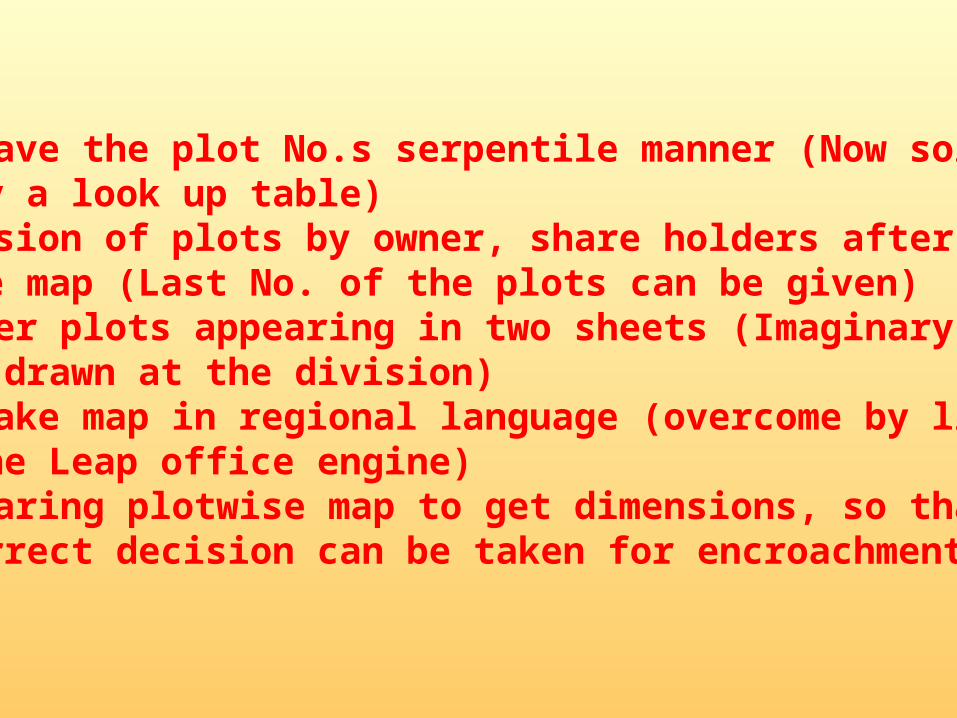
To have the plot No.s serpentile manner (Now solved by a look up table) Division of plots by owner, share holders after making the map (Last No. of the plots can be given) Bigger plots appearing in two sheets (Imaginary line is drawn at the division) To make map in regional language (overcome by linking the Leap office engine) Preparing plotwise map to get dimensions, so that correct decision can be taken for encroachments
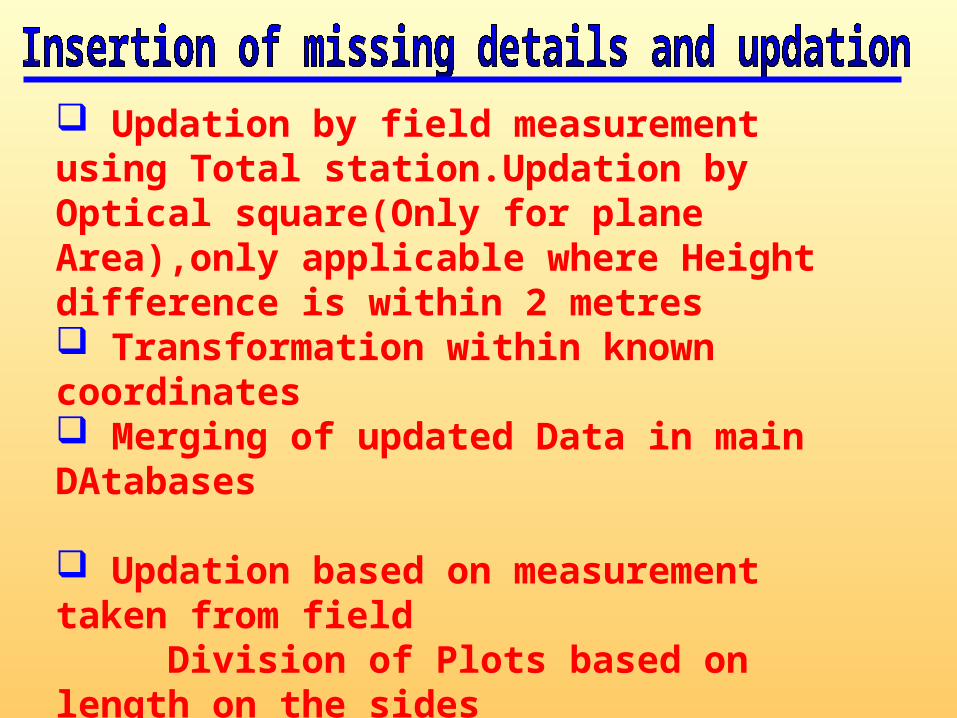
Updation by field measurement using Total station.Updation by Optical square(Only for plane Area),only applicable where Height difference is within 2 metres Transformation within known coordinates Merging of updated Data in main DAtabases
Updation based on measurement taken from field Division of Plots based on length on the sides
Simultaneous updation of Edge and Adjacency is required
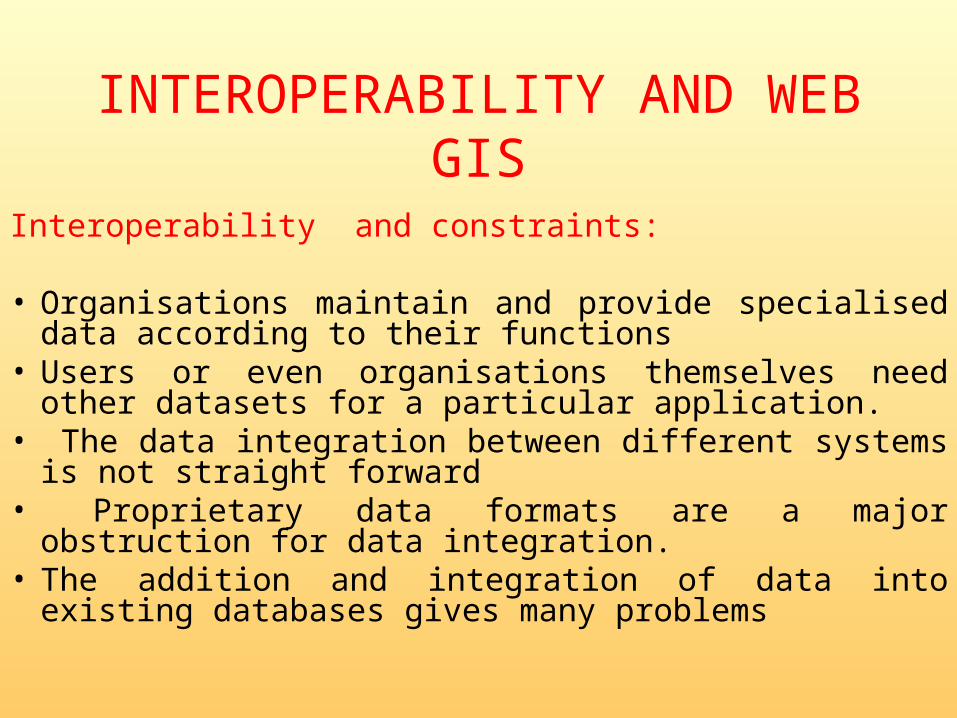
INTEROPERABILITY AND WEB GIS
Interoperability and constraints:
• Organisations maintain and provide specialised data according to their functions
• Users or even organisations themselves need other datasets for a particular application.
• The data integration between different systems is not straight forward
• Proprietary data formats are a major obstruction for data integration.
• The addition and integration of data into existing databases gives many problems
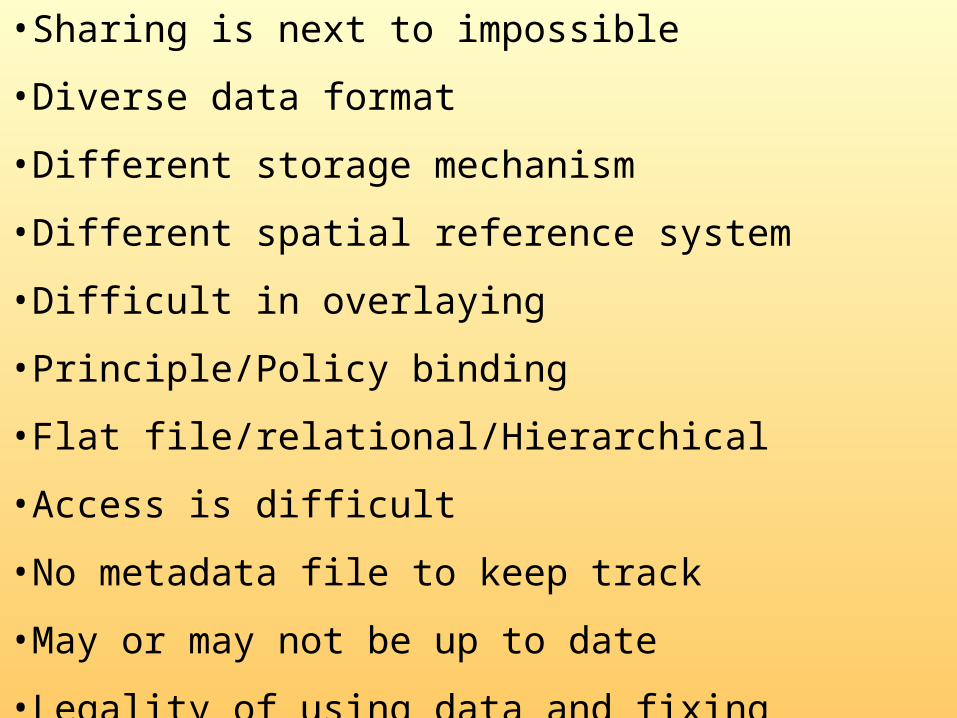
•Sharing is next to impossible
•Diverse data format
•Different storage mechanism
•Different spatial reference system
•Difficult in overlaying
•Principle/Policy binding
•Flat file/relational/Hierarchical
•Access is difficult
•No metadata file to keep track
•May or may not be up to date
•Legality of using data and fixing responsibility

REQUIREMENT OF INTEROPERABILITY:
Though constraints we must share data to avoid repetition and cost effective for which:
Converting data into common standard platform
To define a standard accessing
Flexibility in adding data
There should be heterogeneous need accessibility
Proper metada with specification and details
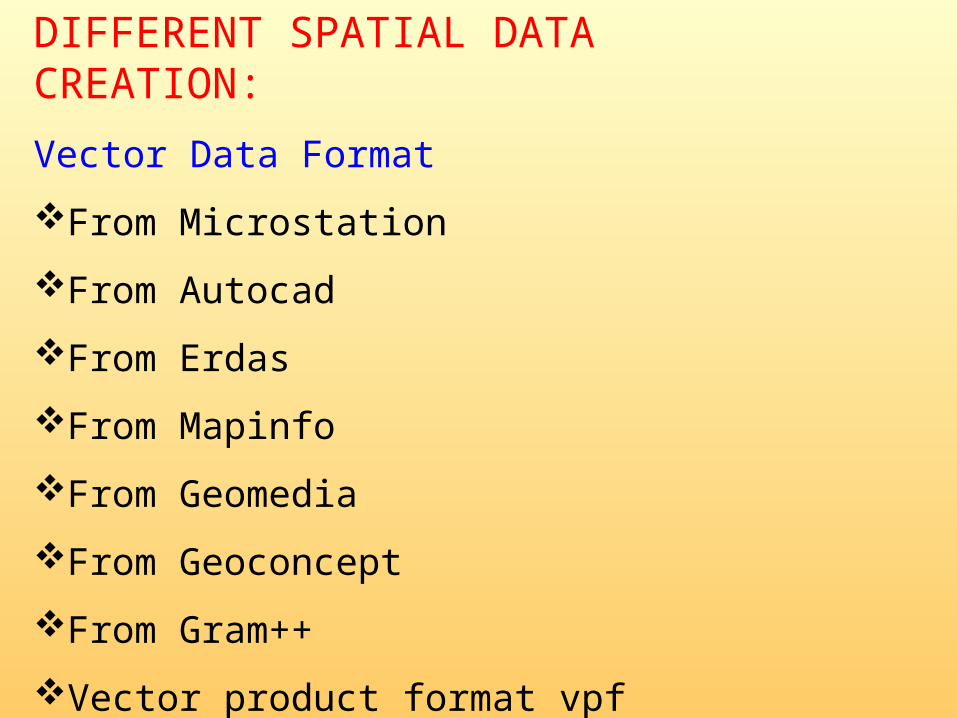
DIFFERENT SPATIAL DATA CREATION:
Vector Data Format
From Microstation
From Autocad
From Erdas
From Mapinfo
From Geomedia
From Geoconcept
From Gram++
Vector product format vpf
Raster Data Format:Bmp
Bsm
Cal
Gif
Hrf
Igs
Rle
Cot
Rgb
Jpg/Jpeg
Tif
Database Format:
Dbf
Mid
Mdb
Plane Text Format
Txt
Ps
……………………….more and more
Open GIS?The Open GIS Consortium (OGC) is "an international, member-driven, non-profit industry consortium of 258 companies, government agencies and universities participating in a consensus process to develop publicly available interface specifications and geoprocessing interoperability computing standards.
OGC supports interoperable solutions that 'geo-enable' the Web, wireless and location-based services, and mainstream IT. The specifications empower technology developers to make complex spatial information and services accessible and useful with all kinds of applications
Close relation with ISO(International Organization for Standardization)
GML ?Geography Markup Language (GML)•Wide scope of work in a broad geospatial marketplace that includes not only geographic information systems (GIS), but also mapping, earth imaging, sensor webs, and mobile wireless services.• It also highlights the importance of OGC Web services standards as part of information technology best practices for integrating geospatial processing into service oriented architectures and enterprise workflows.•A set of XML technologies for spatial data
Advantages of GML:•GML is easy to understand
•GML data can be mixed with Non spatial Data
•GML data can be mixed with imagery and video data
•GML is open and user friendly
•GML also supports to WEB servers,annotation,map own designing and spatial analysis
•GML also readable
•Defines XML-Schema, XML grammar for the encoding of geographic information including geographic features, coverages, observations, topology, geometry, coordinate reference systems, units of measure, time, and value objects
Application of GML:•Internet Mapping
•Disaster Management
•Accident and Police Investigation
•Emergency Service
•Internet GIS and GIS portals
•Muncipal and Government Services
•Land Information system
•Wireless Service
•Graphical drawing both 2D and 3D
•Semantic Data(Meta data & Relation ship)
•Transformation(Spatial & Non Spatial)
XML?(eXtensible Markup Language):XML is eXtensible Markup Language, the new-generation Web technology for representation and transmission of structured data over the Web
XML is a newly approved standard for Web documents. XML can be seen either as a big improvement over HTML (the current Web page language), or a simplified version of SGML (Standard Generalized Markup Language), ISO 8879 by the International Standards Organization(ISO)
XML is ideal for developing Web presentation and transmission techniques for geotechnical data because of the extensibility and other features of XML. XML has its own style language, XSL (eXtensible Style Language).

The XML to be used for web GIS:
If the data is in XML format, then I can access it from any operating system, as well as format it to any format, be that format another XML structure, PDF, Word documents, or HTML.
XML is also useful in isolating your content
from formatting. For instance, you could easily create the content an entire Web site in XML documents and then transformed using XSL Transformations (XSLT) into HTML.
WFS?(Web Feature Service);The OpenGIS Web Feature Service (WFS) Implementation Specification allows a client to retrieve and update geospatial data encoded in Geography Markup Language (GML) from multiple Web Feature Services.
Operation should be available in WFS:
- Create feature -Delete feature
-Update Feature
-Lock Feature
-Transaction feature -Get or query features based on spatial and non-spatial constraints
OGC Web Feature Server Interfaces model
MandatoryGetCapabilities
DesribeFeatureType
GetFeature
Optional
Transaction
LockFeature/GetFeturewithLock
Update,Delete,Insert
Two classes of WFS:
Basic WFS: This gets the feature,desribe the feature type.This is READ ONLY Web Feature Service .
Transaction WFS: This is the Web Feature Service which supports all the operation of a basic web features and also implement the transaction operation .The transaction WFS also does operation like create,update and delete operations on geographic features
LockFeature/GetFetureWithLock: WFS may be able to process a lock request on one or more instances of a feature type for the duration of transaction
When writing a WFS , we must implement the operations like:
GetCapabilities - this queries the WFS service to determine available options.It must indicates which feature types it can service and what operations are supported on each feature type
DescribeFeatureType - this retrieves the XML schema to allow the WFS client to parse the result sets to describe the structure.
GetFeature - This performs the actual query - parameters such as bounding box with cartesian coordinates and any other filters should be passed in, as appropriate, and the WFS service then returns a GML result set containing full geometry and feature attributes.
WMS?(Web Map Service):
Web Map Service (WMS) produces maps of spatially referenced data dynamically from geographic information. This international standard defines a "map" to be a portrayal of geographic information as a digital image file suitable for display on a computer screen. A map is not the data itself. WMS-produced maps are generally available in a pictorial format such as PNG,GIF or JPEG or occasionally as vector-based graphical elements in Scalable Vector Graphics (SVG)
WMS clients:
•Googlie Earth
•NASA satellite Imagery/Photographs
•gvSIG,Openlayers,Qgis
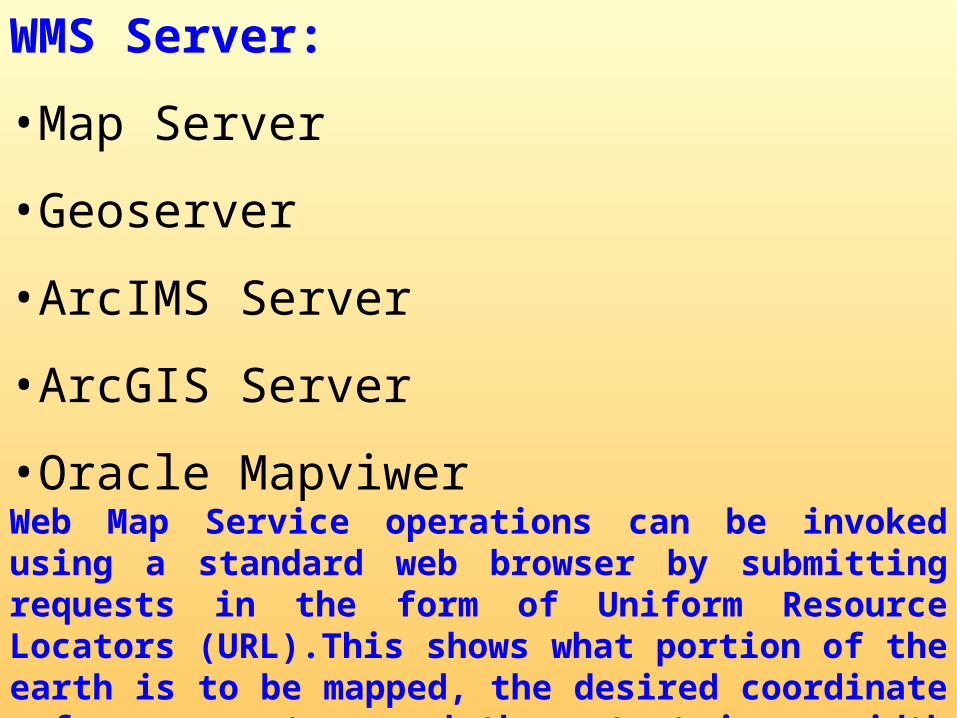
WMS Server:
•Map Server
•Geoserver
•ArcIMS Server
•ArcGIS Server
•Oracle MapviwerWeb Map Service operations can be invoked using a standard web browser by submitting requests in the form of Uniform Resource Locators (URL).This shows what portion of the earth is to be mapped, the desired coordinate reference system, and the output image width and height.
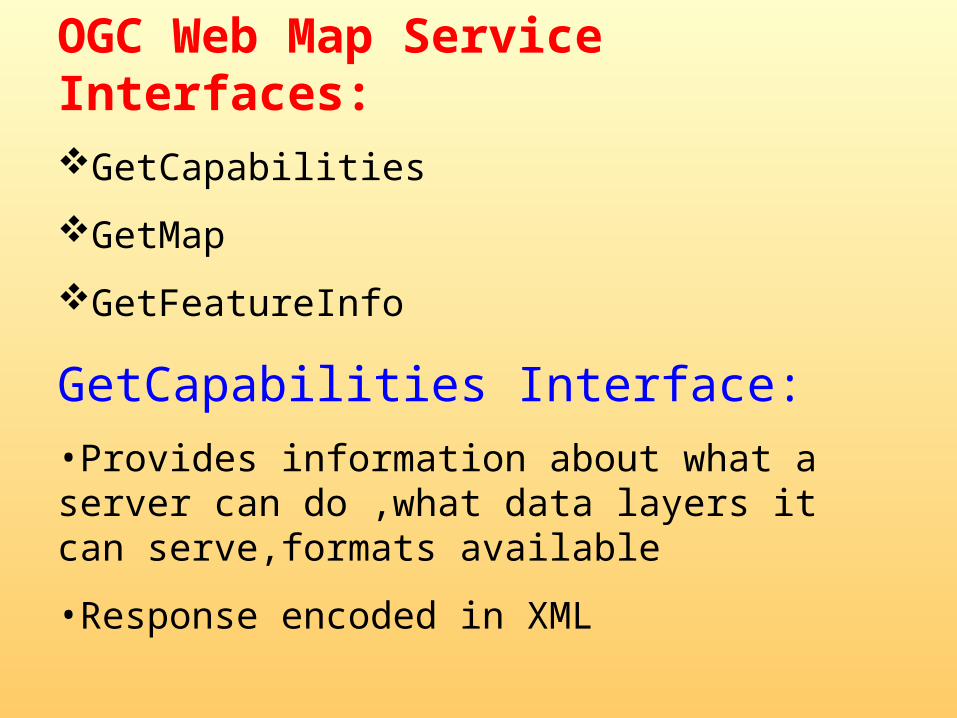
OGC Web Map Service Interfaces:GetCapabilities
GetMap
GetFeatureInfo
GetCapabilities Interface:
•Provides information about what a server can do ,what data layers it can serve,formats available
•Response encoded in XML
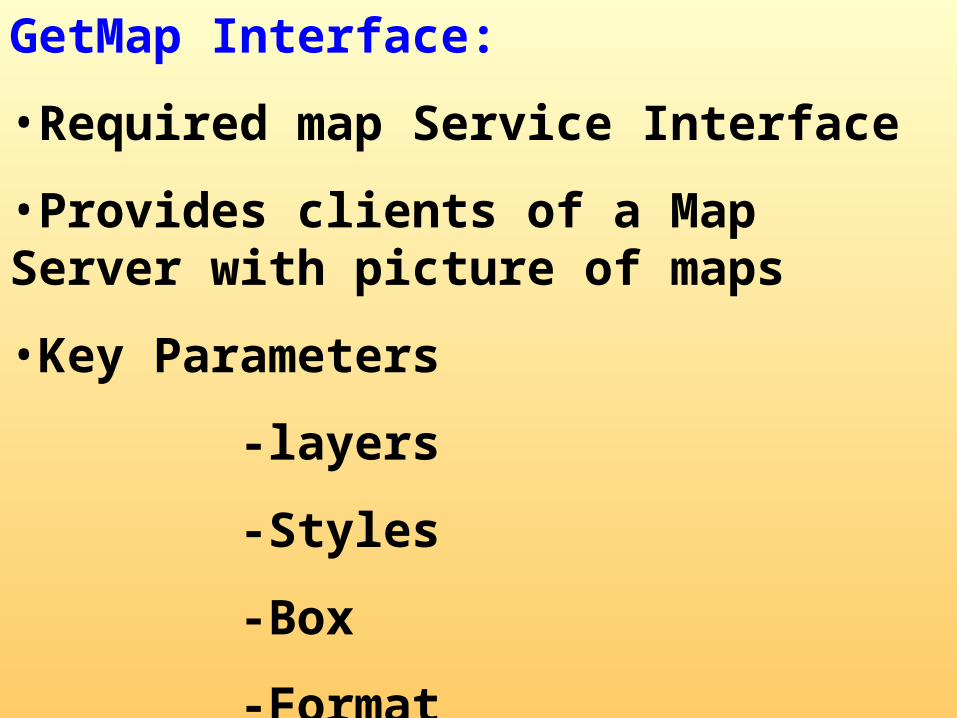
GetMap Interface:
•Required map Service Interface
•Provides clients of a Map Server with picture of maps
•Key Parameters
-layers
-Styles
-Box
-Format
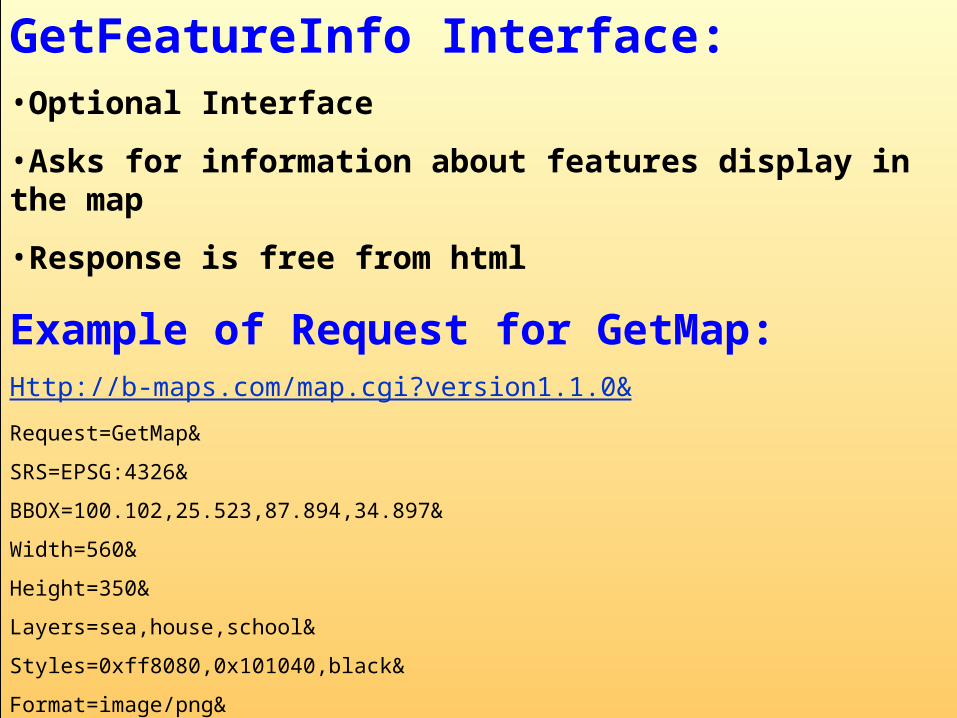
GetFeatureInfo Interface:•Optional Interface
•Asks for information about features display in the map
•Response is free from html
Example of Request for GetMap:Http://b-maps.com/map.cgi?version1.1.0&
Request=GetMap&
SRS=EPSG:4326&
BBOX=100.102,25.523,87.894,34.897&
Width=560&
Height=350&
Layers=sea,house,school&
Styles=0xff8080,0x101040,black&
Format=image/png&
Bgcolor=0xffffff&Transparent=True&
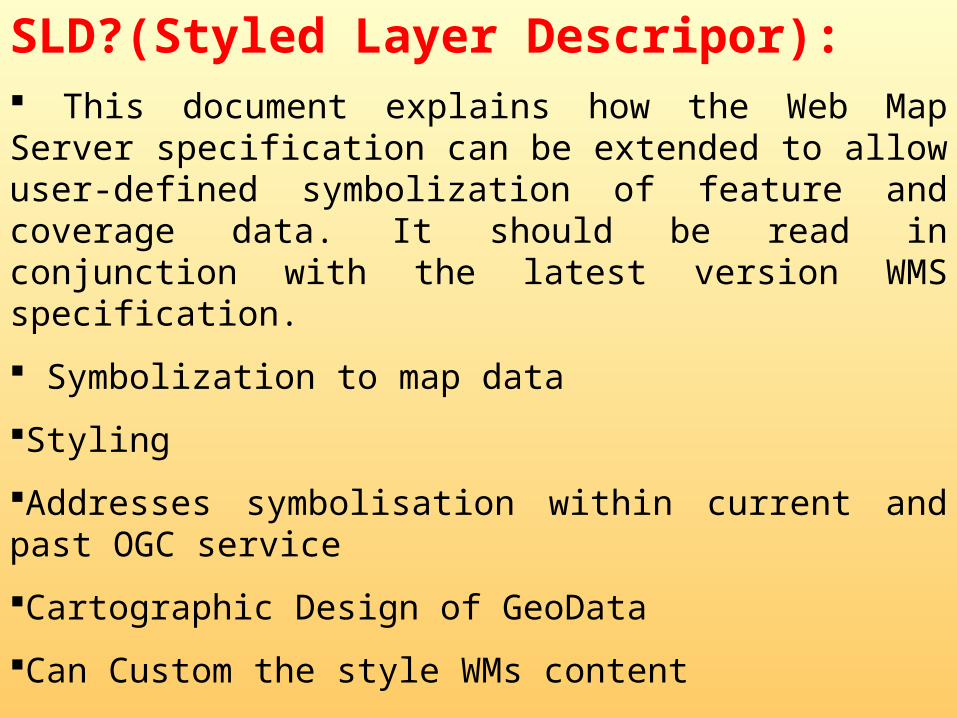
SLD?(Styled Layer Descripor): This document explains how the Web Map Server specification can be extended to allow user-defined symbolization of feature and coverage data. It should be read in conjunction with the latest version WMS specification.
Symbolization to map data
Styling
Addresses symbolisation within current and past OGC service
Cartographic Design of GeoData
Can Custom the style WMs content
Can Custom the style WFS content
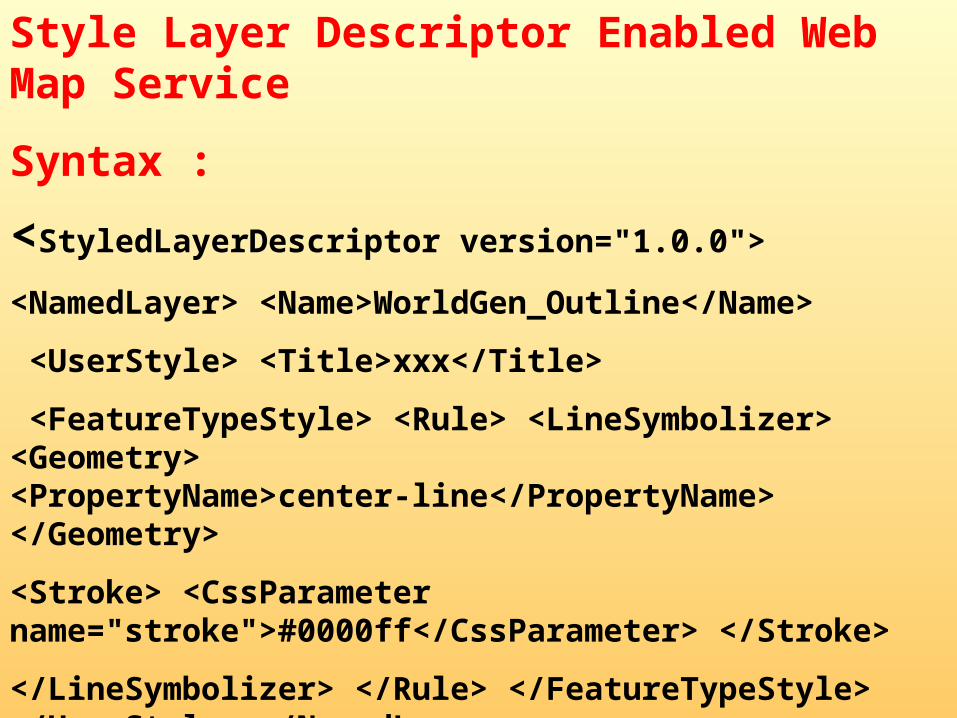
Style Layer Descriptor Enabled Web Map Service
Syntax :
<StyledLayerDescriptor version="1.0.0">
<NamedLayer> <Name>WorldGen_Outline</Name>
<UserStyle> <Title>xxx</Title>
<FeatureTypeStyle> <Rule> <LineSymbolizer> <Geometry> <PropertyName>center-line</PropertyName> </Geometry>
<Stroke> <CssParameter name="stroke">#0000ff</CssParameter> </Stroke>
</LineSymbolizer> </Rule> </FeatureTypeStyle> </UserStyle> </NamedLayer> </StyledLayerDescriptor>
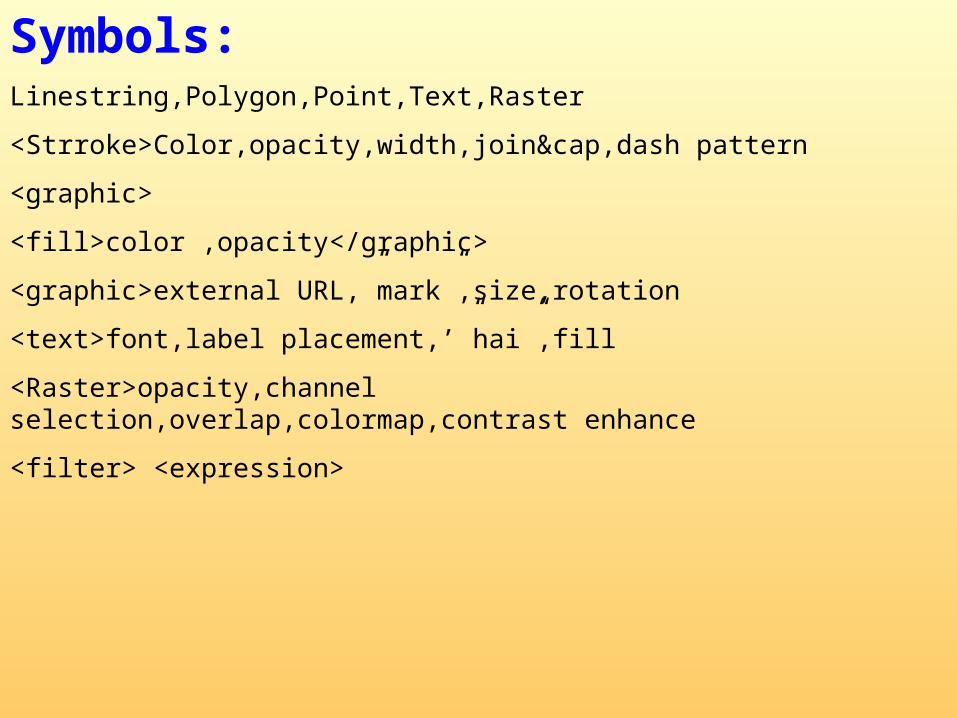
Symbols:Linestring,Polygon,Point,Text,Raster
<Strroke>Color,opacity,width,join&cap,dash pattern
<graphic>
<fill>color ,opacity</graphic>
<graphic>external URL,”mark”,size,rotation
<text>font,label placement,’”hai”,fill
<Raster>opacity,channel selection,overlap,colormap,contrast enhance
<filter> <expression>
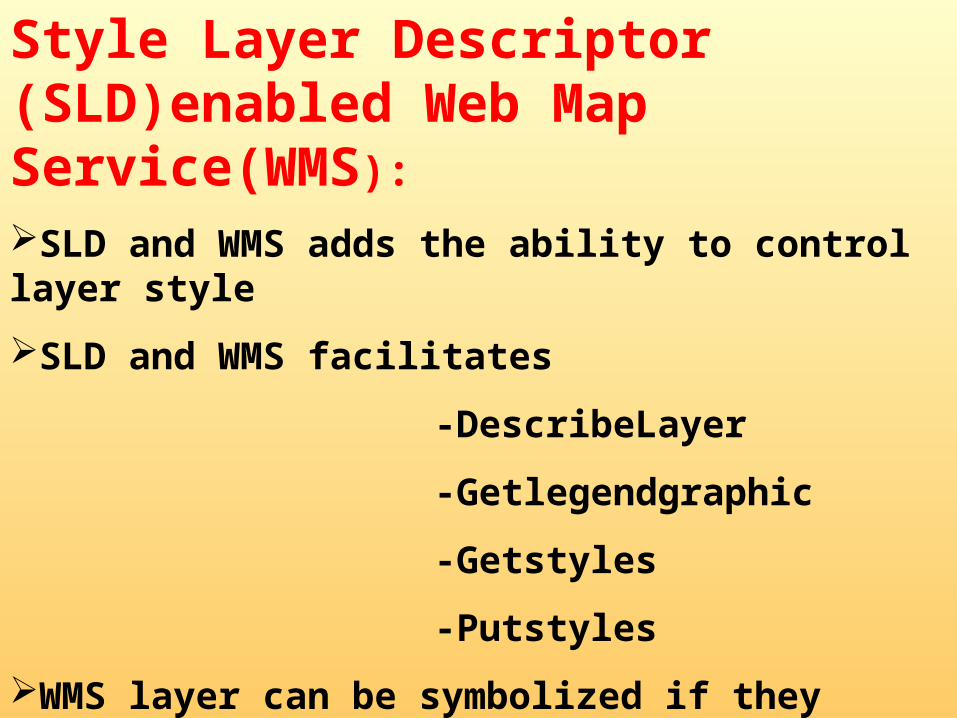
Style Layer Descriptor (SLD)enabled Web Map Service(WMS):
SLD and WMS adds the ability to control layer style
SLD and WMS facilitates
-DescribeLayer
-Getlegendgraphic
-Getstyles
-Putstyles
WMS layer can be symbolized if they originate from a feature source
WCS?(WEB Coverage Service):•WCS provides available data together with their detailed description.
•WCS also allows queries against the data and returns data with original semantics(instead of pictures) which can be interpreted
•The basic Web Coverage Service allows querying and retrieval of coverages.
•WCS describes discovery, query, data transformation operations. The client generates the request and posts it to a web feature server using HTTP. The web feature server then executes the request. The WCS specification uses HTTP as the distributed computing platform.
•Supports many formats and encoding
•WCS is not so much operational as WFS
•Metadata are complex
•As coverage is a Mathematical function a mapping from geographic domain space to range space is a typical measurement
•This supports data format like:
-Series of points, such as locations of samples
-Regular grid of pixels or points
-Set of segmented curves, often used for road paths
-Triangulated irregular network(TIN), often used for DEM
- Ranges of information may be attached to locations, such as average wind speed or yield by crop type.
DISPLAY OF GML DATA
[SVG?(Scalable Vector Graphic)]
•AW3C (World Wide Web Consortium)standard format
•Works directly with Web browser
•Requires a SVG plug-in(free from Adobe or other vendors)
•XML specification and File Format for describing two-dimensional Vector Graphic, both static and animated. SVG can be purely declarative or may include scripting. Images can contain hyperlinks using outbound simple Links.

ADVANTAGES OF SVG:
•Vector graphics NOT Raster image formats JPEG,GIF,PNG etc
•Supports Vector,Raster and Text
•Can be displayed in any scale
•Can be even displayd in cell phone
•SVG can grow to many files ,many users and wide variety of use on WEB
•SVG also reduces size of image by allowing comlex scalable graphics
•SVG file is a XML file so allows portability

•SVG file can be edited and displayed in any environment regardless of computer operating system and Web browser
•SVG is an XML files so hyperlink is possible to raster and vector both
•SVG drawings can be dynamic and interactive.
•Time-based modifications to the elements can be described in SMIL or can be programmed in a scripting language (e.g., ECMA script). The W3C explicitly recommends SMIL as the standard for animation in SVG.
•SVG is an application of XML . SVG file is therefore a simple TEX FILE which can be viewed and edited as with any other markup Language file.
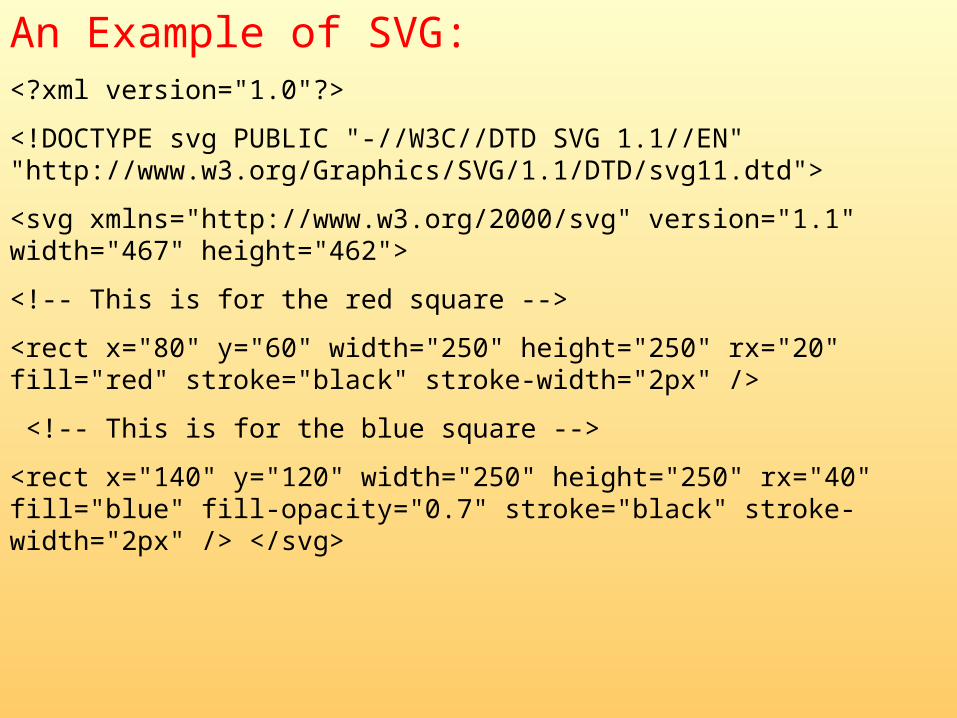
An Example of SVG:<?xml version="1.0"?>
<!DOCTYPE svg PUBLIC "-//W3C//DTD SVG 1.1//EN" "http://www.w3.org/Graphics/SVG/1.1/DTD/svg11.dtd">
<svg xmlns="http://www.w3.org/2000/svg" version="1.1" width="467" height="462">
<!-- This is for the red square -->
<rect x="80" y="60" width="250" height="250" rx="20" fill="red" stroke="black" stroke-width="2px" />
<!-- This is for the blue square -->
<rect x="140" y="120" width="250" height="250" rx="40" fill="blue" fill-opacity="0.7" stroke="black" stroke-width="2px" /> </svg>
XSLT?(Extensible Stylesheet Language Transformations):•XSLT developed by W3C for applying data to XML in formatted way
•The language used is XSL for expressing style sheet
•Style sheet are used to desribe how the contents of a given structured document should be presented
•By this the source content is styled laid out on to some medium such as window in a WEB browser or hand held device
•XSLT are ideal for processing because both GML and SVG are XML standards
•XSLT enables and empowers interoperability