Survey sampling with the R `sampling'...
21
Transcript of Survey sampling with the R `sampling'...

Survey sampling with the R `sampling' package
A. Matei and Yves Tillé
Institute of Statistics,
University of Neuchâtel, Switzerland
Rencontres de statistique appliquée, INED
April 2010
A. Matei and Y. Tillé (Unine) The R `sampling' package April 28, 2010 1 / 21

Overview
Using R and the 'sampling' package for teaching survey samplingtheory and for training in this area;
The sampling package is no used in public statistics. Especially indeveloping countries.
Short overview on sampling theory;
Speci�cal features of our package.
Some exercises.
Conclusions.
A. Matei and Y. Tillé (Unine) The R `sampling' package April 28, 2010 2 / 21
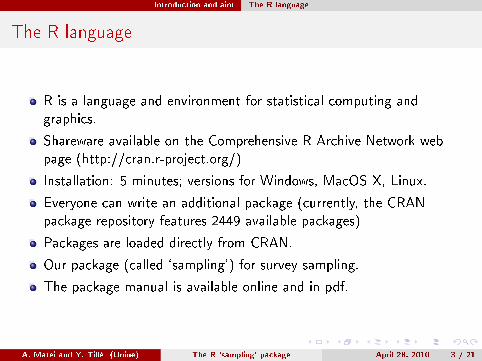
Introduction and aim The R language
The R language
R is a language and environment for statistical computing andgraphics.
Shareware available on the Comprehensive R Archive Network webpage (http://cran.r-project.org/)
Installation: 5 minutes; versions for Windows, MacOS X, Linux.
Everyone can write an additional package (currently, the CRANpackage repository features 2449 available packages)
Packages are loaded directly from CRAN.
Our package (called `sampling') for survey sampling.
The package manual is available online and in pdf.
A. Matei and Y. Tillé (Unine) The R `sampling' package April 28, 2010 3 / 21

Introduction and aim History of the R `sampling' package
The history of the package 'sampling'
EFTA (European Free Trade Association) - training course for nationalo�ce employers, organized by Eurostat and Swiss Federal StatisticalO�ce, in April 2005 at Neuchâtel, Switzerland.
The main goal: to study the sampling theory using R as statisticalsoftware.
Writing of a large set of functions.
The decision to submit the package to CRAN.
A. Matei and Y. Tillé (Unine) The R `sampling' package April 28, 2010 4 / 21

Short overview on sampling theory
Inference
A. Matei and Y. Tillé (Unine) The R `sampling' package April 28, 2010 5 / 21

Short overview on sampling theory
Population and sample
let U be a �nite population of size N;
let s ⊆ U be a sample with the probability to be selected p(s);
let k ∈ U be the reference unit;
πk = Pr(k ∈ s) =∑
s;s3k p(s) is the inclusion probability for unit k ;
πk` = Pr(k , ` ∈ s) =∑
s;k,`3s p(s).
A. Matei and Y. Tillé (Unine) The R `sampling' package April 28, 2010 6 / 21
Short overview on sampling theory
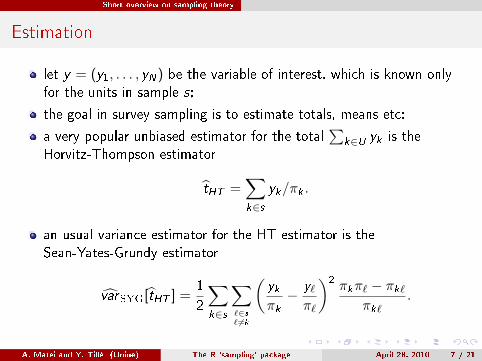
Estimation
let y = (y1, . . . , yN) be the variable of interest, which is known onlyfor the units in sample s;
the goal in survey sampling is to estimate totals, means etc;
a very popular unbiased estimator for the total∑
k∈U yk is theHorvitz-Thompson estimator
t̂HT =∑k∈s
yk/πk .
an usual variance estimator for the HT estimator is theSean-Yates-Grundy estimator
v̂arSYG [̂tHT ] =1
2
∑k∈s
∑`∈s
6̀=k
(ykπk− y`π`
)2 πkπ` − πk`πk`
.
A. Matei and Y. Tillé (Unine) The R `sampling' package April 28, 2010 7 / 21

Short overview on sampling theory
Sampling
Sampling with or without replacement.
Equal or unequal probability sampling.
Complex sampling: strati�ed sampling, multistage sampling, clustersampling, balanced sampling and combination of them.
srswor(n,N), srswor1(n,N), srswr(n,N).
strata(data, stratanames=NULL, size,
method=c("srswor","srswr","poisson", "systematic"), pik,
description=FALSE)
A. Matei and Y. Tillé (Unine) The R `sampling' package April 28, 2010 8 / 21

Short overview on sampling theory
Balanced sampling
A. Matei and Y. Tillé (Unine) The R `sampling' package April 28, 2010 9 / 21
Short overview on sampling theory
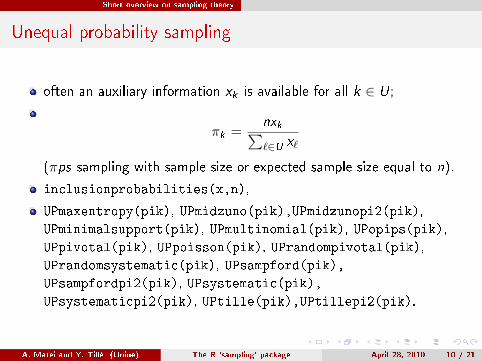
Unequal probability sampling
often an auxiliary information xk is available for all k ∈ U;
πk =nxk∑`∈U x`
(πps sampling with sample size or expected sample size equal to n).
inclusionprobabilities(x,n),
UPmaxentropy(pik), UPmidzuno(pik),UPmidzunopi2(pik),UPminimalsupport(pik), UPmultinomial(pik), UPopips(pik),UPpivotal(pik), UPpoisson(pik), UPrandompivotal(pik),UPrandomsystematic(pik), UPsampford(pik),UPsampfordpi2(pik), UPsystematic(pik),UPsystematicpi2(pik), UPtille(pik),UPtillepi2(pik).
A. Matei and Y. Tillé (Unine) The R `sampling' package April 28, 2010 10 / 21
Short overview on sampling theory
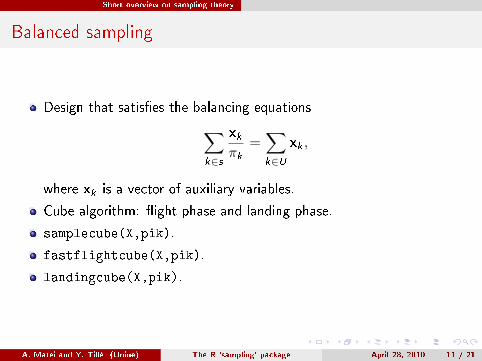
Balanced sampling
Design that satis�es the balancing equations∑k∈s
xk
πk=∑k∈U
xk ,
where xk is a vector of auxiliary variables.
Cube algorithm: �ight phase and landing phase.
samplecube(X,pik).
fastflightcube(X,pik).
landingcube(X,pik).
A. Matei and Y. Tillé (Unine) The R `sampling' package April 28, 2010 11 / 21
Short overview on sampling theory
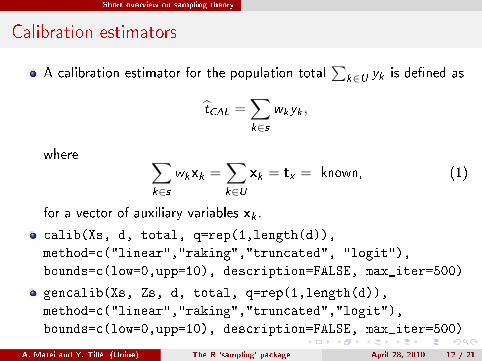
Calibration estimators
A calibration estimator for the population total∑
k∈U yk is de�ned as
t̂CAL =∑k∈s
wkyk ,
where ∑k∈s
wkxk =∑k∈U
xk = tx = known, (1)
for a vector of auxiliary variables xk .
calib(Xs, d, total, q=rep(1,length(d)),
method=c("linear","raking","truncated", "logit"),
bounds=c(low=0,upp=10), description=FALSE, max_iter=500)
gencalib(Xs, Zs, d, total, q=rep(1,length(d)),
method=c("linear","raking","truncated","logit"),
bounds=c(low=0,upp=10), description=FALSE, max_iter=500)
A. Matei and Y. Tillé (Unine) The R `sampling' package April 28, 2010 12 / 21

Functions
Other functions
1 Estimation: Horvitz-Thompson, Hájek, calibration, general calibration,regression, ratio, poststrati�ed estimator,
2 Tools: computation of inclusion probabilities for UP from an auxiliaryvariable variable, crossing strata, response homogeneity groups,propensity scores,
3 Data bases: MU284, Swiss municipalities, Belgian municipalities.
A. Matei and Y. Tillé (Unine) The R `sampling' package April 28, 2010 13 / 21
Functions
Package manual and vignettes
the package manual (in pdf format or HTML)
a set of three vignettes.
A. Matei and Y. Tillé (Unine) The R `sampling' package April 28, 2010 14 / 21

Exercises
Exercise 1
Exercise
Compute the inclusion probabilities, for a sample of size 200 drawn from theBelgian municipalities population, proportional to the population in 2004.
A. Matei and Y. Tillé (Unine) The R `sampling' package April 28, 2010 15 / 21
Exercises
Exercise 2
Exercise
Use the Belgian database. Select a sample of 200 municipalities withunequal probabilities proportional to the number of inhabitants in 2004.
with Poisson sampling
with a method of unequal probabilities and �xed sample size
with simple random sampling.
Conduct Monte-Carlo simulations, compute the Horvitz-Thompson (HT)estimator of the taxable income variable for 10'000 samples and �nallydraw a boxplot for each previous method to compare empirically theestimated variance of the HT estimator.
A. Matei and Y. Tillé (Unine) The R `sampling' package April 28, 2010 16 / 21
Exercises
Exercise 3
Exercise
Use the MU284 population. Compute a vector of inclusion probabilitésproportional to variable P75 for a sample size n = 50. Construct a matrixwith the balancing variables P75,CS82,SS82,S82,ME84,REV84. Next selecta balanced sample on these variables and a sample of �xed sample sizen = 50 with the same vector of inclusion probabilities. Run a set ofsimulations in order to compare the Horvitz-Thompson estimators of thesetwo sampling designs.
A. Matei and Y. Tillé (Unine) The R `sampling' package April 28, 2010 17 / 21
Exercises
Exercise 3
Exercise
Conduct Monte-Carlo simulations to compare the accuracy of theHorvitz-Thompson estimator and Hájek estimator in terms of MSE. Fourcases are considered:
1. the variable of interest yk is randomly generated using the N(3, 4)distribution;
2. Poisson sampling is used to draw a sample s and yk is constant fork = 1, . . . ,N;
3. yk is generated using the following model:xk = k , πk = nxk/
∑N
i=1 xi , yk = 1/πk ;
4. yk are generated using the following model:xk = k , yk = 5(xk + εk), εk ∼ N(0, 1/3);
For cases 1, 3 and 4 use Tillé sampling. In all cases, the population size is100 and the sample size (or the expected sample size) is 20.
A. Matei and Y. Tillé (Unine) The R `sampling' package April 28, 2010 18 / 21

Exercises
Exercise 4
Exercise
Use the database of Swiss municipalities, and select a strati�ed balancedsample. A balanced sample is �rst selected in each strata. Next the resultsof the �ight phase are merged and a �ight phase is applied again on thewhole population. Finally, a landing phase is applied on all the population.Use the following balancing variables: HApoly, Surfacesbois, P00BMTOT,P00BWTOT, POPTOT, Pop020, Pop2040, Pop4065, Pop65P, H00PTOT.The sample size is 400 and the municipalities must be selected withinclusion probabilities proportional to POPTOT. The strati�cation variableis REG (swiss regions). Next, print the names of the selected municipalities.
A. Matei and Y. Tillé (Unine) The R `sampling' package April 28, 2010 19 / 21

Exercises
Exercise 5
Exercise
Use the Belgian database. Select a sample of 200 municipalities withunequal probabilities proportional to the number of inhabitants in 2004with Poisson sampling design. Next calibrate the sample by means of theraking ratio estimator on the variables:Men03/mean(Men03), Women03/ mean(Women03), Di�men, Di�wom,TaxableIncome, Totaltaxation, averageincome, medianincome.The division by the means is necessary to avoid too large numbers.Compute the Horvitz-Thompson estimator and the calibrated estimators forthe calibration variables. Limit the variation of the g-weights between 0.5and 1.5.
A. Matei and Y. Tillé (Unine) The R `sampling' package April 28, 2010 20 / 21
Conclusions
the R 'sampling' package is a tool to teach survey sampling theory, todo training and research in this area;
it can be used for training in o�cial statistics, for university courses insurvey sampling and biostatistics, on graduate or post-graduate level.
it is also a valuable reference for practicing statisticians who areinvolved in the design of sample surveys and estimations.
A. Matei and Y. Tillé (Unine) The R `sampling' package April 28, 2010 21 / 21