
Survey Results
82
1 The State of IT Project Management in the UK 2002-2003 Project management performance is improving but the environment is increasingly challenging. This final report from the ComputerWeekly Project/Programme Management Survey details the state of the art and offers insights and recommendations for greater project success Executive Summary This research is based on data collected from 1,500 practising IT project managers between October 2002 and January 2003. We found that project performance is better than has been previously thought. While the number of projects hitting all their targets remains low at 16%, the variance is much less than commonly supposed. Average overrun on budget is 18%; average overrun on schedule is 23%; average underachievement on scope/functionality is 7%. These figures suggest significant improvements are occurring. We have developed a sketch of today’s IT project manager. This highlights extensive experience in IT and in project management, and strong educational background. We see a major imbalance of males over females, which is compounded by females typically achieving better results than men. We see project managers as largely confident people but who recognise their limited ability to get their own way and who therefore compromise. As leaders, we see them as highly team-oriented and as adopting a first-among-equals style. We find relatively little attention paid to developing organisational capability in project management. While there is active management by senior managers of on- going projects both in their establishment and development, the ability of senior managers to support their project managers is recognised as limited. The widespread lack of a career structure, lack of systematic identification of project manager potential, lack of support for project manager development and toothless performance management reflect a dismal failure to invest in IT project management as a key element of economic growth. We have found that project size is important in success – smaller is better. Unsurprisingly, we found simplicity, certainty and stability associated with performance. We found no continuous advantage to experience or education. We Report by Chris Sauer and Christine Cuthbertson Templeton College, University of Oxford Survey sponsored by the French Thornton Partnership
description
state of IT in uk 2003
Transcript of Survey Results

1
The State of IT Project Management
in the UK 2002-2003 Project management performance is improving but the environment is increasingly challenging. This final report from the ComputerWeekly Project/Programme Management Survey details the state of the art and offers insights and recommendations for greater project success Executive Summary This research is based on data collected from 1,500 practising IT project managers between October 2002 and January 2003. We found that project performance is better than has been previously thought. While the number of projects hitting all their targets remains low at 16%, the variance is much less than commonly supposed. Average overrun on budget is 18%; average overrun on schedule is 23%; average underachievement on scope/functionality is 7%. These figures suggest significant improvements are occurring. We have developed a sketch of today’s IT project manager. This highlights extensive experience in IT and in project management, and strong educational background. We see a major imbalance of males over females, which is compounded by females typically achieving better results than men. We see project managers as largely confident people but who recognise their limited ability to get their own way and who therefore compromise. As leaders, we see them as highly team-oriented and as adopting a first-among-equals style. We find relatively little attention paid to developing organisational capability in project management. While there is active management by senior managers of on-going projects both in their establishment and development, the ability of senior managers to support their project managers is recognised as limited. The widespread lack of a career structure, lack of systematic identification of project manager potential, lack of support for project manager development and toothless performance management reflect a dismal failure to invest in IT project management as a key element of economic growth. We have found that project size is important in success – smaller is better. Unsurprisingly, we found simplicity, certainty and stability associated with performance. We found no continuous advantage to experience or education. We
Report by Chris Sauer and Christine Cuthbertson Templeton College, University of Oxford Survey sponsored by the French Thornton Partnership

2
found some performance advantage for externally conducted projects. We could see no advantage to the private sector over the public. We found project managers concerned principally about familiar issues relating to resources, budgets, schedules, politics, top management support, lack of authority and similar. They see the project context as becoming more turbulent and more difficult in all respects. While performance is improving, the challenge of projects is becoming greater. Our principal recommendations include: • For project managers to structure projects into smaller units, to invest in selecting
the right team and involving them in decision-making, and to invest their own time and effort in self-development.
• For senior IT managers responsible for IT project managers to establish a focus
for project management in their organisation, create a project management career path, identify and develop the right individuals, and create real accountability through more effective performance management.
• For senior business managers/sponsors to develop client-side understanding of
project management and more actively involve themselves with projects for which they are responsible.

3
Introduction IT projects are crucial to economic growth. Half of all capital investment today is in information and communication technologies. This investment creates value through the projects that put the technology to work for practical purposes. This growing investment over many years has transformed many aspects of work and society. IT systems and tools are so pervasive that we can scarcely imagine life without them. The importance of IT projects therefore cannot be overestimated. By contrast to their importance, IT projects have an unfortunate reputation among the public at large for performance. Personal experiences – of the “I’m sorry I can’t help you, the computer’s down” variety – have been exacerbated by sensationalist journalism based on some very large and expensive failures. The US-based Standish Group’s 1995 CHAOS Report reinforced the view that project performance deficit is widespread, cost and schedule overruns high, and scope delivered low. Within the industry we know that there has been intense focus on performance. The logic of time-boxing – of keeping budget, scope and duration down to manageable size – has apparently been widely accepted. The shift to outsourcing has been partly justified in terms of access to more skilled IT staff including project managers, and partly in assigning project risks to the parties who can most appropriately manage them. These types of development should have improved performance. In 1999 and 2003 the Standish Group reported improvements. But until now, we have known very little for certain about IT project performance in the UK. If we are to improve performance, there are two principal targets. The first target is to improve how any specific project is managed. The many articles that identify success factors, causes of failure and the like are all targeting what can make a difference to an individual project. An oft-cited factor here is the skills of the project manager. But, in fact, we know relatively little about who our project managers are: their age, the experience they have, the disciplines they come from, or their leadership style. For the purposes of recruiting the right people and shaping young project managers, understanding project manager profiles will be useful. The second target to improve performance is organisational capability in project management. Our tendency to ascribe success to the efforts of the project manager has focused attention on the individual project and what the potential hero can do to snatch success from the jaws of failure. For organisations that undertake many projects each year, whether in-house or as IT service providers, another approach is to target aggregate or average performance and seek to reduce project performance variance against targets. The challenge of, say, reducing average budget overrun across all projects by 5% per year is less glamorous but may be as effective as achieving one heroic turnaround. For a company undertaking £50m of IT projects in a year, this represents a saving of £2.5m per year. Year on year improvements will increase this figure. The focus of this approach is on creating and maintaining a pool of high quality project managers, developing them, encouraging innovation and knowledge sharing, and creating conditions that motivate and support project success. An organisational

4
level capability in project management then feeds through to improved project performance. Again, though, we know remarkably little about whether organisations actively manage this capability and if so how. In this research, we set out to discover: • What is project/programme performance like today? • Is it improving? • Who are today’s project managers and what are they like? • How are they managed by their employers? • What drives project/programme performance today? • What do experienced project managers think is important? This report aims to answer these questions by asking the people who should know best – the project managers themselves. Some 1,500 have taken the time to share information about themselves and their projects. Their accumulated experience amounts to some 14,000 person years in IT project management. What they tell us provides a broad base of data whose scope exceeds anything previously available. It also makes proposals for accelerating the improvements it records. Terminology – Project Managers or Programme Managers Organisations often draw a distinction between a project and a programme where the latter is treated as a larger unit comprising a set of projects. Just as in other contexts supervisors have become managers and managers directors, this kind of role inflation has crept into the project environment with projects becoming programmes and project managers becoming programme managers. In our four questionnaires, therefore, we preferred to use the terms synonymously so as not to unnecessarily deter individuals from responding. For stylistic simplicity, we refer to our respondents solely as project managers and their work as projects. Initial findings were reported in four preliminary reports published successively on the Computer Weekly website from late 2002. These reports are largely descriptive, based on only partial data, and unconnected. In addition to what has previously been published, this final report therefore provides • results from the full sample of nearly 1,500 individuals • further results on project performance • analysis and discussion of these results • identification of some critical relationships affecting performance • recommendations for project managers • recommendations for senior IT managers responsible for project managers • recommendations for senior business managers/sponsors

5
This report is structured into the following sections: Section One Projects and Their Context p6 Project size, project intensive industries, project difficulty, relationship with the client, change projects, the evolving nature of the project context Section Two Project Manager Characteristics p17 Basic demographics, qualifications, work experience, project management activity, project management style, project manager self-efficacy, project manager satisfaction, characteristics of project managers, summary Section Three Organisational Project Capability p27 Reporting lines, management support for project managers, alignment of interests, sympathy for project management task, senior manager capability to support project managers, establishing the project, communication and reporting, investment in project managers – selection, training and development, performance management, summary Section Four Project Performance p40 Performance levels, performance variance, factors affecting performance, distinctiveness of IT project management
Section Five Improving Performance p61 What the project managers say Section Six Discussion p62 Interpreting the findings of this research study, performance, context, personal background, decision style, building organisational capability in project management, distinctiveness of IT projects, general Section Seven Recommendations p68 Project managers, senior IT managers responsible for project managers, senior business managers/sponsors Section Eight The State of Project Management in 2003 p69 Acknowledgements p72 References p73 Appendices p74 About the Authors p81 Footnotes p82

6
Section One Projects and Their Context Projects vary on many dimensions including delivery, content, size, industry, difficulty, client relationship and any organisational change involved. Our first task is to shed some light on these issues. One of the key aspects of the IT project context is the rate of change especially of the technology itself. A second task therefore is to understand the evolution of the project context. In order to gain specific information across a large sample of project managers rather than ask for generalised views of context, we asked for specifics in relation to their last completed project. Project Delivery and Content The rapid growth of outsourcing in the last decade has resulted in choice as to who will deliver a company’s IT projects – the company itself or external service providers. We find 41% of projects are clearly carried out for an external client, whereas 53% are clearly for internal clients. Thus, notwithstanding the rapid growth of the IT services market over the last ten years, in-house project management remains more common than externally managed projects. That said, the gap is not great. While we have not collected trend data with this survey, it would not be surprising if this gap were to close in the future. But what kind of activity do these projects involve? Figure 1 summarises the responses. Requirements specification, system integration and testing are each undertaken in between approximately 70% and 80% of all projects. In effect, the IT project retains a core of its established character despite waves of technological and commercial change. But in certain respects its new character is leaner with a third of all projects now not involving system design and fewer than half including code development. Development of business case Requirements specification System design Code development Sys integration/implementation Testing Package implementation - min
Package implementation - maj
Data clean up/conversion Business process change Organisational change Marketing electronic products
Legal/ regulatory change Outsourcing Renegotiation of contracts Other
Percent
80 6040200
Figure 1 | Project Context: Primary type of work undertaken

7
The changed character of the project is signalled by the one-third that involve package modification. Of these, 20% identify the level of modification as minimal but 12% tell us that their projects involve major modifications to a package. There are, of course, always reasons for tailoring a package. It is after all difficult to determine in advance the exact fit between software and requirements. Nevertheless, in view of the well-known problems of managing version upgrades where packaged software has been tailored, this figure seems to us surprisingly high. Some 45% of projects involve data conversion, migration or clean-up. So while many projects have established databases from scratch, nearly half have to deal with the difficulties of making established databases useable in their new context. In our experience, this is one of the Cinderella tasks of IT – unglamorous spadework that is essential to success. But it is almost as common a task to be managed as code development. Fewer than 50% of all projects involve business case development. Two factors may explain this. First, with 41% projects being for external clients, it is likely that in many instances the client performs the business case ahead of contracting for the project. Nevertheless, one might expect an external supplier to conduct some form of business case for their own business before taking on the work. Alternatively, our finding could reflect the separation among IT Services firms of the sales and delivery functions, with project managers firmly at the delivery end of the value chain. This finding may also include a number of IT infrastructure projects where the business case may have been regarded as impossible to accurately calculate. Exactly 50% of projects include business process change, organisational change or work design. 43% of the total involve business process change and nearly 30% organisational change or work design. The other side of the coin is that 50% of projects are either purely technical projects or more circumscribed in viewing organisational and process change as out of scope. It would be easy to think that project managers and their teams would be less focused on performance of projects that do not include change on the grounds that they are more removed from the business. Finally, outsourcing is more than just a choice of provider, it is often a task or even a project in itself. 21% of projects identify outsourcing as a primary activity within the project. 10% say they are involved in renegotiating outsourced contracts. 10% handle legal or regulatory change.1 Project Size There are many possible measures of project size including budget, duration, size of project team and number of project years. We collected data on budget and duration. Figure 2 displays the distribution of projects by budget size. While some 9% are small at less than £50,000 budget, and a further 9% cost less than £100,000, in total 55% of all projects cost less than £1m.

8
£5m+£1m-£4.9m
£500,000-£999,999£100,000-£499,999
£50,000-£99,999<£50,000
Per
cent
30
20
10
0
Figure 2 | Project Context: Size of budget More than one project in three (38%) is upwards of the £1m budget point, with 18% exceeding £5m of which 32 or nearly 4% of all reported projects are mega projects – in excess of £50m. Mega-projects are widely distributed among the sectors with 13 out of 21 sectors boasting these giants. Viewed through the lens of the human effort, almost 50% consume fewer than two person years, while almost 25% exceed five person years of which 17% exceed ten person years.
Person months
>480121-480
61-12049-60
37-4825-36
13-247-12
1-6
Per
cent
25
20
15
10
5
0
Figure 3 | Project Context: Human effort Project duration in terms of human effort appears to follow a similar pattern to budget size (Figure 3). Most have short to medium duration. In terms of elapsed time (Figure 4) one third are six months or less, including 11% that are three months or less. Almost one third are between six months and 12 months. A further 25% are between

9
one and two years; 8% are between two and three years; 4% between three and four years; and 2% over four years and one was reported as a marathon at 15 years.
Elapsed months
>3725-3622-2419-2116-1813-1510-127-94-6<=3
Per
cent
25
20
15
10
5
0
Figure 4 | Project Context: Elapsed time While some projects respect the modern wisdom that promotes three to six month projects, and the majority are less than 12 months, there remain a good third that are large enough to experience the traditional problems of scale projects. Without historical data, it is difficult to assess trends, but we do know that 41% of projects are judged to be large or very large in terms of budget by comparison with others undertaken by the respondent’s organisation in the preceding three years while only 22% are judged small or very small (Figure 5). On this basis, it would appear that organisations are tending towards larger rather than smaller projects.
3.6%
10.8% 18.1%
37.9%
29.6%
Very Small
Very Large Small
Medium
Large
Figure 5 | Project Context: Project size in comparison to other projects

10
Project-intensive industries Taking our sample of project managers as representative of where projects are typically conducted, Figure 6a shows that four industry sectors account for more than half of all projects – 59% in total. The Financial Services sector accounts for 22% of all projects. (This dominance is discussed briefly in the box below.) The IT industry itself accounts for a further 16%, Government and Education 13%, with Electronics and Telecommunications making up a further 8%. In total the public sector accounts for at least 18% of all projects and we estimate that the true figure is probably closer to 25%2. Certainly it confirms the importance of the UK Office of Government Commerce’s initiatives to develop Public Sector project management competence.
41.2%
15.8%
12.8%
22.3%
8.0%
Other
IT
Government/Education
Financial Services
Electronics/Telecoms
Figure 6a | Project Context: Industry in which the project took place No other industry group accounts for more than 5% of the total. Figure 6b shows most other sectors providing between 1% and 4% of the total. This indicates that outside the four project intensive sectors, the level of IT project intensity is broadly of the same order. There are three unsurprising stand-out exceptions – facilities management, hospitality/leisure, and metals/mining/agriculture – none of which achieve even 1% of the total. Of these we expect facilities management to increase its project intensity in the future as buildings become increasingly IT-controlled.

11
Aerospace/Defence Automotive Chemicals/PharmaceuticalsConsumer Goods/ServicesElectronics/Telecomms Energy/Utilities Engineering/Construction Equipment Manufacture Facilities Management Financial Services Freight/Logistics Government/Education Health/Life Sciences Hospitality/Leisure IT Media/Entertainment Metals/Mining/Agriculture Professional Service Retail Travel and Transport Other
Percent
3020100
Figure 6b | Project Context: All the industries in which the projects took place The Financial Services sector’s project intensity with more than 20% of the total is consistent with what we know about the typical IT spend against other sectors. For example, an IT spend of 10% of total company expenditure has not been uncommon in the sector. By comparison, manufacturers may spend as little as 0.5-1.0% on IT. We should therefore expect in the order of ten to 20 times as many projects in Financial Services as in manufacturing. In Equipment Manufacturing we received responses relating to 12 projects, compared to 179 in Financial Services, a factor of 15 – broadly in line with the predictions of our rule of thumb calculations Project difficulty We collected information on a number of dimensions likely to indicate contextual volatility and difficulty. These are principally to allow us to relate performance to difficulty. However, they provide some feel for the difficulties under which IT project managers labour. On the one hand, it is reassuring to note that some 66% of all projects are allowed to progress without stoppage. On the other, some 32% endure the disruption of at least one stoppage, and more than half of those endure two or more restarts. Changes in budget, schedule and scope appear to be par for the course (Figures 7, 8, 9). The mean average number of schedule changes is almost 5.0, budget is 3.4, and scope is 4.0. These figures are plainly biased by some very large figures for a few projects – one project reported 500 scope changes – but they do reflect widespread change of key project parameters. Only 12% of projects manage to get through without a change of schedule, 39% experience one or two schedule changes and 46% experience three or more changes. Scope is slightly less prone to change with 24% suffering no change of scope, 37% experiencing one or two changes, and 34% experiencing three or more. Budget change occurs in 56% of projects, 31% involving one or two changes, with 25% facing three or more budgetary adjustments.

12
Figure 7 | Changes in schedule
>10109876543210
Per
cent
25
20
15
10
5
0
Figure 8 | Changes in scope
>10109876543210
Per
cent
25
20
15
10
5
0

13
>10109876543210
Per
cent
25
20
15
10
5
0
Figure 9 | Changes in budget Probably more important than changes to schedule, budget and scope, which can themselves be instruments of project management as well as problems to be dealt with, are changes in the client and in the project manager or director. Some 62% of all projects have just the one manager/director for the whole duration. 17% have a single change; 6% changed twice; and 8% changed project manager three or more times. Clients by contrast have proved more stable, with a single change in 8% of cases and more than one change in just 6% of cases. While these numbers look relatively stable, they remind us that in one project in seven, project managers should expect the client to change. Requirements appear a further area of volatility. Where 60% say they experienced at least some difficulty in identifying requirements, 71% agreed that requirements changed to some extent or more during their last project. Finally, we find a high degree of complexity in terms of the systems and process interconnections required by projects with some 81% agreeing to some extent or more that interconnection was a factor in their last completed project. The relationship with the client Twenty years ago, it was common for project managers to undertake in-house projects with no clear idea of who was the “real” client. Instead they worked principally through a “user liaison officer” or similar. All too often, the project was to build a system, with little or no focus on the client’s desired business benefit. Conversely, the client knew little about the arcane art of developing IT systems and felt neither interest nor duty to understand the project managers who delivered their systems. Our survey therefore investigated several facets of the project manager-client relationship. Our research method precluded our sounding out the clients for their

14
views. Nevertheless, the responses from project managers strongly encourage us to believe that there has been a sharp improvement in mutual understanding. Project managers feel that they understand their client/sponsor’s business better today than they did five years ago (57% better and 10% much better) and much better than they did ten years ago (23% better and 48% much better). Almost as strong is their view that business managers understand the challenges of project management better than five years ago (4% much better, 51% better) and ten years ago (28% much better, 36% better). In view of the fact that it is project managers offering their perception of their clients, it is only human that they should think they understand their clients better than their clients understand them. The importance of these data lies surely in the improvement they reflect in project manager-client mutual understanding rather than any disparity that might underlie the responses. While these are healthy trends, they do not amount to complete, nor even necessarily adequate, mutual understanding. Table 1 shows project managers judging their understanding of their clients as less than complete but nevertheless as well above the mid-point (“somewhat understand”) level of the scale. By contrast, they see their counterparts (the principal representative of the client/sponsor) as scoring below the mid-point. Indeed, to the extent that comparisons can be made, they score clients’ understanding 20-25% below their own. How well do you understand . . .
Mean score [Scale 1 low, 5 high]
Mean score [Scale 1 low, 5 high]
How well does the principal representative of your client understand . . .
Your client/sponsor’s goals and performance targets
4.1 2.93 your performance targets
Your client/sponsor’s performance incentives
3.69 2.72 the incentives that motivate you
Your client/sponsor’s business processes
3.95 2.98 your project management processes
issues that drive your client/sponsor’s business thinking
3.74 2.91 the challenges of project management
Your client’s industry sector
4.05 N/A -
Table 1 | Project manager views of own and client levels of understanding Client support for projects is seen as very mixed. On matters such as whether clients give the right amount of their own time, create time for their staff to work on the project, assign their best resources to the project, involve themselves in the management of the project and support the project management process, there are

15
slightly more positive than negative responses distributed around a mean average close to the mid-point. The one area where there is a distinctively stronger response is the more positive assessment of clients acting as ambassadors for the project (mean score 3.46 on a five point scale). We asked about the frequency of meetings between project managers and their clients and sponsors in an attempt to gauge the distance between the parties. The frequency with which project managers meet principal client representatives and sponsors is mostly once or more each month. While mostly, formal meetings are supplemented by informal meetings, a surprisingly high 12% say they never meet informally with the client suggesting that for them all client communication is formal. This compares with 6% who never meet informally with their project sponsor. More than 33% say they never socialise with the sponsor and 27% say they never socialise with the principal client. In light of the importance respondents attach to informal networks, the absence of this kind of casual contact reduces project managers’ opportunity to manage their clients’ and sponsors’ understanding. And for the 27% who say they are never invited to meetings about the business’s future, they lose or are not offered the opportunity to gain first-hand understanding of the business issues that drive their clients. Change projects Increasing recognition of the importance of organisational change as a prerequisite of achieving the business benefits associated with IT projects led us to inquire into the requirements of success. Table 2 shows the order of importance respondents accord to six factors involved in successfully establishing a business change project. It has long been held that clarity of objectives is a key success factor. This sample of project managers concurs. By putting visible business imperative second, they seem to be saying that the objective also has to matter to the commercial interests of the company. The active senior sponsor is next in importance, with a significant gap between this factor and the representative project board. Ranked last in importance by quite a margin is the involvement of specialist change consultants. This last ranking is not surprising when we see how confident IT project managers are about their ability to manage organisational change (see Section 3, p27). Contrary to this confidence, our own experience is that all too often organisations do not understand what is involved in setting up a project to be successful and require external advice from specialists. Factor Average ranking Clear business objectives 2.07 Visible business imperative 2.63 Active, involve, senior sponsor 2.71 Project board including all stakeholders 3.49 Project control processes 3.99 Involvement of specialist change consultants 5.5 Table 2 | Factors in establishing a change project Table 3 identifies an order of success factors for achieving successful business change. They clearly indicate a weather change in the project management climate. No longer are such projects to be evaluated in traditional terms of variance against budget, schedule and scope. The importance of business benefit is emphasised along with communicating the reason for change to those who will be affected by it. By

16
contrast, traditional performance measures, including delivery of the full functionality to schedule, are viewed as least important. Factor Average Designing the system to have tangible business benefits
2.57
Communicating the reasons for change 3.08 Designing the system to benefit its users 3.30 Overcoming resistance to change 4.05 Training staff in new procedures 4.67 Providing incentives for staff to change 5.33 Completing the project on schedule 5.68 Delivering the full functionality as specified 6.00 Table 3 | Factors in achieving successful change The evolving nature of the project context For many years, the context within which IT projects are conducted has been viewed as one reason why they are so difficult. Indeed, simplifying the context is one recipe for improving performance. So, we investigated whether the context was changing. Table 4 provides a remarkably consistent view of increasing difficulty in the project environment. Every one of 14 factors rates more than a minor increase over the last five years. Three rate a moderate increase or more. There is considerable emphasis on rate of technical change and growth in technical complexity. In view of the trends toward enterprise systems and outsourcing, both of which should shield project managers from technical complexity, this is a surprising finding. It is also interesting in the light of trends toward globalisation, inter-organisational collaboration, alliancing and partnering to note that technological change and technical complexity rate considerably greater growth than extension of project scope outside the organisation and outside country-boundaries and the involvement of partners and suppliers/sub-contractors. Factor Average
Technical complexity 6.13 Importance of security 5.99 Rate of technological change 5.97 Business complexity 5.87 Level of business change for which project managers are responsible
5.62
Reliance upon third-parties for some part of the delivered service
5.56
Project team members being situated in different locations
5.56
Importance of compliance with international, national or industry, laws, rules and regulations
5.52
Organisational instability 5.48

17
Requirement for projects to undertake formal joint venture/alliance/partner agreements with other firms
5.46
Extension of project scope beyond the boundary of the sponsor’s organisation
5.31
Business instability 5.35 Contracting/sub-contracting to other organisations 5.29 Extension of project scope beyond national boundaries 5.13 Note: scale 1-7, 5=minor increase, 6=moderate increase, 7=major increase Table 4 | Change in contextual factors over the last five years Section Two Project Manager Characteristics Introduction Project managers often like to think of themselves as a distinctive breed. Goal-oriented, leaders, managers of complexity and uncertainty, instrumental rather than political – these are some of the common stereotypes of the generalist project manager. In 1987, leadership guru Barry Posner identified six skill categories that he mapped to the distinctive problems of project management. These include skills in communication, organisation, team building, leadership, coping and project management technicalities. However, do these characteristics adequately describe IT project managers in 2003? Who are today’s IT project managers? What are their defining characteristics? What experience do they have? What management styles do they adopt? Then there is the question of what characteristics and skills they really need. When a new project manager is required, all too often the selection process descends to being a matter of the next person to walk down the corridor so it is no surprise that we lack an adequate answer. But, professional recruitment and selection require that we identify what we should be looking for. In this section, we report on the picture presented to us through the 751 responses we received to the second questionnaire of our survey. Basic demographics Figure 10 shows the age breakdown of the respondents. Hardly surprisingly, the majority are between 30 and 50 with approximately as many in their 30s as in their 40s. A significant group (18%) are over 50. The group most obviously under-represented are the under 30s, suggesting that employers see project management as requiring a level of experience and maturity. This is consistent with what we report in the next section about project management and non-project management experience. The male-female split is 88%-12%. When we examine this by age, we see that nearly one-third of the under-30 project managers are females, 13% of the 30-40s, 8% of the 41-50s and 7% of the over 50s. There are various plausible explanations. The good news view is that it has been and continues to be getting easier for women to obtain project management positions. The more pessimistic view is that there is a high attrition rate. It could be that the drop between the under 30s and the 31-40s reflects

18
women taking time out to start families with a significant number not returning to their previous roles. While the likely explanation may be some combination of these two, these findings warrant further investigation.
8.9%
18.5%
36.7%
35.9%Under 30
Over 50
41-50
31-40
Figure 10 | Age breakdown of respondents Qualifications When we look at project managers’ qualifications, we find them to be typically well educated. 64% have A-levels, 55% hold a bachelor’s degree, 24% hold a Master’s degree, while 45% have a professional qualification of some kind. Only a fraction of one percent have no formal qualifications. Examining the field of study in which project managers gained their highest qualification, we see IT/Computer Science, Science and Engineering and Business/Management dominating. These three fields represent the area of study of the highest educational qualification for 66% of project managers. In view of the relative importance project managers accord to “soft/people skills”, it is noteworthy that IT/Computer Science and Science and Engineering should account for 46% compared to the 12% who come from arts, social science and professional studies. This suggests that many project managers come into their role from a technical background. Again, though, viewing qualifications by age is more illuminating. What we see is that IT/Computer Science is the qualification area that varies most according to age group, moving from being the highest qualification for 36% of the 30-40s to 54% for the under-30s. Moreover this is most obviously at the expense of Science/Engineering and Maths. This seems to indicate that many of those who in the past would have studied Science/Engineering/Maths and gone on to become IT project managers have over recent years taken advantage of the wider availability of IT/Computer Science programmes. It is possible that the percentages of Business/Management qualified project managers in the older age groups may reflect the increased availability of

19
MBA programmes and thereby obscure their qualifications on entry to the IT industry and the project management role. The high proportion of younger project managers coming from IT/Computer Science highlights the opportunity for universities and colleges to prepare young people to be better project managers by improving their project management offerings. This is all the more important because more than a quarter of project managers say they have received no formal project management training. With 8% not answering this question, the proportion could be as high as one-third. When we asked how well equipped project managers are today compared to five years ago, the responses record the perception of significant improvement, 53% saying better or much better with 32% seeing no change. Only a small minority of pessimists (13%) think that things have deteriorated (see Figure 11).
Much better4Same2Much worse
Per
cent
45
40
35
30
25
20
15
10
5
0
Figure 11 | How well equipped are project managers today compared to five years ago? Work experience The individuals we surveyed have proved to be highly experienced. With an average of 17 years each working in IT, they have spent just over half that time (9.5 years) working in a project management role. Two-thirds have five or more years experience in the role. On average they have worked for their current employer for seven years. However, this figure is skewed by the 37 who have worked for the same employer for 20-plus years. In fact, 16% have only joined their current organisation in the last year and 55% have been with their employer for five years or less. These figures for churn should not now be surprising in light of our finding in Section One that in 30% of projects there is at least one change of project manager. Many of these are surely because the project manager chooses to change employer although some will also be because the employer enforces the change.

20
Consistent with the years of experience these project managers reported, we find that almost 50% have racked up experience of more than 15 projects. A further 32% have managed between six and 15 projects with only 17% recording five or fewer. Our project managers overall report a breadth of experience as well as depth (Figure 12). Of 17 significant IT project tasks, the average project manager has managed 11. Not surprisingly almost everyone has managed requirements specification, systems integration/implementation and testing. 59% have managed business process change, and over 20% have managed organisational change or work design. Even the less common types of project task have been managed by sizeable minorities – marketing electronic products and services 32%. 30% have managed an outsourcing project. Development business caseRequirements specification System design Code development System integration/iimpl Testing Training Package implementation-minPackage implementation-majData clean up/conversion Maintenance Business process change Organisational change Marketing electronic productsLegal/ regulatory change Outsourcing Renegotiation of contracts
Percent
100 80604020 0
Figure 12 | Project tasks managed Perhaps the most obvious sign of the times is the fact that more than one third of respondents have not managed what was once the stock-in-trade of IT projects – code development. Project management activity Reporting how they spent their time on their last completed project, our project managers indicate that 27% of their time in total is spent communicating with the client and other stakeholders. A further 26% is spent on the classic project manager activities of planning, monitoring and controlling. More than a day a week is spent on firefighting unanticipated problems and managing conflicts. 10% is devoted to team-building. Fully 15% of their time is given over to developing and implementing the solution which goes some way to explaining why our respondents see understanding IT as the fourth most important characteristic among successful project managers (Table 5).

21
Ranking Commercial awareness 1 Confidence 2 Preparedness to take risks 3 Understanding of IT 4 Integrity 5 Goal-orientation 6 Written communication 7 Attention to detail 8 Planning 9 Problem solving 10 Enthusiasm 11 Preparedness to work in a team 12 Delegation 13 Prior success 14 Leadership 15 Energy 16 Stakeholder management 17 Conflict resolution 18 Time management 19 Securing resources 20 Ability to manage change 21 Oral communication 22 Initiative 23 Perspective 24 Understanding business processes 25
Table 5 | Important characteristics of successful project managers We also asked them to agree or disagree about certain statements relating to their last completed project. The questions reflected how they manage. These mostly related to methods, controls and team management. On the matter of whether their organisation has pre-defined methods/rules for use in project management, only 28% agree. Not surprisingly therefore only 24% agree that they pay great attention to pre-defined methods and rules. This contrasts with the 45% who indicate that their organisation does have a well-defined project management methodology and the 37% who are required to follow it. Together these figures indicate that a good proportion of organisations lack a common base of methods and practices. While we do not advocate slavish adherence to formal methodologies, lack of any common standard makes it difficult to manage project variance across an organisation. On the matter of project stage control by milestone, 74% reported that they set several milestones for each stage. Some 21% took a neutral stance which may indicate that they set just a single milestone per stage or that they set milestones only for some stages. By comparison with the 41% who strongly agree that they set several milestones for each stage, only 25% strongly agree that they pay great attention to performance against milestones – although a further 42% clearly indicate that they did pay attention to milestone monitoring. Setting milestones appears more popular than monitoring progress against them. We also find that 68% ensured that each stage is

22
signed off. In short, some two-thirds of project managers actively and vigorously control project stages. One of the strongest messages to emerge from this section of the questionnaire relates to team management. Approximately half the project managers who answer indicate that they pay significant attention to team selection, with a similar proportion either disagreeing or taking a neutral stance. But 73% expected team members to be committed to each other and 63% pay attention to building team commitment. In view of some of our other findings relating to the importance and value of teams, the limited interest displayed in team selection appears a worrying deficiency. We shall return to both the theme of teams and personnel selection. It is interesting to observe that in addition to the 62% who agree that they actively manage team commitment, 65% respond similarly in relation to managing sponsor commitment. While we are unable to determine how successful these efforts are, they are a strong indication that most project managers see commitment as a matter for them to attempt to influence. This is a mature and realistic stance in the face of experience that commitment tends to fade over time if left untended. Project manager leadership style In Questionnaire Two we asked a number of questions designed to give insight into project managers’ leadership characteristics and sense of self-efficacy. At the most basic level of enjoying being the project boss, 70% agree or strongly agree that they like being in command, with most of the remainder neutral. On most other leadership indicators, the sample appears to favour consultation, communication, and participation rather than autonomous decision-making. This balance of emphasis is illustrated by, on a scale of one to five, comparing the mean average level of enjoyment of being in command (3.93) with that of working in a team (4.23). More than 70% feel that they are likely to check their decisions with stakeholders if the decision outcome is uncertain. Most of the remaining 30% agree that they are likely to some extent to check. Propensity of project managers to check uncertain decisions with their manager is lower. Approximately one-third feel they are likely to check whereas nearly 25% say they are unlikely to check, leaving 40% who might check presumably depending on the decision, the circumstances and/or the identity of their boss. Furthermore, 56% agree or strongly agree that they are always prepared to change their mind. Fewer than 5% stand firm on their right to stick by their decisions and opinions. It is therefore not surprising to find that 39% disagree that they are better positioned to make informed decisions than anyone else while only 20% feel they are best placed to make decisions. Project managers, we found, have a strong bias for teamwork and a strong belief in its value. 84% agree or strongly agree that they like working as part of a team. More than 87% agree or strongly agree that they often ask team members for information. 74% agree or strongly agree that teams give a deeper analysis of problems. The strength of this team-orientation is perhaps best illustrated by the fact that only 35% actively disagree with the proposition that they are happy for the project team to decide its own work schedule. While nearly 50% remained neutral, 16% agree or strongly agree that they are happy for the team to decide its own schedule.
23
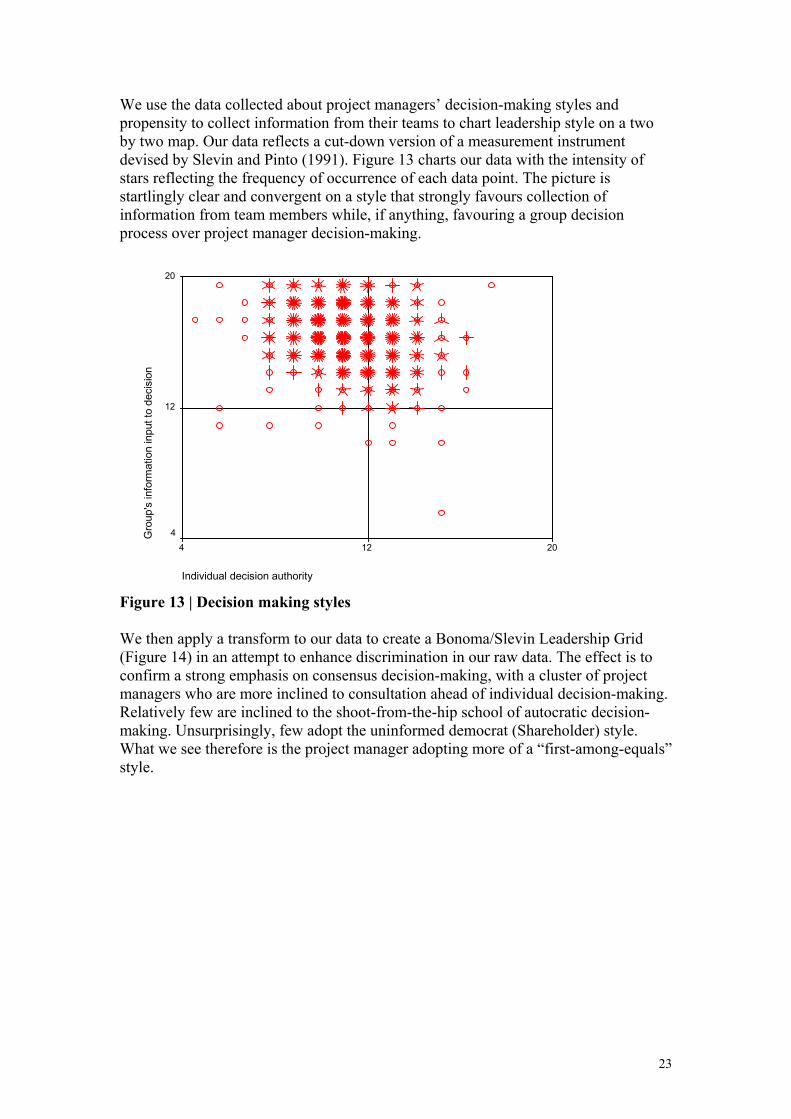
We use the data collected about project managers’ decision-making styles and propensity to collect information from their teams to chart leadership style on a two by two map. Our data reflects a cut-down version of a measurement instrument devised by Slevin and Pinto (1991). Figure 13 charts our data with the intensity of stars reflecting the frequency of occurrence of each data point. The picture is startlingly clear and convergent on a style that strongly favours collection of information from team members while, if anything, favouring a group decision process over project manager decision-making.
Individual decision authority
20124
Gro
up's
info
rmat
ion
inpu
t to
deci
sion
20
12
4
Figure 13 | Decision making styles We then apply a transform to our data to create a Bonoma/Slevin Leadership Grid (Figure 14) in an attempt to enhance discrimination in our raw data. The effect is to confirm a strong emphasis on consensus decision-making, with a cluster of project managers who are more inclined to consultation ahead of individual decision-making. Relatively few are inclined to the shoot-from-the-hip school of autocratic decision-making. Unsurprisingly, few adopt the uninformed democrat (Shareholder) style. What we see therefore is the project manager adopting more of a “first-among-equals” style.

24
D Score (percentile)
1009080706050403020100
I Sco
re (p
erce
ntile
)
100
90
80
70
60
50
40
30
20
10
0
Consensus Consult/Autocratic
Shareholder Autocratic
I Score represents information collection (low to high), D Score represents decision-making (collective to individual) Figure 14 | Leadership grid We see therefore a distinctive leadership style. Compared to the stereotype of the project manager as strong leader/decision-maker, the IT project manager appears to be very strong on collecting information and inclined to involve others in decision-making. The emphasis on collective decision-making suggests that integrating the relevant information is often beyond a single individual. An alternative and potentially complementary explanation is that collective involvement is necessary to win the continuing support of team members. Project manager self-efficacy Beside leadership style, the other characteristic on which we have focused is self-efficacy – a term that denotes justified self-belief or confidence in one’s ability to do a job. Several indicators reflect strong elements of self-efficacy. 88% confidently expect to be able to solve unanticipated problems. 57% have the same confidence that they can swiftly re-motivate a demoralised team with 36% having moderate confidence while only 7% have little or no confidence in this regard. Likewise 78% experience little or no discomfort at the thought of taking responsibility for organisational change. In view of our finding that 59% have managed business process change, and 20% have managed organisational change or work design, it would appear that this high level of comfort is based on experience. However, despite these signs of self-efficacy, project managers do not expect to have everything go their way. 62% expect to have to renegotiate targets to a significant extent while 32% expect to have to renegotiate to some extent. Then, when they encounter resistance, 36% expect to have to compromise to a significant extent, while 52% expect to compromise to some extent. Few are very confident about being able to change the client’s mind when the client wishes to change the project scope. Only 26% express significant confidence, 56% have some confidence, leaving 18% with

25
little or no confidence on this score. In addition, only 22% feel confident managing when they do not have authority over the resources they need even though this is the perennial condition of project managers. 57% express low levels of comfort in this condition. The emerging picture therefore is of the IT project manager as confident in part, but always ready to consult, adapt and change as the situation demands. Project manager satisfaction Half of our project managers report being satisfied in their job, either totally or to a great extent. One third are more ambivalent, expressing a degree of satisfaction but by inference also a degree of dissatisfaction. Only 15% are dissatisfied below the mid-point of our scale. In view of the fact that project performance appears to be improving, it is not surprising that project managers should be feeling good about themselves and their roles. At the same time, there is clearly much progress yet to be made so the role still contains ample challenge to stimulate the interest of ambitious managers. So long as satisfaction does not morph into complacency, the combination of experience, length of tenure and level of satisfaction should be heartening news in that it bodes well for the growth of the profession. If individuals are prepared to stay in the role over many years then their learning and knowledge should accumulate. If the right communication and developmental processes are put in place by companies and by the professional associations, younger recruits to the ranks of IT project manager stand to gain. But as we see in a subsequent section, these conditions are not universal. The characteristics of project managers – according to project managers We asked respondents to rank their top seven from a list of 25 characteristics for project managers. The list is based on characteristics commonly cited in research studies as important for success. Table 5 shows the aggregated ranking for the sample based on a simple count of how many times each characteristic is ranked. (While there are other ways of preparing the aggregated ranking, the other two methods we tried correlate closely with Table 5). One of the most salient findings is that notwithstanding the 7,000 person years of project management experience in this sub-set of our sample, there remains considerable variety in the perception of what characteristics are important. The highest ranked characteristic, commercial awareness, is only ranked in their top seven by 65%, with only three others being ranked by more than half the sample. 20 out of the 25 characteristics are ranked by between 10-40% of the sample. Of the highest ranked characteristics, several are obviously task-oriented including commercial awareness and understanding of IT. Some characteristics, including written communication and problem-solving, relate to skills. Other characteristics, such as goal orientation, preparedness to take risks, preparedness to work in a team, and attention to detail, are more a matter of disposition. Others again, such as confidence, integrity, and enthusiasm, are more personal traits.
26
A few relative differences in the rankings are worth comment. Preparedness to work in a team is ranked 12th, while leadership ranks 15th and initiative 23rd, which reinforces our earlier conclusion that team-orientation is stronger than individualist leadership. Written communication ranks 15 places above oral communication, which appears to suggest that the important elements of communication are written rather than spoken. We are not surprised to find that commercial awareness ranked highest but in view of that we are considerably surprised to find that understanding of business processes is ranked 25th and ability to manage change is ranked 21st. Explanations of this disparity could be that project managers see business processes as unproblematic and view themselves as very capable of managing change. In our experience, this would not be a view shared by most business managers. An alternative explanation is that while project managers acknowledge that they need to be seen to relate to commercial concerns, they do not see business process knowledge and change as essential to successfully delivering commercial objectives. In our view, this would be a worrying trait if real. Our sense is that further research is needed to fathom project managers’ understanding of the relationship between change and commercial objectives and their ability to deliver on both. When we asked respondents to comment on how strongly the same 25 characteristics are exhibited in the project manager they know best, the top three – confidence, goal-orientation and integrity – all appear in the top seven most important. But that consistency aside, there are some notable differences. Understanding of business processes and ability to manage change rise to 7th and 10th=. Leadership and initiative rise to 9th and 10th= from 16th and 23rd respectively which places them above preparedness to work in a team. Characteristics that drop down in these rankings compared to the importance ranking include commercial awareness (from 1st to 12th), understanding of IT (from 4th to 17th
which is interesting given our respondents have themselves an average of nine years in the IT industry), preparedness to take risks (from 3rd to 25th), written communication (from 8th to 21st), noting that oral communication by contrast rises from 22nd in importance to 12th in practice), and attention to detail (from 8th to 19th). It is not easy to formulate a clear picture of what these responses are saying. The most obvious point in relation to the project manager known best by our respondents is that the strongest characteristics are very personal leadership characteristics rather than knowledge-based or skills-based. For example, the top five in order are confidence, integrity, goal orientation, enthusiasm, and energy. It may be that these types of characteristic dominate in this question because they are more observable than skills like planning and time management. Thus, it is possible that these results derive from the difference between respondents looking inside themselves and asking what characteristics they feel are most necessary against looking at others and recognising the most salient or obvious characteristics –for example, leadership may be more apparent than team-orientation. It is important to be precise about the interpretation of the differences in ranking that we find. A low ranking in the characteristics of project managers known to our respondents does not imply absence or weakness of this characteristic in any absolute sense. These peer rankings all averaged above the mid-point on a five-point scale.

27
Strictly speaking, what the differences tell us is that the relative strengths of project managers do not in all respects match the relative importance accorded to the different characteristics although given the variability in rankings we should be cautious about treating the responses as tablets of stone. However, nobody doubts that there is much to be learned, so it is reasonable to infer that many of the disparities do reflect areas for improvement. Summary Our exploration of individual project manager characteristics has yielded some interesting findings. We see a type emerging – team player, consultative in information gathering and decision-making, confident but sensitive to potential difficulties and ready to adapt and change to the situation. Why might such a type evolve in the industry? Why not just collect the relevant information and decide? Our interpretation is that unlike the traditional construction or engineering project where the project manager relies upon knowledge workers (engineering consultants) for specialist advice but delivers the project through tradespeople, semi-skilled and unskilled workers, in IT the project is delivered through the knowledge workers. The rate of change of technical knowledge requires the project manager to depend on the specialists not merely to provide information but also to help integrate it with other specialist knowledges into appropriate decisions. In addition, the project manager engages in a significant level of work in actually delivering the project and therefore is more than just a manager but has to play a dual role as team member. And, as we indicated, it may be necessary to play a “first among equals” role in order to win the team’s commitment in order that they will willingly contribute their knowledge to advance the project’s objectives. Hence project manager confidence is required to inspire team member and stakeholder confidence, integrity to win team member and stakeholder trust, enthusiasm to motivate and energy to keep the team mobilised. These contrast to some extent with what IT project managers view as most important in that they are aware of the business pressures for commercial focus and risk-taking and the need to focus on them but in practice less obviously exhibit these characteristics. This suggests that there is a lag between the role that project managers have forged for themselves and the developing demands for the project manager to be less target-focused (schedule, budget, scope) and more focused on business objectives. Section Three Organisational Project Capability Introduction As we noted in the introduction to this report, the unglamorous, unheroic but potentially effective route to better project performance is via small improvements in organisational capability that incrementally reduce project variance. By this route, the heroic rescue becomes less and less necessary.

28
Our model comes from the construction industry where, over the last 20 years, the larger, more advanced contractors have reduced the variability in project performance. They still have occasional disasters, but on a routine basis more of their projects hit their targets than used to be the case. The difference has been in the way they organise to manage and support their project managers and the project management activity. Our research has therefore investigated the management of IT project managers by their employer so as to understand how they are currently managed and what level of useful support they can expect. The responses delivered several clear messages. First, while project managers can count on senior managers to whom they report for varying degrees of support in matters of clarity of task setting (targets, scope etc), management of politics and stakeholders, provision of resources and similar, organisations could often do much more. Second, and most striking by comparison with the support provided for new and on-going projects, most organisations appear to pay little attention to developing an overall organisational capability in project management. We find that attention to creating a career structure, identification of high potential individuals, training ahead of first appointment, formal and informal professional development, and encouragement for self-development are less rather than more usual. We find that active performance management is similarly lacking. Many expect their careers to be positively affected by their performance but far too frequently below-average performance is allowed to pass unchallenged and uncorrected. By organisations failing to correct and learn, they have permitted underperformance to become acceptable. By not investing in processes to systematically develop individuals and by not weeding out those who are not well selected in the first place, organisations have failed to incrementally improve the quality of their project manager pool, and hence their organisational capability in project management. Reporting lines The boss can be a great support and aid to success in your job if they understand your challenge and have the resources and abilities to assist. So, to whom do project managers report? More (55%) report to a senior IT manager, director or CIO than to any other individual or committee (see Figure 15). This is not surprising as we assume many will have their organisational home within an IT-dominated structure such as an IT department or an IT services company. More unexpected, therefore, is the fact that, even if we allow that all the “Others” are IT managers not deemed to be “senior”, at least 33% appear not to report into an IT manager at all. This is surely a sign of growing adherence to the idea that “there are no IT projects, only business projects”. And, while 41% report into a business manager and 16% to a non-IT Board director, 50% report to a Steering Committee. We assume that most Steering Committees include some business representation so we can conclude that most projects do report to the business in some way or other. The statistics also tell us that whether or not they operate within a formal matrix organisation, the need to satisfy an IT superior and some representative of the
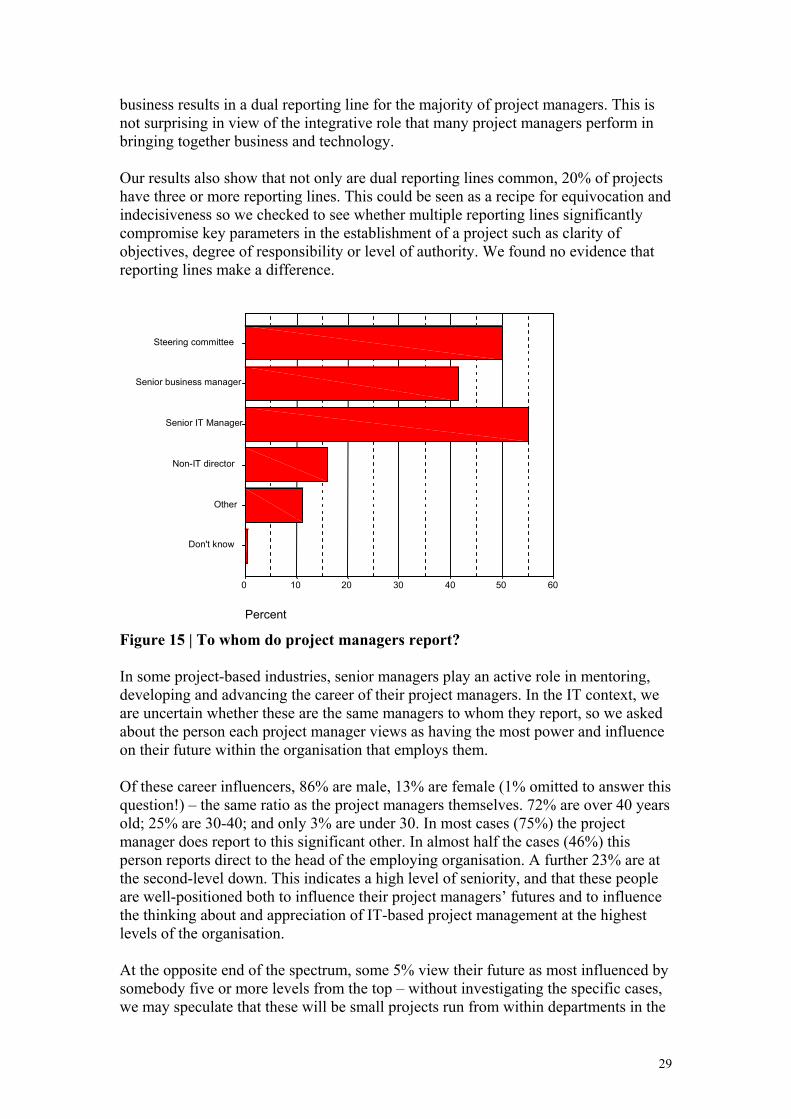
29
business results in a dual reporting line for the majority of project managers. This is not surprising in view of the integrative role that many project managers perform in bringing together business and technology. Our results also show that not only are dual reporting lines common, 20% of projects have three or more reporting lines. This could be seen as a recipe for equivocation and indecisiveness so we checked to see whether multiple reporting lines significantly compromise key parameters in the establishment of a project such as clarity of objectives, degree of responsibility or level of authority. We found no evidence that reporting lines make a difference.
Steering committee
Senior business manager
Senior IT Manager
Non-IT director
Other
Don't know
Percent
605040302010 0
Figure 15 | To whom do project managers report? In some project-based industries, senior managers play an active role in mentoring, developing and advancing the career of their project managers. In the IT context, we are uncertain whether these are the same managers to whom they report, so we asked about the person each project manager views as having the most power and influence on their future within the organisation that employs them. Of these career influencers, 86% are male, 13% are female (1% omitted to answer this question!) – the same ratio as the project managers themselves. 72% are over 40 years old; 25% are 30-40; and only 3% are under 30. In most cases (75%) the project manager does report to this significant other. In almost half the cases (46%) this person reports direct to the head of the employing organisation. A further 23% are at the second-level down. This indicates a high level of seniority, and that these people are well-positioned both to influence their project managers’ futures and to influence the thinking about and appreciation of IT-based project management at the highest levels of the organisation. At the opposite end of the spectrum, some 5% view their future as most influenced by somebody five or more levels from the top – without investigating the specific cases, we may speculate that these will be small projects run from within departments in the

30
heart of their organisation and that the project manager is not on a major project management career trajectory. The majority of these significant others have considerable experience in managing project managers, with half having five or more years’ in the role. At the other end of this experience spectrum 19% being in their first or second year of having such responsibility (Figure 16). Their personal experience as project managers themselves varies from 33% who have more than ten years’ project management experience, 30% with between five and ten years experience, to 22% who have none whatsoever (Figure 17). In only 9% of cases did respondents indicate that their career influencer has a project management qualification (although 24% say they do not know).
> 10109876543210
Per
cent
25
20
15
10
5
0
Figure 16 | Experience of the project manager’s line manager/director in managing project managers

31
> 10109876543210
Per
cent
35
30
25
20
15
10
5
0
Figure 17 | Extent of project management experience of the project manager’s line manager/director In summary, most project managers report to a senior manager. Most report to a manager who is experienced in project management and has considerable experience managing project managers. And most report to their career influencer. If we combine these facts with our further finding that most organisations do not have a project management career structure, two implications follow. First, the relationship between the project manager and boss is of critical importance to the project manager not merely in terms of the goal of project success but also in terms of their personal future. Second, the absence of a career structure means that the senior manager should take active responsibility for managing their project managers’ careers. Management support for project managers It is widely agreed that top management support is a critical success factor for IT projects. This is often narrowly interpreted as whether top management will step in to remove the many roadblocks strewn in the path of the project manager. A broader interpretation focuses on how senior management establishes the project as well as on how it actively intervenes. If we are to understand why some senior managers are more supportive than others, we need to understand their motivation, their appreciation of the project management task, and their ability to help. Alignment of interests The first question to ask is how motivated senior management is to provide support. In our experience we have found that a significant driver of support is alignment between senior manager and project manager interests – often based on rewards. If project success is not monitored and rewarded, there is always the risk that senior managers will attend principally to those tasks whose outcomes will affect their rewards.

32
We find that 68% of project managers indicate that at least one senior manager expects to be assessed in part on the outcome of their current project, whereas 23% indicate that no senior managers are assessed. Against this, we find that in only 43% of cases do project managers expect that a senior manager will be rewarded significantly on the outcome of the project and that in 35% of cases no senior managers have a reward-based incentive. Somewhat worryingly 22% of project managers indicate that they did not know whether anyone will be rewarded. In these cases it is therefore difficult for project managers to be able to anticipate what if any support may be forthcoming and from whom. Sympathy for the project management task We also asked about the degree of sympathy project managers enjoy from those to whom they report. Senior IT managers and executives are seen as clearly the most sympathetic with more than 66% of project managers seeing them as considerably or greatly sympathetic. This contrasts with approaching 50% for steering committees and senior business managers and 37% for non-IT Board directors. Almost 30% saw this last group of directors as either not at all or only slightly sympathetic to the challenges of project management. Clearly, they represent the toughest reporting line to satisfy. Senior manager capability to support project managers Having sympathy for the challenges of project management and incentives to assist must be complemented by the capability to support. Without command of resources and the appropriate knowledge and understanding, motivation and goodwill prove of no avail. We asked about different forms of support including provision of resources, negotiating changes to key project parameters, solving problems, promoting the project, and dealing with clients, stakeholders and associated politics. It appears that 50-60% of projects have managers or steering committees capable of supporting them to a considerable extent or more when it comes to securing resources both initially and when subsequently needed. They are similarly able to provide support in negotiating changes to targets and project scope, in promoting the project and in managing organisational politics. By contrast, in each of these respects 10-20% of project managers feel that those to whom they report are unable or nearly unable to support them, while approximately 30-40% indicate a middling capability to support. The pattern is noticeably less favourable in relation to ability to assist with client and external stakeholder management, with only 40% at the higher end of the support spectrum and 20-25% at the lower end. Two other areas of support stand out. The first is capability to help with technical problems where 67% report little or no capability in their reporting line to help them. 14% report considerable or great capability and 19% a moderate level of ability to support technically (Figure 18). In view of the fact that 55% report to senior IT managers, it is clear that project managers do not see their superiors as holding their position on the basis of useful technical skills.

33
To a great extent4To some extent2Not at all
Per
cent
40
30
20
10
0
Figure 18 | Level of line manager capability to support on technical problems The second difference to stand-out lies in capability to support the project manager in solving project management problems (Figure 19). Here 25% report considerable or great capability to help, 40% moderate capability and 35% little or no capability.
To a great extent4To some extent2Not at all
Per
cent
45
40
35
30
25
20
15
10
5
0
Figure 19 | Level of line manager capability to support on project management problems Actively helping the project manager on technical or project management tasks appears to be thought beyond many senior managers. In relation to the technical problems this may reflect rapidly changing technology. However, given senior managers’ own significant experience in project management, it is harder to understand why they are not seen as capable of helping. One possible explanation is

34
that there is a generation gap. Perhaps today’s project manager sees her/his superior as having operated in a different environment and as therefore having outdated project management skills. Indeed, they may see their predecessors as those responsible for having given IT projects a bad name by contrast with their own generation that is seeking to reverse that perception. While it is true that some aspects of projects appear to have changed – the reported trend to smaller projects, packaged software, prototyped systems, reuse, more extensive outsourcing – it is unlikely that core skills in planning, monitoring, controlling, communicating, managing risk etc have been rendered outdated. The relationship between project manager and senior manager is therefore a target for further research to understand and surmount any barriers to making this a more productive and supportive relationship. Establishing the project Establishing a project’s birthright can play a critical role in determining its ultimate outcome. This is a key area in which the senior manager or steering committee can and should exercise influence. Their role is to equip as far as possible the project manager with the means to be successful. This includes setting objectives, defining responsibilities, assigning authorities, and allocating appropriate resources. Our results show that nearly half of the project managers surveyed feel that project scope and targets had been clearly defined at the start of their last completed project. This is encouraging, given the widespread acceptance of clarity of objectives as a critical success factor. At the same time, nearly one in four (23%) disagree. It is tempting to suppose that a steering committee will be less clear than an individual, and that the further the project is from the top of the organisation, the more diffuse the objectives might become. However, we find no clear difference in clarity of scope and targets whether the project manager is reporting to a steering committee, a senior IT manager, a senior business manager or a non-IT board director. We also find that the number of organisational levels from the top also makes no apparent difference to clarity of scope and targets. Divided responsibilities increase management complexity, the probability that tasks will fall through cracks, and the risk of damaging disagreements and power struggles. Six in ten respondents say that they are given sole responsibility for their project, but one in five (19%) indicate that they are not. It is not easy to interpret why 21% took a neutral stance on this. One possibility is that although they did not have a joint role, they are not confident that their authority will not be undermined in some way during the project life. A perennial bugbear of project managers is lack of decision authority – it is often not possible to command compliance in pursuit of project goals. Some 21% indicate that they do not have enough decision authority, while a further 31% are hesitant to say that they have sufficient decision-making power. On the positive side this leaves 47% who are apparently satisfied with their decision power. Exactly what this decision making power really amounts to is called into question by the doubt project managers express about their access to the resources they need. Only

35
24% agree that they can easily access the necessary resources, while 40% clearly indicate they cannot, leaving 36% uncertain that they can access all the resources they might require. The very strong sentiment in relation to the importance of informal networks in achieving targets (77% agree that they are important) suggests that part of the way they get around the resource-access problem is through their networks rather than via formal organisational structures. Communication and reporting We have found previously that construction project managers typically talk with their boss at least once a day and often more than once. Frequent communication offers two advantages. First, it reduces the chance that a problem will be suppressed with long term consequences for performance. Second, where the senior manager is able to help with the problem, it can be resolved more quickly. In view of our respondents’ reservations about the ability of their superiors to help with technical and project management problems, this latter may be less important in the IT context. We find (Figure 20) that 27% of our IT project managers talk to their line manager or director at least once daily. A further 45% say they speak every few days, with 18% speaking once a week. Just 11% speak less frequently than weekly.
< once a monthMonthly
FortnightlyWeekly
Every few daysDaily
> once daily
Per
cent
50
40
30
20
10
0
Figure 20 | Frequency of contact between project managers and their line manager/director Formal reporting is, not surprisingly, less frequent (Figure 21). We find that 8% report more than once a week; 44% weekly; 20% fortnightly, 24% monthly and 4% less frequently than once a month.
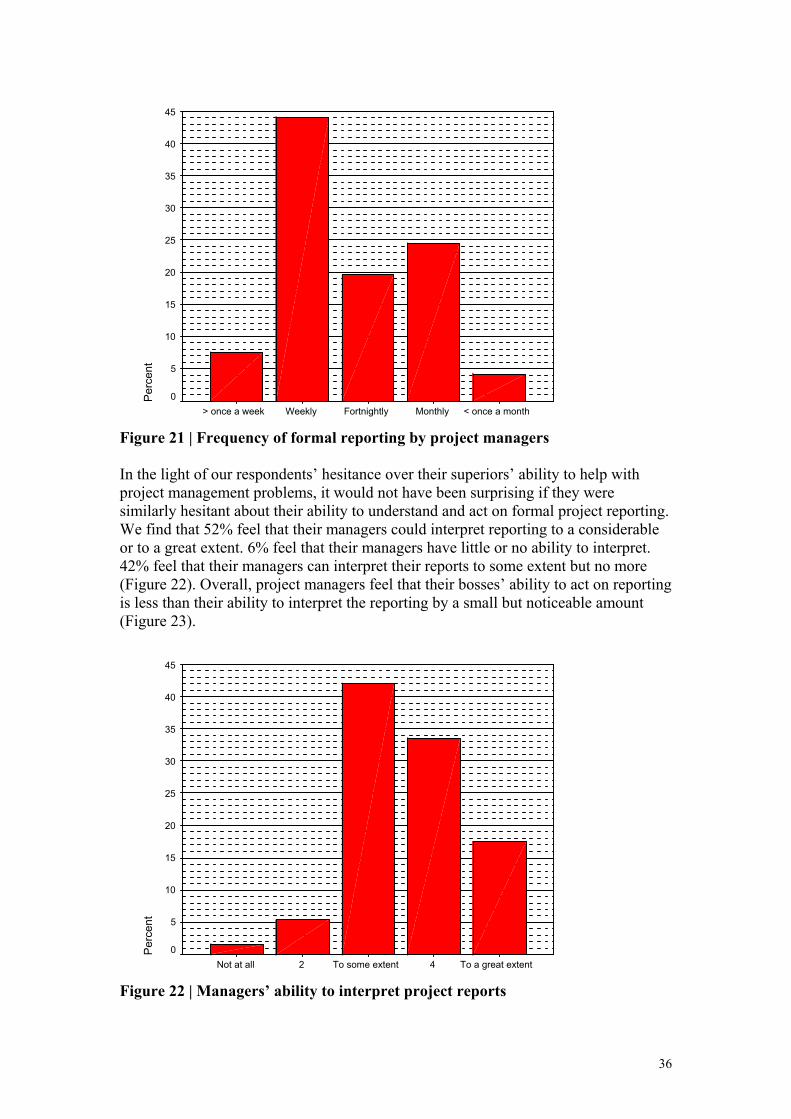
36
< once a monthMonthlyFortnightlyWeekly> once a week
Per
cent
45
40
35
30
25
20
15
10
5
0
Figure 21 | Frequency of formal reporting by project managers In the light of our respondents’ hesitance over their superiors’ ability to help with project management problems, it would not have been surprising if they were similarly hesitant about their ability to understand and act on formal project reporting. We find that 52% feel that their managers could interpret reporting to a considerable or to a great extent. 6% feel that their managers have little or no ability to interpret. 42% feel that their managers can interpret their reports to some extent but no more (Figure 22). Overall, project managers feel that their bosses’ ability to act on reporting is less than their ability to interpret the reporting by a small but noticeable amount (Figure 23).
To a great extent4To some extent2Not at all
Per
cent
45
40
35
30
25
20
15
10
5
0
Figure 22 | Managers’ ability to interpret project reports

37
To a great extent4To some extent2Not at all
Per
cent
50
40
30
20
10
0
Figure 23 | Managers’ ability to act upon project reports We explore whether frequency of reporting and communicating is affected by whether a senior manager is assessed or rewarded on the outcome of the project. It appears that there is a slightly greater likelihood that reporting will occur weekly or more frequently in these circumstances, but we could see no difference in frequency of informal communication. However, reporting does appear to be more frequent in the for-profit sector rather than in not-for-profit organisations (see Table 6) and this may reflect a more stringent exercise of management accountability at all levels. More than
once a week
Weekly Fortnightly Monthly Less than once a month
Non-profit (N=66)
8% 21% 23% 40% 9%
Profit (N=270)
7% 51% 19% 20% 3%
Table 6 | Percentage of projects within each sector reporting formally at the stated frequency Investment in project managers – selection, training and development One area within an organisation where senior management can indirectly affect project performance is through the identification, training and development of project managers. Broadly speaking, our results under this heading paint a discouraging picture of the extent to which companies across industry take seriously key elements of the human resource management of their project managers and the development of the organisation’s capability. Indeed, in no other part of the four questionnaires are the responses so uniformly negative.

38
Only 31% of our respondents indicate that there is either an individual or a unit (such as a corporate project office) responsible for developing project managers within their organisation – 66% are definite that there is nothing or nobody answering this description. We find that only 23% agree that their organisation identifies high potential individuals before appointing them to their first project as opposed to the 40% who disagree – mean average score on five point scale is 2.8. Most organisations appear to drop their project managers in the deep end without training (66%) compared to the few who do train in advance (14%) – mean average score is 2.2. The situation is slightly better in relation to training after appointment, with 24% agreeing that training is provided against 41% disagreeing – mean score 2.7. By any interpretation, it appears that project managers do not see their organisations investing as a matter of course in their development through formal training. So, do organisations encourage project managers and potential project managers to learn informally? Again, the answer appears to be less so rather than more so. For example, 24% agree that their organisation creates opportunities for potential project managers to learn from experienced project managers against 50% who disagree – a mean average score of 2.6. The same appears true in the mentoring of junior project managers by senior project managers. 25% agree that mentoring takes place against 53% who disagree – mean score 2.6. And, again, project managers feel similarly about the creation of peer learning with 25% agreeing that their organisation does create opportunities for peer learning and 48% disagreeing – mean score 2.7. So are project managers encouraged to learn for themselves? No more so than from each other, it appears. We find 27% agree that their organisation gives financial support and/or study time for individuals who take project management qualifications against 50% who disagree – mean score 2.6. Are they rewarded for their studies? A mere 11% agree against 69% who disagree – mean score 1.9. The situation is broadly the same for encouragement to become a member of a project management professional association with 12% agreeing that there is encouragement and 78% disagreeing – mean score 2.0. Consistent with this lack of organisational investment in selection and development of individuals is the lack of a career path. Only 17% of respondents agree that their organisation has a well-recognised career path for project managers while 67% definitely disagree – mean score 2.2. Somewhat ironically, we find 39% agreeing that their organisation views project managers as an asset against just 25% who disagree although 36% remain uncommitted – mean score 3.2. There are numerous possible interpretations of this. It could be wishful thinking – nobody likes to feel they are not valued. It could be that many are indeed valued as an asset but their organisation does not see them as worth long term developmental investment – after all, if we train them, they’ll leave for a better salary elsewhere! However, our earlier data on project manager tenure showing an average of more than six years with the current employer indicates that if this is the view, it is largely misplaced.

39
For a management discipline so important to the realisation of organisational change and so long viewed as underperforming, the widespread failure by organisations to invest in project management improvement is little short of dereliction of duty to the shareholders. The opportunity to make a change for the better is enormous. Performance management It is important to achieving real accountability for project performance for organisations not to switch horses during the race. Most (70%) agree that in their organisation the project manager remained in charge throughout the project (13% disagree). While this should enable senior managers to hold their project managers to account for performance, the practice of performance management appears quite variable. We find 34% agreeing that their organisation formally measures project manager performance and as many (36%) disagreeing – mean score 3.0. We find 28% agreeing that project manager performance is judged relative to project difficulty against 38% disagreeing – mean score 2.8. Some 32% agree that mistakes are recognised as part of the project management learning process against 29% who disagree – mean score 3.0. We find that project managers do expect their careers to be affected by their performance (48% agree against 23% disagree) – mean score 3.4. But this does not consistently flow through into financial rewards, with only 25% agreeing that remuneration is affected by performance in contrast to 43% who disagree – mean score 2.7. So if remuneration is only a very limited management tool, what do organisations do about project managers with below-average performance? We find 17% agree that they are coached to improve but 52% disagree – mean score 2.5. Similarly, 22% agree that poorer performers are redeployed, but 44% disagree – mean score 2.6. And at the more extreme end of organisational responses 15% agree that these poorer performers are dismissed, but a full 60% disagree – mean score 2.2. What does all this amount to? Our best interpretation is that good project managers can expect to be promoted rather than rewarded as project managers. Poor performers can expect to remain within the project manager pool without loss of financial benefits. In other words, many organisations will take little or no action to weed out or rectify poor performance. If our interpretation is right this is a recipe for persistent underperformance. This apparently low level of performance management probably reflects the historic tightness of the labour market for IT project managers. Organisations have not been able to afford to lose even below-average performers. At the same time, only the above-average performers have actually seen their careers advanced. Summary We have explored several aspects of organisational capability including senior manager/sponsor roles, stages of project governance – establishing, reporting and oversight – and management of the project manager pool.

40
The picture of the senior manager as supporter is not entirely clear but the emerging shape of the role appears to be dominantly associated with targets, scope, resources, politics and promotion, with a lesser capability in managing clients and external stakeholders. Project establishment probably reflects the realities that IT project managers have confronted for 50 years – setting objectives, defining targets, allocation of appropriate resources, and delegation of decision authority is often a compromise as a result of the existing organisational structure and politics. Oversight through formal and informal reporting is plainly undertaken although rather too many project managers are less than fulsome in their assessment of their superiors’ ability to understand and act on their reports, nor to actively assist with technical or project problems. Finally, senior management’s role in identifying the right people to be project managers, developing them and managing their careers appears poorly observed. In the absence of a project manager career structure, this is a serious and damaging shortcoming. In short, our assessment of organisation project management capability confirms that most organisations have focused their attention on managing individual projects rather than project performance across the organisation. This represents a major, unexploited opportunity. Section Four Project Performance A principal objective of this study has been to secure up to date UK data on IT project performance. This will enable project managers to benchmark themselves and for senior managers/sponsors to make informed assessments of the probability and magnitude of their investment risk. It will also give the community including media, auditors and the public a better understanding of IT projects by which to judge those that hit the headlines or that personally affect them. We collected data on four dimensions of project performance have been used – variance against budget, variance against schedule, variance on scope/functionality, and abandoned (in which case the other measures have been ignored). Sample The figures in this section are based on complete performance data for 421 projects. Although we received many more responses, many project managers only provided partial data. We concluded that to use partial data would risk skewing the results so we have settled on the base of data in which we are able to place most confidence. Performance levels In our sample, 39 (9%) projects were reported as abandoned.

41
We find that 3% of projects are completed ahead of schedule, 55% of projects are completed to schedule, and 35% behind schedule. We find that 15% of projects are completed ahead of budget, 26% of the projects are completed to budget, and 59% over budget. We find that 5% of projects achieve more than their originally specified scope, 41% of the projects delivered 100% of their planned scope, and 54% underdelivered. It is tempting to interpret these figures negatively – high percentages of missed targets – but to do so is to miss their significance. We therefore draw some comparisons with the Standish Group’s 1995 report. Using their categories of abandoned, challenged and completed we see a mixed outcome. Comparing performance within the challenged category, we see evident improvement. We interpret the Standish “challenged” category strictly to mean any project that fails to meet one or more of its schedule, budget and scope targets. Noticeably our own figures remain the same even when we relax our definition of challenged to permit 2% tolerance on budget, schedule and scope. Abandoned Challenged Successfully
completed Standish Group 1995
31% 53% 16%
Computer Weekly 2003
9% 75% 16%
Table 7 | Comparison on basic performance categories On this comparison, there is no difference in success rates. The difference lies in the greatly reduced percentage of abandoned projects that seemingly have all ended up in the challenged category. This could signal that organisations have become less decisive in ending troubled projects, rather allowing them to fester. Alternatively, it could mean that we are more discriminating in our initial choice of projects and/or that projects are better set up and better managed so that there is less need to cancel them. Further analysis suggests that the latter interpretation is more likely. Performance variance If we analyse performance more finely, we see greatly reduced variances. That is projects are performing more closely to their planned targets. The mean variance in schedule performance proved to be just 23%. That is to say that if the planned project schedule is 12 months, it will typically take almost 15 months to complete. When we exclude 26 projects whose schedule performance is extreme – either behind or ahead of schedule – the mean variance reduces to 16%. The mean variance in budget performance proved to be just 18%. That is to say that if the planned project budget is £1m, it will typically cost £1.18m to complete. When we exclude ten projects whose budgetary performance is extreme – either below or above budget – the mean variance reduces to 13%.

42
The mean average of functionality achieved is 93%. When we exclude 35 projects whose performance is extreme – either under or over specification – the mean scope rises to 94% Variance on
schedule Variance on budget
% scope successfully achieved
Standish Group 1995
+102% +75% 67%
Computer Weekly 2003 (excluding outliers)
+16% +13% 94%
Computer Weekly 2003 (including outliers)
+23% +18% 93%
Table 8 | Comparison of variances The obvious conclusion to draw is that IT project performance has improved to a remarkable extent. But, is the comparison valid? There are various respects in which the Standish study and our own are different. Standish conducted its first study exclusively in the US. Ours is based in the UK. Standish sampled companies through its own network. We use the Computer Weekly website. Standish reported on 8,380 projects. Our performance data are based on 421 projects. However, Standish’s number of respondents was only 365 compared to our 421. We must conclude that Standish asked individuals to report on multiple projects, which may have affected the accuracy of their reporting. Our respondents are reporting on projects they themselves have managed – which may have incorporated its own bias. All of the above differences are reasons for some caution. Nevertheless, the Standish Group has summarised more recent research (1999, 2003) in which it has found greater success rates and a decline in abandoned projects. Noticeably the difference between their findings for abandoned projects are converging on ours – although we should be cautious about concluding comparability as there remains a substantial difference.
Abandoned Challenged Successfully completed
Standish Group 1995 31% 53% 16% Standish Group 1999 28% 46% 26% Standish Group 2003 15% 51% 34% Computer Weekly 2003 9% 75% 16% Table 9 | Comparison on basic performance categories So, if using its own methodology Standish detects improvement, it reinforces the probability that our findings do legitimately point to improvement.

43
Factors affecting performance With a wide range of available data, we have investigated whether certain differences in project context and parameters are related to different levels of performance using both the three Standish Group categories – abandoned, challenged, successfully completed – and the four statistically valid groups for our sample – abandoned, time challenged, cost challenged and typical (see box). We have conducted a statistical cluster analysis through which we have partitioned performance into five groups – abandoned, time challenged (i.e. principally deficient in terms of schedule overrun), cost challenged (i.e. principally challenged in terms of cost overrun), typical, and outliers. The “typical” group of projects includes all those successfully completed together with those challenged projects where the variance is so small that they are statistically indistinguishable from the successes. Thus, our “typical” group reflects our commonsense understanding that a small percentage variance is of little or no importance. Fully 55% of projects fit this category, being on average less than 5% behind time, just over 5% under specification and just less than 4% over budget. In essence, these are essentially successful projects. In the analysis of factors affecting performance, we concentrate on the split between “typical” and others for identifying successful v unsuccessful. Also, we have excluded from our analysis the 12 extreme outlier projects. Project provision – internal v external Figure 24 indicates that there is a small performance advantage to be gained from projects conducted by an external service provider. When the Standish categories are used across the full sample, the performance advantage of external providers is maintained with external projects being10% successful using the strict Standish measurement of success as against 8.5% of internal projects.

44
External Internal
Abandoned Cost challenged Time challenged Typical
10% 4%
8%
80%
9%6%
15%
70%
Figure 24 | Comparison of performance between internally and externally managed projects Sector – private v public Figure 25 compares performance of private and public sectors. It shows a higher percentage of private sector projects being abandoned that may reflect the difficulty the public sector experiences from the political sensitivities of backing down or admitting mistakes. The private sector appears to have fewer cost challenged projects and more time challenged projects. Overall, the public sector appears to have a small advantage over the private sector in achieving a typically sound performance. Given the relative numbers of projects being compared here, it is this last indicator that is the most robust, but given the small difference between them it is probably best interpreted as indicating little difference in performance across the two sectors. Of course, this finding runs counter to folklore and many industry and public perceptions. Four points are worth making in this regard. First, perceptions can be misleading. There are several possible reasons for misperception of public sector projects. The public sector is subject to transparent accountability processes that result in more public than private sector IT problems getting into the public eye. Media interest ensures that public sector problems are broadcast. Public sector project problems such as those at the Passport Office or in the National Health Service can have repercussions across the whole community. Second, it is useful to try a reality check using collateral evidence. For example, reports that the UK public sector has spent £1.5bn on cancelled or overrun projects in the last six years can be conveniently read by the uncritical as public sector incompetence. Yet set against the £10bn that the Public Accounts Committee identifies as being spent on 100 large projects, this suggests a wastage rate of approximately 15%. This compares favourably with the most recent data from the Standish Group indicating a wastage of $55bn out of a total US spend of $255bn, i.e. a wastage rate for all projects of 21.5%. While such calculations are necessarily very

45
rough, they confirm that we should not jump to conclusions about public sector IT projects in today’s environment. Third, our findings are based on data that cover many of the public sector’s smaller and less visible projects as well as some of its bigger ticket items so it offers a more representative view than an exclusive focus on large projects. Fourth, the public sector has in recent years engaged the private sector to help with its projects so it should not be surprising that performance is similar across the two sectors. In short, while we certainly should not jump to the conclusion that the public sector no longer needs help, we definitely should be more cautious about leaping from a few high profile examples to generalities about wholesale misinvestment of public funds.
Private Public
11% 4%
12%
73%
4%9%
8%
79%
Abandoned Cost challenged Time challenged Typical
Figure 25 | Comparison of performance between private sector and public sector projects Project size Figures 26-29 give us several important fixes in relation to project size and performance. Figure 26 based on project cost shows that projects costing less than £100,000 perform similarly whether less than £50,000 or between £50,000 and £100,000. Performance declines between £100,000 and £500,000, and then declines again above £500,000 (although £1-5m projects report similar performance to the £100-500k band).

46
<£50,000 £50,000-£99,999
3%3%
10%
83%
6% 3%
9%
82%
£100,000-£499,999 5% 5%
13%
77%
£500,000-£999,999
14%
9%
12%65%
£1m-£4.9m £5m+
9%7%
9% 76%
18%
4%
13%65%
Abandoned Cost challenged Time challenged Typical
Figure 26 | Comparison of performance by project budget size

47
Figure 27 shows performance against project elapsed time divided into quartiles. Quartile 1, the smallest 25%, which last up to 5 months, yields 81% of projects with typical performance. Quartile 2 6-10 months, yields 83% with typical performance. Quartile 3, 11-17 months, yields only 64% typical, and Quartile 4 yields less again at 58%. Again, we see performance decline with size after the second quartile. Analysed by 3 month periods instead of quartiles again indicates that it is at the 10-12 month duration that performance clearly starts to decline.
1st Quartile
7% 4%
8%
81%
2nd Quartile2.5%
2.5%12%
83%
3rd Quartile
11%
7%
18% 64%
4th Quartile
19%
10%
13%
58%
Q1=1-5 months Q2=6-10 months Q3=11-17 months Q4=18+ months
Abandoned Cost challenged Time challenged Typical
Figure 27 | Comparison of project performance by project elapsed time

48
Figure 28 shows performance against person months of project resource divided into quartiles. Here we see performance decline continuously with increase in size. The typical projects decline from Quartiles 1-4 from 80% to 78% to 73% to 61% as size increases. Here Quartile 1 represents up to 6 person months, Quartile 2 up to 20 person months, Quartile 3 up to 95 person months and Quartile 4 anything above 95 person months.
1st Quartile 2nd Quartile
3rd Quartile 4th Quartile
Q1=1-6 months Q2=7-20 months Q3=21-95 months Q4=95+months
6% 3%
11%
80%
1%7%
14%
78%
11% 5%
11%
73%
15%
10%
14%61%
Abandoned Cost challenged Time challenged Typical
Figure 28 | Comparison of project performance by project time in person months

49
Figure 29 shows that projects that are somewhat larger or somewhat smaller than is customary for their organisation perform similarly to those that are just average sized for that organisation. But those that are very small by comparison perform much better, and those that are very large perform much worse.
Very small Small
13%
87%
7%6%
12%
75%
Medium
8%6%
11%
75%
Large Very large
9% 5% 11%
75%
25%
7% 16%
52%
Abandoned Cost challenged Time challenged Typical
Figure 29 |Comparison of performance by size of project relative to normal for the organisation

50
What does this say about project size? It does support the belief that small is beautiful in terms of performance against project targets. However, for the individual organisation a modest increase or decrease in size against what it is used to makes no difference, but a significant increase in size has a negative effect on performance while a significant reduction in size has a positive effect. Project challenge The degree of difficulty or challenge associated with a project can be partitioned into complexity (measured in terms of intensity of interaction with other systems and business processes)3, internal volatility (a measure of change within the organisation based on restarts, target changes, project manager changes and client changes), and contextual uncertainty (measured in terms of uncertainty and change to requirements). Figures 30-32 portray project performance against each of these measures.

51
1 (not at all)
2
3% 5%
5%
87
9% 3%
6%
82
3
6%
8%
10
76
4
5 (to a great extent)
8%
5%
12
75
14
5%
15
65
Abandone Cost Time Typica
Figure 30 | Relationship between complexity and project performance

52
1 (not at all) 2
10%
5%
85%
6% 2%
9%
82%
3
6% 2%
10%
81%
4
5 (to a great extent)
9%
8%
15%
69%
25%
14%
17%
44%
Abandoned Cost challenged Time challenged Typical
Figure 31 | Relationship between requirements uncertainty and project performance

53
1st Quartile 2nd Quartile
3rd Quartile 4th Quartile
3% 3% 5%
90%
6%2%
10%
81%
13% 7%
18% 61%
23%
10%
13%
55%
Abandoned Cost challenged Time challenged Typical
Figure 32 | Relationship between internal volatility and project performance By focusing principally on typical performance in each of the above three figures it is clear that the more uncertain the requirements, the more complex the system and the more change that takes place within the project the poorer performance will be. This is no surprise. The research bears out what practitioners and academics have known for many years. However, these findings serve as a useful reminder that where discretionary action on the part of a project team, the project manager, sponsor, client or organisation can reduce uncertainty, complexity and change, then it will reduce the level of risk to the project. In instances such as promotion of a sponsor or client to a new role, the organisation should be aware that in making the move while a project is in progress increases its risk. But, we do have to be sensible in our interpretation. In some cases, change of budget or scope is an action designed to assist an already troubled project. In such a case the change may indeed increase risk but is more likely to decrease it.

54
Personal background of project manager Having collected information about age, education, experience and other details, we have checked for any obvious and significant differences. In relation to age, we find that the under-30s perform best. No other age difference is apparent. As there are relatively few under-30s in our sample, the most likely explanation is statistical variation rather than a real effect. The data do not support any form of age discrimination in relation to recruitment and retention. Again with experience as a project manager, one group appears to perform better than the others – those with five to 7.5 years experience. This could be a real effect if it is the case that this level of experience combines both enough knowledge and sufficient hunger to achieve the best outcomes. On the other hand, it could be statistical variation. It requires further investigation before we can be confident to recommend that managers act on this finding. With experience in the IT industry, there is no discernible performance effect. This certainly suggests that selection of project managers with extensive experience in the sector against those from other sectors is not obviously justified. The one personal characteristic on which there is a noticeable performance effect is gender. Of the projects where we have both project manager gender and full performance data, 82% of the female-led projects achieved typical performance against 68% of the male-led projects. Projects led by males are on average 20% over budget and led by females 5% over. The figures for time targets show that males are on average 31% over schedule and females 6%. In terms of scope, there is less obvious difference, with males delivering 7% under specification and females 8% under. These figures are based on the slightly larger sample we have of gender and one or more performance figure. Speculation is tempting but some caution is called for in reacting to these gender figures because the relative under-representation of females in our project manager sample means that the figure for females is based on just 22 projects where we have full performance data and 39 for which we have one or more element of performance. Leadership style Our earlier finding that there is a strong preference for adopting a first-among-equals leadership style raised the question, is this best for performance? A definitive answer will require more extensive research. However, our initial analysis indicates that more projects achieve the typical level of performance when managed by a project manager with this style than when led by a straightforward autocrat. Performance under consultative autocrats and the shareholder (laissez-faire) styles seems little different from the first-among-equals. The lesson appears to be that simple authoritarianism does not pay. Figure 33 displays our initial findings here.

55
Autocratic
21%
4%
21%
54%
Consultative/ Autocratic
9%6%
15% 71%
‘First Among Equals’
10% 7%
13%
70%
Shareholder
9.5% 5%
9.5%
76%
Abandoned Cost challenged Time challenged Typical
Figure 33 | Leadership style and project performance Industry variation Overall, while 55% of projects exceed budget, 27% come in exactly on budget, and 18% come in below budget. The Aerospace/Defence sector stands out for 86% of its projects meeting or coming in under budget. Media and Entertainment, perhaps better known for the budgetary overruns of blockbuster movies, also proves an effective cost manager with 75% meeting or doing better than budget. Of the project-intensive sectors, Financial Services meet or improve on budget in 34% of projects; the IT sector achieve 47%; Government and Education 49%; and Electronics and Telecommunications achieve 57%. Table 10 summarises by industry sector.

56
Numbe
r Numbe
r on
target
% on targe
t
Number
over budget
% over
budget
Number
under budget
% under budge
t Aerospace/Defence 14 7 50 2 14 5 36 Automotive 10 0 0 9 90 1 10 Chems/Pharma 16 7 44 6 38 3 19 Cons gds/Services 20 8 40 9 45 3 15 Electronics/Telecom 42 15 36 18 43 9 21 Energy/Utilities 21 5 24 11 52 5 24 Engineering/Const 9 3 33 6 67 0 0 Equipment manufac 7 1 14 6 86 0 0 Facilities mangmnt 3 0 0 2 67 1 33 Financial services 104 20 19 68 65 16 15 Freight/Logistics 13 5 38 7 54 1 8 Govt/Edu/Charity 65 23 35 33 51 9 14 Health/Life sciences 18 6 33 8 44 4 22 Hospitality/Leisure 4 0 0 2 50 2 50 IT 75 20 27 40 53 15 20 Media/Entertainment
12 6 50 3 25 3 25
Metals/Agri/Forestry
2 0 0 2 100 0 0
Professional services 24 3 13 20 83 1 4 Retail 27 13 48 9 33 5 19 Travel & transport 16 5 31 8 50 3 19 Other 17 6 35 8 47 3 18 TOTAL NUMBERS 519 153 277 89 AVERAGE % 27 55 18 Table 10 | Project Performance: Meeting budgetary targets While these figures provide some benchmark indications, it is premature to judge performance without looking at other dimensions because a sector such as Financial Services may trade off budget against timescale or functionality in order to achieve a better commercial outcome. Performance as a proportion of initially agreed specification solidly averages above 80%. Across the whole sample, 56% deliver 90-99% of the specification. Only approximately 20% of projects deliver less than 80% of the specification. A sprinkling of stand-outs deliver more than 100%. Visual inspection of the data suggests that the hypothesis of a trade-off between budget and functionality may be worth further investigation. For example, Aerospace/Defence, so successful on budget, delivered the third lowest average percentage of specification. However, other forces may be more powerful in determining this dimension of performance. For example, several industries with smaller average project sizes such as Media and Entertainment, Consumer Goods and Services, Professional Services, and Health and Life Sciences all report specification percentages in the mid-90s.

57
Distinctiveness of IT projects It has often been argued that IT projects are sufficiently distinctive that (a) performance is necessarily poorer because the projects are harder, and (b) project management practices from other sectors therefore do not apply. In focusing on what, if anything, is distinctive about IT projects, we continue to receive a consistent message about the centrality of the technology component. Table 11 displays responses as to the extent to which the challenges listed are seen as distinctive to IT projects. Challenge Mean score for distinctiveness to IT
[scale 1=low, 5=high] Mastering rapidly changing technologies 3.5 Harnessing technical innovation 3.13 Controlling complexity of interconnections
3.06
Overcoming business/user resistance 2.72 Specifying what is required with the right level of detail
2.59
Controlling changes to requirements 2.49 Undertaking organisational changes 2.48 Obtaining clarity of objectives/scope 2.45 Controlling changes to requirements 2.43 Estimating time and cost accurately 2.41 Knowing in advance what will count as success
2.29
Managing organisational politics 2.08 Managing multiple agendas and timetables
1.95
Monitoring progress effectively 1.94 Managing contractors/sub-contractors 1.92 Dealing with the personalities and egos 1.83 Managing industrial relations 1.8 Table 11 | Distinctive features of IT project management While in relative terms, managing rapidly changing technology, mastering innovation and controlling module inter-connections, are seen as the most distinctive characteristics, only these three features score above the scale mid-point, and two of these by a bare margin. In short, contrary to earlier suggestions, our project managers do not appear to view IT as a totally distinctive form of project management. Where they see it as having its most distinctive emphases is in relation to technology, innovation and complexity. We obtain a further perspective on this by analysing the answers to our question asking respondents to rank in order of difficulty what we took to be eight very different projects (see Table 12). There is no obvious bias in favour of or against IT, with congestion charging, .Net and Nectar all having substantial elements of conventional IT. The first place for the Eurofighter may well reflect the concerns

58
expressed elsewhere regarding technical and technological challenges. Equally, Eurofighter, congestion charging, and West Coast Mainline are all highly politically charged, and as we see below, politics is viewed as a barrier to performance.
Projects Rank Eurofighter 1 London congestion charging 2 West coast mainline 3 Microsoft’s .Net 4 Canary Wharf 5 BMW’s new mini 6 Nectar launch 7 Harry Potter film 8 Table 12 | Perceived order of difficulty of eight different project types Distinctiveness of IT project management If, as we find, IT project managers see their projects as having some distinctive emphases, then it is natural that they will see the demands of IT project management as different, at least in emphasis, from other types of project management. If correct, this has implications for selection, recruitment and development. It will also impact the ease with which project managers can successfully transfer into and out of the IT project sector. J Rodney Turner (1993), project management guru and academic, has proposed six traits of effective project managers based on his interactions with practising managers. As three of his traits are composites of two others, we separate them out into nine characteristics as follows: • problem-solving ability • results/goal orientation • energy • initiative • self assurance/confidence • leadership • perspective • communication • negotiation ability Table 13 illustrates how, on three different scales, our project managers rank and rate these characteristics against others. IT PMs’
ranking of importance
Ranking of occurrence of
characteristic in IT PMs
Nine characteristics from Turner
Commercial awareness 1 12 Confidence 2 1 Self-assured Preparedness to take risks 3 25 Understanding of IT 4 17

59
Integrity 5 2= Goal-orientation 6 2= Results orientation Written communication 7 21 Communication Attention to detail 8 19 Planning 9 15 Problem solving 10 8 Problem-solving ability Enthusiasm 11 4 Preparedness to work in a team 12 14 Delegation 13 20 Prior success 14 6 Leadership 15 10= Leader Energy 16 5 Energy Stakeholder management 17 16 Negotiation Conflict resolution 18 24 Negotiation Time management 19 23 Securing resources 20 22 Ability to manage change 21 10= Oral communication 22 12 Communication Initiative 23 9 Initiative Perspective 24 17 Perspective Understanding bsnss processes 25 7
Table 13 | Comparison of our study against nine characteristics from Turner Our first comparison looks at columns two and three to set the characteristics ranked as important by IT project managers in our survey against those identified by Turner. The fourth column of Table 13 shows 11 entries because our survey included two items that match communication (written and oral communication) and two that match negotiation (stakeholder management and conflict resolution). From inspecting the Table, we see that there are only four entries against the top 14 characteristics ranked in this survey and a further seven entries against the bottom 11 characteristics (although we anticipate that Turner’s study if replicated today would include commercial awareness as a high priority). Overall, we interpret these differences as indicating that IT project managers do see IT project management as a different challenge from that of the more traditional world of construction and engineering. One particular point to note is that the importance of understanding of IT is highly rated. Rodney Turner notes that some countries value technical competence in project management whereas the British typically do not. The ratings here clearly suggest that in IT project management technical competence is highly rated. And, this is consistent with our interpretation in that IT understanding is important to achieving credibility as a “first-among-equals” leader in a knowledge intensive project. Our second comparison between the third and fourth columns sets the characteristics of today’s IT project managers against Turner’s effective characteristics. Here we see a slightly closer match with seven of Turner’s characteristics appearing in the first 12 exhibited by IT project managers. This probably reflects the reality that even if IT project management is a different kind of challenge, in practice certain core characteristics are necessary.

60
There are two stand-out differences – negotiation and perspective. Negotiation may be far less highly rated because site labour relations, which loom so large in construction and engineering, are by comparison a non-problem in IT. However, this is surely not the case in IT-related change projects where labour issues can be critical. We speculate that often the labour relations aspects of change are outside the project manager’s responsibilities. The low valuing of perspective in IT is harder to explain. We would expect it to be important when all around are losing their heads, the project manager’s sense of perspective should help restore balance and guide the team to sensible solutions to their problems. We cannot see that this is different between IT and other forms of project. In summary, while there are clearly some common aspects to project management, our study indicates that project managers see distinctive challenges in IT project management and value different characteristics. The knowledge intensity of IT projects demands IT understanding in the project manager so that he or she can lead the team as first among equals. Risks Previous research has identified a wide variety of risks that lead to reduced performance in IT projects. Starting from the premise that there have been changes in IT project management in recent years directed to improving performance, it was natural that we should investigate whether the perception of risks was changing as a result. Table 14 lists a set of risks that have been identified in international research over the last thirty years. The order reflects the importance given to them by our respondents in a ranking exercise. In view of the experience and maturity of the project managers who responded to our surveys, their assessment of relative risks should reflect that experience rather than be biased, for example in reflecting the mistakes of the inexperienced. Risks Rank Lack of top management commitment 1 Misunderstanding of scope/objectives/requirements 2 Lack of client/end-user commitment/involvement 3 Changing scope/objectives 4 Poor planning/estimation 5 Inadequate project management 6 Failure to manage end-user expectations 7 Conflict among stakeholders 8 Change in senior management ownership 9 Lack of adequate change control 10 Shortage of knowledge/skills in the project team 11 Improper definition of roles and responsibilities 12 Artificial deadlines 13 Specifications not frozen 14 New or radically redesigned business process/task 15 Employment of new technology 16 Poor control against targets 17 Number of organisational units involved 18 Lack of effective methodologies 19

61
Staff turnover 20 Multiple vendors 21 Table 14 | Relative ranking of well-known risk factors The ranking represents no great surprise. Top management support, scoping and client commitment are stand out leaders in this survey and have been among the top risk factors in most comparable surveys. So what can project managers and their organisations do to improve things? Section Five Improving Performance What the project managers say We asked project managers two questions: what three changes would improve their own performance as project managers, and what three changes would improve their organisation’s performance on projects? There is considerable overlap between the two sets of answers because improvements that assist the individual will often assist the organisation and vice versa. In this section, we note some of the strong themes that emerge from the answers to these questions. We also pick up on a few quirky but insightful comments, and we draw attention to a small number of themes that have not surfaced strongly in prior surveys. Strong themes that come as no surprise include the following: • greater top management support • more commitment from users • more power and decision-making authority • greater financial control and flexibility • greater control over staff resources • commitment to requirements and scope once specified • more project management training • commitment to a stable project management method • alignment of IT project initiatives to business strategy • greater understanding of project management on the part of top management,
project boards and clients • greater realism in setting targets. Several respondents railed against imposed
rather than planned targets and deadlines • establishment of a supportive project office Some reveal deep and personal emotion. We list a few as follows with our interpretation in square brackets: • “more patience” [shortage of time and need to manage one’s own time] • “telepathy, precognition, time travel” [management is asking the impossible] • “be less intense” [exclusive focus on project goals damages one’s sociability] • “a change of employer, a change of industry, a change of attitude” [it is
impossible for me to be successful in my current environment]
62
• “20 years younger” [project management requires energy] • “better time management, more brains, less coffee” [less adrenaline (caffeine),
more reflection] • “make managers stay with their commitments [and] hang offenders out to dry”
[it’s too easy for others to renege on commitments] • “equanimity in the face of indifference” [there’s no point in being upset if my
commitment is not matched by that of others] • “not having sound project decisions reversed on management whim” [project
work is undermined by apparently arbitrary decision-making] • “everything to stand still for six months” [self-evident] • “recognition – by my boss – of my staff’s achievements” [self-evident] • “seriously – removal of my boss – No 1” [management can be a serious
impediment to performance] In one form or other, these comments are expressed by more than one person. What they all reflect is deep-seated frustration at the conditions under which the project manager operates and in most cases this appears to be accompanied by some sense of powerlessness. There are however several further, strong themes that emerge that are worth bringing to the fore because they have not previously been given adequate attention: • more focus on fewer projects – several project managers draw attention to the
need for prioritisation. This suggests to us that more programme-oriented disciplines would help
• the need for focused rewards, including performance incentives and loyalty bonuses
• desire for less politics and greater skills in dealing with political issues • structures for sharing learning including a supportive peer group • ‘no blame’ cultures that recognise that errors are learning opportunities • less red tape • clearer business cases and better processes for building the case • ‘visible’ and ‘tangible’ support. Although top management support is highly
sought after, several respondents emphasise the importance of support being apparent, not merely a background resource available on request
• desire for respect, trust, status, and credibility in the eyes of business clients • greater ‘honesty’ on the part of suppliers. Several respondents allude to a degree
of unreliability characterised as ‘dishonesty’. For some, working with third parties is an adversarial experience
Section Six Discussion The principal reason for conducting research into project management is to improve the performance we achieve on projects. In this section, we identify what we regard as our key findings and discuss their implications. In the following section, we make our recommendations based on these findings.

63
Interpreting the Findings of This Research Study Research can be ambitious and wide-ranging leading to broad indications of areas for improvement or it can be narrow, targeted and intensive leading to specific, assured recommendations. This study has been of the former kind because it has had a strong exploratory element. It has sought to obtain information where existing information has either been outdated, been collected in the US rather than the UK or there has been little or none available. This means that the data we have collected has not always been designed to prove a specific point – we need to interpret the findings in order to make practical recommendations. Interpreting findings requires an assessment of the validity and reliability of the data we have collected. The following points are relevant to this assessment: • We have collected information from 1,500 IT project managers. They represent
a broad cross-section of industries, experience, and backgrounds. So we have avoided the kind of bias that might derive from surveying just members of a single industry or of a professional institution.
• These project managers are self-selected. They are all readers of the Computer Weekly website so there is some bias in that they are all people who keep themselves up to date on industry news and developments.
• The high mean levels of experience both in the IT industry and in project management could be representative of the total population of project managers. But, reality tested against our own experience of the industry, we suspect that our sample is to some extent biased towards a sub-set of the population that is more engaged with the industry and concerned to be up to date than is truly the norm.
• Self-selection of survey respondents carries some risk that responses will be biased to favour the respondents.
• Even if absolute levels of performance are not representative, we can still draw useful conclusions in relation to comparative factors such as project manager experience and project size.
• Not all 1,500 project managers answered all four questionnaires. • In order to keep them simple and quick to complete, the web questionnaires
were designed with minimal validation. We had to exclude some responses that were plainly inappropriate, e.g. managers telling us about their last completed project when it obviously had not yet been completed. Some responses were incomplete. Overall, we received several hundred usable responses from each questionnaire. This is enough to give us considerable confidence in the reliability of the statistics in relation to the sample as a whole.
• Many of the questions we asked used scales (1-5, 1-7 etc). There is a tendency for people to feel uncomfortable using the extremes of a scale, so it is not surprising to find that many responses are roughly distributed around the mid-point.
• The relatively large proportion of projects on which we received data that had low variance against targets has meant that it has been harder than we expected to analyse the data for correlates and causes of success.

64
Performance Performance has turned out to be much better than we anticipated. The rate of abandonments is well below the latest figures from the Standish Group (2003). The level of variance against targets in our survey compares favourably with the Standish figures while the proportion of projects that meet all targets of budget, schedule and specification/scope compares unfavourably. However ours are slightly better than the 13% total success for the UK reported by Andrew Taylor in the BCS Review 2001. As this is the first Computer Weekly web survey, we do not have a baseline for calculating reliable trends for the UK. Nevertheless, our figures appear consistent with recent assessments by Standish and others that project performance is improving. Equally, they show that there is still plenty of room for improvement. These performance figures need to be viewed in perspective. Our statistical clustering has highlighted the typical project with an average 5% schedule overrun, 4% budget overrun, and 6% under specification. This is plainly a very different figure from the 16% that hit all targets with zero tolerance. Our guess is that most project managers and most business executives investing in IT would settle for this level of variance very happily. This very encouraging finding would be even more encouraging if it could be convincingly shown to represent all IT projects. We suspect that our sample is biased to some extent. We believe that the level of experience is unusually high. We speculate that our respondents are unrepresentatively knowledgeable and interested in personal development. We further speculate that they include a disproportionately high number of project managers who have “learnt the hard way” and today are able to produce a higher level of performance than average. It will require further research to determine whether this speculation is correct and if so, how much this has affected our figures. We often receive requests from senior IT executives wishing to brief their business colleagues for latest figures on projects. In the future we will give them the figures we have collected. We shall add that these are best treated not necessarily as the norm but as a strong indication of what can be achieved by good, experienced project managers working in a business environment supportive of IT projects. They are a good benchmark of what is achievable. With the right prerequisites, there is a two in three chance that the project will hit its targets within small tolerances. But there remains a one in three chance of the project missing by a substantial margin. We will also tell them that, as our project managers have forcibly reminded us, the key success measure today is business benefit. The figures we have presented do not give us insight into levels, probabilities and trends in performance against this key objective. Context Our questions about project context have generated several interesting findings on uncertainty, turbulence and change, on project size, and on trends in contextual difficulties faced by projects.

65
It is clear that complexity, uncertainty of requirements and change in the project environment and during its life correlate inversely with performance. In other words, the more complex, the less certainty, the more change, then the more likely performance is to be seriously challenged. It is possible that some respondents whose projects did not perform well tended to blame external difficulties but on balance we are confident that environmental difficulties cause poor project performance. There are lessons in this finding for both project managers and for senior managers responsible for areas of the business that give rise to complexity, uncertainty and turbulence. The simple lesson for both is that there are advantages in managing for simplicity, certainty and stability. For project managers this suggests modularisation is a sensible strategy where possible. Team stability is worth striving for. Stable relationships are worth fostering. For senior managers, the lesson is to manage for stability of key players such as the project manager, principal client, champion, and sponsor. There are further implications in relation to organisation-wide understanding of the challenges of project management. For example, if users/clients do not understand the implications of changing their minds, or asking for highly complex systems, or changing key personnel, then the project manager is likely to be permanently on the back foot. Our data also show that the recent wisdom to the effect that small is beautiful is well founded. Size appears inversely related to project performance. Furthermore, the evidence suggests that it takes a significant reduction in project size compared to the norm for an organisation to make a noticeable difference in performance. Conversely, biting off a larger project than it is normal to chew on makes for serious indigestion. The third finding of interest is the observation by project managers that the trend is for the world to be getting increasingly difficult for projects rather than easier. On every dimension we asked about, technical business, commercial and organisational, there was some element of more change, more uncertainty, greater difficulty emerging. Given our earlier finding about the performance implications of a difficult project context, it is clear that not only do project managers need to improve to improve performance, they have to improve just to maintain existing performance levels. Personal background Our findings in relation to personal background reveal little that stands out or surprises with perhaps one exception. We know of no prior studies of project management that would have led us to predict that female project managers outperform males. There are many possible explanations. Some will conclude that this merely confirms that women have to perform better than men to survive in a “male” environment. Others may conclude that women have some distinctive organisational skills. Others may try to write it off as a freak result. All are possible, but the performance difference appears sufficiently large as to suggest that this is a real phenomenon and is worth investigating, particularly in light of our finding that there are relatively few female project managers.

66
The under-representation of women and the performance effect together should encourage IT departments and their HR colleagues to view women as an under-used pool of potential for project management. More generally, our findings suggest few personal predictors as to who will be the good project managers. Our own best interpretation is that the project managers in our sample are a varied lot because they have survived a process of natural selection – little has been done to assist them, and those who are today successful are those who have learnt and survived. These are primordial organisational skills, not ones which education or training predisposes us to acquire. This is not to say that some people will not make better project managers than others – we are convinced that certain personal attributes do make a difference but that we have not identified them clearly in this study. We still believe that experience is very important, but in this study too many individuals have reached the experience threshold so that it is impossible for us to see its effect. Decision style One absolute stand-out finding which we did not expect is the emphasis of project managers not only on the value and importance of team work and the team as source of information but also on the importance of team decision-making. While we have not been able to explicitly test performance against decision-style, we can only assume that project managers have found it to be an appropriate style for IT projects. One likely reason is that IT projects are knowledge intensive. Not only do team members have exclusive access within the team to specific knowledge, there is too much and/or too varied knowledge required for decisions for the project manager merely to collect the relevant information and decide – the very nature of IT projects requires team decision-making. Building organisational capability in project management One of the clearest but most disappointing findings has been the poverty of organisational thinking about, managing of, and investment in project management capability. While we have no absolute measures by which to assess the answers to our questions (mostly asked against a scale of 1-5 from strongly disagree to strongly agree), no other part of the survey yielded such a consistently strong set of answers across some 15 questions. In particular, very few project managers report that their organisation has a career structure. Few report care in selecting the right individuals to become project managers, neither training nor mentoring is the norm, and support for personal initiatives in self-development is weak. Organisations do not in the main select, support and grow their project managers. Few report that their organisation has a corporate project office or an individual manager with specific responsibility for developing project management. We also found that while some project managers do see their futures as affected by their performance, fewer see their rewards as affected. Further, we found remarkably little sign that organisations act decisively on sub-standard performance. They tend not to coach to improve, redeploy, or dismiss. In consequence, there is limited

67
incentive for performance and little weeding out of the project manager pool with the result that poor performance can be institutionalised. To borrow a phrase from Professors Dan Robey and Kalle Lyytinen – not only have we failed to learn, we have learned to fail. The obvious conclusion is that organisations do not focus much attention on managing their IT project managers and their overall IT project management capability. It is clear that there is a major opportunity for organisations to take this deficiency in hand, grow their own capability, and almost certainly improve performance. Distinctiveness of IT projects The responses to the survey have lead us to conclude that IT projects are distinctive in certain emphases. But, in large measure they are just like any other project. Much of the discipline of task breakdown, teamwork, client management and so forth is common across different kinds of project. But, in certain small ways, IT projects are significantly different from the classic construction and engineering projects on which so much technique and practice is based. The differences noted by our project managers appear to be related to the need for technical knowledge and the fact that it is changing so fast. Project work is knowledge intensive and the project workers are themselves knowledge workers. Decisions require not just knowledge input but discussion that integrates multiple technical perspectives. If our interpretation is correct, then we should certainly expect that project managers would behave differently. They could be expected to adopt a more inclusive leadership style. Planning and estimating could be expected to be less certain because decisions would be more a matter of the interplay of different sets of knowledge. However, this is not an excuse for throwing away all good project management practice. Rather, we should continue to adopt whatever good practices we can from the discipline but with the proviso that we should check whether they make sense in a knowledge intensive environment. We should also recognise that IT projects are not the only ones that are knowledge intensive in this way – much high-tech R&D is similar. There may therefore be other areas of activity in business and government where lessons may be found. General In total, we asked a great many questions, a significant proportion of which asked about issues and areas where help, support or understanding were relevant. This included not only the project management capability issues discussed above, but also areas such as client and sponsor understanding, and project manager understanding of business among others. As a general observation, we found limited tendency to respond positively. Our conclusion is that most project managers work in environments where support is varied and patchy, and that most organisations have plenty of room to improve their contribution to projects.

68
Section Seven Recommendations The following recommendations are for three groups of managers – IT project managers, their managers, and senior business managers/sponsors. The recommendations are not necessarily recommendations for improvement – in some cases they reflect something important that is already being done by many companies. Project managers • Structure projects into smaller sizes • Where a larger task must be achieved, create a programme consisting of smaller
projects • Remember to allocate resources to integrate the constituent projects in a
programme • Invest time and effort in selecting the right team – you need them to have both
the right expertise and the right team player qualities because the world is changing too fast for you to master all the relevant knowledge
• Involve your team in decision-making – you need their ability to apply their knowledge in the decision-making process
• Invest in understanding your client, their motivations, and their performance incentives
• Invest for yourself in developing your project management skills – think about your experience, share learning and knowledge with your peers, consider a buddy system for finding solutions to your problems
Senior IT managers responsible for IT project managers • Establish a focus for project management in your organisation – either an
individual role or a corporate project office and preferably both • Establish and communicate a career path for project managers • Develop a fully professional recruitment and selection process • Identify young project management talent and provide encouragement and
mentoring ahead of transfer to the project manager role • Explore the potential for appointing more female project managers • Train project managers before appointment to their first project and
subsequently develop them • Encourage project manager self-development, e.g. involvement with
professional institutions • Create a network of experienced project managers to help and mentor the less
experienced • Evaluate and manage project manager performance so that project managers
feel accountable – their performance really affects their rewards and future • Be tolerant of poor performance where there are good reasons or where errors
are made for the first time • Coach to prevent future errors • Weed out project managers who repeat errors

69
Where recruiting or searching for project management talent, look first for: o Commercial awareness o Goal/results-orientation o Self-assurance – not over-confidence – and preparedness to take
calculated risks o Integrity o Planning skills o Communication skills o Problem-solving skills o Team player o Attention to detail o Understanding of IT
• Be prepared to vary your search according to the needs of your projects Senior business managers/sponsors • Develop client understanding of the challenges of project management • Develop understanding of project manager motivation and incentives • Actively promote projects for which you have responsibility • Support projects in whatever way you can • Make time for involvement with projects • Ensure that the best client-side managers are assigned to projects rather than
those least valuable to the business • Meet informally with project teams and project managers Section Eight The State of Project Management in 2003 At the start of this report we set out to answer six questions • What is project performance like today? • Is it improving? • Who are today’s project managers and what are they like? • How are they managed by their employers? • What drives project performance today? • What do experienced project managers think is important? To summarise, we came to the following conclusions. First, we found that project performance is better than has been previously thought. It is clear that while the number of projects hitting all their targets remains low, the variance is much lower than is commonly supposed. It is clear that it is no longer

70
appropriate to refer to the pioneering report by the Standish Group in 1995 as if it were representative of today in the UK. Second, our figures compared to earlier reports by other researchers bear out more recent findings by Standish (1999, 2003) that performance is improving on several fronts. Third, we have begun to develop a picture of today’s IT project manager. That picture highlights experience in IT and in project management, strong educational background, with the maturity associated with being over 30 years of age. We see a strong imbalance of males over females. We also see a largely confident person who is not certain of their ability to get their own way and who therefore compromises. As leaders, we see them as highly team-oriented and as adopting a strong first-among-equals style. Fourth, we find relatively little attention paid to developing organisational capability in project management. While there is active management by senior managers of on-going projects both in establishment and development, the ability of senior managers to support their project managers is recognised as limited. The widespread lack of a career structure, lack of systematic identification of project manager potential, lack of support for project manager development and toothless performance management reflect a dismal failure to invest in a key element of economic growth. Fifth, we have not been able to definitively identify the determinants of project performance. However, we have confirmed earlier suspicions that project size is important. Unsurprisingly, we found simplicity, certainty and stability associated with performance. We found some performance advantage for externally conducted projects. Unpredictably, we found females outperforming males. We found several factors that might have been thought to affect performance not doing so. We could see no continuous advantage to experience or education. We could see no advantage to the private sector over the public. Finally, we found project managers concerned principally about familiar issues relating to resources, budgets, schedules, politics, top management support, lack of authority and similar. A number exhibited considerable emotion and frustration in their responses to how to improve performance. They see the project context as becoming more turbulent and more difficult in all respects. While performance is improving, the challenge of projects is becoming greater. Our one qualification to these findings is that we suspect that the project managers who answered our questions are unrepresentatively experienced. This could have an effect on their levels of performance and could bias our results. But, even if this is so, it is important to recognise that our sample represents a benchmark of what can be achieved not just by a single outstanding performer but by a variety of project managers across the industry. Their performance levels may not be entirely normal but they are a beacon for others. This report therefore signals the end of one era and the start of something new. On the traditional measures of time, cost and scope, our survey records a level of performance that belies the established poor public image of IT projects. We are

71
definitely improving. In this respect it is the end of an era. Of course, not everything has been put to rights at once. We have not as yet achieved a superior, industry-wide, project management capability. There will continue to be severe failures, which the media will continue to sensationalise. But the reality is that many project managers are achieving far better performance than ever before. The new era is signalled by the importance project managers now attach to the delivery of business benefits ahead of achievement of narrow, project-centric measures. Future studies will have to focus more on client satisfaction, on the extent to which business objectives have been met. These are not always definitely quantified so it will be harder to measure. In the future, project clients and sponsors must have their say.

72
Acknowledgements This research has been made possible through the support of three organisations – ComputerWeekly.com, the French Thornton Partnership, and Templeton College. At ComputerWeekly, Hooman Bassirian commissioned the work, resourced the web-based questionnaires, provided us with access to ComputerWeekly’s project manager readers, and published our interim reports. Kevin McFarlane constructed the websites for the questionnaires and formatted the data. Julie Senior has overseen production of the final report. The French Thornton Partnership has generously funded a research assistant for this project. In particular, Tim O’Leary and Jean Irvine have facilitated arrangements, provided feedback on the design and progress of the research and have been totally supportive. Keith Backwell was kind enough to comment with great insight on the questionnaire design. Templeton College has financially supported Chris Sauer’s time in leading this research, and has provided the research infrastructure.

73
References Johnson, J. (1995) Chaos: the dollar drain of IT project failures, Application Development Trends, January, 41-47. Slevin, D.P. & Pinto, J.K. (1991) Project leadership: Understanding and consciously choosing your style, Project Management Journal, 22, 1, March, 39-47. Standish Group (1999) Chaos: A recipe for success, http://www.standishgroup.com/sample_research/PDFpages/chaos1998.pdf, (accessed 13 August 2003) Standish Group (2003) Latest Standish Group CHAOS report shows project success rates have improved by 50%, Press release, 25 March, http://www.standishgroup.com/press/article.php?id=2, (accessed 30/07/2003) Taylor, A. (2001) IT projects sink or swim, BCS Review – Computing in the 21st Century, http://www.bcs.org.uk/review/html/p061.htm (accessed 30/07/2003) Turner, J.R. (1993) The Handbook of Project-Based Management, McGraw-Hill, London.
74
Appendix One – Study Design and Method Study Objectives The purpose of this study is to obtain a snapshot of the state of IT project and programme management in the UK at the end of 2002. The underlying reasons for thinking this worth doing are: • The economic and commercial importance of the IT project and programme
management discipline • The limited available data regarding levels of performance and the drivers of
performance • The desirability of establishing a baseline against which future changes in the
discipline can be compared Study Design The study is designed to 1) Describe the existing state of project management 2) Obtain personal viewpoints based on project managers’ experience 3) Explore relationships among the data collected 4) Test hypotheses about the drivers of project performance 5) Compare against the results of prior studies 6) Form a baseline against which future studies can compare No study can be truly comprehensive so the scope is limited to the following: • Project performance • Organisational and managerial context • Project managers’ personal characteristics • Project managers’ views Study Method A survey is the obvious and appropriate method to use in order to collect enough data to constitute a credible sample of the population of UK-based IT project and programme managers. Mail-shot surveys of any length have very poor return rates. Computer Weekly’s website has experienced encouraging response rates to initiatives where it has asked readers to interact with the site. However these interactions have to be relatively short

75
to prevent loss of attention. We therefore designed the survey as a series of four discrete questionnaires, the answers to which could be linked if the same person responded to two or more. Each questionnaire is designed to be short enough to be answered in 10-15 minutes. This encourages completed responses at the expense of limiting the amount of data that can be collected. On the advice of the Computer Weekly Webmaster, data validation is restricted to the absolute minimum. This made the process very easy and painless for respondents but at the expense of completeness and integrity of data. Consequently, there is a higher than usual rate of unusable returns. The questionnaires were mounted on the Computer Weekly website over a period of 14 weeks from October 2002 to January 2003. Each questionnaire remained available for a period of five weeks and was promoted by targeted email to project managers registered with the website. It was also advertised to casual site visitors. After each questionnaire had been available for three weeks, interim data were summarily analysed and a preliminary report made available to participants as soon as that questionnaire was taken off the site. Thus, there was rapid feedback to participants so as to encourage them to respond to the next questionnaire. Statistics given in Appendix 2 below show how successful this strategy proved. Analysis focuses first and foremost on establishing a descriptive baseline of data for the project/programme managers. Secondly, it compares these findings with prior studies elsewhere in the world. Thirdly, it tries to identify drivers of project performance. Fourthly, it looks for other relevant relationships.

76
Appendix Two – Survey Sample The population of UK IT project and programme managers is sampled from visitors to the Computer Weekly website. Everybody registered with the site as a project manager was alerted by email to the availability of the questionnaires and requested to participate. Casual visitors to the site also saw the research advertised on the home page. The sample is therefore both invited and self-selected. 1,744 individuals responded by completing 2,583 questionnaires. Because of the low level of data validation at the collection stage, it is necessary to undertake a rigorous review of the returns received. This includes removing incomplete, duplicate and obviously inappropriate returns. For example, respondents to Questionnaire One were asked about their most recently completed project so we deemed inappropriate any responses that were about a current project. Usable responses were received from 1,456 individuals, giving 2,285 usable cases across the four questionnaires. Number of responses to each questionnaire is shown in Table 15, together with the percentage of the individual respondents to each questionnaire. This shows a distinct drop in enthusiasm for responding between Questionnaires Two and Three. 903 individuals answer just one questionnaire, while 553 answered more than one. 82 individuals provided usable responses for all four questionnaires. Table 16 shows the respondent breakdown by employer’s industry. Strong representation by Banking and Financial Services and the IT industry itself is unsurprising. The response rates by industry remain remarkably stable across all four questionnaires. Table 17 shows the sample breakdown in terms of company size by number of employees. The distribution is bi-modal with 20% in small companies of fewer than 20 employees and 42% in companies with more than 1,500 employees. The balance is roughly evenly distributed among the sizes in between. Table 18 shows the breakdown for the respondent’s organisational level. 35% describe themselves as Project/Team Leader. 16% are at Board level – many small companies may have owners/directors running projects for themselves or for clients. 20% describe themselves as IT Manager – in small to mid-sized organisations this may be a generalist role that includes project management. The demographic breakdown of this sample therefore looks suitably representative.
Questionnaire 1 Questionnaire 2 Questionnaire 3 Questionnaire 4 Responses 959 (55%) 833 (48%) 347 (20%) 444 (26%) Usable responses
804 (55%) 751 (52%) 331 (23%) 399 (27%)
Table 15 | Number of responses to each questionnaire, and percentage of the overall sample of distinct individuals

77
Q1 Q2 Q3 Q4 Total
Industry 804 % 751 % 331 % 399 % 1456 % Automotive 8 1.0 3 0.4 2 0.6 4 1.0 12 0.8 Banking, Finance, Insurance
114 14.2 91 12.1 50 15.1 49 12.3 178 12.2
Business Services
36 4.5 39 5.2 17 5.1 25 6.3 73 5.0
Catering, Hotels, Leisure
5 0.6 6 0.8 5 1.5 5 1.3 13 0.9
Communications 38 4.7 28 3.7 6 1.8 13 3.3 54 3.7 Computer Dealer/Retailer
9 1.1 10 1.3 4 1.2 3 0.7 18 1.2
Computer Distributor/ Wholesaler
4 0.5 3 0.4 2 0.6 2 0.5 6 0.4
Computer Services/FM
36 4.5 31 4.1 16 4.8 21 5.3 84 5.8
Construction, Agriculture, Mining
9 1.1 7 0.9 5 1.5 4 1.0 14 1
Education, Training
28 3.5 27 3.6 16 4.8 19 4.8 58 4
Health, Social, Public Services
18 2.2 16 2.1 7 2.1 8 2.0 30 2.1
IT Consultancy 148 18.4 153 20.4 51 15.4 61 15.3 267 18.3 Local & Central Government
50 6.2 50 6.7 27 8.2 37 9.3 99 6.8
Manufacturing, Engineering
38 4.7 33 4.4 11 3.3 20 5.0 68 4.7
Media 17 2.1 9 1.2 5 1.5 6 1.5 29 2 Retail 26 3.2 28 3.7 19 5.7 17 4.3 53 3.6 Software House, Software Vendor
93 11.6 77 10.3 26 7.9 35 8.8 153 10.5
Systems Integrator/OEM
26 3.2 25 3.3 10 3.0 7 1.8 41 2.8
Transport, Travel 12 1.5 13 1.7 5 1.5 5 1.3 21 1.4 Utilities, Energy, Water
11 1.4 15 2.0 7 2.1 9 2.3 28 1.9
Other 74 9.2 73 9.7 35 10.6 35 8.8 125 8.6 Did not specify 4 0.5 14 1.9 5 1.5 14 3.5 34 2.3
Table 16 | Usable respondents’ employers’ industry
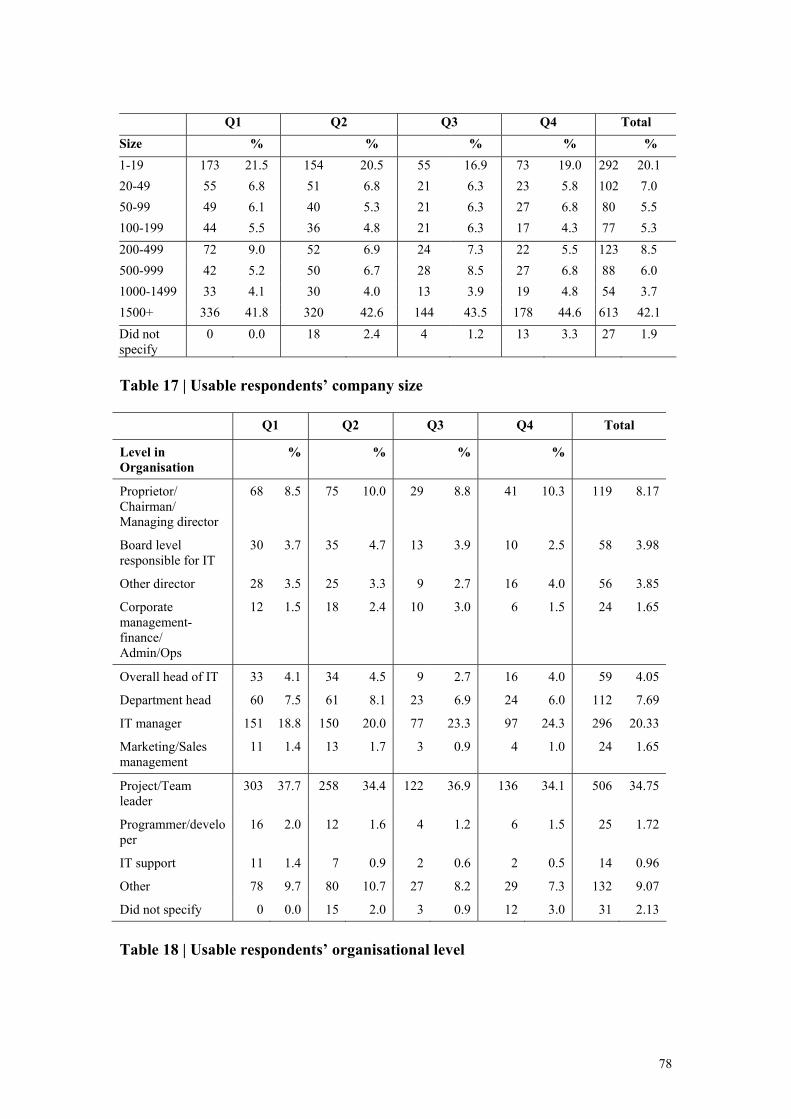
78
Q1 Q2 Q3 Q4 Total Size % % % % % 1-19 173 21.5 154 20.5 55 16.9 73 19.0 292 20.1 20-49 55 6.8 51 6.8 21 6.3 23 5.8 102 7.0 50-99 49 6.1 40 5.3 21 6.3 27 6.8 80 5.5 100-199 44 5.5 36 4.8 21 6.3 17 4.3 77 5.3 200-499 72 9.0 52 6.9 24 7.3 22 5.5 123 8.5 500-999 42 5.2 50 6.7 28 8.5 27 6.8 88 6.0 1000-1499 33 4.1 30 4.0 13 3.9 19 4.8 54 3.7 1500+ 336 41.8 320 42.6 144 43.5 178 44.6 613 42.1 Did not specify
0 0.0 18 2.4 4 1.2 13 3.3 27 1.9
Table 17 | Usable respondents’ company size
Q1 Q2 Q3 Q4 Total
Level in Organisation
% % % %
Proprietor/ Chairman/ Managing director
68 8.5 75 10.0 29 8.8 41 10.3 119 8.17
Board level responsible for IT
30 3.7 35 4.7 13 3.9 10 2.5 58 3.98
Other director 28 3.5 25 3.3 9 2.7 16 4.0 56 3.85
Corporate management-finance/ Admin/Ops
12 1.5 18 2.4 10 3.0 6 1.5 24 1.65
Overall head of IT 33 4.1 34 4.5 9 2.7 16 4.0 59 4.05
Department head 60 7.5 61 8.1 23 6.9 24 6.0 112 7.69
IT manager 151 18.8 150 20.0 77 23.3 97 24.3 296 20.33
Marketing/Sales management
11 1.4 13 1.7 3 0.9 4 1.0 24 1.65
Project/Team leader
303 37.7 258 34.4 122 36.9 136 34.1 506 34.75
Programmer/developer
16 2.0 12 1.6 4 1.2 6 1.5 25 1.72
IT support 11 1.4 7 0.9 2 0.6 2 0.5 14 0.96
Other 78 9.7 80 10.7 27 8.2 29 7.3 132 9.07
Did not specify 0 0.0 15 2.0 3 0.9 12 3.0 31 2.13
Table 18 | Usable respondents’ organisational level

79
Research limitations All studies are limited in the ground they can cover and the results they can achieve. This study is limited by the data collection device, which was a web survey. We did not collect data about performance in terms of contribution to business/commercial/strategic goals because of the difficulty of setting appropriate measures, and the difficulty of collecting credible data – while project managers can be expected to know about performance against budget and schedule, they may be less well informed and less objective about the delivery of business goals. The self-selection of respondents and their identity as readers of Computer Weekly constitute sources of bias in the sample. While larger than the sample in previous studies, we cannot be fully confident that it is representative. Resource limitations for the analysis of the data have meant that by no means all the possibly relevant relationships among the data have been explored. The importance of providing respondents with rapid feedback has also limited the scope of the analysis.

80
Appendix Three – Deconstructing Standish Group Findings Since Jim Johnson published his company’s first research results in Application Development Trends in January 1995, the Standish Group’s Chaos studies have been the most widely available large sample reporting of IT project performance. Full and up to date research findings from the Standish Group are available only at a prohibitively expensive price for a researcher. What is in the public domain in articles and on the company’s website consists of summary, abstracted findings. It is therefore necessary to deconstruct their reports to obtain data usable in our comparisons. In this Appendix, we explain the transformations we have made to their 1995 reported findings. Definition Standish’s definition of a challenged project is a project that meets at least one of the following criteria: overruns its budget or overruns its schedule or underdelivers on scope/functionality (i.e. does less than originally planned). A successful project meets all its targets – budget, schedule and scope. Transform Standish Group findings: 31.1% projects abandoned 52.7% projects challenged 16.2% projects successfully completed _____ 100% total projects Standish reports variance for abandoned + challenged projects, i.e.83.8% of the total. To calculate variance as an average for all projects (i.e. including those successfully completed), we therefore multiply each variance figure by 83.8% Cost Variance Average cost overruns for challenged and cancelled projects = +89% 89% x 83.8% sample = +75% average cost overrun for 100% sample Schedule Variance Average schedule overruns for challenged projects = +122% 122% x 83.8% sample = +102% average schedule overrun for 100% sample Scope/Functionality Variance Average scope/functionality achieve = -39% -39% x 83.8% sample = -33% average scope underachievement for 100% sample

81
About the Authors Chris Sauer has 25 years experience in the IT industry as a computing professional, consultant and academic. He is currently Fellow in Information Management at Templeton College, Oxford University, and Director of the Oxford Advanced Management Programme. Previously, he was Deputy Director of the Fujitsu Centre for Managing Information Technology in Organisations at the Australian Graduate School of Management in Sydney. His core research interests include the management of IT-based organisational transformation, project management including project risk management, and the management of IT infrastructure. He has written many books, chapters and journal articles. His recent books include Why Information Systems Fail: A Case Study Approach, Building the E-Business Infrastructure: Management Strategies for Corporate Transformation, co-authored with Leslie Willcocks, and Moving to E-Business, co-edited with Leslie Willcocks, published by Random House in November 2000. He has conducted consulting and training assignments for a wide range of private and public sector organisations. He is Joint Editor-in-Chief of the Journal of Information Technology. Christine Cuthbertson is a Senior Research Associate at Templeton College, University of Oxford. She has previously held lecturing posts at the universities of Cranfield, Bournemouth and East London, and has been a visiting lecturer at the University of Southampton. Christine’s main research interests are professional and personal development issues in IT, knowledge management, and information systems in the retail sector. Publications include “Retail Strategy: The view from the bridge”, co-edited with Jonathan Reynolds, “A Management Approach to Database Applications” with David Avison, and a chapter in “Knowledge Management in the SocioTechnical World” edited by Elayne Coakes. Christine is editor of the European Retail Digest.

82
Footnotes 1 A glitch in our data collection invalidated the results of this question in relation to the training and maintenance activities. 2 We asked respondents separately whether the project took place in the public or private sector because in areas like health and education, the industry does not determine the sector. Unfortunately some 40% respondents do not specify the sector but as 17.7% say they were in the public sector, this is an absolute minimum figure. It is possible that some who do not specify are spanning both sectors, for example in Public/Private Partnerships or Private Finance Initiatives. 3 Unfortunately, data about the logical complexity of the projects were corrupted in collection.