Survey Overview: Entrepreneurial Development Targeting Rural
19
Transcript of Survey Overview: Entrepreneurial Development Targeting Rural


Overview of Findings Entrepreneurial Development
Targeting Rural Hispanic Immigrants
National Institute of Food and Agriculture National Research Institute
Grant #2008-02639
May 2011
University of Arkansas University of Arkansas Cooperative Extension Service
Research Team Outreach and Education Team
Dr. Frank L. Farmer Dr. Wayne P. Miller Dr. Zola K. Moon Stacey McCullough Dr. Cristina Abreo Dr. Cristina Abreo
Editor
Judith Killen, Ph.D. Proposal Development and
Business Communication Services

Contents
1. Introduction and Background . . . . . . . . . . . . . . . . . . . . . . . . . . . . . . . . . . . . . . . . . . . . . . . . . . . .1
• About the Survey. . . . . . . . . . . . . . . . . . . . . . . . . . . . . . . . . . . . . . . . . . . . . . . . . . . . . . . . . . . . .1
• Survey Area . . . . . . . . . . . . . . . . . . . . . . . . . . . . . . . . . . . . . . . . . . . . . . . . . . . . . . . . . . . . . . . . .2
• Survey Results . . . . . . . . . . . . . . . . . . . . . . . . . . . . . . . . . . . . . . . . . . . . . . . . . . . . . . . . . . . . . . .2
2. Demographic Characteristics of Latino Entrepreneurs . . . . . . . . . . . . . . . . . . . . . . . . . . . . . . .4
• Age . . . . . . . . . . . . . . . . . . . . . . . . . . . . . . . . . . . . . . . . . . . . . . . . . . . . . . . . . . . . . . . . . . . . . . . . .4
• Gender and Ownership . . . . . . . . . . . . . . . . . . . . . . . . . . . . . . . . . . . . . . . . . . . . . . . . . . . . . . .5
• Education and Business Training . . . . . . . . . . . . . . . . . . . . . . . . . . . . . . . . . . . . . . . . . . . . . . .5
• Country of Origin and Migration Pattern . . . . . . . . . . . . . . . . . . . . . . . . . . . . . . . . . . . . . . . .6
• Reason for Moving to Arkansas and Reception . . . . . . . . . . . . . . . . . . . . . . . . . . . . . . . . . . .6
• Participation in Local Community Organizations and Activities . . . . . . . . . . . . . . . . . . . .7
3. Characteristics of Latino Immigrant-Owned Businesses . . . . . . . . . . . . . . . . . . . . . . . . . . . . .8
• Ownership Type and Years in Business . . . . . . . . . . . . . . . . . . . . . . . . . . . . . . . . . . . . . . . . . .8
• Industry Type . . . . . . . . . . . . . . . . . . . . . . . . . . . . . . . . . . . . . . . . . . . . . . . . . . . . . . . . . . . . . . . .8
• Sources of Start-Up Capital . . . . . . . . . . . . . . . . . . . . . . . . . . . . . . . . . . . . . . . . . . . . . . . . . . .10
• Customer Demographics . . . . . . . . . . . . . . . . . . . . . . . . . . . . . . . . . . . . . . . . . . . . . . . . . . . . .10
4. Perceived Barriers and Challenges to Business Start-Up . . . . . . . . . . . . . . . . . . . . . . . . . . . .11
• Start-Up Capital . . . . . . . . . . . . . . . . . . . . . . . . . . . . . . . . . . . . . . . . . . . . . . . . . . . . . . . . . . . . .11
• Understanding Laws, Taxes and Regulatory Systems . . . . . . . . . . . . . . . . . . . . . . . . . . . .12
• Finding and Renting Business Locations . . . . . . . . . . . . . . . . . . . . . . . . . . . . . . . . . . . . . . .12
• Advertising . . . . . . . . . . . . . . . . . . . . . . . . . . . . . . . . . . . . . . . . . . . . . . . . . . . . . . . . . . . . . . . . .13
Appendix . . . . . . . . . . . . . . . . . . . . . . . . . . . . . . . . . . . . . . . . . . . . . . . . . . . . . . . . . . . . . . . . . . . . . . . . .15
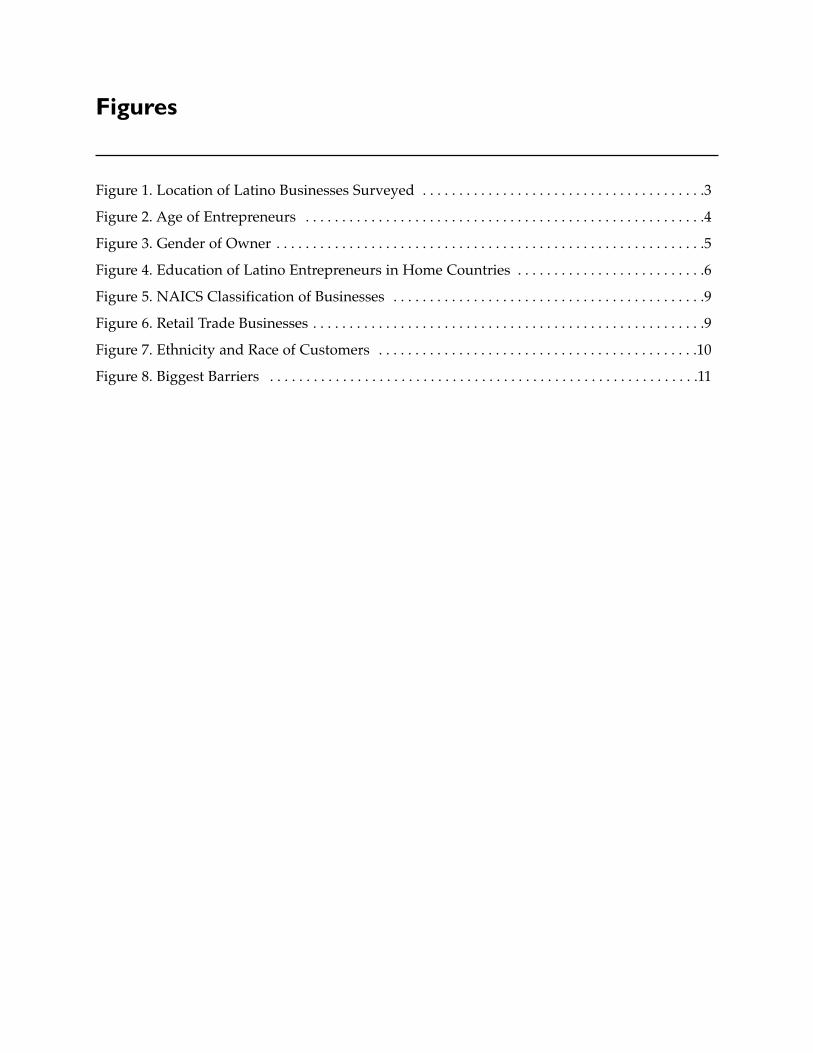
Figures
Figure 1. Location of Latino Businesses Surveyed . . . . . . . . . . . . . . . . . . . . . . . . . . . . . . . . . . . . . . .3
Figure 2. Age of Entrepreneurs . . . . . . . . . . . . . . . . . . . . . . . . . . . . . . . . . . . . . . . . . . . . . . . . . . . . . . .4
Figure 3. Gender of Owner . . . . . . . . . . . . . . . . . . . . . . . . . . . . . . . . . . . . . . . . . . . . . . . . . . . . . . . . . . .5
Figure 4. Education of Latino Entrepreneurs in Home Countries . . . . . . . . . . . . . . . . . . . . . . . . . .6
Figure 5. NAICS Classification of Businesses . . . . . . . . . . . . . . . . . . . . . . . . . . . . . . . . . . . . . . . . . . .9
Figure 6. Retail Trade Businesses . . . . . . . . . . . . . . . . . . . . . . . . . . . . . . . . . . . . . . . . . . . . . . . . . . . . . .9
Figure 7. Ethnicity and Race of Customers . . . . . . . . . . . . . . . . . . . . . . . . . . . . . . . . . . . . . . . . . . . .10
Figure 8. Biggest Barriers . . . . . . . . . . . . . . . . . . . . . . . . . . . . . . . . . . . . . . . . . . . . . . . . . . . . . . . . . . .11

I. Introduction and Background
The Entrepreneurial Development Targeting Rural Hispanic Immigrants Project was funded in 2008 through a three-year grant from the USDA National Research Initiative.
It is a col laborative research and extension project of the School of Human Environmental Sciences at the University of Arkansas in Fayetteville and the University of Arkansas Cooperative Extension Service in Little Rock. The project has two purposes:
• Examine entrepreneurial readiness and constraints among Latino immigrants in rural and urban areas in Arkansas
• Develop educational outreach programs to support entrepreneurial activity among Latino entrepreneurs
This report summarizes findings of a needs assessment conducted in 2009 that delineates characteristics of Latino immigrant entrepreneurs and their businesses along with their perceived barriers to business start-up.
Survey results are being used to develop region-specific training programs for Latino entrepreneurs.
About the Survey Survey questionnaires were given to 171 participants in face-to-face interviews in the language of their choice (Spanish or English) from April – December, 2009. Participants represented 220 Latino immigrant-owned businesses in 59 communities in 26 counties in both rural and urban Arkansas.
Communities surveyed were selected based on the size of their Latino populations and presence of newly arrived immigrants.
Latino entrepreneurs were identified and located with help from county Cooperative Extension Services and Chamber of Commerce personnel—with additional information obtained from the Statewide Food License List (May 2009) provided by the Arkansas Department of Health. This list contains all businesses in Arkansas licensed to sell food as of May 2009. It was used to identify businesses with Spanish language names and those that clearly target Latin American customers.
The questionnaire used 92 questions to gather demographic data and elicit information on such business characteristics as:
• Sources of start-up capital
• Customer base
• Previous business experience
• Licensing and other regulations
• Community linkages
1

____________________
The questionnaire also requested that participants indicate the biggest problems faced when trying to start their businesses in Arkansas and what information would have helped them.
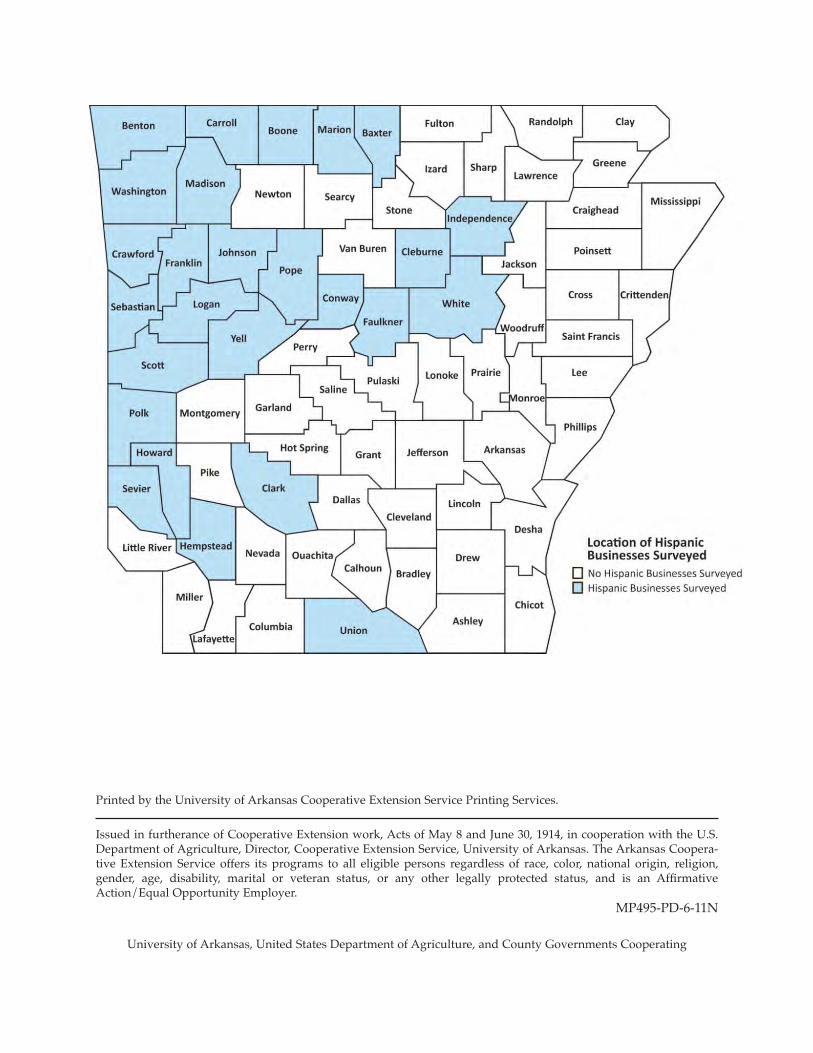
Survey Area Fifty-nine communities in 26 Arkansas counties make up the survey area. All communities included in the survey are classified as rural except for five—Fayetteville, Fort Smith, Rogers, Springdale and Van Buren—which are classified as urban.1 Communities surveyed and their counties are listed in the Appendix. The map in Figure 1 shows the region surveyed.
Survey Results According to our survey, male and female Latino entrepreneurs in Arkansas are generally between 40 and 65 years of age and from urban communities in their home countries. They have at least nine years of schooling—equivalent to a high-school diploma in the U.S.
Most lived elsewhere in the U.S. before moving to Arkansas. Most have had little formal business training before opening their businesses, although 30% had previous employment experience in a similar business. And most—an overwhelming 94% of all respondents—feel “at home” in the state. This is especially so among rural entrepreneurs.
The survey obtained extensive demographic and business data on Latino immigrant entrepreneurs in Arkansas, and the following pages outline:
• Demographic characteristics of Latino entrepreneurs in Arkansas • Business characteristics of Latino immigrant-owned businesses in Arkansas • Perceived barriers and challenges faced during business start-up
1Communities have been classified as rural or urban using the Rural-Urban Commuting Area (RUCA) codes established by the Economic Research Service of the USDA. See http://www.ers.usda.gov/data/ruralurbanarea commutingcodes/.
2

Figure 1. Location of Latino Businessess Surveyed
3

____________________
2. Demographic Characteristics of Latino Entrepreneurs
Survey results for the following key demographics are presented below2:
• Age
• Gender and ownership
• Education and business training
• Country of origin and migration pattern
• Reasons for moving to Arkansas and reception
• Participation in local community organizations and activities
Age • 61% of Latino entrepreneurs surveyed are between 40 and 65 years of age.
• 29% are between 30 and 40 years of age.
• 8% of business owners are less than 30 years of age.
Figure 2. Age of Entrepreneurs
2Percentages have been rounded to the nearest decimal.
4

Gender and Ownership • Males own 33% of businesses surveyed.
• Females own 27% of businesses surveyed.
• 23% are owned by married couples.
Figure 3. Gender of Owner
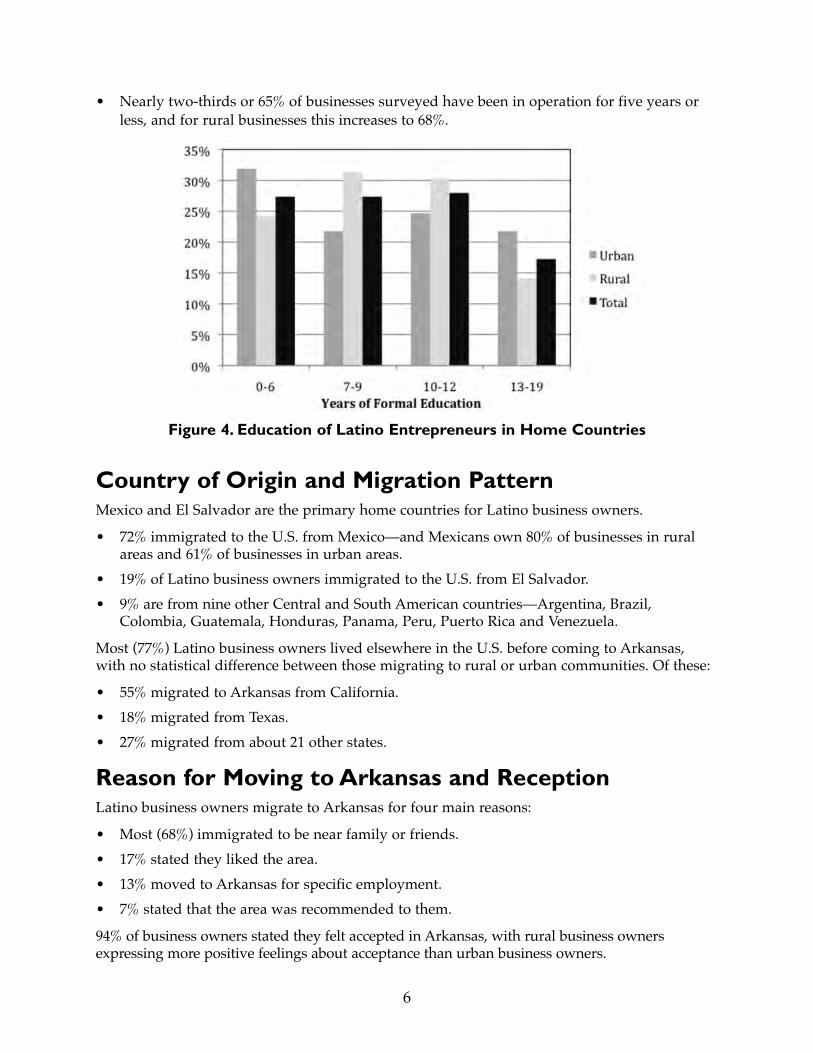
Education and Business Training • 27% of business owners surveyed have completed six or fewer years of primary school in
their countries of origin. (14% actually completed grade 6 as their highest level of formal education.)
• 27% have completed from seven to nine years of education in their home countries. Secondary school is from the 7th to the 9th grade when formal schooling ends and students are awarded completion diplomas. (21% actually completed grade 9 as their highest level of formal education.)
• 28% have at least some preparatory schooling (10th through 12th grades)—the equivalent of specialized college or vocational technical training. (17% actually completed grade 12 as their highest level of formal education.)
• 17% have at least some university education in their home countries.
• 41% of Latino immigrant entrepreneurs report learning their businesses from family members. Only 12% reported receiving any formal entrepreneurial training prior to opening their businesses in Arkansas.
• Only 29% report entrepreneurial experience in their countries of origin before immigrating to the U.S., or in another part of the U.S. before opening businesses in Arkansas.
5
• Nearly two-thirds or 65% of businesses surveyed have been in operation for five years or less, and for rural businesses this increases to 68%.
Figure 4. Education of Latino Entrepreneurs in Home Countries
Country of Origin and Migration Pattern Mexico and El Salvador are the primary home countries for Latino business owners.
• 72% immigrated to the U.S. from Mexico—and Mexicans own 80% of businesses in rural areas and 61% of businesses in urban areas.
• 19% of Latino business owners immigrated to the U.S. from El Salvador.
• 9% are from nine other Central and South American countries—Argentina, Brazil, Colombia, Guatemala, Honduras, Panama, Peru, Puerto Rica and Venezuela.
Most (77%) Latino business owners lived elsewhere in the U.S. before coming to Arkansas, with no statistical difference between those migrating to rural or urban communities. Of these:
• 55% migrated to Arkansas from California.
• 18% migrated from Texas.
• 27% migrated from about 21 other states.
Reason for Moving to Arkansas and Reception Latino business owners migrate to Arkansas for four main reasons:
• Most (68%) immigrated to be near family or friends.
• 17% stated they liked the area.
• 13% moved to Arkansas for specific employment.
• 7% stated that the area was recommended to them.
94% of business owners stated they felt accepted in Arkansas, with rural business owners expressing more positive feelings about acceptance than urban business owners.
6

Participation in Local Community Organizations and Activities • 21% of Latino business owners reported belonging to Chambers of Commerce or other
business associations in their communities.
• 19% reported belonging to community churches.
• 58% reported not participating in or supporting community sports teams, tournaments, parades and other community events.
When asked reasons for lack of participa tion in business organizations, Latino entrepreneurs surveyed who responded stated they had not been asked to participate or did not understand the advantages or purpose in join ing business organizations.
7

3. Characteristics of Latino Immigrant-Owned Businesses
This section summarizes results for the following key business characteristics:
• Ownership type and years in business
• Industry type (NAICS category)
• Source of start-up capital and location of lending institution
• Customer demographics
Ownership Types and Years in Business • 78% of businesses surveyed are sole proprietorships.
• 9% are partnerships, 10% are corporations and 2% are franchises.
• There are no major differences in type of ownership between rural and urban areas.
• 12% have been in business less than one year.
• 53% have been in business from one to five years. This rises to 60% for rural businesses.
• 35% of businesses surveyed have been in operation five years or longer.
Industry Type Latino immigrant-owned businesses were classified using the official U.S. government North American Industry Classification System (NAICS) based on survey participants’ descriptions of types of businesses they owned and products or services offered to the public.
• 70% of businesses surveyed fall into two NAICS categories of Retail Trade (RT) and Accommodation and Food Services (AFS); 41% are RT and 29% are AFS.
• 63% of the Retail Trade businesses fall into the Food and Beverage subcategory. Of these, most are grocery stores.
• Over half (55%) of the businesses surveyed are food related; 33% of those in urban and 70% in rural areas.
• Latino-owned businesses in Arkansas also include many non-food related stores in retail trade, construction, information and educational services (see Figure 5 on page 9).
8

Figure 5. NAICS Classification of Businesses
Figure 6. Retail Trade Businesses
9
Sources of Start-Up Capital Most business owners surveyed reported using multiple sources of start-up capital.
• 73% relied on personal savings to start their businesses—with 79% of urban businesses established using private savings and about 68% of rural businesses using private savings.
• 22% also obtained bank loans for start-up capital. Of these bank loans, 83% were administered through lending institutions located in the same town as the Latino-owned business and 20% were almost equally divided between out of town (10%) and out of state (8%) banks. 25% of rural area businesses used bank loans for start-up capital as compared to 19% of urban area businesses.
• 14% of business owners received family loans to acquire start-up capital, with 17% of rural area businesses and about 10% of urban area businesses using family loans.
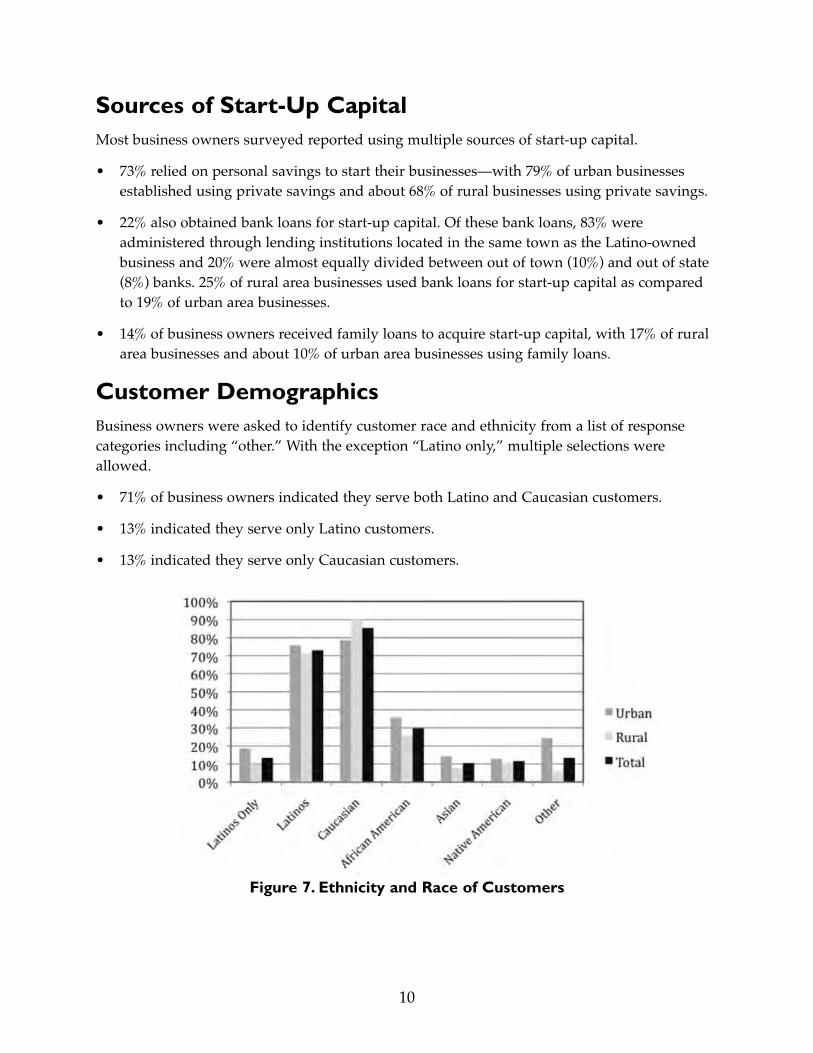
Customer Demographics Business owners were asked to identify customer race and ethnicity from a list of response categories including “other.” With the exception “Latino only,” multiple selections were allowed.
• 71% of business owners indicated they serve both Latino and Caucasian customers.
• 13% indicated they serve only Latino customers.
• 13% indicated they serve only Caucasian customers.
Figure 7. Ethnicity and Race of Customers
10

4. Perceived Barriers and Challenges to Business Start-Up
Latino immigrant entrepreneurs face the same barriers and challenges all entrepreneurs face when establishing and operating businesses. As shown in Figure 8, these challenges fall into several interconnected categories:
• Start-up capital
• Understanding laws, taxes and regulatory systems
• Finding and renting business locations
• Advertising
These are discussed below.
Figure 8. Biggest Barriers
Start-Up Capital • 42% of Latino entrepreneurs surveyed cited lack of start-up capital as the biggest problem
they face when starting their businesses—with another 16% indicating lack of start-up capital as the second biggest difficulty. Lack of start-up capital is a barrier throughout the study area but is more acute in rural areas. Rural business owners state that they have problems understanding lending institutions and the loan process.
• Applying for and receiving loans also seems difficult for Latinos throughout Arkansas. Participants explained they felt ignored, discouraged or rejected at local banks when attempting to speak to loan officers about obtaining business loans.
11
Latino business owners in both rural and urban areas indicated that information or training in the following areas would have helped them obtain more start-up capital:
• How to write a business plan – 49%
• Assistance with understanding licensing or business regulations – 50%
• How to apply for a loan – 33%
Understanding Laws,Taxes and Regulatory Systems • 15% of business owners said that understanding laws, regulations or taxes had been their
biggest problem in starting businesses in Arkansas, and another 16% stated this had been their second biggest problem.
• Understanding laws, regulations and taxes is a greater barrier in rural areas. 20% of respondents cited this as their greatest obstacle compared to only 7% in urban areas.
In general, information about federal, state, county and local regulations, laws and licensing requirements is difficult to obtain in Arkansas. Latino business owners indicated they encountered the following obstacles when trying to understand regulations, taxes and the licensing process:
• Lack of information about local, county, state and/or federal licensing requirements
• Lack of information about licensing requirements per business/occupation
• Lack of organized (step-by-step) information about the licensing process
• Difficulty obtaining regulatory information from government agents
• Difficulty locating and contacting appropriate regulatory agency staff members and obtaining application forms
Business owners indicated that information or training in the following areas would have helped them understand regulations and taxes and obtain necessary licenses:
• Licensing or business regulations – 50%
• Language classes or language assistance – 23%
• Labor law regulations – 18%
• Tax information – 21%
They also cited a need for checklists (“one piece of paper”) that listed all licenses required for a particular business category, and contact information, regulatory requirements, license costs and application processes for each regulatory agency.
Finding and Renting Business Locations • 12% of business owners cited finding and renting business locations as their biggest
problem when starting businesses in Arkansas, with an additional 14% stating this was their second biggest problem.
12

• Finding locations is slightly more difficult in urban than in rural areas—with 17% of urban area business owners stating they encountered this difficulty as compared to only 11% of rural business owners. In rural communities where Latinos do have problems finding business locations, it results from a lack of space for start-up businesses.
Latino business owners stated that they encounter the following specific difficulties when trying to find and rent a business location in Arkansas:
• Lack of commercial properties
• High cost of commercial properties
• Problems with understanding lease agreements
• Problems with negotiating lease agreements
In the urban areas of northwest Arkansas, finding locations is cited as a major concern for individuals trying to start businesses—with specific problems involving understanding and negotiating lease agreements and understanding rental rates and tenants’ rights.
Advertising • 14% of business owners stated that advertising was their biggest problem when starting
businesses in Arkansas, with 13% stating this was their second biggest problem.
• Advertising was a greater problem for urban business owners—with 16% of urban business owners citing advertising as a top barrier as compared to about 9% of rural business owners. Urban business owners rely more heavily on mass media to market products and services while rural entrepreneurs can use word-of-mouth advertising and prominent, or centrally located, establishments to promote their businesses.
Both rural and urban business owners state they encounter two main advertising challenges that prevent them from promoting their businesses:
• Lack of outlet
• Lack of design and development knowledge
In northwest Arkansas, Latino business owners state they feel “relegated” (relegado) to advertising only in Spanish language media sources. These venues are insufficient for two main reasons:
• High competition
• Limited customer base
Business owners also stated they felt English language media sources did not seem interested in doing business with them, and when they were solicited to advertise they received no help in creating, formatting and translating their advertisement.
13
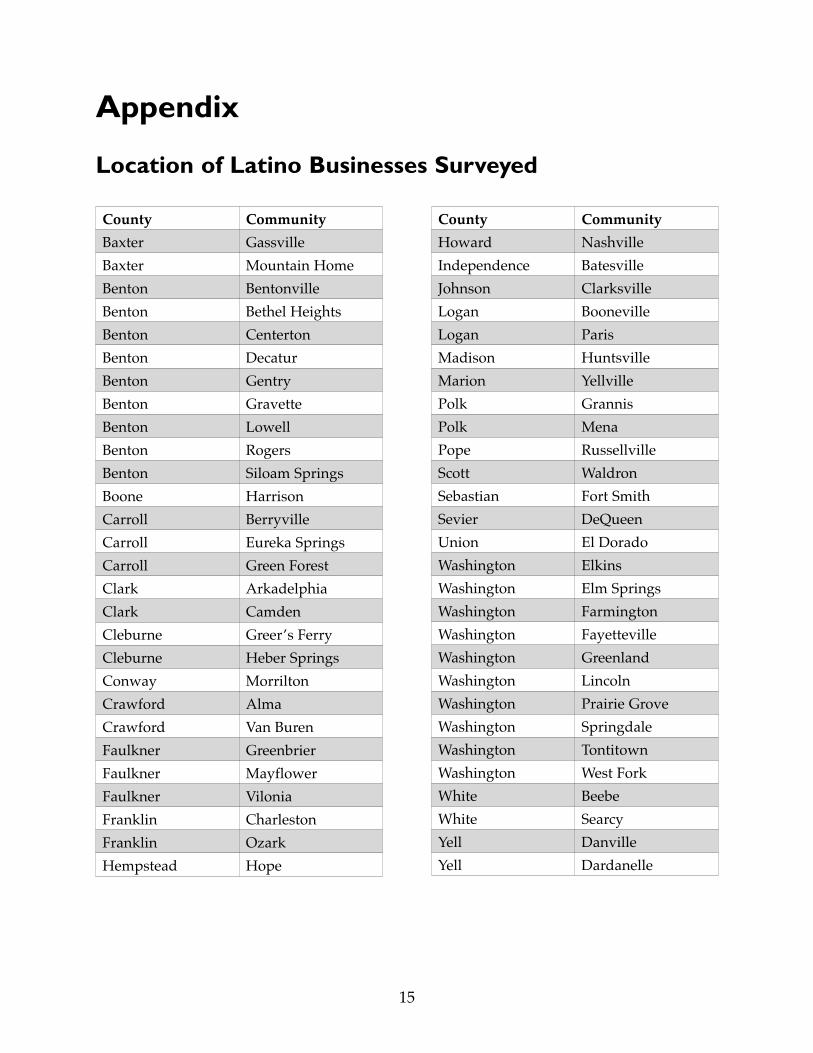
Appendix
Location of Latino Businesses Surveyed
County Community
Baxter Gassville
Baxter Mountain Home
Benton Bentonville
Benton Bethel Heights
Benton Centerton
Benton Decatur
Benton Gentry
Benton Gravette
Benton Lowell
Benton Rogers
Benton Siloam Springs
Boone Harrison
Carroll Berryville
Carroll Eureka Springs
Carroll Green Forest
Clark Arkadelphia
Clark Camden
Cleburne Greer’s Ferry
Cleburne Heber Springs
Conway Morrilton
Crawford Alma
Crawford Van Buren
Faulkner Greenbrier
Faulkner Mayflower
Faulkner Vilonia
Franklin Charleston
Franklin Ozark
Hempstead Hope
County Community
Howard Nashville
Independence Batesville
Johnson Clarksville
Logan Booneville
Logan Paris
Madison Huntsville
Marion Yellville
Polk Grannis
Polk Mena
Pope Russellville
Scott Waldron
Sebastian Fort Smith
Sevier DeQueen
Union El Dorado
Washington Elkins
Washington Elm Springs
Washington Farmington
Washington Fayetteville
Washington Greenland
Washington Lincoln
Washington Prairie Grove
Washington Springdale
Washington Tontitown
Washington West Fork
White Beebe
White Searcy
Yell Danville
Yell Dardanelle
15
Printed by the University of Arkansas Cooperative Extension Service Printing Services.
Issued in furtherance of Cooperative Extension work, Acts of May 8 and June 30, 1914, in cooperation with the U.S. Department of Agriculture, Director, Cooperative Extension Service, University of Arkansas. The Arkansas Cooperative Extension Service offers its programs to all eligible persons regardless of race, color, national origin, religion, gender, age, disability, marital or veteran status, or any other legally protected status, and is an Affirmative Action/Equal Opportunity Employer.
MP495-PD-6-11N
University of Arkansas, United States Department of Agriculture, and County Governments Cooperating