Survey on the Sale of Non-exchange Traded Investment Products Survey... · sale of non-exchange...
15
1 Survey on the Sale of Non-exchange Traded Investment Products For the year ended 31 March 2016
Transcript of Survey on the Sale of Non-exchange Traded Investment Products Survey... · sale of non-exchange...
1
Survey on the Sale of Non-exchange Traded Investment Products
For the year ended 31 March 2016
2
Background
Introduction
1. The Securities and Futures Commission (SFC) conducted a fact-finding survey on the sale of non-exchange traded investment products (“investment products”) to individual investors by corporations licensed by the SFC. The survey covered the sale of investment products from 1 April 2015 to 31 March 2016 (“the reporting period”). Similar surveys were conducted in 2014 and 2012.
Objectives
2. The survey was designed to collect information relating to the types and value of investment products sold by SFC-licensed corporations. Whilst the information gathered may assist the SFC in supervising licensed corporations, it is also useful to market participants.
Scope
3. The survey focused on the sale and distribution of investment products to individual investors (including investment vehicles of such individuals), who had opened accounts with licensed corporations or their overseas affiliates and to whom investment products had been sold or distributed by licensed representatives in Hong Kong. Sales to corporate professionals such as banks or under omnibus/nominee arrangements were not included in the survey.
4. The investment products covered in the survey included structured investment products, government and corporate bonds, swaps and repos, collective investment schemes and hedge funds. Among those excluded from the survey were leveraged foreign exchange products, insurance products, mandatory provident funds, pooled retirement funds, paper gold schemes, listed securities, exchange-traded funds and exchange-traded derivatives.
Questionnaire and responses
5. The survey was sent to 1,611 corporations licensed to deal in or advise on securities or futures. We received 1,602 replies, representing a response rate of 99%. A total of 244 licensed corporations reported that they had sold investment products to individual investors during the reporting period.
3
Key findings
The market remains attractive to a wide variety of players 6. The number of firms which reported to have engaged in the sale of investment products
increased by 15% from 213 in the last survey to 244 in this survey. These firms comprised investment advisors, asset management firms, securities brokers and international financial conglomerates.
7. The aggregate transaction amount1 dropped by 19% from $468 billion in the last survey to $380 billion in this survey. The decrease was primarily attributable to the drop in the transaction amount of interest rate swaps by around $83 billion as a result of reduced demand from clients.
A wide range of investment products were offered with structured investment products continuing to be most popular 8. A wide range of investment products were offered to clients in the reporting period.
Structured investment products continued to be the most favoured product type which accounted for 44% of the aggregate transaction amount, followed by fixed income products (29%), collective investment schemes (14%) and hedge funds (2%) and swaps and repos (8%).
9. The majority (92%) of structured investment products were sold by the top 10 firms2. An international financial conglomerate contributed about half of the total transaction amount of structured investment products.
Top 10 firms continued to dominate the market 10. The top 10 firms continued to dominate the market, representing 69% of the aggregate
transaction amount. The top 10 firms comprised a good mix of international financial conglomerates, brokerage groups, investment advisory firms and asset management firms.
11. Three of the top 10 firms were international financial conglomerates which accounted for 46% of the aggregate transaction amount. These three firms or their related companies were also major issuers of structured investment products.
1 Transaction amount refers to the amount paid or payable by investors for investment products. For leveraged products, the transaction amount means the maximum exposure of the contracts. Licensed corporations were requested to report only one-sided transactions. For example, only the buy order of individual investors should be included as the transaction amount in switching transactions. 2 Throughout this report, “the top 10 firms” refers to the ten licensed corporations with the highest transaction amount of investment products reported in this survey.
4
Analysis of aggregate transaction amount
Overview
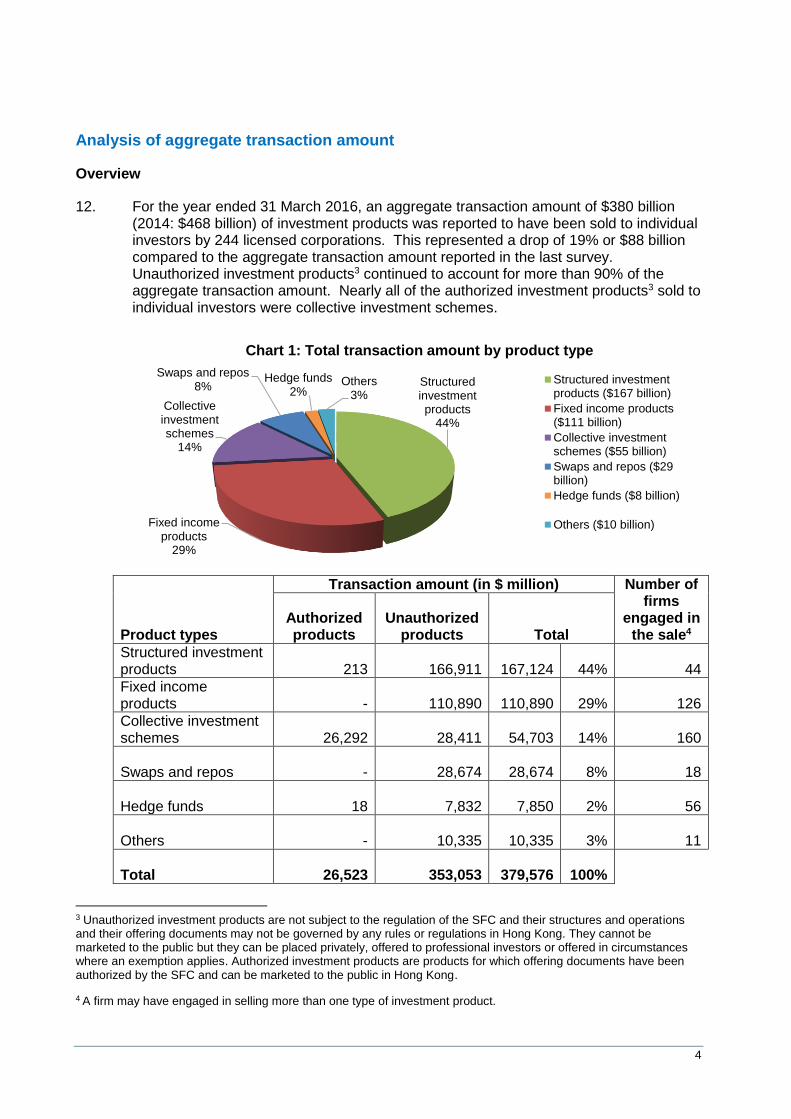
12. For the year ended 31 March 2016, an aggregate transaction amount of $380 billion (2014: $468 billion) of investment products was reported to have been sold to individual investors by 244 licensed corporations. This represented a drop of 19% or $88 billion compared to the aggregate transaction amount reported in the last survey. Unauthorized investment products3 continued to account for more than 90% of the aggregate transaction amount. Nearly all of the authorized investment products3 sold to individual investors were collective investment schemes.
Product types
Transaction amount (in $ million) Number of firms
engaged in the sale4
Authorized products
Unauthorized products Total
Structured investment products 213 166,911 167,124 44% 44
Fixed income products - 110,890 110,890 29% 126
Collective investment schemes 26,292 28,411 54,703 14% 160
Swaps and repos - 28,674 28,674 8% 18
Hedge funds 18 7,832 7,850 2% 56
Others - 10,335 10,335 3% 11
Total 26,523 353,053 379,576 100%
3 Unauthorized investment products are not subject to the regulation of the SFC and their structures and operations and their offering documents may not be governed by any rules or regulations in Hong Kong. They cannot be marketed to the public but they can be placed privately, offered to professional investors or offered in circumstances where an exemption applies. Authorized investment products are products for which offering documents have been authorized by the SFC and can be marketed to the public in Hong Kong. 4 A firm may have engaged in selling more than one type of investment product.
Structured investment products
44%
Fixed income products
29%
Collective investment schemes
14%
Swaps and repos8%
Hedge funds2%
Others3%
Chart 1: Total transaction amount by product type
Structured investmentproducts ($167 billion)
Fixed income products($111 billion)
Collective investmentschemes ($55 billion)
Swaps and repos ($29billion)
Hedge funds ($8 billion)
Others ($10 billion)
5
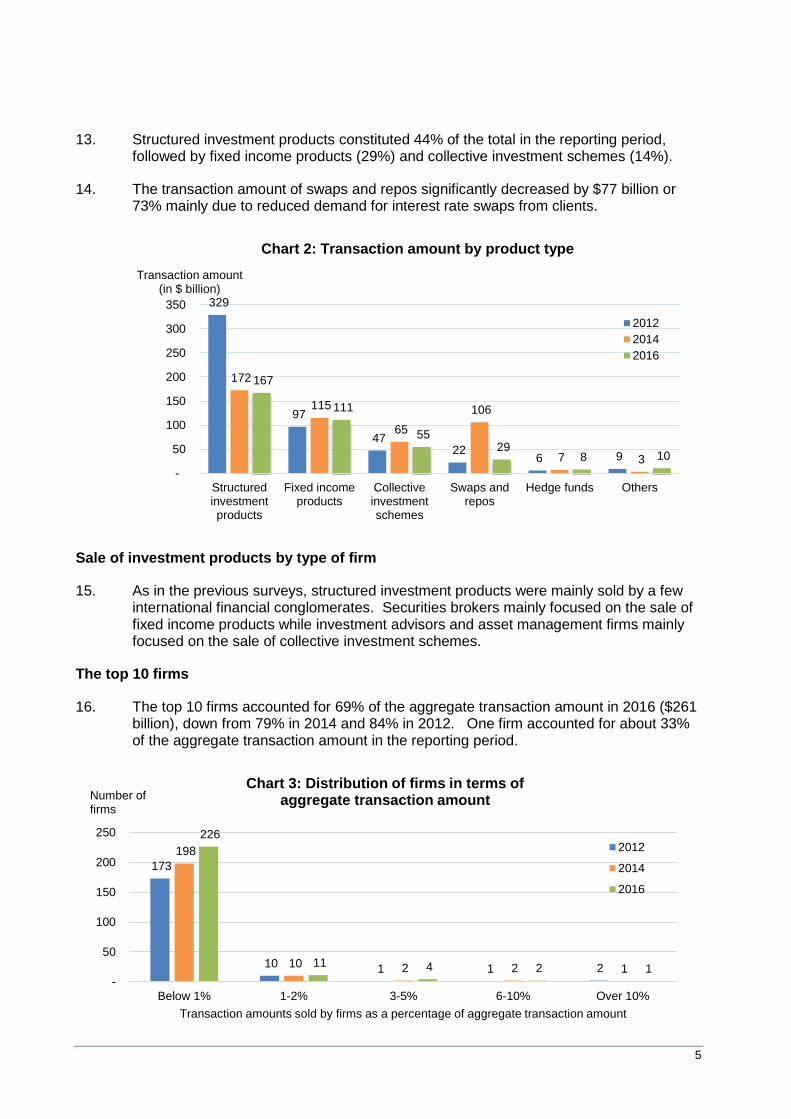
13. Structured investment products constituted 44% of the total in the reporting period, followed by fixed income products (29%) and collective investment schemes (14%).
14. The transaction amount of swaps and repos significantly decreased by $77 billion or 73% mainly due to reduced demand for interest rate swaps from clients.
Sale of investment products by type of firm
15. As in the previous surveys, structured investment products were mainly sold by a few international financial conglomerates. Securities brokers mainly focused on the sale of fixed income products while investment advisors and asset management firms mainly focused on the sale of collective investment schemes.
The top 10 firms
16. The top 10 firms accounted for 69% of the aggregate transaction amount in 2016 ($261 billion), down from 79% in 2014 and 84% in 2012. One firm accounted for about 33% of the aggregate transaction amount in the reporting period.
329
97
47 22
6 9
172
115
65
106
7 3
167
111
55 29
8 10
-
50
100
150
200
250
300
350
Structuredinvestmentproducts
Fixed incomeproducts
Collectiveinvestmentschemes
Swaps andrepos
Hedge funds Others
Transaction amount (in $ billion)
Chart 2: Transaction amount by product type
2012
2014
2016
173
10 1 1 2
198
10 2 2 1
226
11 4 2 1 -
50
100
150
200
250
Below 1% 1-2% 3-5% 6-10% Over 10%
Transaction amounts sold by firms as a percentage of aggregate transaction amount
Chart 3: Distribution of firms in terms of aggregate transaction amount
2012
2014
2016
Number of firms
6
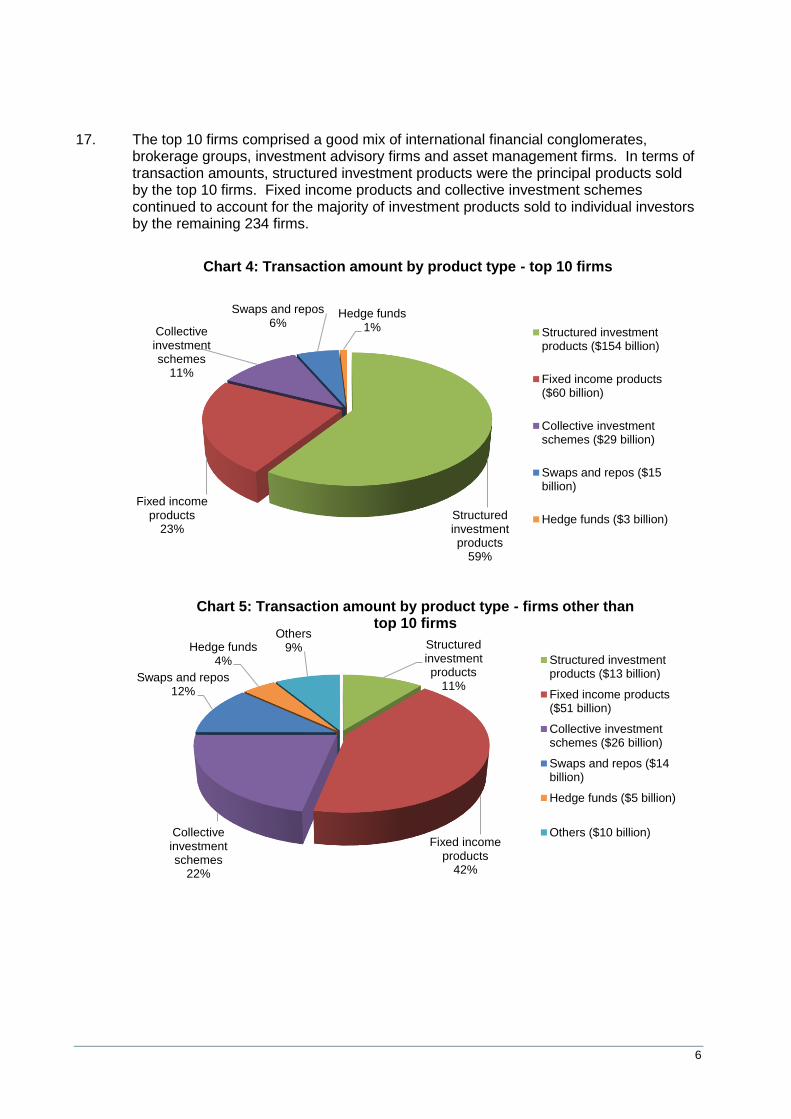
17. The top 10 firms comprised a good mix of international financial conglomerates, brokerage groups, investment advisory firms and asset management firms. In terms of transaction amounts, structured investment products were the principal products sold by the top 10 firms. Fixed income products and collective investment schemes continued to account for the majority of investment products sold to individual investors by the remaining 234 firms.
Structured investment products
59%
Fixed income products
23%
Collective investment schemes
11%
Swaps and repos6%
Hedge funds1%
Chart 4: Transaction amount by product type - top 10 firms
Structured investmentproducts ($154 billion)
Fixed income products($60 billion)
Collective investmentschemes ($29 billion)
Swaps and repos ($15billion)
Hedge funds ($3 billion)
Structured investment products
11%
Fixed income products
42%
Collective investment schemes
22%
Swaps and repos12%
Hedge funds4%
Others9%
Chart 5: Transaction amount by product type - firms other than top 10 firms
Structured investmentproducts ($13 billion)
Fixed income products($51 billion)
Collective investmentschemes ($26 billion)
Swaps and repos ($14billion)
Hedge funds ($5 billion)
Others ($10 billion)
7
Analysis by product type
Structured investment products
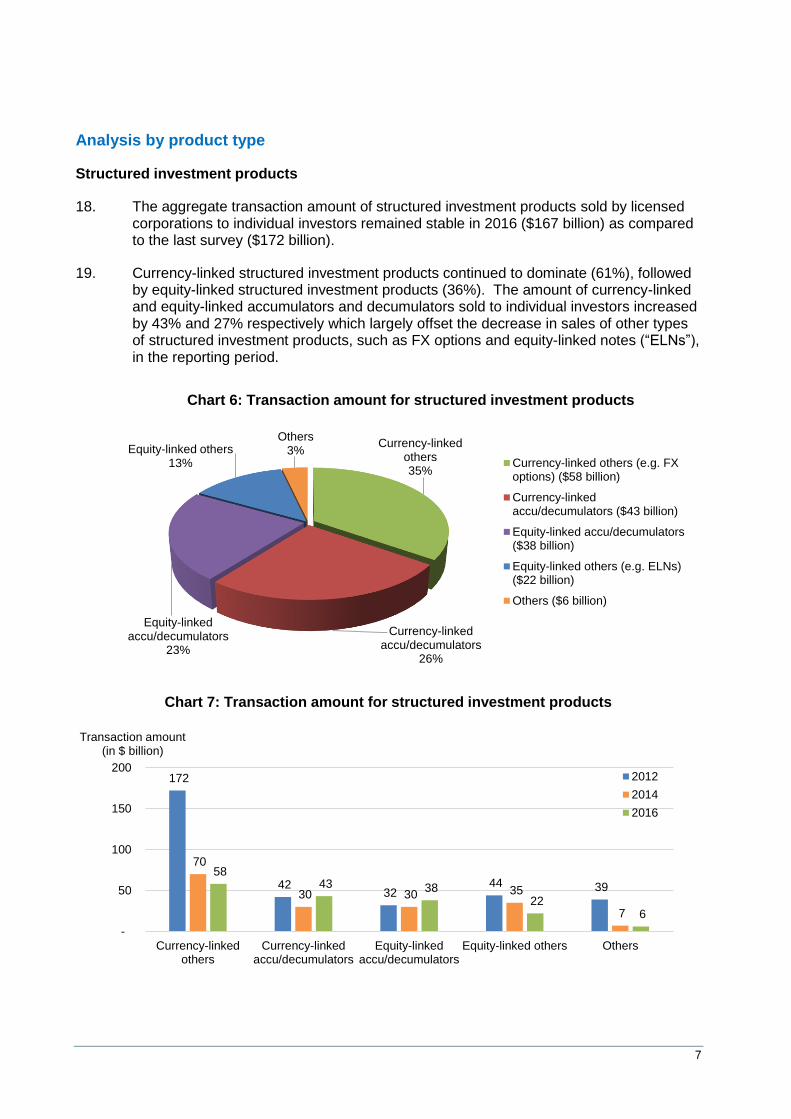
18. The aggregate transaction amount of structured investment products sold by licensed corporations to individual investors remained stable in 2016 ($167 billion) as compared to the last survey ($172 billion).
19. Currency-linked structured investment products continued to dominate (61%), followed by equity-linked structured investment products (36%). The amount of currency-linked and equity-linked accumulators and decumulators sold to individual investors increased by 43% and 27% respectively which largely offset the decrease in sales of other types of structured investment products, such as FX options and equity-linked notes (“ELNs”), in the reporting period.
Currency-linked others35%
Currency-linked accu/decumulators
26%
Equity-linked accu/decumulators
23%
Equity-linked others13%
Others3%
Chart 6: Transaction amount for structured investment products
Currency-linked others (e.g. FXoptions) ($58 billion)
Currency-linkedaccu/decumulators ($43 billion)
Equity-linked accu/decumulators($38 billion)
Equity-linked others (e.g. ELNs)($22 billion)
Others ($6 billion)
172
42 32
44 39
70
30 30 35
7
58 43 38
22 6
-
50
100
150
200
Currency-linkedothers
Currency-linkedaccu/decumulators
Equity-linkedaccu/decumulators
Equity-linked others Others
Transaction amount (in $ billion)
Chart 7: Transaction amount for structured investment products
2012
2014
2016
8
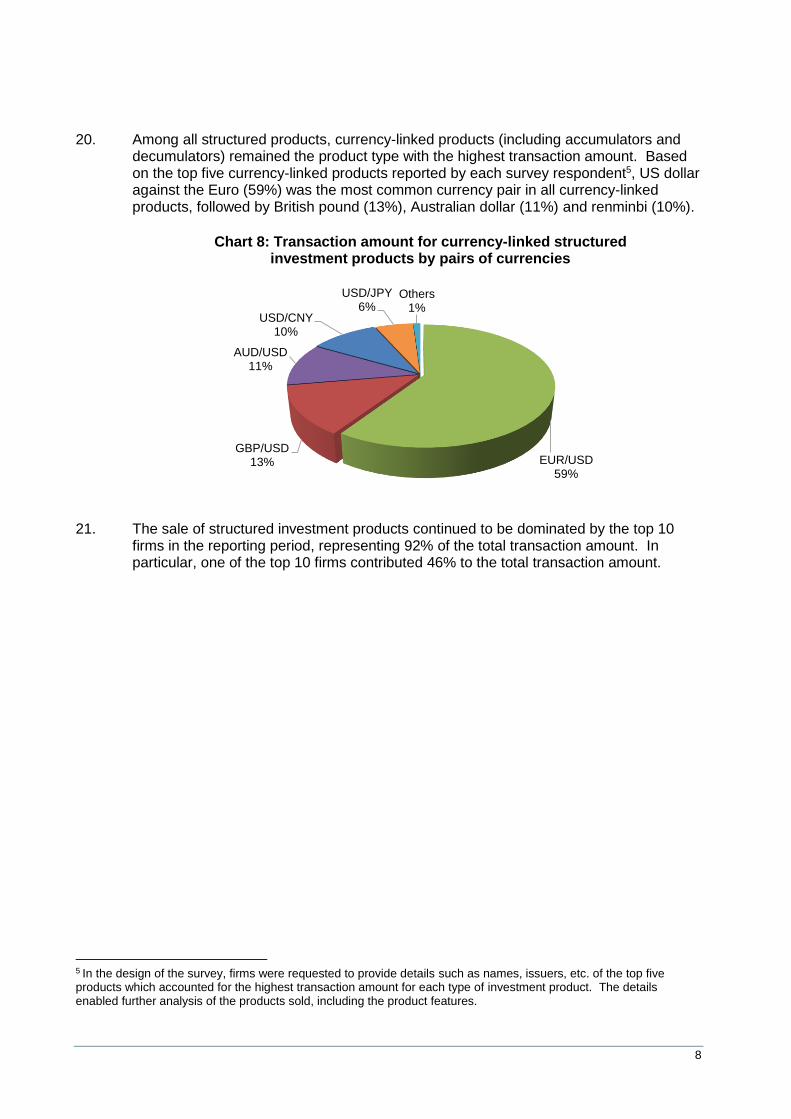
20. Among all structured products, currency-linked products (including accumulators and decumulators) remained the product type with the highest transaction amount. Based on the top five currency-linked products reported by each survey respondent5, US dollar against the Euro (59%) was the most common currency pair in all currency-linked products, followed by British pound (13%), Australian dollar (11%) and renminbi (10%).
21. The sale of structured investment products continued to be dominated by the top 10 firms in the reporting period, representing 92% of the total transaction amount. In particular, one of the top 10 firms contributed 46% to the total transaction amount.
5 In the design of the survey, firms were requested to provide details such as names, issuers, etc. of the top five products which accounted for the highest transaction amount for each type of investment product. The details enabled further analysis of the products sold, including the product features.
EUR/USD59%
GBP/USD13%
AUD/USD11%
USD/CNY10%
USD/JPY6%
Others1%
Chart 8: Transaction amount for currency-linked structured investment products by pairs of currencies
9
Fixed income products
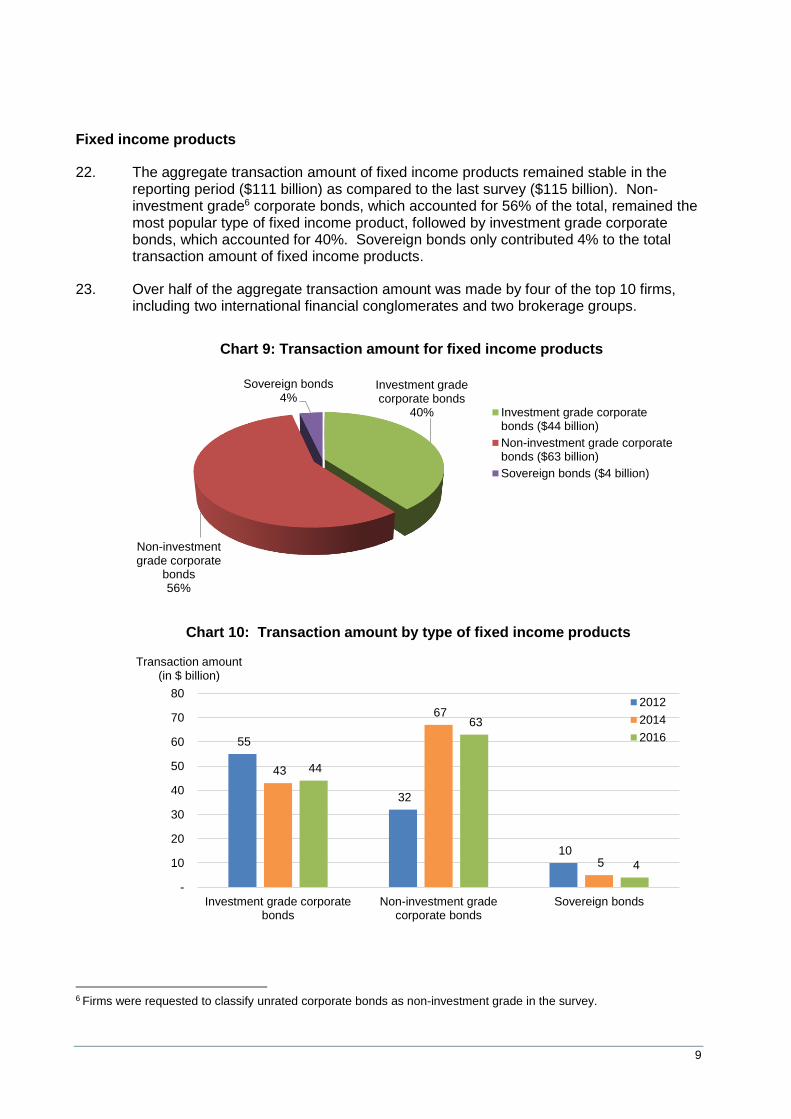
22. The aggregate transaction amount of fixed income products remained stable in the reporting period ($111 billion) as compared to the last survey ($115 billion). Non-investment grade6 corporate bonds, which accounted for 56% of the total, remained the most popular type of fixed income product, followed by investment grade corporate bonds, which accounted for 40%. Sovereign bonds only contributed 4% to the total transaction amount of fixed income products.
23. Over half of the aggregate transaction amount was made by four of the top 10 firms, including two international financial conglomerates and two brokerage groups.
6 Firms were requested to classify unrated corporate bonds as non-investment grade in the survey.
Investment grade corporate bonds
40%
Non-investment grade corporate
bonds56%
Sovereign bonds4%
Chart 9: Transaction amount for fixed income products
Investment grade corporatebonds ($44 billion)
Non-investment grade corporatebonds ($63 billion)
Sovereign bonds ($4 billion)
55
32
10
43
67
5
44
63
4
-
10
20
30
40
50
60
70
80
Investment grade corporatebonds
Non-investment gradecorporate bonds
Sovereign bonds
Chart 10: Transaction amount by type of fixed income products
2012
2014
2016
Transaction amount(in $ billion)
10
Further analysis on corporate bonds
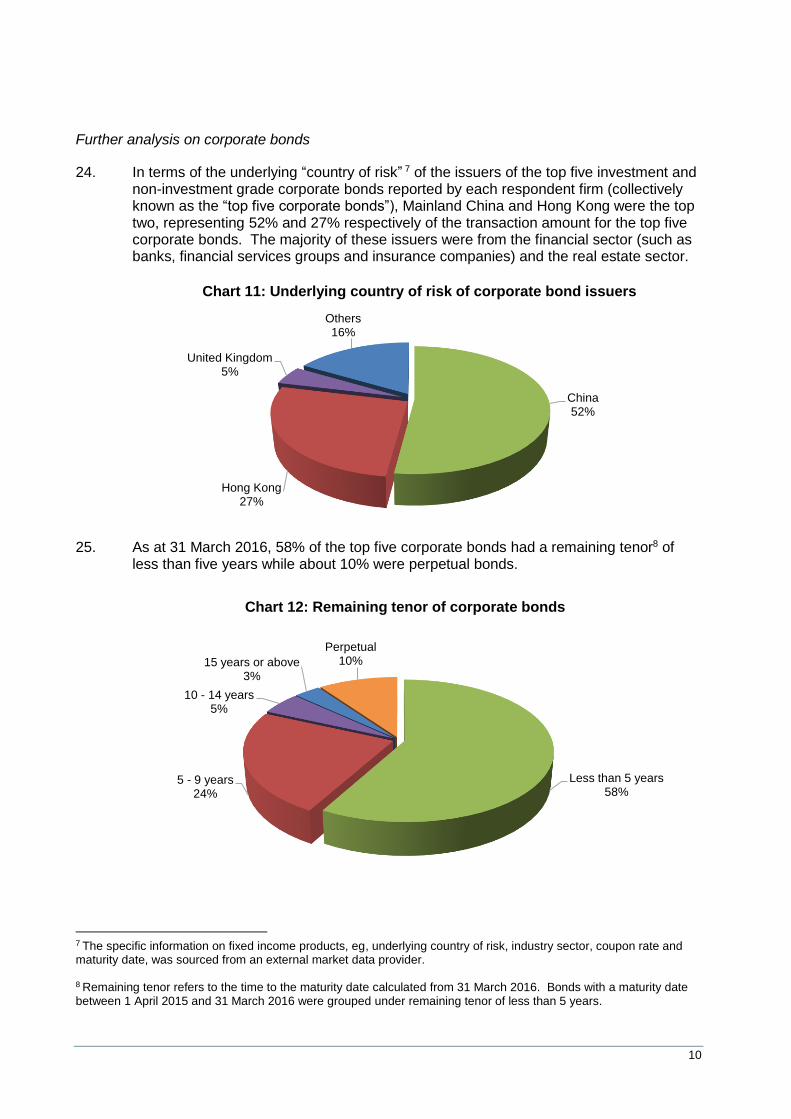
24. In terms of the underlying “country of risk” 7 of the issuers of the top five investment and non-investment grade corporate bonds reported by each respondent firm (collectively known as the “top five corporate bonds”), Mainland China and Hong Kong were the top two, representing 52% and 27% respectively of the transaction amount for the top five corporate bonds. The majority of these issuers were from the financial sector (such as banks, financial services groups and insurance companies) and the real estate sector.
25. As at 31 March 2016, 58% of the top five corporate bonds had a remaining tenor8 of less than five years while about 10% were perpetual bonds.
7 The specific information on fixed income products, eg, underlying country of risk, industry sector, coupon rate and maturity date, was sourced from an external market data provider. 8 Remaining tenor refers to the time to the maturity date calculated from 31 March 2016. Bonds with a maturity date between 1 April 2015 and 31 March 2016 were grouped under remaining tenor of less than 5 years.
China52%
Hong Kong27%
United Kingdom5%
Others16%
Chart 11: Underlying country of risk of corporate bond issuers
Less than 5 years58%
5 - 9 years24%
10 - 14 years5%
15 years or above3%
Perpetual10%
Chart 12: Remaining tenor of corporate bonds
11
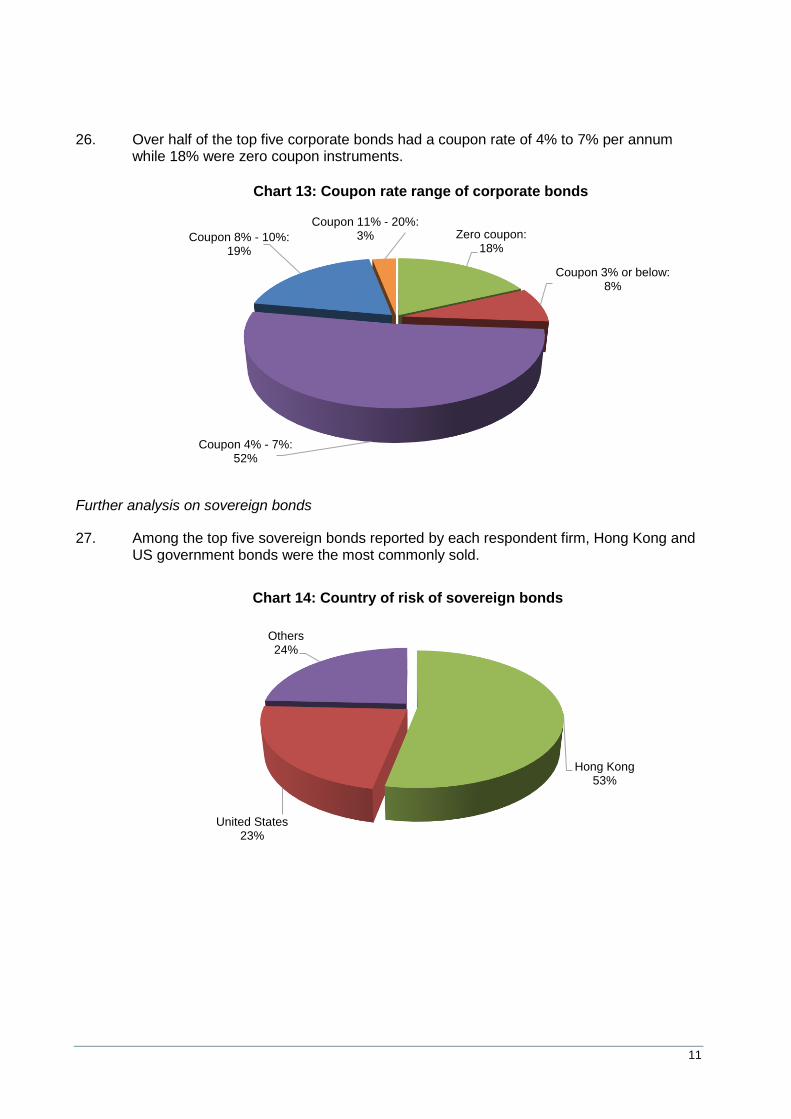
26. Over half of the top five corporate bonds had a coupon rate of 4% to 7% per annum while 18% were zero coupon instruments.
Further analysis on sovereign bonds
27. Among the top five sovereign bonds reported by each respondent firm, Hong Kong and US government bonds were the most commonly sold.
Zero coupon:18%
Coupon 3% or below:8%
Coupon 4% - 7%:52%
Coupon 8% - 10%:19%
Coupon 11% - 20%:3%
Chart 13: Coupon rate range of corporate bonds
Hong Kong53%
United States23%
Others24%
Chart 14: Country of risk of sovereign bonds
12
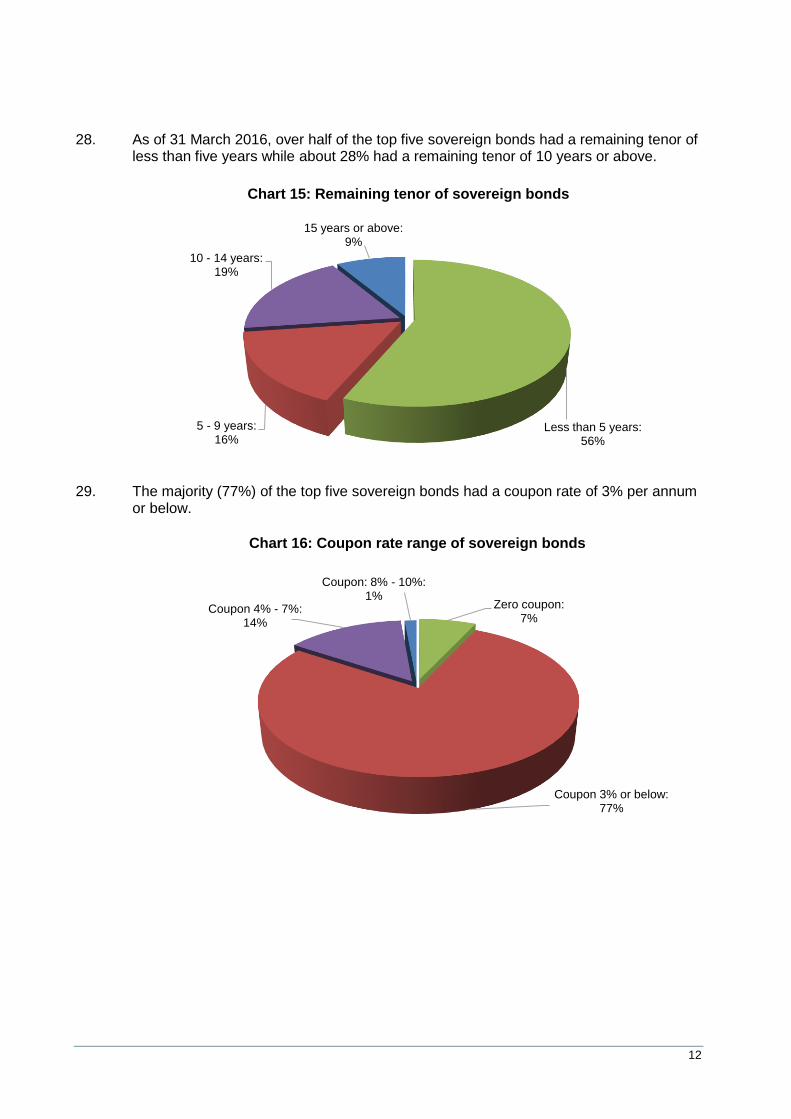
28. As of 31 March 2016, over half of the top five sovereign bonds had a remaining tenor of less than five years while about 28% had a remaining tenor of 10 years or above.
29. The majority (77%) of the top five sovereign bonds had a coupon rate of 3% per annum or below.
Less than 5 years:56%
5 - 9 years:16%
10 - 14 years:19%
15 years or above:9%
Chart 15: Remaining tenor of sovereign bonds
Zero coupon:7%
Coupon 3% or below:77%
Coupon 4% - 7%:14%
Coupon: 8% - 10%:1%
Chart 16: Coupon rate range of sovereign bonds
13
Fixed income products with non-viability loss absorption features9
30. The sale of non-viability loss absorption bonds increased from $2.1 billion in the last survey to $7.7 billion in the current survey. About 70% of these bonds were sold by five of the top 10 firms.
31. Among the top five non-viability loss absorption bonds sold, over 70% of these bonds in terms of transaction amount were issued by European banks and the rest were issued by Asian banks. 69% of these bonds had equity conversion feature. Other features included permanent and temporary write down10. About 90% were perpetual bonds while the rest had a remaining tenor of over 3 years. About 78% of the top five non-viability loss absorption bonds had a coupon rate of 5% to 7% per annum.
Collective investment schemes and hedge funds
32. Collective investment schemes continued to be the product type sold by the majority (66%) of the firms which engaged in the sale of investment products in the reporting period. The transaction amounts of authorized and unauthorized collective investment schemes were 48% and 52% respectively in the reporting period.
33. The transaction amount of collective investment schemes dropped by 15% from $65 billion in the last survey to $55 billion in the current survey. The two firms with the largest decrease in the sale of collective investment schemes respectively advised that the drop was mainly due to reduced demand from clients during the reporting period and the disposal of its wealth management business line.
34. Among the 160 firms selling collective investment schemes in the reporting period, five firms contributed $30 billion or 55% to the total transaction amount, including one international financial conglomerate, two investment advisory firms and two asset management firms. Equity funds were the most popular type of funds sold to individual investors on the top five collective investment schemes reported by each respondent firm.
35. 50 firms reported to have participated in the sale of high yield bond funds with a transaction amount of about $2 billion or 4% of the total for all collective investment schemes.
36. The transaction amount of hedge funds remained steady in both the 2016 and 2014 survey periods. Among the 56 firms which sold hedge funds to individual investors, five firms accounted for about 60% of the total transaction amount of hedge funds ($8 billion). According to the top five hedge funds reported, equity long/short was the most common investment strategy among hedge funds sold during the reporting period.
9 These fixed income products are often attached with conversion options or loss absorption features which are triggered when the issuer’s regulatory capital ratio drops to a certain level or upon the occurrence of specific government or regulatory action in the event the issuer faces financial difficulties (ie, non-viability events). 10 Under a temporary write-down, the principal amount of the bond would be written down fully or partially upon the occurrence of a triggering event. However, if the issuer’s financial position subsequently improved and met certain requirements, the principal amount of the bond could be reinstated fully or partially.
14
Swaps and repos
37. The sale of swaps and repos declined by 73% from $106 billion in the last survey to $29 billion in the reporting period as a result of reduced demand for interest rate swaps from clients. Five firms contributed over 80% of the total transaction amount of swaps and repos, including three international financial conglomerates and two brokerage groups.
Outstanding contracts
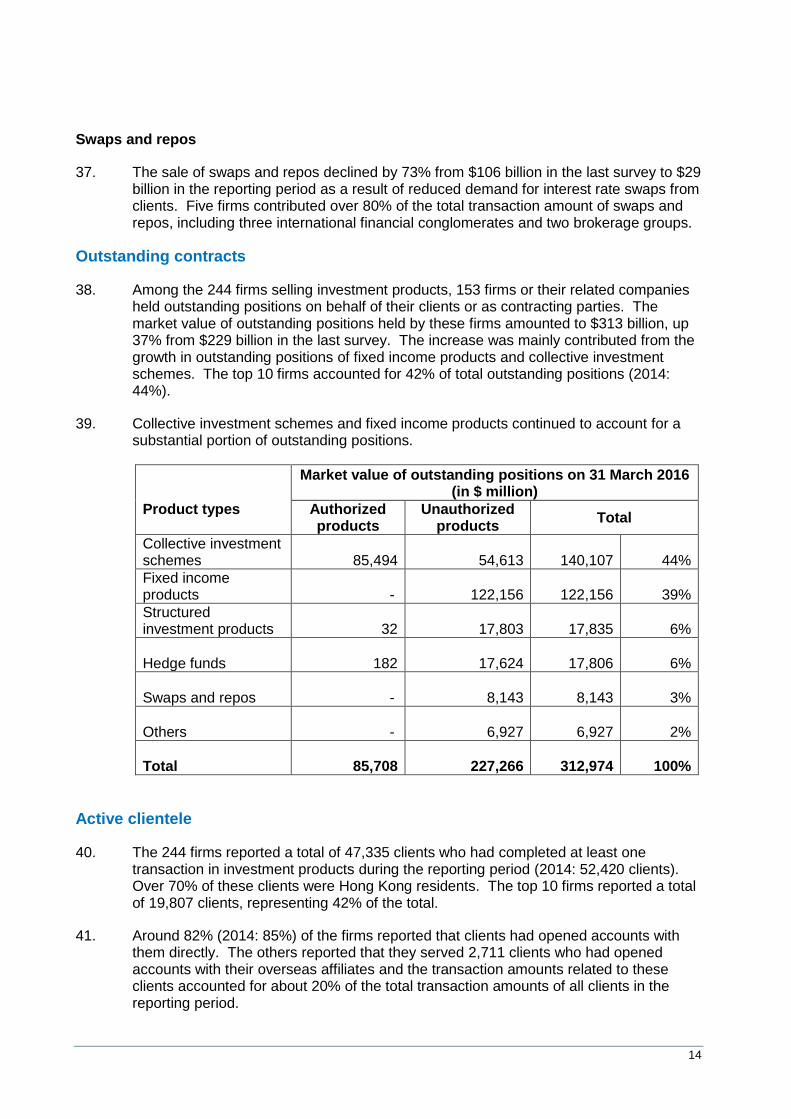
38. Among the 244 firms selling investment products, 153 firms or their related companies held outstanding positions on behalf of their clients or as contracting parties. The market value of outstanding positions held by these firms amounted to $313 billion, up 37% from $229 billion in the last survey. The increase was mainly contributed from the growth in outstanding positions of fixed income products and collective investment schemes. The top 10 firms accounted for 42% of total outstanding positions (2014: 44%).
39. Collective investment schemes and fixed income products continued to account for a substantial portion of outstanding positions.
Product types
Market value of outstanding positions on 31 March 2016 (in $ million)
Authorized products
Unauthorized products
Total
Collective investment schemes 85,494 54,613 140,107 44%
Fixed income products - 122,156 122,156 39%
Structured investment products 32 17,803 17,835 6%
Hedge funds 182 17,624 17,806 6%
Swaps and repos - 8,143 8,143 3%
Others - 6,927 6,927 2%
Total 85,708 227,266 312,974 100%
Active clientele
40. The 244 firms reported a total of 47,335 clients who had completed at least one transaction in investment products during the reporting period (2014: 52,420 clients). Over 70% of these clients were Hong Kong residents. The top 10 firms reported a total of 19,807 clients, representing 42% of the total.
41. Around 82% (2014: 85%) of the firms reported that clients had opened accounts with them directly. The others reported that they served 2,711 clients who had opened accounts with their overseas affiliates and the transaction amounts related to these clients accounted for about 20% of the total transaction amounts of all clients in the reporting period.
15
42. About 16% or 7,595 clients (2014: 11% or 5,596 clients) had been treated as professional investors under the Code of Conduct11.
Investment product issuers
43. Each respondent firm reported its top five issuers of investment products sold. For the year ended 31 March 2016, $271 billion of the total transaction amount was related to these top five reported issuers. These issuers included financial institutions, governments or their agencies, and local or overseas corporations.
44. The three international financial conglomerates in the top 10 firms or their related companies issued about $142 billion (52%) of the total. These products were mainly structured investment products. Out of this $142 billion, $138 billion (97%) was sold by the three international financial conglomerates to their clients.
Manpower
45. As at 31 March 2016, 5,448 licensed representatives were reported to be engaged in the sale of investment products, an increase of 3.6% from 5,258 in the last survey.
46. Over half of the respondent firms reported to have five or fewer licensed representatives engaged in the sale of investment products whereas 12 firms reported to have over 100 licensed representatives.
11 Code of Conduct for Persons Licensed by or Registered with the Securities and Futures Commission