Survey on public attitudes towards the physical discipline ...
72
Survey on public attitudes towards the physical discipline of children Sue Carswell Ministry of Justice
Transcript of Survey on public attitudes towards the physical discipline ...

Survey on public attitudes towardsthe physical discipline
of children
Sue Carswell
Ministry of Justice

ii
First published in November 2001 by theMinistry of Justice
PO Box 180Wellington
New Zealand
© Crown Copyright
ISBN 0-478-20159-1

iii
Foreword
Section 59 of the Crimes Act 1961 provides a defence to parents charged with variousoffences relating to physical assaults of their children. The Government is currentlyconsidering issues related to section 59, in the context of a work programme to improve NewZealand’s compliance with the United Nations Convention on the Rights of the Child. Toassist this work, it is important to gain an understanding of the views currently held by NewZealanders on the physical discipline of children.
In June 2001, the Ministry of Justice commissioned a stand-alone telephone survey of 1000adults to ascertain their attitudes towards the use of physical discipline on children. Thisreport contains the results of that survey. The survey complements previous studies that havebeen done in this area by other government agencies and academic researchers.
The use of physical discipline on children is an issue that generates considerable interest anddebate. While the survey was primarily commissioned to inform policy advice toGovernment, it is also available as a resource to others who have an interest in this issue. Thesurvey findings provide a valuable insight into New Zealanders’ current attitudes towardsparenting practice and the use of physical discipline.
Belinda ClarkSecretary for Justice

iv

v
AcknowledgementsI wish to thank Andrea King, Alison Chetwin, Judy Paulin, Phil Spier, Wendy Searle, WarrenYoung, Chris Cunningham and Heker Robertson for their helpful suggestions and commentson a draft copy of this report. I would also like to thank Andy Heinemann and his team atthe National Research Bureau Ltd for conducting the telephone survey and Judith Spier forformatting the final draft.

vi

vii
Contents
Foreword iiiAcknowledgements vContents viiTables ixFigures ixExecutive Summary xi1 Introduction 1
1.1 Background 11.2 Methodology 1
2 Type of physical punishment 52.1 Introduction 52.2 Findings 62.3 Summary 12
3 Severity of physical punishment 173.1 Introduction 173.2 Findings 173.3 Summary 22
4 Ages of children 234.1 Introduction 234.2 Findings 234.3 Summary 29
5 Discussion 31References 39Appendix A: Sample description 41Appendix B: Additional demographic information 43Appendix C: Research and sampling methodology 45Appendix D: Sampling errors 49Appendix E: Questionnaire 51

viii

ix
Tables
Table 1.1 Demographic variables and respective groupings 4Table 5.1 Percentage of people who agreed with the statement: There are certain
circumstances when it is alright for a parent to smack a child 33Table 5.2 Comparison of results (percentage) from 1993 and 2001 regarding
acceptability of physically disciplining teenagers, by gender 34Table A.1 The demographic variables, gender, ethnicity and age, that were used for
calculating the weighting of the sample based on the New Zealand 1996 Census 41
Table A.2 Sample description of the demographic variables, parental status and NZSEI occupational category 42
Table D.1 95% confidence limits for various rates and sample sizes 49Table D.2 99% confidence limits for various rates and sample sizes 49
Figures
Figure 2.1 Percentage of people who agreed that each of the four types of physical discipline should be legally allowable to discipline a child 6
Figure 2.2 Percentage of people who agreed with the statement on smacking with an open hand, by ethnicity 7
Figure 2.3 Percentage of respondents who agreed with the statement on smacking with an open hand, by parental status 8
Figure 2.4 The percentage of respondents who agreed with the statement on smacking with an open hand, by age group 8
Figure 2.5 Percentage of respondents who agreed with the statement on smacking with an open hand, by occupational category 9
Figure 2.6 Percentage of people who agreed with the statement on using implements such as a wooden spoon and belt, by ethnicity 10
Figure 2.7 Percentage of people who agreed with the statement regarding the use of implements such as wooden spoons and belts, by age group 11
Figure 2.8 Percentage of people who agreed with the statement regarding the use of implements such as wooden spoons and belts, by occupational category 11
Figure 2.9 Percentage of respondents who agreed with the four viewpoints on the type of physical punishment of children that should be legally allowable, by ethnicity 13
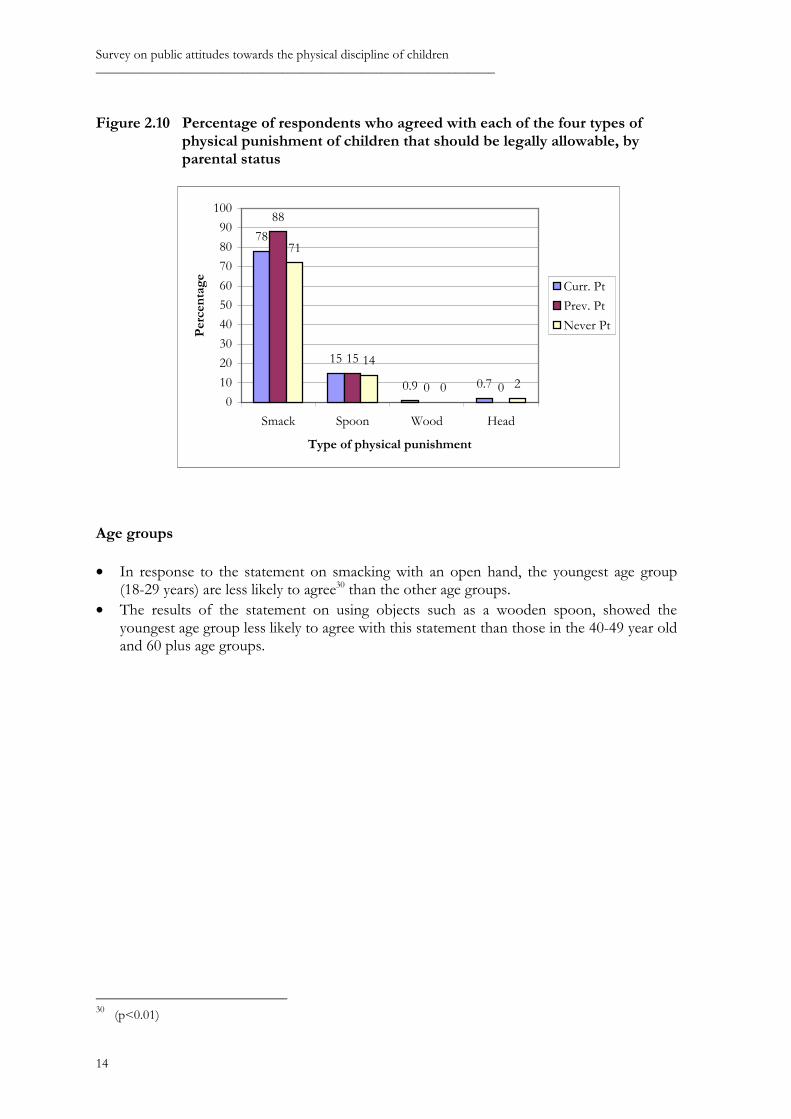
Figure 2.10 Percentage of respondents who agreed with each of the four types of physical punishment of children that should be legally allowable, by parental status 14
Figure 2.11 Percentage of respondents who agreed with the four viewpoints on the type of physical punishment of children that should be legally allowable, by age group 15

x
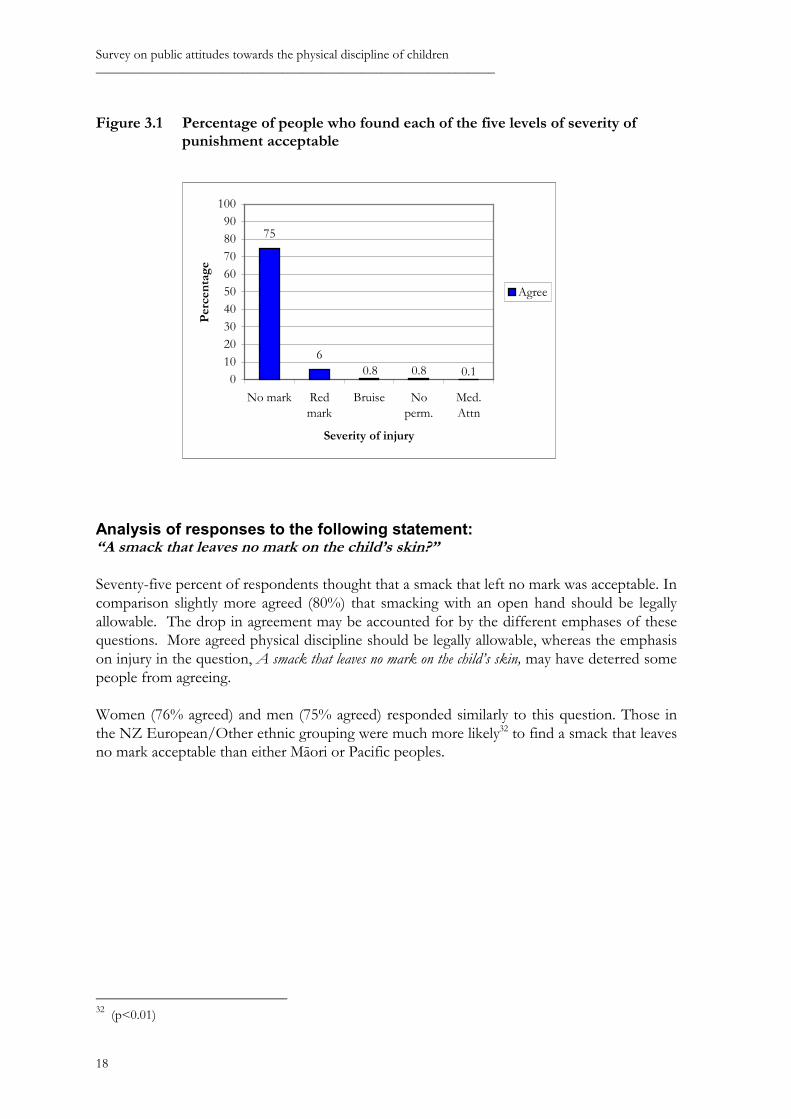
Figure 3.1 Percentage of people who found each of the five levels of severity of punishment acceptable 18
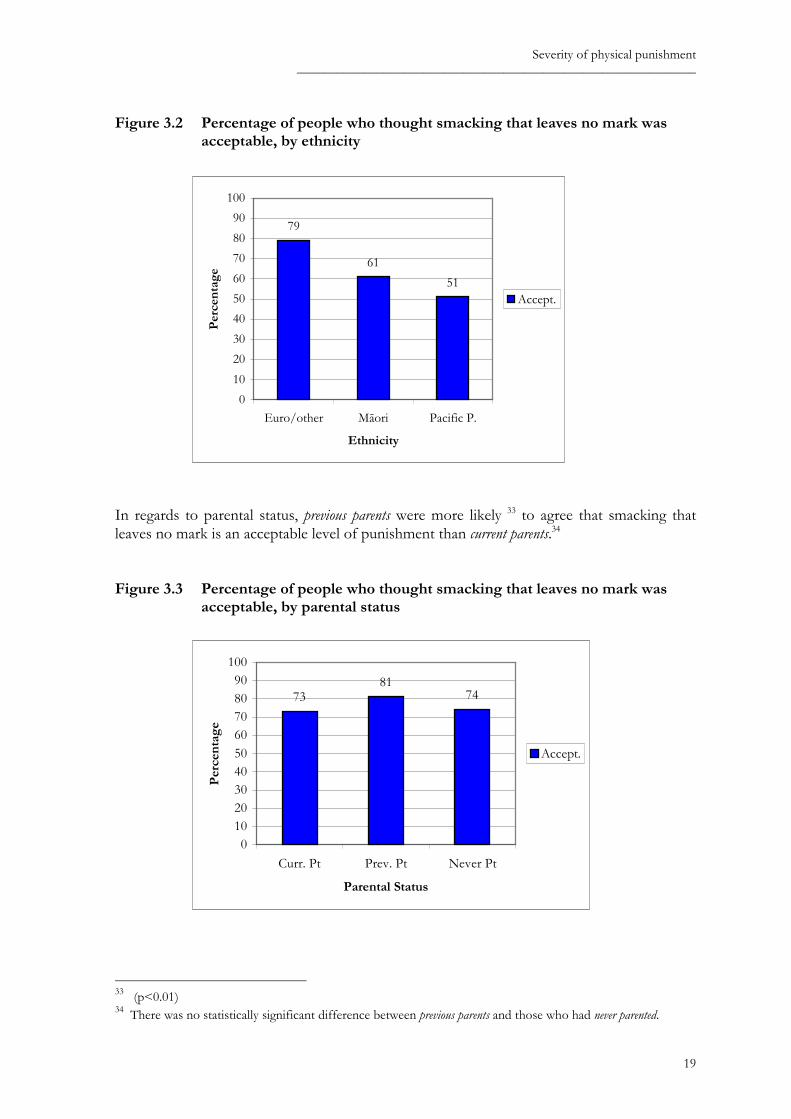
Figure 3.2 Percentage of people who thought smacking that leaves no mark was acceptable, by ethnicity 19
Figure 3.3 Percentage of people who thought smacking that leaves no mark was acceptable, by parental status 19
Figure 3.4 Percentage of people who thought smacking that leaves no mark was acceptable, by age group 20
Figure 3.5 Percentage of people who thought smacking that leaves no mark was acceptable, by occupational category 21
Figure 4.1 Percentage of people who thought it acceptable to physically discipline each of the five age groups 24
Figure 4.2 Percentage of people who agreed that it is acceptable to physically punish children in each of the age groups, by gender 24
Figure 4.3 Percentage of people who agreed that it is acceptable to physically punish children in each of the age groups, by ethnicity 26
Figure 4.4 Percentage of people who agreed it is acceptable to physically punish children in each of the age groups, by parental status 26
Figure 4.5 Percentage of people who agreed it was acceptable to physically punish children in each of the age groups, by respondents age groups 28
Figure B.1 Percentage of the age groups of the respondents for each parental status 43Figure B.2 Percentage of the ethnic groupings of the respondents for each parental
status 43Figure B.3 Percentage of the ethnic groupings of the respondents for each age group 44

xi
Executive Summary
Objective
The survey was conducted by the Ministry of Justice to ascertain public attitudes towards thephysical discipline of children. This information is to inform ongoing policy work on section59 of the Crimes Act 1961. Section 59 provides a defence to parents charged with assaultagainst their children. Under section 59, every parent of a child (and every person in the placeof the parent of a child) is justified in using force by way of correction towards the child, ifthe force used is reasonable in the circumstances.
Methodology
This study involved a stand alone, nation-wide, telephone survey of 1000 adults (18 years andover) that included proposed minimum samples of 100 Mäori and 100 Pacific peoples. Thetelephone survey was undertaken by a research company, the National Research Bureau Ltd,during June 2001. The results were analysed and written into the present report by theMinistry of Justice.
The survey questions were grouped into three different aspects of physical discipline, namely:type of punishment; physical severity of punishment; and the acceptability of physicalpunishment of children of different age groups. These questions sought to find out if thepublic viewed the physical discipline of children as acceptable at all and, if so, what theyconsidered to be acceptable physical punishment for the purposes of correction.
The response rate to the survey was 59%. The results were further analysed using thefollowing demographic variables; gender, ethnicity, age, parental status and socio-economicstatus. The demographic results that are reported are significant at the 95% confidence levelunless otherwise stated as being significant at the 99% confidence level, which is representedby the p value (p<0.01) in a footnote. A significant result at the 95% confidence level meansthat we can say with 95% certainty that these results have not occurred by chance. Similarly,for the 99% confidence level we can say with 99% certainty that these results have notoccurred by chance.
The margins of error at the 95% and 99% confidence levels associated with a result of 50% ofthe total survey sample agreeing with a particular statement are approximately ± 3.1% and± 4.1% respectively.

xii
Findings
Type of physical punishment
The results showed that 80% of the public agreed that a person parenting a child should beallowed by law to smack the child with an open hand if they are naughty. The use of objectsto smack a child and smacking them in the head and neck area drew an overwhelminglynegative response from the public, indicating that only using an open hand was acceptable tomost people.
• Fifteen percent agreed with the viewpoint that a person parenting a child should be legallyallowed to use objects like a wooden spoon or a belt to punish the child if they arenaughty.
• There was negligible agreement (0.4%) with the viewpoint that persons parenting a childshould be legally allowed to use heavier objects like a piece of wood or an electric cord tophysically discipline a child.
• There was negligible agreement (1.3%) with the viewpoint that persons parenting a childshould be legally allowed to smack a child in the head and neck area if they are naughty.
• Other New Zealand studies have asked respondents if they agree with the statement Thereare certain circumstances when it is alright for a parent to smack a child. The results from thesestudies can only tentatively be compared to the question on smacking with an open handas they are different questions and different methodologies were used. However, theresults are documented in the discussion section of this report.
Severity of physical punishment
The questions on severity of punishment ranged from a smack that left no mark through tophysical punishment that required medical attention. The responses indicated that only asmack that left no mark was acceptable to the majority of people (75%). Physical force thatleft a red mark or bruising that lasts for a few days, marks and bruising that last for more thana few day, and injuries that require medical attention were found to be unacceptable by almosteveryone.
• 6% thought it was acceptable to use physical punishment that leaves a red mark that lastsa few days.
• 0.8% thought it was acceptable to use physical punishment that leaves a bruise that lasts afew days.
• 0.8% thought it was acceptable to use physical punishment that leaves marks and bruisesthat last for more than a few days but doesn’t cause permanent injury.
• 0.1% thought it was acceptable to use physical punishment that causes an injury thatneeds medical attention.

xiii
Age groups of children
In regards to the questions on the age groups of children, the results indicate that mostrespondents view punishing very young and older children as unacceptable. This possiblyreflects attitudes towards the maturity of the child in terms of physicality and intellectualdevelopment.
• 23% thought it was acceptable to physically discipline children under two years old.
• 62% thought it was acceptable to physically discipline children 2-5 years old.
• 72% thought it was acceptable to physically discipline children 6-10 years old.
• 43% thought it was acceptable to physically discipline children 11-14 years old.
• 16% thought it was acceptable to physically discipline children 15-17 year olds.
Demographic analysis of survey results
Gender
• The response from women and men was very similar for the questions on type andseverity of punishment.
• The significant differences were in regards to the age groups of children. Women (26%)found it more acceptable1 than men (19%) to physically punish children less than twoyears.
• In regards to the physical discipline of 6-10 and 11-14 year olds, men (76% and 51%respectively) found this more acceptable2 than women (67% and 35% respectively).
Ethnicity
• The sample was analysed by the following ethnic groupings: New ZealandEuropean/Other; Mäori; and Pacific peoples. A comparison of the statistically significantresults by ethnicity showed that those in the NZ European/Other ethnic groupinggenerally viewed it as more acceptable than either Mäori or Pacific peoples to physicallydiscipline children.
• The respondents in the NZ European/Other ethnic grouping (82%) were more likely3 tothink that persons parenting a child should be legally allowed to physically discipline thechild if they are naughty, than either Mäori (73%) or Pacific peoples (69%).
1 (p<0.01)2 (p<0.01)3 (p<0.01)

xiv
• NZ European/Other respondents (79%) were more likely4 to view a smack that left nomark as an acceptable level of physical punishment than either Mäori (61%) or Pacificpeoples (51%). There was no one ethnic group that viewed punishment that leaves a redmark, bruising or injuries that require medical attention as acceptable more so than theother groups.
• NZ European/Other respondents were more likely5 than Mäori or Pacific peoples tothink that it was acceptable to physically discipline children aged 0-10 years old. Theproportion of each ethnic grouping that found it acceptable to physically disciplinechildren aged:
� under two years old: NZ European/Other (25%); Mäori (12%); Pacific peoples(13%);
� 2-5 years old: NZ European/Other (66%); Mäori (44%); Pacific peoples (31%);� 6-10 years old: NZ European/Other (74%); Mäori (61%); Pacific peoples (59%).
• Pacific peoples (30%) were more likely6 to view it as acceptable to discipline olderchildren aged 15-17 years than NZ European/Other respondents (14%). These resultssuggest that there were different perceptions among ethnic groups about the ages it isappropriate to physically discipline children.
• Pacific peoples (27%) were more likely7 to agree that objects such as wooden spoonsshould be allowed by law to physically punish children than NZ European/Others (15%)or Mäori (10%).
• There was no one ethnic group that thought that the use of heavier objects like a piece ofwood or an electric cord to physically discipline a child was more acceptable than theother groups.
Parental status
• The sample was analysed by parental status. The proportions of the sample were:currently parenting (53%); those who had previously parented (29%); and those who hadnever parented (18%), equating to a total of 82% who had parenting experience.
• The results in terms of parental status highlighted that previous parents (88%) were morelikely8 to find smacking with an open hand should be legally allowable than those whowere currently parenting (78%) or those who had never parented (71%).
• Previous parents (81%) were also more likely9 to agree that smacking that leaves no mark isan acceptable level of punishment than current parents (73%).
4 (p<0.01)5 (p<0.01)6 (p<0.01)7 (p<0.01)8 (p<0.01)9 (p<0.01)

xv
• Current parents (26%) were more likely to find physical discipline of children under twoyears acceptable than previous parents (19%) or those that have never parented (17%acceptance).
Age groups of respondents
• The sample was analysed by age groups of respondents: 18-29 years old; 30-39 years old;40-49 years old; 50-59 years old; and 60 plus years.
• The youngest age group of respondents, those aged 18-29 years, were less likely10 to agreethat smacking with an open hand should be legally allowable than the other age groups.
• Those aged 18-29 years were also less likely11 to agree that a smack that leaves no markwas an acceptable level of punishment than nearly all the other age groups.
• The question was raised whether the lower acceptance of 18-29 year olds was due to thelarger proportion of these respondents who had never parented (47%). Further statisticalanalysis regarding the question on smacking with an open hand was conducted toexamine this query. The results showed that those in the 18-29 year old age group whowere currently parenting (44% of the 18-29 year olds) were still significantly less likely toagree that smacking with an open hand should be legally allowable to discipline a naughtychild.
• The youngest age group maintained a lower acceptance of physical discipline of childrenacross many of the questions, which could be an indication that there is a change inattitude over the generations towards the physical discipline of children becoming lessacceptable. However, there was not a consistent drop in agreement from oldest toyoungest. Indeed, for some of the results, the 50-59 years and 60+ years had relativelylow acceptance compared to the middle groups.
• Those who were 60+ years had the lowest acceptance of physically punishing childrenaged 15-17 years when compared to the 40-49 year olds.
New Zealand Socio-economic Index (NZSEI) occupational categories
• The sample was analysed by NZSEI occupational categories.
• The results of the survey showed no discernible difference between occupations that hadhigher or lower NZSEI scores. This suggests that there was no difference in attitudesbetween people with different socio-economic status towards the physical discipline ofchildren.
10 (p<0.01)11 (p<0.01) With the exception of the 30-39 year olds where the statistically significant difference is at the 95%confidence level.

xvi

1
Introduction
1.1 Background
This survey was conducted by the Ministry of Justice to ascertain public attitudes towards thephysical discipline of children. This information is to contribute to ongoing policy work onsection 59 of the Crimes Act 1961. Section 59 provides a defence to parents charged withassault of their children. Under section 59, every parent of a child (and every person in theplace of the parent of a child) is justified in using force by way of correction towards thechild, if the force used is reasonable in the circumstances.
The issue of section 59 primarily arose in the context of a proposed Government-wide workprogramme to improve New Zealand’s compliance with the United Nations Convention onthe Rights of the Child of 1989 (UNCROC). The United Nations Committee on the Rightsof the Child has previously recommended that New Zealand review its corporal punishmentlegislation with the view to banning all forms of corporal punishment against children.
Officials have investigated how other comparable countries, particularly in the EuropeanUnion, have addressed the issue of compliance with UNCROC and the existence of lawsimilar to section 59. They found that while many European countries are banning physicalpunishment, a number of Commonwealth countries, such as Australia, Canada and theUnited Kingdom, are either doing nothing or considering placing restrictions in law on whenthe use of physical punishment was appropriate.
Officials are currently analysing the implications for New Zealand should Parliament (forexample, through a Member’s Bill) decide to repeal or amend section 59 and what educationmeasures could be undertaken. The findings of this survey will inform officials’ advice togovernment.
1.2 Methodology
The survey aimed to ascertain public attitudes to the physical discipline of children. Thisstudy involved a stand alone, nation-wide, telephone survey of 1,000 adults (18 years andover) that was undertaken by the National Research Bureau Ltd during June 2001. Thesample was to include proposed minimum samples of 100 Mäori and 100 Pacific peoples.
Questions
The survey consisted of closed questions that asked respondents about three different aspectsof physical discipline of children. The first area enquired whether respondents agreed ordisagreed with various viewpoints on the type of physical punishment a person parenting a

Survey on public attitudes towards the physical discipline of children____________________________________________________________
2
child should be allowed, by law, to carry out for the purposes of punishing a naughty child.The different types of punishment included:
• smacking with an open hand;• using implements such as a wooden spoon or belt;• using implements that were heavier, such as a piece of wood; and• smacking a child in the head and neck area.
The second area of questioning asked people whether they viewed different levels of physicalpunishment as acceptable or unacceptable. The levels included:
• a smack that leaves no mark on the child’s skin;• punishment that leaves a red mark that lasts a few days;• punishment that leaves a bruise that lasts a few days;• punishment that leaves marks and bruises that last for more than a few days but doesn’t
cause a permanent injury; and• punishment that causes an injury that needs medical attention.
The third area of questioning asked which age groups of children respondents thought peopleshould not be allowed to punish physically. The age groups were:
• under 2 years;• 2 - 5 years;• 6 - 10 years;• 11 - 14 years; and• 15 - 17 years.
Response rate and margin of error
The response rate to the survey was 59%. This is the percentage of people who agreed toparticipate in the survey out of the total number of people telephoned (approximately 1,700),in order to reach the total survey sample of 1000 respondents.
The survey results were further analysed by demographic variables (see Table 1 below) and allthose results that are reported are significant at the 95% confidence level unless otherwisestated as being significant at the 99% confidence level, which is represented by the p value(p<0.01) in a footnote. The 95% confidence level means that we can say with 95% certaintythat these results have not occurred by chance. Similarly, for the 99% confidence level wecan say there is a 99% certainty that these results have not occurred by chance.
The reported results are based on weighted sample sizes that take into account gender, ageand ethnicity to align the sample to the 1996 New Zealand Census population12. This makesit possible to generalise the findings to the New Zealand population, subject to measurementerror, also referred to as margins of error. The margins of error at the 95% and 99% 12 Refer to Appendix A for the comparative weighting of the sample sizes for gender, age and ethnicity to the1996 New Zealand Census proportions.

3
confidence levels associated with a result of 50% of the total survey sample (1000respondents) agreeing with a particular statement are approximately ± 3.1% and ± 4.1%respectively (see Appendix D). For example, if 50% of a sample of 1000 agreed with aparticular statement, we can say with 95% confidence that between 46.9% and 53.1% of thewhole population would agree to the statement.
For all the questions the respondents were given the option to say they don’t know/no idea orthat they would prefer not to answer. As the proportion who responded in this way was very low(below 2%) for every question, these responses were not included in the analysis.
Limitations
A short survey of this nature must necessarily be limited in scope. The questions cannotexplore every aspect of physical discipline of children. For example, the questions onlyfocused on attitudes, rather than the use of physical punishment.13 The attitudes of childrenthemselves would add valuable insight into these issues. However the methodology wasconsidered inappropriate to ask children their views. This would require a different type ofstudy, with face-to-face interviews conducted by specially trained interviewers.14
The way a question is worded also has an impact on the response. A comparative analysis ofsome of the questions highlights this point. However, all the questions (apart from thedemographic information) in the survey implicitly asked whether it is acceptable to physicallydiscipline children. A respondent who did not agree with the physical discipline of childrenwould have found all the viewpoints unacceptable.
A limitation of self-report surveys is that they are based on what respondents decide toreport. There is the possibility that respondents may say what they think is the correctresponse rather than what they actually think or do.
Telephone surveys are thought to under-represent groups who have lower rates of telephoneownership and to achieve a lower response from Mäori and Pacific peoples who tend toprefer face-to-face interviewing. However, approximately 96% of households have atelephone.
The survey findings are divided into three sections relating to each of the three areas ofquestioning. They are: type of physical punishment; severity of physical punishment; and agesof children.15
13 The Department of Child, Youth and Family has recently (May 2000) conducted a survey on the impact oftheir Alternatives to Smacking Campaign that included questions on practice.14 Some consultation with children on this issue has taken place in the context of The Agenda for Children andYouth Development Strategy being led by the Ministries of Social Development and Youth Affairs.15 A note on the presentation of percentage results. The results over 2% have been rounded to the nearestwhole number. However, as a considerable number of results are under 2%, these results are presented at theone decimal point place for the purposes of clarity.

Survey on public attitudes towards the physical discipline of children____________________________________________________________
4
Statistical testing
Statistical analyses were performed on the unweighted data using The Survey System (TSS)software. Chi-square tests were used to assess statistical differences between responses to thequestions about the physical discipline of children according to the following demographicvariables and groupings:
Table 1.1 Demographic variables and respective groupingsDemographic variable Grouping
Gender FemaleMale
Ethnicity New Zealand European/OtherMäoriPacific peoples
Parental status Currently parentingPreviously parentedNever parented
Age groups 18-29 years30-39 years40-49 years50-59 years60 plus years NZSEI Scores
New Zealand Socio-economic Index ofOccupationalStatus (NZSEI) ofmain income earner inthe household at themajor group level(excluding ArmedForces16)
Legislators, Administrators and ManagersProfessionalsTechnicians and Associate ProfessionalsClerksService and Sales WorkersAgriculture and Fishery WorkersTrades WorkersPlant and Machine Operators and AssemblersElementary Occupations
577158423625473831
The NZSEI occupational status scores attributed to each of the broad occupational categorieswere calculated by Statistics New Zealand to reflect the education and income of those whopractise occupations that fall within these categories. The index assumes that a person’soccupation provides a reasonable basis on which to assign them a position on the socio-economic hierarchy. The occupations with higher scores reflect more education and income,which can be taken as a measure of socio-economic status (see Appendix C for furtherdiscussion).
In regards to parental status, 53% of the sample were currently parenting and 29% hadpreviously parented, equating to a total of 82% of respondents who had parenting experience.Eighteen percent of the sample had never parented.
16 The Armed Forces was excluded from the analysis because the sample size of the group, which was fourrespondents, was considered too small to be representative.

5
Type of physical punishment
2.1 Introduction
The survey asked people to respond to a series of four statements regarding different types ofphysical discipline of children. Before each statement the respondent was asked ‘Do you agreeor disagree with the following viewpoint?’
Q3a “A person parenting a child should be allowed, by law, to smack the child with an open handif the child is naughty.”
Q3b “A person parenting a child should be allowed, by law, to use things like a wooden spoon ora belt to punish the child if it is naughty.”
Q3c “A person parenting a child should be allowed, by law, to use something heavier like a pieceof wood or an electric cord to punish the child if the child is naughty.”
Q3d “A person parenting a child should be allowed, by law, to smack the child on the head or theneck if the child is naughty.” 17
The questions were framed around how section 59 operates currently. The parameters used inthis instance were that only a person parenting a child can use this clause as a defence andonly if they are physically punishing a child in their care for the purposes of correction. Theadjective naughty was used in all four statements to signal that the purpose of physicalpunishment was for disciplining or correcting the child’s behaviour.
The questions were also designed to typify different forms of punishment that have beenused to discipline children. The first three statements can be seen to increase in severity.Smacking with an open hand denotes less force than a closed fist or the use of an implement.
There are two questions on implements as we wanted to find out if the public perceived adifference between traditional objects used for physical punishment such as a wooden spoonor belt, and other implements that denote a more severe level of physical punishment. Thusan electric cord and the heavier adjective with wood imply other ‘non-traditional’ objects thatcould cause more pain and injury.
The fourth statement on smacking a child in the head or neck area also denotes a severe levelof physical punishment, as this is a very sensitive area of the body.
17 The four statements are identified in the graphs as Smack for Q3a; Spoon for Q3b; Wood for Q3c and Head forQ3d.

Survey on public attitudes towards the physical discipline of children____________________________________________________________
6
2.2 Findings
The total percentage of people who agreed with each statement is shown in Figure 2.1 below.
Figure 2.1 Percentage of people who agreed that each of the four types of physicaldiscipline should be legally allowable to discipline a child
The second and third statements in question three related to whether the use of implementsshould be legally allowable or not. The results clearly demonstrate that they are notconsidered acceptable, with heavier and more damaging implements drawing a response of99.3% who disagree that the use of such objects should be legally allowable. The differencebetween the two questions on implements lends weight to the idea that certain implementslike the wooden spoon or belt are more acceptable than other types of objects because theyhave cultural currency among some respondents as traditional objects used for physicalpunishment.
Analysis of responses to the following statement: “A person parenting a child should be allowed, by law, to smack the child withan open hand if the child is naughty.”
Smacking with an open hand received the highest agreement, 80%, with 18% disagreeing.18
18 The remaining 2% opted for the don’t know or prefer not to answer options.
80
0.4 1.3
15
0102030405060708090
100
Smack Spoon Wood Head
Types of physical punishment
Perc
enta
ge
Agree

Type of physical punishment____________________________________________________________
7
Similar proportions of women (81%) and men (78%) agreed that smacking with an openhand should be allowed by law. However, a significantly19 higher percentage of those in theNZ European/Other ethnic grouping (82%) agreed with the statement on smacking thanMäori (73%) or Pacific peoples (69%).
Figure 2.2 Percentage of people who agreed with the statement on smacking withan open hand, by ethnicity
With regards to parental status, Figure 2.3 clearly shows that those who have never parentedwere significantly20 less likely to agree than current or previous parents that smacking a child withan open hand for the purposes of discipline should be legally allowable. Furthermore, therewas a 10% difference21 in agreement between those who were current parents (78%) and thosewho had previously parented (88%).
19 (p<0.01)20 (p<0.01)21 (p<0.01)
8273 69
0102030405060708090
100
Euro/other Mäori Pacific P.
Ethnicity
Perc
enta
ge
Agree

Survey on public attitudes towards the physical discipline of children____________________________________________________________
8
Figure 2.3 Percentage of respondents who agreed with the statement on smackingwith an open hand, by parental status
Figure 2.4 illustrates the response to the statement by age groups, and shows the youngest agegroup is less likely to agree22 than any of the other age groups with the statement on smackingwith an open hand.
Figure 2.4 The percentage of respondents who agreed with the statement onsmacking with an open hand, by age group
22 (p<0.01)
7888
71
0102030405060708090
100
Curr. Pt Prev. Pt Never Pt
Parental Status
Perc
enta
ge
Agree
65
84 82 85 88
0102030405060708090
100
18-29yrs 30-39yrs 40-49yrs 50-59yrs 60+yrs
Age groups
Perc
enta
ge
Agree

Type of physical punishment____________________________________________________________
9
Responses according to age group broadly equate with responses according to parental status.That is, those in the younger age group of 18-29 years are more likely to have never parented(47%), and both these demographic categories were the least likely to view smacking with anopen hand as acceptable. Those in the older age groups, 50-59 years and 60 plus years, weremore likely to be previous parents (57% and 73% respectively). Current parents are mostlikely to be in the 30-39 years (78%) and 40-49 years groups (80%), although it should benoted that 44% of 18-29 year olds in the sample were currently parenting.
Figure 2.5 shows that there was no consistent pattern with regard to occupational categorieswith high or low NZSEI scores. Respondents in the Agricultural, Forestry and FisheryWorkers category had the highest level of agreement with smacking with an open hand. Thisresult was significant23 when compared to those respondents in households whose mainincome earner was in the following categories: Professional; Technicians and AssociateProfessionals; and Service and Sales Workers. Furthermore, the result was also significantwhen compared to those in the Trades and Elementary occupations.
Figure 2.5 Percentage of respondents who agreed with the statement on smackingwith an open hand, by occupational category
23 (p<0.01)
8475
8984
74 7579 82
77
0102030405060708090
100
Admin/
MgProf
.Tech
Clerks
Serv/
Sale
Agri/F
ish.
Trades
Machine
Elem.O
cc
Occupational Category
Perc
enta
ge
Agree

Survey on public attitudes towards the physical discipline of children____________________________________________________________
10
Analysis of responses to the following statement: “A person parenting a child should be allowed, by law, to use things like a woodenspoon or a belt to punish the child if it is naughty.”
The total proportion of people who agreed with this statement is 15%, which is a dramaticdrop from the 80% of respondents who agreed with the viewpoint on smacking with an openhand. The substantial majority of respondents (85%) disagreed with this statement. Thefollowing analysis looks at demographic differentiation that is statistically significant.
Similar proportions of men (16%) and women (13%) agreed with this viewpoint. Figure 2.6shows that Pacific peoples were significantly24 more likely to think that disciplining with awooden spoon or belt should be legally allowable than the other groups. This result is theopposite to the pattern expressed in the previous statement on smacking with an open hand.
Figure 2.6 Percentage of people who agreed with the statement on usingimplements such as a wooden spoon and belt, by ethnicity
In regards to parental status there was no statistically significant difference between thegroups, with 14% of the never parented and 15% of the previous parented and currently parentinggroups agreeing that disciplining with a wooden spoon or belt should be legally allowable.
The response pattern by age group to the smacking statement is not reflected in the responsesfor this statement (see Figure 2.7). Although the younger age group was the least likely toagree that disciplining with a wooden spoon or belt should be legally allowable, they share thisresult with the 50-59 year olds.
24 (p<0.01)
15 10
27
0102030405060708090
100
Euro/other Mäori Pacific P.
Ethnicity
Perc
enta
ge
Agree

Type of physical punishment____________________________________________________________
11
Figure 2.7 Percentage of people who agreed with the statement regarding the use ofimplements such as wooden spoons and belts, by age group
There was no consistent pattern with regard to occupational categories with high or lowNZSEI scores. Persons in households from the Technicians and Associate Professionalsgroup had the highest level of agreement that the use of implements such as a wooden spoonshould be legally allowable. They were more likely to agree than Service and Sales Workers,25
who had the lowest level of agreement (8%), or those in the Professionals households (12%).
Figure 2.8 Percentage of people who agreed with the statement regarding the use ofimplements such as wooden spoons and belts, by occupational category
25 (p<0.01)
1017 18
1018
0102030405060708090
100
18-29yrs 30-39yrs 40-49yrs 50-59yrs 60+yrs
Age groups
Perc
enta
ge Agree
15 1222
14 816 17 17 12
0102030405060708090
100
Admin/
MgProf
.Tech
Clerks
Serv/
Sale
Agri/F
ish.
Trades
Machine
Elem.O
cc
Occupational Category
Perc
enta
ge
Agree

Survey on public attitudes towards the physical discipline of children____________________________________________________________
12
Analysis of responses to the following statement:“A person parenting a child should be allowed, by law, to use something heavier like apiece of wood or an electric cord to punish the child if the child is naughty.”
The response to this statement was almost unanimous disagreement at 99%. The totalpercentage of people who agreed with this statement was only 0.4%. Therefore nodemographic analysis was undertaken.
Analysis of responses to the following statement:“A person parenting a child should be allowed, by law, to smack the child on the heador the neck if the child is naughty.”
The total response to this statement was again a nearly unanimous disagreement at 98%.Those in agreement totalled only 1.3%. As with the above statement, no demographicanalysis was undertaken.
2.3 Summary
The results clearly indicate the public does not consider using implements or smacking on thehead and neck area to be an acceptable form of punishment for children and should not be‘allowed by law’. However, there is a high level of support for smacking with an open handfor the purposes of discipline to be legally allowable. The demographic analysis showed that:
Gender
• There was no discernible difference between the female and male responses to thesequestions.
Ethnicity
• Those in the NZ European/Other ethnic grouping were significantly more likely to agreethat open hand smacking should be legally allowed as a form of punishment for childrenwhen compared to Mäori or Pacific peoples26.
• Pacific peoples were the least likely to agree that open hand smacking should be legallyallowed.
• Of the low percentage of people who found using implements such as wooden spoonsacceptable to discipline children, Pacific peoples were more likely27 to agree to thisstatement than NZ European/Others or Mäori.
• Mäori were the least likely to agree that using objects such as wooden spoons to physicallydiscipline children should be legally allowed.
26 (p<0.01)27 (p<0.01)

Type of physical punishment____________________________________________________________
13
Figure 2.9 Percentage of respondents who agreed with the four viewpoints on thetype of physical punishment of children that should be legally allowable,by ethnicity
Parental status
• Those who had never parented were significantly less likely28 to agree that smacking with anopen hand should be legally allowed than those who were current parents and particularlythose who were previous parents.
• Previous parents were more likely29 to agree that smacking with an open hand should belegally allowed than those who were current parents and those who had never parented.
28 (p<0.01)29 (p<0.01)
82
15
0.5
73
100 0.5
69
27
0 1.51.40
102030405060708090
100
Smack Spoon Wood Head
Type of physical punishment
Perc
enta
ge Euro/otherMaoriPacific P.
Survey on public attitudes towards the physical discipline of children____________________________________________________________
14
Figure 2.10 Percentage of respondents who agreed with each of the four types ofphysical punishment of children that should be legally allowable, byparental status
Age groups
• In response to the statement on smacking with an open hand, the youngest age group(18-29 years) are less likely to agree30 than the other age groups.
• The results of the statement on using objects such as a wooden spoon, showed theyoungest age group less likely to agree with this statement than those in the 40-49 year oldand 60 plus age groups.
30 (p<0.01)
78
15
88
15
0 0
14
0 20.70.9
71
0102030405060708090
100
Smack Spoon Wood Head
Type of physical punishment
Perc
enta
ge Curr. PtPrev. PtNever Pt

Type of physical punishment____________________________________________________________
15
Figure 2.11 Percentage of respondents who agreed with the four viewpoints on thetype of physical punishment of children that should be legally allowable,by age group
NZSEI occupational categories
• The analysis did not show any consistent differences between occupations with highNZSEI scores and those with low scores. For example persons from households in theProfessional and Elementary Occupations categories were each as likely to agree that theuse of objects such as a wooden spoon should be legally allowable (12% agreed).
65
101 2
84
17
0.4
82
18
0.7
85
100
88
18
0 1.2 1.5 0.6 0.70
102030405060708090
100
Smack Spoon Wood Head
Type of physical punishment
Perc
enta
ge
18-29yrs30-39yrs40-49yrs50-59yrs60+yrs

Survey on public attitudes towards the physical discipline of children____________________________________________________________
16

17
Severity of physical punishment
3.1 Introduction
The second section of the survey asked people about what severity of physical punishmentthey found acceptable. The respondent was asked ‘Do you think these are acceptable levelsof physical punishment for a child? Please say “yes” or “no” for each punishment read out.’Respondents were also given the choice to say they don’t know or prefer not to answer.
Q4a “A smack that leaves no mark on the child’s skin?”
Q4b “ Where it leaves a red mark that lasts a few days?”
Q4c “Where it leaves a bruise that lasts a few days?”
Q4d “Where the punishment leaves marks and bruises that last for more than a few days but doesn’t cause a permanent injury?”
Q4e “Where the punishment causes an injury that needs medical attention?” 31
The questions were modelled on an English study (Protecting Children, Supporting Parents, 1998)that formed part of a consultation document for the English government on the physicalpunishment of children. The use of section 59 as a defence largely centres around whether ajudge or jury decides the force used was reasonable in the circumstances. Circumstances varyconsiderably; therefore rather than list multiple scenarios of physically disciplining childrenfor the respondents to reply to, the questions aimed to find out what the public perceived asreasonable force in terms of the severity of the physical punishment.
3.2 Findings
The results clearly show that any physical discipline of children that causes marking, bruising,or injury to a child is not considered acceptable. The total percentages of people who agreedwith each statement are shown in Figure 3.1.
31 The five statements are identified in the graphs as No Mark for Q4a; Red Mark for Q4b; Bruise for Q4c; NoPerm. for Q4d; and Med. Attn for 4Qe.
Survey on public attitudes towards the physical discipline of children____________________________________________________________
18
Figure 3.1 Percentage of people who found each of the five levels of severity ofpunishment acceptable
Analysis of responses to the following statement:“A smack that leaves no mark on the child’s skin?”
Seventy-five percent of respondents thought that a smack that left no mark was acceptable. Incomparison slightly more agreed (80%) that smacking with an open hand should be legallyallowable. The drop in agreement may be accounted for by the different emphases of thesequestions. More agreed physical discipline should be legally allowable, whereas the emphasison injury in the question, A smack that leaves no mark on the child’s skin, may have deterred somepeople from agreeing.
Women (76% agreed) and men (75% agreed) responded similarly to this question. Those inthe NZ European/Other ethnic grouping were much more likely32 to find a smack that leavesno mark acceptable than either Mäori or Pacific peoples.
32 (p<0.01)
75
60.10.80.8
0102030405060708090
100
No mark Redmark
Bruise Noperm.
Med.Attn
Severity of injury
Perc
enta
ge
Agree
Severity of physical punishment____________________________________________________________
19
Figure 3.2 Percentage of people who thought smacking that leaves no mark wasacceptable, by ethnicity
In regards to parental status, previous parents were more likely 33 to agree that smacking thatleaves no mark is an acceptable level of punishment than current parents.34
Figure 3.3 Percentage of people who thought smacking that leaves no mark wasacceptable, by parental status
33 (p<0.01)34 There was no statistically significant difference between previous parents and those who had never parented.
79
6151
0102030405060708090
100
Euro/other Mäori Pacific P.
Ethnicity
Perc
enta
ge
Accept.
7381
74
0102030405060708090
100
Curr. Pt Prev. Pt Never Pt
Parental Status
Perc
enta
ge
Accept.

Survey on public attitudes towards the physical discipline of children____________________________________________________________
20
Figure 3.4 illustrates the response to the statement by age groups. The results show theyoungest age group is less likely to agree35 than all the other age groups, with the exception ofthe 30-39 year olds, where the statistical significance is at the 95% confidence level.
Figure 3.4 Percentage of people who thought smacking that leaves no mark wasacceptable, by age group
The analysis showed that respondents in households in the Agricultural and Fishery Workerscategory had the highest percentage of acceptance (87%). Those in the Service and Saleworkers category had the lowest score (66%). It is interesting to note that those in theProfessionals households have the same response as those respondents from ElementaryOccupations households (72%). These results mirror the pattern for the question regardingthe use of objects such as wooden spoons for physically disciplining children. This responsereinforces the proposition that there are no discernible patterns among occupationalcategories with high or low NZSEI scores. This suggests that education and income levels donot influence attitudes towards the physical discipline of children.
35 (p<0.01)
65
78 7680 82
0
10
20
30
40
50
60
70
80
90
100
18-29yrs 30-39yrs 40-49yrs 50-59yrs 60+yrs
Age groups
Perc
enta
ge
Agree

Severity of physical punishment____________________________________________________________
21
Figure 3.5 Percentage of people who thought smacking that leaves no mark wasacceptable, by occupational category
Analysis of responses to the following statements:
“ Where it leaves a red mark that lasts a few days?”
“Where it leaves a bruise that lasts a few days?”
“Where the punishment leaves marks and bruises that last for more than a few daysbut doesn’t cause a permanent injury?”
“Where the punishment causes an injury that needs medical attention?”
The response to all of these statements was a resounding ‘no’, indicating that these levels ofphysical punishment are unacceptable to the vast majority of New Zealanders. Notably lessthan 1% of people opted for the don’t know or prefer not to answer options. As would beexpected, the low level of acceptance decreased with the severity of injury. Six percentindicated that a red mark that lasts a few days was acceptable, compared with 0.1% whothought that physical punishment that resulted in medical attention being required wasacceptable. Therefore, no demographic analysis was undertaken.
7671 73 77
66
8779 78
71
0102030405060708090
100
Admin/
MgProf
.Tech
Clerks
Serv/
Sale
Agri/F
ish.
Trades
Machine
Elem. O
cc
Occupational Category
Perc
enta
ge
Accept

Survey on public attitudes towards the physical discipline of children____________________________________________________________
22
3.3 Summary
This series of questions aimed to find out the public’s attitudes towards the severity ofphysical punishment of children. The results clearly indicate that only smacking that leavesno mark is acceptable to the majority of people (75%). Ninety-four percent of peoplethought smacking that leaves a red mark that lasts a few days was unacceptable. Less than1% of people thought that physical punishment that left bruises or required medical attentionwas an acceptable form of physical punishment for a child.
Demographic analyses of the question on smacking that leaves no mark showed:
• Women and men responded similarly to this question.• Those in the NZ European/Other ethnic grouping (79%) were significantly36 more likely
to find this an acceptable level of punishment than Mäori (61%) or Pacific peoples (51%).• Respondents who had previously parented children were significantly37 more likely to
view this as an acceptable form of physical discipline than those that were currentlyparenting.
• Those in the 18-29 age group were less likely than the 30-39 year olds, and less likely38
than those 40 and above to find smacking that leaves no mark acceptable.• There were no differences in response according to a respondent’s socio-economic status.
36 (p<0.01)37 (p<0.01)38 (p<0.01)

23
Ages of children
4.1 Introduction
The third section of the survey asked people about which age groups of children they foundacceptable to physically punish. The respondent was asked ‘Are there any age groups thatpeople should not be allowed to punish physically? Please give your answer for each ofthese.’ Before each question the respondent was asked ‘Do you think it is acceptable orunacceptable to physically punish a child aged . . .?’ Respondents were also given the choiceto say they don’t know or prefer not to answer.
Q5a “Do you think it is acceptable or unacceptable to physically punish a child aged under two years?
Q5b “. . . aged two to five years?’
Q5c “. . . aged six to ten years?”
Q5d “. . . aged eleven to fourteen years?’
Q5c “. . . aged fifteen to seventeen years?”
This set of questions aimed to find out public attitudes towards physically punishing childrenfrom different age groups. There is some existing research on attitudes to and the practice ofphysical discipline towards children of different ages, and these survey results will becompared with New Zealand and international studies in the conclusion.
4.2 Findings
The results showed that the physical discipline of children is more accepted for the 2-5 (62%)and 6-10 year olds (72%) followed by the 11-14 year olds (43%). The physical discipline of15-17 year olds was the least accepted (16%), which suggests the majority of people think thatthis age group is too old for physical discipline. Nearly a quarter (23%) of respondentsthought it was acceptable to physically discipline children aged under two years old.
The total percentages of people who agreed with each statement are shown in Figure 4.1. Itshould be noted that for all these questions on ages of children, less than 1.5% of therespondents chose the don’t know or prefer not to answer options.

Survey on public attitudes towards the physical discipline of children____________________________________________________________
24
Figure 4.1 Percentage of people who thought it acceptable to physically disciplineeach of the five age groups
Gender
Women thought it more acceptable39 than men to physically punish a child under two years ofage. Conversely men were more likely40 than women to find it acceptable to physically punish6-10 and 11-14 year olds.
Figure 4.2 Percentage of people who agreed that it is acceptable to physicallypunish children in each of the age groups, by gender
39 (p<0.01)
23
62
72
43
16
0
10
20
30
40
50
60
70
80
90
100
Under two 2-5 yrs 6-10 yrs 11-14 yrs 15-17 yrs
Age groups
Perc
enta
ge
Accept
26
64 67
35
1419
60
76
51
18
0102030405060708090
100
Undertwo
2-5 yrs 6-10 yrs 11-14 yrs 15-17 yrs
Children's age groups
Perc
enta
ge
FemaleMale

Ages of children____________________________________________________________
25
Ethnicity
Under two years
In regards to ethnicity, those in the NZ European/Other ethnic grouping were approximatelytwice as likely41 as Mäori and Pacific peoples to indicate that it is acceptable to physicallydiscipline children under two years old.
Two to five years
NZ European/Other respondents were much more likely42 than Mäori and Pacific peoples tofind it acceptable to physically punish children aged 2-5 years. The results showed thatpersons in the NZ European/Other category were more than twice as likely as Pacificpeoples to view this as acceptable.
Six to ten years
The NZ European/Other ethnic grouping were also more likely43 to view it as acceptable tophysically discipline 6-10 year olds than Mäori or Pacific peoples.
Eleven to fourteen years
There were minimal differences among ethnic groups with regard to the acceptability ofphysically disciplining 11-14 year olds.
Fifteen to seventeen years
The previous response pattern with regard to children aged 10 and under is reversed forchildren aged 15-17 years old. Pacific peoples (30%) were twice as likely44 to find thisacceptable as those in the NZ European/Other ethnic grouping (14%).
The results suggest that there are different perceptions among ethnic groups about the ages itis appropriate to physically discipline children.
40 (p<0.01)41 (p<0.01)42 (p<0.01)43 (p<0.01)44 (p<0.01)

Survey on public attitudes towards the physical discipline of children____________________________________________________________
26
Figure 4.3 Percentage of people who agreed that it is acceptable to physicallypunish children in each of the age groups, by ethnicity
Parental status
In terms of parental status, current parents (26%) are more likely to find physical discipline ofchildren under two acceptable than previous parents (19%) or those that have never parented(17%). Analyses of the responses regarding the other age groups showed that there were nosignificant differences.
Figure 4.4 Percentage of people who agreed it is acceptable to physically punishchildren in each of the age groups, by parental status
25
6674
43
1412
44
61
41
2113
31
59
46
30
0102030405060708090
100
Under two 2-5 yrs 6-10 yrs 11-14 yrs 15-17 yrs
Children's age groups
Perc
enta
ge Euro/otherMaoriPacific P.
26
6169
41
1619
64
75
43
1517
62
73
46
19
0102030405060708090
100
Under two 2-5 yrs 6-10 yrs 11-14 yrs 15-17 yrs
Children's age groups
Perc
enta
ge Curr. Pt.Prev. Pt.Never Pt.

Ages of children____________________________________________________________
27
Analysis of age of child by age of respondents
Under two years
The results showed some differentiation between the age group of respondents. Thoserespondents in the 40-49 year old group had the highest percentage (31%) of respondentswho agreed. They were much more likely45 to find this acceptable in comparison to the 18-29year olds and 50-59 year olds; and were more likely to agree than those who are 60+ years.
The youngest age group (18-29 years) had the lowest percentage (17%) of respondents whoagreed. They were less likely than the 30-39 year olds and 40-49 year olds46 to agree physicalpunishment of under two year olds was acceptable.
Two to five years
In regards to the 2-5 year olds the 18-29 year old respondents were less likely47 to findphysical punishment acceptable than those in the age groups 30-59 years. They were alsosignificantly less likely to agree than those aged 60 plus years.
Six to ten and eleven to fourteen years
There were no significant differences in responses by age group when asked the acceptabilityof physically disciplining children in the 6-10 and 11-14 age groups.
Fifteen to seventeen years
The 40-49 year olds had the highest acceptance (21%) of the physical punishment of 15-17year olds. This was significant48 compared with the 60 plus age group who had the lowestpercentage (12%) of respondents who viewed this as acceptable. Figure 3.5 below comparesthe responses by the age groups of respondents.
45 (p<0.01)46 (p<0.01)47 (p<0.01) significant for both the 30-39 year olds (26% agreed) and 40-49 year olds (31% agreed)48 (p<0.01)

Survey on public attitudes towards the physical discipline of children____________________________________________________________
28
Figure 4.5 Percentage of people who agreed it was acceptable to physically punishchildren in each of the age groups, by respondents age groups
NZSEI occupational categories
Under two years
People in Elementary occupations were less likely to think that it was acceptable to physicallypunish under two year olds than persons in households whose main income earner was in thePlant and Machinery Operators, and Agriculture and Fishery workers categories.
Two to five years
Those in the Agriculture and Fishery workers category had the highest percentage (73%) ofrespondents who thought it was acceptable to physically punish children aged 2-5 years. Thiswas significant when compared to Service and Sale workers49 (51%) and Professionalscategory (60%) and Trades workers (59%).
Furthermore, those in the Sales and Service workers category had the lowest percentage ofrespondents who agreed. This group were less likely to find physical discipline of childrenacceptable than those in Plant and Machine Operators and Assemblers category (65%) andLegislators, Administrators and Managers (65%). Interestingly, the Professionals andElementary Occupations category had the same response (60%).
49 (p<0.01)
0
10
20
30
40
50
60
70
80
90
100
Under Two 2-5 years 6-10 years 11-14 years 15-17 years
Age groups
Perc
enta
ge
18-29yrs
30-39yrs
40-49yrs
50-59yrs
60+yrs

Ages of children____________________________________________________________
29
Six to ten years
Persons in Agriculture and Fishery workers were significantly more likely to find it acceptableto physically discipline 6-10 year olds than Professionals and Service and Sale workerscategories50 and Technicians and Associate Professionals. Sales and Service workers are alsoless likely51 to agree than Legislators, Administrators and Managers.
Eleven to fourteen years
Those respondents in the Trades category (51%) were more likely to find the physicaldiscipline of 11-14 years olds acceptable than Professionals (37%) and Technicians andAssociate Professionals (38%).
Fifteen to seventeen years
There were no significant differences among the NZSEI occupational categories for this agegroup.
These findings, including the similarity in response to some of the questions from those inthe Professional and Elementary occupations, suggests there is no discernible difference inattitudes between those that could be classified in terms of higher and lower socio-economicgroupings.
4.3 Summary
This section examined public attitudes towards the physical disciplining of children ofdifferent age groups. The analysis found that on the whole the public does not perceive it asacceptable to physically discipline older children aged 15-17 years, nor was there majoritysupport for disciplining 11-14 year olds. Only a quarter of respondents thought it acceptableto physically discipline children under two years of age. However, nearly three-quarters of therespondents thought it acceptable to physically punish 6-10 year old children. This wasfollowed by children aged 2-5 years, where over half the sample thought this was acceptable.
The demographic analysis showed that:
• Women were more likely52 than men to view physical discipline of children under two asacceptable. Conversely men thought it more acceptable53 than women did to physicallydiscipline 6-10 and 11-14 year olds.
• Those in the NZ European/Other ethnic grouping thought it more acceptable54 thanMäori or Pacific peoples to physically discipline children aged 0-10 years.
50 (p<0.01)51 (p<0.01)52 (p<0.01)53 (p<0.01)

Survey on public attitudes towards the physical discipline of children____________________________________________________________
30
• Pacific peoples were more likely55 to view it as acceptable to discipline older children aged15-17 years than NZ European/Other.
• There were no significant differences between Mäori and Pacific peoples responses.• Current parents are more likely to find physical discipline of children under two as
acceptable than previous parents or those that have never parented.• There is no consistent pattern in attitudes by age group of respondents.• The 18-29 year olds had a significantly lower acceptance of physical discipline of children
aged under two and 2-5 year years old.• The 40-49 year olds had a significantly higher acceptance of physical discipline of children
aged under two and those aged fifteen to seventeen.• The results for occupational categories showed that there are no significant patterns to
differentiate respondents with occupations from higher NZSEI scores from those withlower scores.
54 (p<0.01)55 (p<0.01)

31
Discussion
The objective of this survey was to examine public attitudes towards the physical discipline ofchildren to inform ongoing policy work on section 59 of the Crimes Act 1961. The surveyquestions were grouped into three different aspects of physical discipline, namely: type ofpunishment; physical severity of punishment; and the age groups of children for which it isacceptable/unacceptable to physically punish. These questions sought to find out if the publicfind it acceptable to physically discipline children and, if so, what they consider acceptablephysical punishment for the purposes of correction.
The results showed that 80% of the public agreed that a person parenting a child should beallowed by law to smack them with an open hand if they are naughty. The use of objects tosmack a child and smacking them in the head and neck area drew an overwhelmingly negativeresponse from the public, indicating that only using an open hand was acceptable to mostpeople.
The questions on severity of punishment ranged from a smack that left no mark through tophysical punishment that required medical attention. The responses indicated that only asmack that left no mark was acceptable to the majority of people (75%). Physical force thatleft a red mark or bruising that lasts for a few days, marks and bruising that last for more thana few days and injuries that require medical attention were found to be definitely notacceptable by almost everyone.
In regards to the questions on the age groups of children, the results indicate that mostrespondents view punishing very young and older children as unacceptable. Respondentsfound it the least acceptable (16%) to physically discipline the oldest age group, those aged15-17 years. The response was also low for children under two years (23%). However, themajority of respondents viewed it as acceptable to physically punish 6-10 year olds (72%) and2-5 year olds (62%). The result for the 11-14 year olds was 43% acceptance. Thus levels ofacceptance formed a bell shaped pattern where it was found to be least acceptable tophysically punish the youngest and oldest age groups. This possibly reflects attitudes towardsthe maturity of the child in terms of physicality and intellectual development.
The issue of what should be legally allowable for parents in regards to physically discipliningtheir children and the physical consequences for the child can be examined by comparing twoof the survey questions. They are, the question on the acceptability of smacking that does notleave a mark compared with the question regarding the legality of parents smacking with anopen hand for the purposes of discipline. The results demonstrated that while the responsepattern was similar, there was an almost consistent slight drop in agreement to the statementon smacking that leaves no mark across demographic variables. It is suggested that thedifferent emphases of these two questions, legality and injury, could account for this.

Survey on public attitudes towards the physical discipline of children____________________________________________________________
32
The comparison of the question on smacking with an open hand (80% agreement) with theother questions on the severity of punishment illustrates what degree of force most peoplemean when they think of smacking with an open hand. The majority of people do notperceive it as acceptable to give a smack with such force as to cause red marks (94%unacceptable), bruises or any form of injury that requires medical attention (99.9%unacceptable).
New Zealand Studies – attitudes towards smacking
There have been several studies done in New Zealand on attitudes to and the practice ofphysical punishment of children. The results of this survey can only be tentatively comparedto some of the findings in these studies as different questions and methodologies were used.A question that has been compared over time across six studies asks respondents howstrongly they agree with the following statement:
There are certain circumstances when it is alright for a parent to smack a child.
In New Zealand, Jane Ritchie asked this question in 1981 as part of a wider study on familyviolence. In that study, 89% of respondents agreed with this statement. The question wasagain asked in 1993 when the Office of the Commissioner for Children commissioned astudy, Physical Punishment in the Home in New Zealand (Maxwell 1993). The study involved atelephone survey of 1,000 adults. At that time the response to this statement was 87% agreed(Maxwell 1993, p.6).
The Department of Child, Youth and Family (CYF) has asked this question in variousmonitors since 1995 and as part of the evaluation of their Alternatives to Smacking Campaign. Arecent evaluation of this public education campaign was conducted in May 2000. Thisinvolved a survey conducted with face-to-face interviews with 610 respondents. The surveyfound that 56% of respondents agreed that there were certain circumstances when it was allright to smack a child.
The following table summaries the agreement response to this question across most of thesestudies.

Discussion____________________________________________________________
33
Table 5.1 Percentage of people who agreed with the statement:There are certain circumstances when it is alright for a parent to smack a child
Year % thatagreed
Commissioning agency and study
1981 89% Jane Ritchie study1993 87% Office of the Commissioner for Children – Physical Punishment in the Home in New
Zealand1995 69% CYF – first survey in the Breaking the Cycle child abuse monitor series conducted in
June 19951998 57% CYF – benchmark survey conducted just prior to the Alternatives to Smacking
campaign in June 19981998 52% CYF - evaluation survey conducted after the Alternatives to Smacking television
advertisements in November 19982000 56% CYF – evaluation survey conducted after re-run of Alternatives to Smacking
television advertisements in May 2000
England - Office for National Statistics Omnibus Survey 1998
In England, the Department of Health included questions in the Office for National StatisticsOmnibus Survey (April 1998) to find out people’s views on the physical discipline ofchildren.56 A random probability sample of approximately 2,000 adults was interviewed. Thekey findings relevant to the current study are:
• 88% of respondents agreed that it is sometimes necessary to smack a naughty child.• 9% of respondents agreed that it is sometimes necessary to use things like canes, sticks,
belts or slippers to punish a naughty child.• 60% considered physical punishment that leaves no mark at all to be reasonable from the
options presented. 36% would not specify any level of punishment as reasonable.• Nearly all respondents considered punishment that leaves a red mark or bruising to be
unreasonable (96% and over 99% respectively).• There were no significant differences in the views on smacking held by men and women
or by parents in different age groups.• 13% agreed that parents should be allowed, by law, to smack a naughty child who is less
than two years old.• 53% agreed that parents should be allowed, by law, to smack a naughty child who is over
two years old.• 85% agreed that parents should be allowed, by law, to smack a naughty child who is over
five years old.
It should be restated that it is problematic comparing two studies with differentmethodologies and questions and in this case different countries. However, the results fromthe English study showed similar patterns to the present study in regards to the acceptabilityof the type and severity of punishment and the age groups of children. The majority agreedthat parents should legally be allowed to smack their children for the purposes of discipline.Over 90% did not think it was acceptable to apply physical discipline with an object or to use
56 See Protecting Children, Supporting Parents – A Consultation Document on the Physical Punishment of Children for furtherdiscussion.

Survey on public attitudes towards the physical discipline of children____________________________________________________________
34
such force as to leave red marks or bruises (96% and over 99% respectively found thisunreasonable).
Proportionally fewer respondents (13%) in the English study agreed that Parents should beallowed, by law, to smack a naughty child who is less than two years old. The present survey askedrespondents Do you think it is acceptable or unacceptable to physically punish a child aged under two years?to which 23% responded this was acceptable. The other questions on ages of children in theEnglish study were asked without specified age brackets. However, the higher rate ofacceptance for children over two and over five years does reflect the pattern in the presentsurvey.
Demographic analysis
Gender
The response from women and men was very similar for the questions on type and severityof punishment. The significant differences were in regards to the age groups of children.Women (26%) found it more acceptable57 than men (19%) to physically punish children lessthan two years. In regards to the physical discipline of 6-10 and 11-14 year olds, men (76%and 51% respectively) found this more acceptable58 than women (67% and 35% respectively).
The Office of the Commissioner for Children report, Physical Punishment in the Home in NewZealand (Maxwell 1993), asks questions on the acceptability of physical punishment of teenagechildren. A comparable finding was that twice as many men as women accepted ‘hittingteenagers’ in certain circumstances. The term teenagers was not defined by age brackets in the1993 study. However it can be seen that in the present study men still find it more acceptablethan women to physically discipline 11-14 year olds. In the present survey men and womendo not significantly differ in their response to physically punishing 15 -17 year old children.
The following table compares the results from the present survey with the 1993 study. Bothstudies were telephone surveys of 1000 adults.
Table 5.2 Comparison of results (percentage) from 1993 and 2001 regardingacceptability of physically disciplining teenagers, by gender
Study Question % of Malerespondentsacceptable
% of Femalerespondentsacceptable
1993 Mother hit teenage son 34% 16%1993 Mother hit teenage daughter 30% 16%1993 Father hit teenage son 28% 15%1993 Father hit teenage daughter 14% 8%2001 Physically punish 11-14 year olds 51% 35%2001 Physically punish 15-17 year olds 18% 14%
57 (p<0.01)58 (p<0.01)

Discussion____________________________________________________________
35
Interestingly, Maxwell compares the results of the 1993 study with that of Jane Ritchie’s studyin 1981, and concludes that from that time there has been a change in the attitudes of bothwomen and men towards hitting (and thrashing) teenagers, with a decrease in acceptability.
Ethnicity
Those of the NZ European/Other ethnic grouping generally viewed it as more acceptablethan either Mäori or Pacific peoples to physically discipline children. In most of the resultsPacific peoples had the lowest acceptance response closely followed by Mäori. An exceptionwas, of the low percentage of people who found using implements such as wooden spoonsacceptable to discipline children, Pacific peoples (27%) were more likely to agree to thisviewpoint than NZ European/Others (15%) or Mäori (10%).
The other exception was Pacific peoples also found it more acceptable59 than the othergroups to discipline their children aged 15-17 years. Mäori also had a higher acceptance thanNZ European/Other of physically disciplining the eldest age group, whereas the NZEuropean/Other ethnic grouping was more likely60 to find it acceptable to physically punishchildren under 2 years; 2-5 year; and 6-10 years. There were no significant differencesbetween ethnic groups regarding the physical discipline of 11-14 year olds.
These results suggest that there may be different cultural perspectives on what is a suitableage range to physically discipline children. NZ European/Other respondents thought itmuch more acceptable to smack children under ten years (particularly those aged 2-10 years)than Mäori or Pacific peoples. Conversely, Pacific peoples and Mäori find it more acceptableto physically punish children that are aged 15-17 years. This area would benefit from furtherresearch.
The Office of the Commissioner for Children report, Physical Punishment in the Home in NewZealand (Maxwell 1993), did not find any evidence ‘to support the notion of major culturaldifferences in the use of physical punishment among the main ethnic groups living in NewZealand’ (Maxwell 1993, p.7). In regards to respondents’ attitudes, the current study showsmore acceptance that physical discipline should be allowed by law among the NZEuropean/Other ethnic grouping than either Mäori or Pacific peoples.
The CYF evaluation of their Alternatives to Smacking Campaign (May 2000) found that NewZealand Europeans had the highest level of agreement followed by Mäori and Pacific peoplesto the statement: There are certain circumstances when it is alright for a parent to smack a child. TheCYF (2000) study noted there has been a downward trend in agreement by both Mäori andPacific peoples to this statement as measured against their previous monitors (studies).
The reported attitudes of Mäori and Pacific peoples tends to challenge perceptions that theymay have a higher tolerance of harsh physical discipline in comparison to the rest of thepopulation.
59 (p<0.01)60 (p<0.01)
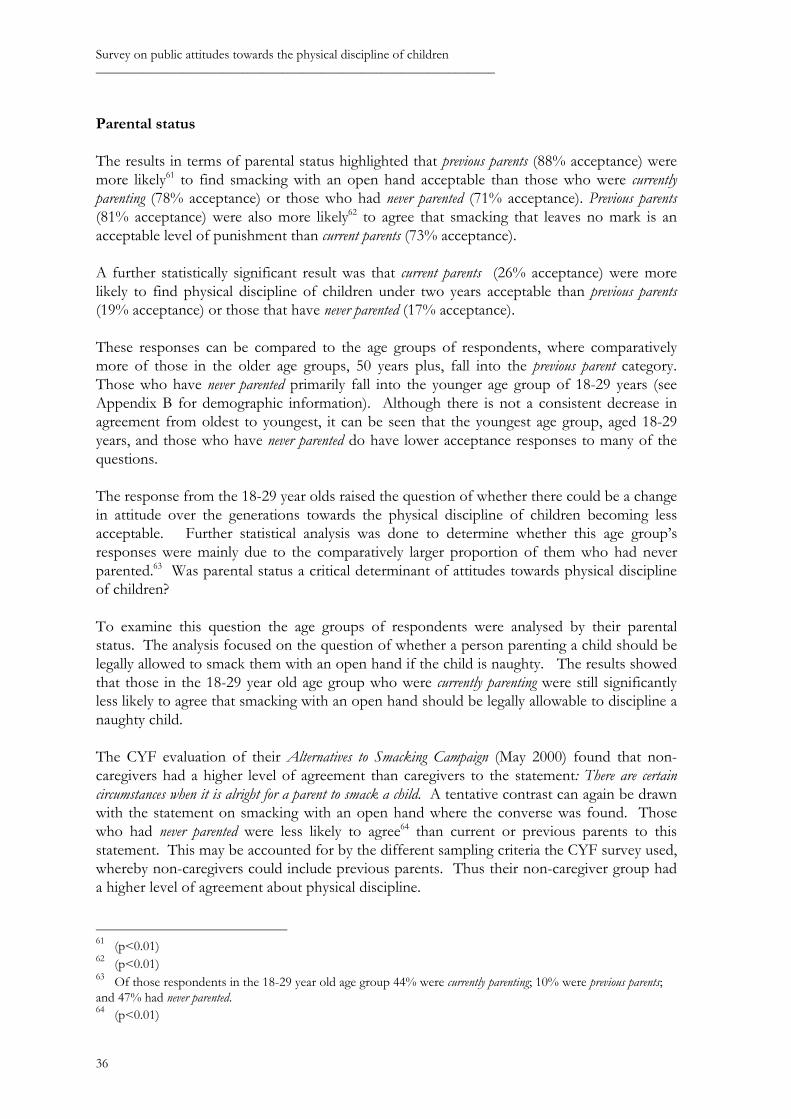
Survey on public attitudes towards the physical discipline of children____________________________________________________________
36
Parental status
The results in terms of parental status highlighted that previous parents (88% acceptance) weremore likely61 to find smacking with an open hand acceptable than those who were currentlyparenting (78% acceptance) or those who had never parented (71% acceptance). Previous parents(81% acceptance) were also more likely62 to agree that smacking that leaves no mark is anacceptable level of punishment than current parents (73% acceptance).
A further statistically significant result was that current parents (26% acceptance) were morelikely to find physical discipline of children under two years acceptable than previous parents(19% acceptance) or those that have never parented (17% acceptance).
These responses can be compared to the age groups of respondents, where comparativelymore of those in the older age groups, 50 years plus, fall into the previous parent category.Those who have never parented primarily fall into the younger age group of 18-29 years (seeAppendix B for demographic information). Although there is not a consistent decrease inagreement from oldest to youngest, it can be seen that the youngest age group, aged 18-29years, and those who have never parented do have lower acceptance responses to many of thequestions.
The response from the 18-29 year olds raised the question of whether there could be a changein attitude over the generations towards the physical discipline of children becoming lessacceptable. Further statistical analysis was done to determine whether this age group’sresponses were mainly due to the comparatively larger proportion of them who had neverparented.63 Was parental status a critical determinant of attitudes towards physical disciplineof children?
To examine this question the age groups of respondents were analysed by their parentalstatus. The analysis focused on the question of whether a person parenting a child should belegally allowed to smack them with an open hand if the child is naughty. The results showedthat those in the 18-29 year old age group who were currently parenting were still significantlyless likely to agree that smacking with an open hand should be legally allowable to discipline anaughty child.
The CYF evaluation of their Alternatives to Smacking Campaign (May 2000) found that non-caregivers had a higher level of agreement than caregivers to the statement: There are certaincircumstances when it is alright for a parent to smack a child. A tentative contrast can again be drawnwith the statement on smacking with an open hand where the converse was found. Thosewho had never parented were less likely to agree64 than current or previous parents to thisstatement. This may be accounted for by the different sampling criteria the CYF survey used,whereby non-caregivers could include previous parents. Thus their non-caregiver group hada higher level of agreement about physical discipline.
61 (p<0.01)62 (p<0.01)63 Of those respondents in the 18-29 year old age group 44% were currently parenting; 10% were previous parents;and 47% had never parented.64 (p<0.01)

Discussion____________________________________________________________
37
Age groups
As stated, there was generally a lower acceptance level of physical discipline among theyoungest age bracket (18-29 year olds) compared to the other age groups. The statisticalanalysis on parental status of age groups discussed above suggests that the 18-29 year oldsresponse is not attributable to the fact that a larger proportion of this group has neverparented. It has been suggested that this indicates a trend that younger people may be findingit less acceptable to physically discipline children.
There was not a consistent drop in agreement from oldest to youngest. Indeed for some ofthe results the 50-59 years and 60+ years had relatively low acceptance compared to themiddle groups. Those who were 60+ had the lowest acceptance of physically punishingchildren aged 15-17 years.
An interesting result was that those aged 40-49 years had the highest acceptance response tophysically discipline children under two years and those aged 15-17 years. This was significantin comparison to some of the other age brackets. In regards to parental status 80% of the 40-49 year olds were current parents; 13% previous parents and only 7% had never parented. There wasno significant difference for this result between 40-49 year olds and 30-39 year olds, who alsohad a higher proportion of current parents (78%).
New Zealand Socio-economic index occupational categories
There was no discernible difference between respondents with different socio-economicstatus reflected by occupational categories with higher or lower NZSEI scores. This indicatesthat there was no difference in attitudes between people with different educational levels andincome capacity towards the physical discipline of children.
This is in contrast to the 1993 Office of the Commissioner for Children report, PhysicalPunishment in the Home in New Zealand survey which found that those who were more highlyeducated were the least likely to endorse physical punishment.
This survey contributes towards an investigation of public perceptions of what is currentlyacceptable parenting practice in terms of physically disciplining children. The respondentsexpressed a strong desire to retain the legal right for parents to physically discipline theirchildren for the purposes of correction. However, there was an even stronger belief that thisphysical discipline should not be applied with implements or to the head and neck area, norshould it be of such force to leave marks and bruises. A consideration for the maturity andphysicality of a child was also reflected in the results where there was not much support forthe physical discipline of older teenage children, or those children under the age of two years.

Survey on public attitudes towards the physical discipline of children____________________________________________________________
38

39
References
Colmar Brunton Research. August 1998. Final Benchmark Quantitative Report: Findings ofResearch into “Smacking”, prepared for Child, Young Persons and Their Families Service.
Colmar Brunton Research. May 2000. Alternatives to Smacking Campaign: Findings of QuantitativeResearch Final Report 4/9/00, prepared for Department of Child, Youth and Family.
Davis, P., McLeod, K., Ransom, M., Ongley, P. 1997. The New Zealand SocioeconomicIndex of Occupational Status (NZSEI): Research Report #2. Statistics New Zealand,Wellington.
Maxwell, G.M. September 1993. Physical Punishment in the Home in New Zealand, prepared forOffice of the Commissioner for Children.
Protecting Children, Supporting Parents – A Consultation Document on the Physical Punishment ofChildren. 1998. Department of Health, United Kingdom.

Survey on public attitudes towards the physical discipline of children____________________________________________________________
40

41
Appendix A: Sample description
The proposed sample was 1000 adults aged 18 years and over, including a proposed minimumsample of 100 Mäori and 100 Pacific peoples.
Table A.1 The demographic variables, gender, ethnicity and age, that were used forcalculating the weighting of the sample based on the New Zealand 1996Census
Demographicvariable
Unweighted Sample Weighted Sample PopulationCensus
1996Number % Number % %
GenderFemale 625 62.5 519 52 51Male 375 37.5 481 48 49
EthnicityNZ European/Other 767 77 840 84 85Mäori 139 14 117 12 12Pacific peoples 94 9 43 4 4
Age18-29 years 166 17 246 25 2530-39 years 232 23 219 22 2240-49 years 219 22 189 19 1950-59 years 167 17 132 13 1360 plus years 213 21 211 21 21

Survey on public attitudes towards the physical discipline of children____________________________________________________________
42
Table A.2 Sample description of the demographic variables, parental status andNZSEI occupational category
Demographic variable Unweighted Sample Weighted SampleNumber % Number %
Parental StatusCurrently parenting 568 57 525 53Previously parented 305 31 294 29Never parented 127 13 181 18
NZSEI Occupational CategoryLegislators, Administrators and Managers 115 12 117 12Professionals 158 16 155 16Technicians and Associate Prof. 98 10 99 10Clerks 80 8 72 7Service and Sales Workers 98 10 95 10Agriculture and Fishery Workers 116 12 124 12Trades Workers 128 13 135 14Plant and Machine Operators and Assemblers 99 10 94 9Elementary Occupations 89 9 90 9

43
Appendix B: Additional demographicinformation
Figure B.1 Percentage of the age groups of the respondents for each parental status
Figure B.2 Percentage of the ethnic groupings of the respondents for each parentalstatus
78 80
137
53
23
3544
29
73
57
61018
4816
47
0102030405060708090
100
18-29yrs 30-39yrs 40-49yrs 50-59yrs 60+yrs Total
Age groups
Perc
enta
ge Curr ParentPre ParentNever Par
49
66
78
32
17 1319 17
9
0102030405060708090
100
Euro/other Mäori Pacific P.
Ethnicity
Perc
enta
ge Curr PtPrev Pt.Never Pt.

Survey on public attitudes towards the physical discipline of children____________________________________________________________
44
Figure B.3 Percentage of the ethnic groupings of the respondents for each agegroup
22
38 36
2127 25
19 17 1714 10 10
24
9 9
0102030405060708090
100
Euro/other Mäori Pacific P.
Ethnicity
Perc
enta
ge
18-29yrs30-39yrs40-49yrs50-59yrs60+yrs

45
Appendix C: Research and samplingmethodology
Questionnaire Development
• The questionnaire was developed by the Ministry of Justice and the Ministries of SocialPolicy and Youth Affairs and the Department of Child Youth and Family were consulted.A market research company, National Research Bureau Ltd (NRB) prepared a version ofthe questionnaire that was phrased and set out for interviewing. NRB tested thequestionnaire, in a cognitive pilot.
Cognitive Pilot
• This step pre-tested the questionnaire for semantic clarity and comprehension. Theprocedure for doing this was to administer the questionnaire to a sample of the targetpeople(s), and then to cycle back over the words used, asking what came to mind andwhat the person thought each question was referring to. This answers the questions:
� Are they comfortable with the words?� Do they correctly interpret them?� Do different people interpret the questions the same way?
• The pilot sub-sample was based on personal interviews with:
6 Pacific Island People6 Mäori People6 Asian People6 European People
24 TOTAL PRETEST PARTICIPANTS
• Twelve were men and twelve were women. A spread of ages was obtained. All have, orhave previously had care of children.
Telephone Survey
• NRB conducted the telephone survey in June 2001. The following outlines the surveymethodology and data analysis. NRB supplied the Ministry with the data in table formatthat was further analysed and written up as the present report.

Survey on public attitudes towards the physical discipline of children____________________________________________________________
46
Sampling
• The sample frame was all households with a (landline) phone as defined within the mostrecent white page update of the telephone directory.
• In order to re-include people who may not have a listing (missed the publication orwithheld number) a version of random digit dialling was used. This means that arandomly chosen phone number was drawn on the basis of every xth number of every ythpage, and then a "1" is added to that number to randomize it, yet within the range ofactive numbers assigned to the residential sector. (This is the Waksberg Adaption forRDD).
• Sampling proceeded by drawing both urban and rural numbers, to the populationproportions from Census 1996.
• The Mäori sample of 100 minimum emerged naturally as Mäori adults are over 12% ofthe population. However, any shortfall in participation was made up by continuing tosample numbers and determining ethnicity before interviewing.
• The Pacific People minimum of 100 is roughly twice their population proportion foradults. In this case sampling and screening proceeds as before, but this activity wasfocussed in areas where the Census shows Pacific People to be more prevalent.
Respondent Selection
• The adult aged 18 plus years with the "last birthday" was chosen from all adults normallyresident there.
Interviewing and Call Pattern
• Interviews took place on weekday evenings and on weekends, and were administered overthe phone by NRB interviewers.
• The call pattern consisted of an initial call, then two further calls at different times ondifferent days to attempt contact, and a fourth call where the respondent is willing to givean appointment time when successfully contacted on the third call.
Response Rate Ethnicity Match
• Interviewing is typically conducted in English. However, New Zealand now containsresidents who were either not originally schooled in English as one of their languages orwho tend to participate more readily when interacting with an ethnicity matchedinterviewer.
• NRB's team was briefed to try to identify the ethnicity/language background of thoserespondents who are either struggling with the questions and/or who appear to have a

Appendix C: Research and sampling methodology____________________________________________________________
47
different ethnicity/language as a possible source of difficulty. The phone numbers forthese were retained with whatever identifying details were obtained, in order that theycould be called back by an interviewer with matching ethnicity or language skill.
Analysis and Tabulation
• The data was entered into a survey analysis package, The Survey System (TSS), beingconcurrently edited for range and logic. At this point post-stratification or "weighting" isapplied to rebalance for any differences between the age/gender/ethnicity mix of theachieved sample, and that of the adult population as determined by the 1996 Census.
• Cross tabulations were prepared to show the findings in total, and by age, gender,ethnicity, parent responsibility and socio-economic status determined by NZSEIoccupational categories.
Quality Control Features
• NRB observes best practise at each step of the survey. The following quality controlsillustrate.
i) The questionnaire was cognitively pretested on the main ethnicity target groups.ii) Each NRB interviewer was personally briefed and instructed, face to face, by the
NRB Supervisor.iii) Sophisticated RDD sampling was used to provide the best achievable sample
frame.iv) Callbacks were made on 10% of each interviewer's work to ensure quality
administration of the questionnaire.v) Range and logic checks were run on the data as it is entered.
Privacy of Information and Ethics
• This was achieved by capturing data into electronic form, where each data record containscoded answers but does not contain the name of the respondent, nor the phone number.Thus, the survey data is "anonymised".
• The original questionnaire forms are held securely for a brief period to allow audit, andare then security shredded.
• Informed consent is not practised in relation to sample phone polls. This is becausepeople are giving opinion data about a public issue, rather than personal data aboutthemselves. The equivalent process of "informed consent" in phoned opinion surveyshowever is the "refused option", ie. each respondent may refuse any question they are notcomfortable with, or terminate the interview.

Survey on public attitudes towards the physical discipline of children____________________________________________________________
48
Identification of ethnicity
• People were asked to identify which ethnic groups they belonged too using the StatisticsNew Zealand criteria. The selection of a respondent’s primary ethnicity, where theyspecified more than one ethnic group, for the purposes of coding followed the followingcriteria:
� was coded as Mäori, where Mäori was one of the ethnic groups given� was coded as Pacific person, where Pacific ethnicity was given and another which was
not Mäori� was coded as NZ European/Other where one or more ethnic groups were given that
were neither Mäori or Pacific peoples.
Identification of socio-economic status
• To obtain information on respondents’ socio-economic status the New Zealand Socio-economic Index of Occupational Status (NZSEI) (Davis et al. 1997) developed byStatistics New Zealand was used. The use of occupation as an indicator of socio-economic status is:
premised on a model of the stratification system in which occupation functions as a latent,intermediate variable converting education into income, measuring “the potential of an occupation toconvert a person’s main resource (education) into a person’s main reward (income) (Kunst andMackenback, 1994, p.38 cited in Davis, McLeod, Ransom and Ongley 1997, p.39).
• The NZSEI assumes that a person’s occupation provides a reasonable basis on which toassign them a position on the socio-eocnomic hierarchy.
• Different occupations are allocated scores on a socio-economic index by computing aweighted sum of the average education and income levels observed for their currentpractice (Davis, et. al. 1997, p.39). The range of scores run from 10-90, for consistencywith the International Socio-economic Index. The higher scores represent highereducation and income levels and therefore higher socio-economic status. For a fulldiscussion regarding the development of the NZSEI see The New Zealand Socio-economicIndex of Occupational Status Research Report #2 (Davis et al. 1997).
• Respondents were asked to state the occupation of the main income earner in thehousehold. The occupation was classified at the three digit level (minor group) on theNZSEI, which is based on occupational data from the 1991 Census and the NZSCO90.These groupings were further classified to a two digit code (major group), grouping theoccupations into ten major groups.
• Occupations at the major group level are presented in the survey findings, with theexception of the Armed Forces, where the sample size was considered too small.

Survey on public attitudes towards the physical discipline of children____________________________________________________________
49
Appendix D: Sampling errors
Table D.1 95% confidence limits for various rates and sample sizesEstimatedprevalence
95% confidence limits
(%) n=50 n=100 n=150 n=200 n=500 n=1,000
10 1.7 – 18.3 4.1 – 15.9 5.2 – 14.8 5.8 – 14.2 7.4 - 12.6 8.1 – 11.9
50 36.1 – 63.9 40.2 – 59.8 42.0 – 58.0 43.1 – 56.9 45.6 – 54.4 46.9 – 53.1
80 68.9 – 91.1 72.2 – 87.8 73.6 – 86.4 74.5 – 85.5 76.5 – 83.5 77.5 – 82.5
Table D.2 99% confidence limits for various rates and sample sizesEstimatedprevalence
99% confidence limits
(%) n=50 n=100 n=150 n=200 n=500 n=1,000
10 0.0 – 20.9 2.3 – 17.7 3.7 – 16.3 4.5 – 15.5 6.5 – 13.5 7.6 – 12.4
50 31.8 – 68.2 37.1 – 62.9 39.5 – 60.5 40.9 – 59.1 44.2 – 55.8 45.9 – 54.1
80 65.4 – 94.6 69.7 – 90.3 71.6 – 88.4 72.7 – 87.3 75.4 – 84.6 76.7 – 83.3

50

Appendix E: Questionnaire01/108 June 2001
NRBNRBNRBNRB
PHYSICAL DISCIPLINE OF CHILDREN STUDYQUESTIONNAIRE
CONTACT AN ADULT, AFTER CHECKING THAT THIS IS A HOME, NOT A BUSINESS.
"Good morning/afternoon/evening. I am Xxx Yyy from NRB, the research company. We are talking to 1000 people, allover New Zealand to ask their opinion on the physical discipline of children.
May I ask if the people in your house are Mäori, Pacific Island, or Chinese? "
YES- ASK WHICH "Would you like someone who is ____________ [state] to phone you, or are you happy for meto do the interview? (RECORD SPECIFIC ETHNICITY ON SAMPLE SHEET FORETHNICITY CALLBACK)
NO –PROCEED
"The person we choose is the one aged 18 years or older, who had the last birthday. Can you put me on to that person?We need only 8 to 9 minutes for the interview. If they are away, or its not convenient now, I can call back. " (OBTAINSUITABLE CALL BACK TIME IF NEED BE)
Q.1 "Firstly, do you take part in the parenting of a child?" [CIRCLE ONE]
Yes - 1 No - 2
Q.2 "Did you do so in the past?" [CIRCLE ONE]
Yes-1 No-2
Q.3 "I'll read out a number of viewpoints on the physical discipline of children. Please tell me for eachone whether you agree or disagree with that viewpoint."[READ OUT, THEN CIRCLE REPLY. USE "HELP BOXES" TO RESOLVE QUERIES]
a) "A person parenting a child should be allowed, by law, to smack the child with an open hand if the child isnaughty." [CIRCLE ONE]
Agree/Yes ………………………….…... 1]
Disagree/No/Never ……………….….… 2
Don’t Know/No Idea …………….…….. 3
Prefer not to answer ……………………. 4
Go to Q3 GO TO Q2
INCLUDES FOSTER PARENT, GRANDPARENT, ELDER SIBLING, RELATIVE, ETCEXCLUDES CRECHE WORKER, TEACHER, PRE SCHOOL OR BOARDING PROVIDER, ETC.
INCLUDES: IF JUSTIFIED,VERY RARELY, ONLY FORITS OWN GOOD BUT NOTHARD, IF NOTHING ELSEWORKS, ONLY CERTAINKINDS OF KIDS,DEPENDING,ETC.
51

52
2
b) "A person parenting a child should be allowed, by law to use things like a wooden spoon or a belt to punish thechild if it is naughty."
Agree/Yes ……………………..1 ]
Disagree /No/Never ……………2
Don't Know /No /Never ……….3
Prefer not to answer ……………4
c) "A person parenting a child should be allowed, by law,electric cord to punish the child if the child is naughty.
Agree/Yes …………………….…1 ]
Disagree /No/Never ……………..2
Don't Know /No /Never ………..3
Prefer not to answer …………….4
d) "A person parenting a child should be allowed, by law,naughty."
Agree/Yes ……………………….1]
Disagree /No/Never …………….2
Don't Know /No /Never …………3
Prefer not to answer ……………..4
Q.4 " Do you think these are acceptable levels of physical por "no" for each punishment as I read it out." [PROMP
a) "A smack that leaves no mark on the child's skin ?"
Yes/Acceptable ………………………………... 1
No/Unacceptable ……………………….……… 2
Don’t know/Can’t say ………………………..... 3
Prefer not to answer…………………………… 4
INCLUDES: IF JUSTIFIED,VERY RARELY, ONLY FORITS OWN GOOD BUT NOTHARD, IF NOTHING ELSEWORKS, ONLY CERTAINKINDS OF KIDS,DEPENDING,ETC.
to use something heavier like a piece of wood or an"
to smack the child on the head or neck if the child is
unishment for a child? Please say "yes"T: "Is that acceptable or unacceptable?"]
INCLUDES: IF JUSTIFIED,VERY RARELY, ONLY FORITS OWN GOOD BUT NOTHARD, IF NOTHING ELSEWORKS, ONLY CERTAINKINDS OF KIDS,DEPENDING,ETC
INCLUDES: IF JUSTIFIED,VERY RARELY, ONLY FORITS OWN GOOD BUT NOTHARD, IF NOTHING ELSEWORKS, ONLY CERTAINKINDS OF KIDS,DEPENDING,ETC

53
3
b) "Where it leaves a red mark that lasts a few days?"
Yes/Acceptable ………………………………... 1
No/Unacceptable ……………………….……… 2
Don’t know/Can’t say ………………………..... 3
Prefer not to answer…………………………… 4
c) "Where it leaves a bruise that lasts a few days?"
Yes/Acceptable ………………………………... 1
No/Unacceptable ……………………….……… 2
Don’t know/Can’t say ………………………..... 3
Prefer not to answer…………………………… 4
d) "Where the punishment leaves marks and bruises that last for more than a few days but doesn't cause apermanent injury?"
Yes/Acceptable ………………………………... 1
No/Unacceptable ……………………….……… 2
Don’t know/Can’t say ………………………..... 3
Prefer not to answer…………………………… 4
e) "Where the punishment causes an injury that needs medical attention?"
Yes/Acceptable ………………………………... 1
No/Unacceptable ……………………….……… 2
Don’t know/Can’t say ………………………..... 3
Prefer not to answer…………………………… 4

54
4
Q.5 "Are there any age groups that people should not be allowed to punish physically? Please giveyour answer for each of these." [CIRCLE ONE IN EACH CATEGORY]
a) "Do you think it is acceptable or unacceptable to physically punish a child aged under two years?"
Yes/Acceptable ………………………………... 1
No/Unacceptable ……………………….……… 2
Don’t know …………………………………..... 3
Can’t Say ……………………………………… 4
b) "Do you think it is acceptable or unacceptable to physically punish a child aged two to five years?"
Yes/Acceptable ………………………………... 1
No/Unacceptable ……………………….……… 2
Don’t know …………………………………..... 3
Can’t Say ……………………………………… 4
c) "Do you think it is acceptable or unacceptable to physically punish a child aged six to ten years?"
Yes/Acceptable ………………………………... 1
No/Unacceptable ……………………….……… 2
Don’t know …………………………………..... 3
Can’t Say ……………………………………… 4
d) "Do you think it is acceptable or unacceptable to physically punish a child aged eleven to fourteen years?"
Yes/Acceptable ………………………………... 1
No/Unacceptable ……………………….……… 2
Don’t know …………………………………..... 3
Can’t Say ……………………………………… 4

5
d) "Do you think it is acceptable or unacceptable to physically punish a child aged fifteen to seventeen years?"
Yes/Acceptable …………………………. 1
No/Unacceptable ……………………….. 2
Don’t know ………………………..……. 3
Can’t say ………………………………... 4
Q.6 "I'll read out some age groups. Would you please say "stop" when I get to the one thatyou fit into." [READ OUT AND CIRCLE REPLY]
“18 to 29 years” ……………….…………1
"30 to 39 years” ………………………….2
"40 to 49 years?” ………………………...3
"50 to 59 years?” …………………………4
“60 to 69 years” ………………………….5
“70 years or over”…………………………6
Q.7 "What is the occupation of the main income earner in thepossible." (PROBE FOR SPECIFIC
_____________________________________________________
[IF RETIRED OR BENEFICIARY ASK WHAT THE OCCUPATBENEFIT ]
Q.8 RECORD GENDER W ITHOUT ASKING: Fe
Q.9 "Which ethnic group do you belong to? Please state whic[READ OUT AND CIRCLE ONE OR MORE ].
"European or NZ European" ……………………1
"Mäori" …………………………………………2
"Samoan" ………………………………………..3
“Tongan” ……………………………..…………4
"Cook Island Mäori" …………………………...5
“Nuiean”…………………………….…………. 6
"Chinese” ……………………………………….7
“Indian” …………………………………...…… 8
“Or another that I haven’t mentioned”
[WRITE IN] _________________________________
DO NOT READ OUT:Prefer not to answer - 7
55
household? Please be as specific asWORK AND LEVEL]
_____________________________________
ION WAS BEFORE RETIRING/ GOING ON
male - 1 Male - 2
h group or groups apply to you."

56
6
Q.10 CIRCLE AREA OF INTERVIEW
Northland - 01 Wairarapa -10
Auckland - 02 Wellington - 11
Waikato, King Country, Thames - 03 Nelson - 12
Bay of Plenty - 04 West Coast - 13
Gisborne - 05 Blenheim - 14
Hawkes Bay - 06 Christchurch - 15
Taranaki - 07 Oamaru/Timaru -16
Wanganui - 08 Dunedin - 17
Manawatu - 09 Invercargill - 18
CLOSE INTERVIEW; "Thank you for giving your views on this survey. We appreciate your taking part. May I haveyour initials or name so that my Supervisor can audit this interview?"
RECORD CONTACT NAME OR INITIALS: __________________________________________________
RECORD PHONE NUMBER HERE: __________________________________________________
--------------------------------------------------------------------------------------------------------------------------------------CERTIFICATION: I hereby certify that this is a true and accurate record of an Interview conducted by me at the time and place specified. TICK WHEN CHECKED:
Interview Sign: _______________________________ Date: __________________________
Supervisor Sign: _____________________________ Field Check: _____________________