Survey on Impact of use of Digital Media on Voting...
20
Report on findings of Survey on Impact of use of Digital Media on Voting Behavior Among First Time Voters Submitted to Submitted on 24 th October, 2013 Submitted by Marketing & Development Research Associates 34-B, Community Centre, Saket, New Delhi-110 017 Phone: +91-11-26522255, 26522244, 26856429 Fax: 26968282 Email: [email protected]; Web: www.mdraonline.com
-
Upload
truongthuan -
Category
Documents
-
view
218 -
download
4
Transcript of Survey on Impact of use of Digital Media on Voting...

Report on findings of
Survey on Impact of use of Digital Media on
Voting Behavior Among First Time Voters
Submitted to
Submitted on
24th October, 2013
Submitted by
Marketing & Development Research Associates 34-B, Community Centre, Saket, New Delhi-110 017
Phone: +91-11-26522255, 26522244, 26856429 Fax: 26968282 Email: [email protected]; Web: www.mdraonline.com

CONTENT
Page No. 1.1 Overall survey findings ..............................................................................................................................1
2.1 Opinion about mostly using digital/social media for...................................................................................4
2.2 Decision influenced by digital marketing/communication ..........................................................................5
2.3 Mostly used digital media for tracking political developments in India.......................................................6
2.4 Opinions about following digital campaigns of political parties ..................................................................7
2.5 Opinion about political party digital strategy would focus..........................................................................8
2.6 Mostly visible political party in digital/social media ...................................................................................9
2.7 Political parties digitally interactive .........................................................................................................10
2.8 Opinion about digital platform for political communication .....................................................................11
2.9 Opinion about posting/commenting to political leader on any digital platform ........................................12
2.10 Opinion about getting response on posted question to political leader on any digital platform ................13
2.11 Opinion about following political leaders on social media........................................................................14
2.12 Opinion about following number of political leaders on social media.......................................................15
3.1 City wise sample size achieved ................................................................................................................16
3.2 Gender wise sample size achieved...........................................................................................................17
3.3 Caste wise sample size achieved..............................................................................................................17
3.4 Occupation wise sample size achieved.....................................................................................................18
3.5 Education wise sample size achieved.......................................................................................................18

Survey on Impact of use of Digital Media on Voting Behavior
Marketing & Development Research Associates 24th October, 2013 1
CHAPTER 1
OVERALL SURVEY FINDINGS This chapter details out findings of the survey on an overall basis, i.e. on the basis of entire sample
achieved (1010), cutting across cities, demographic profile, etc.
1.1 Overall survey findings
B1. What do you primarily use digital, including social media, for?
S. No Purpose Rank 1 Entertainment 1 2 Networking 2 3 News and analysis 3 4 Exchange of views 4 5 Follow political developments 5 6 Interact with lawmakers/political leaders 6
B2. Are any of your decisions influenced by digital marketing/communication?
S. No Response % 1 Yes, I tend to take reviews and opinions expressed online seriously 46.3 2 No, I base my decisions on my research/opinion 53.7
B3. What digital media do you use to keep track of political developments in India?
S. No Factor Rank 1 Online news content 2 2 Blogs 3 3 Facebook 1 4 Twitter 4 5 Emails 5 6 Other 6
[Others include SMS]
B4. Are you following digital campaigns of political parties?
S. No Response % 1 Yes, regularly 24.9 2 Sometimes 69.6 3 Not at all 5.5
B5. What would you like political parties’ digital strategy to focus on?
S. No Response % 1 National issues 35.6 2 Local issues 48.3 3 Candidates’ quality 16.0

Survey on Impact of use of Digital Media on Voting Behavior
Marketing & Development Research Associates 24th October, 2013 2
B6. Which party, according to you, is most visible digitally?
S. No Response % 1 Congress 22.7 2 BJP 64.2 3 AAP 4.0 4 Others 9.2 5 BSP 0.0 6 CPI 0.2 7 CPI (M) 0.3 8 TMC 2.7 9 Others 5.4
B7. Which parties do you find digitally interactive? [MULTIPLE RESPONSE POSSIBLE]
S. No Response % 1 Congress 74.0 2 BJP 89.6 3 AAP 21.6 4 SP 5.2 5 BSP 2.3 6 CPI 4.5 7 CPI (M) 4.6 8 TMC 7.7 9 Others 9.7
B8. Which digital platform do you find the easiest for political communication?
S. No Response % 1 SMS 19.4 2 Facebook 66.5 3 Twitter 3.4 4 Blogs 4.2 5 Email 4.6 6 Recorded phone calls 2.0
B9. Have you ever posted a question or a comment to a political leader on Facebook or twitter or any other digital
platform?
S. No Response % 1 Yes 58.8 2 No 41.2
B9a. If Yes, did you get a response? [ASKED ONLY AMONG THOSE WHO RESPONDED “YES” TO PREVIOUS QUESTION.]
S. No Response % 1 Yes 64.3 2 No 35.7

Survey on Impact of use of Digital Media on Voting Behavior
Marketing & Development Research Associates 24th October, 2013 3
B10. Are you following political leaders on social media?
S. No Response % 1 Yes 45.2 2 No 54.8
B10a. If Yes, how many? [ASKED ONLY AMONG THOSE WHO RESPONDED “YES” TO PREVIOUS QUESTION.]
S. No Response Mean 1 Average following political leaders 2.40

Survey on Impact of use of Digital Media on Voting Behavior
Marketing & Development Research Associates 24th October, 2013 4
CHAPTER 2
DDEETTAAIILLEEDD FFIINNDDIINNGGSS
2.1 Opinion about mostly using digital/social media for
Table 2.1: Opinion about mostly using digital/social media for
B1. What do you primarily use digital, including social media, for? [PLEASE RANK YOUR PURPOSE IN THAT ORDER. ASSIGN RANK “1” TO THE PURPOSE FOR WHICH YOU USE DIGITAL MEDIUM THE MOST, RANK “2” TO THE NEXT AND SO ON.]
Ranking
S. N.
City
Ente
rtai
nmen
t
Net
wor
king
New
s and
ana
lysis
Exch
ange
of v
iew
s
Follo
w p
oliti
cal
deve
lopm
ents
Inte
ract
with
la
wm
aker
s/po
litic
al
lead
ers
All respondents 1 2 3 4 5 6 Male 1 2 3 4 5 6
Gender Female 1 2 3 4 5 6 General 1 2 3 4 5 6 OBC 1 2 3 4 5 6 SC 1 1 3 4 5 6
Caste
ST 1 2 3 4 5 6 Housewife 1 2 3 4 5 6 Employee – Govt. 2 2 1 4 5 6 Employee – Pvt. Sector 1 2 3 4 5 6 Business/Self Employee/Professional 1 2 3 4 5 6 Student 1 2 3 4 5 6
Respondent’s Occupation
Unemployed 1 2 3 4 6 5 Below HSC/SSC 2 1 2 4 5 6 HSC/SSC 1 2 3 4 5 6 Graduate/PG – General 1 2 3 4 5 6
Respondent’s Education
Graduate/PG – Professional 1 2 3 5 6 4 Delhi 3 2 1 4 5 6 Jaipur 1 2 3 4 5 6 Lucknow 4 1 2 3 5 6 Mumbai 1 2 3 4 5 6 Bhopal 1 2 3 6 5 4 Ahmedabad 3 1 2 4 5 6 Kolkata 2 1 4 3 5 6 Bhubaneshwar 1 3 2 4 5 6 Patna 1 2 3 4 5 6 Bangalore 1 2 3 4 5 6 Chennai 1 2 3 6 5 4
City
Hyderabad 1 2 3 4 6 5

Survey on Impact of use of Digital Media on Voting Behavior
Marketing & Development Research Associates 24th October, 2013 5
2.2 Decision influenced by digital marketing/communication
Table 2.2: Decision influenced by digital marketing/communication
(All figures in percent)
B2. Are any of your decisions influenced by digital marketing/communication?
Response Percent
Respondent Category Yes, I tend to take reviews and opinions expressed
online seriously
No, I base my decisions on my research/opinion
All respondents 46.3 53.7 Male 47.0 53.0
Gender Female 45.7 54.3 General 46.5 53.5 OBC 46.0 54.0 SC 50.0 50.0 ST 60.0 40.0
Caste
Other 7.7 92.3 Housewife 28.0 72.0 Employee – Govt. 0.0 100.0 Employee – Pvt. Sector 57.5 42.5 Business/Self Employee/Professional 16.7 83.3 Student 47.9 52.1 Unemployed 22.7 77.3
Respondent’s Occupation
Other 0.0 0.0 Below HSC/SSC 21.4 78.6 HSC/SSC 46.3 53.7 Graduate/PG – General 43.1 56.9
Respondent’s Education
Graduate/PG – Professional 63.2 36.8 Delhi 48.9 51.1 Jaipur 58.3 41.7 Lucknow 85.0 15.0 Mumbai 42.9 57.1 Bhopal 78.8 21.3 Ahmedabad 22.5 77.5 Kolkata 45.6 54.4 Bhubaneshwar 23.8 76.3 Patna 20.7 79.3 Bangalore 65.6 34.4 Chennai 8.8 91.3
City
Hyderabad 53.0 47.0

Survey on Impact of use of Digital Media on Voting Behavior
Marketing & Development Research Associates 24th October, 2013 6
2.3 Mostly used digital media for tracking political developments in India
Table 2.3: Mostly used digital media for tracking political developments in India
B3. What digital media do you use to keep track of political developments in India? [PLEASE RANK YOUR MEDIUM OF PREFERENCE IN THAT ORDER. ASSIGN RANK “1” TO THE MEDIUM WHICH YOU USE THE MOST, RANK “2” TO THE NEXT AND SO ON.]
Ranking S. N.
City Online news content Blogs Facebook Twitter Emails Other
All respondents 2 3 1 4 5 6 Male 2 3 1 4 5 6
Gender Female 2 3 1 4 5 6 General 2 3 1 4 5 6 OBC 2 3 1 4 5 6 SC 2 4 1 5 3 6 ST 3 2 1 5 4 6
Caste
Other 1 4 2 5 2 6 Housewife 4 5 1 2 3 6 Employee – Govt. 5 1 4 2 3 6 Employee – Pvt. Sector 2 4 1 5 3 6 Business/Self Employee/Professional
2 4 1 3 5 6 Student 2 3 1 4 5 6
Respondent’s Occupation
Unemployed 1 3 2 5 4 6 Below HSC/SSC 4 3 1 2 5 6 HSC/SSC 3 2 1 4 5 6 Graduate/PG – General 2 3 1 4 5 6
Respondent’s Education
Graduate/PG – Professional 2 3 1 4 5 6
Delhi 4 2 1 3 5 6 Jaipur 2 3 1 5 4 6 Lucknow 4 3 1 2 5 6 Mumbai 3 2 1 4 5 6 Bhopal 2 3 1 4 5 6 Ahmedabad 4 2 1 3 5 6 Kolkata 2 4 1 5 3 6 Bhubaneshwar 2 4 1 5 3 6 Patna 4 5 1 3 2 6 Bangalore 4 2 1 3 5 6 Chennai 3 4 1 5 2 6
City
Hyderabad 2 5 1 4 3 6

Survey on Impact of use of Digital Media on Voting Behavior
Marketing & Development Research Associates 24th October, 2013 7
2.4 Opinions about following digital campaigns of political parties
Table 2.4: Opinions about following digital campaigns of political parties (All figures in percent)
B4. Are you following digital campaigns of political parties?
Response Percent Respondent Category
Yes, regularly Sometimes Not at all
All respondents 24.9 69.6 5.5 Male 31.3 65.3 3.4
Gender Female 18.4 73.9 7.7 General 21.0 73.1 5.9 OBC 31.4 64.4 4.2 SC 28.0 63.4 8.5 ST 33.3 66.7 0.0
Caste
Other 53.8 46.2 0.0 Housewife 12.0 64.0 24.0 Employee – Govt. 0.0 66.7 33.3 Employee – Pvt. Sector 20.0 72.5 7.5 Business/Self Employee/Professional 100.0 0.0 0.0 Student 25.0 70.1 4.9 Unemployed 25.0 70.5 4.5
Respondent’s Occupation
Other 0.0 0.0 0.0 Below HSC/SSC 42.9 42.9 14.3 HSC/SSC 19.5 71.5 8.9 Graduate/PG – General 24.3 72.5 3.1
Respondent’s Education
Graduate/PG – Professional 41.9 53.8 4.3 Delhi 2.2 88.9 8.9 Jaipur 38.1 60.7 1.2 Lucknow 16.3 83.8 0.0 Mumbai 12.1 87.9 0.0 Bhopal 51.3 48.8 0.0 Ahmedabad 5.0 87.5 7.5 Kolkata 17.8 53.3 28.9 Bhubaneshwar 16.3 78.8 5.0 Patna 34.1 61.0 4.9 Bangalore 22.2 76.7 1.1 Chennai 33.8 58.8 7.5
City
Hyderabad 53.0 47.0 0.0

Survey on Impact of use of Digital Media on Voting Behavior
Marketing & Development Research Associates 24th October, 2013 8
2.5 Opinion about political party digital strategy would focus
Table 2.5: Opinion about political party digital strategy would focus
(All figures in percent)
B5. What would you like political parties’ digital strategy to focus on?
Response Percent Respondent Category
National issues Local issues Candidates’ quality
All respondents 35.6 48.3 16.0 Male 44.2 43.5 12.3
Gender Female 27.1 53.2 19.8 General 36.0 49.3 14.7 OBC 37.2 46.7 16.1 SC 28.0 42.7 29.3 ST 33.3 60.0 6.7
Caste
Other 38.5 53.8 7.7 Housewife 40.0 40.0 20.0 Employee – Govt. 66.7 33.3 0.0 Employee – Pvt. Sector 17.5 57.5 25.0 Business/Self Employee/Professional 66.7 33.3 0.0 Student 37.2 47.5 15.2
Respondent’s Occupation
Unemployed 11.4 63.6 25.0 Below HSC/SSC 57.1 21.4 21.4 HSC/SSC 38.5 43.6 17.9 Graduate/PG – General 31.6 53.3 15.1
Respondent’s Education
Graduate/PG – Professional 41.9 44.4 13.7 Delhi 27.8 60.0 12.2 Jaipur 28.6 60.7 10.7 Lucknow 31.3 13.8 55.0 Mumbai 33.0 56.0 11.0 Bhopal 58.8 38.8 2.5 Ahmedabad 15.0 80.0 5.0 Kolkata 52.2 30.0 17.8 Bhubaneshwar 13.8 70.0 16.3 Patna 62.2 18.3 19.5 Bangalore 22.2 45.6 32.2 Chennai 40.0 50.0 10.0
City
Hyderabad 43.4 56.6 0.0

Survey on Impact of use of Digital Media on Voting Behavior
Marketing & Development Research Associates 24th October, 2013 9
2.6 Mostly visible political party in digital/social media
Table 2.6: Mostly visible political party in digital/social media
(All figures in percent)
B6. Which party, according to you, is most visible digitally?
Response Percent Respondent Category
Congress BJP AAP SP BSP CPI CPI (M) TMC Others
All respondents 22.7 64.2 4.0 0.6 0.0 0.2 0.3 2.7 5.4 Male 20.2 66.7 4.4 0.2 0.0 0.4 0.4 1.6 6.2
Gender Female 25.1 61.7 3.6 1.0 0.0 0.0 0.2 3.8 4.7 General 20.8 63.2 4.1 0.9 0.0 0.0 0.2 3.8 7.0 OBC 22.2 68.6 5.4 0.0 0.0 0.8 0.4 0.8 1.9 SC 36.6 57.3 0.0 0.0 0.0 0.0 1.2 1.2 3.7 ST 13.3 73.3 0.0 0.0 0.0 0.0 0.0 0.0 13.3
Caste
Other 46.2 53.8 0.0 0.0 0.0 0.0 0.0 0.0 0.0 Housewife 64.0 32.0 0.0 0.0 0.0 0.0 4.0 0.0 0.0 Employee – Govt. 33.3 66.7 0.0 0.0 0.0 0.0 0.0 0.0 0.0 Employee – Pvt. Sector 27.5 60.0 0.0 2.5 0.0 0.0 0.0 0.0 10.0 Business/Self Employee/Professional 16.7 50.0 0.0 16.7 0.0 0.0 0.0 0.0 16.7 Student 21.9 65.1 3.6 0.4 0.0 0.1 0.2 3.0 5.6
Respondent’s Occupation
Unemployed 11.4 68.2 18.2 0.0 0.0 2.3 0.0 0.0 0.0 Below HSC/SSC 35.7 64.3 0.0 0.0 0.0 0.0 0.0 0.0 0.0 HSC/SSC 26.3 52.0 4.9 0.8 0.0 0.0 0.5 5.7 9.8 Graduate/PG – General 20.2 71.2 3.7 0.6 0.0 0.4 0.2 1.0 2.7
Respondent’s Education
Graduate/PG – Professional 20.5 71.8 2.6 0.0 0.0 0.0 0.0 0.9 4.3 Delhi 24.4 65.6 8.9 0.0 0.0 0.0 0.0 1.1 0.0 Jaipur 22.6 75.0 2.4 0.0 0.0 0.0 0.0 0.0 0.0 Lucknow 10.0 83.8 0.0 6.3 0.0 0.0 0.0 0.0 0.0 Mumbai 18.7 74.7 1.1 0.0 0.0 0.0 0.0 0.0 5.5 Bhopal 13.8 86.3 0.0 0.0 0.0 0.0 0.0 0.0 0.0 Ahmedabad 6.3 93.8 0.0 0.0 0.0 0.0 0.0 0.0 0.0 Kolkata 22.2 42.2 5.6 0.0 0.0 0.0 1.1 28.9 0.0 Bhubaneshwar 8.8 62.5 25.0 0.0 0.0 2.5 0.0 0.0 1.3 Patna 36.6 58.5 3.7 1.2 0.0 0.0 0.0 0.0 0.0 Bangalore 41.1 57.8 1.1 0.0 0.0 0.0 0.0 0.0 0.0 Chennai 47.5 50.0 0.0 0.0 0.0 0.0 2.5 0.0 0.0
City
Hyderabad 18.1 22.9 0.0 0.0 0.0 0.0 0.0 0.0 59.0
Survey on Impact of use of Digital Media on Voting Behavior
Marketing & Development Research Associates 24th October, 2013 10
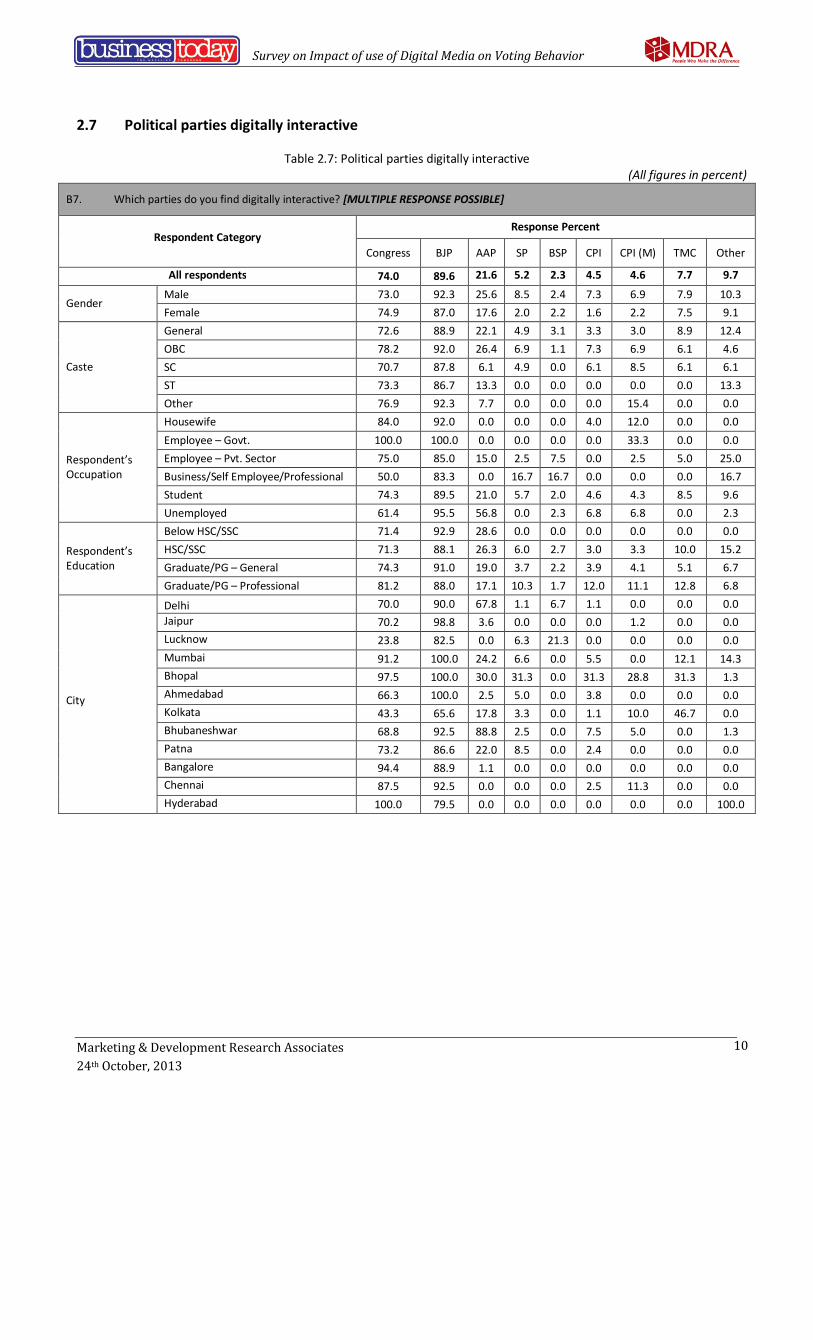
2.7 Political parties digitally interactive
Table 2.7: Political parties digitally interactive
(All figures in percent)
B7. Which parties do you find digitally interactive? [MULTIPLE RESPONSE POSSIBLE]
Response Percent Respondent Category
Congress BJP AAP SP BSP CPI CPI (M) TMC Other
All respondents 74.0 89.6 21.6 5.2 2.3 4.5 4.6 7.7 9.7
Male 73.0 92.3 25.6 8.5 2.4 7.3 6.9 7.9 10.3 Gender
Female 74.9 87.0 17.6 2.0 2.2 1.6 2.2 7.5 9.1 General 72.6 88.9 22.1 4.9 3.1 3.3 3.0 8.9 12.4 OBC 78.2 92.0 26.4 6.9 1.1 7.3 6.9 6.1 4.6 SC 70.7 87.8 6.1 4.9 0.0 6.1 8.5 6.1 6.1 ST 73.3 86.7 13.3 0.0 0.0 0.0 0.0 0.0 13.3
Caste
Other 76.9 92.3 7.7 0.0 0.0 0.0 15.4 0.0 0.0 Housewife 84.0 92.0 0.0 0.0 0.0 4.0 12.0 0.0 0.0 Employee – Govt. 100.0 100.0 0.0 0.0 0.0 0.0 33.3 0.0 0.0 Employee – Pvt. Sector 75.0 85.0 15.0 2.5 7.5 0.0 2.5 5.0 25.0 Business/Self Employee/Professional 50.0 83.3 0.0 16.7 16.7 0.0 0.0 0.0 16.7 Student 74.3 89.5 21.0 5.7 2.0 4.6 4.3 8.5 9.6
Respondent’s Occupation
Unemployed 61.4 95.5 56.8 0.0 2.3 6.8 6.8 0.0 2.3 Below HSC/SSC 71.4 92.9 28.6 0.0 0.0 0.0 0.0 0.0 0.0 HSC/SSC 71.3 88.1 26.3 6.0 2.7 3.0 3.3 10.0 15.2 Graduate/PG – General 74.3 91.0 19.0 3.7 2.2 3.9 4.1 5.1 6.7
Respondent’s Education
Graduate/PG – Professional 81.2 88.0 17.1 10.3 1.7 12.0 11.1 12.8 6.8
Delhi 70.0 90.0 67.8 1.1 6.7 1.1 0.0 0.0 0.0 Jaipur 70.2 98.8 3.6 0.0 0.0 0.0 1.2 0.0 0.0 Lucknow 23.8 82.5 0.0 6.3 21.3 0.0 0.0 0.0 0.0 Mumbai 91.2 100.0 24.2 6.6 0.0 5.5 0.0 12.1 14.3 Bhopal 97.5 100.0 30.0 31.3 0.0 31.3 28.8 31.3 1.3 Ahmedabad 66.3 100.0 2.5 5.0 0.0 3.8 0.0 0.0 0.0 Kolkata 43.3 65.6 17.8 3.3 0.0 1.1 10.0 46.7 0.0 Bhubaneshwar 68.8 92.5 88.8 2.5 0.0 7.5 5.0 0.0 1.3 Patna 73.2 86.6 22.0 8.5 0.0 2.4 0.0 0.0 0.0 Bangalore 94.4 88.9 1.1 0.0 0.0 0.0 0.0 0.0 0.0 Chennai 87.5 92.5 0.0 0.0 0.0 2.5 11.3 0.0 0.0
City
Hyderabad 100.0 79.5 0.0 0.0 0.0 0.0 0.0 0.0 100.0
Survey on Impact of use of Digital Media on Voting Behavior
Marketing & Development Research Associates 24th October, 2013 11
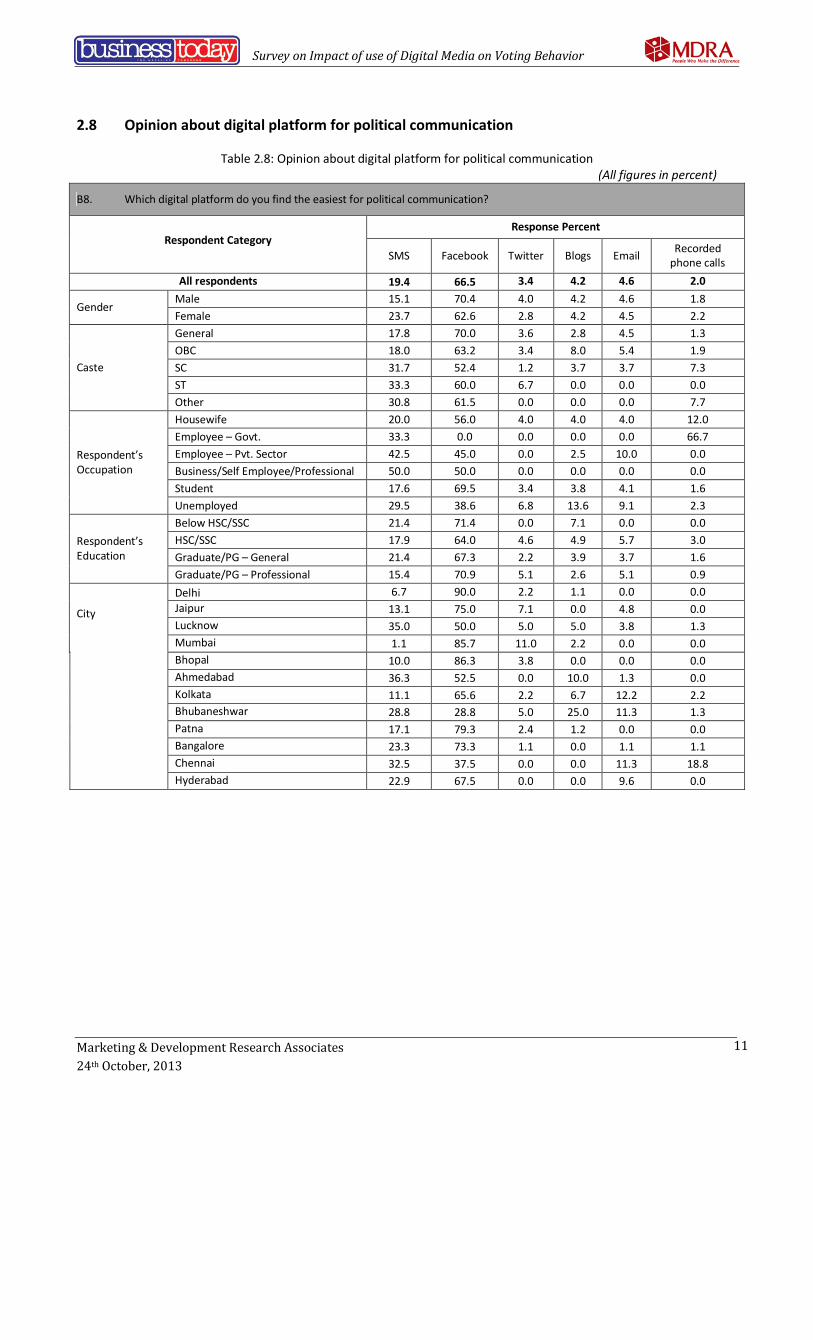
2.8 Opinion about digital platform for political communication
Table 2.8: Opinion about digital platform for political communication
(All figures in percent)
B8. Which digital platform do you find the easiest for political communication?
Response Percent Respondent Category
SMS Facebook Twitter Blogs Email Recorded phone calls
All respondents 19.4 66.5 3.4 4.2 4.6 2.0 Male 15.1 70.4 4.0 4.2 4.6 1.8
Gender Female 23.7 62.6 2.8 4.2 4.5 2.2 General 17.8 70.0 3.6 2.8 4.5 1.3 OBC 18.0 63.2 3.4 8.0 5.4 1.9 SC 31.7 52.4 1.2 3.7 3.7 7.3 ST 33.3 60.0 6.7 0.0 0.0 0.0
Caste
Other 30.8 61.5 0.0 0.0 0.0 7.7 Housewife 20.0 56.0 4.0 4.0 4.0 12.0 Employee – Govt. 33.3 0.0 0.0 0.0 0.0 66.7 Employee – Pvt. Sector 42.5 45.0 0.0 2.5 10.0 0.0 Business/Self Employee/Professional 50.0 50.0 0.0 0.0 0.0 0.0 Student 17.6 69.5 3.4 3.8 4.1 1.6
Respondent’s Occupation
Unemployed 29.5 38.6 6.8 13.6 9.1 2.3 Below HSC/SSC 21.4 71.4 0.0 7.1 0.0 0.0 HSC/SSC 17.9 64.0 4.6 4.9 5.7 3.0 Graduate/PG – General 21.4 67.3 2.2 3.9 3.7 1.6
Respondent’s Education
Graduate/PG – Professional 15.4 70.9 5.1 2.6 5.1 0.9 Delhi 6.7 90.0 2.2 1.1 0.0 0.0 Jaipur 13.1 75.0 7.1 0.0 4.8 0.0 Lucknow 35.0 50.0 5.0 5.0 3.8 1.3
City
Mumbai 1.1 85.7 11.0 2.2 0.0 0.0 Bhopal 10.0 86.3 3.8 0.0 0.0 0.0 Ahmedabad 36.3 52.5 0.0 10.0 1.3 0.0 Kolkata 11.1 65.6 2.2 6.7 12.2 2.2 Bhubaneshwar 28.8 28.8 5.0 25.0 11.3 1.3 Patna 17.1 79.3 2.4 1.2 0.0 0.0 Bangalore 23.3 73.3 1.1 0.0 1.1 1.1 Chennai 32.5 37.5 0.0 0.0 11.3 18.8 Hyderabad 22.9 67.5 0.0 0.0 9.6 0.0
Survey on Impact of use of Digital Media on Voting Behavior
Marketing & Development Research Associates 24th October, 2013 12
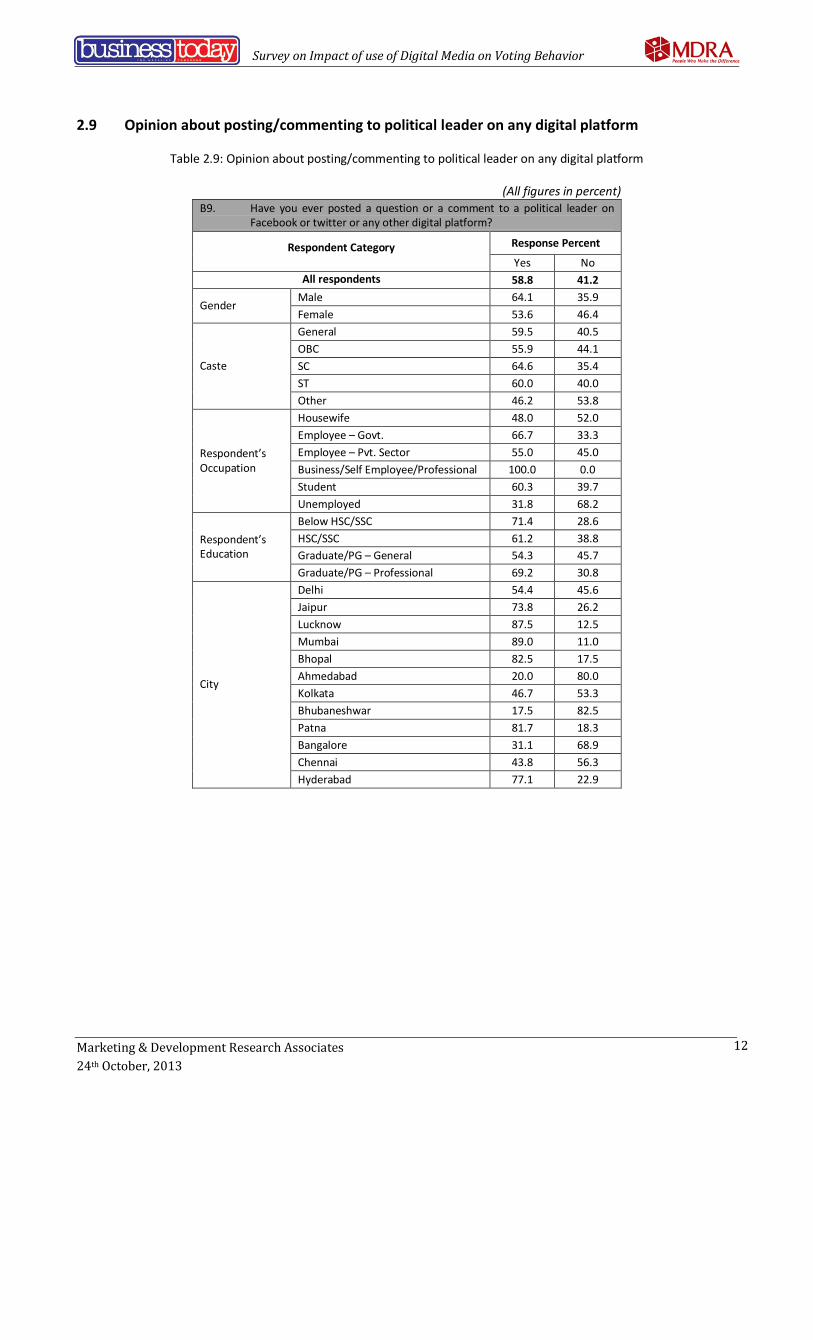
2.9 Opinion about posting/commenting to political leader on any digital platform
Table 2.9: Opinion about posting/commenting to political leader on any digital platform
(All figures in percent)
B9. Have you ever posted a question or a comment to a political leader on Facebook or twitter or any other digital platform?
Response Percent Respondent Category Yes No
All respondents 58.8 41.2 Male 64.1 35.9
Gender Female 53.6 46.4 General 59.5 40.5 OBC 55.9 44.1 SC 64.6 35.4 ST 60.0 40.0
Caste
Other 46.2 53.8 Housewife 48.0 52.0 Employee – Govt. 66.7 33.3 Employee – Pvt. Sector 55.0 45.0 Business/Self Employee/Professional 100.0 0.0 Student 60.3 39.7
Respondent’s Occupation
Unemployed 31.8 68.2 Below HSC/SSC 71.4 28.6 HSC/SSC 61.2 38.8 Graduate/PG – General 54.3 45.7
Respondent’s Education
Graduate/PG – Professional 69.2 30.8 Delhi 54.4 45.6 Jaipur 73.8 26.2 Lucknow 87.5 12.5 Mumbai 89.0 11.0 Bhopal 82.5 17.5 Ahmedabad 20.0 80.0 Kolkata 46.7 53.3 Bhubaneshwar 17.5 82.5 Patna 81.7 18.3 Bangalore 31.1 68.9 Chennai 43.8 56.3
City
Hyderabad 77.1 22.9

Survey on Impact of use of Digital Media on Voting Behavior
Marketing & Development Research Associates 24th October, 2013 13
2.10 Opinion about getting response on posted question/commented to political leader on any digital platform
Table 2.10: Opinion about getting response on posted question/commented to political leader on any
digital platform (All figures in percent)
B9a. If Yes, did you get a response?
Response Percent Respondent Category Yes No
All respondents 64.3 35.7 Male 63.2 36.8
Gender Female 65.7 34.3 General 66.6 33.4 OBC 57.5 42.5 SC 66.0 34.0 ST 77.8 22.2
Caste
Other 50.0 50.0 Housewife 16.7 83.3 Employee – Govt. 100.0 0.0 Employee – Pvt. Sector 59.1 40.9 Business/Self Employee/Professional 50.0 50.0 Student 65.8 34.2
Respondent’s Occupation
Unemployed 57.1 42.9 Below HSC/SSC 40.0 60.0 HSC/SSC 64.6 35.4 Graduate/PG – General 63.5 36.5
Respondent’s Education
Graduate/PG – Professional 69.1 30.9 Delhi 67.3 32.7 Jaipur 14.5 85.5 Lucknow 85.7 14.3 Mumbai 85.2 14.8 Bhopal 93.9 6.1 Ahmedabad 50.0 50.0 Kolkata 59.5 40.5 Bhubaneshwar 28.6 71.4 Patna 46.3 53.7 Bangalore 42.9 57.1 Chennai 37.1 62.9
City
Hyderabad 87.5 12.5

Survey on Impact of use of Digital Media on Voting Behavior
Marketing & Development Research Associates 24th October, 2013 14
2.11 Opinion about following political leaders on social media
Table 2.11: Opinion about following political leaders on social media
(All figures in percent) B10. Are you following political leaders on social media?
Response Percent Respondent Category Yes No
All respondents 45.2 54.8 Male 46.4 53.6
Gender Female 44.1 55.9 General 45.1 54.9 OBC 47.9 52.1 SC 40.2 59.8 ST 66.7 33.3
Caste
Other 7.7 92.3 Housewife 28.0 72.0 Employee – Govt. 66.7 33.3 Employee – Pvt. Sector 37.5 62.5 Business/Self Employee/Professional 83.3 16.7 Student 46.7 53.3
Respondent’s Occupation
Unemployed 25.0 75.0 Below HSC/SSC 28.6 71.4 HSC/SSC 39.6 60.4 Graduate/PG – General 45.5 54.5
Respondent’s Education
Graduate/PG – Professional 64.1 35.9 Delhi 16.7 83.3 Jaipur 27.4 72.6 Lucknow 92.5 7.5 Mumbai 75.8 24.2 Bhopal 87.5 12.5 Ahmedabad 30.0 70.0 Kolkata 35.6 64.4 Bhubaneshwar 11.3 88.8 Patna 53.7 46.3 Bangalore 54.4 45.6 Chennai 10.0 90.0
City
Hyderabad 77.1 22.9

Survey on Impact of use of Digital Media on Voting Behavior
Marketing & Development Research Associates 24th October, 2013 15
2.12 Opinion about following number of political leaders on social media
Table 2.12: Opinion about following number of political leaders on social media
(All figures in percent)
B10a. If Yes, how many?
Response Percent Respondent Category Mean
All respondents 2.40 Male 2.10
Gender Female 2.73 General 2.38 OBC 2.33 SC 3.00 ST 2.20
Caste
Other 2.00 Housewife 1.86 Employee – Govt. 2.00 Employee – Pvt. Sector 2.27 Business/Self Employee/Professional 1.80 Student 2.43
Respondent’s Occupation
Unemployed 2.45 Below HSC/SSC 2.00 HSC/SSC 2.32 Graduate/PG – General 2.34
Respondent’s Education
Graduate/PG – Professional 2.80 Delhi 3.00 Jaipur 1.61 Lucknow 3.30 Mumbai 2.43 Bhopal 3.46 Ahmedabad 1.20 Kolkata 1.56 Bhubaneshwar 1.56 Patna 1.20 Bangalore 1.37 Chennai 1.63
City
Hyderabad 2.59

Survey on Impact of use of Digital Media on Voting Behavior
Marketing & Development Research Associates 24th October, 2013 16
CHAPTER 3
METHODOLOGY AND SAMPLE SIZE
Marketing and Development Research Associates (MDRA), a premier research organization
with significant expertise and experience in opinion survey conducted the survey in the cities
given below.
3.1 City wise sample size achieved
Table 3.1: City wise total sample size
S. No City Sample Achieved Percent
1 Delhi 90 8.9
2 Jaipur 84 8.3
3 Lucknow 80 7.9
4 Mumbai 91 9.0
5 Bhopal 80 7.9
6 Ahmedabad 80 7.9
7 Kolkatta 90 8.9
8 Bhubneswar 80 7.9
9 Patna 82 8.1
10 Bangalore 90 8.9
11 Chennai 80 7.9
12 Hyderabad 83 8.2
Total 1010 100.0
The broad objective of the survey was to understand the impact of use of digital media on
voting behavior among those who intend to vote during forthcoming Lok Sabha Elections for
the very first time; it was needed to maintain stringent sampling procedures.
Mr. Abhishek Agrawal, Deputy Director, MDRA informed that a specific in-house developed
formula called “3S” has been availed for conducting this survey in view of his years of
experience. The 3 “S” stand for –
- Sample size
- Spread of the sample

Survey on Impact of use of Digital Media on Voting Behavior
Marketing & Development Research Associates 24th October, 2013 17
- Selection Criteria
This formula has been able to derive optimum results within the short time-span available for
the country-wide survey.
The respondents have been selected randomly to prevent any bias creeping into the samples.
Structured questionnaire was administered to the respondents by experienced and trained
investigators of MDRA, through face-to-face interview. This unique approach has helped in
getting a picture, which is representative of the urban male and female at large. The target
respondents were selected on the basis of two criteria i.e.
- Who have never voted
- Going to caste vote in 2014 Lok Sabha elections for the first time
The respondents were within the age group of 17 to 22 years only. However, the geographical
reach inside a particular city was carefully considered and for this purpose, the city was further
sub-divided into five zones e.g. Central, East, West, North and South. The field survey was
conducted on 22nd and 23rd October 2013 in twelve cities in the country. The sample details of
the respondents approached have been presented below.
3.2 Gender wise sample size achieved
Table 3.2: Gender wise total sample size
S. No Gender Sample Achieved Percent 1 Male 504 49.9 2 Female 506 50.1
Total 1010 100.0
3.3 Caste wise sample size achieved
Table 3.3: Caste wise total sample size
S. No Caste Sample Achieved Percent 1 General 639 63.3
2 OBC 261 25.8
3 SC 82 8.1
4 ST 15 1.5
5 Other/ Not Sure 13 1.3
Total 1010 100.0

Survey on Impact of use of Digital Media on Voting Behavior
Marketing & Development Research Associates 24th October, 2013 18
3.4 Occupation wise sample size achieved
Table 3.5: Occupation wise total sample size S. No Occupation Sample Achieved Percent
1 Housewife 25 2.5
2 Employee – Govt. 3 0.3
3 Employee – Pvt. Sector 40 4.0
4 Businessman/Self Employee/Professional 6 0.6
5 Students 892 88.3
6 Unemployed 44 4.4
Total 1010 100.0 3.5 Education wise sample size achieved
Table 3.6: Education wise total sample size
S. No Education of Respondents Sample Achieved Percent 1 Below HSC/SSC 14 1.4
2 HSC/SSC 369 36.5
3 Graduate/PG – General 510 50.5
4 Graduate/PG – Professional 117 11.6
Total 1010 100.0
3.6 Statistical Significance
Any major factors that could cause sampling errors have been controlled through appropriate
selection process. The respondents were randomly chosen. This is an adaptation of queuing
theory where randomization is built into the system. Above all, total sample size achieved was
1010 and this number is sufficiently high to ensure that over all sampling error is low.
In view of above, the confidence level is 95% with ± 3.08% error of margin.