Survey of the trans fatty acid content in processed food ...
30
MONITORING & SURVEILLANCE SERIES Survey of the trans fatty acid content in processed food products in Ireland NUTRITION
Transcript of Survey of the trans fatty acid content in processed food ...

MONITORING & SURVEILLANCE SERIES
Survey of the trans fatty acid content in processed food products in Ireland
NUTRITION


Survey of the trans fatty acid content in processed food products in Ireland
2016
MONITORING AND SURVEILLANCE SERIES NUTRITION page 1
CONTENTS
ABBREVIATIONS .......................................................................................................................... 2
EXECUTIVE SUMMARY ............................................................................................................... 3
1. PUBLIC HEALTH IMPLICATIONS OF TRANS FATTY ACIDS ....................................... 4
2. LEGISLATION RELATING TO TRANS FATTY ACIDS .................................................... 6
3. THE EUROPEAN RESPONSE TO TRANS FATTY ACIDS ............................................. 8
4. TRANS FATTY ACIDS INTAKES IN THE IRISH POPULATION .................................... 10
5. METHODS ............................................................................................................................. 11
5.1 SAMPLE DESCRIPTION, COLLECTION, AND DELIVERY..................................... 11
5.2 METHODS OF ANALYSIS ........................................................................................... 12
6. RESULTS AND DISCUSSION ............................................................................................ 13
6.1 TRANS FATTY ACIDS ................................................................................................. 13
6.2 NUTRITIONAL LABELLING AND CLAIMS ................................................................ 20
7. CONCLUSIONS .................................................................................................................... 24
8. REFERENCES ...................................................................................................................... 25

Survey of the trans fatty acid content in processed food products in Ireland
2016
MONITORING AND SURVEILLANCE SERIES NUTRITION page 2
ABBREVIATIONS
EC European Commission
EU European Union
SFAs saturated fatty acids
MUFAs monounsaturated fatty acids
PUFAs polyunsaturated fatty acids
TFAs trans fatty acids
EFSA European Food Safety Authority
FSAI Food Safety Authority of Ireland
WHO World Health Organization
CHD coronary heart disease
JRC Joint Research Centre

Survey of the trans fatty acid content in processed food products in Ireland
2016
MONITORING AND SURVEILLANCE SERIES NUTRITION page 3
EXECUTIVE SUMMARY
In December 2015, the European Commission (EC) published a report on trans fatty acids (TFAs) in
Europe, as prescribed under Regulation (EU) No 1169/2011 on the provision of food information to
consumers. This report outlines an analysis of the effectiveness of the different approaches that could be
implemented in the European Union (EU) to control TFAs and protect public health. As a standout
conclusion, the report recommends a legal limit for industrial TFA as the best way to protect public health.
In October 2016, the European Parliament called on the EC to establish an EU legal limit on industrial TFA
as soon as possible. Also in October 2016, the EC launched an inception impact assessment on its
initiative to limit industrial TFA intakes across the EU. The inception impact assessment is designed to
collect more information and inform on the practicality of future policy decisions.
In November 2017, the EC opened a public consultation on its initiative to limit industrial TFA intakes in the
EU. This public consultation is aimed at giving all stakeholders and individual citizens an opportunity to
provide their views on key elements of the EC inception impact assessment.
From an Irish perspective, two previous surveys carried out by the Food Safety Authority of Ireland (FSAI)
in 2007 and 2008 examined levels of TFA in a cross-section of processed foods (n=100) and fast foods
(n=150) (FSAI, 2008; FSAI, 2009). While both surveys concluded that the overall levels of TFA were low,
i.e. <2 g TFA per/100 g fat, there were some foods which had high levels of TFA, as also identified in other
published literature.
With the launch of the EC inception impact assessment, the FSAI wished to establish new data on levels of
TFA in processed food products available in Ireland. During June 2016 the FSAI collected 240 branded and
private label processed food products across all major supermarkets in Ireland. The samples comprised a
cross-section of products grouped into 15 product categories.
The latest FSAI survey indicates that overall levels of TFA in processed food products in Ireland are low
and continue to decrease, with 97.5% of products having ≤2% TFA as a percentage of total fat. This is an
improvement on the previous 2007 FSAI survey which also found low levels of TFA, but only in 80% of
surveyed products. The results of this survey also verify the effectiveness of industry commitments and
initiatives to reduce or exclude TFA from processed food products.
The results of this survey will enable the FSAI and the Department of Health to have an informed position
on the practicality of future policy decisions in relation to the TFA content in processed foods when the EC
completes its inception impact assessment.

Survey of the trans fatty acid content in processed food products in Ireland
2016
MONITORING AND SURVEILLANCE SERIES NUTRITION page 4
1. Public health implications of trans fatty acids
Fats are essential for health and their consumption allows the human body to store energy, absorb fat-
soluble vitamins and supply essential fatty acids (e.g. omega-3 and omega-6 fatty acids, which the human
body cannot make). However, it is important to control the overall fat intake in the diet as well as the intake
of specific fats that are less healthy than other forms of fat (FSAI, 2008).
Fatty acids in food are classified according to their number of double bonds. Saturated fatty acids (SFAs)
have no double bonds, monounsaturated fatty acids (MUFAs) have one double bond, and polyunsaturated
fatty acids (PUFAs) have two or more double bonds (EFSA, 2010). The double bonds in MUFAs and
PUFAs can have either a ‘cis’ or ‘trans’ configuration. The majority of MUFAs and PUFAs in foods have the
‘cis’ configuration.
Trans fatty acids (TFAs) are unsaturated fatty acids with at least one double bond in the ‘trans’
configuration. Regulation (EU) No 1169/2011 defines TFAs ‘as fatty acids with at least one non-conjugated,
(namely interrupted by at least one methylene group), carbon-carbon double bond in the trans
configuration’, rather than the more common ‘cis’ configuration (EFSA, 2004; EC 2011).
Based on their origin, TFAs are often grouped into either industrial/artificial TFAs or natural/ruminant TFAs.
Industrial TFAs are formed during a number of industrial processes associated with oil refining (EFSA
2004; FSAI, 2008; Bhardwaj et al. 2011), which include:
Partial hydrogenation of vegetable oils (or occasionally fish oils), which converts oils into solid fats
such as margarines. Hydrogenation involves the addition of hydrogen atoms across the
unsaturated double bonds of the particular fats. The primary reason for hydrogenating oil is to
improve its oxidative stability and increase the proportion of solid to liquid fats, which facilitates
processing (EFSA, 2004; FSAI, 2008; Bhardwaj et al., 2011).
Deodorisation of unsaturated vegetable oils (or occasionally fish oils) high in PUFAs (a necessary
step in refining)
Heating and frying of oils at high temperatures.
Natural or ruminant TFAs are formed by bio-hydrogenation, i.e. bacterial transformation of unsaturated fatty
acids during fermentation in the rumen of ruminant animals. As such, these TFAs are naturally present in
foods sourced from these animals, such as meat and dairy products. Although the same TFA isomers are
present in both industrial and natural TFA, the proportions may differ.
The ‘trans’ configuration has an effect on the functional and physiochemical properties of fatty acids, which
in turn affects their metabolism in humans (FSAI, 2008). Since TFAs have no nutritional function, no
population reference intake, average requirement, or adequate intakes are set (EFSA, 2010).
There is, however, broad scientific consensus that high intake of TFA is a risk factor for the development of
coronary heart disease (CHD) and may also be associated with increased risk of obesity and type 2
diabetes (WHO, 2009; WHO, 2015; EP, 2016).

Survey of the trans fatty acid content in processed food products in Ireland
2016
MONITORING AND SURVEILLANCE SERIES NUTRITION page 5
Prospective cohort studies show a consistent relationship between higher intakes of TFA and increased
risk of CHD (Mozaffarian et al. 2006). The evidence suggests that consumption of diets containing TFA
consistently results in increased serum low-density lipoprotein cholesterol, compared with consumption of
diets containing cis-MUFA or cis-PUFA (FSAI, 2009; EFSA, 2010). Diets containing trans-MUFA can also
result in reduced blood high-density lipoprotein cholesterol concentrations and increases in the total
cholesterol to high-density lipoprotein cholesterol ratio (EFSA, 2010).
In 2009, the World Health Organization (WHO) suggested that the intake of ruminant TFA was low enough
in most populations not to constitute a significant risk factor for CHD. The potential intake of TFA from
these foods was low, even when the total ruminant fat intake was relatively high (WHO, 2009; EP, 2016).
However, the available evidence indicates that TFA from ruminant sources has similar adverse effects on
blood lipids and lipoproteins as TFA from industrial sources, when consumed in equal amounts (EFSA,
2010; Brouwer, 2016). Essentially, three main differences are observed when TFA from ruminant sources
and TFA from industrial sources are compared:
There is a different proportion of TFA in total fat, i.e. between 2% and 7% for ruminant sources and
between <1% and >50% for industrial sources.
Generally, both sources contain the same TFA isomers but in different proportions, e.g. vaccenic
acid (18:1t11) is more prominent from ruminant sources, and elaidic acid (18:1t9) is more
prominent from industrial sources.
Positional distribution of TFA in triglycerides is different between the two sources, e.g. sn-1(3) of
18:1t11 in ruminant sources, and sn-2 of 18:1t9 in industrial sources.
The European Food Safety Authority (EFSA) concluded that intakes of TFA should be as low as possible
within the context of a nutritionally adequate diet (EFSA, 2010). The WHO European Food and Nutrition
Action Plan 2015–2020 notes that the development of policies for eliminating TFA from the European food
supply is a priority (WHO, 2014). However, in a subsequent policy brief related to its action plan the WHO
noted that despite a decrease in the average TFA intake in European countries, many people still consume
high levels of TFA that significantly increase their risk of CHD (WHO, 2015).

Survey of the trans fatty acid content in processed food products in Ireland
2016
MONITORING AND SURVEILLANCE SERIES NUTRITION page 6
2. Legislation relating to trans fatty acids
Currently, there is no harmonised EU legislation regulating the content of TFA in food. Legislative limits are
set for TFAs in infant formulae and follow-on formulae (i.e. the TFA content shall not exceed 3% of the total
fat content and the erucic acid content shall not exceed 1% of the total fat content) to allow for the use of
milk, which naturally contains ruminant TFA, as a source of fat (EC, 2006a).1
There is also no harmonised EU legislation regarding TFA labelling on foods. In relation to nutritional
labelling, Regulation (EU) No 1169/2011 on the provision of food information to consumers does not allow
manufacturers to declare the TFA content in foods on nutrition labels, even on a voluntary basis (EC, 2011;
EC, 2016).
However, the Regulation requires manufacturers to list all ingredients contained in a food product on its
label or package (EC, 2011). Thus, should a product contain partially hydrogenated oils (and therefore,
possibly TFA from industrial sources), its label will indicate this. Also, as ingredients are listed in decreasing
amounts, TFA concentrations may be higher in those products where hydrogenated oil is listed earlier in
the ingredient declaration (FSAI, 2007). The term ‘fully hydrogenated’ or ‘partially hydrogenated’, as
appropriate, must accompany the indication of hydrogenated oil, but it will not indicate the exact amount of
TFA present (EC, 2011; EP, 2016; EC, 2016).2
With regard to nutrition and health claims, Regulation (EC) No 1924/2006 does not permit claims
specifically in relation to TFA in products (EC, 2006b). However, the Regulation indicates that claims in
relation to the following and any claim likely to have the same meaning for the consumer may only
be made if:
Low in saturated fat: The sum of saturated fatty acids and TFA in the product does not exceed 1.5
g per/100 g for solids or 0.75 g per/100 ml for liquids and in either case the sum of saturated fatty
acids and TFA must not provide more than 10% of energy.
Saturated fat free: The sum of saturated fat and TFA does not exceed 0.1 g of saturated fat
per/100 g or 100 ml.
Reduced saturated fat: The sum of saturated fatty acids and TFA in the product bearing the claim
is at least 30% less than the sum of saturated fatty acids and TFA in a similar product, and if the
TFA content in the product bearing the claim is equal to or less than in a similar product.
Notwithstanding the absence of harmonised EU legislation regulating the content or labelling of TFA on
foods, some EU countries have their own national legislation or voluntary self-regulation measures.
Legislative measures limiting the content of industrial TFA to <2% of the total fat content of the food have
been adopted in Denmark (2003), Austria (2009), Hungary (2013) and Latvia (2015).
1 The Directive will be replaced in 2020 by a Commission Delegated Regulation (EU) 2016/127 which maintains the same maximum amount for TFAs, on the basis of the advice of EFSA Scientific Opinion on the essential composition of infant and follow-on formulae. (EFSA Journal, 2014; 12(7):3760). 2 It should be noted that in the United States, since June 2015, partially hydrogenated oils are no longer generally recognised as safe for use in human food. The U.S. Food and Drug Administration has requested food manufacturers to remove partially hydrogenated oils from foods by June 2018 (FDA, 2017).

Survey of the trans fatty acid content in processed food products in Ireland
2016
MONITORING AND SURVEILLANCE SERIES NUTRITION page 7
In November 2017, Romania notified the European Commission (EC) of a new national law on TFA which
makes it mandatory for all food businesses in Romania to limit the TFA content in foods to a maximum of 2
g/100 g of the total fat content. These same provisions will also apply to foods from third countries and
other member states (EC, 2017).
Outside the European Union (EU), in 2005 Canada became the first country to regulate the mandatory
labelling of TFA on pre-packaged foods and in 2006 the United States introduced the mandatory
declaration of TFA in foods containing ≥0.5 g TFA per serving. Other legislative measures limiting the
content of industrial TFA have been implemented in Iceland (2011), Switzerland (2008) and Norway (2014)
(Mouratidou et al. 2014; WHO, 2015; EC, 2016).
In 2011, Sweden passed legislation to limit the TFA content in foods. However, the legislation has yet to be
implemented (WHO, 2015). Voluntary measures to reduce TFA in foods are in place in Belgium, Estonia,
Czech Republic, Germany, France, the Netherlands, Poland, the United Kingdom and Greece. National
dietary recommendations have also been issued in Ireland, Bulgaria, Malta, Slovakia, Finland and the
United Kingdom (WHO, 2015; EC, 2016; Healthy Ireland 2016, 2017).

Survey of the trans fatty acid content in processed food products in Ireland
2016
MONITORING AND SURVEILLANCE SERIES NUTRITION page 8
3. The European response to trans fatty acids
When Regulation (EU) No 1169/11 on the provision of food information to consumers was adopted in 2011,
the European Parliament and the Council requested that the EC submit a report on the presence of TFAs
in foods and in the overall diet of the EU population. Additionally, this report was to be accompanied by
legislative proposals, if appropriate (EC, 2011). In December 2015, the EC published the requested report
(EC, 2015b). It builds on research, literature reviews and data gathered, analysed and summarised by the
Joint Research Centre (JRC) as well as consultation with EU member states and relevant stakeholders
(EC, 2015a; EC, 2015b; Mouratidou et al., 2013; Mouratidou et al., 2014).
The EC report confirms that there has been a significant reduction in TFA content in foods across the
European Union (EU), to levels <2 g TFA per/100 g of fat, i.e. the limit specified by Denmark, where
legislation to limit TFA content in foods is in place (Danish Government, 2003; EC, 2015b). However, the
report also notes that some foods such as biscuits and popcorn can have very high levels of TFA (i.e. >40
g TFA per/100 g of fat). In some European countries, TFA levels in pre-packed bakery products have not
fallen at all over the past 10 years, suggesting that certain parts of the EU, particularly Eastern Europe,
have seen little progress (EC, 2015b; EC 2015c).
In relation to dietary intakes of TFA across the European population, the EC report notes that average TFA
intakes have been decreasing across the EU to less than the WHO recommendation of <1% of daily
energy intake (WHO/FAO, 2003; EC, 2015b). However, some subpopulations (e.g. low-income earners
and people aged 18–30) are at risk of excessive TFA consumption as long as foods with high levels of TFA
are sold in the EU (EC, 2015b).
The EC report analysed the effectiveness of three different options that could be adopted across the EU to
reduce the TFA content in food, reduce population intakes and inform consumers. These options included
(EC, 2015b; EP, 2016):
Mandatory labelling of TFA
Voluntary industry agreements to decrease TFA in food at EU level
Setting legal limits for the TFA content in food.
In relation to mandatory labelling, it was concluded that there was limited information on consumer
understanding of TFAs. This suggested that the majority of EU citizens did not understand or know about
the risk TFAs posed to public health. As such, any mandatory TFA labelling on food products would make
little sense without consumer education programmes (EC, 2015; EP, 2016). Furthermore, TFA labelling
would only target prepacked foods, but not food sold loose, or food consumed outside the home. In relation
to voluntary industry agreements, their effectiveness would be limited to the level of industry participation
and the foods targeted by the agreements.

Survey of the trans fatty acid content in processed food products in Ireland
2016
MONITORING AND SURVEILLANCE SERIES NUTRITION page 9
With regard to setting legal limits for the TFA content in food, the EC report considered that future efforts to
reduce TFA levels in food should be targeted at industrial TFA. Levels of industrial TFA can be modified,
whereas TFA levels in ruminant fats are relatively stable (EP, 2016). As such, the report suggested that
setting a legal limit for industrial TFA content in foods would be the most effective measure in terms of
public health, consumer protection and compatibility with the single market (EC, 2015b). However, the
implementation of such a limit would require further investigation (Mouratidou et al., 2014).
Stakeholders have generally welcomed the EC report, while stressing that voluntary reformulation efforts
by the food industry have already reduced TFA levels in foods to relatively low levels (EP, 2016).
In October 2016, the EC launched an inception impact assessment on its initiative to limit industrial TFA
intakes across the EU. The inception impact assessment is designed to collect more information and inform
on the practicality of future policy decisions (EC, 2016).
In November 2017, the EC opened a public consultation on its initiative to limit industrial TFA intakes in the
EU; this integrates the targeted consultations with interested stakeholders and national competent
authorities already carried out by the EC to support its work on TFA. This public consultation (open from 17
November 2017 to 9 February 2018) was aimed at giving an additional possibility to all stakeholders and
individual citizens with a possible interest in TFA to provide their views on key elements of the EC inception
impact assessment.
Survey of the trans fatty acid content in processed food products in Ireland
2016
MONITORING AND SURVEILLANCE SERIES NUTRITION page 10
4. Trans fatty acids intakes in the Irish population
From an Irish perspective, two previous surveys carried out by the Food Safety Authority of Ireland (FSAI)
in 2007 and 2008 examined levels of TFA in a cross-section of retail foods (n=100) and fast foods (n=150)
(FSAI 2008; FSAI 2009). While both surveys concluded that the overall levels of TFA were low, i.e. <2 g
TFA per/100 g fat, there were some foods that had high levels of TFA (FSAI 2008; FSAI 2009). To update
knowledge on levels of TFA in Irish food, the FSAI commissioned its third and largest survey in 2016 which
examined the TFA content in 240 pre-packaged (processed food) retail products.
Recent estimates of TFA intake from the Irish diet (Kaifeng et al., 2016) show that intakes have decreased
in the decade from 2001 to 2011 and, at 0.5% of total energy, are substantially below the UK
recommendations of ≤2% contribution to food energy (SACN, 2007). The major dietary sources of TFAs in
the Irish diet are ruminant animal products such as meat, cheese and whole milk (42% contribution), with
decreases seen for foods such as ‘spreading fats and oils’ (from 5.9% to 1.4% intakes) between 2001 and
2011 (Kaifeng et al., 2016). This is significant, as it suggests that commercial foods containing industrial
TFA are either no longer on sale or are no longer consumed to a significant degree in Ireland (Kaifeng et
al., 2016; Gibney et al., 2017).

Survey of the trans fatty acid content in processed food products in Ireland
2016
MONITORING AND SURVEILLANCE SERIES NUTRITION page 11
5. Methods
5.1 Sample description, collection, and delivery
Samples were collected from retailers across Ireland by the FSAI during June 2016. In total, 240 different
food products were collected and categorised into 15 categories, as outlined in Table 1:
Table 1: Summary of samples taken
Categorya Number of
samples (n)
% of
overall total
Number of
samples
Percentage of overall
total
Number of
samples
Percentage of overall
total
Branded Private label
Biscuits 32 13 12 5 20 8
Bread 16 7 7 3 9 4
Breakfast cereals 5 2 5 2 0 0
Confectionery 46 19 20 8 26 11
Custard 6 3 2 1 4 2
Crackers 16 7 9 4 7 3
Dried noodles/pasta 13 5 8 3 5 2
Pastry (ready-made) 4 2 2 1 2 1
Pies (Canned meat) 2 1 2 1 0 0
Powders 25 10 14 6 11 5
Sauces/gravies 5 2 3 1 2 1
Snacks 27 11 13 5 14 6
Soup (ready-made ) 9 4 6 3 3 1
Spreadable fats 24 10 19 8 5 2
Spreads 10 4 8 3 2 1
Total 240 100 130 54 110 46
a Biscuits: Rich Tea; Digestives; Cookies; Custard creams; Ginger Nut, etc. Breads: Wraps and Burger buns
Breakfast cereals: Rice and corn-based cereals. Confectionery: Chocolate bars; Marshmallow; Cereal bars; Cakes; Muffins; Tarts; Wafers. Custard: Dairy-based custards. Crackers: Cream Crackers; Bread sticks; Water Biscuits; Flatbreads. Dried noodles/pasta: Instant noodles and pasta meals. Pastry: Ready-made short crust and puff pastry. Pies: Canned steak and kidney pies. Powders: Curry powder; Gravy powder/granules; Instant soups. Sauces/gravies: Curry sauce/pastes; Ready-made gravy; Pasta sauce. Snacks: Crisps; Popcorn; Tortilla chips; Extruded snacks. Soup: Canned and ambient varieties. Spreadable fats: Vegetable and blended spreads of differing fats contents; Refined cooking fats. Spreads: Peanut butter; Chocolate spread; Sandwich spread.
Each sample was marked with a unique FSAI code and sealed in hard plastic boxes. Samples were
collected from the FSAI by ALS Life Sciences in June 2016 and transported in a refrigerated vehicle by
representatives of ALS Life Sciences for analysis at its laboratory in the United Kingdom.

Survey of the trans fatty acid content in processed food products in Ireland
2016
MONITORING AND SURVEILLANCE SERIES NUTRITION page 12
5.2 Methods of analysis
Each of the analyses for total fat and fatty acid profile was conducted using the following methods
of analysis:
Determination of total fat in foodstuffs by nuclear magnetic resonance (NMR) [ALS
Method Reference: AM/C/1015]
The sample was dried in an oven at a specified temperature (ALS Method AM/C/801 and AM/C/1015) with
an uncertainty percentage of ±1.1%. The dried sample was then stabilised at 50 °C in a heating block prior
to being subjected to pulsed nuclear magnetic resonance (NMR). The resulting oil/fat content was
determined automatically by comparing the resonance of the sample with a two-point calibration curve,
determined using a certified olive oil standard with an uncertainty percentage of ±3.8%.
Determination of fatty acids (saturates, monounsaturates and polyunsaturates)
[ALS Method Reference: AM/C/107; Standard Reference: BS EN ISO 5509: 2001]
Fats are converted to free fatty acids by saponification. The fatty acids are converted to their methyl esters
by treatment with methanolic acetyl chloride and are then extracted with heptane. Internal standards are
employed if an estimation of actual fatty acids present in the fat is required. Identification and quantification
of fatty acids was achieved by gas chromatography using flame ionisation detection with uncertainty
percentages of ±2.2% for saturates; ±1.0% for monounsaturates and ±2.7% for polyunsaturates.
Note: This method for determination of fatty acids does not include C4:0 and therefore saturates values will
be slightly underreported for dairy products. In addition, as the chromatography is normalised, this will (very
marginally) increase the TFA values for3 these particular samples.
3 The laboratory Eclipse Scientific Group Limited, trading as Advance Laboratory Testing (ALS) Food and Pharmaceutical, holds UKAS accreditation for the methods of analysis: UKAS Testing No. 1282.

Survey of the trans fatty acid content in processed food products in Ireland
2016
MONITORING AND SURVEILLANCE SERIES NUTRITION page 13
6. Results and discussion
A total of 240 individual samples across 15 different categories of processed food products from both
branded and private retail labels were collected and analysed as outlined in Table 1. The results presented
in this report relate solely to the individual products tested and do not necessarily reflect the general
composition of similar products on the market. For reporting purposes and as a basis for indicating high
and low concentrations of TFA, the following classification was used (Danish Government, 2003; FSAI,
2008, 2009):
Low TFA = ≤2% of total fat in the product
High TFA = ≥2% of total fat in the product.
6.1 Trans fatty acids
Results indicated that overall levels of TFA in surveyed products are low, with 97.5% (n=234/240) of
products having ≤2% TFA as a percentage of total fat. This is an improvement on a previous FSAI survey
of retail foods carried out in 2007, which found low levels of TFA (i.e. ≤2% TFA as a percentage of total fat)
in 80% (n=80/100) of surveyed products (FSAI, 2008).
Levels of TFA as a percentage of total fat across surveyed products ranged from <0.01 g to 4.90 g. An
overall average of 0.45 g TFA per/100 g of fat was seen across the 240 samples (Table 2).
While there was a wide variation in the range of values for the TFA content in surveyed foods, 78%
(n=187/240) had a TFA content <0.5 g TFA per/100 g total fat, whereas 3% (n=7/240) had <0.01 g TFA,
which was the limit of detection for TFA in the current survey (Table 2).

Survey of the trans fatty acid content in processed food products in Ireland
2016
MONITORING AND SURVEILLANCE SERIES NUTRITION page 14
Table 2: Trans fatty acid content in surveyed food product categories
Product categorya Number of samples
Total TFAb-c
(g/100 g fat)
Trans C18.1 oleic acidd (g/100 g fat)
Trans C18.2 linoleic acid d (g/100 g fat)
Trans C20.1 gadaleic acid d
(g/100 g fat)
Breakfast cereals 5 <0.01 <0.01 <0.01 <0.01
Spreads 10 0.17 (<0.01–0.60) 0.05 (<0.01–0.24) 0.11 (<0.01–0.36) 0.01 (<0.01–0.03)
Snacks 27 0.30 (0.06–1.60) 0.14 (0.02–1.12) 0.15 (0.03–0.48) <0.01 (<0.01–0.03)
Confectionery 46 0.33 (0.08–1.24) 0.17 (0.04–0.88) 0.16 (0.03–0.36) <0.01 (<0.01–0.04)
Pastry (ready-made) 4 0.33 (0.19–0.42) 0.09 (0.05–0.14) 0.22 (0.14–0.28) 0.01 (<0.01–0.03)
Biscuits 32 0.35 (0.07–0.56) 0.10 (0.04–0.39) 0.24 (0.03–0.49) <0.01 (<0.01–0.01)
Crackers 16 0.36 (0.12–0.59) 0.07 (0.04–0.19) 0.28 (0.05–0.52) <0.01 (<0.01–0.01)
Dried noodles/pasta 13 0.37 (0.18–0.78) 0.09 (0.04–0.27) 0.28 (0.14–0.67) 0.01 (<0.01–0.02)
Powders 25 0.48 (<0.01–1.89) 0.23 (<0.01–1.43) 0.25 (<0.01–0.46) <0.01 (<0.01–0.02)
Spreadable fats 24 0.58 (0.14–2.98) 0.34 (0.03–2.39) 0.22 (0.09–0.59) 0.01 (<0.01–0.04)
Breads 16 0.60 (0.13–4.07) 0.41 (0.04–3.91) 0.19 (0.07–0.4) <0.01 (<0.01–0.02)
Soup (ready-made) 9 0.64 (0.19–2.26) 0.40 (0.09–1.66) 0.22 (0.07–0.58) 0.02 (<0.01–0.06)
Pie (canned meat) 2 0.84 (0.51–1.16) 0.50 (0.26–0.73) 0.34 (0.25–0.43) <0.01
Custard 6 0.84 (0.50–1.25) 0.48 (0.29–0.68) 0.36 (0.17–0.58) <0.01 (<0.01–0.01)
Sauces/gravies 5 1.99 (0.13–4.90) 1.44 (0.02–4.10) 0.54 (0.08–0.87) 0.01 (<0.01–0.03)
Total 240 0.45 (<0.01–4.90) 0.23 (<0.01–4.10) 0.22 (<0.01–0.87) 0.02 (<0.01–0.06)
a The TFA content in each of the categories is ordered by their increasing average total TFA (g/100 g fat).
b The average total TFA content followed by the range of TFA values in brackets within each category. c The total TFA content in samples was calculated as the sum of C18.1 oleic acid (trans), C18.2 linoleic acid (trans) and C20.1 gadaleic acid (trans). d The average content of each TFA isomer followed by the range of TFA isomer values in brackets within each category.
page 14

Survey of the trans fatty acid content in processed food products in Ireland
2016
MONITORING AND SURVEILLANCE SERIES NUTRITION page 15
Only 2.5% (n=6/240) of surveyed products had a TFA content ≥2% of total fat. Figure 1 illustrates these
six samples:
Figure 1: Samples with levels of TFA ≥2 g TFA per/100 g fat
The highest TFA content in the 240 samples surveyed was found in a jarred ready-to-eat meat gravy with
4.90 g TFA per/100 g fat (Figure 1). This product contained a variety of ingredients derived from beef which
would naturally contain TFA. However, it did not contain any hydrogenated fats.
High levels of TFA were also found in a bread sample (i.e. flour tortilla) which had 4.07 g TFA per/100 g fat
(Figure 1). The manufacturer claimed on the packaging that the product was made with 100% sunflower oil.
Its ingredient declaration had no ingredients of animal origin or hydrogenated fats listed.
In the case of a low-fat butter product, the manufacturer indicated that no chemically treated fats or
vegetable oil were added, so it is assumed that the total TFAs are derived exclusively from natural ruminant
(i.e. dairy) sources. However, in the case of the blended dairy spread it contained both rapeseed oil and
dairy ingredients.
0.0
0.5
1.0
1.5
2.0
2.5
3.0
3.5
4.0
4.5
5.0
TF
A (
g/t
ota
l fa
t)

Survey of the trans fatty acid content in processed food products in Ireland
2016
MONITORING AND SURVEILLANCE SERIES NUTRITION page 16
The current 2016 survey shows that only 0.4% (n=1/240) of products indicated the presence of
hydrogenated fats in their ingredient declarations, whereas 7.5% (n=18/240) indicated the absence of
hydrogenated fats either within ingredient declarations or elsewhere on their product labelling.
A variety of descriptors relating to the absence of hydrogenated fats were used on the product labelling,
including:
Free from hydrogenated fat
No hydrogenated fats
No hydrogenated vegetable oil
No chemically treated fats
Free from hydrogenated vegetable oil
Contains no hydrogenated fats
Made without hydrogenated fats

Survey of the trans fatty acid content in processed food products in Ireland
2016
MONITORING AND SURVEILLANCE SERIES NUTRITION page 17
Levels of TFA in products making claims in relation to the absence or presence of hydrogenated fats are
illustrated in Figure 2.
Figure 2: Level of TFA in products making claims in relation to hydrogenated fats
*
0
1
2
3
TF
A (
g/t
ota
l fa
t)
* *
*
*
* *
* Products of animal origin or containing ingredients of animal origin which could be a source of natural TFA (n=7/19)
Approximately 68% (n=13/19) of surveyed products making claims in relation to the absence or presence of
hydrogenated fats had levels of TFA <0.5 g per/100 g fat (Figure 2). However, one product of animal origin,
a low-fat butter spread, had 2.98 g TFA per/100 g fat (Figure 2). In the case of this sample, it is assumed
that the TFAs are from ruminant sources, as the low-fat butter spread contained no vegetable oils.
Outlined in Figure 3 is a cross-sectional breakdown of products surveyed, based on the source of their
ingredient declarations. Approximately 20% (n=49/240) of total products surveyed were products of animal
origin. These products included dairy-based spreadable fats and custards, meat-based soups, pies and
gravies.

Survey of the trans fatty acid content in processed food products in Ireland
2016
MONITORING AND SURVEILLANCE SERIES NUTRITION page 18
Figure 3: Cross-sectional breakdown of products surveyed
20%
43%
37%
Products of animal origin
Products of non-animal origin(with no ingredients of animal origin)
Products of mixed origin(with ingredients of animal and non-animal origin)
The most commonly identified ingredients in products of animal origin included milk, cream, buttermilk,
whey powder and various meats such as beef, chicken and bacon. Some of the meat-based ingredients
were dried or in powdered forms.
Approximately 43% (n=103/240) of total products surveyed were products of non-animal origin with no
ingredients of animal origin declared on product labels (Figure 3). These products included various biscuits,
dried gravies and curry sauces, spreads, breakfast cereals, confectionery, noodles, snacks and crackers.
The most commonly identified ingredients in products of non-animal origin included various grains, flours
(particularly corn and wheat) and nuts (e.g. peanuts, hazelnuts) vegetables (particularly potatoes found in
crisps) starches, sugars, vegetable oils and additives. Some dried gravy products, while implying the
presence of meat-based ingredients (e.g. gravy for beef, savoury gravy, etc.), did not contain any animal-
based ingredients in their ingredient declarations.
The remaining 37% (n=88/240) of total products surveyed were products of mixed origin and contained
both ingredients of animal and non-animal origin. These products included various spreads, confectionery,
snacks and ready-made pastry. The most commonly identified ingredients in products of mixed origin
included egg and dairy-based ingredients such as egg yolk, whey and butter.

Survey of the trans fatty acid content in processed food products in Ireland
2016
MONITORING AND SURVEILLANCE SERIES NUTRITION page 19
On examining the three broad categories, average levels of TFA were higher in products of animal origin
than in products of non-animal origin or mixed origin, as outlined in Figure 4. However, high levels of TFA
(i.e. ≥2 g TFA per/100 g fat) were seen in some individual products from both animal origin and non-animal
origin (Figure 4).
Figure 4: Levels of TFA in products of animal and non-animal origin
0
0.5
1
1.5
2
2.5
3
3.5
4
4.5
5
Products of animal origin Products of mixed origin(with ingredients of animal
and non-animal origin)
Products of non-animalorigin
(with no ingredients ofanimal origin)
TF
A (
g/t
ota
l fa
t)
Average TFA
Highest TFA
Survey of the trans fatty acid content in processed food products in Ireland
2016
MONITORING AND SURVEILLANCE SERIES NUTRITION page 20
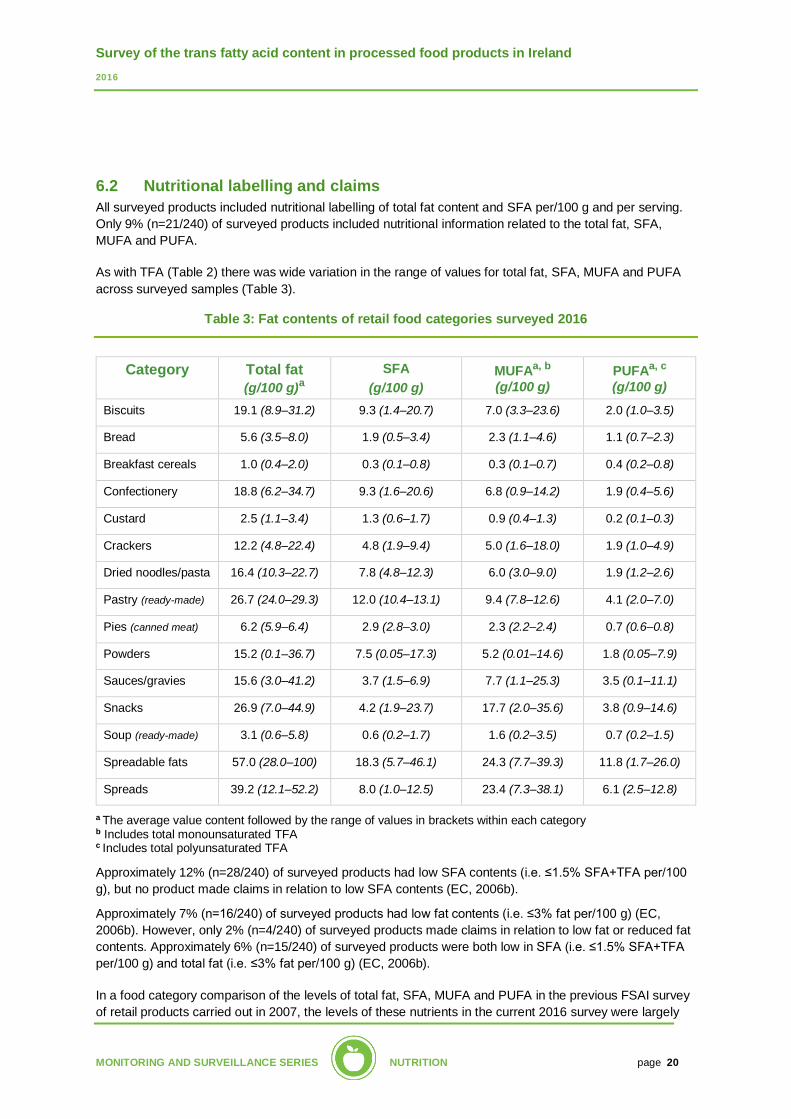
6.2 Nutritional labelling and claims All surveyed products included nutritional labelling of total fat content and SFA per/100 g and per serving.
Only 9% (n=21/240) of surveyed products included nutritional information related to the total fat, SFA,
MUFA and PUFA.
As with TFA (Table 2) there was wide variation in the range of values for total fat, SFA, MUFA and PUFA
across surveyed samples (Table 3).
Table 3: Fat contents of retail food categories surveyed 2016
Category Total fat
(g/100 g)a
SFA
(g/100 g)
MUFAa, b
(g/100 g)
PUFAa, c
(g/100 g)
Biscuits 19.1 (8.9–31.2) 9.3 (1.4–20.7) 7.0 (3.3–23.6) 2.0 (1.0–3.5)
Bread 5.6 (3.5–8.0) 1.9 (0.5–3.4) 2.3 (1.1–4.6) 1.1 (0.7–2.3)
Breakfast cereals 1.0 (0.4–2.0) 0.3 (0.1–0.8) 0.3 (0.1–0.7) 0.4 (0.2–0.8)
Confectionery 18.8 (6.2–34.7) 9.3 (1.6–20.6) 6.8 (0.9–14.2) 1.9 (0.4–5.6)
Custard 2.5 (1.1–3.4) 1.3 (0.6–1.7) 0.9 (0.4–1.3) 0.2 (0.1–0.3)
Crackers 12.2 (4.8–22.4) 4.8 (1.9–9.4) 5.0 (1.6–18.0) 1.9 (1.0–4.9)
Dried noodles/pasta 16.4 (10.3–22.7) 7.8 (4.8–12.3) 6.0 (3.0–9.0) 1.9 (1.2–2.6)
Pastry (ready-made) 26.7 (24.0–29.3) 12.0 (10.4–13.1) 9.4 (7.8–12.6) 4.1 (2.0–7.0)
Pies (canned meat) 6.2 (5.9–6.4) 2.9 (2.8–3.0) 2.3 (2.2–2.4) 0.7 (0.6–0.8)
Powders 15.2 (0.1–36.7) 7.5 (0.05–17.3) 5.2 (0.01–14.6) 1.8 (0.05–7.9)
Sauces/gravies 15.6 (3.0–41.2) 3.7 (1.5–6.9) 7.7 (1.1–25.3) 3.5 (0.1–11.1)
Snacks 26.9 (7.0–44.9) 4.2 (1.9–23.7) 17.7 (2.0–35.6) 3.8 (0.9–14.6)
Soup (ready-made) 3.1 (0.6–5.8) 0.6 (0.2–1.7) 1.6 (0.2–3.5) 0.7 (0.2–1.5)
Spreadable fats 57.0 (28.0–100) 18.3 (5.7–46.1) 24.3 (7.7–39.3) 11.8 (1.7–26.0)
Spreads 39.2 (12.1–52.2) 8.0 (1.0–12.5) 23.4 (7.3–38.1) 6.1 (2.5–12.8)
a The average value content followed by the range of values in brackets within each category
b Includes total monounsaturated TFA c Includes total polyunsaturated TFA
Approximately 12% (n=28/240) of surveyed products had low SFA contents (i.e. ≤1.5% SFA+TFA per/100
g), but no product made claims in relation to low SFA contents (EC, 2006b).
Approximately 7% (n=16/240) of surveyed products had low fat contents (i.e. ≤3% fat per/100 g) (EC,
2006b). However, only 2% (n=4/240) of surveyed products made claims in relation to low fat or reduced fat
contents. Approximately 6% (n=15/240) of surveyed products were both low in SFA (i.e. ≤1.5% SFA+TFA
per/100 g) and total fat (i.e. ≤3% fat per/100 g) (EC, 2006b).
In a food category comparison of the levels of total fat, SFA, MUFA and PUFA in the previous FSAI survey
of retail products carried out in 2007, the levels of these nutrients in the current 2016 survey were largely

Survey of the trans fatty acid content in processed food products in Ireland
2016
MONITORING AND SURVEILLANCE SERIES NUTRITION page 21
similar (FSAI, 2008). However, some of the products taken in the 2007 survey were either not available or
were not sampled during the 2016 survey. In those product categories with similarities, the following
comparisons were observed in relation to total fat, SFA, MUFA and PUFA (Table 4):
Table 4: Comparison of average levels of total fat, SFA, MUFA and PUFA
Category Total fat (g/100 g sample)
SFA (g/100 g sample)
MUFA (g/100 g sample)
PUFA (g/100 g sample)
2007 2016 2007 2016 2007 2016 2007 2016
Spreadable fats 60.2 55.1 13.4 17.1 27.6 23.5 14.5 11.6
Breads 6.9 5.6 2.4 1.9 2.9 2.2 1.3 1.1
Confectionery 17.9 18.8 10.1 9.3 5.5 6.7 1.5 1.9
Crackers 20.7 12.2 11.8 4.8 6.0 5.0 2.0 1.8
Dried noodles/pasta 9.9 16.4 5.1 7.8 3.5 6.0 0.9 1.8
Snacks 30.2 26.9 5.9 4.2 12.1 17.7 10.9 3.8
Sauces 7.6 15.6 3.0 3.7 2.4 7.6 1.8 3.4
Powders 16.1 15.2 7.7 7.5 5.1 5.2 1.0 1.8
As all surveyed products included nutritional labelling for total fat and SFA content per/100 g, a comparison
of this labelled nutritional information to obtained analysis values for these nutrients is outlined in Figure 5.
Figure 5: Comparison of labelled v analysis values for fat/SFA contents

Survey of the trans fatty acid content in processed food products in Ireland
2016
MONITORING AND SURVEILLANCE SERIES NUTRITION page 22
Applying the draft EC nutritional tolerances (Table 5) for total fat and SFA to the products surveyed
indicated that in all categories, except dried noodles and pasta, and dried powders, the labelled nutritional
values were within labelling tolerance guidelines when compared to analysis values (EC, 2012).
However, in the case of product categories such as dried noodles and pasta, and dried powders, the
nutritional declarations were often provided for the rehydrated product rather than the product as sold dry.
As the analysis of these products was as sold, it was difficult to extrapolate accurately as to the accuracy of
the products’ nutritional declarations.
Table 5: Tolerances for total fat, SFA, MUFA and PUFA in foods a, b
0.0
10.0
20.0
30.0
40.0
50.0
60.0
g/1
00g
Labelled fat Analysis fat
Labelled SFA Analysis SFA

Survey of the trans fatty acid content in processed food products in Ireland
2016
MONITORING AND SURVEILLANCE SERIES NUTRITION page 23
Nutrient Range of nutrient values Tolerances for foodsc
Total fat <10 g per 100 g ±2 g
10–40 g per 100 g ±20%
>40 g per 100 g ±8 g
SFA, MUFA and PUFA <4 g per 100 g ±0.8 g
≥4 g per 100 g ±20%
a Extract from Table 1 of Commission Document (EC, 2012) b Excludes food supplements c Includes measurement of uncertainty
Approximately 5% (n=13/240) of products surveyed declaring total fat contents were outside the labelling
tolerance guidelines set out in Table 5, with 77% (n=10/13) of these products under-declaring for total fat
content.
In relation to SFA, approximately 12% (n=29/240) of products surveyed declaring total SFA contents were
outside the labelling tolerance guidelines set out in Table 5, with 38% (n=11/29) of these products under-
declaring for SFA. Approximately 4% (n=10/240) of products surveyed were outside the labelling tolerances
for both total fat and SFA declarations.
In a comparison of the current 2016 survey results with a 2010 FSAI survey that specifically examined the
accuracy of nutrition labelling of pre-packaged foods in Ireland, the accuracy of labelling in relation to total
fat and SFA has improved significantly since that 2010 survey (FSAI, 2010). In the 2010 survey,
approximately 52% of those declaring total fat and 58% of those declaring SFA were under-declaring for
these nutritional parameters (FSAI, 2010).

Survey of the trans fatty acid content in processed food products in Ireland
2016
MONITORING AND SURVEILLANCE SERIES NUTRITION page 24
7. Conclusions
Historically, partially hydrogenated oils were widely used as ingredients in processed foods. This led to
many processed foods in Ireland containing moderate to high levels of industrial TFA, depending on the
extent of hydrogenation.
However, while the presence of high TFA concentrations was detected in some products in the current
survey, it is clear that overall levels are low (i.e. ≤2% of total fat in the product) and are continuing to drop,
as was demonstrated in previous FSAI surveys in 2007 and 2008.
Recent estimates of TFA from the Irish diet support the findings of this survey and show continuing
declines in TFA intakes among the Irish population. Estimated intakes of TFA at 0.5% of total energy are
substantially below the 2003 WHO/FAO recommendations of ≤1% contribution to food energy.
It can be concluded that continuing public health concerns regarding TFA, coupled with the emergence of
new and improving technologies and an expanding scientific knowledge base regarding TFA, continue to
impact on levels of TFA in processed foods in Ireland.
Recent research has also suggested that processed foods containing industrial TFA are either no longer on
sale or are no longer consumed to a significant degree in Ireland. Over 99% of products sampled in the
current survey did not declare the presence of hydrogenated fats in their ingredient declarations.
The accuracy of nutritional labelling provided on processed foods for both total fat and saturates has also
improved substantially since a previous FSAI survey examining accuracy of nutritional declarations took
place in 2010. It is clear from the current survey that consumers can have greater confidence in these
nutritional declarations, which facilitates better lifestyle and healthy living choices.

Survey of the trans fatty acid content in processed food products in Ireland
2016
MONITORING AND SURVEILLANCE SERIES NUTRITION page 25
8. References
Bhardwaj S, Passi S and Misra A. Overview of trans fatty acids: biochemistry and health effects. Diabetes
Metab Syndr 2011, 5: 161–164.
Brouwer IA. Effects of trans-fatty acid intake on blood lipids and lipoproteins: a systematic review and
meta-regression analysis. Geneva: World Health Organization, 2016.
Danish Government. Executive Order No. 160 of 11 March 2003 on the Content of Trans Fatty Acids in
Oils and Fats, 2003.
European Commission. Directive 2006/141/EC on infant formulae and follow-on formulae. Brussels:
European Commission, 2006a.
European Commission. Regulation (EC) No. 1924/2006 on nutrition and health claims made on foods.
Brussels: European Commission, 2006b.
European Commission. Regulation (EU) No. 1169/2011 on the provision of food information to consumers.
Brussels: European Commission, 2011.
European Commission. Guidance Document for Competent Authorities for the Control of Compliance with
EU Legislation with Regard to the Setting of Tolerances for Nutrient Values Declared on a Label. Brussels:
European Commission, 2012.
European Commission. Results of the Commission’s consultations on ‘trans fatty acids in foodstuffs in
Europe’. Brussels: European Commission, 2015a.
European Commission. Report from the Commission to the European Parliament and the Council
Regarding trans fats in foods and in the overall diet of the Union population. Brussels: European
Commission, 2015b.
European Commission. Factsheet – Trans fats in foods and in the overall diet of the Union population.
Brussels: European Commission, 2015c.
European Commission. Inception Impact Assessment: Initiative to limit industrial trans fats intakes in the
EU. Brussels: European Commission, 2016.
European Commission. Law on the trans-fat content of foods intended for human consumption. Notification
Number: 2017/535/RO (Romania). Brussels: European Commission, 2017.
European Parliament. Trans Fats – Overview of recent developments, 2016. Available at:
http://www.europarl.europa.eu/RegData/etudes/BRIE/2016/577966/EPRS_BRI(2016)577966_EN.pdf
European Food Safety Authority (EFSA). Opinion of the Scientific Panel on Dietetic products, nutrition and
allergies on a request from the Commission related to the presence of trans fatty acids in foods and the
effect on human health of the consumption of trans fatty acids. EFSA Journal 2004, 81: 1–49.
European Food Safety Authority (EFSA). Scientific Opinion on Dietary Reference values for fats, including
saturated fatty acids, polyunsaturated fatty acids, monounsaturated fatty acids, trans fatty acids, and
cholesterol. EFSA Journal 2010, 8(3): 1461.
European Food Safety Authority (EFSA). Scientific Opinion on the essential composition of infant and
follow-on formulae. EFSA Journal 2014, 12(7): 3760.
Food and Drug Administration – United States. Final Determination Regarding Partially Hydrogenated Oils
(Removing Trans Fat). Silver Spring, MD: U.S. Food and Drug Administration, 2017.

Survey of the trans fatty acid content in processed food products in Ireland
2016
MONITORING AND SURVEILLANCE SERIES NUTRITION page 26
Food Safety Authority of Ireland (FSAI). Trans Fatty Acid Survey – Retail Products (2007). Dublin: Food
Safety Authority of Ireland, 2008.
Food Safety Authority of Ireland (FSAI). Trans Fatty Acid Survey of Fast Foods in Ireland (2008). Dublin:
Food Safety Authority of Ireland, 2009.
Food Safety Authority of Ireland (FSAI). Accuracy of Nutrition Labelling of Pre-Packaged Food in Ireland.
Dublin: Food Safety Authority of Ireland, 2010.
Gibney MJ, Forde CG, Mullally D and Gibney ER. Ultra-processed foods in human health: a critical
appraisal. Am J Clin Nutr 2017, 106: 717–724.
Healthy Ireland. Healthy Food for Life: The Healthy Eating Guidelines and Food Pyramid. Dublin:
Department of Health, 2016.
Healthy Ireland. Nutrition Standards for School Meals. Dublin: Department of Health, 2017.
Kaifeng L, McNulty BA, Tierney AM, Devlin N, Joyce T, Leite JC, Flynn A, Walton J, Brennan L, Gibney MJ
and Nugent AP. Dietary fat intakes in Irish adults in 2011: how much has changed in 10 years? Br J Nutr
2016, 115: 1798–1809.
Mozaffarian D, Katan MB, Ascherio A, Stampfer MJ and Willett WC. Trans fatty acids and cardiovascular
disease. N Engl J Med 2006, 354(15): 1601–1613.
Mozaffarian D, Aro A and Willett WC. Health effects of trans-fatty acids: experimental and observational
evidence. Eur J Clin Nutr 2009, 63(S2): S5–S21.
Mouratidou T, Saborido CM, Wollgast J, Ulberth F and Caldeira S. Trans Fatty Acids in Diets: Health and
Legislative Implications. JRC Science and Policy Reports. Luxembourg: Publications Office of the
European Union, 2013.
Mouratidou T, Livaniou A, Saborido CM, Wollgast J and Caldeira S JRC. Trans Fatty Acids in Europe:
where do we stand? A Synthesis of the Evidence: 2003–2013. JRC Science and Policy Reports.
Luxembourg: Publications Office of the European Union, 2014.
Scientific Advisory Committee on Nutrition (SACN). Update on trans fatty acids and health; Position
Statement by the Scientific Advisory Committee on Nutrition. London: Public Health England, 2007.
Trattner S, Becker W, Wretling S, Öhrvik V and Mattisson I. Fatty acid composition of Swedish bakery
products, with emphasis on trans-fatty acids. Food Chem 2015,175: 423–430.
World Health Organization (WHO) and Food and Agriculture Organization (FAO). Expert Report: Diet,
Nutrition and Prevention of Chronic Diseases. Report of a Joint WHO/FAO Expert Consultation. WHO
Technical Report Series 916. Geneva and Rome: World Health Organization and Food and Agriculture
Organization of the United Nations, 2003.
World Health Organization (WHO). Scientific Update on trans fatty acids (TFA). Eur J Clin Nutr 2009, 63:
(S2).
World Health Organization (WHO). European Food and Nutrition Action Plan 2015–2020. Copenhagen:
World Health Organization Regional Office for Europe, 2014.
World Health Organization (WHO). Eliminating trans fats in Europe: A policy brief. Copenhagen: World
Health Organization Regional Office for Europe, 2015.


The Exchange, George’s Dock, IFSC, Dublin 1, D01 P2V6.
Advice Line: 1890 336677 Telephone: +353 1 817 1300 Email: [email protected] Website: www.fsai.ie