SURVEY OF THE TOBACCO GROWING AREAS IN THE · PDF fileSURVEY OF THE TOBACCO GROWING AREAS IN...
96
Rene Rafael C. Espino, Ph.D. Danilo L. Evangelista Edgardo Ulysses Dorotheo, MD The Collaborative Funding Program for Southeast Asia Tobacco Control Research SURVEY OF THE TOBACCO GROWING AREAS IN THE PHILIPPINES Financial support from The Rockefeller Foundation and Thai Health Promotion Foundation
Transcript of SURVEY OF THE TOBACCO GROWING AREAS IN THE · PDF fileSURVEY OF THE TOBACCO GROWING AREAS IN...
Rene Rafael C. Espino, Ph.D.Danilo L. Evangelista
Edgardo Ulysses Dorotheo, MD
The Collaborative Funding Program for Southeast Asia Tobacco Control Research
SURVEY OF THETOBACCO GROWING
AREAS IN THE PHILIPPINES
Financial support from The Rockefeller Foundation and
Thai Health Promotion Foundation

SURVEY OF THE TOBACCO GROWING AREAS IN THE PHILIPPINES
Rene Rafael C. Espino, Ph.D.* Danilo L. Evangelista*
Edgardo Ulysses Dorotheo, MD∗
University of the Philippines, Los Banos Framework Convention on Tobacco Control Alliance, Philippines (FCAP)
Manila, Philippines
Editor Menchi G. Velasco
Supported by
Southeast Asia Tobacco Alliance (SEATCA) Under The Collaborative Funding Program for Tobacco Control Research
Financial Support from The Rockefeller Foundation and
Thai Health Promotion Foundation (ThaiHealth)
May, 2009 ∗ Professor, Crop Science Cluster, College of Agriculture, University of the Philippines Los Banos; Assistant Professor, Department of Agricultural Economics, College of Economics and Management, University of the Philippines, Los Banos; and Framework Convention on Tobacco Control Alliance. Philippines (FCAP), respectively.

i
EXECUTIVE SUMMARY
A survey was conducted among tobacco and non-tobacco farmers in the 4 provinces of Region 1 in the Philippines to: a) establish the profile of the farming household; b) to compare the farming practices and income; c) determine the socio-economic considerations in the decision-making process by farmers on whether to or not to plant tobacco; and d) to analyze the suitability of other crops that can be grown in the tobacco producing areas. Region 1 is the main tobacco growing area in the country. It is composed of 4 provinces, namely 1) Ilocos Norte; 2) Ilocos Sur; 3) La Union; and 4) Pangasinan. The survey covered the 2006-2007 cropping season. The Virginia type of tobacco is the predominant type grown by farmers. There were 987 respondents involved in the survey and the break down is as follows: 503 tobacco farmers and 484 non-tobacco farmers. Furthermore, the survey area was subdivided into 2 groupings, namely a) very good/good area; and b) marginal/salty area based on their suitability for tobacco cultivation. There were 660 respondents for the very good/good areas and 327 respondents for the marginal/salty areas. Data obtained had shown that the area under cultivation and total production of tobacco in Region 1 had been declining at an annual average rate of 9.36% and 5.36%, respectively since 2001. However, average yield per hectare has been increasing by 4.72%. Farmers in the area, whether cultivating tobacco or not, can be characterized as: a) male; b) generally young at age of 21-60 years old; c) had secondary education; d) household size of 3-5; e) small farm size, 1 hectare or less; f) had more than 10 years farming experience; g) high tenancy rate (60% for tobacco farmers and 40% for non-tobacco farmers; and h) total annual income of less than P 100,000.00 (US$ 2,222.22). Tobacco and non-tobacco farmers gave similar reasons for cultivating their respective crops such as: a) profitability; b) availability of market/buyer; c) accessibility/availability of inputs and labor; d) availability and familiarity of production technology; and e) suitability of the area/climate. The majority of the tobacco farmer (86.8%) will continue to grow tobacco in the next cropping season due to: a) its profitability; b) available market/buyer and c) experience in growing the crop. For the non-tobacco farmers, they will continue growing similar crop due to: a) less labor requirement; b) lower input cost; and c) experience in growing the said crop. For tobacco farmers who will shift to another crop this cropping season, the reasons given were high labor and input costs in cultivating tobacco while for the non-tobacco farmers who will shift to tobacco, the reasons given were high profitability and price of tobacco. Corn, legumes (mungbean, beans, peanut) and various species of vegetables (tomato, eggplant, garlic, onion, etc) are the preferred crops by farmers for cultivation.

ii
Among the different types of tobacco grown by farmers, Virginia type gave the highest net income (P 51,642 or US$ 1,147.60) followed by the burley type (P 32,750 or US$ 727.78) and the least was the native type (P 19,266 or US$ 428.13). Cost and return analysis shows that cultivating vegetables gave 1.5 to 5 times higher net income than tobacco (Virginia type). Net income derived from corn is at par with that obtained in planting native tobacco but much lower compared to burley and Virginia types of tobacco. For mungbean, the net income derived from cultivating is almost similar to that of burley tobacco while for peanut, it was higher by 1.5 times compared to Virginia tobacco. However, own-time labor cost of the farmer was not taken into account in this cost and return analysis. Based on the percent net income (Table 42) which ranged from 31.14% to 72.16%, garlic had the lowest and hot pepper had the highest percentage. In addition, the average percent net income obtained by farmers in growing tobacco (49.83%) was similar to that of growing non-tobacco crops (50.26%). Virginia tobacco requires highest input cost (P 41,990 or US$ 933.11) and labor requirement (261 man days) per hectare among the 3 tobacco types. For the non-tobacco crops, input cost ranged from P 10,540 (US$ 234.22 - mungbean) to P 120,150 (US$ 2,670 - bitter gourd) and labor requirement from 54 man days for mungbean to 209 man days for tomato. Corn, being the most preferred crop planted by non-tobacco farmers requires an input cost of P 14,990 (US$ 333.11) which was the second lowest among the crops and 115 man days as a labor requirement. Hence, farmers always weigh his option based on his financial resources, availability of labor and profitability of the crop in choosing which crop to plant each year. For the tobacco farmers particularly those planting the Virginia type, source of labor outside the family is becoming a major concern since the crop requires considerable manpower (the highest among the various crops) to grow and the limited manpower available in the community. Tobacco farmers tend to sell their products directly to the tobacco companies while non-tobacco farmers tend to do their own marketing of their products in the local market. Tobacco companies and traders/middlemen go to different communities to purchase the farmers’ produce, hence shouldering all the marketing cost. GIS maps for tobacco, corn, vegetables and legumes show the various areas suitable for growing these crops in the 4 provinces of Region 1. It also shows that areas suited for tobacco cultivation are also suitable for the non-tobacco crops preferred by farmers as substitute for tobacco. In some cases, the area suited for these crops are much larger than areas suitable for tobacco growing.

iii
ABSTRACT
A survey was conducted in the major tobacco growing areas in the Philippines to establish the socio-economic profile of tobacco and non-tobacco farmers in the area, determine their consideration in the decision-making process in planting tobacco or not, and identify other crops that are suitable in the areas where tobacco is planted. It focused on 4 provinces of Region 1, namely Ilocos Norte, Ilocos Sur, La Union and Pangasinan and for the crop year 2006-2007. The preferred tobacco type grown by farmers was the Virginia type. Data obtained indicate that the socio-demographic profile of tobacco and non-tobacco farmers is similar to each other. They are characterized as follows: a) male; b) generally young with age of 21-60 years old; c) had secondary education; d) household size of 3-5; e) small farm size, 1 hectare or less; f) had more than 10 years farming experience; g) high tenancy rate (60%) for tobacco farmers and for non-tobacco farmers (40%); and h) total annual income of less than P 100,000.00 (US$ 2,222.22). In addition, similar reasons were given by tobacco and non-tobacco farmers in cultivating their respective crops. These were: a) profitability; b) availability of market/buyer; c) accessibility/availability of inputs and labor; d) availability and familiarity of production technology; and e) suitability of the area/climate. The majority of the tobacco farmers tend to continue planting tobacco in the next cropping season due: to) its profitability; b) available market/buyer and c) experience in growing the crop. For the non-tobacco farmers, they will continue growing the same crop because it requires less labor, the input cost is lower and they have the experience in growing the said crop. High input cost and high labor requirement were the principal reasons given by tobacco farmers in shifting to another crop in the following cropping season. On the other hand, high profitability and price were the major reasons given by non-tobacco farmers for switching to tobacco. Corn, vegetables (tomato, eggplant, garlic, onion, etc) and legumes (mungbean and peanut) were the preferred crops chosen for planting by farmers. Among the 3 types of tobacco grown by farmers, Virginia type gave the highest income per hectare (P 51,642 or US$ 1,147.60) while the native type generated the least (P 19,266 or US$ 428.13). Cultivating vegetables generally had a higher income compared to tobacco. For the legumes, the net income derived from mungbean cultivation was at par with that of the burley tobacco while income from peanut was 1.5 times higher compared to that of Virginia tobacco. Corn, on the other had an income at par with native tobacco. However, the cost and return analysis for these crops did not take into account the farmers’ own-time labor cost. In terms of input requirement, growing vegetable generally requires higher input cost compared to tobacco, corn and legumes. The percent net income in growing all these crops ranges from 31.14% to 72.26% which indicates their profitability.
iv
Labor requirement for the cultivation of tobacco ranged from 142 to 261 man days with Virginia type having the highest (261 man days). For corn and vegetables, it ranged from 114 to 209 man days while for the legumes, it was 54 to 85 days which was the least. Tobacco farmers sell their produce to tobacco companies directly while non-tobacco farmers sell theirs in the local market. Tobacco companies and traders/middlemen go to the various communities to purchase the farmer’s produce. Crop suitability analysis showed that the areas suitable for tobacco in Region 1 are also suitable for growing other crops such as corn, vegetables and legumes (mungbean, peanut and beans).

v
ACKNOWLEDGEMENTS
The authors wish to extend their sincere thanks to the following persons and their institutions that had generously provided assistance to the survey team to accomplish their task:
• Mr. Danilo Coronacion and his staff at the National Tobacco Administration for providing the necessary information on tobacco cultivation in the country;
• Dr. Paz Mones and Mr. Angel Padilla and their staff at the Department of
Agriculture’s Regional Field Unit 1 for their assistance in the survey work; • To the various provincial and municipal agricultural officers who extended their
cooperation and hospitality; • To the various enumerators who exerted all efforts to accomplish the questionnaires
on time; and • Dr. Marlowe Aquino and his staff at the Bureau of Agricultural Research who
painstakingly generated the suitability maps for the various crops.
Finally, we extend our utmost gratitude to The Rockefeller Foundation, Thai Health Promotion Foundation (ThaiHealth), and the Southeast Asia Tobacco Control Alliance (SEATCA) for providing technical and financial support for the conduct of this study.

vi
TABLE OF CONTENTS
Executive summary ……………………………………………………………………………i Abstract ………………………………………………………………………………………iii Acknowledgements …………………………………………………………………….v
1. Introduction …………………………………………………………………………….. 1
2. Objectives ………………………………………………………………………………...2
2.1. General objectives ……………………………………………………………. ... 2 2.2. Specific objectives………………………………………………………………. 2
3. Methodology …………………………………………………………………………. … 3 3.1. Survey questionnaire……………………………………………………………. 3 3.2. Study design ……………………………………………………………………. 3 3.3. Study area ……………………………………………………………………… 5 3.4. Study participants and sampling group……………………………................... . 5 3.5. Data analysis …………………………………………………………………….5 3.6. Study limitation ………………………………………………………………... 6
4. Results and Discussion ………………………………………………………………….. 7 4.1. Tobacco production in Region 1 ……………………………………………….. 7
4.1.1. Cropping pattern ……………………………………………………………. 7 4.1.2. Volume of production ………………………………………………………. 7 4.1.3. Area planted/harvested ……………………………………………………… 7 4.1.4. Yield per hectare …………………………………………………………….. 8
4.2. Socio-demographic profile of farmers …………………………………………. 9 4.2.1. Tobacco farmers…………………………………………………………….. 9 4.2.2. Non-tobacco farmers…………………………………………………………12
4.3. Farming characteristics …………………………………………………………15 4.3.1. Tobacco farming …………………………………………………………… 15 4.3.2. Non-tobacco farming ………………………………………………………. 22
4.4. Farmers perception to tobacco farming ………………………………………. 30 4.4.1. Tobacco farmers ……………………………………………………………..30 4.4.2. Non-tobacco farmers ……………………………………………………….. 34
4.5. Income, input and labor requirement ………………………………………….. 39 4.5.1. Cost and return analysis ……………………………………………………. 39 4.5.2. Input cost and labor requirements ………………………………………….. 40
4.6. Marketing ……………………………………………………………………… 41 4.6.1. Tobacco products……………………………………………………………41 4.6.2. Non-tobacco products………………………………………………………..42
4.7. Crop suitability analysis ………………………………………………………. 43 4.7.1. Suitability analysis through GIS …………………………………………... 43

vii
4.7.2. Total area identified as suitable for growing various crops ………………... 43 5. Summary ………………………………………………………………………………. 49 6. Conclusion …………………………………………………………………………….. 52 7. References ……………………………………………………………………………. 53
8. Appendices ……………………………………………………………………………. 54

viii
LIST OF TABLES
Table No.
Title
Page No.
1
Volume (mt) and annual growth rate (%) of tobacco production in the 4 provinces of Region 1, Philippines (BAS, 2008)
7
2
Total area planted/harvested and annual growth rate (%) of tobacco in the 4 provinces of Region 1, Philippines (BAS, 2008)
8
3
Average yield per hectare (mt) and annual growth rate (%) of production of tobacco in the 4 provinces of Region 1, Philippines (BAS, 2008)
8
4
Percentage distribution of the age group of respondents as head of household engaged in planting tobacco in Region 1, Philippines
9
5
Percentage distribution of the sex of respondents as head of household engaged in planting tobacco in Region 1, Philippines
9
6
Percentage distribution of the educational level of respondents engaged in planting tobacco in Region 1, Philippines
10
7
Percentage distribution of the household size of respondents engaged in planting tobacco in Region 1, Philippines
11
8
Percentage distribution of the total household income of respondents engaged in planting tobacco in Region 1, Philippines
11
9
Percentage distribution of the age of the head household engaged in growing crops other than tobacco in Region 1, Philippines
12
10
Percentage distribution by sex of the farmers engaged in growing non-tobacco crops in Region 1, Philippines
13
11
Percentage distribution of the educational level reached by farmers growing non-tobacco crops in Region 1, Philippines
13
12
Percentage distribution of the size of household of farmers growing non-tobacco crops in Region 1, Philippines
14
13
Percentage distribution of the total annual income of household of farmers growing non-tobacco crops in Region 1, Philippines
14
14
Percentage distribution of the types of tobacco planted by farmers in Region1, Philippines
15
15
Percentage distribution of the types of tobacco planted by farmers in the 4 provinces in Region 1, Philippines
16
16
Percentage distribution of the farm size of farmers growing tobacco in Region 1 , Philippines
16
Percentage distribution of the tenurial status of farmers

ix
17 cultivating tobacco in Region 1 , Philippines 17
18 Percentage distribution of the number of years of farming experience of tobacco farmers in Region 1 , Philippines
18
19
Percentage distribution of agencies providing assistance to tobacco farmers in Region 1 , Philippines
18
20
Percentage distribution of the type of assistance provided to tobacco farmers in Region 1 , Philippines
19
21
Percentage distribution for reasons given by farmers in Region 1, Philippines why they prefer to grow tobacco
20
22
Percentage distribution of various crops planted by tobacco farmers in the previous cropping season in Region 1, Philippines
21
23
List of crops planted by non-tobacco farmers and their percentage distribution in Region1, Philippines
22
24
Percentage distribution of the size of farms cultivated by non-tobacco farmers in Region 1 , Philippines
24
25
Tenurial status of non-tobacco farmers and their percentage distribution in Region 1, Philippines
24
26
Number of years of farming by non-tobacco farmers and their percentage distribution in Region 1, Philippines
25
27
List of institutions providing assistance to non-tobacco farmers and their percentage distribution in Region 1, Philippines
26
28
Percentage distribution of the assistance received by non-tobacco farmers in Region 1 , Philippines
27
29
Reasons provided by farmers for planting non-tobacco crop varieties and their percentage distribution in Region 1, Philippines
28
30
Percentage distribution of farmers who planted tobacco and non-tobacco crops during the previous cropping season in Region 1 , Philippines
29
31
Reasons provided by farmers for shifting from tobacco to non-tobacco crops during the crop year 2006-2007 and their percentage distribution in Region 1, Philippines
29
32
Responses of tobacco farmers on whether to continue tobacco cultivation or not and their percentage distribution in Region 1, Philippines
30
33
Reasons provided by tobacco farmers in deciding to continue tobacco cultivation in the next cropping season and their percentage distribution in Region 1, Philippines
31
34
Reasons given by tobacco farmers on why they will shift to another crop in the next cropping season and their percentage distribution in Region 1, Philippines
32
35
List of crops selected by farmers as substitute for tobacco in the next cropping season and their percentage distribution in Region 1, Philippines
33
Reasons provided by farmers in selecting a particular crop as

x
36 replacement for tobacco in the next cropping season and their percentage distribution in Region 1, Philippines
34
37
Responses obtained from non-tobacco farmers on their intention to plant tobacco or not in the next cropping season and their percentage distribution in Region 1, Philippines
35
38
Reasons provided by non-tobacco farmers for shifting to tobacco cultivation in the next cropping season and their percentage distribution and their percentage distribution in Region 1, Philippines
35
39
Reasons provided by non-tobacco farmers to continue planting non-tobacco crops in the next cropping season and their percentage distribution in Region 1, Philippines
36
40
List of crops preferred by non-tobacco farmers to plant in the next cropping season and their percentage distribution in Region 1, Philippines
37
41
Reasons provided by farmers in deciding which crop to plant in the coming cropping season and their percentage distribution and their percentage distribution in Region 1, Philippines
38
42
Cost and return analysis of selected crops grown by farmers in Region 1, Philippines during the 2006-2007 cropping season
40
43
Input and labor requirements in growing various crops in Region 1, Philippines
41
44
Market outlets used by tobacco farmers to sell their products and their percentage distribution in Regions 1, Philippines
42
45
Marketing outlets used by non-tobacco farmers to sell their products in Region 1, Philippines.
42
46
Areas identified as suitable for cultivation of various crops in the 4 provinces of Region 1, Philippines
43
xi
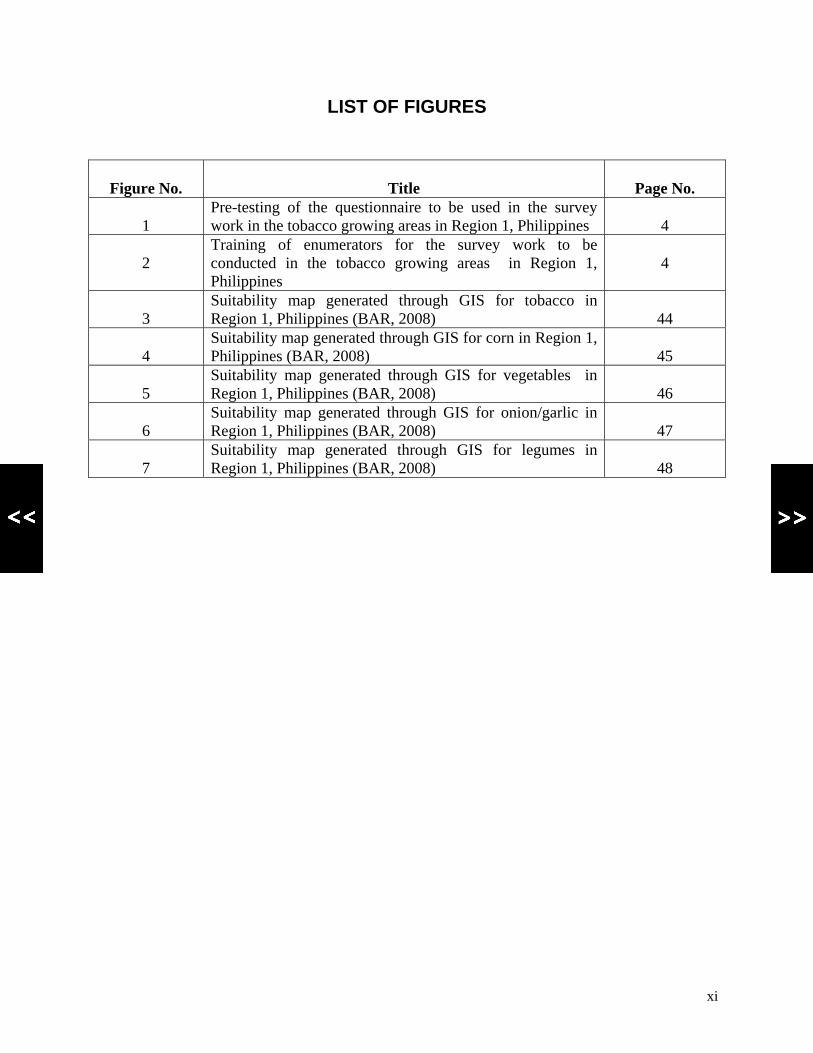
LIST OF FIGURES
Figure No.
Title
Page No.
1
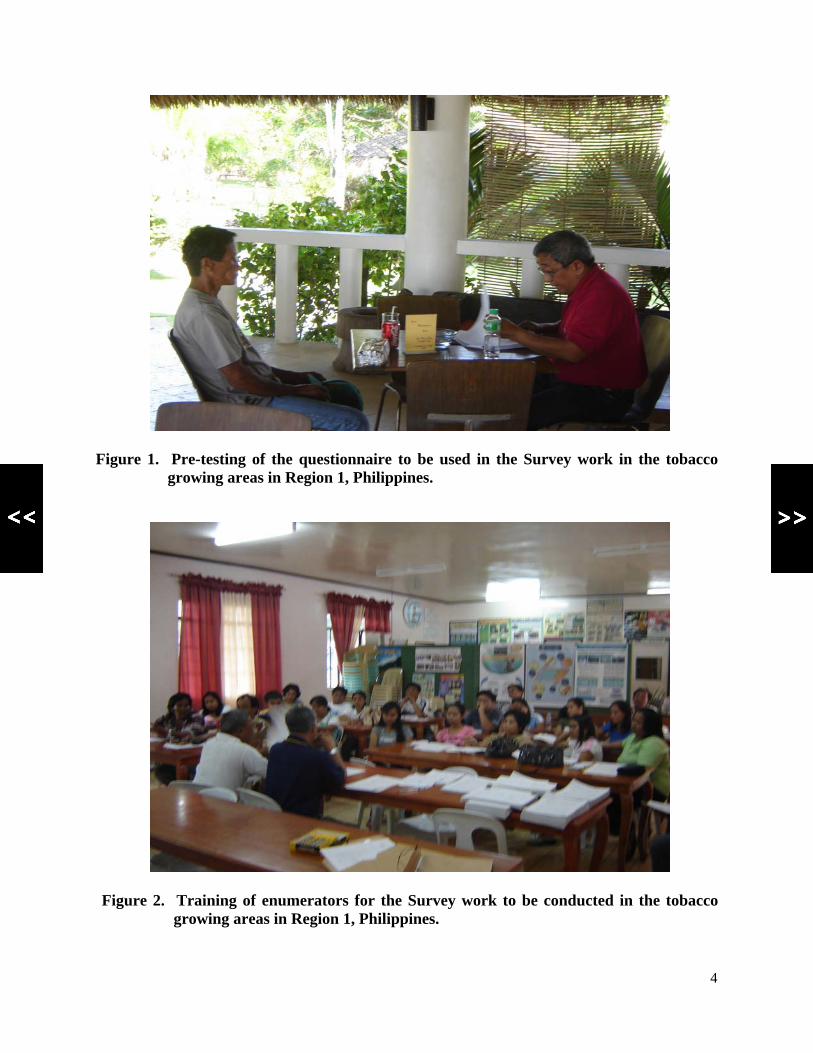
Pre-testing of the questionnaire to be used in the survey work in the tobacco growing areas in Region 1, Philippines
4
2
Training of enumerators for the survey work to be conducted in the tobacco growing areas in Region 1, Philippines
4
3
Suitability map generated through GIS for tobacco in Region 1, Philippines (BAR, 2008)
44
4
Suitability map generated through GIS for corn in Region 1, Philippines (BAR, 2008)
45
5
Suitability map generated through GIS for vegetables in Region 1, Philippines (BAR, 2008)
46
6
Suitability map generated through GIS for onion/garlic in Region 1, Philippines (BAR, 2008)
47
7
Suitability map generated through GIS for legumes in Region 1, Philippines (BAR, 2008)
48

xii
APPENDICES
Appendix No.
Title
Page No.
1
Questionnaire used for farmers cultivating tobacco
55
2
Questionnaire used for farmers cultivating non-tobacco crops
67
3 Table 1: Areas planted with tobacco in the 4 provinces covered by the survey work, crop year 2004-2005 (National Tobacco Administration, 2007) Table 2: List of municipalities and number of respondents in the survey work.
79
81
1
INTRODUCTION
1.1. Tobacco continues to be touted by the National Tobacco Administration (NTA), a government agency and tobacco companies, foreign and local, as a poverty alleviating crop. There has been no data to date in the Philippines that can definitely demonstrate to our lawmakers, local government unit leaders, and the farmers themselves that diversifying or even switching to other crops would be more economically beneficial for the farmers and for the provinces/towns/barangays as a whole.
1.2. If lawmakers are convinced that tobacco farming is not as lucrative as they think and
that farmers can do as well or even better by planting other crops, there will also be less opposition to implementing and strengthening other non-supply tobacco control policies in the country.

2
OBJECTIVES
2.1. General Objectives
2.1.1. To establish a profile of tobacco farming household in the top 3-4 major tobacco producing provinces in the Philippines; and
2.1.2. To develop and disseminate a policy advocacy paper based on the Survey results,
to farmer groups, policymakers and the media.
2.2. Specific Objectives
2.2.1. To determine the social and demographic attributes of tobacco and non-tobacco farmers;
2.2.2. To compare the tobacco farming practices and income to other crops suited in the area as possible substitute for tobacco;
2.2.3. To determine the cost of production, curing and marketing of tobacco including the
incentives received;
2.2.4. To analyze the suitability of other crops that can be grown in the tobacco-producing areas; and
2.2.5. To determine the socio-economic considerations in the decision-making process of
the farmers to plant or not to plant tobacco.

3
METHODOLOGY
3.1. Survey Questionnaire Preparation of questionnaires for farmers growing tobacco and other crops was
undertaken. Pre-testing involving 20 respondents in the targeted area for the Survey was done in order to assess its effectiveness to capture the necessary information needed and easiness for the enumerators to obtain the necessary information from the farmers (Figure 1). Based on the results, these questionnaires were revised accordingly and finalized. Appendices 1 and 2 were the final questionnaires to be used in the Survey of farmers planting tobacco and other crops, respectively. There were 45 enumerators that were involved in the Survey work (Figure 2).
3.2. Study Design
3.2.1. A stratified random sampling design was used in the Survey for both qualitative
and quantitative factors involved in the questionnaire. For each province, top-growing tobacco municipalities were identified and selected. In turn, top-growing tobacco barangays were also identified and selected. Then individual farmer within a barangay was selected. All of these identification and selection of the respondents were done in coordination with the provincial/municipal agricultural office and the regional office of the Department of Agriculture.
3.2.2. Selection of the municipalities/barangays was based on the data available on the
area planted during the 2004-2005 planting season. This was obtained from the records of the National Tobacco Administration (NTA) and shown in Appendix Table 1. NTA classified the growing areas as: a) very good/good (VG/G) and b) marginal/salty (MSF).
3.2.3. The selected municipalities represent more than 50% of the total area planted per
growing areas in the province. Furthermore, the number of respondents was determined in proportion to the hectarage of each town and growing condition. Appendix Table 2 shows the towns involved in each province, growing condition and corresponding respondents. Within the town, this was broken down into barangay wherein the following scheme was followed: a) 1 barangay was selected if the number of respondents was less than 10; b) 2 barangays were selected when the number of respondents was 10-20; and c) 3 barangays were selected if the number of respondents were more than 20. In each barangay, equal number of respondents for tobacco and non-tobacco farming was done.
4
Figure 1. Pre-testing of the questionnaire to be used in the Survey work in the tobacco
growing areas in Region 1, Philippines.
Figure 2. Training of enumerators for the Survey work to be conducted in the tobacco
growing areas in Region 1, Philippines.
5
3.2.4. A total of 987 respondents were selected which comprised 503 tobacco farmers and 484 non-tobacco farmers. For the very good/good areas, there were 660 farmers and for the marginal/salty areas, there were 327 farmers involved in the Survey.
3.3. Study Area
3.3.1. The Survey work on the tobacco-growing areas in the Philippines was concentrated on 4 provinces, namely, Ilocos Norte, Ilocos Sur, La Union, and Pangasinan which comprise Region 1 of the country. These areas have a total land area of 18,732 hectares producing 31,117 metric tons which represent 63.3% of the total area planted and 67% of the total volume produced in the country.
3.3.2. These provinces belong to Region 1, considered as the major tobacco-growing
area in the Philippines.
3.4. Study Participants and Sampling Groups
3.4.1. For both qualitative and quantitative factors involved in the Survey questionnaire, the respondent of the Survey was the farmer himself as well as his family to gather all the necessary information. Four (4) groupings were Surveyed, namely:
a) farmers who continuously plant tobacco; b) farmers who do not plant tobacco; c) farmers who had planted tobacco and shifted to another crop; and d) farmers who had planted other crops and shifted to tobacco.
3.4.2. The Survey was focused on the 2006-2007 crop year.
3.5. Data Analysis
Survey data was collated and subjected to analysis.
3.5.1. Quantitative data: Cost and return analysis was done to determine the net return
derived by farmers in tobacco-growing areas. Furthermore, cost of various practices such as land preparation, planting, care, harvesting, curing and marketing were determined. Input cost such as seeds, fertilizer, pesticides (if any), etc, were also identified. An exchange rate of P 40-42 per US$1.00 was prevailing during this time.
3.5.2. Qualitative data: Analysis was done using frequency count and percentages to
determine the primary factors involved in the decision-making process of the farmer to plant or not to plant tobacco.
3.5.3. Secondary data on income-derived from other crops will be obtained. Initial
selection for candidate crops for substitution to tobacco was based on income, which is either equal or higher than tobacco. The next step was to determine

6
whether they are suitable in the area and have available market. For the former, this was done using geographical information system (GIS) analysis based on ideal soil and climate requirements of each crop. For the latter, this was based on the markets available in the area, supply and demand analysis and price trend.
3.6. Study Limitation
The data generated in this Survey work was based on the recall of the farmers in their various farming activities undertaken during the crop year 2006-2007 which ended in May 2007. The Survey was undertaken during the months of November 2007 till January 2008.

7
RESULTS AND DISCUSSION
4.1. Tobacco Production in Region 1
4.1.1. Cropping pattern. Tobacco is generally planted after rice in the region. Planting starts during the months of October up to December. Farmers generally practice mono-cropping. They planted 3 types of tobacco, namely: a) native; b) burley; and c) Virginia.
4.1.2. Volume of production. Production of tobacco in the region had been declining
by an average of 5.36% annually from 2001 to 2007. From a total volume of 35,590 metric tons in 2001, it dropped to 25,028 metric tons in 2007. Among the 4 provinces that belong to Region 1, Pangasinan exhibited the highest decline averaging 11.62% annually from 10,381 metric tons in 2001 to 3,467 metric tons in 2007. It was only Ilocos Sur that exhibited positive growth in total production. However, this was very minimal reaching an average of 1.38% annually (Table 1.) In addition, it was also the highest producer in the region accounting for 54.15% of the total production in 2007.
Table 1. Volume (mt) and annual growth rate (%) of production of tobacco in the
4 provinces of Region 1, Philippines (BAS, 2008).
Province 2001 2002 2003 2004 2005 2006 2007
Average Annual Growth
Rate (%) Ilocos Norte
2,909
3,457
2,529
2,325
2,270
2,212
2,109
-4.28
Ilocos Sur
12,756
13,152
12,931
13,014
11,629
11,431
13,553
1.38
La Union
9,544
9,501
10,387
9,452
8,830
7,590
5,899
-7.17
Pangasinan
10,381
10,688
12,890
10,347
8,338
8,922
3,467
-11.620
Total
35,590
36,798
38,737
35,138
31,067
30,155
25,028
-5.358
4.1.3. Area planted/harvested. Table 2 shows the total area planted/harvested for
tobacco in the 4 provinces belonging to Region 1. Similar to the trend in the volume of production, the area planted/harvested had been declining at an average annual rate of 9.36% from 29,426 hectares in 2001 to 15,619 hectares in 2007. All of the provinces had experienced a decline in the total area planted/harvested with Pangasinan having the highest decline (14.97%) while Ilocos Norte had the least decline at 4.18% annually. This decline was due to the reduction in the area planted/harvested during this time period.

8
Table 2. Total area planted/harvested and annual growth rate (%) of tobacco in the 4 provinces of Region 1, Philippines (BAS, 2008)
Province 2001 2002 2003 2004 2005 2006 2007
Average Annual Growth
Rate (%) Ilocos Norte
2,930
2,930
2,927
2,813
2,527
2,426
2,258
-4.18
Ilocos Sur
13,515
13,515
13,108
9,580
7,989
8,302
8,603
-6.50
La Union
6,364
6,364
6,855
4,654
3,987
3,594
2,913
-11.26
Pangasinan
6,617
6,617
7,529
5,807
4,229
4,434
1,845
-14.97
Total
29,426
29,426
30,419
22,854
18,732
18,756
15,619
-9.36
4.1.4. Yield per hectare. Production of tobacco per hectare has been increasing at an
average annual rate of 4.72% in Region 1 (Table 3). From an average of 1.25 metric tons/ha in 2001, this had reached into 1.60 tons/hectare by 2007. Ilocos Sur has exhibited the highest increase at 9.72% which accounted for the increasing total volume of production even though the area under cultivation was shrinking during this time period. For the other provinces, the increase in yield per hectare did not compensate for the diminished area put into tobacco cultivation such that reduction in total volume of production was observed. The said increase in yield per hectare was brought about by the aggressive extension activities of the various government agencies particularly the NTA and private tobacco companies.
Table 3. Average yield per hectare (mt) and annual growth rate (%) of tobacco in
the 4 provinces of Region 1, Philippines (BAS, 2008).
Province 2001 2002 2003 2004 2005 2006 2007
Average Annual Growth
Rate (%)
Ilocos Norte 0.99 1.18 0.86 0.83 0.90 0.91 0.93 0.06
Ilocos Sur 0.94 0.97 0.99 1.35 1.46 1.38 1.58 9.72
La Union 1.50 1.49 1.52 2.03 2.21 2.11 2.02 5.90
Pangasinan 1.57 1.62 1.71 1.78 1.97 2.01 1.88 3.19
Average 1.25 1.32 1.27 1.50 1.64 1.60 1.60 4.72

9
4.2. Socio-demographic Profile of Farmers
4.2.1. Tobacco farmers
4.2.1.1. Age of the head of the household. Farmers belonging to the age group 41 to 60 years old predominate comprising 62.87% of the total respondents. This is followed by farmers belonging to the 31-40 age group which constitute 14.59% and those in the 61-70 age group accounted for 12.91%. It is noteworthy to observe that farmers with ages of 71-80 years are still engaged in farming activities.
Table 4. Percentage distribution of the age group of respondents as head of
household engaged in planting tobacco in Region 1, Philippines.
Growing Condition (%) Age group Very Good/Good Marginal/Salty
Average (%)
21-30
5.42
6.43
5.93
31-40
17.47
11.70
14.59
41-50
34.34
36.84
35.59
51-60
25.90
28.65
27.28
61-70
13.55
12.28
12.91
71-80
3.01
3.51
3.26
No answer
0.30
0.58
0.44
Number of responses by area: Very good/good = 332; Marginal/salty = 171
4.2.1.2. Sex of the head of household. Table 5 shows the percentage distribution by sex of the head of household. Male farmers predominate as head of the household in the tobacco farming community, accounting for 93.76% of the respondents. Female as head of household constituted 6.24% of the total respondents.
Table 5. Percentage distribution of the sex of respondents as head of household
engaged in tobacco growing in Region 1, Philippines.
Growing Condition (%) Sex Very Good/Good Marginal/Salty
Average (%)
Male
92.77
94.74
93.76
Female
7.23
5.26
6.24
Number of responses by area: Very good/good = 332; Marginal/salty = 171

10
4.2.1.3. Educational level of the head of household. Farmers who are high school graduates constitute the majority of respondents representing 42.64% of the respondents (Table 6). This is followed by farmers who had obtained elementary education (29.56%). Nearly 10% of the total respondents reached college level education.
Table 6. Percentage distribution of the educational level of respondents engaged in
tobacco growing in Region 1, Philippines.
Growing Condition (%) Educational Level Very Good/Good Marginal/Salty
Average (%)
Elementary undergraduate
8.73
4.09
6.41
Elementary graduate
31.63
27.49
29.56
High school undergraduate
4.82
5.85
5.34
High school graduate
36.75
48.54
42.64
College undergraduate
3.61
4.68
4.14
College graduate
6.63
4.68
5.66
Vocational school graduate
7.23
1.75
4.49
No answer
0.60
2.92
1.76
Number of responses by area: Very good/good = 332; Marginal/salty = 171
4.2.1.4. Household size. Table 6 shows the percentage distribution of household size of tobacco farmers. Families with 3-5 members comprised 57.21% of the total respondents. This also represents the average family size in the country. This is followed by households having 6-9 members which accounted for 28.15% of the total respondents.

11
Table 7. Percentage distribution of the household size of respondents engaged in tobacco growing in Region 1, Philippines.
Growing Condition (%)
Household size Very Good/Good Marginal/Salty Average
(%)
1-2
6.33
7.60
6.96
3-5
62.35
52.05
57.21
6-9
25.90
30.41
28.15
10 or more
4.22
1.75
2.98
No answer
1.2
8.19
4.70 Number of responses by area: Very good/good = 332; Marginal/salty = 171
4.2.1.5. Total household income. This was the most difficult information that
could be obtained from the respondents since there is a perception among farmers that this could be used against them for tax purposes and receiving free input assistance. Table 8 shows the percentage distribution of the income of the farmer-respondents engaged in tobacco growing. The majority of the farmers have an annual income of less than the P 120,000 (US$ 2666.67) which is the national poverty income threshold of the country.
Table 8. Percentage distribution of the total household income of respondents engaged in tobacco growing in Region 1, Philippines.
Growing Condition (%) Income level
(‘000 PhP)* Very Good/Good Marginal/Salty Average
(%)
below 10
4.82
4.09
4.46
10-20
24.10
13.45
18.76
21-30
11.45
11.11
11.28
31-40
9.64
11.11
10.38
41-50
12.35
16.37
14.36
51-60
8.73
7.60
8.16
61-70
3.92
6.43
5.18
71-80
4.82
5.85
5.34

12
81-90
2.71
2.34
2.53
91-100
6.02
8.19
7.11
101 and higher
11.14
13.44
12.29
No answer
0.30
0
0.15
Number of responses by area: Very good/good = 332; Marginal/salty = 171 1 US$ = PhP 45
4.2.2. Non-tobacco farmers 4.2.2.1. Age of the head of household. The majority of the farmers engaged in the
cultivation of non-tobacco crops are aged 31-60 years old. This comprised 76.9% of the total populace. Again, it is noteworthy to mention that 71-80 year old farmers are still engaged in farming activities (Table 9). A small percentage of farmers (7.05%) are young, falling within the age group of 21-30 years old.
Table 9. Percentage distribution of the age of the head of household engaged in
growing crops other than tobacco in Region 1, Philippines.
Growing Condition (%) Age group Very Good/Good Marginal/Salty
Average (%)
21-30
6.40
7.69
7.05
31-40
24.39
17.31
20.85
41-50
28.96
26.28
27.62
51-60
27.44
29.49
28.47
61-70
9.45
12.82
11.13
71-80
2.74
6.41
4.58
No answer
0.62
0
0.30
Number of responses by area: Very good/good = 328; Marginal/salty = 156
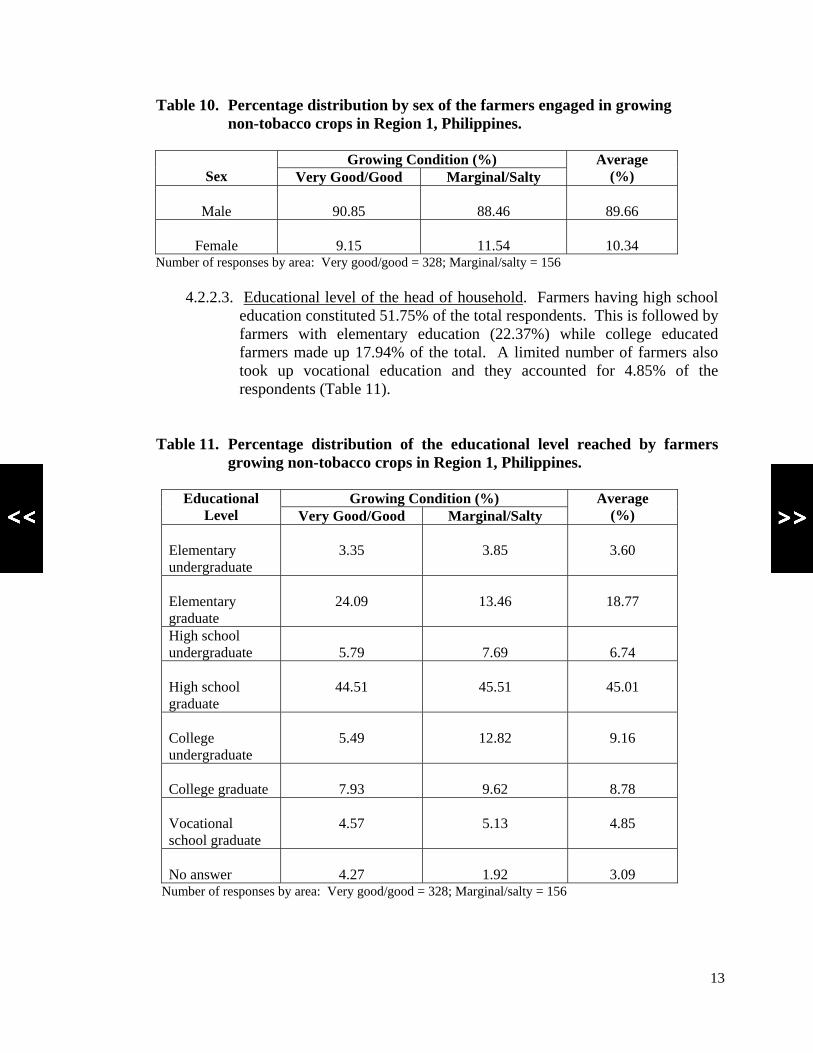
4.2.2.2. Sex of the head of household. Males generally dominate as the head of the household, accounting for almost 90% of the respondents. About 10% of the total respondents are females acting as the head of the household (Table 10).
13
Table 10. Percentage distribution by sex of the farmers engaged in growing non-tobacco crops in Region 1, Philippines.
Growing Condition (%)
Sex Very Good/Good Marginal/Salty Average
(%)
Male
90.85
88.46
89.66
Female
9.15
11.54
10.34 Number of responses by area: Very good/good = 328; Marginal/salty = 156
4.2.2.3. Educational level of the head of household. Farmers having high school
education constituted 51.75% of the total respondents. This is followed by farmers with elementary education (22.37%) while college educated farmers made up 17.94% of the total. A limited number of farmers also took up vocational education and they accounted for 4.85% of the respondents (Table 11).
Table 11. Percentage distribution of the educational level reached by farmers growing non-tobacco crops in Region 1, Philippines.
Growing Condition (%) Educational
Level Very Good/Good Marginal/Salty Average
(%) Elementary undergraduate
3.35
3.85
3.60
Elementary graduate
24.09
13.46
18.77
High school undergraduate
5.79
7.69
6.74
High school graduate
44.51
45.51
45.01
College undergraduate
5.49
12.82
9.16
College graduate
7.93
9.62
8.78
Vocational school graduate
4.57
5.13
4.85
No answer
4.27
1.92
3.09
Number of responses by area: Very good/good = 328; Marginal/salty = 156

14
4.2.2.4. Size of the household. Table 12 shows the percentage distribution of household size of farmers cultivating non-tobacco crops. As with the tobacco farmers, families having 3-5 members in the household predominate (62.89%). This is within the normal family size in the country which is 5 persons. Households having 6-9 members constitute 25.89% of the total households while those having 10 or more persons had the least frequency which is 0.15%.
Table 12. Percentage distribution of the size of household of farmers growing
non-tobacco crops in Region 1, Philippines.
Growing Condition (%) Household size Very Good/Good Marginal/Salty
Average (%)
1-2
9.76
8.33
9.04
3-5
66.16
59.62
62.89
6-9
21.65
30.13
25.89
10 or more
0.30
0
0.15
No answer
2.13
1.92
2.03
Number of responses by area: Very good/good = 328; Marginal/salty = 156
4.2.2.5. Total household income. On the average, households with an annual income of more than P 100,000 had the highest frequency (18.53%) followed by those household with an income of P 10,000-20,000 or US$ 222.22-444.44 (16.78%). This exhibits a great disparity in income among farmers. In marginal/salty areas, this is more evident since those having an income greater than P 100,000 (US$2,222.22) constitutes close to 25% of the respondents (Table 13). Hence, a considerable number of farmers were near/above the threshold poverty level income of P 120,000/annum (US$ 2,666.67).
Table 13. Percentage distribution of the total annual income of household of farmers growing non-tobacco crops in Region 1, Philippines.
Growing Condition (%) Income Range
( ‘000 PhP) Very Good/Good Marginal/Salty Average
(%)
Below 10
8.23
4.49
6.36
10-20
20.74
12.82
16.78
21-30
14.64
14.10
14.37

15
31-40
9.15
2.56
5.86
41-50
13.72
13.46
13.59
51-60
5.49
4.49
4.99
61-70
2.74
6.42
4.58
71-80
5.18
9.62
7.40
81-90
1.84
2.56
2.20
91-100
3.96
5.78
4.87
101 and higher
14.01
23.06
18.53
No answer
0.30
0.64
0.47
Number of responses by area: Very good/good = 328; Marginal/salty = 156
4.3. Farming Characteristics
4.3.1. Tobacco farming
4.3.1.1. Type of tobacco planted. There are 3 types of tobacco that are cultivated by farmers, namely: a) native; b) burley; and 3) Virginia. Among these three, Virginia was planted by almost two-third of the farmer-respondents. This is followed by burley tobacco, grown by about 25% of the farmers. Native tobacco was the least preferred of the three. (Table 14).
Table 14. Percentage distribution of the types of tobacco planted by farmers in
Region 1, Philippines.
Growing Condition (%) Type Very Good/Good Marginal/Salty
Average (%)
Native
6.63
8.19
7.41
Burley
23.80
28.07
25.93
Virginia
69.58
63.74
66.66
Number of responses by area: Very good/good = 332; Marginal/salty = 171
However, a look on the provincial level suggests that preference for burley in Pangasinan was most evident since 96% of the farmers

16
planted it. In La Union, more than ¼ of the farmer-respondents planted the native type. The Virginia variety predominates in Ilocos Norte, Ilocos Sur and La Union since this was preferred by buyers/traders (Table 15).
Table 15. Percentage distribution of the types of tobacco planted by farmers in
the 4 provinces in Region 1, Philippines.
Type (%) Province Native Burley Virginia
Ilocos Norte
0.7
0.7
98.6
Ilocos Sur
0.7
2.3
97.0
La Union
26.8
0.9
72.3
Pangasinan
3.2
96.0
0.8
Number of responses by area = 503
4.3.1.2. Farm size. Areas devoted to tobacco cultivation are generally small. Table 16 shows the percentage distribution of farm size in the cultivation of tobacco in Region 1. More than 80% of the area cultivated by farmers is 1 hectare or less which is the average farm size for small farmers in the country. Farmers with areas of 1.1 to 2 hectares constituted 14.16% of the total respondents.
Table 16. Percentage distribution of farm size of farmers growing tobacco in
Region 1, Philippines.
Growing Condition (%) Farm size (ha) Very Good/Good Marginal/Salty
Average (%)
0.5 and below
44.88
39.77
42.32
0.6-1.0
35.84
43.27
39.56
1.1-1.5
9.64
5.85
7.76
1.6-2.0
7.53
5.26
6.40
2.1-2.5
0
2.92
1.46
2.6-3.0
0.90
1.75
1.32
More than 3.0
1.20
1.17
1.18
Number of responses by area: Very good/good = 328; Marginal/salty = 156

17
4.3.1.3. Tenurial status of farmers. This is categorized into several groups, namely: a) tenant; b) owner; c) tenant/owner wherein part of the total area cultivated is owned by the farmer; d) rented/leaseholder wherein the farmer rents the area being cultivated on a season to season basis without any relationship with the owner; and e) owner/leaseholder wherein part of the area planted with tobacco is being leased by the farmer. Table 17 shows the percentage distribution of the tenurial status of farmers cultivating tobacco. Tenant farmers predominant, accounting for 72.96% of the respondents. Only 24.52% of the land being cultivated are owned by the farmers themselves. Only a small fraction of the farmers leased their land for tobacco cultivation.
Table 17. Percentage distribution of the tenurial status of farmers cultivating
tobacco in Region 1, Philippines.
Growing Condition (%) Status Very Good/Good Marginal/Salty
Average (%)
Tenant
55.12
63.16
59.14
Owner
26.81
22.22
24.52
Tenant/Owner
15.36
12.28
13.82
Rented/Leaseholder
2.40
1.75
2.08
Owner/leaseholder
0.30
0
0.15
No answer
0
0.58
0.29
Number of responses by area: Very good/good = 328; Marginal/salty = 156
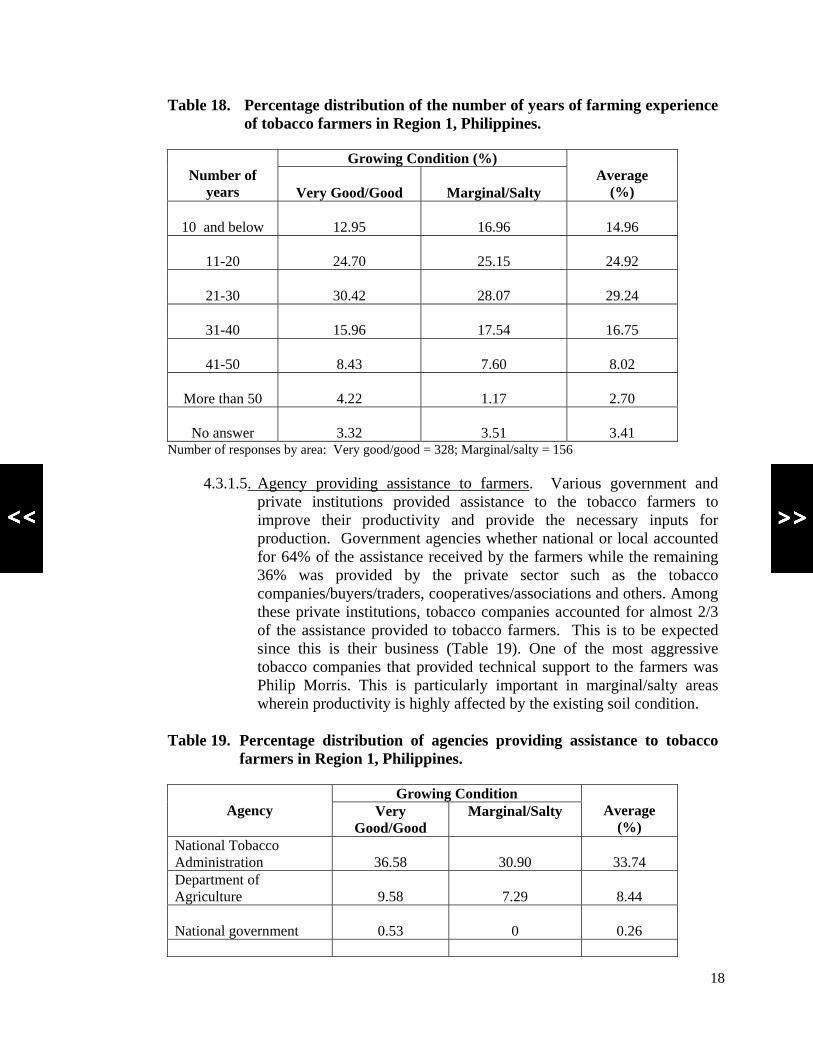
4.3.1.4. Number of years in tobacco farming. Farming experience was grouped based on a ten year interval. Table 18 shows the percentage distribution of the number of years that tobacco farmers had been engaged in tobacco farming. Close to 70% of the total respondents had been in farming for 11-40 years. This had provided them ample experience in tobacco cultivation. There were even farmers who had been involved in tobacco cultivation for more than 50 years.
18
Table 18. Percentage distribution of the number of years of farming experience of tobacco farmers in Region 1, Philippines.
Growing Condition (%)
Number of years
Very Good/Good
Marginal/Salty
Average
(%)
10 and below
12.95
16.96
14.96
11-20
24.70
25.15
24.92
21-30
30.42
28.07
29.24
31-40
15.96
17.54
16.75
41-50
8.43
7.60
8.02
More than 50
4.22
1.17
2.70
No answer
3.32
3.51
3.41 Number of responses by area: Very good/good = 328; Marginal/salty = 156
4.3.1.5. Agency providing assistance to farmers. Various government and
private institutions provided assistance to the tobacco farmers to improve their productivity and provide the necessary inputs for production. Government agencies whether national or local accounted for 64% of the assistance received by the farmers while the remaining 36% was provided by the private sector such as the tobacco companies/buyers/traders, cooperatives/associations and others. Among these private institutions, tobacco companies accounted for almost 2/3 of the assistance provided to tobacco farmers. This is to be expected since this is their business (Table 19). One of the most aggressive tobacco companies that provided technical support to the farmers was Philip Morris. This is particularly important in marginal/salty areas wherein productivity is highly affected by the existing soil condition.
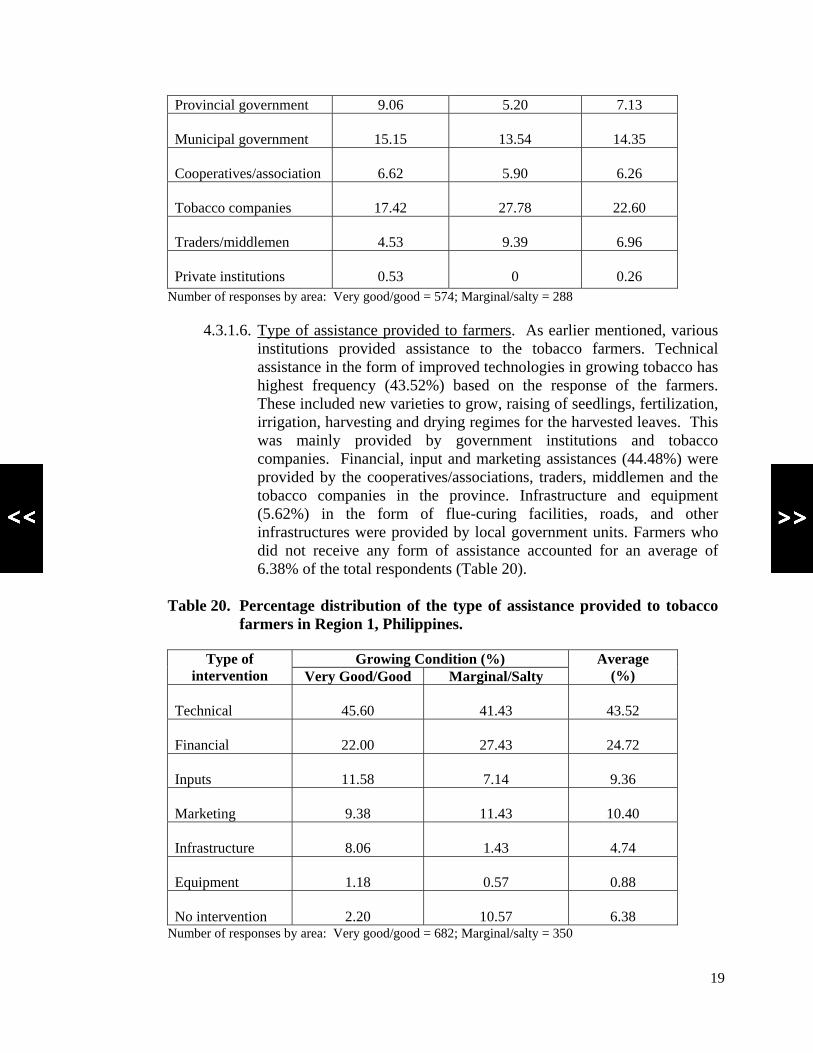
Table 19. Percentage distribution of agencies providing assistance to tobacco
farmers in Region 1, Philippines.
Growing Condition Agency Very
Good/Good Marginal/Salty
Average
(%) National Tobacco Administration
36.58
30.90
33.74
Department of Agriculture
9.58
7.29
8.44
National government
0.53
0
0.26
19
Provincial government 9.06 5.20 7.13 Municipal government
15.15
13.54
14.35
Cooperatives/association
6.62
5.90
6.26
Tobacco companies
17.42
27.78
22.60
Traders/middlemen
4.53
9.39
6.96
Private institutions
0.53
0
0.26
Number of responses by area: Very good/good = 574; Marginal/salty = 288
4.3.1.6. Type of assistance provided to farmers. As earlier mentioned, various institutions provided assistance to the tobacco farmers. Technical assistance in the form of improved technologies in growing tobacco has highest frequency (43.52%) based on the response of the farmers. These included new varieties to grow, raising of seedlings, fertilization, irrigation, harvesting and drying regimes for the harvested leaves. This was mainly provided by government institutions and tobacco companies. Financial, input and marketing assistances (44.48%) were provided by the cooperatives/associations, traders, middlemen and the tobacco companies in the province. Infrastructure and equipment (5.62%) in the form of flue-curing facilities, roads, and other infrastructures were provided by local government units. Farmers who did not receive any form of assistance accounted for an average of 6.38% of the total respondents (Table 20).
Table 20. Percentage distribution of the type of assistance provided to tobacco
farmers in Region 1, Philippines.
Growing Condition (%) Type of intervention Very Good/Good Marginal/Salty
Average (%)
Technical
45.60
41.43
43.52
Financial
22.00
27.43
24.72
Inputs
11.58
7.14
9.36
Marketing
9.38
11.43
10.40
Infrastructure
8.06
1.43
4.74
Equipment
1.18
0.57
0.88
No intervention
2.20
10.57
6.38
Number of responses by area: Very good/good = 682; Marginal/salty = 350

20
4.3.1.6. Reasons for planting tobacco. Table 21 shows the reasons given by farmers in choosing to plant tobacco and their percentage distribution. Among the predominant reasons given were: a) profitability of growing tobacco; b) availability of market; c) presence of technology in growing tobacco; d) availability of farm input including labor; e) suitability of the area/climate; and f) familiarity in the production technology/farming experience. It is Surprising that in marginal/salty areas, the response obtained from farmers on the suitability of the climate/area is more or less similar to that in the very good/good areas. It is known that even though tobacco can be grown in these areas, its yield level is greatly affected by these soil conditions.
Table 21. Percentage distribution for reasons given by farmers in Region 1,
Philippines why they prefer to grow tobacco.
Growing Condition (%) Reason for planting Very Good/Good Marginal/Salty
Average (%)
Profitable
17.98
15.75
16.87
Available market
16.73
15.75
16.24
Available technology
13.38
14.13
13.76
Available farm labor/input
13.98
15.04
14.51
Suitable area/climate
13.68
14.63
14.16
Farm experience/ familiarity of production
16.31
14.13
15.22
Resistance to prevailing pest
7.41
9.65
8.53
Farmers preference
0.30
0.20
0.25
Available assistance
0.17
0
0.08
Family needs
0
0.40
0.20
No answer
0.06
0.30
0.18
Number of responses by area: Very good/good = 1,674; Marginal/salty = 984
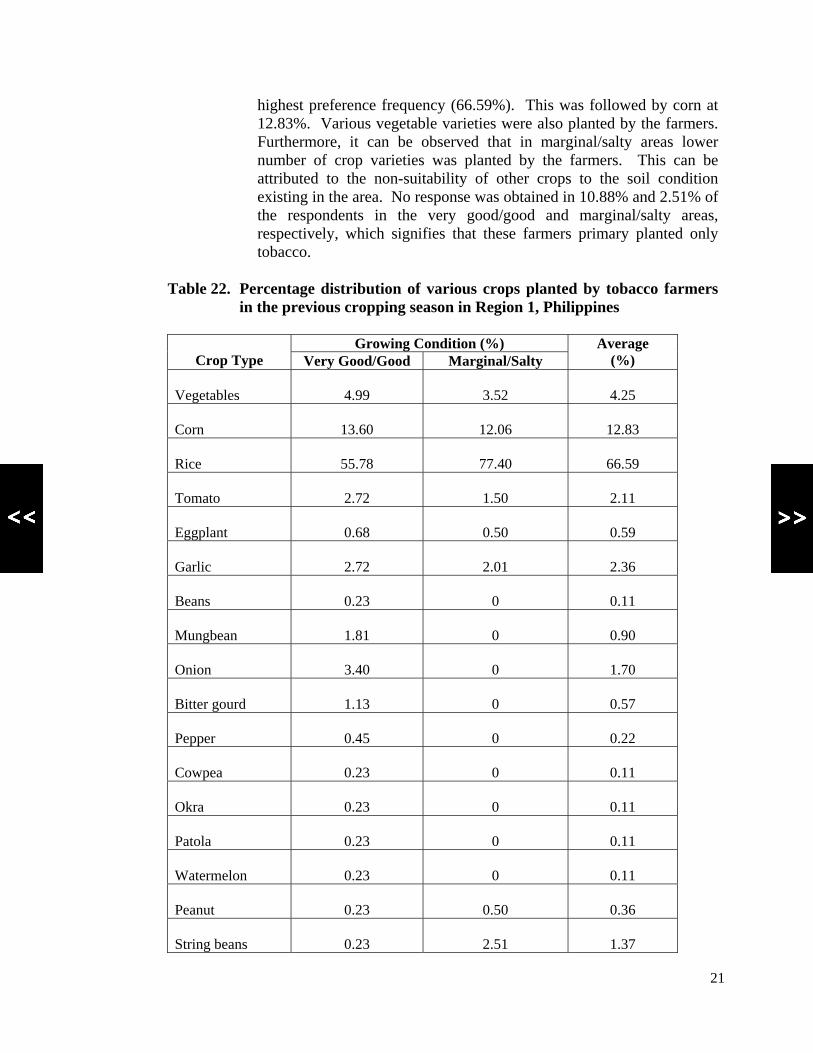
4.3.1.7. Other crops planted by tobacco farmers. The tobacco farmers interviewed in this Survey had also experienced planting other crops in the previous years. Table 22 shows the list crops that were planted and their frequency distribution in terms of preference of the farmer. Rice, being the main crop for the farmers during the rainy months had the
21
highest preference frequency (66.59%). This was followed by corn at 12.83%. Various vegetable varieties were also planted by the farmers. Furthermore, it can be observed that in marginal/salty areas lower number of crop varieties was planted by the farmers. This can be attributed to the non-suitability of other crops to the soil condition existing in the area. No response was obtained in 10.88% and 2.51% of the respondents in the very good/good and marginal/salty areas, respectively, which signifies that these farmers primary planted only tobacco.
Table 22. Percentage distribution of various crops planted by tobacco farmers
in the previous cropping season in Region 1, Philippines
Growing Condition (%) Crop Type Very Good/Good Marginal/Salty
Average (%)
Vegetables
4.99
3.52
4.25
Corn
13.60
12.06
12.83
Rice
55.78
77.40
66.59
Tomato
2.72
1.50
2.11
Eggplant
0.68
0.50
0.59
Garlic
2.72
2.01
2.36
Beans
0.23
0
0.11
Mungbean
1.81
0
0.90
Onion
3.40
0
1.70
Bitter gourd
1.13
0
0.57
Pepper
0.45
0
0.22
Cowpea
0.23
0
0.11
Okra
0.23
0
0.11
Patola
0.23
0
0.11
Watermelon
0.23
0
0.11
Peanut
0.23
0.50
0.36
String beans
0.23
2.51
1.37

22
Balatora
0.23
0
0.11
No answer
10.88
2.51
6.70
Number of responses by area: Very good/good = 441; Marginal/salty = 203
4.3.2. Non-tobacco farming 4.3.2.1. Crops planted. Table 23 shows the list of crops planted by the non-
tobacco farmers and its percentage distribution during the cropping season covered by the Survey. This included corn, jute, mungbean, peanut, pigeon pea and various types of vegetables such as tomato, eggplant, garlic, onion, beans, bitter gourd, pepper, squash, gourd, string beans, bell pepper, okra and others. Corn was the predominant crop chosen by farmers which accounted for 53.32% of the total respondents. This was followed by various vegetable varieties wherein tomato was the most popular among them. This was due to the presence of a tomato processing company, Northern Foods Incorporated in Ilocos Norte. In the marginal/salty areas, lower number of crop varieties was planted by the farmers.
Table 23. List of crops planted by non-tobacco farmers and their percentage
distribution in Region 1, Philippines.
Growing Condition (%) Crop Planted Very Good/Good Marginal/Salty
Average (%)
Vegetable
6.23
6.18
6.20
Tomato
7.67
7.22
7.44
Corn
52.52
54.12
53.32
Eggplant
5.28
3.60
4.44
Jute
0.24
0
0.12
Mungbean
5.76
1.03
3.40
Garlic
2.64
2.57
2.60
Beans
0.72
0.52
0.62
Onion
6.48
0
3.24
Pechay
0.48
0
0.24
Bitter gourd
2.16
1.03
1.60

23
Peanut
2.40
9.80
6.10
Pepper (hot/ sweet)
1.20
1.55
1.38
Squash
0.72
1.03
0.88
Watermelon
0.72
0
0.36
Gourd
0.24
0.52
0.37
Pigeon pea
0.24
0
0.12
String beans
2.40
1.55
1.98
Bell pepper
0.48
0
0.24
Okra
0.95
0
0.47
Others
0.47
9.28
4.88
Number of responses by area: Very good/good = 676; Marginal/salty = 330
4.3.2.2. Farm size. The majority of the farms cultivated by non-tobacco farmers has an area of 1.0 hectare or less. It constitutes 81.91% of the total respondents in the Survey. The frequency of farmers having larger areas decreases as the size of the farm increases. In the very good/good areas for tobacco, no farm Surveyed has an area of 3.0 hectares or higher. It is only in the marginal/salty areas where this was observed (Table 24).

24
Table 24. Percentage distribution of the size of farms cultivated by non-tobacco farmers in Region 1, Philippines.
Growing Condition (%)
Area (ha) Very Good/Good Marginal/Salty Average
(%)
0.5 and below
51.83
45.52
48.68
0.6-1.0
27.44
33.97
30.70
1.1-1.5
10.98
8.97
9.98
1.6-2.0
7.62
5.14
6.38
2.1-2.5
0.91
0.64
0.78
2.6-3.0
0.61
2.56
1.58
3.1 and higher
0
2.56
1.28
No answer
0.61
0.64
0.62 Number of responses by area: Very good/good = 328; Marginal/salty = 156
4.3.2.3. Tenurial status of farmers. Table 25 shows the tenurial status of non-
tobacco farmers and its percentage distribution. Tenant and owner farmers had almost similar frequency (39%) among the various tenurial statuses. However, 50% of the farmers in the marginal/salty areas own their farms while in the very good/good areas, it accounted for only 30% of the farmers in this category.
Table 25. Tenurial status of non-tobacco farmers and their percentage distribution in Region 1, Philippines.
Growing Condition
Status Very Good/Good Marginal/Salty Average
(%) Tenant
47.26
31.42
39.34
Owner
29.88
50.00
39.94
Tenant/owner
20.74
15.38
18.06
Rented/leaseholder
0.60
1.92
1.26
Owner/leaseholder
0.30
0
0.15
No answer
1.22
1.28
1.25
Number of responses by area: Very good/good = 328; Marginal/salty = 156
25
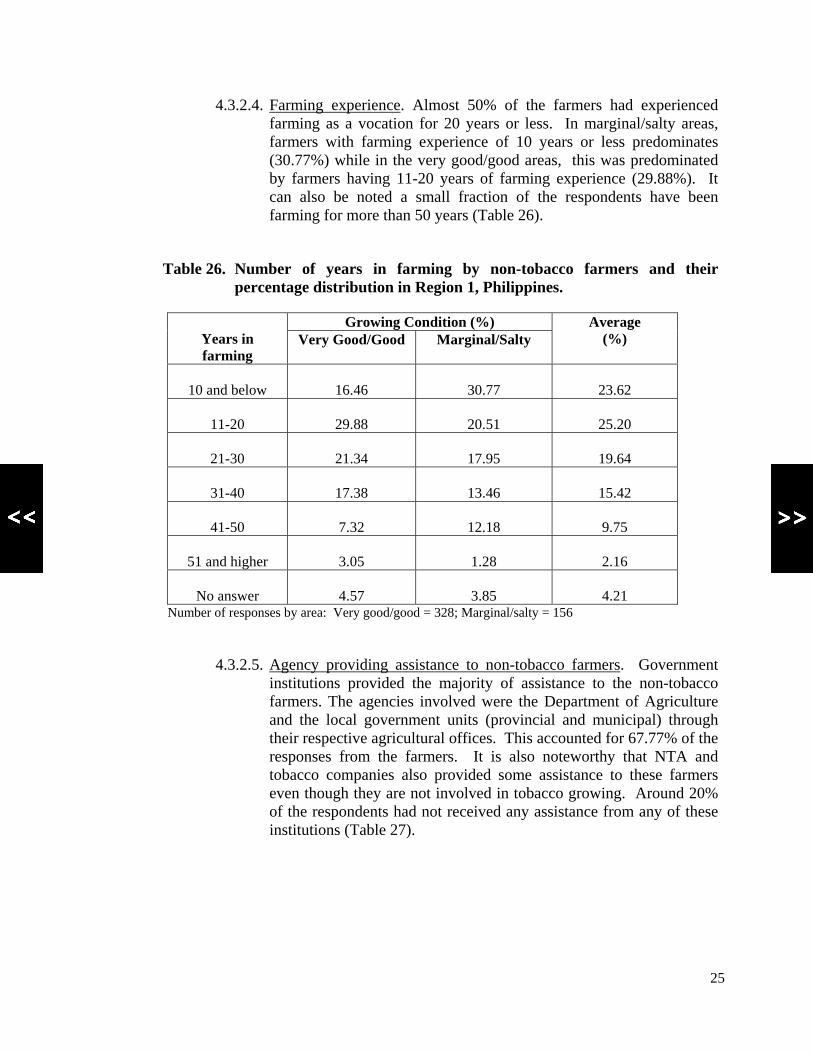
4.3.2.4. Farming experience. Almost 50% of the farmers had experienced farming as a vocation for 20 years or less. In marginal/salty areas, farmers with farming experience of 10 years or less predominates (30.77%) while in the very good/good areas, this was predominated by farmers having 11-20 years of farming experience (29.88%). It can also be noted a small fraction of the respondents have been farming for more than 50 years (Table 26).
Table 26. Number of years in farming by non-tobacco farmers and their percentage distribution in Region 1, Philippines.
Growing Condition (%)
Years in farming
Very Good/Good Marginal/Salty Average
(%)
10 and below
16.46
30.77
23.62
11-20
29.88
20.51
25.20
21-30
21.34
17.95
19.64
31-40
17.38
13.46
15.42
41-50
7.32
12.18
9.75
51 and higher
3.05
1.28
2.16
No answer
4.57
3.85
4.21
Number of responses by area: Very good/good = 328; Marginal/salty = 156
4.3.2.5. Agency providing assistance to non-tobacco farmers. Government
institutions provided the majority of assistance to the non-tobacco farmers. The agencies involved were the Department of Agriculture and the local government units (provincial and municipal) through their respective agricultural offices. This accounted for 67.77% of the responses from the farmers. It is also noteworthy that NTA and tobacco companies also provided some assistance to these farmers even though they are not involved in tobacco growing. Around 20% of the respondents had not received any assistance from any of these institutions (Table 27).
26
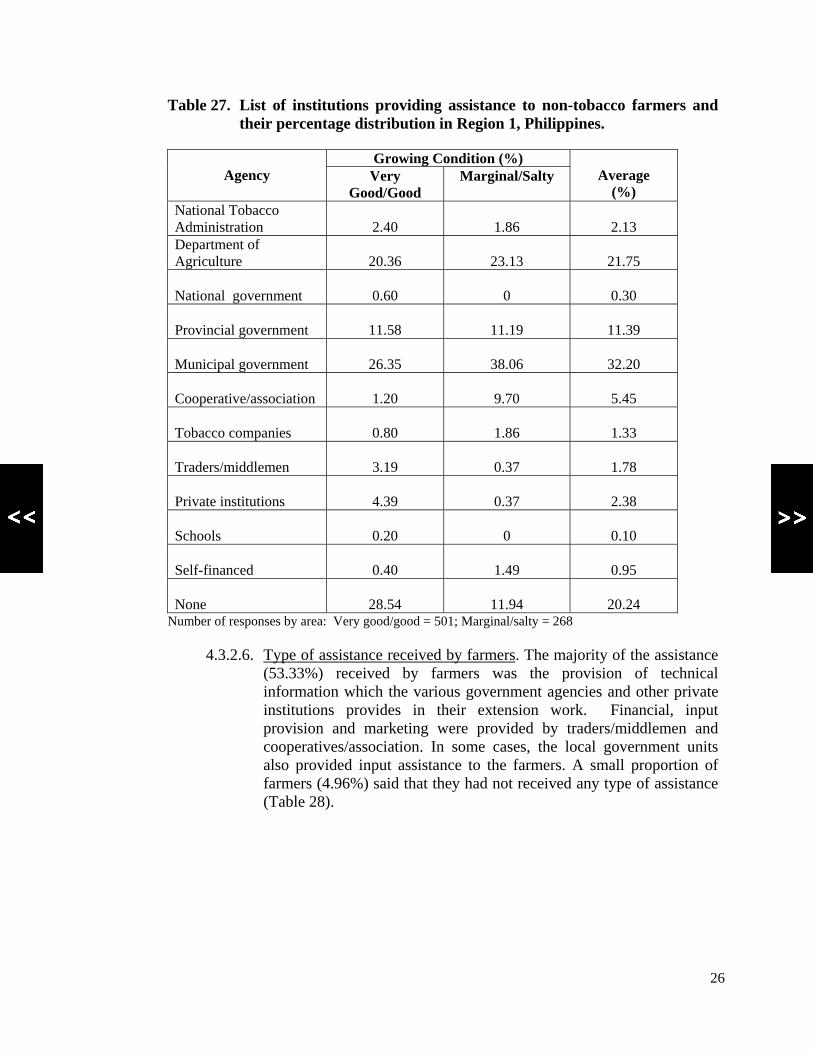
Table 27. List of institutions providing assistance to non-tobacco farmers and their percentage distribution in Region 1, Philippines.
Growing Condition (%)
Agency Very Good/Good
Marginal/Salty
Average (%)
National Tobacco Administration
2.40
1.86
2.13
Department of Agriculture
20.36
23.13
21.75
National government
0.60
0
0.30
Provincial government
11.58
11.19
11.39
Municipal government
26.35
38.06
32.20
Cooperative/association
1.20
9.70
5.45
Tobacco companies
0.80
1.86
1.33
Traders/middlemen
3.19
0.37
1.78
Private institutions
4.39
0.37
2.38
Schools
0.20
0
0.10
Self-financed
0.40
1.49
0.95
None
28.54
11.94
20.24
Number of responses by area: Very good/good = 501; Marginal/salty = 268
4.3.2.6. Type of assistance received by farmers. The majority of the assistance (53.33%) received by farmers was the provision of technical information which the various government agencies and other private institutions provides in their extension work. Financial, input provision and marketing were provided by traders/middlemen and cooperatives/association. In some cases, the local government units also provided input assistance to the farmers. A small proportion of farmers (4.96%) said that they had not received any type of assistance (Table 28).

27
Table 28. Percentage distribution of the assistance received by non-tobacco farmers in Region 1, Philippines.
Growing Condition (%)
Kind of assistance
Very Good/Good Marginal/Salty Average
(%)
Technical
43.34
63.33
53.33
Financial
13.84
12.92
13.38
Inputs
25.06
9.17
17.11
Marketing
1.83
5.00
3.41
Infrastructure
8.88
2.08
5.48
Equipment
1.04
1.25
1.15
Package of technology
2.09
0
1.05
Need driven
0.26
0
0.13
No intervention
3.66
6.25
4.96
Number of responses by area: Very good/good = 383; Marginal/salty = 240
4.3.2.7. Reasons for growing non-tobacco crops continuously. Farmers cultivating non-tobacco crops provided various reasons why they chose to plant a particular specie. Predominant reasons given were: a) profitability of the crop; b) availability of market; c) availability of technology of production, farm inputs and labor; d) suitable area/climate for the crop; and e) familiarity to production technique. These were similar reasons provided by farmers for their decision to plant tobacco. It is noteworthy to mention that some farmers, even though they represent a small proportion of the respondents, had eluded that planting non-tobacco crops require less labor and input and which fetch a higher price in the market compared to tobacco. (Table 29).
28
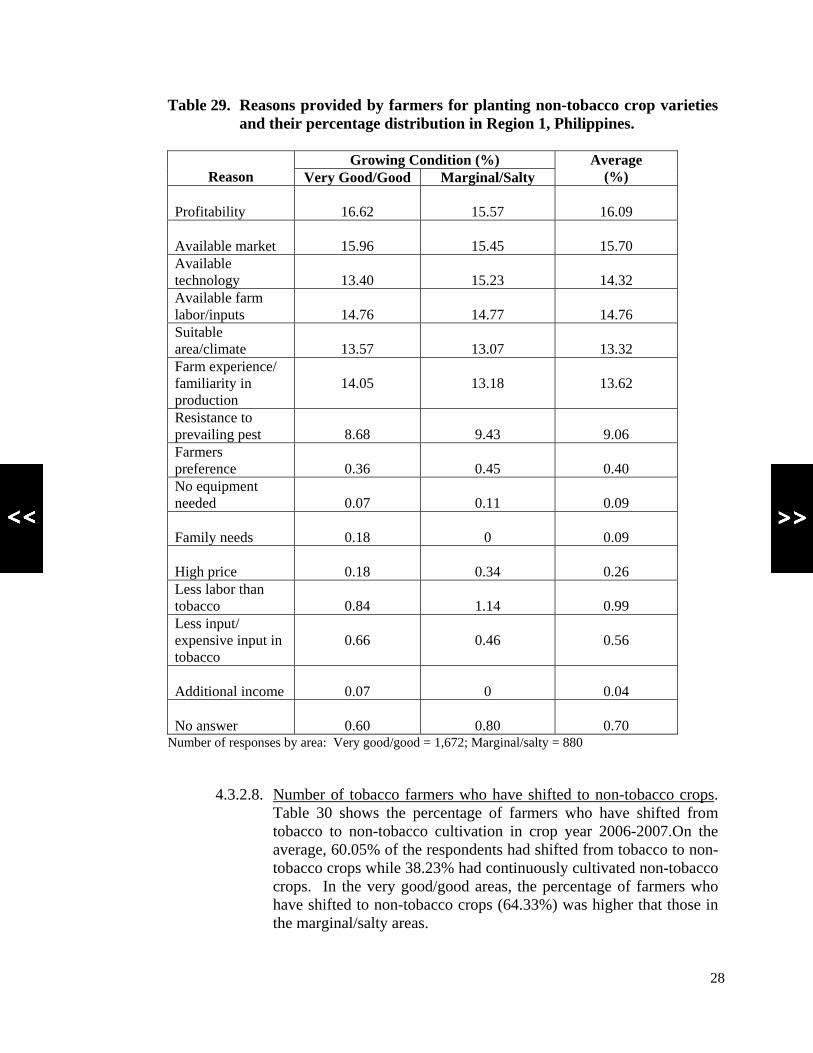
Table 29. Reasons provided by farmers for planting non-tobacco crop varieties and their percentage distribution in Region 1, Philippines.
Growing Condition (%)
Reason Very Good/Good Marginal/Salty Average
(%) Profitability
16.62
15.57
16.09
Available market
15.96
15.45
15.70
Available technology
13.40
15.23
14.32
Available farm labor/inputs
14.76
14.77
14.76
Suitable area/climate
13.57
13.07
13.32
Farm experience/ familiarity in production
14.05
13.18
13.62
Resistance to prevailing pest
8.68
9.43
9.06
Farmers preference
0.36
0.45
0.40
No equipment needed
0.07
0.11
0.09
Family needs
0.18
0
0.09
High price
0.18
0.34
0.26
Less labor than tobacco
0.84
1.14
0.99
Less input/ expensive input in tobacco
0.66
0.46
0.56
Additional income
0.07
0
0.04
No answer
0.60
0.80
0.70
Number of responses by area: Very good/good = 1,672; Marginal/salty = 880
4.3.2.8. Number of tobacco farmers who have shifted to non-tobacco crops.
Table 30 shows the percentage of farmers who have shifted from tobacco to non-tobacco cultivation in crop year 2006-2007.On the average, 60.05% of the respondents had shifted from tobacco to non-tobacco crops while 38.23% had continuously cultivated non-tobacco crops. In the very good/good areas, the percentage of farmers who have shifted to non-tobacco crops (64.33%) was higher that those in the marginal/salty areas.

29
Table 30. Percentage distribution of farmers who planted tobacco and non-tobacco crops during the previous cropping season in Region 1, Philippines.
Growing Condition Crop planted
the previous cropping
Very Good/Good Marginal/Salty
Average (%)
Tobacco
64.33
55.77
60.05
Non-tobacco
34.15
42.31
38.23
No answer
1.52
1.92
1.72
Number of responses by area: Very good/good = 328; Marginal/salty = 156
4.3.2.9. Reasons for shifting from tobacco to non-tobacco crop species. Table
31 shows the reasons given by farmers who had shifted from tobacco to non-tobacco crops this cropping season. Predominant reasons given were: a) it required less labor (35.38%); b) high input cost for tobacco cultivation (23.98%); c) farmer’s preference (14.06%); and d) low price for tobacco (6.22%). These accounted for nearly 80% of the response obtained from the farmer-respondents.
Table 31. Reasons provided by farmers for shifting from tobacco to non-tobacco
crops during the crop year 2006-2007 and their percentage distribution in Region 1, Philippines.
Growing Condition (%)
Reason Very Good/Good Marginal/Salty Average
(%) Farmer’s preference
13.84
14.28
14.06
Source of income/food
3.96
3.89
3.92
Less labor
3 5.04
35.71
35.38
Higher profitability
4.24
3.25
3.75
Unsuitability of tobacco to area/climate
2.54
4.54
3.54
Lack of market/ buyer for tobacco
4.80
3.25
4.02
Farming experience
2.54
3.90
3.22
Available assistance
0
0.65
0.32
No assistance to tobacco
0.85
0.65
0.75
30
High input cost for tobacco
24.58
23.38
23.98
Available equipment
0.28
0
0.14
Disease incidence for tobacco
0.28
0
0.14
Low price for tobacco
5.93
6.50
6.22
Resistance to disease
0.56
0
0.28
No answer
0.56
0
0.28
Number of responses by area: Very good/good = 196; Marginal/salty = 100
4.4. Farmers’ Perception of Tobacco Farming
4.4.1. Tobacco farmers
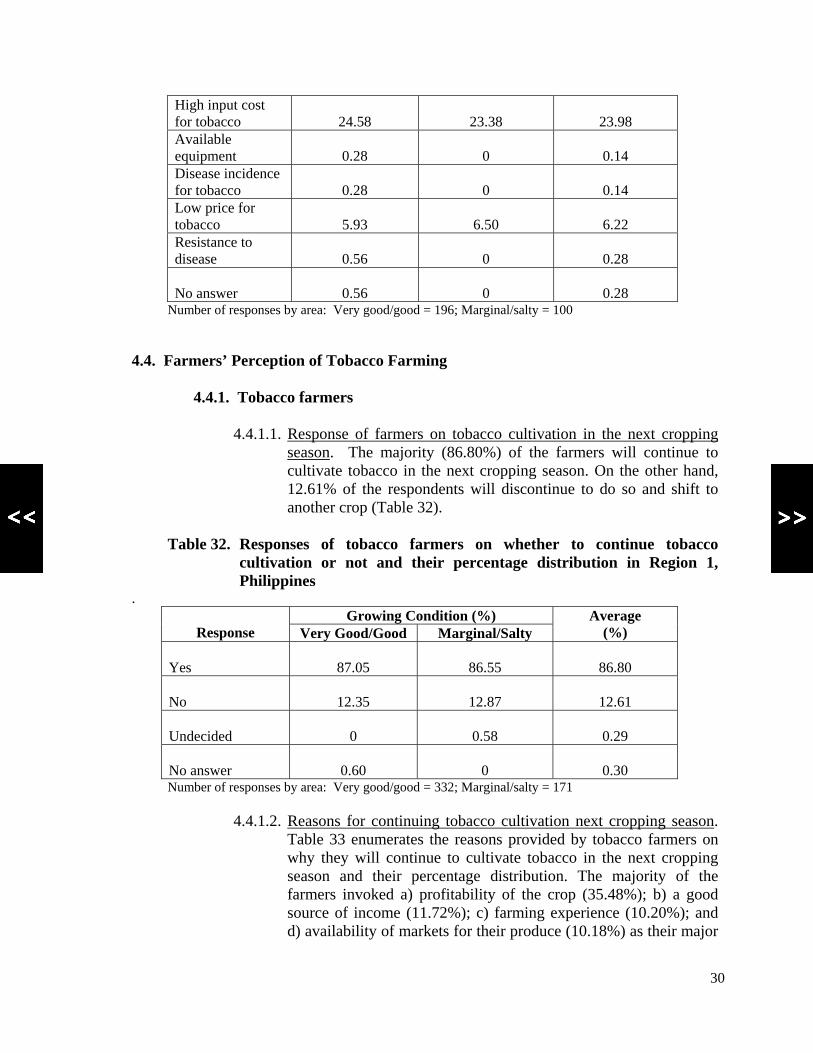
4.4.1.1. Response of farmers on tobacco cultivation in the next cropping season. The majority (86.80%) of the farmers will continue to cultivate tobacco in the next cropping season. On the other hand, 12.61% of the respondents will discontinue to do so and shift to another crop (Table 32).
Table 32. Responses of tobacco farmers on whether to continue tobacco
cultivation or not and their percentage distribution in Region 1, Philippines
. Growing Condition (%)
Response Very Good/Good Marginal/Salty Average
(%) Yes
87.05
86.55
86.80
No
12.35
12.87
12.61
Undecided
0
0.58
0.29
No answer
0.60
0
0.30
Number of responses by area: Very good/good = 332; Marginal/salty = 171
4.4.1.2. Reasons for continuing tobacco cultivation next cropping season. Table 33 enumerates the reasons provided by tobacco farmers on why they will continue to cultivate tobacco in the next cropping season and their percentage distribution. The majority of the farmers invoked a) profitability of the crop (35.48%); b) a good source of income (11.72%); c) farming experience (10.20%); and d) availability of markets for their produce (10.18%) as their major

31
reasons for continuing tobacco cultivation. In the marginal/salty areas, profitability of the crop (41.67%) was the major consideration for farmers in deciding to continue tobacco cultivation.
Table 33. Reasons provided by tobacco farmers in deciding to continue tobacco
cultivation in the next cropping season and their percentage distribution in Region 1, Philippines.
Growing Condition (%)
Reason Very Good/Good Marginal/Salty Average
(%) Farmer’s preference
7.27
3.33
5.3
Source of income/food
13.44
10.00
11.72
Availability of inputs/labor
9.03
6.25
7.64
Profitability
29.30
41.67
35.48
Suitable area/climate
6.17
5.83
6.00
Available market
10.35
10.00
10.18
Farming experience
14.98
5.42
10.20
Available assistance
7.27
7.92
7.60
Good/high price
0.22
0
0.11
Family needs
0.87
9.58
5.22
No answer
1.10
0
0.55
Number of responses by area: Very good/good = 454; Marginal/salty = 240 4.4.1.3. Reasons for shifting from tobacco to another crop in the next
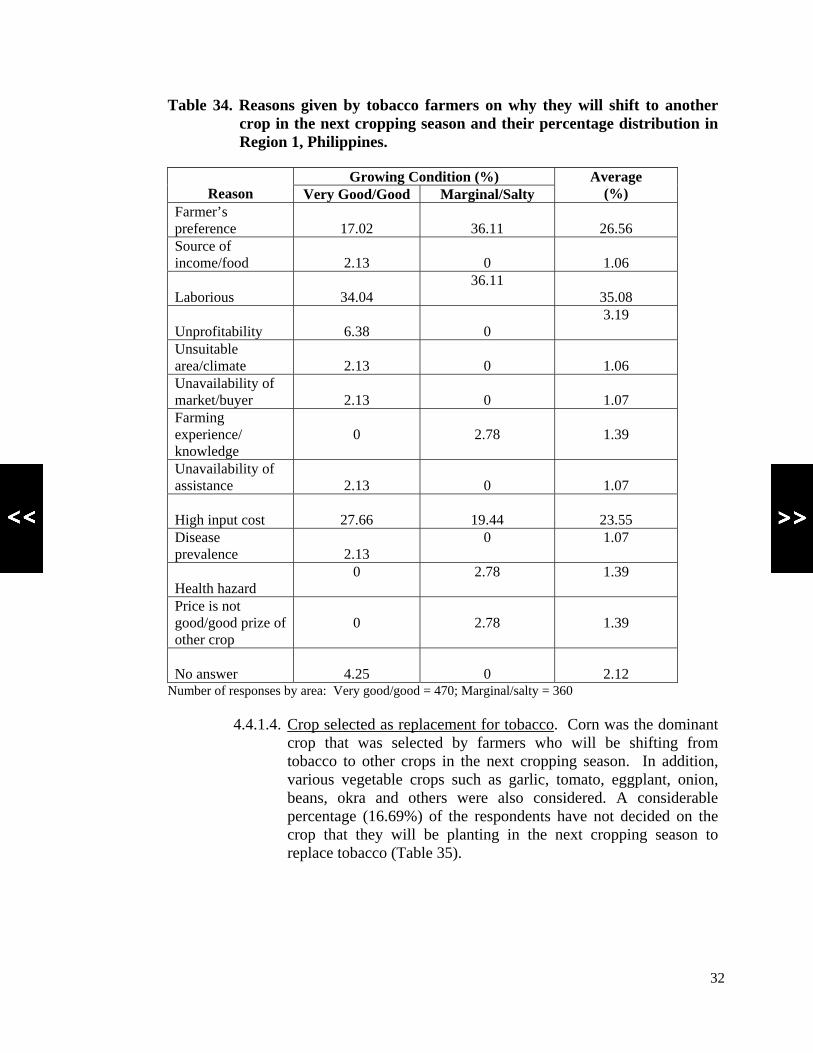
cropping season. Laborious (35.08%), farmer’s preference (26.56%) and high input cost (23.55%) were the major reasons provided by farmers who intend to plant other crops in the next cropping season. Other reasons such as unprofitability, low prices, minimal farming experience, etc, accounted for the remainder of the responses provided by the farmer-respondents (Table 34)
32
Table 34. Reasons given by tobacco farmers on why they will shift to another crop in the next cropping season and their percentage distribution in Region 1, Philippines.
Growing Condition (%)
Reason Very Good/Good Marginal/Salty Average
(%) Farmer’s preference
17.02
36.11
26.56
Source of income/food
2.13
0
1.06
Laborious
34.04
36.11 35.08
Unprofitability
6.38
0
3.19
Unsuitable area/climate
2.13
0
1.06
Unavailability of market/buyer
2.13
0
1.07
Farming experience/ knowledge
0
2.78
1.39
Unavailability of assistance
2.13
0
1.07
High input cost
27.66
19.44
23.55
Disease prevalence
2.13
0 1.07
Health hazard
0 2.78 1.39
Price is not good/good prize of other crop
0
2.78
1.39
No answer
4.25
0
2.12
Number of responses by area: Very good/good = 470; Marginal/salty = 360 4.4.1.4. Crop selected as replacement for tobacco. Corn was the dominant
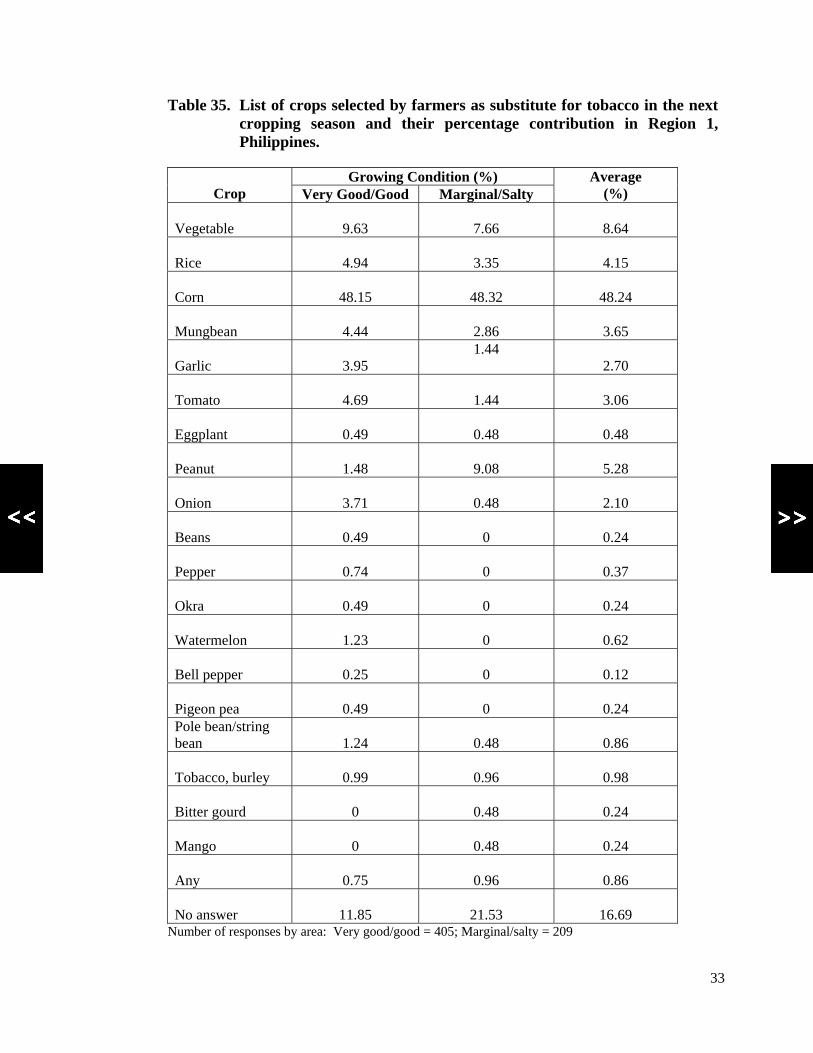
crop that was selected by farmers who will be shifting from tobacco to other crops in the next cropping season. In addition, various vegetable crops such as garlic, tomato, eggplant, onion, beans, okra and others were also considered. A considerable percentage (16.69%) of the respondents have not decided on the crop that they will be planting in the next cropping season to replace tobacco (Table 35).
33
Table 35. List of crops selected by farmers as substitute for tobacco in the next cropping season and their percentage contribution in Region 1, Philippines.
Growing Condition (%)
Crop Very Good/Good Marginal/Salty Average
(%) Vegetable
9.63
7.66
8.64
Rice
4.94
3.35
4.15
Corn
48.15
48.32
48.24
Mungbean
4.44
2.86
3.65
Garlic
3.95
1.44 2.70
Tomato
4.69
1.44
3.06
Eggplant
0.49
0.48
0.48
Peanut
1.48
9.08
5.28
Onion
3.71
0.48
2.10
Beans
0.49
0
0.24
Pepper
0.74
0
0.37
Okra
0.49
0
0.24
Watermelon
1.23
0
0.62
Bell pepper
0.25
0
0.12
Pigeon pea
0.49
0
0.24
Pole bean/string bean
1.24
0.48
0.86
Tobacco, burley
0.99
0.96
0.98
Bitter gourd
0
0.48
0.24
Mango
0
0.48
0.24
Any
0.75
0.96
0.86
No answer
11.85
21.53
16.69
Number of responses by area: Very good/good = 405; Marginal/salty = 209
34
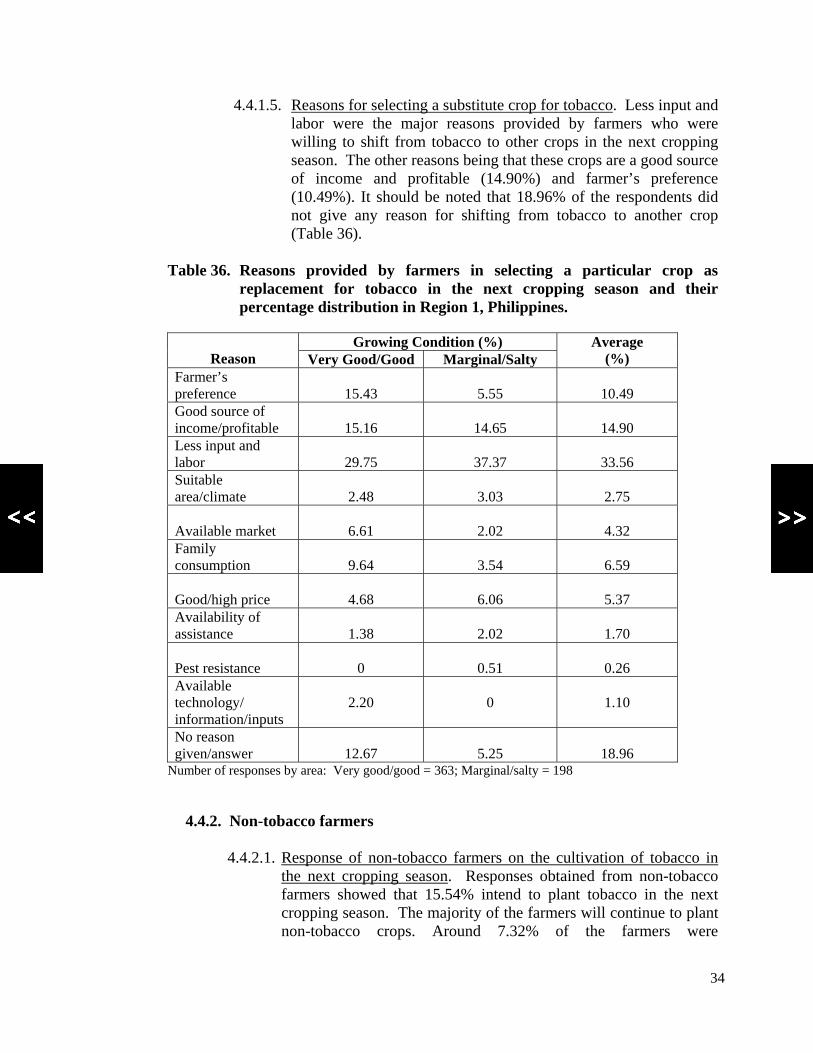
4.4.1.5. Reasons for selecting a substitute crop for tobacco. Less input and labor were the major reasons provided by farmers who were willing to shift from tobacco to other crops in the next cropping season. The other reasons being that these crops are a good source of income and profitable (14.90%) and farmer’s preference (10.49%). It should be noted that 18.96% of the respondents did not give any reason for shifting from tobacco to another crop (Table 36).
Table 36. Reasons provided by farmers in selecting a particular crop as
replacement for tobacco in the next cropping season and their percentage distribution in Region 1, Philippines.
Growing Condition (%)
Reason Very Good/Good Marginal/Salty Average
(%) Farmer’s preference
15.43
5.55
10.49
Good source of income/profitable
15.16
14.65
14.90
Less input and labor
29.75
37.37
33.56
Suitable area/climate
2.48
3.03
2.75
Available market
6.61
2.02
4.32
Family consumption
9.64
3.54
6.59
Good/high price
4.68
6.06
5.37
Availability of assistance
1.38
2.02
1.70
Pest resistance
0
0.51
0.26
Available technology/ information/inputs
2.20
0
1.10
No reason given/answer
12.67
5.25
18.96
Number of responses by area: Very good/good = 363; Marginal/salty = 198
4.4.2. Non-tobacco farmers
4.4.2.1. Response of non-tobacco farmers on the cultivation of tobacco in the next cropping season. Responses obtained from non-tobacco farmers showed that 15.54% intend to plant tobacco in the next cropping season. The majority of the farmers will continue to plant non-tobacco crops. Around 7.32% of the farmers were

35
undecided/provided no answer as to their intention for the next cropping season (Table 37)
Table 37. Responses obtained from non-tobacco farmers on their intention to
plant tobacco or not in the next cropping season and their percentage distribution in Region 1, Philippines.
Growing Condition (%)
Response Very Good/Good Marginal/Salty Average
(%) Yes
18.90
12.18
15.54
No
72.87
81.41
77.14
Undecided
2.74
0
1.37
No answer
5.49
6.41
5.95
Number of responses by area: Very good/good = 328; Marginal/salty = 156
4.4.2.2. Reasons for shifting from non-tobacco to tobacco cultivation. Good price (30.15%) and profitability (19.23%) of tobacco cultivation were the main reasons provided by farmers who intend to plant tobacco in the next season. In addition, it also serves as a good source of income to farmers. The availability of inputs/labor accounted for 10.46% of the responses provided by the farmers (Table 38).
Table 38. Reasons provided by non-tobacco farmers for shifting to tobacco
cultivation in the next cropping season and their percentage distribution in Region 1, Philippines.
Growing Condition (%)
Reason Very Good/Good Marginal/Salty Average
(%) Farmer’s preference
4.62
12.00
8.31
Source of income/food
6.15
16.00
11.08
Availability of inputs/labor
16.92
4.0
10.46
Profitable
18.46
20.00
19.23
Suitable area/climate
4.62
4.00
4.31
Available market
1.54
4.00
2.77
Farming experience
3.07
0 1.53

36
Available assistance
3.07
12.00
7.54
Equipment availability
4.62
0
2.31
Good/high price for tobacco
32.31
28.00
30.15
No answer
4.62
0
2.31
Number of responses by area: Very good/good = 65; Marginal/salty = 25
4.4.2.3. Reasons provided by non-tobacco farmers for continuing planting
non-tobacco crops. Table 39 shows the various reasons given by non-tobacco farmers to continue to plant non-tobacco crops in the next cropping season. The major reasons provided were: a) it requires less labor (36.92%); b) high input cost for tobacco production; and c) farmer’s preference. It should be noted that some farmers were already aware that tobacco is a health hazard (1.58%). A total of 6.92% of the respondents provided no answer on the crops he will plant in the next cropping season.
Table 39. Reasons provided by non-tobacco farmers to continue planting non-
tobacco crops in the next cropping season and their percentage distribution in Region 1, Philippines.
Growing Condition
Reason Very Good/Good Marginal/Salty Average
(%) Farmer’s preference
13.86
16.29
15.08
Source of income/food
1.77
0
0.88
Less labor
40.12
33.71
36.92
Other crops are profitable
2.06
3.38
2.72
Unsuitability of tobacco to area/climate
2.06
6.74
4.40
Lack of market/ buyer for tobacco
0.59
1.68
1.14
No farming experience on tobacco
3.24
3.37
3.30
Available assistance
0.30
0.57
0.43
No assistance available
0.30
0
0.15
High input cost for tobacco
23.60
23.03
23.31

37
Presence of equipment
0.30
1.12
0.71
No equipment
0.30
0
0.15
Low price for tobacco
2.06 2.25 2.16
Family needs
0.30
0
0.15
Health hazard
1.47
1.68
1.58
No answer
7.67
6.18
6.92
Number of responses by area: Very good/good = 339; Marginal/Salty = 178
4.4.2.4. Preferred crops to be planted next cropping season. Vegetables and corn were the top preferences of the farmers to plant in the next cropping season. Farmers’ preference for other crops ranged from less than 1% to 6.15%. A considerable percentage of farmers (15.84%) were undecided as to what to plant in the following cropping season (Table 40).
Table 40. List of crops preferred by non-tobacco farmers for planting in the next cropping season and their percentage distribution in Region 1, Philippines.
Growing Condition (%)
Crop Very Good/Good Marginal/Salty Average
(%) Vegetables
17.97
25.00
21.48
Tomato
7.61
4.69
6.15
Garlic
3.17
1.57
2.37
Corn
20.72
19.79
20.26
Mungbean
7.40
3.64
5.52
Eggplant
3.80
3.12
3.46
Beans
1.69
2.08
1.88
Rice
4.44
2.60
3.52
Onion
4.65
2.08
3.36
Pepper
0.63
0
0.32
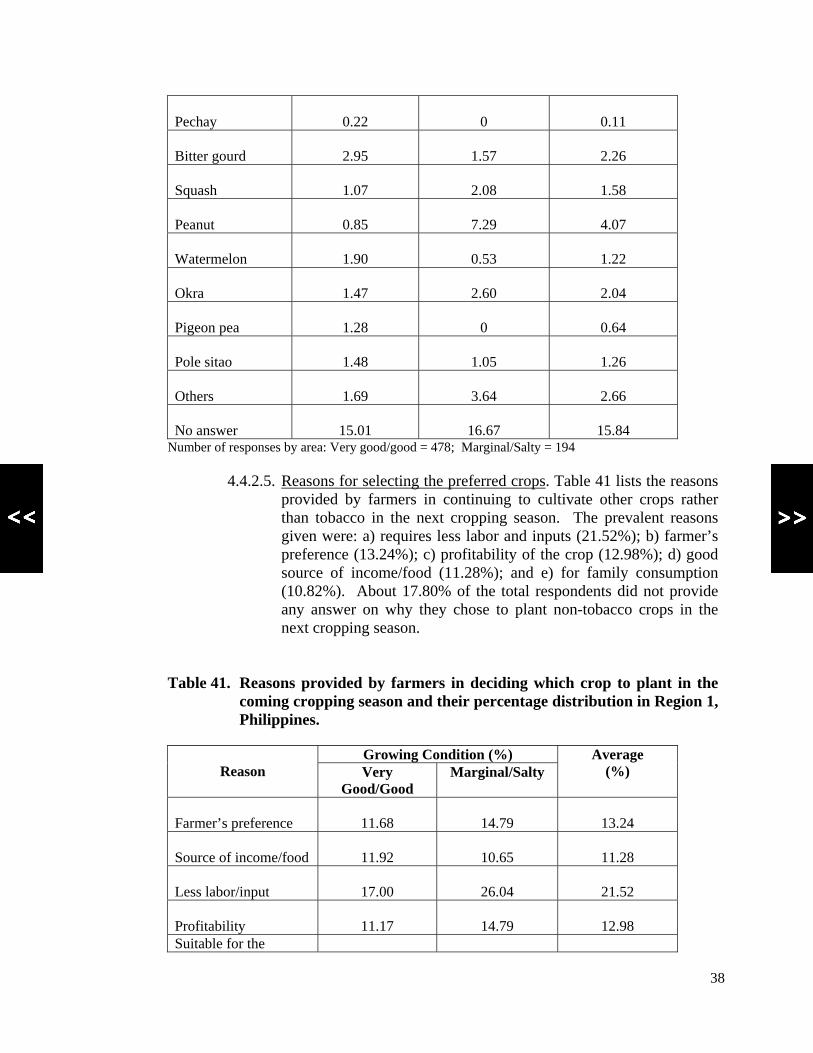
38
Pechay
0.22
0
0.11
Bitter gourd
2.95
1.57
2.26
Squash
1.07
2.08
1.58
Peanut
0.85
7.29
4.07
Watermelon
1.90
0.53
1.22
Okra
1.47
2.60
2.04
Pigeon pea
1.28
0
0.64
Pole sitao
1.48
1.05
1.26
Others
1.69
3.64
2.66
No answer
15.01
16.67
15.84
Number of responses by area: Very good/good = 478; Marginal/Salty = 194 4.4.2.5. Reasons for selecting the preferred crops. Table 41 lists the reasons
provided by farmers in continuing to cultivate other crops rather than tobacco in the next cropping season. The prevalent reasons given were: a) requires less labor and inputs (21.52%); b) farmer’s preference (13.24%); c) profitability of the crop (12.98%); d) good source of income/food (11.28%); and e) for family consumption (10.82%). About 17.80% of the total respondents did not provide any answer on why they chose to plant non-tobacco crops in the next cropping season.
Table 41. Reasons provided by farmers in deciding which crop to plant in the coming cropping season and their percentage distribution in Region 1, Philippines.
Growing Condition (%)
Reason Very Good/Good
Marginal/Salty Average
(%)
Farmer’s preference
11.68
14.79
13.24
Source of income/food
11.92
10.65
11.28
Less labor/input
17.00
26.04
21.52
Profitability
11.17
14.79
12.98
Suitable for the

39
area/climate 2.03 0.60 1.32 Available market
7.36
2.37
4.87
Family consumption
13.95
7.69
10.82
Family needs
0.25
0
0.12
Good/high price
4.82
3.54
4.18
Available assistance
0.52
1.19
0.86
Experience/knowledge of the crop
0.26
0
0.13
Available technology
0
1.77
0.88
No answer
19.04
16.57
17.80
Number of responses by area: Very good/good = 394; Marginal/Salty = 1169
4.5. Income, Input and Labor Requirement
4.5.1. Cost and return analysis. This was undertaken to determine the income derived by
farmers in the various crops they planted. Labor cost includes only the direct cost encountered in the cultivation of the crop. Labor attributed by the farmer and his household was not included in the analysis as well as the cost of land used either as direct rental/leasehold or as tenant-landowner arrangement. For the farmer, rental cost amounted to P 1.00/square meter/cropping (US$0.02) while the latter the sharing scheme on the net income is 20-25% for the landowner and 75-80% for the farmer per cropping. Table 42 shows the cost and return analysis for selected crops planted by farmers in the region. In direct monetary terms for tobacco, Virginia provided the highest income to farmers amounting to P51,642/hectare while native tobacco generated the lowest income at P19,266/hectare. Production cost was also higher in producing Virginia tobacco since it entailed high amount of labor and flue-curing was required as post-harvest activity in order for the tobacco leaves to be sold in the market. Income derived from burley cultivation amounted to P32,750.00. For the non-tobacco crops, corn provided the least income of P22,424.00 which was higher than the income derived from native tobacco but lower than those of burley and Virginia tobaccos. Farmers preferred to plant non-tobacco crops since they require less input and labor compared to tobacco as indicated in the responses obtained from farmers. Vegetable crops such as tomato, garlic, eggplant, pepper (sweet/hot) and bitter gourd provided much higher income than tobacco. Cultivation of mungbean resulted in higher income than native tobacco but almost equal to burley and lower than that of the Virginia tobacco. On the other hand, growing peanut resulted in higher income compared to tobacco but lesser than most vegetable varieties. In terms of the ratio between the gross income and production cost, this ranged from 1.45 – 3.54. Cultivation of pepper (hot/sweet) gave the highest return (>3.0) while
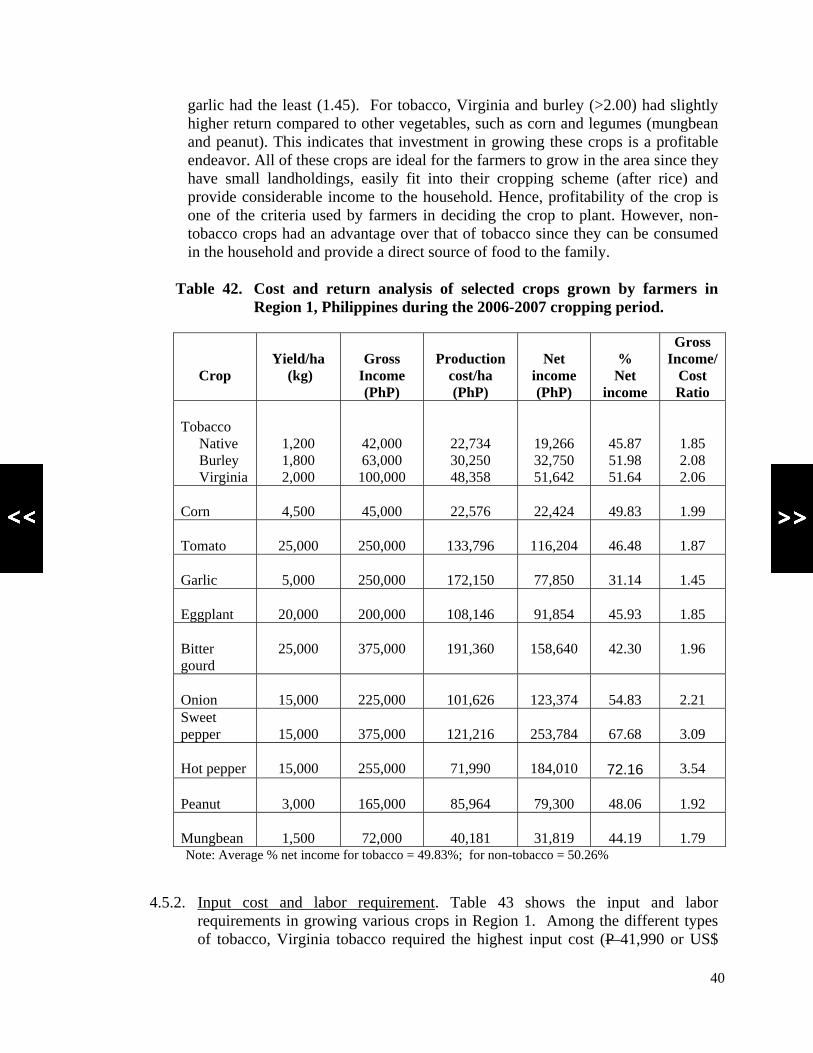
40
garlic had the least (1.45). For tobacco, Virginia and burley (>2.00) had slightly higher return compared to other vegetables, such as corn and legumes (mungbean and peanut). This indicates that investment in growing these crops is a profitable endeavor. All of these crops are ideal for the farmers to grow in the area since they have small landholdings, easily fit into their cropping scheme (after rice) and provide considerable income to the household. Hence, profitability of the crop is one of the criteria used by farmers in deciding the crop to plant. However, non-tobacco crops had an advantage over that of tobacco since they can be consumed in the household and provide a direct source of food to the family.
Table 42. Cost and return analysis of selected crops grown by farmers in
Region 1, Philippines during the 2006-2007 cropping period.
Crop
Yield/ha
(kg)
Gross
Income (PhP)
Production
cost/ha (PhP)
Net
income (PhP)
% Net
income
Gross Income/
Cost Ratio
Tobacco Native Burley Virginia
1,200 1,800 2,000
42,000 63,000
100,000
22,734 30,250 48,358
19,266 32,750 51,642
45.87 51.98 51.64
1.85 2.08 2.06
Corn
4,500
45,000
22,576
22,424
49.83
1.99
Tomato
25,000
250,000
133,796
116,204
46.48
1.87
Garlic
5,000
250,000
172,150
77,850
31.14
1.45
Eggplant
20,000
200,000
108,146
91,854
45.93
1.85
Bitter gourd
25,000
375,000
191,360
158,640
42.30
1.96
Onion
15,000
225,000
101,626
123,374
54.83
2.21
Sweet pepper
15,000
375,000
121,216
253,784
67.68
3.09
Hot pepper
15,000
255,000
71,990
184,010
72.16
3.54
Peanut
3,000
165,000
85,964
79,300
48.06
1.92
Mungbean
1,500
72,000
40,181
31,819
44.19
1.79
Note: Average % net income for tobacco = 49.83%; for non-tobacco = 50.26%
4.5.2. Input cost and labor requirement. Table 43 shows the input and labor requirements in growing various crops in Region 1. Among the different types of tobacco, Virginia tobacco required the highest input cost (P 41,990 or US$
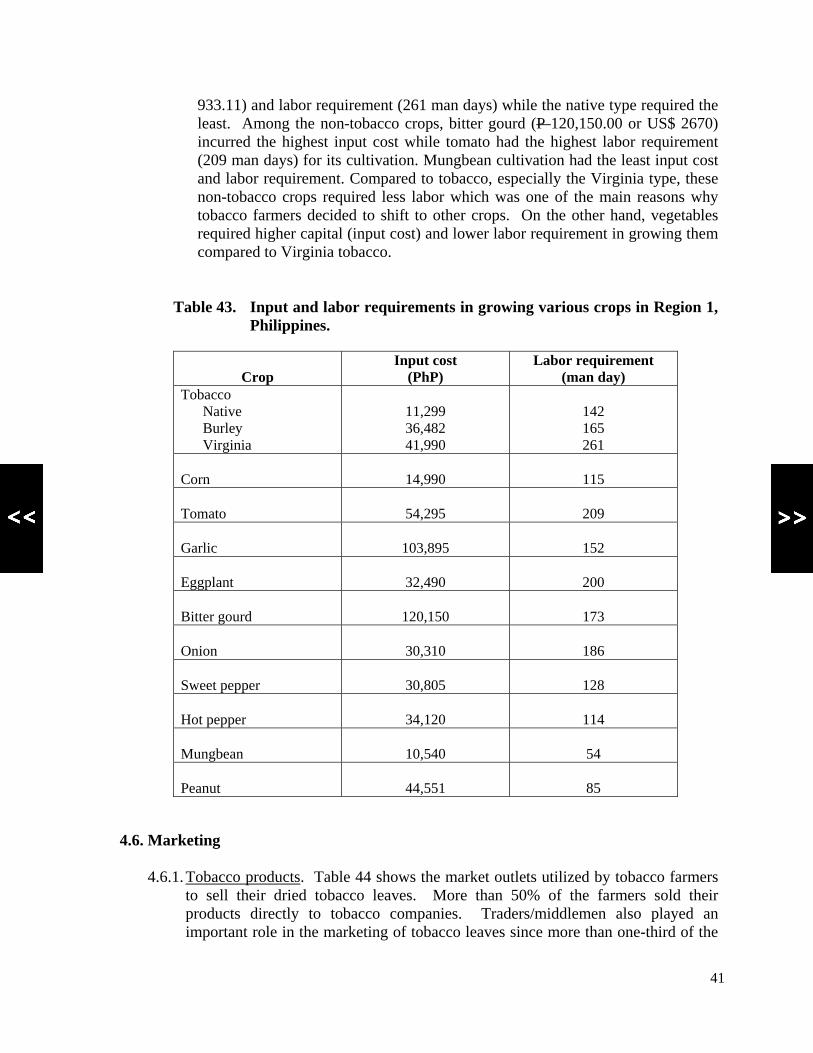
41
933.11) and labor requirement (261 man days) while the native type required the least. Among the non-tobacco crops, bitter gourd (P 120,150.00 or US$ 2670) incurred the highest input cost while tomato had the highest labor requirement (209 man days) for its cultivation. Mungbean cultivation had the least input cost and labor requirement. Compared to tobacco, especially the Virginia type, these non-tobacco crops required less labor which was one of the main reasons why tobacco farmers decided to shift to other crops. On the other hand, vegetables required higher capital (input cost) and lower labor requirement in growing them compared to Virginia tobacco.
Table 43. Input and labor requirements in growing various crops in Region 1, Philippines.
Crop Input cost
(PhP) Labor requirement
(man day) Tobacco Native Burley Virginia
11,299 36,482 41,990
142 165 261
Corn
14,990
115
Tomato
54,295
209
Garlic
103,895
152
Eggplant
32,490
200
Bitter gourd
120,150
173
Onion
30,310
186
Sweet pepper
30,805
128
Hot pepper
34,120
114
Mungbean
10,540
54
Peanut
44,551
85
4.6. Marketing 4.6.1. Tobacco products. Table 44 shows the market outlets utilized by tobacco farmers
to sell their dried tobacco leaves. More than 50% of the farmers sold their products directly to tobacco companies. Traders/middlemen also played an important role in the marketing of tobacco leaves since more than one-third of the
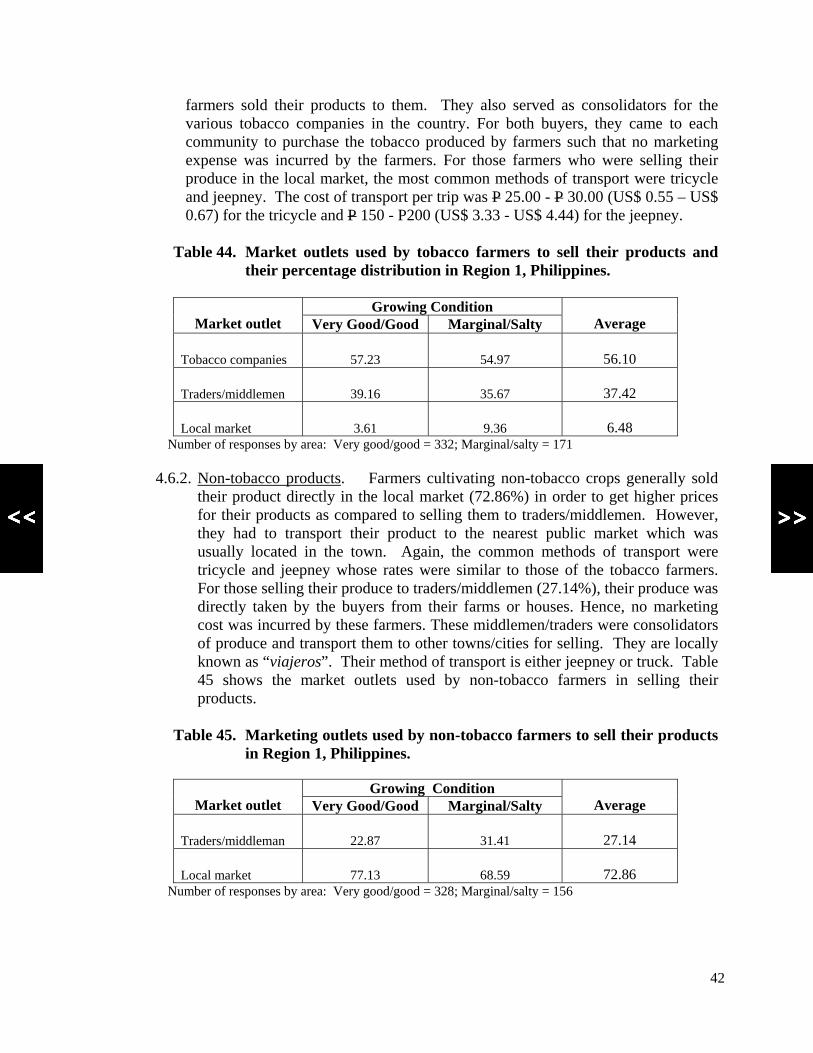
42
farmers sold their products to them. They also served as consolidators for the various tobacco companies in the country. For both buyers, they came to each community to purchase the tobacco produced by farmers such that no marketing expense was incurred by the farmers. For those farmers who were selling their produce in the local market, the most common methods of transport were tricycle and jeepney. The cost of transport per trip was P 25.00 - P 30.00 (US$ 0.55 – US$ 0.67) for the tricycle and P 150 - P200 (US$ 3.33 - US$ 4.44) for the jeepney.
Table 44. Market outlets used by tobacco farmers to sell their products and
their percentage distribution in Region 1, Philippines.
Growing Condition Market outlet Very Good/Good Marginal/Salty
Average
Tobacco companies 57.23 54.97
56.10 Traders/middlemen 39.16 35.67
37.42
Local market 3.61 9.36
6.48
Number of responses by area: Very good/good = 332; Marginal/salty = 171
4.6.2. Non-tobacco products. Farmers cultivating non-tobacco crops generally sold their product directly in the local market (72.86%) in order to get higher prices for their products as compared to selling them to traders/middlemen. However, they had to transport their product to the nearest public market which was usually located in the town. Again, the common methods of transport were tricycle and jeepney whose rates were similar to those of the tobacco farmers. For those selling their produce to traders/middlemen (27.14%), their produce was directly taken by the buyers from their farms or houses. Hence, no marketing cost was incurred by these farmers. These middlemen/traders were consolidators of produce and transport them to other towns/cities for selling. They are locally known as “viajeros”. Their method of transport is either jeepney or truck. Table 45 shows the market outlets used by non-tobacco farmers in selling their products.
Table 45. Marketing outlets used by non-tobacco farmers to sell their products
in Region 1, Philippines.
Growing Condition Market outlet Very Good/Good Marginal/Salty
Average
Traders/middleman 22.87 31.41
27.14
Local market 77.13 68.59
72.86
Number of responses by area: Very good/good = 328; Marginal/salty = 156
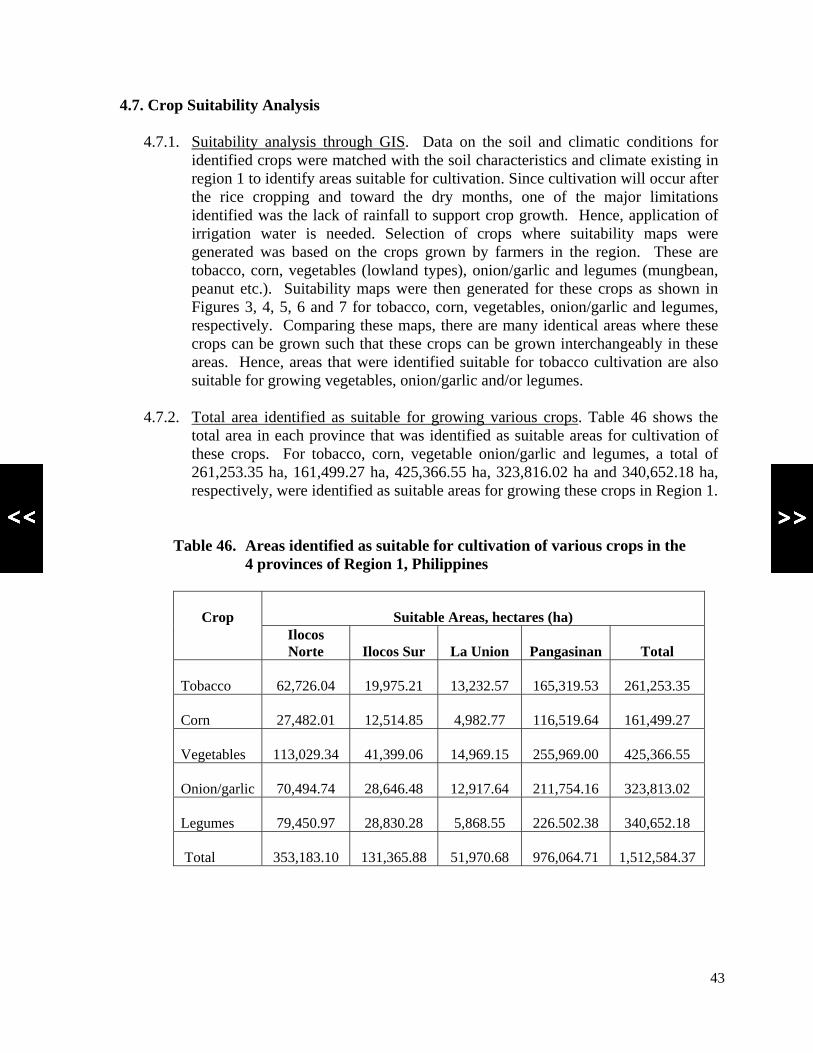
43
4.7. Crop Suitability Analysis
4.7.1. Suitability analysis through GIS. Data on the soil and climatic conditions for identified crops were matched with the soil characteristics and climate existing in region 1 to identify areas suitable for cultivation. Since cultivation will occur after the rice cropping and toward the dry months, one of the major limitations identified was the lack of rainfall to support crop growth. Hence, application of irrigation water is needed. Selection of crops where suitability maps were generated was based on the crops grown by farmers in the region. These are tobacco, corn, vegetables (lowland types), onion/garlic and legumes (mungbean, peanut etc.). Suitability maps were then generated for these crops as shown in Figures 3, 4, 5, 6 and 7 for tobacco, corn, vegetables, onion/garlic and legumes, respectively. Comparing these maps, there are many identical areas where these crops can be grown such that these crops can be grown interchangeably in these areas. Hence, areas that were identified suitable for tobacco cultivation are also suitable for growing vegetables, onion/garlic and/or legumes.
4.7.2. Total area identified as suitable for growing various crops. Table 46 shows the
total area in each province that was identified as suitable areas for cultivation of these crops. For tobacco, corn, vegetable onion/garlic and legumes, a total of 261,253.35 ha, 161,499.27 ha, 425,366.55 ha, 323,816.02 ha and 340,652.18 ha, respectively, were identified as suitable areas for growing these crops in Region 1.
Table 46. Areas identified as suitable for cultivation of various crops in the 4 provinces of Region 1, Philippines
Suitable Areas, hectares (ha)
Crop Ilocos Norte
Ilocos Sur
La Union
Pangasinan
Total
Tobacco
62,726.04
19,975.21
13,232.57
165,319.53 261,253.35
Corn
27,482.01
12,514.85
4,982.77
116,519.64 161,499.27
Vegetables
113,029.34
41,399.06
14,969.15
255,969.00 425,366.55
Onion/garlic
70,494.74
28,646.48
12,917.64
211,754.16 323,813.02
Legumes
79,450.97
28,830.28
5,868.55
226.502.38 340,652.18
Total 353,183.10 131,365.88 51,970.68 976,064.71 1,512,584.37

44
Figure 3. Suitability map generated through GIS for tobacco in Region 1, Philippines
(BAR, 2008).

45
Figure 4. Suitability map generated through GIS for corn in Region 1, Philippines
(BAR, 2008).

46
Figure 5. Suitability map generated through GIS for vegetables in Region 1,
Philippines (BAR, 2008).

47
Figure 6. Suitability map generated through GIS for onion/garlic in Region 1,
Philippines (BAR, 2008)
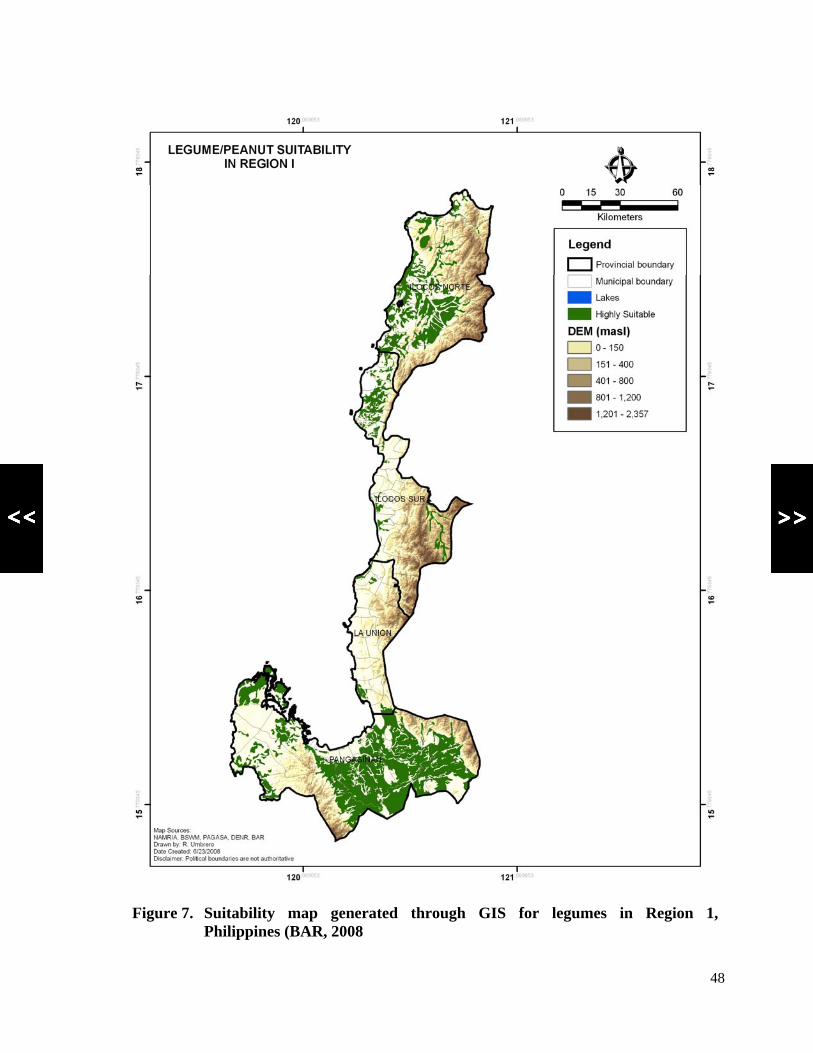
48
Figure 7. Suitability map generated through GIS for legumes in Region 1,
Philippines (BAR, 2008
49
SUMMARY
5.1. A Survey was conducted in the major tobacco growing provinces of the country namely; a) Ilocos Norte; b) Ilocos Sur; c) La Union; and d) Pangasinan. A total of 987 respondents were selected and distributed in a stratified random design on 2 tobacco growing environments, namely; a) very good/good (VG/G); and b) marginal/salty areas (MSF). The Survey covered the 2006-2007 cropping season.
5.2. The objectives of the Survey are: a) to determine the social and demographic attributes
of tobacco and non-tobacco farmers; b) to compare the tobacco farming practices and income to other crops suited in the area as possible substitute for tobacco; c) to determine the cost of production; d) to analyze the suitability of other crops that can be grown in the tobacco-producing areas; and e) to determine the socio-economic considerations made by farmers in deciding whether or not to plant tobacco.
5.3. The socio-demographic profile of the tobacco and non-tobacco farmers is as follows: 5.3.1. Farmers are relatively young wherein 80% or more are between 21 to 60 years
old; 5.3.2. As expected, most of the farmers are male which comprised 88-94% of the total
respondents; 5.3.3. In terms of education, most of the farmers had reached secondary education with
48% for the tobacco farmers and 55% for non-tobacco farmers; 5.3.4. Household size ranging from 3-5 members predominates in both the tobacco and
non-tobacco households; and 5.3.5. Eighty eight (88%) percent and 81% of tobacco and non-tobacco farmers,
respectively have a yearly income of P 100,000.00 (US$ 2,222.22) or less derived from their farming activities. This is way below the poverty threshold income of P 120,000 (US$ 2,666.67). All households with income below this threshold are considered poor.
5.4. Farms devoted to tobacco and non-tobacco crops are generally small with an area of 1
hectare or less. 5.5. Sixty (60%) percent and 40% of the tobacco and non-tobacco farmers, respectively are
tenants on the land they cultivate.
5.6. Farmers have significant farming experience. On the average, 80% of tobacco and 73% for non-tobacco farmers had been in farming for more than 10 years making them cognizant in the production of their respective crops.

50
5.7. Tobacco farmers planted 3 types of tobacco, namely: a) native; b) burley; and c) Virginia. Farmers in Pangasinan generally planted the native type while Ilocos Norte, Ilocos Sur and La Union preferred the Virginia type due to its higher price in the market. For non-tobacco farmers, considerable variety of crops were planted that include corn (highest preference), various species of vegetables such as tomato, onion, eggplant, bitter gourd, etc, and legumes (mungbean, peanut, pigeon pea and beans).
5.8. Government agencies such as the National Tobacco Administration (NTA), local
government units (provincial and municipal agricultural offices) provided the majority of the assistance received by tobacco farmers. Likewise, this is similar to non-tobacco farmers except that NTA had a very minimal involvement.
5.9. Technical assistance was the primary form of aid that the farmer obtained from these
government agencies. Financial, input and market assistances were also being provided by these agencies. However, traders/buyers/tobacco companies were the usual provider of these assistances.
5.10. Tobacco and non-tobacco farmers gave similar reasons for cultivating their crops,
These were: a) profitability; b) availability of market; c) accessibility of farm inputs and labor; d) availability and familiarity with the technology; and e) suitability of the crop to the area and climate.
5.11. Tobacco farmers had experienced planting other crops wherein rice was the most
predominant crop variety since the cropping system followed by the farmers involved planting rice during the rainy season. Again, planting corn and various types of vegetables were also done.
5.12. During the cropping period under study, 60% of the farmers planting non-tobacco crops
had planted tobacco in the previous season. The reasons provided by these farmers in shifting from tobacco to non-tobacco cultivation were: a) less labor (35.38%); b) high input cost for tobacco growing (23.98%); and c) farmer preference (14.06%).
5.13. The majority (86.82%) of the current tobacco farmers will continue to plant tobacco in
the next season. The reasons given were: a) profitability/good source of income; (b) availability of market; and c) farmer’s experience.
5.14. For the non-tobacco farmers, 77% will continue to plant their crops in the next cropping
season. The principal reasons given were: a) less labor requirement; b) lower input cost; and c) farmer’s preference.
5.15. For those who were shifting from tobacco to non-tobacco crops in the next cropping
season, high labor requirement and input cost of tobacco farming were the major reasons given by the respondents. For those shifting from non-tobacco to tobacco, the major reasons given were: a) profitability; and b) high price for tobacco in the market.

51
5.16. Corn and vegetables were the preferred crops by the tobacco farmers who intend to shift into these crops in the next cropping season. Again, the major reasons given are: a) it requires less input and labor; b) good source of income/profitability; and c) can be use for home consumption.
5.17. Cost and return analysis showed that cultivation of various types of vegetables (tomato,
onion, bitter gourd, eggplant, pepper, etc) provided a 1.5 -3 times higher net income per hectare than Virginia tobacco which have the highest net income among the 3 types of tobacco. Corn, mungbean and native tobacco provided more or less similar income per hectare.
5.18. Growing Virginia type of tobacco was the most laborious (261 man days) among the
various crop varieties being cultivated by farmers while mungbean had the least (54 man days). Vegetable growing required 114-209 man days depending on the varieties.
5.19. Tobacco farmers sold their produce directly to tobacco companies while non-tobacco
farmers sold theirs in the local market.
5.20. Suitability maps for tobacco, corn, vegetable, onion/garlic and legumes were generated using the geographical information system (GIS) to determine the areas suited for cultivation in the 4 provinces in Region 1. Many areas were found to be suitable for more than one crop variety.
5.21. A total area of 261,253.35 ha for tobacco, 161,499.27 ha for corn, 425,366.55 ha for
vegetables, 323,813.02 ha for onion/garlic and 340,652.18 ha for legumes were identified as suitable areas for these crops in Region 1.

52
CONCLUSION The results of the study show that tobacco and non-tobacco farmers had similar socio-demographic profile and reasons for growing their respective crops. Their primary consideration for selecting a particular crop to grow is its profitability, availability of inputs and labor and their experience in growing the said crop. Tobacco farmers tend to shift to another crop in the next cropping season due to their lower input cost and labor requirements while non-tobacco farmers shift to tobacco due to its high price and profitability. This indicates that farmers tend to weigh in their decision to plant a particular crop based on its profitability and the resources available to them. For tobacco farmers, the primary consideration is the availability of labor since this is becoming scare in the area. Among the various types of tobacco studied, Virginia tobacco has the highest labor requirement. In terms of income, vegetable cultivation provided the highest income to farmers even though it required higher input cost and lower labor requirement compared to Virginia tobacco. Corn, mungbean and peanut were also preferred by farmers mainly due to their low labor requirement and the income generated was at par with tobacco. Hence, farmers tend to have more time to engage in other activities and at the same time minimize the hiring of extra labor to do the various activities on the farm.
53
REFERENCES
Bureau of Agricultural Statistics. 2008. Selected Statistics on Agriculture. Bureau of Agricultural Statistics. 2007. Crop Statistics of the Philippines 2001-2006. Bureau of Agricultural Statistics. www.bas.gov.ph Bureau of Agricultural Research. www.bar.gov.ph National Tobacco Administration. www.nta.ds.gov.ph

54
APPENDICES

55
APPENDIX 1 QUESTIONNAIRE USED FOR FARMERS CULTIVATING TOBACCO
FORM A
PROVINCE: _________ TOWN: __________ BARANGAY: __________
1. BASIC INFORMATION
Name:_________________________________________________________________
Name of Spouse: ________________________________________________________
Address: _______________________________________________________________
Sex: _________________________ Marital Status: _______________________
Age: ______________ Educational Attainment: ___________________________
Household Size: __________ No. of persons earning in the family: ________________
Annual Income: _________________________________________________________
Sources of Income:
Source Amount (In Percent)
Farm (Crops, Livestock etc.) _________________
Off-Farm (Hired Farmer etc.) _________________
Non-Farm (Jobs, etc.) _________________
Is farming a full time job (Pls. Check)? YES NO
If not, percent time devoted to farming: ______________________________________
Other Jobs: ____________________________________________________________
Number of years in farming: ______________________________________________
2. Farm
Farm Address: __________________________________________________________
Size of the Farm: ____________________ Tenure: Owner Tenant
If a Tenant: Years of Tenancy: __________________
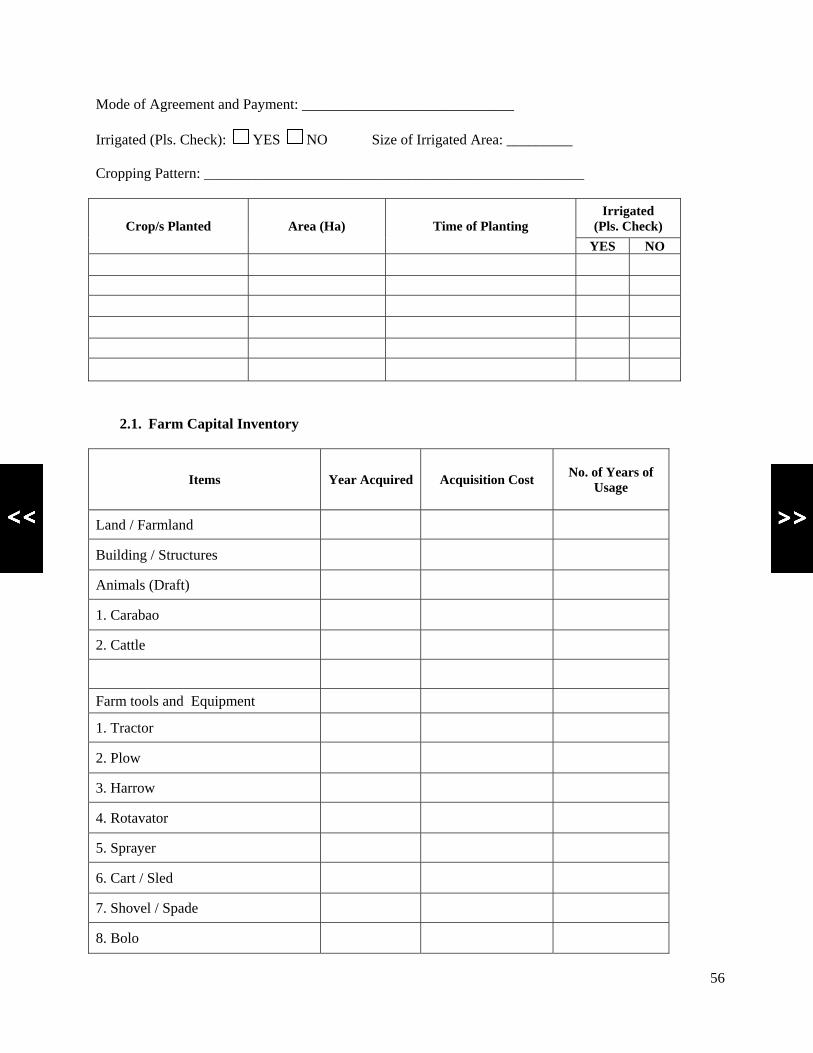
56
Mode of Agreement and Payment: _____________________________
Irrigated (Pls. Check): YES NO Size of Irrigated Area: _________
Cropping Pattern: ____________________________________________________
Irrigated (Pls. Check) Crop/s Planted Area (Ha) Time of Planting
YES NO
2.1. Farm Capital Inventory
Items Year Acquired Acquisition Cost No. of Years of Usage
Land / Farmland
Building / Structures
Animals (Draft)
1. Carabao
2. Cattle
Farm tools and Equipment
1. Tractor
2. Plow
3. Harrow
4. Rotavator
5. Sprayer
6. Cart / Sled
7. Shovel / Spade
8. Bolo
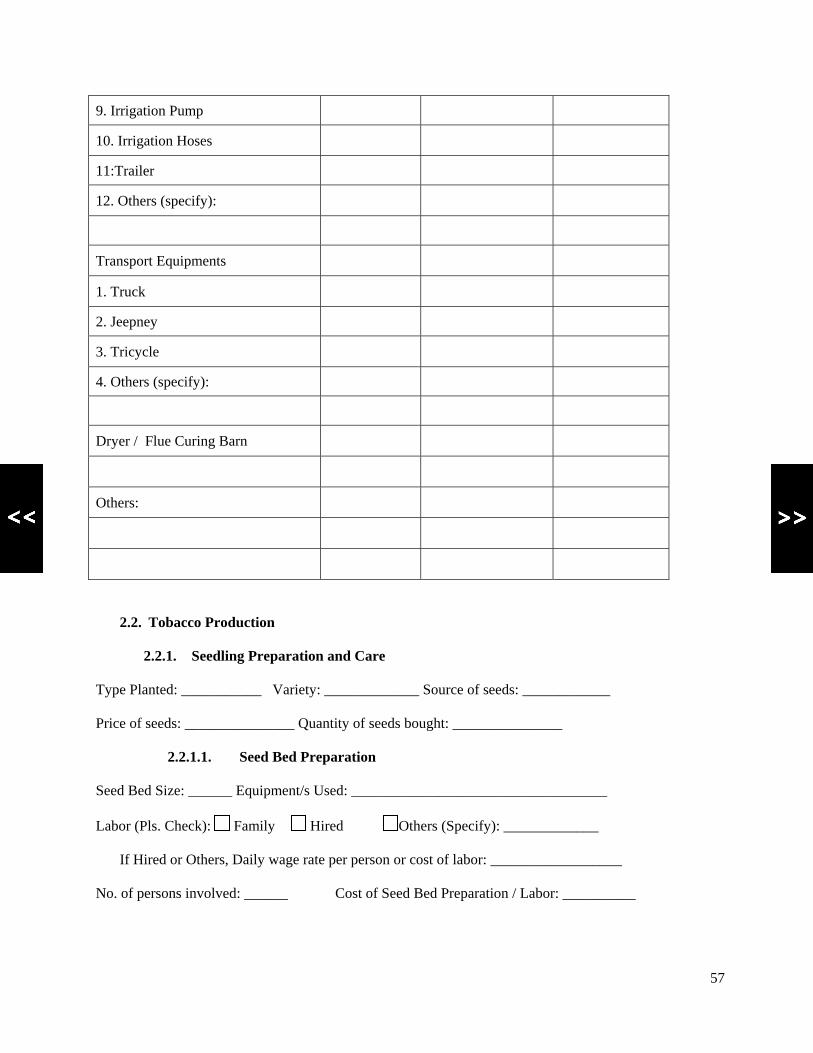
57
9. Irrigation Pump
10. Irrigation Hoses
11:Trailer
12. Others (specify):
Transport Equipments
1. Truck
2. Jeepney
3. Tricycle
4. Others (specify):
Dryer / Flue Curing Barn
Others:
2.2. Tobacco Production
2.2.1. Seedling Preparation and Care
Type Planted: ___________ Variety: _____________ Source of seeds: ____________
Price of seeds: _______________ Quantity of seeds bought: _______________
2.2.1.1. Seed Bed Preparation
Seed Bed Size: ______ Equipment/s Used: ___________________________________
Labor (Pls. Check): Family Hired Others (Specify): _____________
If Hired or Others, Daily wage rate per person or cost of labor: __________________
No. of persons involved: ______ Cost of Seed Bed Preparation / Labor: __________

58
2.2.1.2. Irrigation (Seed Bed):
Source of Irrigation (Pls. Check): Shallow Tube Well Deep Well Rivers / Streams
Others (Specify): _________________________________
Method of Irrigation (Pls. Check): Flooding Furrow Basin
Others (Specify): _________________________________
Duration (until transplanting): ___________ No. of hours involved per day: __________
Frequency: __________ per day __________ per week __________ weeks
Labor (Pls. Check): Family Hired Others (Specify): ____________
If Hired or Others, Daily wage rate per person or cost of labor:__________________
No. of persons involved: ______ Equipment/s used: ____________________________
Amount (in liters) and cost of fuel used (if any): ________________________________
2.2.1.3. Pest Control (Seed Bed)
Please Enumerate: Control Measure
(Pls. Check) Target Pest Manual Chemical
Kind of Pesticides Used (If chemical)
Dosage Pesticide per Application
(If chemical)
Cost of Pesticide
Frequency: _____ per day _____ per week _____ weeks Time of application: _______
Labor (Pls. Check): Family Hired Others (Specify): ____________
If Hired or Others, Daily wage rate per person or cost of labor: __________________
No. of persons involved/application ______ No. of hours involved/application: _______
Equipment/s used: _______________________________________________________
Protective equipments used: _______________________________________________

59
2.2.1.4. Fertilization (Seed Bed)
Please Enumerate:
Kind of Fertilizer Amount Used Cost of Fertilizer Method of Application
Frequency: _____ per day _____ per week _____ weeks Time of application: _______
Labor (Pls. Check): Family Hired Others (Specify): ____________
If Hired or Others, Daily wage rate per person or cost of labor: __________________
No. of persons involved/application ______ No. of hours involved/application: _______
Equipment/s used: _______________________________________________________
Protective equipments used: _______________________________________________
2.2.1.5. Weeding (Seed Bed)
Method of weeding: ______________________________________________________
Frequency: _____ per day _____ per week _____ weeks Time of weeding: _________
Labor (Pls. Check): Family Hired Others (Specify): ____________
If Hired or Others, Daily wage rate per person or cost of labor: __________________
No. of persons involved: _____________ No. of hours involved: _________________
Equipment/s used: _______________________________________________________
Protective equipments used: _______________________________________________
2.2.1.6. Other Information
________________________________________________________________________________________________________________________________________________________________________________________________________________________________________________________________________________________
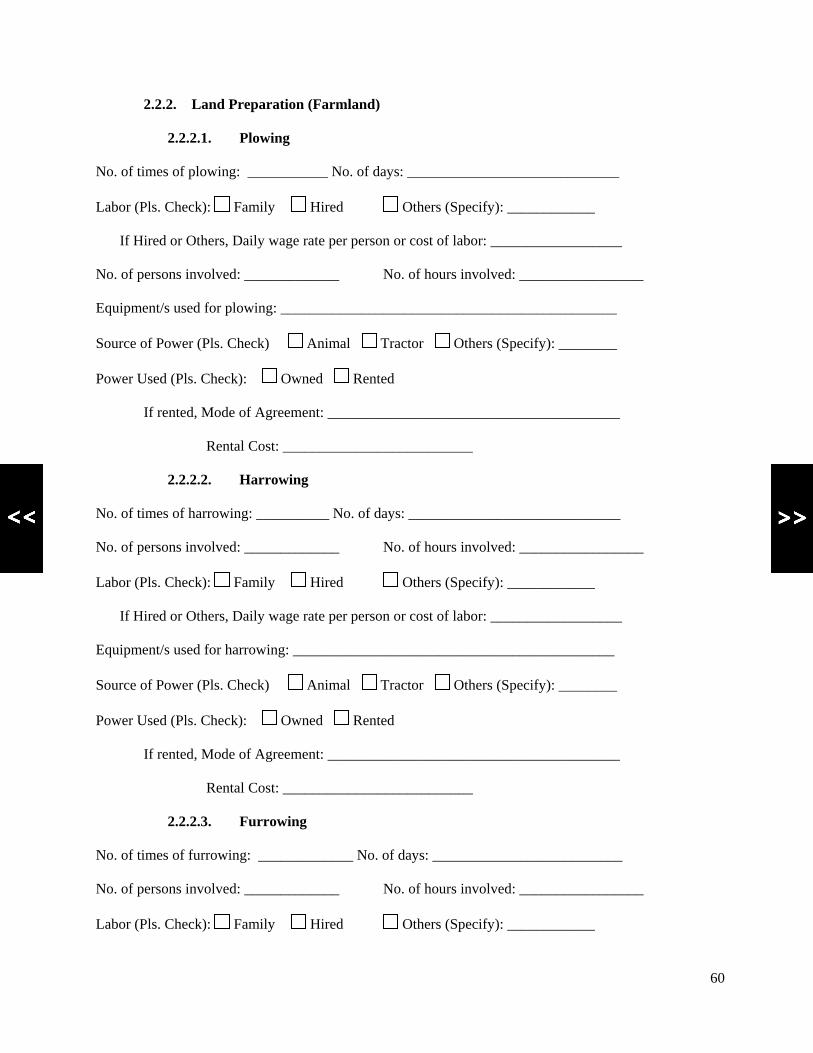
60
2.2.2. Land Preparation (Farmland)
2.2.2.1. Plowing
No. of times of plowing: ___________ No. of days: _____________________________
Labor (Pls. Check): Family Hired Others (Specify): ____________
If Hired or Others, Daily wage rate per person or cost of labor: __________________
No. of persons involved: _____________ No. of hours involved: _________________
Equipment/s used for plowing: ______________________________________________
Source of Power (Pls. Check) Animal Tractor Others (Specify): ________
Power Used (Pls. Check): Owned Rented
If rented, Mode of Agreement: ________________________________________
Rental Cost: __________________________
2.2.2.2. Harrowing
No. of times of harrowing: __________ No. of days: _____________________________
No. of persons involved: _____________ No. of hours involved: _________________
Labor (Pls. Check): Family Hired Others (Specify): ____________
If Hired or Others, Daily wage rate per person or cost of labor: __________________
Equipment/s used for harrowing: ____________________________________________
Source of Power (Pls. Check) Animal Tractor Others (Specify): ________
Power Used (Pls. Check): Owned Rented
If rented, Mode of Agreement: ________________________________________
Rental Cost: __________________________
2.2.2.3. Furrowing
No. of times of furrowing: _____________ No. of days: __________________________
No. of persons involved: _____________ No. of hours involved: _________________
Labor (Pls. Check): Family Hired Others (Specify): ____________

61
If Hired or Others, Daily wage rate per person or cost of labor: __________________
Equipment/s used for furrowing: ____________________________________________
Source of Power (Pls. Check) Animal Tractor Others (Specify): ________
Power Used (Pls. Check): Owned Rented
If rented, Mode of Agreement: ________________________________________
Rental Cost: __________________________
2.2.3. Other Activities
No. of times of done: _____________ No. of days: _____________________________
No. of persons involved: _____________ No. of hours involved: _________________
Labor (Pls. Check): Family Hired Others (Specify): ____________
If Hired or Others, Daily wage rate per person or cost of labor: __________________
Equipment/s used for furrowing: ____________________________________________
2.2.4. Planting / Transplanting
Distance of Planting: ______________ Time of planting/transplanting: ______________
No. of persons involved: _____________ No. of hours involved: _________________
No. of days involved: ________________
Equipment/s used: _______________________________________________________
Labor (Pls. Check): Family Hired Others (Specify): ____________
If Hired or Others, Daily wage rate per person or cost of labor: __________________
2.2.5. Irrigation
Source of Irrigation (Pls. Check): Shallow Tube Well Deep Well Rivers / Streams
Others (Specify): _________________________________
Method of Irrigation (Pls. Check): Flooding Furrow Basin
Others (Specify): _________________________________
If using irrigation pump:
Type and cost of fuel: _____________________________
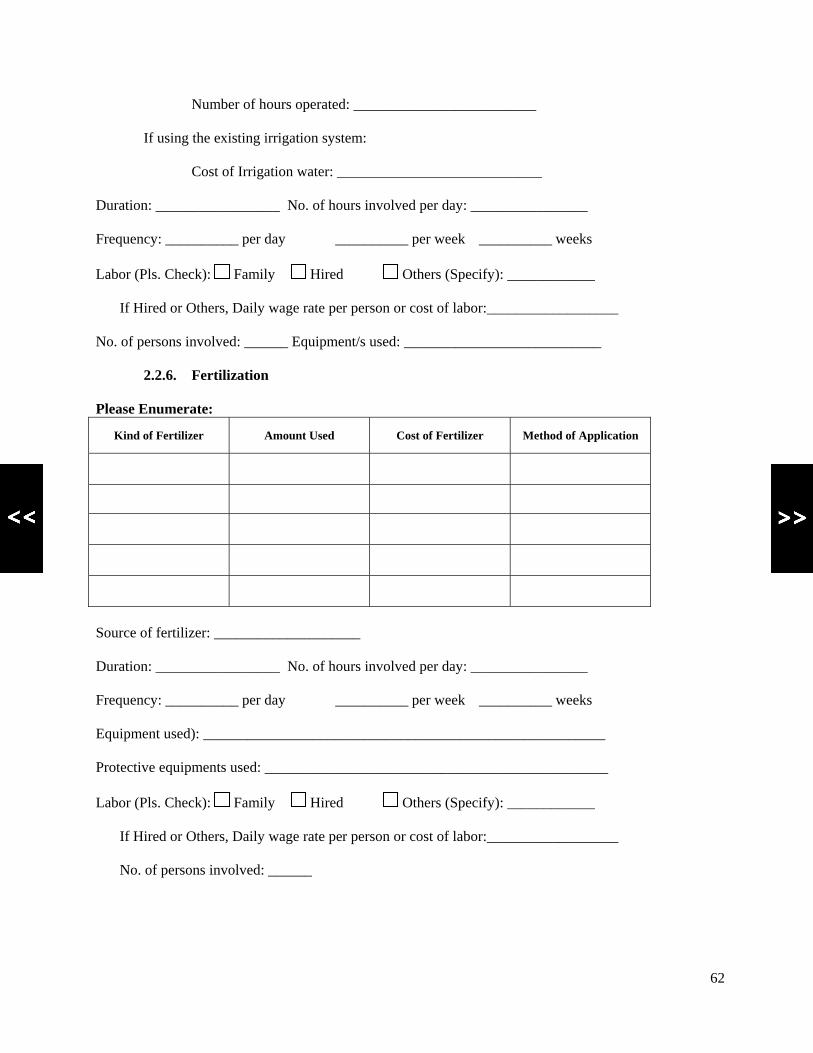
62
Number of hours operated: _________________________
If using the existing irrigation system:
Cost of Irrigation water: ____________________________
Duration: _________________ No. of hours involved per day: ________________
Frequency: __________ per day __________ per week __________ weeks
Labor (Pls. Check): Family Hired Others (Specify): ____________
If Hired or Others, Daily wage rate per person or cost of labor:__________________
No. of persons involved: ______ Equipment/s used: ___________________________
2.2.6. Fertilization
Please Enumerate:
Kind of Fertilizer Amount Used Cost of Fertilizer Method of Application
Source of fertilizer: ____________________
Duration: _________________ No. of hours involved per day: ________________
Frequency: __________ per day __________ per week __________ weeks
Equipment used): _______________________________________________________
Protective equipments used: _______________________________________________
Labor (Pls. Check): Family Hired Others (Specify): ____________
If Hired or Others, Daily wage rate per person or cost of labor:__________________
No. of persons involved: ______

63
2.2.7. Weeding
Determinants when to weed:
• ___________________________________________________________
• ___________________________________________________________
• ___________________________________________________________
Method of weeding: ______________________________________________________
Frequency: _____ per day _____ per week _____ weeks Time of weeding: _________
Labor (Pls. Check): Family Hired Others (Specify): ____________
If Hired or Others, Daily wage rate per person or cost of labor: __________________
No. of persons involved: _____________ No. of hours involved: _________________
Equipment/s used: _______________________________________________________
Protective equipments used: ______________________________________________
2.2.8. Pest and disease Control
Please Enumerate: Control Measure
(Pls. Check) Target Pest Manual Chemical
Kind of Pesticides Used (If chemical)
Dosage Pesticide per Application
(If chemical)
Cost of Pesticide
Frequency: _____ per day _____ per week _____ weeks Time of application: _______
Labor (Pls. Check): Family Hired Others (Specify): ____________
If Hired or Others, Daily wage rate per person or cost of labor: __________________
No. of persons involved/application ______ No. of hours involved/application: _______
Equipment/s used: _______________________________________________________
Protective equipments used: _______________________________________________

64
2.2.9. Harvesting
Time of harvesting (start): _________ Total Number of times of harvesting: __________
No. of day between each harvesting: __________ No. of hours involved: ____________
Frequency: _______per day _____ per week No. of persons involved: _________
Labor (Pls. Check): Family Hired Others (Specify): ____________
If Hired or Others, Daily wage rate per person or cost of labor: __________________
Equipment/s used: _______________________________________________________
2.2.10. Post harvest operations (Sticking, Hanging, Stringing, and Drying)
2.2.10.1. Sticking, Stringing, and Hanging
Equipment/s used: _______________________________________________________
Labor (Pls. Check): Family Hired Others (Specify): ____________
If Hired or Others, Daily wage rate per person or cost of labor: __________________
No. of days involved: ____________ No. of hours involved: ____________
2.2.10.2. Drying
Method of Drying (Pls. Check): Air Dried Flue Curing Others (specify):_______
If using Flue curing barn (Pls. Check): Owned Rented Communal
If rented or communal,
Mode of Agreement/Payment: __________________________
Rental Cost: _________________________________
Equipment used: _______________________________________
Inputs used and cost of each input used: _____________________________________ ______________________________________________________________________
Labor (Pls. Check): Family Hired Others (Specify): ____________
If Hired or Others, Daily wage rate per person or cost of labor: __________________
No. of days involved in drying: ____________
Average total volume of harvest per season (dried leaves): ____________________
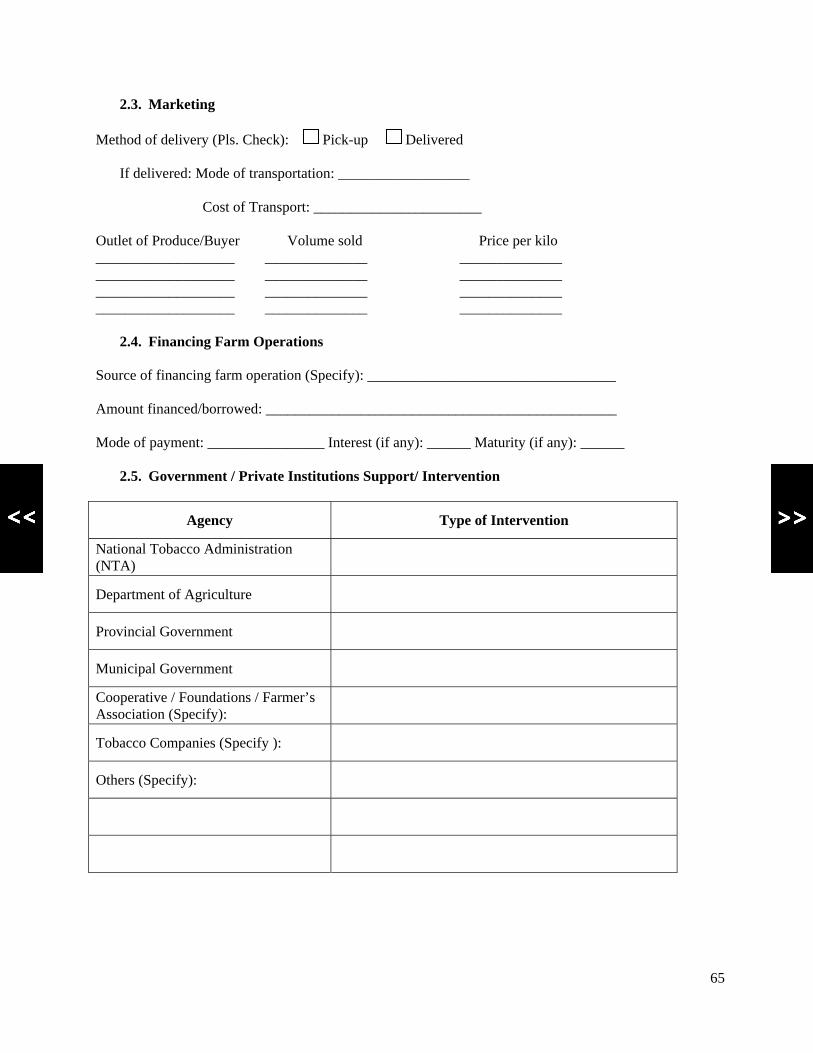
65
2.3. Marketing
Method of delivery (Pls. Check): Pick-up Delivered
If delivered: Mode of transportation: __________________
Cost of Transport: _______________________
Outlet of Produce/Buyer Volume sold Price per kilo ___________________ ______________ ______________ ___________________ ______________ ______________ ___________________ ______________ ______________ ___________________ ______________ ______________
2.4. Financing Farm Operations
Source of financing farm operation (Specify): __________________________________
Amount financed/borrowed: ________________________________________________
Mode of payment: ________________ Interest (if any): ______ Maturity (if any): ______
2.5. Government / Private Institutions Support/ Intervention
Agency Type of Intervention
National Tobacco Administration (NTA)
Department of Agriculture
Provincial Government
Municipal Government
Cooperative / Foundations / Farmer’s Association (Specify):
Tobacco Companies (Specify ):
Others (Specify):

66
2.6. Reasons for Planting Tobacco
3. Will you continue planting tobacco this coming season? YES No
Why? (Enumerate): • _________________________________________ • _________________________________________ • _________________________________________
4. If given the opportunity to plant other crops rather than tobacco the next season, what kinds or types of crops would you like to plant?
Type / Kind Reasons
____________________ ____________________ ____________________ ____________________ ____________________ ____________________ ____________________ ____________________ ____________________ ____________________
5. Other Relevant information:
Reason Yes / No
Profitable
Available Market
Available technology
Available farm labor and inputs
Suitability in the area / climate
Farming experience / familiarity of production
Resistance to prevailing pests
Others (specify):

67
APPENDIX 2 QUESTIONNAIRE USED FOR FARMERS CULTIVATING NON-
TOBACCO CROPS
FORM B
PROVINCE: _________ TOWN: __________ BARANGAY: __________
1. BASIC INFORMATION
Name:_________________________________________________________________
Name of Spouse: ________________________________________________________
Address: _______________________________________________________________
Sex: _________________________ Marital Status: _______________________
Age: ______________ Educational Attainment: ___________________________
Household Size: __________ No. of persons earning in the family: ________________
Annual Income: _________________________________________________________
Sources of Income:
Source Amount (In Percent)
Farm (Crops, Livestock etc.) _________________
Off-Farm (Hired Farmer etc.) _________________
Non-Farm (Jobs, etc.) _________________
Is farming a full time job (Pls. Check)? YES NO
If not, percent time devoted to farming: ______________________________________
Other Jobs: ____________________________________________________________
Number of years in farming: ______________________________________________
2. Farm
Farm Address: __________________________________________________________
Size of the Farm: ____________________ Tenure: Owner Tenant
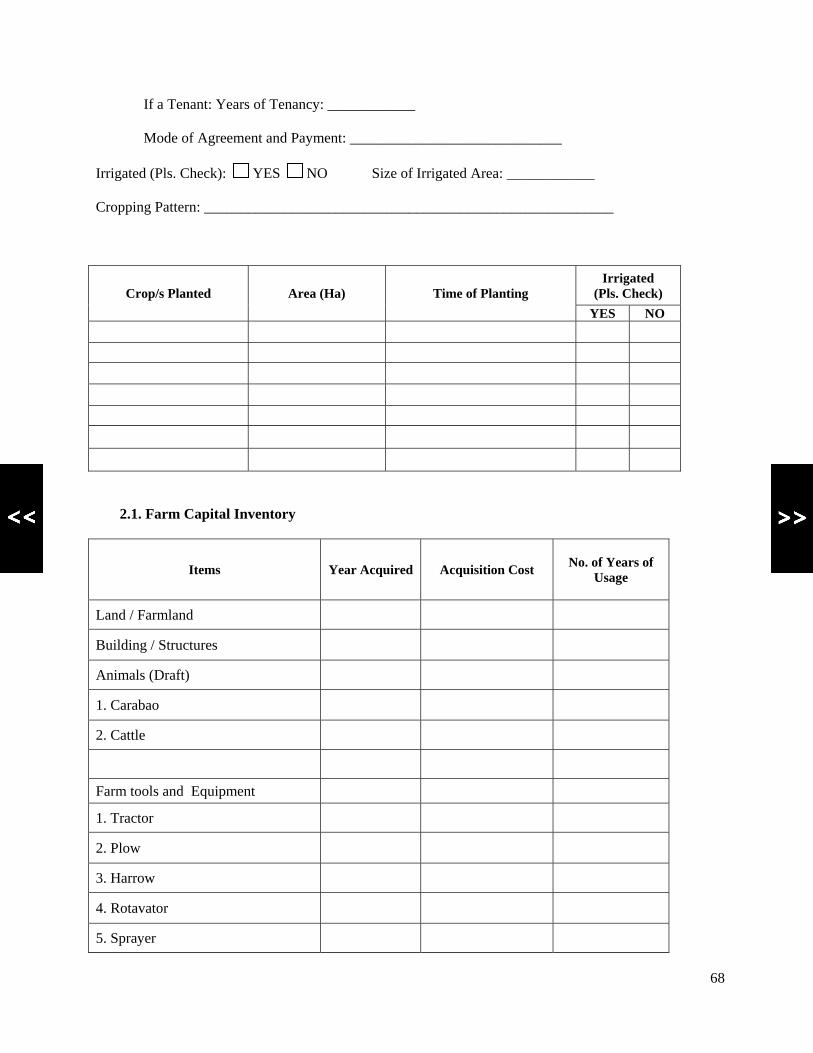
68
If a Tenant: Years of Tenancy: ____________
Mode of Agreement and Payment: _____________________________
Irrigated (Pls. Check): YES NO Size of Irrigated Area: ____________
Cropping Pattern: ________________________________________________________
Irrigated (Pls. Check) Crop/s Planted Area (Ha) Time of Planting
YES NO
2.1. Farm Capital Inventory
Items Year Acquired Acquisition Cost No. of Years of Usage
Land / Farmland
Building / Structures
Animals (Draft)
1. Carabao
2. Cattle
Farm tools and Equipment
1. Tractor
2. Plow
3. Harrow
4. Rotavator
5. Sprayer

69
6. Cart / Sled
7. Shovel / Spade
8. Bolo
9. Irrigation Pump
10. Irrigation Hoses
11:Trailer
12. Others (specify):
Transport Equipments
1. Truck
2. Jeepney
3. Tricycle
4. Others (specify):
Dryer / Flue Curing Barn
Others:
2.2 Crop Production:
2.2.1 Seedling Preparation and Care (if any, depending on the crop):
Type Planted: ___________ Variety: ____________ Source of seeds: _____________
Price of seeds: __________________ Quantity of seed bought: ________________
2.2.2. Seed Bed Preparation:
Seed Bed Size: ______ Equipment/s Used: ___________________________________
Labor (Pls. Check): Family Hired Others (Specify): _____________

70
If Hired or Others, Daily wage rate per person or cost of labor: __________________
No. of persons involved: ______ Cost of Seed Bed Preparation / Labor: __________
2.2.3 Irrigation (Seed Bed):
Source of Irrigation (Pls. Check): Shallow Tube Well Deep Well Rivers / Streams
Others (Specify): _________________________________
Method of Irrigation (Pls. Check): Flooding Furrow Basin
Others (Specify): _________________________________
Duration (until transplanting): ___________ No. of hours involved per day: __________
Frequency: __________ per day __________ per week __________ weeks
Labor (Pls. Check): Family Hired Others (Specify): ____________
If Hired or Others, Daily wage rate per person or cost of labor:__________________
No. of persons involved: ______ Equipment/s used: ____________________________
Amount (in liters) and cost of fuel used (if any): ________________________________
2.2.3. Pest Control (Seed Bed)
Please Enumerate: Control MeaSure
(Pls. Check) Target Pest Manual Chemical
Kind of Pesticides Used (If chemical)
Dosage Pesticide per Application
(If chemical)
Cost of Pesticide
Frequency: _____ per day _____ per week _____ weeks Time of application: _______
Labor (Pls. Check): Family Hired Others (Specify): ____________
If Hired or Others, Daily wage rate per person or cost of labor: __________________
No. of persons involved/application ______ No. of hours involved/application: _______
Equipment/s used: _______________________________________________________
Protective equipments used: _______________________________________________
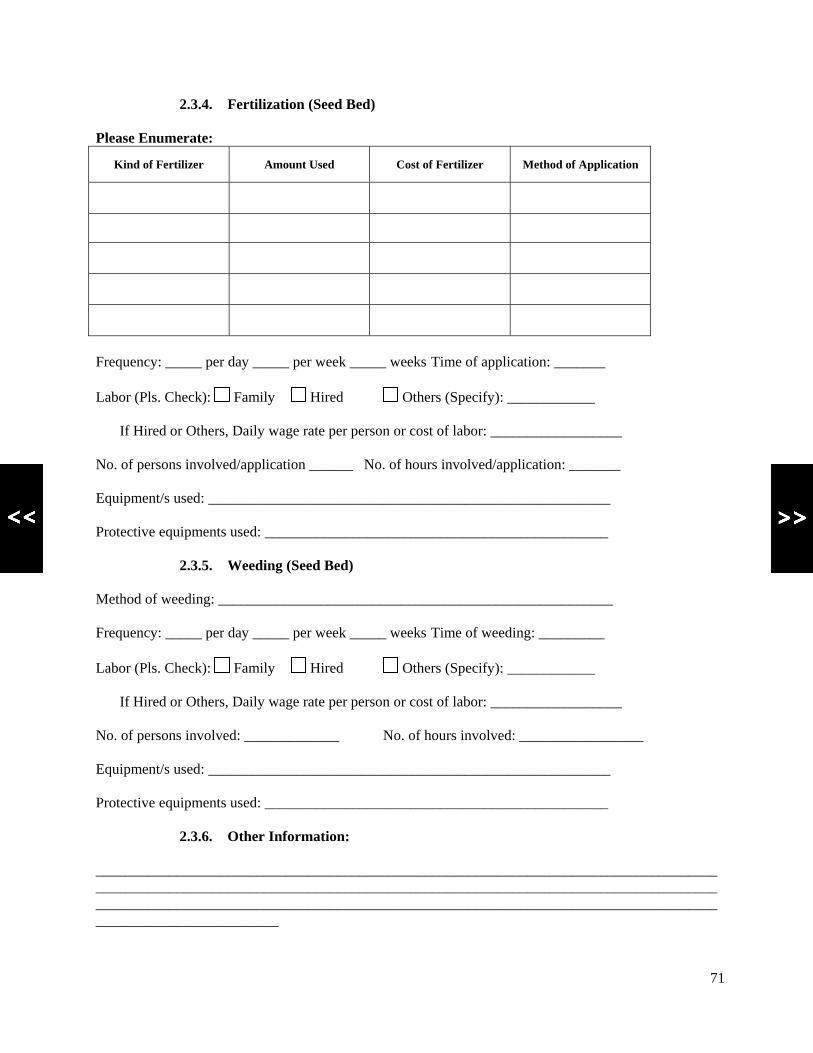
71
2.3.4. Fertilization (Seed Bed)
Please Enumerate:
Kind of Fertilizer Amount Used Cost of Fertilizer Method of Application
Frequency: _____ per day _____ per week _____ weeks Time of application: _______
Labor (Pls. Check): Family Hired Others (Specify): ____________
If Hired or Others, Daily wage rate per person or cost of labor: __________________
No. of persons involved/application ______ No. of hours involved/application: _______
Equipment/s used: _______________________________________________________
Protective equipments used: _______________________________________________
2.3.5. Weeding (Seed Bed)
Method of weeding: ______________________________________________________
Frequency: _____ per day _____ per week _____ weeks Time of weeding: _________
Labor (Pls. Check): Family Hired Others (Specify): ____________
If Hired or Others, Daily wage rate per person or cost of labor: __________________
No. of persons involved: _____________ No. of hours involved: _________________
Equipment/s used: _______________________________________________________
Protective equipments used: _______________________________________________
2.3.6. Other Information:
________________________________________________________________________________________________________________________________________________________________________________________________________________________________________________________________________________________
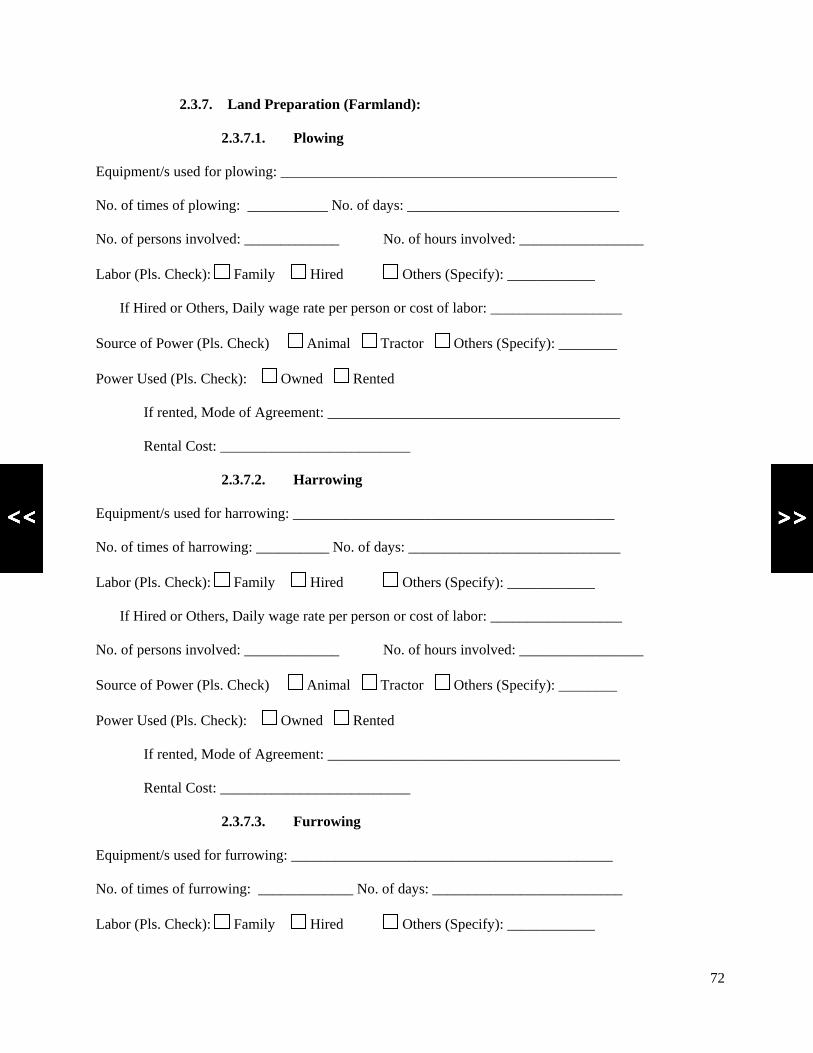
72
2.3.7. Land Preparation (Farmland):
2.3.7.1. Plowing
Equipment/s used for plowing: ______________________________________________
No. of times of plowing: ___________ No. of days: _____________________________
No. of persons involved: _____________ No. of hours involved: _________________
Labor (Pls. Check): Family Hired Others (Specify): ____________
If Hired or Others, Daily wage rate per person or cost of labor: __________________
Source of Power (Pls. Check) Animal Tractor Others (Specify): ________
Power Used (Pls. Check): Owned Rented
If rented, Mode of Agreement: ________________________________________
Rental Cost: __________________________
2.3.7.2. Harrowing
Equipment/s used for harrowing: ____________________________________________
No. of times of harrowing: __________ No. of days: _____________________________
Labor (Pls. Check): Family Hired Others (Specify): ____________
If Hired or Others, Daily wage rate per person or cost of labor: __________________
No. of persons involved: _____________ No. of hours involved: _________________
Source of Power (Pls. Check) Animal Tractor Others (Specify): ________
Power Used (Pls. Check): Owned Rented
If rented, Mode of Agreement: ________________________________________
Rental Cost: __________________________
2.3.7.3. Furrowing
Equipment/s used for furrowing: ____________________________________________
No. of times of furrowing: _____________ No. of days: __________________________
Labor (Pls. Check): Family Hired Others (Specify): ____________

73
If Hired or Others, Daily wage rate per person or cost of labor: __________________
No. of persons involved: _____________ No. of hours involved: _________________
Source of Power (Pls. Check) Animal Tractor Others (Specify): ________
Power Used (Pls. Check): Owned Rented
If rented, Mode of Agreement: ________________________________________
Rental Cost: __________________________
2.3.7.4. Other Activities
Equipment/s used for furrowing: ____________________________________________
No. of times of done: _____________ No. of days: _____________________________
Labor (Pls. Check): Family Hired Others (Specify): ____________
If Hired or Others, Daily wage rate per person or cost of labor: __________________
No. of persons involved: _____________ No. of hours involved: _________________
2.3.8. Planting / Transplanting
Distance of Planting: ______________ Time of planting/transplanting: ______________
Equipment/s used: _______________________________________________________
No. of hours involved: _________________ No. of days involved: ________________
Labor (Pls. Check): Family Hired Others (Specify): ____________
If Hired or Others, Daily wage rate per person or cost of labor: __________________
No. of persons involved: _____________
2.3.9. Irrigation:
Source of Irrigation (Pls. Check): Shallow Tube Well Deep Well Rivers / Streams
Others (Specify): _________________________________
Method of Irrigation (Pls. Check): Flooding Furrow Basin
Others (Specify): _________________________________
If using irrigation pump:
Type and cost of fuel: _____________________________

74
Number of hours operated: _________________________
If using the existing irrigation system:
Cost of Irrigation water: ____________________________
Duration: _________________ No. of hours involved per day: ________________
Frequency: __________ per day __________ per week __________ weeks
Labor (Pls. Check): Family Hired Others (Specify): ____________
If Hired or Others, Daily wage rate per person or cost of labor:__________________
No. of persons involved: ______ Equipment/s used: ____________________________
2.3.10. Fertilization
Please Enumerate:
Kind of Fertilizer Amount Used Cost of Fertilizer Method of Application
Source of fertilizer: ____________________
Equipment used): _______________________________________________________
Protective equipments used: _______________________________________________
Duration: _________________ No. of hours involved per day: ________________
Frequency: __________ per day __________ per week __________ weeks
Labor (Pls. Check): Family Hired Others (Specify): ____________
If Hired or Others, Daily wage rate per person or cost of labor:__________________
No. of persons involved: ______

75
2.3.11. Weeding
Determinants when to weed:
• ___________________________________________________________
• ___________________________________________________________
• ___________________________________________________________
Method of weeding: ______________________________________________________
Frequency: _____ per day _____ per week _____ weeks Time of weeding: _________
Labor (Pls. Check): Family Hired Others (Specify): ____________
If Hired or Others, Daily wage rate per person or cost of labor: __________________
No. of persons involved: _____________ No. of hours involved: _________________
Equipment/s used: _______________________________________________________
Protective equipments used: _______________________________________________
2.3.12. Pest and disease Control
Please Enumerate: Control Measure
(Pls. Check) Target Pest Manual Chemical
Kind of Pesticides Used (If chemical)
Dosage Pesticide per Application
(If chemical)
Cost of Pesticide
Frequency: _____ per day _____ per week _____ weeks Time of application: _______
Labor (Pls. Check): Family Hired Others (Specify): ____________
If Hired or Others, Daily wage rate per person or cost of labor: __________________
No. of persons involved/application ______ No. of hours involved/application: _______
Equipment/s used: _______________________________________________________
Protective equipments used: _______________________________________________

76
2.3.13. Harvesting
Time of harvesting (start): _________ Total Number of times of harvesting: __________
No. of day between each harvesting: __________ No. of hours involved: ____________
Frequency: _______per day _____ per week No. of persons involved: _________
Labor (Pls. Check): Family Hired Others (Specify): ____________
If Hired or Others, Daily wage rate per person or cost of labor: __________________
Equipment/s used: _______________________________________________________
2.3.14. Post harvest operations:
Activities involved Purpose ________________________ __________________ ________________________ __________________ ________________________ __________________ ________________________ __________________
Equipment/s used: _______________________________________________________
Input/s used and cost of each input/s used: ___________________________________ ______________________________________________________________________
No. of persons involved: _______________
Frequency: _______per day _____ per week No. of hours involved: ___________
Labor (Pls. Check): Family Hired Others (Specify): ____________
If Hired or Others, Daily wage rate per person or cost of labor: __________________
Average total volume of harvest per season: __________________________________
2.4. Marketing:
Method of delivery (Pls. Check): Pick-up Delivered
If delivered: Mode of transportation: __________________
Cost of Transport: _______________________
Outlet of Produce/Buyer Volume sold Price per kilo ___________________ ______________ ______________ ___________________ ______________ ______________ ___________________ ______________ ______________ ___________________ ______________ ______________
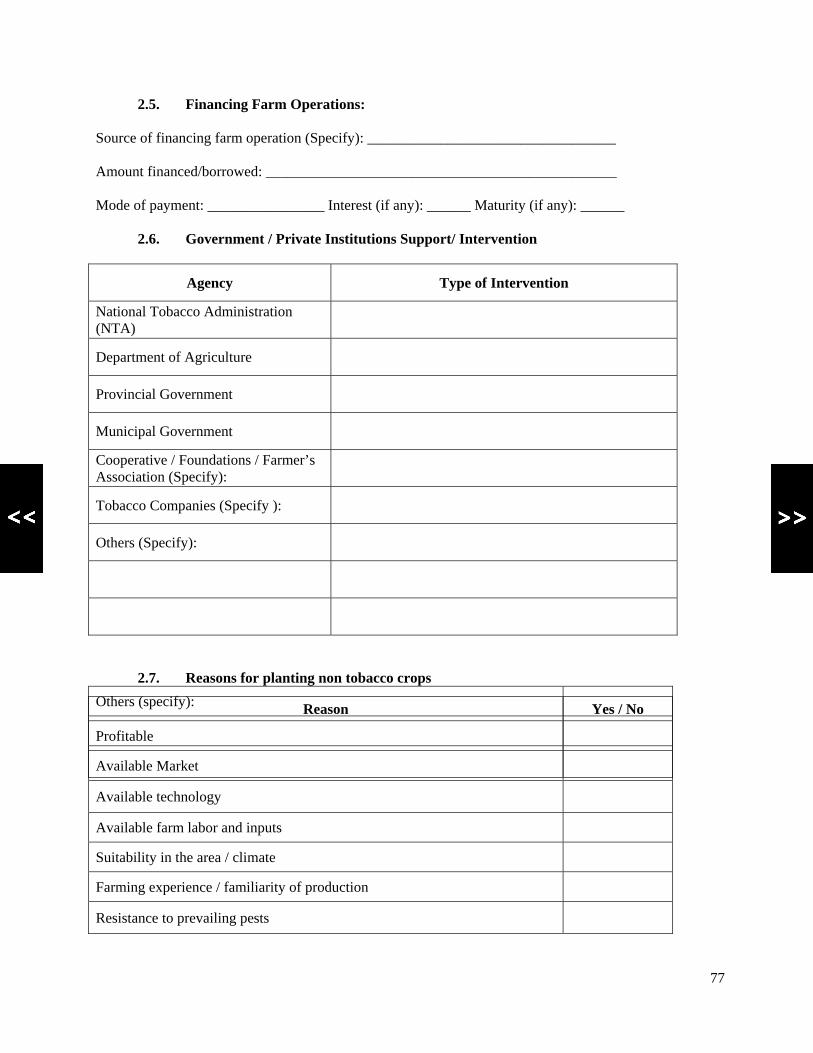
77
2.5. Financing Farm Operations:
Source of financing farm operation (Specify): __________________________________
Amount financed/borrowed: ________________________________________________
Mode of payment: ________________ Interest (if any): ______ Maturity (if any): ______
2.6. Government / Private Institutions Support/ Intervention
Agency Type of Intervention
National Tobacco Administration (NTA)
Department of Agriculture
Provincial Government
Municipal Government
Cooperative / Foundations / Farmer’s Association (Specify):
Tobacco Companies (Specify ):
Others (Specify):
2.7. Reasons for planting non tobacco crops
Reason Yes / No
Profitable
Available Market
Available technology
Available farm labor and inputs
Suitability in the area / climate
Farming experience / familiarity of production
Resistance to prevailing pests
Others (specify):
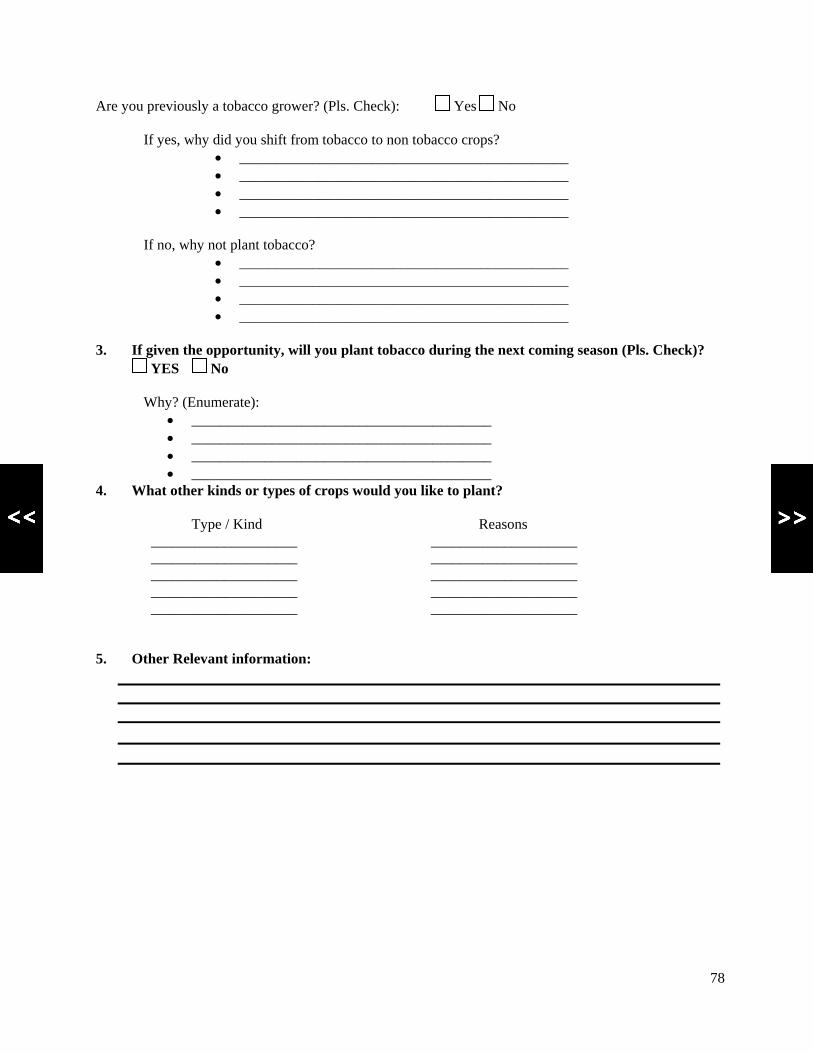
78
Are you previously a tobacco grower? (Pls. Check): Yes No
If yes, why did you shift from tobacco to non tobacco crops? • _____________________________________________ • _____________________________________________ • _____________________________________________ • _____________________________________________
If no, why not plant tobacco?
• _____________________________________________ • _____________________________________________ • _____________________________________________ • _____________________________________________
3. If given the opportunity, will you plant tobacco during the next coming season (Pls. Check)? YES No Why? (Enumerate):
• _________________________________________ • _________________________________________ • _________________________________________ • _________________________________________
4. What other kinds or types of crops would you like to plant?
Type / Kind Reasons ____________________ ____________________ ____________________ ____________________ ____________________ ____________________ ____________________ ____________________ ____________________ ____________________
5. Other Relevant information:
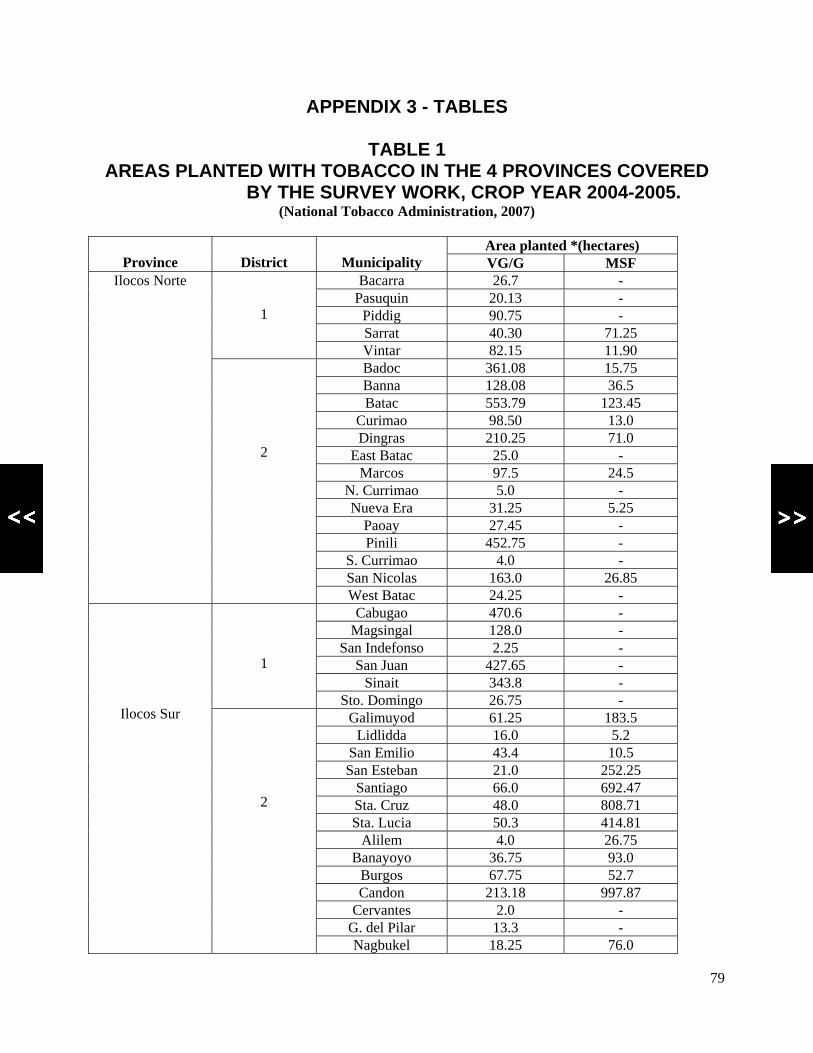
79
APPENDIX 3 - TABLES
TABLE 1 AREAS PLANTED WITH TOBACCO IN THE 4 PROVINCES COVERED
BY THE SURVEY WORK, CROP YEAR 2004-2005. (National Tobacco Administration, 2007)
Area planted *(hectares)
Province
District
Municipality VG/G MSF Bacarra 26.7 -
Pasuquin 20.13 - Piddig 90.75 - Sarrat 40.30 71.25
1
Vintar 82.15 11.90 Badoc 361.08 15.75 Banna 128.08 36.5 Batac 553.79 123.45
Curimao 98.50 13.0 Dingras 210.25 71.0
East Batac 25.0 - Marcos 97.5 24.5
N. Currimao 5.0 - Nueva Era 31.25 5.25
Paoay 27.45 - Pinili 452.75 -
S. Currimao 4.0 - San Nicolas 163.0 26.85
Ilocos Norte
2
West Batac 24.25 - Cabugao 470.6 -
Magsingal 128.0 - San Indefonso 2.25 -
San Juan 427.65 - Sinait 343.8 -
1
Sto. Domingo 26.75 - Galimuyod 61.25 183.5
Lidlidda 16.0 5.2 San Emilio 43.4 10.5 San Esteban 21.0 252.25
Santiago 66.0 692.47 Sta. Cruz 48.0 808.71 Sta. Lucia 50.3 414.81
Alilem 4.0 26.75 Banayoyo 36.75 93.0
Burgos 67.75 52.7 Candon 213.18 997.87
Cervantes 2.0 - G. del Pilar 13.3 -
Ilocos Sur
2 Nagbukel 18.25 76.0

80
Narvacan 58.25 159.1 Quirino 32.4 - Salcedo 53.25 191.03 Sigay 30.0 -
Sta. Maria 33.5 436.77 Sugpon 3.25 12.65
Suyo 2 33.75
Tagudin 34.5 63.9 Bacnotan 31.5 20.0 Balaoan 103.84 32.5 Bangar 18.15 0.5 Luna - 13.5
San Fernando 40.58 49.65 San Gabriel 1.5 -
San Juan 87.56 24.65 Santol 13.5 -
1
Sudipen 39.75 26.05 Agoo 13.0 -
Aringay 7.0 3.0 Bagulin 2.02 - Bauang 162.33 40.25
Caba 10.75 2.5 Naguilian 71.44 11.7 Rosario 18.26 -
Sto Tomas 3.75 -
La Union
2
Tubao 5.84 - Bayambang 11.25 - Malasiqui 30.76 -
3
Sta Barbara 29.25 - Manaoag 26.95 7.5
San Fabian 358.62 -
4 San Jacinto 98.14 9.5
Alcala 75.5 - Bautista 13.0 - Laoac 90.75 - Sison 155.89 1.0
Sto Tomas 28.19 1.5
5
Villasis 161.23 - Asingan 13.8 -
Balungao 84.42 - Rosales 5.43 -
San Manuel 11.1 - San Quintin 0.75 - Sta Maria 90.85 - Sto Tomas 16.75 -
Pangasinan
6
Umingan 1.58 - *VG/G – Very good/Good areas: MSF – Marginal and salty area
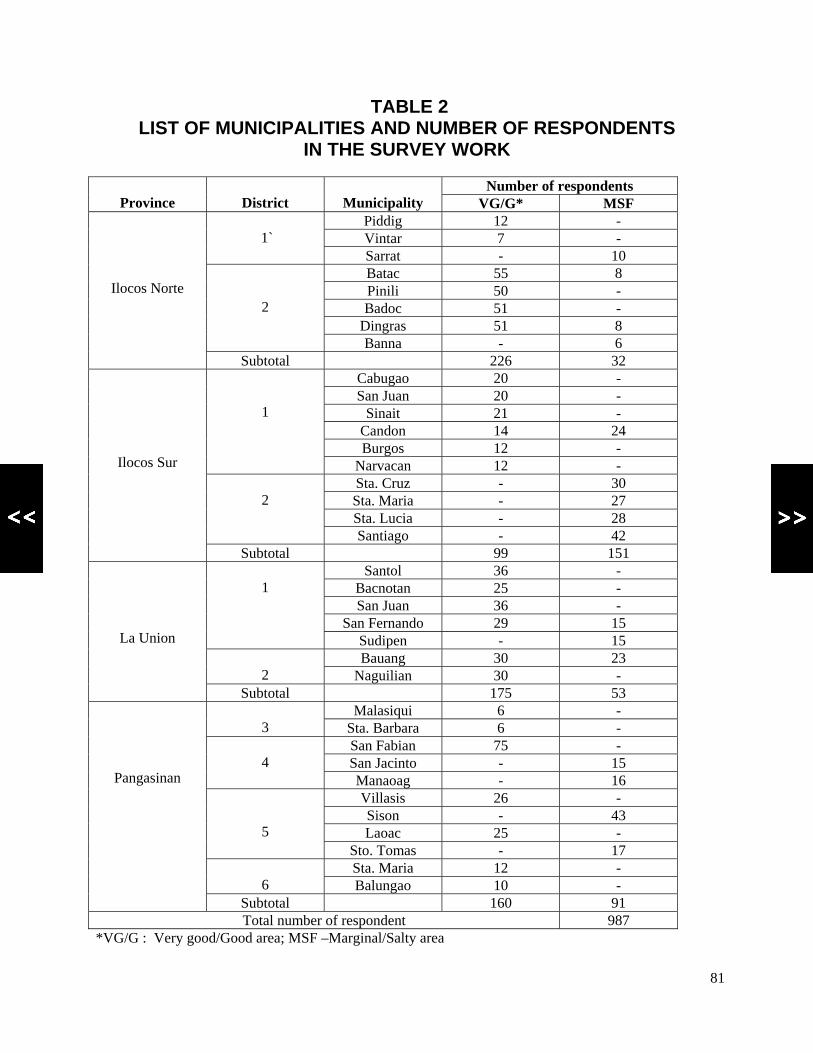
81
TABLE 2 LIST OF MUNICIPALITIES AND NUMBER OF RESPONDENTS
IN THE SURVEY WORK
Number of respondents Province
District
Municipality VG/G* MSF
Piddig 12 - Vintar 7 -
1`
Sarrat - 10 Batac 55 8 Pinili 50 - Badoc 51 -
Dingras 51 8
2
Banna - 6
Ilocos Norte
Subtotal 226 32 Cabugao 20 - San Juan 20 -
Sinait 21 - Candon 14 24 Burgos 12 -
1
Narvacan 12 - Sta. Cruz - 30 Sta. Maria - 27 Sta. Lucia - 28
2
Santiago - 42
Ilocos Sur
Subtotal 99 151 Santol 36 -
Bacnotan 25 - San Juan 36 -
San Fernando 29 15
1
Sudipen - 15 Bauang 30 23
2 Naguilian 30 -
La Union
Subtotal 175 53 Malasiqui 6 -
3 Sta. Barbara 6 - San Fabian 75 - San Jacinto - 15
4
Manaoag - 16 Villasis 26 - Sison - 43 Laoac 25 -
5 Sto. Tomas - 17 Sta. Maria 12 -
6 Balungao 10 -
Pangasinan
Subtotal 160 91 Total number of respondent 987
*VG/G : Very good/Good area; MSF –Marginal/Salty area

………………………………………………………………………………………………….. About SEATCA The Southeast Asia Tobacco Control Alliance (SEATCA) works closely with key partners in ASEAN member countries to generate local evidence through research programs, to enhance local capacity through advocacy fellowship program, and to be catalyst in policy development through regional forums and in-country networking. By adopting a regional policy advocacy mission, it has supported member countries to ratify and implement the WHO Framework Convention on Tobacco Control (FCTC) Contact persons: Ms. Bungon Ritthiphakdee: SEATCA Director Email: [email protected] Ms. Menchi G. Velasco: SEATCA Research Program Manager Email: [email protected]; [email protected] Southeast Asia Tobacco Control Alliance (SEATCA) Address: Thakolsuk Apartment Room 2B, 115 Thoddamri Rd., Nakornchaisri
Dusit, Bangkok 10300, THAILAND Tel./Fax: +662 241 0082
Website: http://www.seatca.org …………………………………………………………………………………………………..