Survey of the English Curriculum and Teaching in UK Higher Education
36
Survey of the English Curriculum and Teaching in UK Higher Education Alexandra Cronberg and Jane Gawthrope Number 19 • January 2010 Report Series ISBN 978-1-905846-32-0
-
Upload
english-subject-centre -
Category
Documents
-
view
217 -
download
2
description
This report summarises the results from a 2009 survey of English departments in the UK. The survey was conducted to collect data on what is taught, how it is taught and the resources and wider context which influence teaching. The report presents the statistical data emerging from each question, and gives a brief commentary on each one. Comments made by Heads of Department completing the questionnaire are also included, as are their views on the current HE context and future trends. The report provides information about: staff, students, resources and facilities, teaching and assessment, course content, coverage and aims and graduate attributes. The report of a similar survey conducted in 2002 is also available.
Transcript of Survey of the English Curriculum and Teaching in UK Higher Education

Survey of the English Curriculum and Teaching in UK Higher Education
Alexandra Cronberg and Jane Gawthrope
Number 19 • January 2010
Report Series
ISBN 978-1-905846-32-0

Number 19 • January 2010
Report Series
ISBN 978-1-905846-32-0
Survey of the English Curriculum and Teaching in UK Higher Education
Alexandra Cronberg and Jane Gawthrope
Copyright Statementa) The authors of the report are Alexandra Cronberg and Jane Gawthrope, who should be referenced
in any citations of the report and acknowledged in any quotations from it.
b) Copyright in the report resides with the publisher, the Higher Education Academy English Subject Centre, from whom permission to reproduce all or part of the report should be obtained.
c) If any additional use is made of secondary data the source must be acknowledged.
The AuthorsAlexandra Cronberg is a freelance social researcher who works on a range of health, education and transport topics.
Jane Gawthrope is Manager of the English Subject Centre and has run a number of surveys in academic environments.
AcknowledgementsThe Subject Centre wishes to thank all those who contributed to this report. Special thanks go to the Council for College and University English and the English Association for their fi nancial contributions and to Alexandra Cronberg who analysed the data. We are grateful to all Heads of Department who took the time and trouble to complete the questionnaire, to those who tested it (Robert Hampson, Simon Dentith and Marion Wynne-Davies) and to David Roberts and Sue Zlosnik who advised on its structure and content.
1
Foreword 2
1. Introduction 3
1.1 Background 3
1.2 Respondents 3
1.3 Methodology 3
1.4 Defi nitions and notes on reading the report 3
2. About Your Department 4
2.1 Awards and Student Numbers 4
2.2 Number of enrolled undergraduate students 5
2.3 Number of post-graduate students enrolled programmes 6
3. Student Recruitment and Retention 7
3.1 Criteria for student selection 7
3.2 Undergraduate admission target compared with actual intake 7
3.3 Student numbers compared to three years ago 8
3.4 Recruitment through Clearing 8
3.5 Drop out rates 9
3.6 Entry profi le 9
3.7 Compulsory entry requirements 10
3.8 Changes in student profi le over last three years that have impacted on teaching and learning 10
4. About Your Colleagues 10
4.1 Number of FTE staff 10
4.2 Types of contract 11
4.3 Weekly timetabled classroom time for full-time staff members 11
4.4 Time spent supervising undergraduate dissertations and one-to-one student consultations 11
4.5 Balance between lectures and group discussion classes 12
5. Teaching for undergraduates 12
5.1 Forms of teaching for undergraduates 12
5.2 Use of student time 13
5.2.1 Level 1 13
5.2.2 Level 2 13
5.2.3 Level 3+ 13
5.3 Restraints on students’ time 14
5.4 Attendance 14
5.5 Penalties 14
5.6 Separation of Level 2 and Level 3+ students 14
6. Assessment 15
6.1 Formal examinations 15
6.2 Final examinations 15
6.3 Dissertation 16
6.4 Forms of assessment 16
6.5 Penalties imposed for late submissions 17
6.6 Detection of plagiarism 17
6.7 Feedback 17
6.8 Barriers to change 18
6.9 Multiple examiners 18
6.10 Anonymous submission 19
7. Coverage 19
7.1 Compulsory elements 19
7.2 Modules Offered in English Literature 20
7.3 English Language 22
7.4 Creative Writing 23
7.5 Drivers of change 23
7.6 Academic writing skills 23
8. Graduate Attributes 24
8.1 Most important skills/attributes for graduates 24
8.2 Career planning advice 24
9. Physical Resources, Facilities, E-Learning 25
9.1 Impact of physical resources 25
9.2 Profi le of e-learning technologies 25
9.3 Number of undergraduate modules that currently have an online component or support delivered through a VLE 26
9.4 Range of ways in which departments use the VLE 26
9.5 Support provided for the development of e-learning technologies 27
9.6 Impact of e-learning 27
10. General Questions 27
10.1 Factors that have had an impact on teaching in the last three years 27
10.2 Most signifi cant changes that are expected in the future 27
10.3 Most signifi cant institutional changes 29
10.4 Single change that would most enhance learning and teaching 30
Contents
2
Survey of the English Curriculum and Teaching in UK Higher Education
ForewordIn its ten year history the Subject Centre has developed a role in providing the English and Creative Writing community with information about itself and, by extension, to other interested organisations and individuals. The Subject Centre works with and for the discipline as part of a national network and is therefore well-placed to gather and disseminate intelligence ‘without fear or favour’ to the interests of a particular HE institution or group of institutions. This intelligence-gathering takes several forms. It ranges from casual conversations with academic colleagues, views and information published on our website and in our magazine, to more formally gathered data from surveys such as the one reported here.
Most of the information the Subject Centre gathers is shared with the wider community (although care is taken not to disclose matters of a confi dential or sensitive nature) and much is freely available in the public domain. We know that there is a need for such information because we are asked for it frequently. Heads of Department preparing cases to senior management, lecturers making cases to Heads of Department or preparing presentations for Open Days, parents concerned about how much contact time their offspring receive, publishers curious about how widely a topic is taught and those responding to consultation documents have all approached the Subject Centre with the sort of questions which can be answered from this report. A community which has little acquaintance with statistics in its subject matter seems to recognise the value of numbers in strengthening arguments and understanding a department’s particular situation in relation to a broader picture.
This report is therefore a major constituent of a ‘body of evidence’ about the teaching of English and Creative Writing. It is necessarily imperfect in that not all departments invited to complete a questionnaire did so. (Only professional ethics will prevent us from succumbing to the temptation to ask a Head of Department if they completed the survey before responding to an enquiry they bring to us.) The questions asked had to be restricted to a manageable number so as not to deter respondents. Yet we are confi dent that the information produced in this report is reliable and will prove useful in a variety of ways in the years to come.
Although the survey is a snapshot of the discipline in mid-2009, it adds to the data collected by a similar survey in 2002 (see Survey of the English Curriculum and Teaching in UK Higher Education, English Subject Centre Report no. 8, October 2003 available at www.english.heacademy.ac.uk/explore/publications/currsurvey.php) which in turn built on the 1997 Council for College and University English report Diversity and Standards. (The desire to maintain a thread of continuity and comparability between these surveys whilst asking questions that were appropriate in the current context was one of the biggest challenges faced in developing the questionnaire for the 2009 survey.) Indeed a comment made by Philip Martin in the Foreword to the 2003 Survey is just as pertinent to that of 2009:
It is not surprising that a subject well-known for the diversity of its forms (curriculum, combinations of awards, teaching and learning styles, assessment kinds, type of institution, student qualifi cations at entry, and so on) should produce results in a survey of this kind that reveal a broad and varied pattern rather than a narrow and consistent one.
Evidence of that breadth and variety abounds in this report in answers to questions about student and staff numbers, entry profi le, assessment methods and the curriculum. Whilst such diversity is perhaps not surprising to those familiar with the discipline in HE, it is useful to be able to point it out to prospective students when guiding them in making university choices. It is also useful in challenging the stereotypes of teaching and the curriculum often portrayed in the press and indeed occasionally by VCs.
In relation to the pressures faced by departments, however, diversity fades and a more consistent picture emerges. Pressures caused by students engaged in paid employment or with caring responsibilities, pressure to give more feedback on coursework and the negative impact on teaching of the lack of good quality teaching space are all commonly cited by respondents and could be described as ‘characteristic’ of the community. Heads of Department have in common a preoccupation with student numbers and increased workloads for staff. When asked to state the single change that would most enhance teaching and learning, the answer ‘more staff’ was commonly given. The gap between what HE policy makers see as the priorities for the sector, and the priorities as perceived by those running departments, is a striking one.
Problems and pressures are not the whole picture however. This report points to growth in terms of undergraduate numbers, in creative writing and in postgraduate programmes. It points to innovation in teaching and assessment methods, widespread adoption of e-learning and the positive impact of the availability of digital collections. It points to a wide and changing curriculum. Taken as a whole, this report evidences a diverse and energetic discipline, striving to fi nd innovative solutions to the problems faced by HE generally and by English and Creative Writing in particular. The Subject Centre wishes to thank all those who contributed to it. Special thanks go to the Council for College and University English and the English Association for their fi nancial contributions and to Alexandra Cronberg who analysed the data. We are grateful to all Heads of Department who took the time and trouble to complete the questionnaire, to those who tested it (Robert Hampson, Simon Dentith and Marion Wynne-Davies) and to David Roberts and Sue Zlosnik who advised on its structure and content.
Jane GawthropeManagerEnglish Subject CentreNovember 2009

3
Survey of the English Curriculum and Teaching in UK Higher Education
1. Introduction1.1 BackgroundIn 2002/2003 the English Subject Centre carried out a wide-ranging survey of the English curriculum and teaching in higher education. In conducting the survey, the Subject Centre had the support of its Advisory Board and the Council for College and University English (CCUE). The survey resulted in the publication of an extensive report entitled ‘Survey of the English Curriculum and Teaching in UK Higher Education’ in October 2003. (See www.english.heacademy.ac.uk/explore/publications/currsurvey.php)
Over the years the report proved invaluable in:
• providing benchmarking data against which departments could compare themselves and use in making cases to the senior management of their institutions
• providing evidence to support responses to various national consultations
• providing information to prospective students about what they are likely to study and how
• evidencing the breadth and variety of provision in the discipline
• answering enquiries about the discipline from those inside and outside it
By 2008 it was apparent that the report was signifi cantly outdated, failing to refl ect changes in teaching methods (for example the growth of e-learning) or in the shape of the discipline (the expansion of Creative Writing) which had occurred over the previous fi ve years. Nevertheless, because there was no alternative source of data it continued to be used, for example in presentations at student open days. The Subject Centre therefore sought and obtained the support of CCUE and the English Association to update the survey.
In consultation with representatives of the discipline community, the Subject Centre revised the 2003 questionnaire to take account of changed circumstances, new issues and the fact that it would be presented online. Overall, it aimed to reduce the length of the questionnaire and the amount of detail requested in order to encourage completion. Final drafts of the questionnaire were tested on a sample of Heads of Department before it went live.
1.2 RespondentsSubject Centre staff compiled a list of eligible departments teaching English Literature, English Language or Creative Writing by searching for courses on HE institution websites. (FE institutions teaching HE were not included.) One hundred and thirty-nine ‘departments’ emerged as eligible to participate in the survey, although it should be noted that some of these were very small units where there might be only one or two staff running, say, one part-time programme. Others were very large units where English/Creative Writing was a minor element in provision. There were 63 responses that were entered into the survey software. Of these, two responses did not contain any answers and two respondents were ineligible. Additionally, four respondents completed the survey more than once, accounting for fi ve responses in total. In cases of duplicate entries, only the most recent response was used.
Hence, there were 54 valid responses used in the analysis, equivalent to 40% (although as noted above, this percentage is pulled down by the fact that in some of the departments contacted there was only a small amount of English/Creative Writing teaching going on and a response was therefore unlikely). A 40% response rate is generally deemed satisfactory for postal surveys, while the response rate for electronic surveys tends to be slightly lower. Hence, the response rate achieved in this survey is somewhat higher than what might have been expected.
Three universities with more than one department teaching English were represented twice (e.g. universities with separate departments for Language and Creative Writing). It should be noted that not all respondents completed the full range of questions. Consequently, the number on which the analysis of individual questions is based varies to some extent.
For comparison, there were 53 respondents when the survey was conducted in 2003 so the response rate is broadly similar.
1.3 MethodologyThe survey was conducted using the software Survey Monkey (www.surveymonkey.com). Eligible respondents were sent a letter and/or an email containing a link to the questionnaire, which could be completed by respondents in one or more sessions.
The survey was open between 27th April and 4th August 2009. Non-respondents were sent three reminders at intervals during this period, and entry in a draw for a case of wine was offered as an inducement to complete the survey.
1.4 Defi nitions and notes on reading the reportCombined degrees refers to degrees that combine English Literature, English Language or Creative Writing with a subject in another department e.g. English and Drama or Creative Writing and Business Studies. Combined degrees are also referred to as joint degrees.
Combination degrees refers to degrees that combine two or more subjects within English Literature, English Language and Creative Writing e.g. English Language and Literature or Creative Writing and English Language.
This report presents the results of the survey in sections which correspond to the original questionnaire. The text highlights the key fi ndings from each question, and gives the related numbers/percentages. The results are presented in graphical form and the full results for each question are presented in a workbook available at: www.english.heacademy.ac.uk/archive/publications/reports.php
The results in the charts are presented as percentages when responses are compared, since the number of responses for each question tends to vary. When the total number of responses to a particular question is small (20 or fewer), the results are not shown alongside the other questions. It should be noted that even a base of 20 or 30 respondents could be considered small and percentages should be treated with caution. For the remaining charts, results are generally presented as frequencies, so that the number of responses is shown in addition to the pattern.
For most questions, the number of respondents is equivalent to the number of responses. Unless otherwise stated, ‘responses’ and ‘respondents’ are therefore used interchangeably.

4
Survey of the English Curriculum and Teaching in UK Higher Education
Further, for some questions where an estimate was required, some respondents explicitly reported zero, while others left answers blank. Since it is not possible to determine whether a non-response represents a zero or unknown, all zeros and blanks have been excluded so as not to misrepresent this category of respondents.
The results from 2009 are compared with those from 2003 wherever possible. In many cases however, questions had to be formulated differently in 2009 because of changing circumstances. Where there are notable differences or similarities between the two sets of data, these are mentioned in the text and the relevant results are reproduced. It should be remembered, however, that differences between the two sets of data might be due to different sets of respondents in the two surveys.
2. About Your Department2.1 Distribution of respondentsFigure 1: Country of department, 2009 and 2003
The majority of the 54 respondents were based at universities in England (39 respondents, 72%), followed by Scotland (6 respondents, 11%), Wales (5 respondents, 9%), Northern Ireland (3 respondents, 6%) and Ireland (1 respondent, 2%). Compared to 2003, a slightly smaller proportion of respondents were based in England in the 2009 survey (72% vs. 85%).
This pattern largely represents the distribution of English departments across the United Kingdom. Departments based in English HEIs represented 80% of those surveyed and 36% of these responded; departments based in Scottish HEIs represented 8% of those surveyed and 54% of these responded; departments based in Welsh HEIs represented 10% of those surveyed and 45% of these responded; departments based in HEIs in Northern Ireland represented 2% of those surveyed and 33% of these responded. This information is summarised below:
CountryNo. of
respondents% of all
respondents
% of those
surveyed
% response
by country
England 39 72% 80% 36%
Scotland 6 11% 8% 54%
Wales 5 9% 10% 45%
N. Ireland 3 6% 2% 33%
2.2 Awards and student numbersFigure 2: Awards offered, 2009 and 2003 (multiple response)
Almost all respondents in 2009 offer Single Honours undergraduate degrees and Joint/Combined honours with another subject (both 45 of 47 respondents, 96%). Forty-one respondents (87%) offer taught postgraduate degrees and 40 respondents (85%) offer research degrees (such as PhD/DPhil/MPhil/MLitt).
Compared to the 2003 survey, there has been an increase in the proportion of respondents offering taught post-graduate degrees (from 77% in 2003 to 87% in 2009). There has also been a slight increase in the proportion of respondents offering Single Honours degrees (from 91% in 2003 to 96% in 2009). The proportion of respondents that offer research degrees has remained largely constant during this time period (87% in 2003 and 85% in 2009). Due to slightly different wording in terms of Joint/Combined honours degrees in the 2003 and 2009 surveys, these responses are not comparable and therefore not shown in the chart. In 2003, respondents were asked separately about Combined Honours English with another subject (77% reported they offered this type of degree) and Joint Honours English with another subject (integrated programme) (55% reported they offered this type of degree).
Figure 3: Undergraduate degrees offered, 2009 and 2003 (multiple response)
In 2009, 42 of 48 respondents (88%) said they offer English Literature as part of their undergraduate programme, 26 respondents (54%) offer Creative Writing, and 14 respondents (29%) offer English Language. Twenty-fi ve respondents (52%) offer combination degrees (for example BA English combining Literature and Language).
0
10
20
30
40
50
60
70
80
90
England
Per
cent
of
resp
ons
es
Country
Scotland Wales NorthernIreland
Ireland
2003
2009P
erce
nt o
f re
spo
nses
Awards offered
2003
2009
0102030405060708090
100
Undergraduatedegree –
SingleHonours
Undergraduate degree - Joint or Combined
Honours with another
subject
Taught postgraduate
degree
Research degree - Phd / DPhil / MPhil /
MLitt etc
0
10
20
30
40
50
60
70
80
90
100
Literature EnglishLanguage
CreativeWriting
Combinations
Per
cent
of
resp
ons
es
Undergraduate degrees offered
2003
2009
5
Survey of the English Curriculum and Teaching in UK Higher Education
Compared to 2003, there has been a substantial decrease in the proportion of respondents offering Language (from 55% in 2003 to 29% in 2009) although this may be due to the two surveys having different sets of respondents. There has also been a small decrease in the proportion of respondents offering Literature (from 96% to 88%). There was no equivalent question on Creative Writing in the 2003 survey because Creative Writing was not such a signifi cant feature of the landscape as it is now. It is notable however that more than half of respondents in 2009 offer this subject.
2.3 Number of enrolled undergraduate students
2.3.1 Full-time students
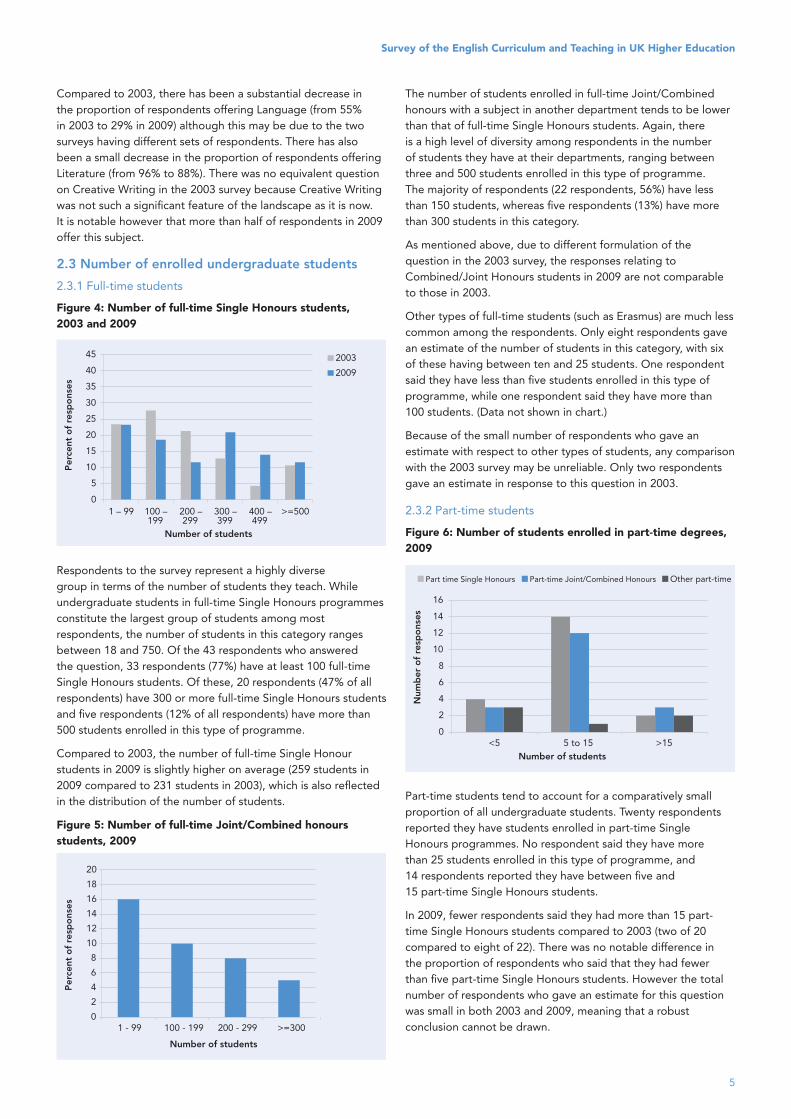
Figure 4: Number of full-time Single Honours students, 2003 and 2009
Respondents to the survey represent a highly diverse group in terms of the number of students they teach. While undergraduate students in full-time Single Honours programmes constitute the largest group of students among most respondents, the number of students in this category ranges between 18 and 750. Of the 43 respondents who answered the question, 33 respondents (77%) have at least 100 full-time Single Honours students. Of these, 20 respondents (47% of all respondents) have 300 or more full-time Single Honours students and fi ve respondents (12% of all respondents) have more than 500 students enrolled in this type of programme.
Compared to 2003, the number of full-time Single Honour students in 2009 is slightly higher on average (259 students in 2009 compared to 231 students in 2003), which is also refl ected in the distribution of the number of students.
Figure 5: Number of full-time Joint/Combined honours students, 2009
The number of students enrolled in full-time Joint/Combined honours with a subject in another department tends to be lower than that of full-time Single Honours students. Again, there is a high level of diversity among respondents in the number of students they have at their departments, ranging between three and 500 students enrolled in this type of programme. The majority of respondents (22 respondents, 56%) have less than 150 students, whereas fi ve respondents (13%) have more than 300 students in this category.
As mentioned above, due to different formulation of the question in the 2003 survey, the responses relating to Combined/Joint Honours students in 2009 are not comparable to those in 2003.
Other types of full-time students (such as Erasmus) are much less common among the respondents. Only eight respondents gave an estimate of the number of students in this category, with six of these having between ten and 25 students. One respondent said they have less than fi ve students enrolled in this type of programme, while one respondent said they have more than 100 students. (Data not shown in chart.)
Because of the small number of respondents who gave an estimate with respect to other types of students, any comparison with the 2003 survey may be unreliable. Only two respondents gave an estimate in response to this question in 2003.
2.3.2 Part-time students
Figure 6: Number of students enrolled in part-time degrees, 2009
Part-time students tend to account for a comparatively small proportion of all undergraduate students. Twenty respondents reported they have students enrolled in part-time Single Honours programmes. No respondent said they have more than 25 students enrolled in this type of programme, and 14 respondents reported they have between fi ve and 15 part-time Single Honours students.
In 2009, fewer respondents said they had more than 15 part-time Single Honours students compared to 2003 (two of 20 compared to eight of 22). There was no notable difference in the proportion of respondents who said that they had fewer than fi ve part-time Single Honours students. However the total number of respondents who gave an estimate for this question was small in both 2003 and 2009, meaning that a robust conclusion cannot be drawn.
Per
cent
of
resp
ons
es
Number of students
2003
2009
0
5
10
15
20
25
30
35
40
45
1 – 99 100 –199
200 –299
300 –399
400 –499
>=500
0
2
4
6
8
10
12
14
16
18
20
1 - 99 100 - 199 200 - 299 >=300
Number of students
Per
cent
of
resp
ons
es
0
2
4
6
8
10
12
14
16
<5 5 to 15 >15
Num
ber
of
resp
ons
es
Part time Single Honours Part-time Joint/Combined Honours Other part-time
Number of students

6
Survey of the English Curriculum and Teaching in UK Higher Education
Part-time Joint/Combined honours programmes with a subject in another department appear to be about as common as part-time Single Honours programmes. Eighteen respondents reported they have students enrolled in part-time Joint/Combined honours programmes with a subject in another department. Twelve respondents said they have between fi ve and 15 students enrolled in this type of programme, three respondents said they have fewer than fi ve students, two respondents said they have 20 students, and one respondent said they have 50 students.
Five respondents said they have students enrolled in other types of part-time programmes, with three of these respondents reporting that they have between 15 and 30 students in this category.
No respondents said they have students enrolled in distance Single Honours programmes, and only one respondent reported their department has distance students taking Joint/Combined honours (15 students).
These fi gures are not fully comparable with the 2003 survey and therefore not included.
2.3.3 Other students enrolled on undergraduate modules
Figure 7: Number of other students enrolled on undergraduate modules, 2003 and 2009
Thirty-six respondents reported that they had other students enrolled on undergraduate modules, for example Erasmus students or American exchange students. The number of students in this category ranged between one and 200, though the majority of respondents said they had between fi ve and 50 such students.
Compared to 2003, the average number of other students enrolled on undergraduate modules has remained similar in 2009 (39 and 38 students respectively), although the distribution of the number of students appears to have changed slightly.
2.4 Number of post-graduate students enrolled programmesFigure 8: Number of students enrolled in taught post-graduate degrees, 2003 and 2009
The number of students on taught post-graduate degrees tends to be slightly higher than on research degrees. Among the 35 respondents who gave a non-zero estimate in response to these questions, 18 respondents (51%) reported that they have fewer than 25 students enrolled in taught postgraduate degrees. Twelve respondents (34%) have 50 or more students, one of which (3% of all respondents) has more than a hundred students.
The number of students enrolled in taught post-graduate degrees has on average decreased in 2009 (35 students) compared to 2003 (42 students). It should be noted however that a larger number of departments are offering taught post-graduate degrees in 2009 compared to 2003 – see Figure 2.
Figure 9: Number of students enrolled in research degrees, 2003 and 2009
The number of students enrolled in research degrees tended to be slightly lower than that for taught postgraduate degrees. While 20 of 36 respondents (56%) reported that they had fewer than 25 students enrolled in this type of programme, eight respondents (22%) reported that they had 50 students or more.
The number of students enrolled in research degrees has decreased marginally in 2009 compared to 2003: in 2009 it is on average 29 students, while it was 31 students in 2003.
0
10
20
30
40
50
60
<25 25 to 49 50 to 74 >=100Number of students
Per
cent
of
resp
ons
es
2003
2009
0
10
20
30
40
50
60
<25 25 to 49 50 to 74 75 to 99 >=100
Number of students
Per
cent
of
resp
ons
es
2003
2009
0
10
20
30
40
50
60
70
<25 25 to 49 50 to 74 75 to 99 >=100
Number of students
Per
cent
of
resp
ons
es
2003
2009

7
Survey of the English Curriculum and Teaching in UK Higher Education
3. Student Recruitment and Retention3.1 Criteria for student selectionFigure 10: Criteria for student selection, 2009
Respondents were asked whether each of a number of criteria used for student selection was used as major method, subsidiary method, or not at all. The number of total responses differed slightly for the different criteria, with a somewhat higher number of respondents answering the question with respect to predicted public examination performance (such as A Level) and the UCAS form (other than predicted exam performance) (42 and 41 respondents, respectively). The number of responses with respect to the other criterion ranged between 34 and 37.
With respect to whether each of the different criteria are used as major method, subsidiary method, or not at all, predicted public examination performance is the criteria most commonly used as major method (39 of 42 respondents, 93%). Two respondents (5%) reported that it is used as a subsidiary method and one respondent (2%) said it is not used at all.
With respect to the UCAS form (parts other than predicted exam performance), 24 of 41 respondents (59%) reported that it is used as major method, 16 respondents (39%) said it is used as subsidiary method, and one respondent (2%) said it is not used at all.
Thirty-seven respondents answered the question with respect to interview. Twenty-six respondents (70%) said they use it as subsidiary method and four respondents (11%) said they use it as a major method. Seven respondents (19%) reported they do not use it at all.
Thirty-four respondents gave a response with respect to portfolio and about half of those (18 respondents, 53%) said they use it as subsidiary method. Fifteen respondents (44%) said it is not used at all and only one respondent (3%) said it is used as major method.
The least commonly used criterion for undergraduate student selection is university-set examinations. Thirty respondents answered the question with respect to this selection method. One respondent (3%) reported they use it as major method and three respondents (10%) said it is used as subsidiary method. Twenty-six respondents (87%) said it is not used at all.
Compared to 2003, a very similar pattern is seen in 2009 with respect to using predicted exam results as selection method: of the 53 respondents, 92% used it as major method, 2% as subsidiary method, and 6% not at all.
There were two separate questions relating to the UCAS form in 2003, that is, ‘personal statement’ and ‘reference’, while there was a single question in 2009. Therefore, no valid comparison can be made with respect to these selection methods.
A similar proportion in 2009 as in 2003 reported they use interview as major method (11% in both surveys). There has been a notable increase in 2009, however, in the proportion of respondents that said they use interview as subsidiary method (70% in 2009 compared to 57% in 2003).
‘Portfolio’ was not included as part of the question in the 2003 survey.
3.1.1 Other criteria for selecting students
In addition to the criteria above, fi ve respondents mentioned using a short writing task as selection method for Creative Writing, in particular for ‘non-traditional’ applicants such as overseas students.
Two respondents said they select students based on Access qualifi cations, in particular if applicants are mature students.
3.2 Undergraduate admission target compared with actual intakeFigure 11: Undergraduate admission target compared with actual intake 2008/09 and 2001/02
Respondents were asked whether their undergraduate admission targets for 2008/09 were about the same (+/-10%), higher, or lower compared with actual intake. The majority of respondents reported that actual intake is about the same or higher than their admission targets, although the pattern differs slightly with respect to Creative Writing and Language compared to Literature and Combinations.
In terms of Literature, 26 of 39 respondents (67%) reported that actual intake is about the same as their admission targets. Seven respondents reported that actual intake is higher than the admission target (18%), whereas four reported that it is lower (10%). The equivalent fi gures for Combination programmes were 16 of 26 respondents (62%) reporting that actual intake and targets are about the same. Three respondents (12%) reported it is higher than actual intake and a further three respondents (12%) reported it is lower. Four respondents (15%) did not respond.
0
10
20
30
40
50
60
70
80
90
100
Predictedexam results
UCAS form(other part)
Interview University-set
examination
Portfolio
Major Method
Subsidiary Method
Not at all
Criteria
Per
cent
of
resp
ons
es
0
10
20
30
40
50
60
70
80
Literature CreativeWriting
Combinations Overall2001/02
About the same (less than 10% larger or smaller)
Target higher than intake Target lower than intake
Per
cent
of
resp
ons
es

8
Survey of the English Curriculum and Teaching in UK Higher Education
The pattern is slightly different with respect to Creative Writing and Language. Among respondents who offer Creative Writing, thirteen of 28 respondents (46%) reported it is about the same, while four respondents said it is higher than actual intake (14%) and fi ve respondents (18%) said it is lower. Six respondents (21%) did not respond.
With respect to Language, while the numbers are too small to present reliable percentages and are therefore not shown in the chart, it can be seen that 9 of 20 respondents said actual intake and admission targets are about the same. One respondent said it is higher and three respondents said it is lower. Seven of the 20 respondents did not respond.
In 2003, this question was asked for overall student numbers, rather than for each degree separately. It can be noted however that a comparatively small proportion reported that admission targets and actual intake for 2001/02 were about the same (30% of 53 respondents), whereas 40% reported that their overall admission targets were higher than actual intake and 23% reported it was lower. Seven percent did not respond.
Hence, it appears that the gap between admission targets and actual intake tended to be smaller in 2008/09 compared to 2001/02, although the data does not allow any robust conclusions to be drawn.
3.3 Student numbers compared to three years agoFigure 12: Student numbers compared with 3 years ago, 2009 and 2003 (5 years ago)
Respondents were asked whether student numbers in their department are about the same (+/-10%), larger or smaller compared to three years ago. A large majority reported that student numbers have either stayed the same or increased for each of the degrees.
Departments offering Creative Writing have seen the most notable increase in student numbers during this time period, with 14 out of 27 respondents (52%) reporting that the number of students has increased. Seven respondents (26%) reported that numbers are about the same, whereas two respondents (7%) reported that numbers have decreased. Four respondents (15%) did not respond.
With respect to Literature, 14 of 37 respondents (38%) said the number of students has remained about the same, 15 respondents (41%) said the number has increased, and seven respondents (19%) said it has decreased.
Fewer respondents answered the question with respect to Language and Combination degrees. With respect to Combinations, ten of 23 respondents (43%) said the student number has remained about the same, eight respondents (35%) said it has become larger, three respondents (13%) said it has become smaller, and two respondents (9%) did not know. Among the 18 respondents who answered the question with respect to Language, four respondents said the number of students has remained about the same, eight said it has become larger, two said it had become smaller, and four did not respond.
In 2003, respondents were asked to compare the overall student numbers of their department, rather than student numbers within each degree. Respondents were further asked to compared student numbers with those fi ve years ago, rather than three years ago as in 2009. While the results are therefore not directly comparable, it can be noted that a substantial majority of the 53 respondents (64%) reported that student numbers had increased overall, 15% reported they were about the same, and 19% reported they had decreased. Two percent did not respond. Hence, it seems there has been a continuous trend of expansion among English departments, although the rate of increase may have slowed down.
3.4 Recruitment through ClearingFigure 13: Proportion of students recruited through clearing, 2008/09 and 2001/02
The majority of respondents reported that they recruit 10% or fewer of their students through clearing. No respondent reported that more than 40% of students are recruited through this method.
Literature students are least likely to be recruited through clearing, with 29 of 38 respondents (76%) reporting that 10% or fewer of students are recruited through this method. No respondent reported that more than 20% of Literature students are recruited through clearing. Following Literature, Creative Writing students are the next least likely to be recruited this way, with 17 of 26 respondents (65%) reporting that 10% or fewer of students are recruited through clearing. Five respondents (19%) reported that between 11% and 40% of Creative Writing students are recruited through this method. Thirteen of 24 respondents (54%) reported that 10% or fewer of students taking Combinations are recruited this way, while six respondents (25%) reported that it is between 11% and 40%. Fewer respondents gave an estimate with respect to Language.
0
10
20
30
40
50
60
70
Literature CreativeWriting
Combinations Overall 2003
About the same (less than 10% larger or smaller)
Per
cent
of
resp
ons
es
Larger Smaller
0
10
20
30
40
50
60
70
Literature CreativeWriting
Combinations Overall2001/02
0%
1-10%
11-20%
21-30%
31-40%
41-50%
Per
cent
of
resp
ons
es
>50%
9
Survey of the English Curriculum and Teaching in UK Higher Education
Of 20 respondents, nine respondents reported that 10% or fewer of students are recruited through clearing and four respondents reported that between 11% and 20% of students are recruited through this method.
In the 2003 survey, respondents were asked about the overall proportion of students recruited through clearing. While the results are not directly comparable, it can be noted that 48% of the 53 respondents said that 10% or fewer of students were recruited this way in 2003, while 35% said that between 11% and 50% were recruited through this method. Two percent said more than 50% were recruited through clearing. The results therefore suggest that Clearing has become a slightly less common way of recruiting students, perhaps because competition among students has increased.
3.5 Drop out ratesFigure 14: Proportion of registered students dropping out of Level 1 (fi rst year), 2008/09 and 2001/02
Among the respondents, Literature had the lowest drop out rate overall among Level 1 (fi rst year) registered students in 2008/09, followed by Creative Writing, and then Combinations. While the number of responses for Language was slightly lower compared to the other degrees, drop out rates appeared to be similar to that of Creative Writing.
With respect to Literature, 30 of 38 respondents (79%) reported that 10% or fewer of registered students dropped out at Level 1 in 2008/09. The equivalent fi gure was 18 of 25 respondents (72%) for Creative Writing and 12 of 23 respondents (52%) for Combinations. Fewer respondents gave an estimate with respect to Language, but it can be seen that 12 of 18 respondents reported that 10% or fewer of registered students dropped out at Level 1 in 2008/09.
In 2003, respondents were asked about overall drop out rates in 2001/02 rather than for each programme individually. It appears that drop out rates in 2001/02 were similar to that of Literature in 2008/09, with 77% of 53 respondents reporting that 10% or less of students dropped out at Level 1 and 15% of respondents reporting that between 11% and 20% of students dropped out at Level 1.
In line with the question above on recruitment through clearing, the results suggest that degrees with the largest proportion of students recruited through clearing also tend to have the highest drop out rates.
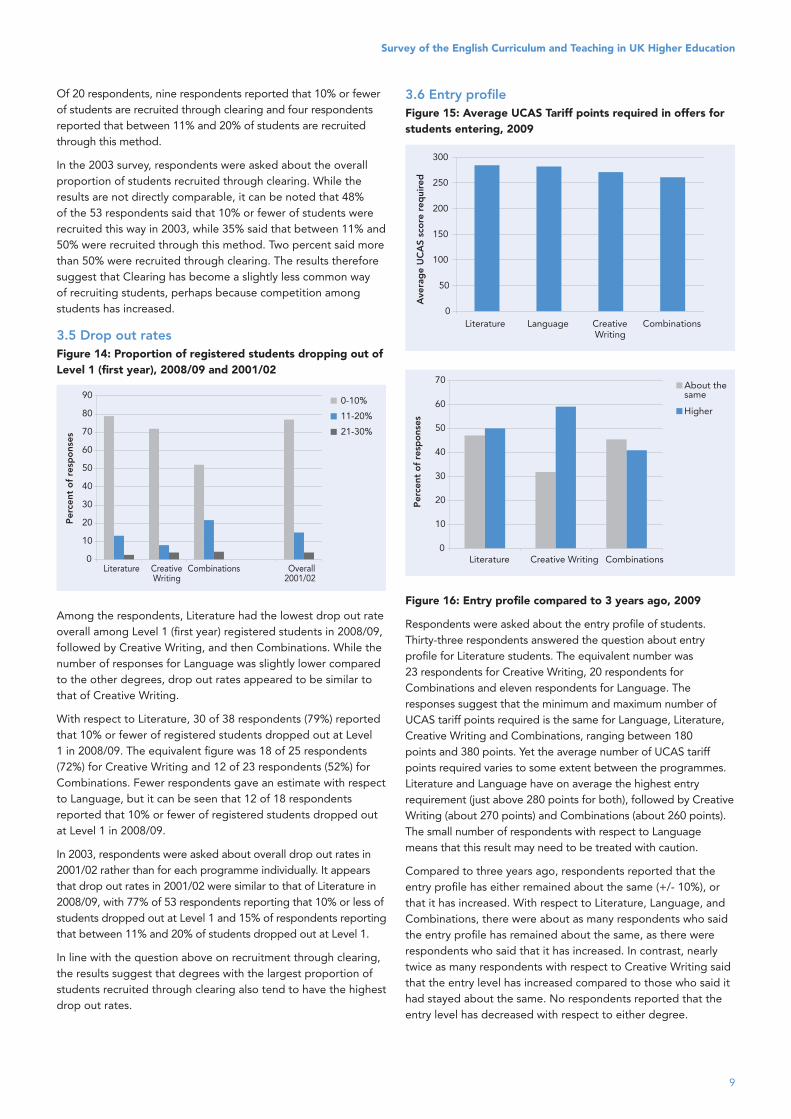
3.6 Entry profi leFigure 15: Average UCAS Tariff points required in offers for students entering, 2009
Figure 16: Entry profi le compared to 3 years ago, 2009
Respondents were asked about the entry profi le of students. Thirty-three respondents answered the question about entry profi le for Literature students. The equivalent number was 23 respondents for Creative Writing, 20 respondents for Combinations and eleven respondents for Language. The responses suggest that the minimum and maximum number of UCAS tariff points required is the same for Language, Literature, Creative Writing and Combinations, ranging between 180 points and 380 points. Yet the average number of UCAS tariff points required varies to some extent between the programmes. Literature and Language have on average the highest entry requirement (just above 280 points for both), followed by Creative Writing (about 270 points) and Combinations (about 260 points). The small number of respondents with respect to Language means that this result may need to be treated with caution.
Compared to three years ago, respondents reported that the entry profi le has either remained about the same (+/- 10%), or that it has increased. With respect to Literature, Language, and Combinations, there were about as many respondents who said the entry profi le has remained about the same, as there were respondents who said that it has increased. In contrast, nearly twice as many respondents with respect to Creative Writing said that the entry level has increased compared to those who said it had stayed about the same. No respondents reported that the entry level has decreased with respect to either degree.
0
10
20
30
40
50
60
70
80
90
Literature CreativeWriting
Combinations Overall2001/02
0-10%
11-20%
21-30%
Per
cent
of
resp
ons
es
0
50
100
150
200
250
300
Literature Language CreativeWriting
Combinations
Ave
rag
e U
CA
S sc
ore
req
uire
d
0
10
20
30
40
50
60
70
Literature Creative Writing Combinations
Per
cent
of
resp
ons
es
About thesame
Higher

10
Survey of the English Curriculum and Teaching in UK Higher Education
Specifi cally, in terms of Literature, 16 of 34 respondents (47%) reported that the entry profi le has remained about the same and 17 respondents (50%) reported that it has increased. For Combinations the fi gures were ten of 22 respondents (45%) reporting that the entry profi le has remained about the same and 9 respondents (41%) reporting it has increased. For Creative Writing, 13 of 22 respondents (59%) reported that the entry profi le has increased, whereas seven respondents (32%) said it has remained about the same. Only 13 respondents answered the question with respect to Language. Of these, four respondents said the entry profi le has remained about the same, and fi ve respondents said it has increased.
3.7 Compulsory entry requirementsFigure 17: Compulsory entry requirements, 2009 (multiple response)
Respondents were asked what compulsory entry requirements are applied for each degree. Respondents could select multiple responses. Due to limitations in the questionnaire design in the survey software, it is not possible to determine the number of respondents, as opposed to the total number of responses, with respect to each degree. It is therefore not possible to compare the proportion of responses across the different degrees, taking into account the multiple response nature of the question.
In terms of the number of responses for each response option, the most commonly reported requirement across all degrees is any A Level in English (Literature or Language or Literature and Language), ranging between ten responses (Language) and 23 responses (Literature).
Between three and eight responses indicated that Advanced Higher English is a compulsory entry requirement for each degree.
Literature is the degree that was most commonly reported as requiring a specifi c A Level in English (twelve responses). The requirements most commonly mentioned are Literature or Literature and Language. The equivalent fi gure for Language, Creative Writing and Combinations ranged between one and four responses.
Between three and four responses with respect to each degree said that their departments require an A Level/Higher in another specifi ed subject. From the responses it is not clear whether this is an actual requirement or an accepted or desirable criterion. For example, one respondent reported that an A Level/GSCE in a foreign language is desirable, whereas another respondent mentioned that Theatre/Media studies is acceptable for Creative Writing.
3.8 Changes in student profi le over last three years that have impacted on teaching and learningAs an open-ended question, respondents were asked what other changes, if any, they have observed in the student profi le over the last three years which have impacted on teaching and learning (other than changes in grade entry profi le). Thirty-two respondents answered this question. The most common responses are shown below.
Comment Number of responses
No change has been observed 10
Fewer mature students and a generally younger age profi le
8
Students have poorer writing skills 4
Fewer local students and a larger number of students from other parts of England or international students are recruited
3
Students increasingly tend to have part-time work commitments
2
4. About Your Colleagues4.1 Number of FTE staffFigure 18: Number of FTE staff involved in teaching and FTE admin/support staff, 2009
Respondents were asked how many FTE staff are involved in teaching, and how many FTE administrative/support staff their department has. There is a high level of variation among respondents in terms of number of staff. Thirty-nine respondents answered the question with respect to number of staff involved in teaching and 37 respondents answered it with respect to administrative/support staff. The number of FTE involved in teaching ranges between 0.8 and 50, and the average number is 18 FTE staff. The number of FTE administrative/support staff ranges between 0.2 and 10, and the average number is three staff.
The average number of FTE staff in 2009 decreased marginally in 2003 (18 compared to 19 staff, respectively). The average number of FTE administrative/support staff is similar in 2009 compared to 2003 (an average of three staff in both years).
0
5
10
15
20
25
Literature Language Creative Writing
Combinations
Num
ber
of
resp
ons
es
Any A Level English (Literature or Language or Lit&Lang) or Higher English
A specific A Level English (Literature or Language or Lit&Lang)
A Level/Higher in another subject
Advanced Higher English (SQA)
0
5
10
15
20
25
30
35
40
1 - 9 10 - 19 20 - 29 30 - 39 40 - 49 50+
FTE staff involved in teaching FTE admin/support staff
Num
ber
of
resp
ons
es
Number of staff

11
Survey of the English Curriculum and Teaching in UK Higher Education
4.2 Types of contractFigure 19: Number of staff on full-time, permanent contracts, 2009
Figure 20: Average number of staff by type of contract, 2003 and 2009
Respondents were asked about the types of contract among their staff. Forty-three respondents answered the question. As one would expect, the most common type of contract reported by respondents is full-time, permanent contracts, followed by hourly paid staff (including teaching assistants). Part-time staff and fractional staff are less common, and the least common type of contract is full-time staff on temporary contracts.
The number of full-time staff on permanent contracts ranges between one and 45, with an average number of about 16 staff. The number of hourly paid staff range between one and 30, with an average number of about eleven staff. The number of part-time staff and fractional staff range between one and 18 and the average is about four staff. In terms of full-time staff on temporary contracts, the minimum and maximum numbers are one and seven staff, respectively, with an average of about one staff member.
Compared to 2003, the average number of full-time staff on permanent contracts in 2009 appears to have decreased marginally, from 17 to 16 staff. The number of full-time staff on temporary contracts also appears to have decreased somewhat, from three to one staff. In contrast, there was a slight increase in the number of part-time/fractional staff over the same period, from three to four staff.
4.3 Weekly timetabled classroom time for full-time staff membersFigure 21: Weekly timetabled classroom time for full-time staff members, 2009
In terms of professorial staff, the majority of respondents (21 of 35 respondents, 60%) reported that the weekly timetabled classroom time for full-time staff is between fi ve and eight hours. Nine respondents reported that it is between nine and 20 hours (26%). Three respondents (9%) reported that it is less than four hours.
As one would expect, the weekly timetabled classroom time tends to be higher for full-time non-professorial staff compared to professorial staff: half of respondents (20 of 40 respondents, 50%) reported that it is between fi ve and eight hours, whereas 19 respondents (48%) said it is between nine and 20 hours.
It should be noted that this question referred specifi cally to the ‘typical weekly timetabled classroom time’ and does not include time spent in preparation, individual consultation, marking and administration. Staff who do not teach at all were excluded from the responses.
4.4 Time spent supervising undergraduate dissertations and one-to-one student consultationsFigure 22: Time typically spent each week supervising undergraduate dissertations and one-to-one student consultations, 2009
Respondents reported that the time typically spent on supervision of undergraduate dissertations and student one-to-one consultations ranges between less than four hours and up to twelve hours for both professorial and non-professorial staff.
0
2
4
6
8
10
12
14
1 - 9 10 - 19 20 - 29 30 - 39 40 -49 50+
Number of staff
Num
ber
of
resp
ons
es
0
10
20
30
40
50
60
70
Less than 4hours
5-8 hours 9-12 hours 13-20 hours
Professorial staff Non-professorial staff
Per
cent
of
resp
ons
es
0
2
4
6
8
10
12
14
16
18
Full-timestaff,
permanentcontracts
Hourly paidstaff
(includinggraduateteaching
assistants)
Part-timestaff andfractional
staff
Full-timestaff,
temporarycontracts
Ave
rag
e nu
mb
er o
f st
aff
2003
2009
0
10
20
30
40
50
60
70
80
Less than 4 hours 5-8 hours 9-12 hours
Professorial staff Non-professorial staff
Per
cent
of
resp
ons
es

12
Survey of the English Curriculum and Teaching in UK Higher Education
Twenty-six of 35 respondents (74%) reported that it is less than four hours for professorial staff, six respondents (17%) said it is between fi ve and eight hours, and one respondent (3%) said it is between nine and twelve hours.
The pattern for non-professorial staff is similar to that of professorial staff.
4.5 Balance between lectures and group discussion classesFigure 23: Balance between lectures and group discussion classes, 2009 and 2003
Respondents were asked about the balance between lectures and group discussion classes. This balance differs for Literature, Language, and Creative Writing, although few respondents reported that lectures are the dominant form of teaching in either of the programmes.
In terms of Literature, 22 of 37 respondents (59%) said that the balance is about half-and-half, and twelve respondents (32%) said it mainly consists of group discussions. One respondent (3%) said lectures are the main form of teaching.
In terms of Creative Writing, 24 of 29 respondents (83%) reported that group discussions are the dominant form of teaching, and one respondent (3%) said the balance between lectures and group discussions is about half-and-half. No respondents reported that lectures are the main form. Four respondents (14%) did not respond.
The number of respondents for Language and Combinations was lower than for the other two programmes. Due to the small numbers of respondents the results with respect to these programmes are not shown in the chart. Of the 20 respondents who answered the question with respect to Combinations, eight respondents reported that the balance is about half-and-half, and seven respondents reported that it is mainly group discussions. No respondents said that lectures are the main form of teaching. Five respondents did not respond.
Of the 19 respondents who answered the question with respect to Language, eight reported that the balance is about half-and-half, and four respondents reported that it is mainly group discussions. One respondent said the balance is mainly lectures. Six respondents did not respond.
In the 2003 survey, respondents were asked about the balance between lectures and group discussion classes overall, rather than separately for each degree. While the results are therefore
not directly comparable, it can be noted that the pattern seen in 2003 was largely similar to that for Literature in 2009, with 64% of the 53 respondents reporting that the balance was about half-and-half and 34% reporting that it was mainly group discussions.
5. Teaching of undergraduates5.1 Forms of teaching for undergraduatesFigure 24: Regular or occasional forms of teaching for undergraduates, 2009
This question explored the extent to which forms of teaching other than the lecture are used (regularly, occasionally, or never). Thirty-two of 39 respondents (82%) reported that they regularly use one-to-one consultations or feedback and 30 of 40 respondents (75%) reported that they regularly use one-to-one dissertation tutorials. The equivalent fi gure for seminars/tutorials with 15 or fewer participants is 28 of 39 respondents (72%). If these forms of teaching are not used regularly, they tend to be used occasionally: seven respondents (18%) said one-to-one consultations or feedback are used occasionally, ten respondents (25%) said dissertation tutorials are used occasionally, and nine respondents (23%) said seminars/tutorials with 15 or fewer participants are used occasionally.
A slightly smaller proportion of respondents reported that they use seminars with 16 to 30 participants on a regular basis. Twenty-six of 40 respondents (65%) reporting they are used regularly and nine respondents (23%) reporting they are used occasionally.
Seminars with more than 30 participants are relatively uncommon, with ten respondents (28%) reporting they are used occasionally and only one respondent (3%) reporting they are used regularly.
Twenty-three of 39 respondents (59%) said practical sessions, e.g. writing or drama, are regularly used and a further 12 respondents (31%) said they are used occasionally.
Work related learning, such as ‘real world’ projects, and work placements are notably less common, with 21 of 36 respondents (58%) and 19 of 38 respondents (50%), respectively reporting that they are used regularly or occasionally (with the majority of these reporting they are used occasionally rather than regularly).
The response options in 2003 differed slightly compared to 2009. However, to the extent that the responses are comparable, the pattern in 2009 is similar to that seen in 2003.
0
10
20
30
40
50
60
70
80
90
Literature Creative Writing Overall 2003
About half-and-half
Mainly group discussions
Mainly lectures
Per
cent
of
resp
ons
es
0 20 40 60 80 100
Dissertation tutorial (one to one)
One-to-one consultations or feedback
Seminars/tutorials with 15 or fewer participants
Practical sessions (e.g. writing/drama)
Seminars with 16-30 participants
Work-related learning
Work placements
Seminars with more than 30 participants
Percent of responses
Regularly Occasionally

13
Survey of the English Curriculum and Teaching in UK Higher Education
5.2 Use of student timeFigure 25: Number of hours per week in term-time that students are expected to spend in formally scheduled teaching time at all Levels, 2009
Figure 26: Number of hours per week in term-time that students are expected to spend in individual study at all Levels, 2009
Figure 27: Number of hours per week in term-time that students are expected to spend in directed activities online and in group work outside teaching time at all Levels, 2009
5.2.1 Level 1For Level 1, 41 respondents answered the question with respect to time spent in formally scheduled teaching time and 39 respondents answered it with respect to time spent in individual study. Among the respondents, Level 1 students are on average expected to spend nine hours in formally scheduled teaching
time, 25 hours in individual study, two hours in directed teaching activities online, and another two hours in group work outside teaching time.
There is some variation however among respondents, in particular with respect to the time students are expected to spend in individual study. The number of hours given by respondents ranged between eight and 50 hours, although more than half of respondents gave an estimate of between 21 and 30 hours (21 responses, 54%). In terms of formally scheduled teaching time, responses ranged between two hours and sixteen hours, with 80% of respondents estimating it was between six and ten hours.
Fewer respondents gave an estimate of the number of hours students are expected to spend in terms of directed teaching activities online (23 respondents) and group work outside teaching time (17 respondents). Among respondents giving a non-zero estimate, 14 of 23 respondents said they expect students to spend between one and two hours in directed activities online and eleven of 17 respondents said students are expected to spend between one and two hours in group work outside teaching time. No respondent reported that students are expected to spend more than fi ve hours in either of these activities.
5.2.2 Level 2For Level 2, 40 respondents answered the question with respect to time spent in formally scheduled teaching time and 37 respondents answered it with respect to time spent in individual study. On average, students at Level 2 are expected to spend one more hour per week during term-time in individual study compared to Level 1 (26 hours vs. 25 hours) and a similar number of hours in formally scheduled teaching time (9 hours). The number of hours Level 2 students are expected to spend in directed teaching activities online and group work outside teaching time also tends to be slightly higher in Level 2 than in Level 1 (3 hours vs. 2h for both). The range of responses was similar to Level 1.
With respect to formally scheduled teaching time, 31 respondents (78%) reported that students are expected to spend between six and ten hours per week during term-time in this form of teaching.
The most common response with respect to individual study was that students are expected to spend between 21 and 30 hours per week during term-time (23 of 37 respondents, 62%). Only one respondent (3%) said they expect students to spend more than 40 hours in individual study.
5.2.3 Level 3+At Level 3+, 41 respondents answered the question with respect to formally scheduled teaching time and 38 respondents answered it with respect to time spent in individual study. Among the respondents, students in Level 3+ are on average expected to spend two more hours per week during term-time in individual study compared to Level 2 (28 hours vs. 26 hours) and one hour less in formally scheduled teaching time per week (8 hours vs. 9 hours). The majority of respondents reported that students are expected to spend between 21 and 30h hours (25 respondents, 66%). With respect to formally scheduled teaching time, the majority of respondents reporting that students are expected to spend between six and ten hours per week during term-time (33 of 41 respondents, 80%).
0
10
20
30
40
50
60
70
80
90
Level 1 Level 2 Level 3+
1 to 5h
6 to 10h
11 to 15h
>15h
Per
cent
of
resp
ons
es
0
10
20
30
40
50
60
70
Level 1 Level 2 Level 3+
1 to 10h
11 to 20h
21 to 30h
31 to 40h
>40h
Per
cent
of
resp
ons
es
0
2
4
6
8
10
12
14
16
Level 1 Level 2 Level3+
Level 1 Level 2 Level3+
Directed activities online In group work outsideteaching time
1 to 2h
3 to 4h
5h +
Num
ber
of
resp
ons
es

14
Survey of the English Curriculum and Teaching in UK Higher Education
The average number of hours, as well as the range, students are expected to spend in directed activities online and in group work outside teaching time is similar to that in Level 2 (on average 3 hours for both).
Compared to the 2003 survey, students were expected to spend one more hour per week in individual study in Level 1 and Level 2, and two more hours per week during individual study in Level 3+. There was no substantial difference with respect to formally scheduled teaching time. Scheduled activities online and group work outside teaching time were not included in the 2003 survey.
5.3 Restraints on students’ timeFigure 28: Factors reported to impact on students’ learning, 2009
Paid employment was the factor most commonly reported to have an impact on students’ learning, with 35 of 43 respondents (81%) reporting that it has quite a lot of impact and a further seven respondents (16%) reporting it has some impact. Caring responsibilities were reported to have less of an impact on students’ learning, with 12 respondents (28%) reporting that it has quite a lot of impact and 24 respondents (56%) reporting that it has some impact. Eight respondents (19%) reported that travel time has quite a lot of impact, and 24 respondents (57%) reported that it has some impact.
5.4 AttendanceFigure 29: Whether students are formally required to attend, 2009
About half of respondents (20 of 41 respondents, 49%) said that students are always formally required to attend lectures, and four respondents (10%) said students are sometimes required to attend
lectures. This pattern is different when looking at other classes such as seminars: a large majority of respondents said students are always formally required to attend (33 respondents, 80%).
5.5 PenaltiesFigure 30: Whether penalties are imposed for poor attendance, 2009
Twenty-fi ve of 43 respondents (58%) reported that no penalties are imposed for poor attendance.
Among respondents who reported that penalties are imposed, the most common types of penalties mentioned are loss of marks, e.g. 10% or 20% (six respondents), a fail grade (four respondents), or exclusion from the programme generally preceded by a series of warnings (fi ve respondents). A commonly mentioned threshold for a fail grade is attending less than 25% of seminars, but 50% of class time was also mentioned. Respondents reported that students are allowed to re-take exams if subjected to this type of penalty, in contrast to the penalty of exclusion.
5.6 Separation of Level 2 and Level 3+ studentsFigure 31: Whether Level 2 students are taught together with Level 3+ students, 2009
Few respondents reported that Level 2 and Level 3+ students are taught together. Twenty-eight of 42 respondents (67%) said Level 2 and Level 3+ students are never taught together, 11 respondents (26%) said they are rarely taught together, two respondents (5%) said they are taught together to some extent, and only one respondent (2%) said they are taught together extensively.
0
10
20
30
40
50
60
70
80
90
Paid employment
Caringresponsibilities
Travel times
Hardly at all
To someextent
Quitealot
Per
cent
of
resp
ons
es
0
10
20
30
40
50
60
70
80
90
100
Lectures Other classes
Yes,always
Yes,sometimes
No
Per
cent
of
resp
ons
es
0
5
10
15
20
25
30
Yes No
Num
ber
of
resp
ons
es
0
5
10
15
20
25
30
Yes,extensively
Yes, to someextent
Yes, butrarely
Never
Num
ber
of
resp
ons
es

15
Survey of the English Curriculum and Teaching in UK Higher Education
6. Assessment6.1 Formal examinationsFigure 32: Percent of assessment comprising formal examination in English Literature, 2009
Figure 33: Percent of assessment comprising formal examination in English Language, 2009
Figure 34: Percent of assessment comprising formal examination in Creative Writing, 2009
Respondents were asked what percentage of assessment formal examinations comprise for students taking a typical mix of modules in English Literature, English Language, and Creative Writing. As one would expect, examinations tend to be a more commonly used form of assessment for English Literature and English Language than for Creative Writing. Examinations also tend to be more commonly used in Level 1 and Level 2 than in Level 3+.
Thirty-seven respondents answered the question with respect to English Literature. More than 80% of respondents reported that examinations comprise 50% or less of assessment at all levels, and no respondents said that examinations comprise 80% or more of assessment at any level. About as many respondents said that examinations comprise 20% or less as there were respondents who said that examinations comprise between 21% and 40% in both Level 1 and Level 2 (Level 1: 0%-20%, 13 respondents; 21%-40%, 14 respondents. Level 2: 0%-20%, 13 respondents; 21%-40%, 12 respondents). In contrast, with respect to Level 3+, over half of respondents said that examinations comprise 20% or less of assessment (20 respondents, 56%). Seven respondents (19%) said examinations comprise between 21% and 40% of assessment.
Only twelve respondents answered the question with respect to English Language. In Level 1, responses ranged between 0% and 71%-80%. Eleven respondents reported that examinations comprise 50% or less of assessment. In Level 2, responses ranged between 1%-10% and 91%-100% and ten respondents said examinations comprise 50% or less of assessment. In Level 3+, the range of responses was the same as that for Level 2. Nine respondents said examinations comprise 50% or less of assessment in Level 3+.
Examinations were a markedly less common form of assessment in Creative Writing compared to English Literature and English Language. Of the 28 respondents, the majority reported that examinations comprise 0% of assessment at all levels (23 respondents (82%) for both Level 1 and Level 2, and 26 respondents (93%) for Level 3+). No respondents said that examinations comprise more than 40% in Level 1 and Level 2, and no respondents said it comprise more than 20% in Level 3+.
In the 2003 survey, respondents were asked what percentage examinations comprised of assessment overall, rather than for each type of degree. To the extent that the responses are comparable, the pattern for Literature in 2009 appears to be largely similar to that seen in 2003.
6.2 Final examinationsFigure 35: Whether fi nal degree classifi cations are largely dependent on fi nal examinations, 2009 and 2003
Thirty-fi ve of 43 respondents (81%) reported that their departments do not have fi nal examinations on which the fi nal classifi cation of students’ degrees largely depends.
0
5
10
15
20
25
30
35
40
45
50
Level 1 Level 2 Level 3+
0%
1%-20%
21%-40%
41%-60%
61%-80%
Per
cent
of
resp
ons
es
0
2
4
6
8
10
12
Level 1 Level 2 Level 3+
0%
1%-20%
21%-40%
41%-60%
61%-80%
81%-100%
Num
ber
of
resp
ons
es
0
5
10
15
20
25
30
Level 1 Level 2 Level 3+
0%
1%-20%
21%-40%
41%-60%
61%-80%
81%-100%
Num
ber
of
resp
ons
es
0
10
20
30
40
50
60
70
80
90
Yes No
Per
cent
of
resp
ond
ents
2003
2009

16
Survey of the English Curriculum and Teaching in UK Higher Education
Compared to 2003, the proportion of departments that use fi nal examinations for fi nal classifi cation of students appears to have decreased slightly in 2009: in 2003 the proportion that use fi nal examinations for fi nal classifi cation was 25% (13 of 53 respondents) compared to 19% in 2009.
6.3 DissertationFigure 36: Status of dissertations for undergraduates, 2009
Figure 37: Status of dissertations for Single Honours students, 2009 and 2003
Respondents were asked what the status of dissertations is for undergraduates in their department. Forty respondents answered the question with respect to Single Honours, 42 respondents answered the question with respect to Joint/Combined Honours, and 26 respondents answered the question with respect to non-honours students. Among respondents who answered the question with respect to Single Honours students, about two-thirds of respondents reported that dissertations are compulsory (27 respondents, 68%). In contrast, the majority of respondents reported that they are optional for Joint/Combined honours students (23 respondents, 55%). Ten respondents (38%) reported that dissertations are not available for non-honours students, while the remaining respondents said dissertations are optional.
In the 2003 survey, respondents were asked this question with respect to Single Honours students, and ‘other’ students. Comparing the responses relating to Single Honours students, a slightly larger proportion in 2009 (68%) reported that dissertations are compulsory in 2009 compared to 2003 (52%), with an equivalent decrease in the proportion reporting that dissertations are optional.
6.4 Forms of assessmentFigure 38: Forms of assessment across all levels, 2009
Respondents were asked how frequently (‘often’, ‘sometimes’, or ‘never’) they use a range of different assessment forms. Between 37 and 43 respondents gave an answer with respect to each assessment form. Almost all respondents said they use coursework essays and dissertations often or sometimes (42 respondents (100%) and 41 respondents (97%) respectively), with the majority of these respondents reporting they use these forms ‘often’. Coursework is the form of assessment most commonly used on a frequent basis (40 respondents (95%) reported they used this form ‘often’), while the equivalent fi gure is 31 respondents (74%) for dissertations. Individual projects and unseen exams are the next most commonly used forms of assessment, with 39 and 37 respondents saying they use these assessment forms often or sometimes (91% and 93% respectively). The least common forms of assessment are multiple choice test and vivas, with seven (19%) and six (16%) respondents respectively reporting they use these forms ‘sometimes’ and one respondent (3%) reporting they use them ‘often’.
While this question was formulated slightly differently in the 2003 survey, the pattern appeared to be similar.
0
10
20
30
40
50
60
70
80
Compulsory Optional Not available
Single Honours
Joint/combined honours
Non-honours students
Per
cent
of
resp
ons
es
0
10
20
30
40
50
60
70
80
Compulsory Optional Not available
Per
cent
of
resp
ons
es
2003
2009
0 20 40 60 80 100
Dissertation
Coursework essays
Unseen exams
Individual projects
Individual presentations
Portfolio
Group presentations
Group projects
Student logs(including online)
Previously seen exams
Contributions in seminars
Short answer tests
Open-book exams
Contributions to online discussions
Peer assessment
Multiple choice tests
Vivas
Often Sometimes
Percent of responses

17
Survey of the English Curriculum and Teaching in UK Higher Education
6.5 Penalties imposed for late submissionsFigure 39: Penalties imposed for late submission of assessed coursework, 2009
Of the 43 respondents who answered the question whether penalties are imposed for late submission of assessed coursework, 42 respondents (98%) said they impose some form of penalty. The majority of respondents reported that penalties are determined by the institution (27 respondents, 63%), while about a third reported they are determined by the department. Most respondents (36 respondents, 84%) reported that penalties are imposed strictly.
6.6 Detection of plagiarismFigure 40: Use of plagiarism detection software, 2009
Respondents were asked how often they use plagiarism detection software, such as ‘Turnitin’. Almost a third of respondents said they either use it for all or nearly all assessed coursework (13 of 43 respondents, 30%), while a similar proportion said they use it hardly at all or never (13 respondents, 30%). Ten respondents (23%) said they use it for some coursework and three respondents (7%) said they use it for most coursework.
Further, three respondents commented that they tend to use software such as ‘Google’ rather than specifi c plagiarism detection software. Of these, one respondent said they tend to use plagiarism detection software for postgraduate research-based submissions and ‘Google’ for taught undergraduate courses. Four respondents said their departments are about to introduce ‘Turnitin’ or extend its use to additional levels.
Two respondents said plagiarism detection software is only used in cases “where misconduct is suspected”. One respondent said students themselves are encouraged to use plagiarism detection software.
6.7 FeedbackFigure 41: Pressure to give feedback on examinations and more feedback on coursework, 2009
Respondents were asked to what extent they were under pressure to give feedback on examinations and to give more feedback on coursework. The majority of respondents reported that they are under either a little or a lot of pressure to give feedback on examinations (25 of 40 respondents, 63%) or give more feedback on coursework (32 of 43 respondents, 74%), with a larger proportion reporting they were under a little pressure than a lot. Eight respondents (20%) said they already give feedback on examinations.
Figure 42: Principal forms of feedback, 2009 (multiple response)
Respondents were asked about the principal forms of feedback used in their department. Forty-three respondents answered the question. Multiple responses were allowed, meaning that the percent of respondents add up to more than 100%. The most widely used forms of feedback are comments written on the coursework itself and printed pro-forma completed by hand (both 38 respondents, 88%). The next most common form of feedback is individual handback/essay return (33 respondents, 77%) and comments delivered to a group of students (24 respondents, 56%). Eighteen respondents (42%) reported they deliver verbal or written comments electronically.
0 5 10 15 20 25
Determined by the department and imposed flexibly
We have no penalties for late submission of assessed coursework
Determined by the institution and imposed flexibly
Determined by the department and imposed strictly
Determined by the institution and imposed strictly
Number of responses
0
2
4
6
8
10
12
14
For all or nearlyall coursework
For mostcoursework
For somecoursework
Hardly at all ornever
Num
ber
of
resp
ons
es
0
10
20
30
40
50
60
Examinations Course work
Yes, a lot Yes, a little NoWe already give feedback on exams
Per
cent
of
resp
ons
es
0 5 10 15 20 25 30 35 40
Verbal or written comments deliveredelectronically
Comments delivered to a group of students
Individual handback/essay return
Printed pro-forma completed by hand
Comments written on the coursework itself
Number of responses

18
Survey of the English Curriculum and Teaching in UK Higher Education
A small number of respondents gave additional comments in response to the question. For example, two respondents said their departments are encouraging or in the process of introducing electronic feedback to a greater extent, e.g. in the form of emailed feedback documents. One respondent reported that their department used peer feedback, and another respondent commented that students can request individual one-to-one feedback on any assessed work.
6.8 Barriers to changeFigure 43: Barriers to introducing new methods of assessment, 2009 (multiple response)
Respondents were asked whether they had encountered any barriers to introducing new methods of assessment. Thirty-nine respondents answered the question. Multiple answers were allowed, meaning that the percentages add up to more than 100%.
Among respondents whose departments have introduced new methods of assessment, the most common response was that no barriers have been encountered (15 respondents, 38%). In terms of the barriers encountered, 12 respondents (31%) reported that limitations on staff time is a barrier, ten respondents (26%) said there is resistance among staff, nine (23%) said their university regulations are a barrier, eight respondents (21%) said IT limitations are a barrier and further eight respondents (21%) said there is resistance among students. Two respondents (5%) reported that they have not attempted to introduce any new methods of assessment.
6.9 Multiple examinersFigure 44: Marking of examination papers by multiple examiners, 2009 and 2003
Figure 45: Marking of assessed coursework by multiple examiners, 2009 and 2003
Respondents were asked whether assessed coursework and examination papers are marked by multiple examiners. Between 40 and 41 respondents answered the questions with respect to each level. At all levels, the most common response for both assessed coursework and examination papers was that multiple examiners selectively mark coursework or exams. The proportion of respondents who said that examination papers are always marked by more than one examiner (ranging between 10% and 38%) tends to be higher than assessed coursework (ranging between 3% and 17%) at each level. Further, the proportion of respondents who said assessed coursework or examination papers are always marked by multiple examiners tends to increase between Level 1 and Level 3+.
Compared to the 2003 survey, there has been a decrease in the proportion of respondents who report that assessed coursework and examination papers are always marked by multiple examiners,
0 2 4 6 8 10 12 14 16
No new methods introduced
Student resistance
IT limitations
University regulations
Staff resistance
Limitations on staff time
No barriers encountered
Number of responses
0
10
20
30
40
50
60
70
Level 1 Level 2 Level 3+ Level 1 Level 2 Level 3+
2003 2009
No Not applicable
Yes, to all papers Yes, selectively (moderation)
Per
cent
of
resp
ons
es
0
10
20
30
40
50
60
70
80
90
100
Level 1 Level 2 Level 3+ Level 1 Level 2 Level 3+
2003 2009
NoYes, to all papers Yes, selectively (moderation)
Per
cent
of
resp
ons
es

19
Survey of the English Curriculum and Teaching in UK Higher Education
while there has been an equivalent increase in the proportion of respondents who say examination papers are selectively marked by more than one examiner. This has been particularly apparent for Level 3+: in the 2003 survey, 63% of 53 respondents said all examination papers are marked by multiple examiners compared to 38% in 2009. For assessed coursework, the equivalent fi gure was 49% in 2003, whereas it was 17% in 2009.
6.10 Anonymous submissionFigure 46: Anonymous submission of examinations, 2003 and 2009
Figure 47: Anonymous submission of examinations and assessed coursework, 2003 and 2009
Respondents were asked about anonymous submission of examinations and assessed coursework. Between 38 and 41 respondents answered the questions with repect to each level. The majority of respondents reported that all assessed coursework and examined work are submitted anonymously. The proportion of respondents reporting that examined work is always submitted anonymously was higher than for assessed coursework across the three levels (ranging between 87% and 97% for examined work compared to between 49% and 56% for assessed coursework).
A small number of respondents made additional comments, for example:
“Coursework can be submitted anonymously but most students don’t bother. In any case we tend to see the work in tutorials.”
“Anonymity is not strictly enforced in CW as most work already seen in draft by tutors.”
Compared to the 2003 survey, there has been an increase in the proportion of respondents who said that examined work and assessed coursework are always submitted anonymously. The increase has been particularly notable for assessed coursework.
For assessed coursework in 2003, the proportion reporting that work is always submitted anonymously ranged between 23% and 34% across the three levels (based on 53 respondents) compared to between 49% and 56% in 2009. For examinations, the equivalent fi gure ranged between 77% and 81% in 2003 (based on 53 respondents), while it ranged between 87% and 97% in 2009.
7. Coverage7.1 Compulsory elementsFigure 48: Percentage of Single Honours programme that is compulsory at Level 1, 2009
Figure 49: Percentage of Single Honours programme that is compulsory at Level 2, 2009
0
10
20
30
40
50
60
70
80
90
100
Level 1 Level 2 Level 3+ Level 1 Level 2 Level 3+2003 2009
NoYes, to all papers Yes, selectively
Per
cent
of
resp
ons
es
0
10
20
30
40
50
60
70
80
Level 1 Level 2 Level 3+ Level 1 Level 2 Level 3+
2003 2009
NoYes, to all papers Yes, selectively
Per
cent
of
resp
ons
es
0
10
20
30
40
50
60
Literature Creative Writing Combinations
0%-20%
21%-40%
41%-60%
61%-80%
81%-100%
Don't know/NA
Per
cent
of
resp
ons
es
0
10
20
30
40
50
60
Literature Creative Writing Combinations
0%-20%
21%-40%
41%-60%
61%-80%
81%-100%
Don't know/NA
Per
cent
of
resp
ons
es

20
Survey of the English Curriculum and Teaching in UK Higher Education
Figure 50: Percentage of Single Honours programme that is compulsory at Level 3+, 2009
As expected, the proportion of Single Honours programme that is compulsory is higher at Level 1 compared to Level 2 and Level 3+. Further, Single Honours Literature and Creative Writing programmes tend to have a larger proportion of compulsory elements compared to Single Honours Combinations.
At Level 1, the most common response for Literature and Creative Writing was that 81%-100% of the programme is compulsory, with 16 of 38 respondents (42%) giving this answer with respect to Literature and 12 of 28 respondents (43%) giving this answer with respect to Creative Writing. No respondents reported that 0%-20% of Single Honours programme is compulsory for Literature. For Combinations, a similar proportion of respondents said that 41%-60% and 81%-100% of the programme is compulsory (7 of 25 respondents, 28%). Fewer than 10% of respondents said that 0%-20% of Literature, Creative Writing and Combinations is compulsory at Level 1. A smaller number of respondents gave an estimate with respect to Language, meaning that the results should be treated with caution. Seven of 19 respondents did not know what proportion of Level 1 Language programmes is compulsory and four respondents said 21%-40% is compulsory, which was the most commonly reported estimate.
At Level 2, a substantially smaller proportion of respondents said that 81%-100% of Literature, Creative Writing and Combination programmes is compulsory (ranging between 8% and 13%) compared to Level 1. Instead, the most common response was that 0%-20% of these programmes is compulsory, with about a quarter to a third of respondents giving this answer: twelve of 38 respondents (32%) gave this answer with respect to Literature, seven of 28 respondents (25%) did so with respect to Creative Writing, and seven of 24 respondents (29%) did so with respect to Combinations. Again for Language, seven of 19 respondents did not know the answer, fi ve respondents said that 21%-40% of the programme is compulsory and four respondents said that 0%-20% is compulsory.
At Level 3+, a larger proportion of respondents said that 0%-20% of Single Honours programmes is compulsory compared to Level 2. Seventeen of 38 respondents (45%) gave this answer with respect to Literature, and the equivalent fi gures were eight of 29 respondents (28%) with respect to Creative Writing and ten of 24 respondents (37%) with respect to Combinations. For Language, six of 19 respondents did not know the answer and seven respondents said 0%-20% of the programme is compulsory.
The question was formulated slightly differently in the 2003 survey. The responses are therefore not directly comparable. It appears however that the pattern is similar in 2009 to the extent that a third or more of the 53 respondents in 2003 reported that all elements were compulsory at Level 1 for Single and Combined/Joint Honours and about 10% of respondents reported that all modules were compulsory at Level 2 for both types of degree.
7.2 Modules Offered in English LiteratureThe sections below relate to modules offered and whether they are compulsory or optional. Some respondents reported that modules were both compulsory and optional, meaning that the total number of responses is greater than the number of respondents. In order not to double count respondents with respect to the overall pattern of modules offered, the number of respondents, rather than the total number of responses, is reported in the text, followed by the number of responses with respect to compulsory and optional modules. The chart shows the number of responses, rather than the number of respondents.
7.2.1 Modules offered
Figure 51: Compulsory or optional modules for English Literature, 2009
The number in brackets refers to the number of respondents who reported that the module is a recent addition.
Respondents were asked to indicate whether they offered compulsory or optional modules in specifi c areas, and to indicate if the module was a recent addition. There was an option to add modules not covered by the areas specifi ed. As mentioned above, the distinction between number of respondents and number of responses is made.
In terms of respondents indicating that modules are offered on either a compulsory or optional basis, the most commonly offered modules overall for Literature are Modernist Literature (35 respondents), followed by Victorian and Romantic (both 34 respondents) and Renaissance Literature (33 respondents). Thirty-one respondents said they offer Late Twentieth Century and/or Mid Twentieth Century Literature. The least commonly offered module is Old English Literature (ten respondents). (These fi gures are not shown in the chart.)
0
10
20
30
40
50
60
Literature Creative Writing Combinations
0%-20%
21%-40%
41%-60%
61%-80%
81%-100%
Don't know/NA
Per
cent
of
resp
ons
es
0 5 10 15 20 25 30 35 40 45 50
Renaissance
Romantic
Victorian
Modernist
Late-Twentieth Century and Contemporary
Mid-Twentieth Century
Seventeenth Century
Surveys spanning a wide chronology of periods
Eighteenth Century
Other Nineteenth Century
Medieval
Edwardian
Old English
(2)
(1)
(1)
(1)
(1)
(1)
(1)
(2)
(1)
Compulsory module(s) Optional module(s)
Number of responses

21
Survey of the English Curriculum and Teaching in UK Higher Education
With respect to the number of responses indicating whether modules are offered on a compulsory or optional basis, the most commonly reported compulsory module is ‘Surveys spanning a wide chronology of periods’ (20 responses) followed by Victorian, Modernist and Romantic Literature (18, 17, and 16 responses respectively). Old English Literature is least likely to be offered as compulsory module (two responses).
7.2.2 Single author modules offered
Figure 52: Compulsory or optional single author modules, 2009
The number in brackets refers to the number of respondents who reported that the module is a recent addition.
For reasons mentioned in 7.2 above, the number of respondents, rather than the total number of responses, is reported in order to show the overall pattern of modules offered. The number of responses, rather than the number of respondents, is shown in the chart.
In terms of single author modules, Shakespeare is the most commonly offered module on either a compulsory or optional basis (31 respondents), followed by Chaucer (15 respondents) and Dickens (ten respondents). The majority of respondents reported that these modules were offered on an optional rather than compulsory basis.
Respondents mentioned a number of other single author modules that are offered:
(The number in brackets indicates the number of respondents that mentioned the module)
• Hardy (4)
• Joyce (2)
• Woolf (2)
• Becket (2)
• ‘Austen and the Brontes’ (2)
Additionally, each of the following authors were mentioned by one respondent: Yeats, Toni Morrison, Seamus Heaney, Marvell, Middleton, William Morris, Byron, Hazlitt, Henry James, DH Lawrence, Philip Larkin, Blake, Foucault, Austen, Milton, Plath, Margaret Atwood, and Ian McEwan.
7.2.3 Region/ethnicity based modules
Figure 53: Compulsory or optional region/ethnicity based modules, 2009
The number in brackets refers to the number of respondents who reported that the module is a recent addition.
Again, for reasons mentioned in 7.2 above, the number of respondents, rather than the total number of responses, is reported in order to show the overall pattern of modules offered. The number of responses, rather than the number of respondents, is shown in the chart.
The most commonly offered regional/ethnicity based modules (on either a compulsory or optional basis) are Colonial/Post-Colonial Literature (32 respondents), followed by Twentieth Century (30 respondents), Pre-Twentieth Century American and Contemporary American Literature (both 24 respondents). Few respondents reported that one or more of these modules are compulsory.
Additionally, respondents commented that the following modules are also offered:
• Comparative literature
• Ulster-Scots writing
• Contemporary Irish
• Old Icelandic
• Icelandic and Irish, Scottish, Welsh options (“borrowable from another department”)
• Turkish
“We offer modules that combine study of region and ethnicity e.g. Level One Literary History modules include study of Black British, Scottish and Irish fi ction in their address of ‘periods’; Level Two modules in Women’s Writing and Postcolonialism include study of Southern Asian, Canadian, C19 and contemporary American, African and Black American writings.”
0 5 10 15 20 25 30 35 40
Shakespeare
Chaucer
Dickens
Other author (1)
Compulsory module(s) Optional module(s)
Number of responses
0 5 10 15 20 25 30 35
Colonial/Post-Colonial
Twentieth Century American
Contemporary American
Pre-Twentieth Century American
Irish
African
Black American
Caribbean
South Asian
Black British
Canadian
Australasian
Scottish
Welsh
Icelandic
Other
(3)
(2)
(1)
(1)
(2)
(1)
(1)
(1)
(1)
Compulsory module(s) Optional module(s)
Number of responses
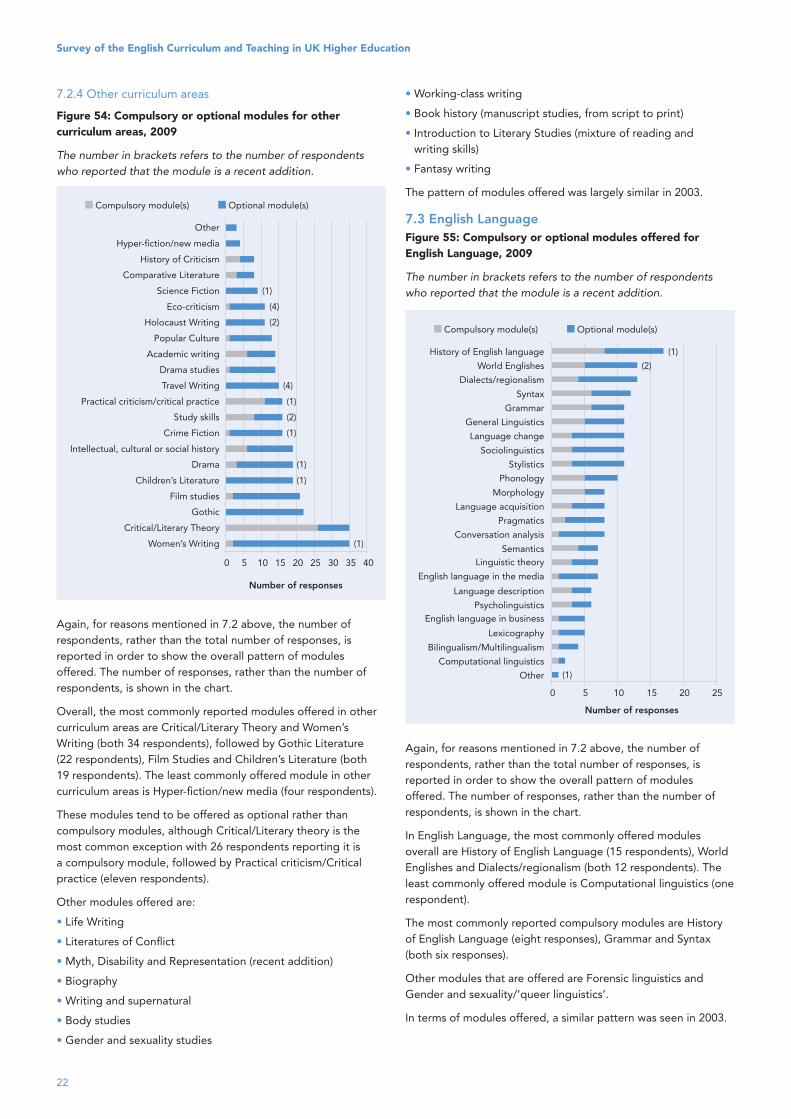
22
Survey of the English Curriculum and Teaching in UK Higher Education
7.2.4 Other curriculum areas
Figure 54: Compulsory or optional modules for other curriculum areas, 2009
The number in brackets refers to the number of respondents who reported that the module is a recent addition.
Again, for reasons mentioned in 7.2 above, the number of respondents, rather than the total number of responses, is reported in order to show the overall pattern of modules offered. The number of responses, rather than the number of respondents, is shown in the chart.
Overall, the most commonly reported modules offered in other curriculum areas are Critical/Literary Theory and Women’s Writing (both 34 respondents), followed by Gothic Literature (22 respondents), Film Studies and Children’s Literature (both 19 respondents). The least commonly offered module in other curriculum areas is Hyper-fi ction/new media (four respondents).
These modules tend to be offered as optional rather than compulsory modules, although Critical/Literary theory is the most common exception with 26 respondents reporting it is a compulsory module, followed by Practical criticism/Critical practice (eleven respondents).
Other modules offered are:
• Life Writing
• Literatures of Confl ict
• Myth, Disability and Representation (recent addition)
• Biography
• Writing and supernatural
• Body studies
• Gender and sexuality studies
• Working-class writing
• Book history (manuscript studies, from script to print)
• Introduction to Literary Studies (mixture of reading and writing skills)
• Fantasy writing
The pattern of modules offered was largely similar in 2003.
7.3 English Language Figure 55: Compulsory or optional modules offered for English Language, 2009
The number in brackets refers to the number of respondents who reported that the module is a recent addition.
Again, for reasons mentioned in 7.2 above, the number of respondents, rather than the total number of responses, is reported in order to show the overall pattern of modules offered. The number of responses, rather than the number of respondents, is shown in the chart.
In English Language, the most commonly offered modules overall are History of English Language (15 respondents), World Englishes and Dialects/regionalism (both 12 respondents). The least commonly offered module is Computational linguistics (one respondent).
The most commonly reported compulsory modules are History of English Language (eight responses), Grammar and Syntax (both six responses).
Other modules that are offered are Forensic linguistics and Gender and sexuality/’queer linguistics’.
In terms of modules offered, a similar pattern was seen in 2003.
0 5 10 15 20 25 30 35 40
Women’s Writing
Critical/Literary Theory
Gothic
Film studies
Children’s Literature
Drama
Intellectual, cultural or social history
Crime Fiction
Study skills
Practical criticism/critical practice
Travel Writing
Drama studies
Academic writing
Popular Culture
Holocaust Writing
Eco-criticism
Science Fiction
Comparative Literature
History of Criticism
Hyper-fiction/new media
Other
(1)
(1)
(1)
(1)
(2)
(1)
(4)
(2)
(4)
(1)
Compulsory module(s) Optional module(s)
Number of responses
0 5 10 15 20 25
Other
Computational linguistics
Bilingualism/Multilingualism
Lexicography
English language in businessPsycholinguistics
Language description
English language in the media
Linguistic theorySemantics
Conversation analysis
Pragmatics
Language acquisition
Morphology
Phonology
Stylistics
Sociolinguistics
Language change
General Linguistics
Grammar
Syntax
Dialects/regionalism
World Englishes
History of English language
(2)
(1)
(1)
Compulsory module(s) Optional module(s)
Number of responses
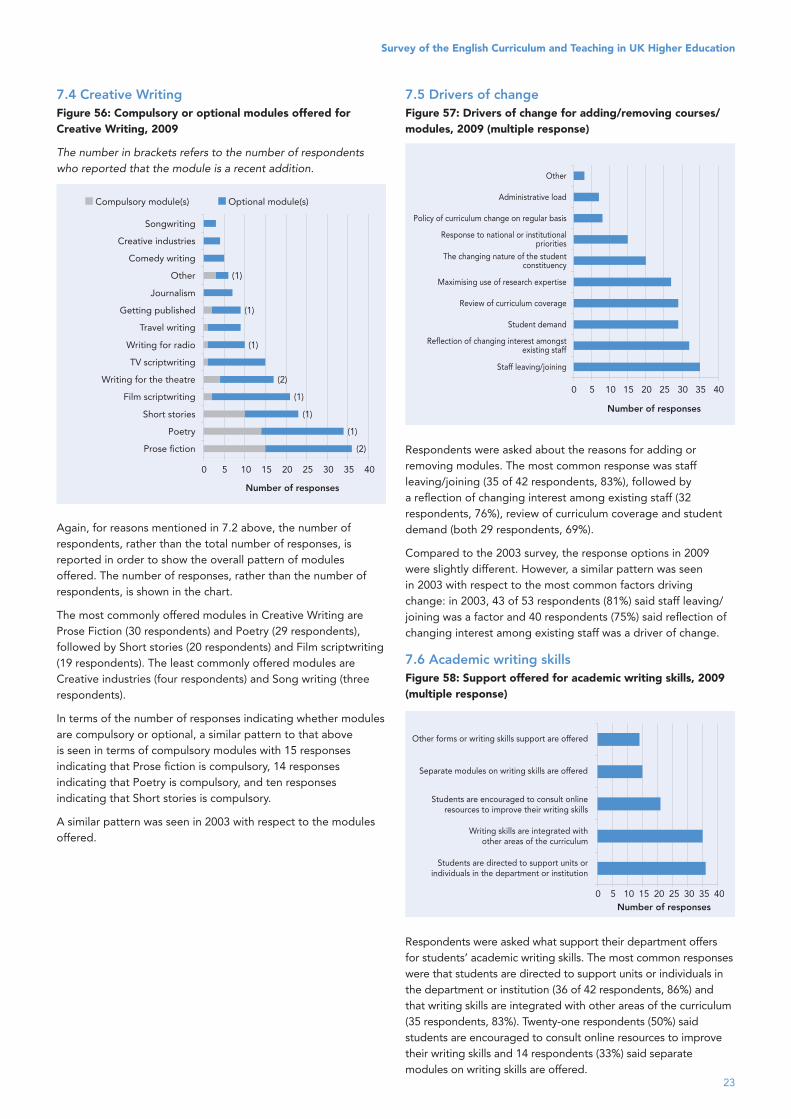
23
Survey of the English Curriculum and Teaching in UK Higher Education
7.4 Creative WritingFigure 56: Compulsory or optional modules offered for Creative Writing, 2009
The number in brackets refers to the number of respondents who reported that the module is a recent addition.
Again, for reasons mentioned in 7.2 above, the number of respondents, rather than the total number of responses, is reported in order to show the overall pattern of modules offered. The number of responses, rather than the number of respondents, is shown in the chart.
The most commonly offered modules in Creative Writing are Prose Fiction (30 respondents) and Poetry (29 respondents), followed by Short stories (20 respondents) and Film scriptwriting (19 respondents). The least commonly offered modules are Creative industries (four respondents) and Song writing (three respondents).
In terms of the number of responses indicating whether modules are compulsory or optional, a similar pattern to that above is seen in terms of compulsory modules with 15 responses indicating that Prose fi ction is compulsory, 14 responses indicating that Poetry is compulsory, and ten responses indicating that Short stories is compulsory.
A similar pattern was seen in 2003 with respect to the modules offered.
7.5 Drivers of changeFigure 57: Drivers of change for adding/removing courses/modules, 2009 (multiple response)
Respondents were asked about the reasons for adding or removing modules. The most common response was staff leaving/joining (35 of 42 respondents, 83%), followed by a refl ection of changing interest among existing staff (32 respondents, 76%), review of curriculum coverage and student demand (both 29 respondents, 69%).
Compared to the 2003 survey, the response options in 2009 were slightly different. However, a similar pattern was seen in 2003 with respect to the most common factors driving change: in 2003, 43 of 53 respondents (81%) said staff leaving/joining was a factor and 40 respondents (75%) said refl ection of changing interest among existing staff was a driver of change.
7.6 Academic writing skillsFigure 58: Support offered for academic writing skills, 2009(multiple response)
Respondents were asked what support their department offers for students’ academic writing skills. The most common responses were that students are directed to support units or individuals in the department or institution (36 of 42 respondents, 86%) and that writing skills are integrated with other areas of the curriculum (35 respondents, 83%). Twenty-one respondents (50%) said students are encouraged to consult online resources to improve their writing skills and 14 respondents (33%) said separate modules on writing skills are offered.
0 5 10 15 20 25 30 35 40
Prose fiction
Poetry
Short stories
Film scriptwriting
Writing for the theatre
TV scriptwriting
Writing for radio
Travel writing
Getting published
Journalism
Other
Comedy writing
Creative industries
Songwriting
(2)
(1)
(1)
(1)
(2)
(1)
(1)
(1)
Compulsory module(s) Optional module(s)
Number of responses
0 5 10 15 20 25 30 35 40
Staff leaving/joining
Reflection of changing interest amongstexisting staff
Student demand
Review of curriculum coverage
Maximising use of research expertise
The changing nature of the studentconstituency
Response to national or institutionalpriorities
Policy of curriculum change on regular basis
Administrative load
Other
Number of responses
0 5 10 15 20 25 30 35 40
Students are directed to support units orindividuals in the department or institution
Writing skills are integrated withother areas of the curriculum
Students are encouraged to consult onlineresources to improve their writing skills
Separate modules on writing skills are offered
Other forms or writing skills support are offered
Number of responses
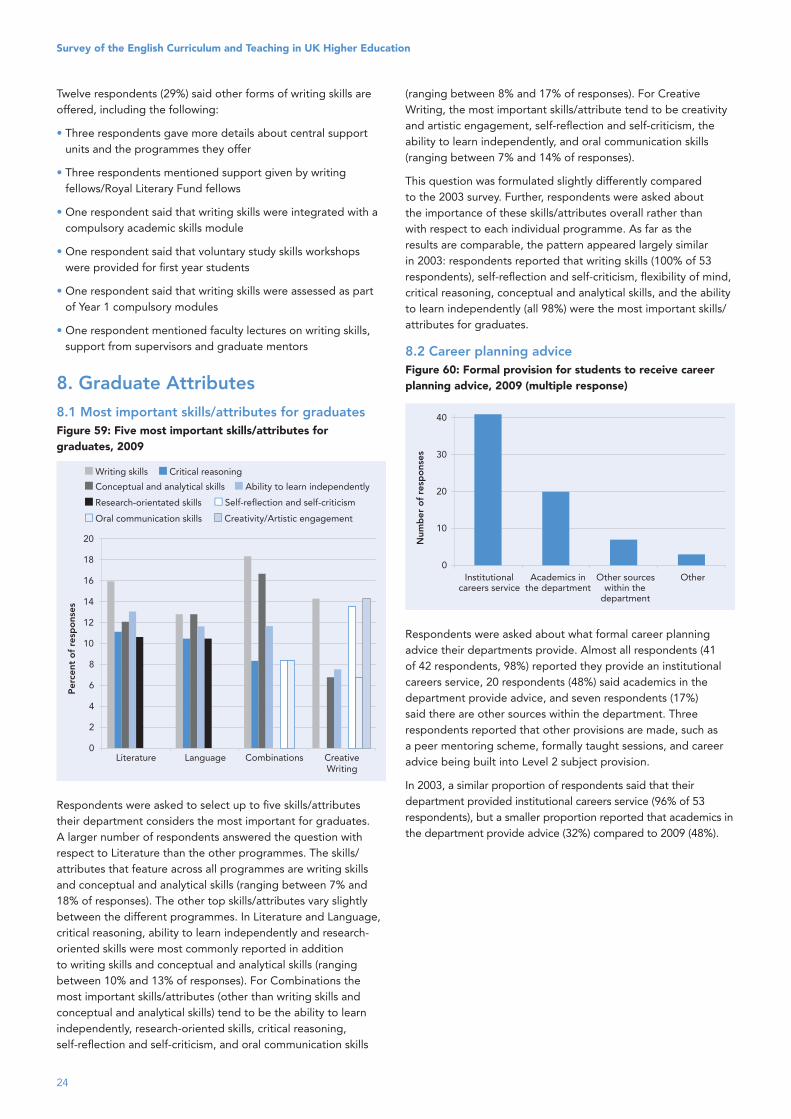
24
Survey of the English Curriculum and Teaching in UK Higher Education
Twelve respondents (29%) said other forms of writing skills are offered, including the following:
• Three respondents gave more details about central support units and the programmes they offer
• Three respondents mentioned support given by writing fellows/Royal Literary Fund fellows
• One respondent said that writing skills were integrated with a compulsory academic skills module
• One respondent said that voluntary study skills workshops were provided for fi rst year students
• One respondent said that writing skills were assessed as part of Year 1 compulsory modules
• One respondent mentioned faculty lectures on writing skills, support from supervisors and graduate mentors
8. Graduate Attributes8.1 Most important skills/attributes for graduatesFigure 59: Five most important skills/attributes for graduates, 2009
Respondents were asked to select up to fi ve skills/attributes their department considers the most important for graduates. A larger number of respondents answered the question with respect to Literature than the other programmes. The skills/attributes that feature across all programmes are writing skills and conceptual and analytical skills (ranging between 7% and 18% of responses). The other top skills/attributes vary slightly between the different programmes. In Literature and Language, critical reasoning, ability to learn independently and research-oriented skills were most commonly reported in addition to writing skills and conceptual and analytical skills (ranging between 10% and 13% of responses). For Combinations the most important skills/attributes (other than writing skills and conceptual and analytical skills) tend to be the ability to learn independently, research-oriented skills, critical reasoning, self-refl ection and self-criticism, and oral communication skills
(ranging between 8% and 17% of responses). For Creative Writing, the most important skills/attribute tend to be creativity and artistic engagement, self-refl ection and self-criticism, the ability to learn independently, and oral communication skills (ranging between 7% and 14% of responses).
This question was formulated slightly differently compared to the 2003 survey. Further, respondents were asked about the importance of these skills/attributes overall rather than with respect to each individual programme. As far as the results are comparable, the pattern appeared largely similar in 2003: respondents reported that writing skills (100% of 53 respondents), self-refl ection and self-criticism, fl exibility of mind, critical reasoning, conceptual and analytical skills, and the ability to learn independently (all 98%) were the most important skills/attributes for graduates.
8.2 Career planning adviceFigure 60: Formal provision for students to receive career planning advice, 2009 (multiple response)
Respondents were asked about what formal career planning advice their departments provide. Almost all respondents (41 of 42 respondents, 98%) reported they provide an institutional careers service, 20 respondents (48%) said academics in the department provide advice, and seven respondents (17%) said there are other sources within the department. Three respondents reported that other provisions are made, such as a peer mentoring scheme, formally taught sessions, and career advice being built into Level 2 subject provision.
In 2003, a similar proportion of respondents said that their department provided institutional careers service (96% of 53 respondents), but a smaller proportion reported that academics in the department provide advice (32%) compared to 2009 (48%).
0
2
4
6
8
10
12
14
16
18
20
Literature Language Combinations CreativeWriting
Writing skills Critical reasoning
Conceptual and analytical skills Ability to learn independently
Research-orientated skills Self-reflection and self-criticism
Oral communication skills Creativity/Artistic engagement
Per
cent
of
resp
ons
es
0
10
20
30
40
Institutionalcareers service
Academics inthe department
Other sourceswithin the
department
Other
Num
ber
of
resp
ons
es
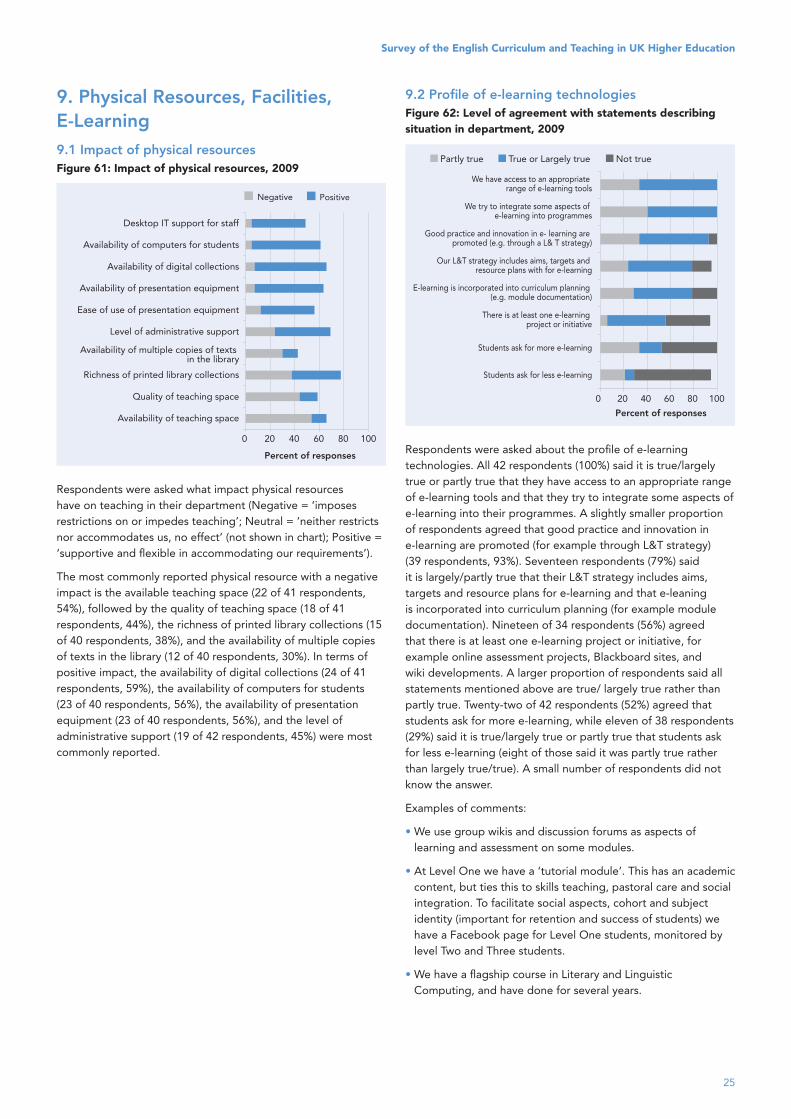
25
Survey of the English Curriculum and Teaching in UK Higher Education
9. Physical Resources, Facilities, E-Learning9.1 Impact of physical resourcesFigure 61: Impact of physical resources, 2009
Respondents were asked what impact physical resources have on teaching in their department (Negative = ‘imposes restrictions on or impedes teaching’; Neutral = ‘neither restricts nor accommodates us, no effect’ (not shown in chart); Positive = ‘supportive and fl exible in accommodating our requirements’).
The most commonly reported physical resource with a negative impact is the available teaching space (22 of 41 respondents, 54%), followed by the quality of teaching space (18 of 41 respondents, 44%), the richness of printed library collections (15 of 40 respondents, 38%), and the availability of multiple copies of texts in the library (12 of 40 respondents, 30%). In terms of positive impact, the availability of digital collections (24 of 41 respondents, 59%), the availability of computers for students (23 of 40 respondents, 56%), the availability of presentation equipment (23 of 40 respondents, 56%), and the level of administrative support (19 of 42 respondents, 45%) were most commonly reported.
9.2 Profi le of e-learning technologiesFigure 62: Level of agreement with statements describing situation in department, 2009
Respondents were asked about the profi le of e-learning technologies. All 42 respondents (100%) said it is true/largely true or partly true that they have access to an appropriate range of e-learning tools and that they try to integrate some aspects of e-learning into their programmes. A slightly smaller proportion of respondents agreed that good practice and innovation in e-learning are promoted (for example through L&T strategy) (39 respondents, 93%). Seventeen respondents (79%) said it is largely/partly true that their L&T strategy includes aims, targets and resource plans for e-learning and that e-leaning is incorporated into curriculum planning (for example module documentation). Nineteen of 34 respondents (56%) agreed that there is at least one e-learning project or initiative, for example online assessment projects, Blackboard sites, and wiki developments. A larger proportion of respondents said all statements mentioned above are true/ largely true rather than partly true. Twenty-two of 42 respondents (52%) agreed that students ask for more e-learning, while eleven of 38 respondents (29%) said it is true/largely true or partly true that students ask for less e-learning (eight of those said it was partly true rather than largely true/true). A small number of respondents did not know the answer.
Examples of comments:
• We use group wikis and discussion forums as aspects of learning and assessment on some modules.
• At Level One we have a ‘tutorial module’. This has an academic content, but ties this to skills teaching, pastoral care and social integration. To facilitate social aspects, cohort and subject identity (important for retention and success of students) we have a Facebook page for Level One students, monitored by level Two and Three students.
• We have a fl agship course in Literary and Linguistic Computing, and have done for several years.
0 20 40 60 80 100
Availability of teaching space
Quality of teaching space
Richness of printed library collections
Availability of multiple copies of texts in the library
Level of administrative support
Ease of use of presentation equipment
Availability of presentation equipment
Availability of digital collections
Availability of computers for students
Desktop IT support for staff
Negative Positive
Percent of responses
0 20 40 60 80 100
Students ask for less e-learning
Students ask for more e-learning
There is at least one e-learning project or initiative
E-learning is incorporated into curriculum planning (e.g. module documentation)
Our L&T strategy includes aims, targets and resource plans with for e-learning
Good practice and innovation in e- learning are promoted (e.g. through a L& T strategy)
We try to integrate some aspects of e-learning into programmes
We have access to an appropriate range of e-learning tools
Percent of responses
Partly true True or Largely true Not true
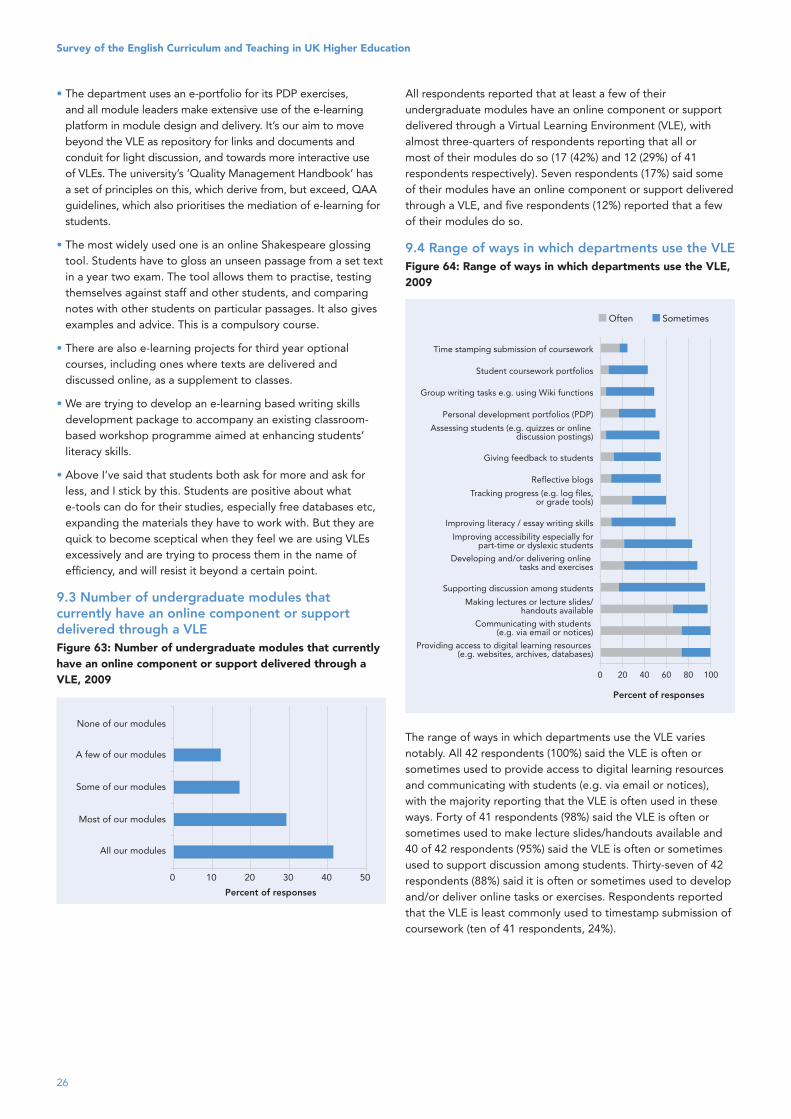
26
Survey of the English Curriculum and Teaching in UK Higher Education
• The department uses an e-portfolio for its PDP exercises, and all module leaders make extensive use of the e-learning platform in module design and delivery. It’s our aim to move beyond the VLE as repository for links and documents and conduit for light discussion, and towards more interactive use of VLEs. The university’s ‘Quality Management Handbook’ has a set of principles on this, which derive from, but exceed, QAA guidelines, which also prioritises the mediation of e-learning for students.
• The most widely used one is an online Shakespeare glossing tool. Students have to gloss an unseen passage from a set text in a year two exam. The tool allows them to practise, testing themselves against staff and other students, and comparing notes with other students on particular passages. It also gives examples and advice. This is a compulsory course.
• There are also e-learning projects for third year optional courses, including ones where texts are delivered and discussed online, as a supplement to classes.
• We are trying to develop an e-learning based writing skills development package to accompany an existing classroom-based workshop programme aimed at enhancing students’ literacy skills.
• Above I’ve said that students both ask for more and ask for less, and I stick by this. Students are positive about what e-tools can do for their studies, especially free databases etc, expanding the materials they have to work with. But they are quick to become sceptical when they feel we are using VLEs excessively and are trying to process them in the name of effi ciency, and will resist it beyond a certain point.
9.3 Number of undergraduate modules that currently have an online component or support delivered through a VLEFigure 63: Number of undergraduate modules that currently have an online component or support delivered through a VLE, 2009
All respondents reported that at least a few of their undergraduate modules have an online component or support delivered through a Virtual Learning Environment (VLE), with almost three-quarters of respondents reporting that all or most of their modules do so (17 (42%) and 12 (29%) of 41 respondents respectively). Seven respondents (17%) said some of their modules have an online component or support delivered through a VLE, and fi ve respondents (12%) reported that a few of their modules do so.
9.4 Range of ways in which departments use the VLEFigure 64: Range of ways in which departments use the VLE, 2009
The range of ways in which departments use the VLE varies notably. All 42 respondents (100%) said the VLE is often or sometimes used to provide access to digital learning resources and communicating with students (e.g. via email or notices), with the majority reporting that the VLE is often used in these ways. Forty of 41 respondents (98%) said the VLE is often or sometimes used to make lecture slides/handouts available and 40 of 42 respondents (95%) said the VLE is often or sometimes used to support discussion among students. Thirty-seven of 42 respondents (88%) said it is often or sometimes used to develop and/or deliver online tasks or exercises. Respondents reported that the VLE is least commonly used to timestamp submission of coursework (ten of 41 respondents, 24%).
Percent of responses
0 10 20 30 40 50
All our modules
Most of our modules
Some of our modules
A few of our modules
None of our modules
0 20 40 60 80 100
Providing access to digital learning resources (e.g. websites, archives, databases)
Communicating with students (e.g. via email or notices)
Making lectures or lecture slides/handouts available
Supporting discussion among students
Developing and/or delivering online tasks and exercises
Improving accessibility especially forpart-time or dyslexic students
Improving literacy / essay writing skills
Tracking progress (e.g. log files,or grade tools)
Reflective blogs
Giving feedback to students
Assessing students (e.g. quizzes or online discussion postings)
Personal development portfolios (PDP)
Group writing tasks e.g. using Wiki functions
Student coursework portfolios
Time stamping submission of coursework
Often Sometimes
Percent of responses

27
Survey of the English Curriculum and Teaching in UK Higher Education
9.5 Support provided for the development of e-learning technologiesFigure 65: Support provided for the development of e-learning technologies, 2009 (multiple response)
All 41 respondents (100%) reported there is support for e-learning at their departments. The most commonly reported way in which department provide support is staff engagement in development opportunities for e-learning provided centrally (33 respondents, 81%), followed by staff being supported by centrally based learning technologists (30 respondents, 73%). Twenty respondents (49%) said funding for the development of e-learning is available centrally and 19 respondents (46%) said staff are supported by departmental/faculty based learning technologists. Seventeen respondents (42%) reported that staff attend external events, conferences etc. with an e-learning theme, that staff engage in development opportunities for e-learning provided by the department, and that there are lecturers who act as mentors or advisers for e-learning.
9.6 Impact of e-learningFigure 66: Impact of e-learning, 2009
Respondents were asked what impact e-learning has on specifi c areas (‘signifi cant impact’, ‘modest impact’, ‘no impact’). All 42 respondents (100%) reported that e-learning has either a signifi cant or modest impact on access to resources, and almost all respondents reported that it has a signifi cant or modest impact on the support for the overall student experience (41 of 42 respondents 98%), communication with students (40 of 42 respondents, 95%), and support for individual student learning (39 of 42 respondents, 93%).
10. General Questions10.1 Factors that have had an impact on teaching in the last three yearsFigure 67: Factors that have had an impact on teaching in the last three years, 2009
Respondents were asked what factors have had an impact on teaching in the last three years. The most commonly reported factors were increased administration of teaching and students facing more external pressure (both 38 of 40 respondents, 95%), followed by demands on teaching being in confl ict with research (37 of 40 respondents, 93%), programme restructuring or rationalising and the academic background of students (both 35 of 40 respondents, 88%). With the exception of programme restructuring or rationalisation, these were also the factors that were most commonly reported to have had a signifi cant, rather than modest, impact.
10.2 Most signifi cant changes that are expected in the futureIn an open question, respondents were asked to state the most signifi cant changes they expected in the future. Responses have been grouped under broad headings.
RE-ORGANISATION
• English department is absorbing American studies, thus altering the staff profi le and impacting on all areas of work and may impact on PIs.
• Increased collaboration with other departments (eg theatre studies) to widen provision for students.
0 5 10 15 20 25 30 35
Staff engage in development opportunitiesfor e-learning provided centrally
There is no support for thedevelopment of e-learning
Staff attend external events, conferences etc with an e-learning theme
Staff engage in development opportunities for e-learning provided by the department
There are lecturers who act as mentors or advisers for e-learning
Staff are supported by departmental/faculty based learning technologists
Funding for the development of e-learning is available centrally
Staff are supported by centrally based learning technologists
Number of responses
0 20 40 60 80 100
Access to resources
Support for the overall studentexperience
Communication with students
Support for individual studentlearning
Support for curriculum enhancement
Student motivation
Widening access
Class cohesion
Assessment
Significant impact Modest impact
Percent of responses
0 10 20 30 40 50 60
Students facing more external pressures
Increased administration of teaching
Demands of teaching in conflict with research
The academic background of students
Programme restructuring or rationalising
Adopting new teaching methods (e.g. VLEs)
Motivation of students
Quality monitoring procedures
Increased teaching loads
Investment (or lack of) in teaching facilities
Organisational restructuring
Staff turnover
Decline or increase in student numbers
Lack of administrative support
Significant impact Some impact
Percent of responses

28
Survey of the English Curriculum and Teaching in UK Higher Education
• Merger.
• Rationalisation.
• We are likely to become part of a large College of Humanities. We are currently at the consultation stage of this process. We are redesigning our fi rst year, which will include aspects of skills training. As of next year, we will be delivering within a differently-shaped academic year.
• We fear another university re-structuring.
• Possible restructuring to whole institution.
• Moving from semesterised modular scheme to year-long scheme.
CURRICULUM CHANGE
• Continuing development of new approaches and courses, in response to external validating bodies.
• A revised undergraduate curriculum in Literature.
• Modularisation is possible.
• We are intending to review our undergraduate programme next year, having engaged in substantial postgraduate development in 2008-09 with four new taught postgraduate programmes now on stream. I thus expect to see a rise in the number of contact hours for staff in my area, and a resulting squeeze on research time.
• More inter-disciplinary modules taught across different Schools.
POSTGRADUATE PROVISION
• Expansion of taught postgraduate provision.
• The introduction of an MA in English.
• Hopefully an increase in taught MA provision and an expansion in numbers of research degree students.
• Diffi culties with recruitment for MA programmes.
E-LEARNING
• Greater use of VLE.
• More emphasis on e-learning.
• Move to more non-trad delivery.
• Increased use of Blackboard etc.
• Extension and enhancement of VLE provision.
• Increased use of e-learning.
STUDENT NUMBERS/PROFILE
• An expansion in student numbers as the campus grows, and possible expansion in staff numbers using QR income (but this is tempered by the fi nancial constraints of the current recession).
• Positively: more stable student numbers and increase in average UCAS tariff.
• At the time of writing, the capping of student numbers may have an impact. Despite a signifi cant growth in recruitment, we are unable to grow in the current climate.
• Decreasing student numbers and the effect of local competition may well result in closure.
• Improvements in undergraduate recruitment to stabilize numbers at the levels of three to fi ve years ago.
• We are worried about the demographic downturn. Maintaining good levels of recruitment and retention while also trying to prioritise the REF will be tough for everyone.
• More stable numbers of Creative Writing students (after a substantial increase in the popularity of the subject).
• More linguistics students.
• More students from outside Northern Ireland (both from GB and Republic of Ireland).
• Students demanding more for their money.
• Increased need to accommodate students with poor entry qualifi cations, and wishing to follow non-traditional patterns of study for reasons to do with part-time employment, commuting, etc.
RESEARCH
• Increased research pressure.
• Increased emphasis on research productivity and the introduction of a sabbatical system of study leave.
• More collaborative, externally funded research projects.
• Reduction in funding for research (the RAE resulted in 100% more funding, but we’re unlikely to see much of it).
TEACHING/ASSESSMENT
• Increase in face-to-face student contact.
• Anonymised coursework marking.
• Pressure both from management and from the student body to move away from formal examinations.
• Introduction of 40-credit core modules at all levels.
EMPLOYABILITY
• More emphasis on skills training and entrepreneurship.
• The main issue will be balancing the traditional demands of the subject with newer initiatives e.g. student careers provision, the demands to be more `business facing’.
• Much more emphasis on social engagement, employability, collaboration with creative industries and other external organizations.
• Increased emphasis upon employability in arts.
• University pressure to include employability modules in the undergraduate curriculum.
STAFFING
• New, young staff are very impressive indeed and are bringing new energy to all areas of the department’s work.
• I’m anxious that reduced government funding will mean a reduction in staffi ng levels as staff are not replaced.
• Possibly more teaching hours per member of staff.
• Increased workloads.
• There is a danger that we shall lose posts.
• Cuts in funding for part time hourly paid staff.
• Cuts in admin support.
• No teaching only permanent appointments.
• Reduced reliance on hourly-paid Teaching Assistants.
• Rationalisation of staff provision.
• Increasing fi nancial constraints and restraints on the appointment of new staff.
• Increased workloads in consequence of reduced availability of funding for postgraduate and part-time teaching.
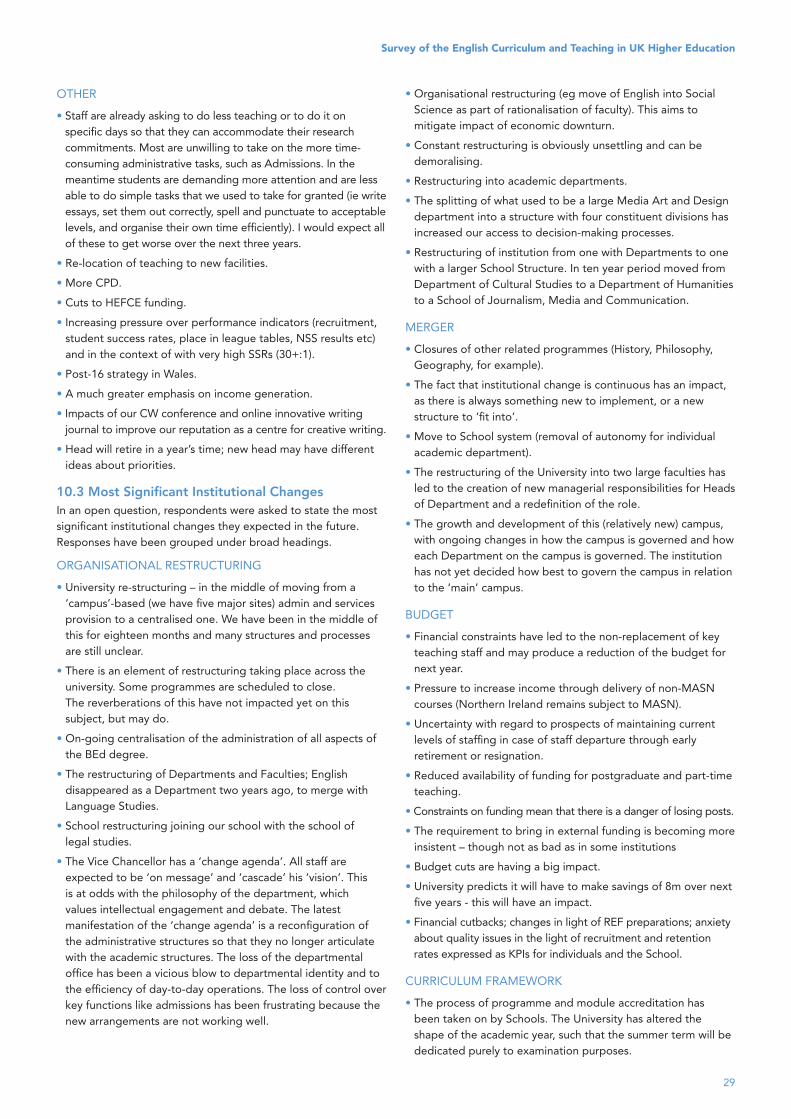
29
Survey of the English Curriculum and Teaching in UK Higher Education
OTHER
• Staff are already asking to do less teaching or to do it on specifi c days so that they can accommodate their research commitments. Most are unwilling to take on the more time-consuming administrative tasks, such as Admissions. In the meantime students are demanding more attention and are less able to do simple tasks that we used to take for granted (ie write essays, set them out correctly, spell and punctuate to acceptable levels, and organise their own time effi ciently). I would expect all of these to get worse over the next three years.
• Re-location of teaching to new facilities.
• More CPD.
• Cuts to HEFCE funding.
• Increasing pressure over performance indicators (recruitment, student success rates, place in league tables, NSS results etc) and in the context of with very high SSRs (30+:1).
• Post-16 strategy in Wales.
• A much greater emphasis on income generation.
• Impacts of our CW conference and online innovative writing journal to improve our reputation as a centre for creative writing.
• Head will retire in a year’s time; new head may have different ideas about priorities.
10.3 Most Signifi cant Institutional ChangesIn an open question, respondents were asked to state the most signifi cant institutional changes they expected in the future. Responses have been grouped under broad headings.
ORGANISATIONAL RESTRUCTURING
• University re-structuring – in the middle of moving from a ‘campus’-based (we have fi ve major sites) admin and services provision to a centralised one. We have been in the middle of this for eighteen months and many structures and processes are still unclear.
• There is an element of restructuring taking place across the university. Some programmes are scheduled to close. The reverberations of this have not impacted yet on this subject, but may do.
• On-going centralisation of the administration of all aspects of the BEd degree.
• The restructuring of Departments and Faculties; English disappeared as a Department two years ago, to merge with Language Studies.
• School restructuring joining our school with the school of legal studies.
• The Vice Chancellor has a ‘change agenda’. All staff are expected to be ‘on message’ and ‘cascade’ his ‘vision’. This is at odds with the philosophy of the department, which values intellectual engagement and debate. The latest manifestation of the ‘change agenda’ is a reconfi guration of the administrative structures so that they no longer articulate with the academic structures. The loss of the departmental offi ce has been a vicious blow to departmental identity and to the effi ciency of day-to-day operations. The loss of control over key functions like admissions has been frustrating because the new arrangements are not working well.
• Organisational restructuring (eg move of English into Social Science as part of rationalisation of faculty). This aims to mitigate impact of economic downturn.
• Constant restructuring is obviously unsettling and can be demoralising.
• Restructuring into academic departments.
• The splitting of what used to be a large Media Art and Design department into a structure with four constituent divisions has increased our access to decision-making processes.
• Restructuring of institution from one with Departments to one with a larger School Structure. In ten year period moved from Department of Cultural Studies to a Department of Humanities to a School of Journalism, Media and Communication.
MERGER
• Closures of other related programmes (History, Philosophy, Geography, for example).
• The fact that institutional change is continuous has an impact, as there is always something new to implement, or a new structure to ‘fi t into’.
• Move to School system (removal of autonomy for individual academic department).
• The restructuring of the University into two large faculties has led to the creation of new managerial responsibilities for Heads of Department and a redefi nition of the role.
• The growth and development of this (relatively new) campus, with ongoing changes in how the campus is governed and how each Department on the campus is governed. The institution has not yet decided how best to govern the campus in relation to the ‘main’ campus.
BUDGET
• Financial constraints have led to the non-replacement of key teaching staff and may produce a reduction of the budget for next year.
• Pressure to increase income through delivery of non-MASN courses (Northern Ireland remains subject to MASN).
• Uncertainty with regard to prospects of maintaining current levels of staffi ng in case of staff departure through early retirement or resignation.
• Reduced availability of funding for postgraduate and part-time teaching.
• Constraints on funding mean that there is a danger of losing posts.
• The requirement to bring in external funding is becoming more insistent – though not as bad as in some institutions
• Budget cuts are having a big impact.
• University predicts it will have to make savings of 8m over next fi ve years - this will have an impact.
• Financial cutbacks; changes in light of REF preparations; anxiety about quality issues in the light of recruitment and retention rates expressed as KPIs for individuals and the School.
CURRICULUM FRAMEWORK
• The process of programme and module accreditation has been taken on by Schools. The University has altered the shape of the academic year, such that the summer term will be dedicated purely to examination purposes.

30
Survey of the English Curriculum and Teaching in UK Higher Education
• Changing from a 15 credit to a 20 credit framework.
• The fact that our degrees are no longer accredited by the University of X (following granting of taught degree awarding powers).
• The university is moving to a new ‘Undergraduate Framework’ to bring it more into line with other HEIs nationally, especially. for credit transfer etc. Most of the new principles and practices are things we are committed to anyway. But the biggest impact on this dept will be the change to a standard 20-credit module (from a preponderance of 15s and 30s): staff (especially in Literature) perceive this as a negative, since on balance it will drive down the number of modules, reducing variety and choice. We have to plan for this change and make sure we get it on our terms.
OTHER
• I suspect that there will be a further push towards more vocational subjects.
• Likely national issues, such as employability of graduates, might have an impact. In general, national agendas (change of government?) seem the most potentially destabilising areas of impact.
• Preparations at College level for REF (even though the form and date are still uncertain).
• The department has been very successful over the last few years according to all the university’s PIs but it will be diffi cult to sustain this success.
10.4 Single Change that Would Most Enhance Learning and TeachingIn an open question, respondents were asked to state the single change that would most enhance learning and teaching. Responses have been grouped under broad headings.
STAFF
• More favourable staff/student ratio and increased student spend (dream on).
• More staff.
• More staff so we could have smaller seminar groups
• One or two additional FTE lecturers
• Reduced class sizes
• Improved SSR
• Lower SSR
• More staff and fewer students
• More human resource
• Increased staffi ng resource
• A signifi cant growth in academic staff numbers
• Smaller seminar groups (currently 25-28 is the norm)
SPACE
• Dedicated teaching rooms for the department’s use
• Improved teaching spaces
• Provision of more teaching space that is appropriate for workshop and seminar classes.
• Better accommodation
STUDENTS
• Better qualifi ed, more highly motivated, and better-off students: this would allow us not only to enhance the standards of teaching in terms of contents, level of engagement, etc., but also to cope more successfully with the socioeconomic factors affecting the organisation of teaching in the subject. These factors, which include student employment, commuting, etc., result in major diffi culties with timetabling, poor class attendance, non-academic reasons for module selection, purely utilitarian approach to study and assessment, etc.
• Finding ways of ensuring that students are better prepared for classes, above all in terms of their preparatory reading.
• Greater motivation across student body.
• Students entering the HEI system with signifi cantly better reading and writing, and signifi cantly greater engagement with books.
• The schools need to take responsibility for sending 18-year-olds to University properly prepared ie. able to read long texts in a short time, able to write essays, write grammatically, and manage their own time. This would make an enormous difference to what we could focus on in the fi rst year, and save us from moving ever nearer to a remedial level of teaching. I don’t think the majority of schools are serving universities at all well at the moment.
ADMINISTRATION
• More administrative support - after restructuring the Staff and Student Administrative offi ces are no longer in the same building.
• Fewer administrative requirements without previous opportunity-costing.
• Reduction in quality assurance pressures
RESEARCH
• All of the appraisals which I have conducted return the same answer: the freeing of more time for research. This would enhance teaching and learning either directly, through the research resulting [sic], or indirectly, by virtue of the improved morale which tutors would enjoy – and bring, no doubt, to their preparation of sessions.
• The ability to teach one’s own research and get students involved in research - this is already beginning to happen.
OTHER
• Introduction of plagiarism detection software
• We believe that both teaching and learning continue to develop in a consistently positive way.
• Support and incentive to rethink delivery of provision.
• A bigger library with more cash to spend
• An extended and more meaningful Induction period, in which students receive guidance from Academic Support tutors on key skills e.g. what to expect from a seminar; basic note-taking.


The English Subject Centre
Royal Holloway, University of London
Egham TW20 0EX
T 01784 443221 • [email protected]
www.english.heacademy.ac.uk
The English Subject Centre supports all
aspects of the teaching and learning of
English Literature, English Language
and Creative Writing in higher education
in the UK. It is a Subject Centre of
the Higher Education Academy.
As one of its activities, the Subject Centre
gathers and disseminates information to
the subject community. This report series
publishes the outcomes of substantial
projects undertaken or commissioned by
the Subject Centre.
For a full list of our reports, see
www.english.heacademy.ac.uk/explore/
publications/reports.php.