Survey of Salaries - American Payroll Association · 2011-09-14 · 2011 Survey of Salaries and the...
192
Survey of Salaries & the Payroll Profession 2011 www.americanpayroll.org Results report sponsored by
Transcript of Survey of Salaries - American Payroll Association · 2011-09-14 · 2011 Survey of Salaries and the...

Survey of Salaries & the Payroll Profession
2011
www.americanpayroll.org
Results report sponsored by

2011 Survey of Salaries and the Payroll Profession 2
Table of Contents
Executive Summary ....................................................................................................................... 4
I. Introduction ................................................................................................................................. 8
Study Methodology ............................................................................................................. 9
Interpretation of Tables & Charts in this Report ............................................................... 10
Sampling Variability & Statistical Significance ............................................................... 12
II. Payroll Staff Salaries .............................................................................................................. 13
Average Current Salaries (2011 vs. 2009) ....................................................................... 14
Average Starting Salaries (2011 vs. 2009) ........................................................................ 15
Average Starting Salaries for CPP (2011 vs. 2009) .......................................................... 16
Summary of 2011 Current & Starting Salaries ................................................................. 17
III. Organization Characteristics .............................................................................................. 18
Annual Gross Revenue ...................................................................................................... 19
Type of Organization ........................................................................................................ 20
Number of Full-time Employees ....................................................................................... 22
Number of Part-time Employees ....................................................................................... 23
Merger, Acquisition, or Divestiture in Last 2 Years ......................................................... 24
Location of Payroll Jobs .................................................................................................... 25
IV. Payroll Staff ............................................................................................................................. 26
Payroll Functions Provided at Multiple Sites .................................................................... 27
Number Employed Full-time in Payroll Department ........................................................ 28
Education & Certifications ................................................................................................ 29
Hours of Professional Development ................................................................................. 30
Training Budget ................................................................................................................ 31
V. Payroll Processing ................................................................................................................. 32
Department to Which Payroll Function Reports ............................................................... 33
Methods Used to Input Payroll Data ................................................................................. 34
Payroll Frequency ............................................................................................................. 35
Delivery Method for Payroll ............................................................................................. 36
Delivery Method for Paystubs........................................................................................... 37
Regular Paydays, Paychecks, and Off-cycle Payments .................................................... 38
Payroll Operating Budget .................................................................................................. 39
Number of W-2s Issued for Past Year .............................................................................. 40

2011 Survey of Salaries and the Payroll Profession 3
Number of U.S. States in Which Pay Unemployment Tax ............................................... 41
Involvement with Countries Outside the U.S. ................................................................... 42
Reporting Time Manually vs. Automated Method ........................................................... 44
VI. Payroll Department Functions ........................................................................................... 45
Functions Performed by Payroll Staff ............................................................................... 46
Other Types of Payments Through Payroll (aside from Wage & Salary) ......................... 47
Collect Fee for Replacement W-2s ................................................................................... 48
Payroll Deductions Required ............................................................................................ 49
Number of Garnishments .................................................................................................. 50
HRIS Integration ............................................................................................................... 51
Employee Benefits Recordkeeping by Payroll Staff ......................................................... 52
Products / Services Recommended by Payroll .................................................................. 53
Payroll Processing In-House vs. Service Provider ............................................................ 54
VII. In-House Payroll Processing Systems ........................................................................... 55
Intention to Outsource Payroll Processing ........................................................................ 56
In-House Payroll Processing Software .............................................................................. 57
VIII. Outsourced Payroll Processing ...................................................................................... 58
Intention to Bring Payroll Processing In-House ............................................................... 59
Year Began Using Service Provider.................................................................................. 60
IX. Cross-tabulations by Number of W-2s Issued for 2010 .............................................. 61
X. Cross-tabulations by Region ............................................................................................. 121
XI. Appendix ................................................................................................................................ 183
2011 Questionnaire ......................................................................................................... 184
Payroll Position Descriptors ............................................................................................ 190

2011 Survey of Salaries and the Payroll Profession 4
Executive Summary
� Some of the study highlights are summarized here to provide a synopsis, but there is much more information covered later in this report, including detailed comparisons between 2011 and 2009.
SALARIES
� In Section II of this report, the average current salary, average starting salary, and average starting salary for CPP in both 2011 and 2009 are shown for a number of different payroll job classifications. Here, a brief summary observation is that the average salary in 2011 was slightly higher than the average salary in 2009 for the majority of the job classifications covered in the survey.
─ On the one hand, one might expect salaries to be higher in 2011 than in 2009, as there has been some inflation over the past two years, and employees typically look for pay raises to at least keep pace with inflation. On the other hand, there has been extraordinary economic uncertainty during the past few years, and the unemployment rate has remained at relatively high levels. In this context, seeing 2011 average salaries come in slightly higher than 2009 average salaries is encouraging.
─ As a specific example, the average salary for a Payroll Practitioner II (Intermediate) was
$40,825 in 2011 vs. $39,531 in 2009, and this implies that the 2011 average salary was 3.3% higher than in 2009.
─ As another specific example, the average salary for a Payroll Manager/Director was $83,583 in 2011 vs. $77,849 in 2009, and this implies that the 2011 average was 7.4% higher than in 2009.
ORGANIZATION CHARACTERISTICS
� Approximately one-third (33.2%) of the 2011 survey respondents reported that their organization has annual gross revenue of less than $50 million. Slightly more than one-third (34.8%) work at an organization with between $50 million and $500 million in annual gross revenue.
─ Many different industries were represented in the survey, with the largest general
categories being services (23.6%), manufacturing (15.1%), education (9.9%), government (9.6%), and finance (8.6%).
─ Nearly half (48.4%) of the 2011 survey respondents reported that their organization has 500 or more full-time employees.
� More than half (57.7%) reported issuing 500 or more W-2s for calendar year 2010. (Note that the proportion reporting 500 or more W-2s is expected to be higher than the proportion reporting 500 or more full-time employees, as W-2s are also issued for part-time employees, and W-2s are issued for employees who have left the organization at some time during the year, as well as those still employed.)

2011 Survey of Salaries and the Payroll Profession 5
� More than one-fourth (27.5%) reported that their organization has been involved in a merger, acquisition, or divestiture in the last two years.
─ Among those experiencing such a change, 71.4% reported that the payroll department is
now paying more employees as a result.
─ For 13.0% of those experiencing such a change, the payroll staff has increased, while 11.7% reported a reduction in payroll staff, and 45.5% reported no change in the payroll staff, as a result of their organization being involved in a merger, acquisition, or divestiture in the last two years.
PAYROLL STAFF
� Slightly more than one-fifth (20.9%) reported that their payroll department provides payroll functions at more than one job site.
� Slightly more than half (52.0%) reported that at least two people are employed full-time in their payroll department. One-in-six (16.7%) reported having six or more full-time employees in their payroll department.
� Slightly more than half (52.5%) have at least one employee in their payroll department who is a Certified Payroll Professional (CPP). Nearly one-in-ten (9.4%) have at least one employee in their payroll department who has a Fundamental Payroll Certification (FPC).
� More than half (59.7%) reported at least some hours of professional development on payroll-related issues being offered each year to senior-level staff. Among organizations offering professional development hours, the median was 24 hours for senior-level staff.
� Slightly more than four-in-ten (43.3%) reported at least some hours of professional development on payroll-related issues being offered each year to intermediate-level staff. Among organizations offering professional development hours, the median was 16 hours for intermediate-level staff.
� Slightly more than one-fourth (26.0%) reported at least some hours of professional development on payroll-related issues being offered each year to entry-level staff. Among organizations offering professional development hours, the median was 16 hours for entry-level staff.
� More than half (59.2%) reported that their organization allocates some money for training and education of payroll staff. Among these organizations, the median amount budgeted was $2,000 in the current fiscal year for training and education of payroll staff.
� More than one-fourth (29.3%) reported a total payroll operating budget for 2011 of $500,000 or more. (This includes only payroll staff salaries, benefits, and other direct costs related to payroll processing.) Slightly more than one-fourth (26.7%) reported a total payroll operating budget between $150,000 and $499,999, while 44.0% reported a total payroll operating budget under $150,000.

2011 Survey of Salaries and the Payroll Profession 6
PAYROLL PROCESSING / PAYROLL FUNCTIONS
� More than half (61.9%) indicated that payroll is a unit within an accounting or finance department, while nearly one-fourth (23.8%) indicated that payroll is a unit within a human resources or personnel department.
� Several different methods are in common use for inputting payroll data, such as batch input by payroll (52.0%), system input by payroll (36.5%), file transfers by payroll (36.1%), file transfers from systems (32.8%), web-based input by payroll (27.0%), web-based input by employees (25.0%), and web-based input by managers (17.2%).
─ Although not as commonly used as several other methods, web-based input by payroll
was reported noticeably more often in 2011 (27.0%) than in 2009 (19.3%).
� More than half (55.4%) reported that their largest payroll is biweekly, although sizable proportions reported that their largest payroll is semimonthly (22.8%) or weekly (15.1%).
� On average, 13.3% of payroll is delivered by paper paycheck, while 85.0% is delivered by direct deposit. (The other 1.6% is delivered by paycard or other method.)
� On average, 50.3% of paystubs are delivered by paper, while 46.2% are delivered by online posting, and 5.0% are delivered by e-mail.
─ The average percentage delivering paystubs by online posting increased significantly
from 32.2% in 2009 to 46.2% in 2011.
� One-third (33.7%) of the organizations represented in the survey pay unemployment taxes in one state, while one-fifth (20.1%) pay unemployment taxes in 20 or more states.
� Nearly one-in-seven organizations (13.8%) pay local national employees in at least one foreign country.
� More than one-fourth (27.7%) report paying nonresident alien employees in the U.S.
� On average, 35.1% of nonexempt employees report their time manually vs. 64.9% who report their time using an automated method.
� Most organizations (83.0%) have at least some employees that require child support orders. Other types of special deductions required for at least some employees were federal tax levies (58.7%), creditor garnishments (56.0%), student loan garnishments (50.0%), bankruptcy orders (46.0%), and state tax levies (39.3%).
� Aside from handling wage and salary payments, sizable proportions reported other types of payments being made through the payroll system, such as relocation expenses (60.3%), commission payments (48.7%), tuition reimbursements (36.6%), business expense reimbursements (35.7%), and travel reimbursements (35.3%).

2011 Survey of Salaries and the Payroll Profession 7
� More than two-thirds (72.5%) reported that their largest payroll is integrated with a Human Resource Information System (HRIS).
� Approximately half (50.2%) reported that the payroll staff handles less than 15% of their organization's employee benefits record keeping. On the other end of the spectrum, more than one-fourth (26.5%) reported that 85% or more of their organization's employee benefits recordkeeping is handled by payroll staff.
� Around half indicated that someone in the payroll department would be called upon to recommend or approve payroll processing software (55.4%) and/or training (46.9%).
IN-HOUSE PROCESSING VS. SERVICE PROVIDER
� Nearly half (49.8%) indicated that their organization's payroll processing is handled all in-house, while slightly more than one-third (35.8%) indicated that all payroll processing is handled by a service provider. (The remaining 14.4% use a mixture of in-house and service provider processing.)
� Among organizations handling payroll processing in-house, 7.3% plan to outsource all or part of their payroll processing in the future.
� Also among organizations handling payroll processing in-house, 24.6% plan to purchase new payroll-related software in the future.
� Among those using a service provider for payroll processing, 7.3% plan to bring all or part of their payroll processing in-house in the future.

2011 Survey of Salaries and the Payroll Profession 8
I. Introduction

2011 Survey of Salaries and the Payroll Profession 9
Study Methodology
The American Payroll Association (APA) commissioned Amplitude Research, Inc. to conduct a survey of its members in order to find out more about their organizations, their payroll staff, and the current salaries of personnel employed in their payroll department. A wide variety of topics were covered in an extensive six page survey.
A mail survey methodology was utilized for this study, involving 1,875 members randomly selected from the APA membership list to receive a survey. Similar to the approach used in 2009 (when a nearly identical study was conducted), most of the sample was taken at random from the whole membership list, but there was also an "oversample" of 300 randomly selected larger organizations (where "larger" meant they were predicted to have 5,000 or more employees). The reason for oversampling from larger organizations was the expectation that the response rate would be lower among members of large organizations, as answering about a large organization may require more time and research. Before the survey was mailed, an advance notice postcard, signed by Dan Maddux, Executive Director of the American Payroll Association, was sent on April 19, 2011. This informed members of the survey and asked for their cooperation. The postcard also mentioned that survey respondents could choose to be entered into a drawing to win an iPad™ or free APA webinar on demand. On April 22, 2011, a "package" was mailed out to 1,875 APA members that included a cover letter from the American Payroll Association asking for their participation, a six-page questionnaire, a two-page list of job classifications and descriptions, an entry form for a drawing to win an iPad™ or free APA webinar on demand, and a business reply envelope (b.r.e.) to use to return the survey (postage paid). Members were asked to complete and return the survey by May 27, 2011. On May 11, 2011, a reminder e-mail was sent to members who had not already returned a completed questionnaire. Members were asked to reply to the e-mail if they had misplaced their survey and needed a new survey mailed to them. It turned out that 42 members replied to the e-mail, and 42 new surveys were mailed to these members. From these 42 mailings, 14 completed surveys were returned. On May 13, 2011, a reminder letter was sent by regular mail to those who had not already returned a survey. Although the survey deadline was May 27, returned surveys were collected as late as June 7 to ensure that as many members as possible were included. In the end, 300 completed surveys were received, entered, processed, and tabulated for this report. Since the total mailout was 1,875, the response rate was 16%. Many researchers consider 10% to be an average response rate for a mail survey. From this perspective, the response rate of 16% achieved for this study can be considered above average. A similar survey was conducted in 2009, using a similar process (e.g., advance postcard, cover letter with survey and job descriptors, reminder letter, etc.). Throughout this report, many comparisons are made between the results from the 2011 survey and the 2009 survey. Having results from two different years provides a broader context and can help identify changes impacting the payroll profession and/or changes in APA membership.

2011 Survey of Salaries and the Payroll Profession 10
Interpretation of Tables & Charts in this Report
In many parts of the following report, a table is shown in the format below to present the 2011 results. The actual wording of the question used in the survey is shown in dark red at the top. The table below is showing fictitious results among 300 survey respondents who were asked about the color of their car. Each of the possible answers to the question is shown in a different row of the table. In this example, the respondents were asked to indicate if their car is red, blue, or some other color. That is, the "Valid" response options in the survey were "Red," "Blue," or "Other."
Q5. What color is your car?
Frequency Percent
Valid
Percent
Cumulative
Percent
Valid Red 100 33.3 36.4 36.4
Blue 125 41.7 45.5 81.8
Other 50 16.7 18.2 100.0
Total valid responses 275 91.7 100.0
Missing (No answer) 25 8.3
Total respondents 300 100.0
In a typical mail survey, not every respondent will answer every question. In some cases, this may be accidental (e.g., the respondent just missed the question or planned to come back to it later but forgot). In other cases, the respondent may choose not to answer for various reasons, such as not having access to the information needed or being unsure about the correct answer. In the example above, 25 respondents did not provide an answer, and this is indicated in the row that begins with "Missing." The column labeled "Percent" shows the percentages based on all 300 respondents, regardless of whether the respondent gave a valid answer or not. This shows that 8.3% did not answer the question. The column labeled "Valid Percent" shows the percentages based only on those who answered the question. For example, 36.4% of those who answered the question, indicated that their car is red. Next, many parts of the report include a chart like the one below to compare the 2011 results to the 2009 results. Notice that the 2011 bar in this chart has the same percentages as in the "Valid Percent" column of the table above.
30.0%
36.4%
50.0%
45.5%
20.0%
18.2%
0% 20% 40% 60% 80% 100%
2009
2011
Red Blue Other

2011 Survey of Salaries and the Payroll Profession 11
Interpretation of Tables & Charts (Continued)
An example of another type of table used in many parts of this report is shown below. This covers more than one question in the same table, and the percentages shown are based on the respondents who answered each question (i.e., the "Valid Percent"). Among other reasons, this type of table may be used when it is helpful to view the results for multiple questions together on the same page.
2011 2009
Q10. Which of the following pay
frequencies does your
organization use?
Biweekly 66.3% 72.7%
Semimonthly 30.3% 25.9%
Weekly 25.7% 29.3%
Monthly 20.3% 22.8%
Other 1.0% 1.4%
Q11. What is the pay frequency
of the largest payroll?
Biweekly 55.4% 58.6%
Semimonthly 22.8% 17.8%
Weekly 15.1% 15.6%
Monthly 6.0% 7.6%
Other 0.7% 0.4%
Another type of table used in this report is shown in the next section. These tables show the average salary for a number of payroll job classifications. For questions that involve numeric entries (e.g., salaries, number of employees, amount budgeted for a department, etc.) two helpful measures for summarizing the results include the "Mean" (or "Average") and the "Median." Both measures are often used to represent a "typical" value. The median is the value such that approximately half of the respondents gave a lower value, and approximately half of the respondents gave a higher value than the median. (For example, if the median selling price of homes in a neighborhood is $150,000, this means that half of the homes have been selling for less and half of the homes have been selling for more than $150,000.) In this report, sometimes the median is shown and sometimes the average is shown for numeric questions. The choice of which measure to show depends on the nature of the data. The median is more reliable and preferable when a very wide range of values is possible. For example, the number of employees working at an organization can range from 1 to more than 100,000. It is best to avoid relying on the average for this type of data (especially when comparing results from two different years), because one or a few very high values can disproportionately impact the average, whereas the median is not unduly impacted by a small number of extreme values. However, in some types of questions, it is reasonable and customary to use the average. For example, it is common to report the average salary for a particular job classification. Also, if a respondent is asked to name a percentage that must be between 0% and 100%, it is common to use the average. In this case, extreme values are not a major concern, as the maximum value is "capped" at 100%.

2011 Survey of Salaries and the Payroll Profession 12
Sampling Variability & Statistical Significance
While examining the survey findings, it is helpful to keep in mind that the results are based on a sample and are therefore subject to sampling variability, often referred to as “sampling error.” The degree of uncertainty for an estimate (e.g., a particular percentage from the survey) arising from sampling variability is represented through the use of a margin of error. A sampling margin of error at the “95% confidence level” can be interpreted roughly as providing a 95% probability that the interval created by the estimate plus and minus the margin of error contains the true value. (The “true” value would be known only if everyone in the target market was surveyed rather than just a sample.) In addition to sampling variability, results may be subject to various sources of non-sampling error (e.g., non-response bias, respondent misinterpretation of question wording, etc.). The degree of non-sampling error is not represented by the sampling margin of error and is usually unknown.
For a “sample size” of 300 survey respondents, the “maximum” margin of sampling error for percentages from the survey is +/- 5.6 percentage points at the 95% confidence level. Here, “maximum” refers to the margin of error being highest for proportions from the survey near 50%, while the margin of error declines as percentages get further from 50%. For example, given the same sample size of 300 respondents, a result from the survey near 10% or 90% would have a margin of sampling error of +/- 3.4 percentage points.
This suggests that results from 2011 and 2009 can be considered "similar" when the differences between these years are small (i.e., small enough to be within the range of sampling error). Said another way, when comparing survey results from 2011 to 2009, the differences are impacted by sampling error. Intuitively, sometimes the difference between these two years may be small enough to be explained merely by sampling error. Sometimes the difference is large enough to be confident that a true change has occurred.
In layman's terms, a “statistically significant” difference means that the difference is large enough that one can be reasonably confident (i.e., at the "95% confidence level") that the difference cannot be explained merely by sampling error. If a change is not statistically significant, then there is not enough evidence to be highly confident that a difference in survey results between years implies a true change among members and their organizations. In this report, we minimize the use of technical / statistical terms. However, when a difference is referred to as "significant" -- or if a 2011 result is referred to as "significantly" higher or lower than the result in 2009 -- this is based on "statistical significance." This essentially implies that the difference referred to as "significant" is worth paying attention to, since sampling error alone is not likely to be the explanation for the magnitude of the difference observed.
When thinking about changes between 2009 and 2011, it is worth keeping in mind that the APA membership base is not static, but rather changes to at least some degree over time. For example, the APA website states that membership "has risen to over 22,000 Payroll Professionals and continues to grow, demonstrating the high level of interest on the part of the payroll community participating in the wide range of activities available to APA members." In other words, the base of members in 2011 is not exactly the same as the base of members in 2009. Although a high degree of continuity can be expected, many new members have joined in the past two years, while others may have changed careers or retired. The 2011 survey provides a "snapshot" of the membership base (and their organizations) at one point in time, while the 2009 survey provides a snapshot of the membership base at a different point in time. Thus, differences between 2011 and 2009 can be due to changes in the membership base, as well as to changes in practices over time.

2011 Survey of Salaries and the Payroll Profession 13
II. Payroll Staff Salaries
(See the Appendix for a detailed description of each job classification.)

2011 Survey of Salaries and the Payroll Profession 14
Average Current Salaries
� The table below shows the average salary for each job classification in 2011 and 2009.
� For example, the average salary for a Payroll Practitioner II was $40,825 based on the 2011
survey and $39,531 based on the 2009 survey. The average of $40,825 in 2011 was based on
157 salaries reported in the 2011 survey.
− As might be expected, the larger the number of salaries reported in the survey, the more confidence one can have that the average salary reported here represents a typical salary for this job classification. Extra caution is recommended when interpreting averages
based on fewer than 30 salaries reported. However, comparing the 2011 average salary to the 2009 average salary can help make a reasonable judgment about what is typical today. Having data from two different years provides a more reliable picture than just one year alone. For example, the average of $60,291 for classification (L) above is based on only 7 salaries reported in the 2011 survey. Comparing this to the average of $46,483 from 2009 suggests that the 2011 average may be too high, but one can judge that a typical salary for (L) in 2011 is likely to be somewhat higher than in 2009.
2011 Number
Of Current 2011 2009
Base Salaries Avg. Current Avg. Current
Reported Base Salary Base Salary
Payroll Practitioner/AdministratorPayroll Clerk/Assistant (A) 38 $35,068 $33,409
Payroll Practitioner I (Entry-level) (B) 58 $37,689 $34,235
Payroll Practitioner II (Intermediate) (C) 157 $40,825 $39,531
Payroll Practitioner III (Senior) (D) 80 $48,488 $44,424
Payroll Administrator (E) 129 $50,673 $48,125
Lead Payroll Administrator (F) 42 $55,561 $54,681
Payroll ManagementPayroll Supervisor (G) 66 $63,558 $62,257
Payroll Manager/Director (H) 105 $83,583 $77,849
Director/Vice President of Payroll (I) 28 $111,132 $97,918
Technical/Professional StaffAccounting Clerk (J) 6 $46,332 $44,011
Payroll Accountant/Payroll Analyst (K) 40 $50,776 $56,087
Payroll Records/Benefits Administrator (L) 7 $60,291 $46,483
Payroll Tax Administrator (M) 27 $58,205 $58,236
Payroll Systems/Information TechnologyData Processing/Entry Operator (N) 6 $40,267 $39,200
Lead Operator (O) 0 n/a *
Payroll Systems Coordinator (P) 12 $55,205 $56,760
Payroll Systems Analyst (Q) 19 $73,395 $70,490
* Insufficient data

2011 Survey of Salaries and the Payroll Profession 15
Average Starting Salaries
� The table below shows the average starting salary for each payroll job classification in 2011 and
2009 (when sufficient data was available).
� For example, the average starting salary for a Payroll Practitioner II (C) was $35,247 in 2011
and $33,410 in 2009.
− The average of $35,247 in 2011 for classification (C) was based on 45 starting salaries reported in the 2011 survey. This is lower than the number of current salaries (as shown on the previous page) for this job classification, for at least two reasons. First, each respondent could report only one starting salary, whereas respondents could report multiple current salaries for the same job classification if multiple employees currently hold that job at the same organization. Second, some respondents might not know what their organization would use as a starting salary today, whereas current salaries at the organization are known.
2011 Number
Of Starting 2011 2009
Salaries Avg. Starting Avg. Starting
Reported Base Salary Base Salary
Payroll Practitioner/AdministratorPayroll Clerk/Assistant (A) 17 $31,119 $28,521
Payroll Practitioner I (Entry-level) (B) 20 $34,237 $28,191
Payroll Practitioner II (Intermediate) (C) 45 $35,247 $33,410
Payroll Practitioner III (Senior) (D) 23 $41,059 $37,050
Payroll Administrator (E) 53 $39,679 $38,458
Lead Payroll Administrator (F) 17 $47,908 $43,306
Payroll ManagementPayroll Supervisor (G) 31 $50,559 $50,857
Payroll Manager/Director (H) 50 $68,865 $62,872
Director/Vice President of Payroll (I) 14 $87,923 $70,126
Technical/Professional StaffAccounting Clerk (J) 3 $34,846 $34,820
Payroll Accountant/Payroll Analyst (K) 11 $44,405 $41,798
Payroll Records/Benefits Administrator (L) 4 $49,653 $34,949
Payroll Tax Administrator (M) 9 $49,819 $43,865
Payroll Systems/Information TechnologyData Processing/Entry Operator (N) 1 * *
Lead Operator (O) 0 n/a *
Payroll Systems Coordinator (P) 5 $44,581 $42,117
Payroll Systems Analyst (Q) 8 $61,335 $49,385
* Insufficient data

2011 Survey of Salaries and the Payroll Profession 16
Average Starting Salaries for CPP
� The table below shows the average starting salary for those who have a Certified Payroll Professional (CPP) certification.
� For example, the average starting salary for a Payroll Practitioner II (C) with CPP certification
was $37,854 in 2011 and $37,255 in 2009.
− The average of $37,854 in 2011 for classification (C) was based on 20 starting salaries for CPP reported in the 2011 survey. This is lower than the number of starting salaries without specifying CPP (as shown on the previous page) for this job classification. More respondents were able to provide an answer for the starting salary in general than were able to provide an answer for a starting salary for CPP in particular.
2011 Number 2011 2009
Of Starting Avg. Starting Avg. Starting
Salaries for Base Salary Base Salary
CPP Reported For CPP For CPP
Payroll Practitioner/AdministratorPayroll Clerk/Assistant (A) 3 $32,434 $31,189
Payroll Practitioner I (Entry-level) (B) 8 $37,104 $34,354
Payroll Practitioner II (Intermediate) (C) 20 $37,854 $37,255
Payroll Practitioner III (Senior) (D) 12 $47,370 $41,563
Payroll Administrator (E) 28 $45,237 $44,416
Lead Payroll Administrator (F) 11 $52,651 $46,752
Payroll ManagementPayroll Supervisor (G) 20 $52,851 $55,432
Payroll Manager/Director (H) 33 $73,898 $67,807
Director/Vice President of Payroll (I) 10 $94,108 $86,797
Technical/Professional StaffAccounting Clerk (J) 1 * $34,500
Payroll Accountant/Payroll Analyst (K) 5 $52,261 $50,979
Payroll Records/Benefits Administrator (L) 2 * $42,123
Payroll Tax Administrator (M) 1 * $50,719
Payroll Systems/Information TechnologyData Processing/Entry Operator (N) 0 n/a *
Lead Operator (O) 0 n/a *
Payroll Systems Coordinator (P) 2 * $50,333
Payroll Systems Analyst (Q) 4 $67,181 $58,150
* Insufficient data
2011 Survey of Salaries and the Payroll Profession 17
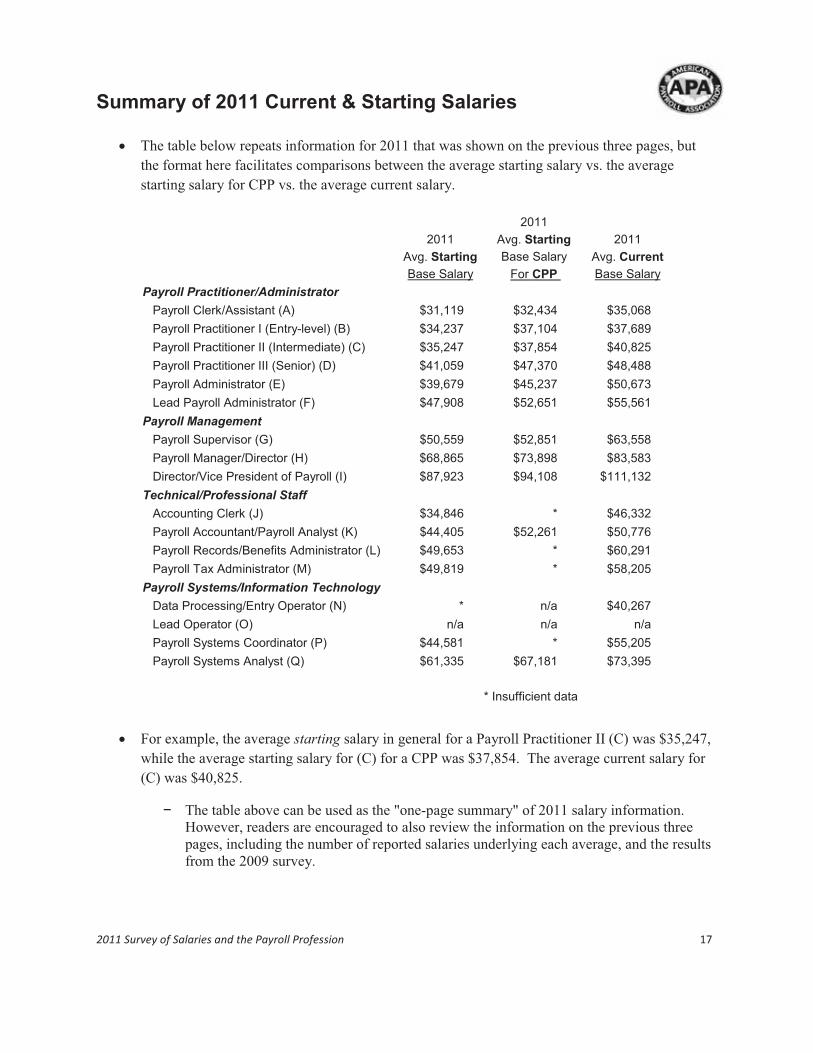
Summary of 2011 Current & Starting Salaries
� The table below repeats information for 2011 that was shown on the previous three pages, but
the format here facilitates comparisons between the average starting salary vs. the average
starting salary for CPP vs. the average current salary.
� For example, the average starting salary in general for a Payroll Practitioner II (C) was $35,247,
while the average starting salary for (C) for a CPP was $37,854. The average current salary for
(C) was $40,825.
− The table above can be used as the "one-page summary" of 2011 salary information. However, readers are encouraged to also review the information on the previous three pages, including the number of reported salaries underlying each average, and the results from the 2009 survey.
2011
2011 Avg. Starting 2011
Avg. Starting Base Salary Avg. Current
Base Salary For CPP Base Salary
Payroll Practitioner/AdministratorPayroll Clerk/Assistant (A) $31,119 $32,434 $35,068
Payroll Practitioner I (Entry-level) (B) $34,237 $37,104 $37,689
Payroll Practitioner II (Intermediate) (C) $35,247 $37,854 $40,825
Payroll Practitioner III (Senior) (D) $41,059 $47,370 $48,488
Payroll Administrator (E) $39,679 $45,237 $50,673
Lead Payroll Administrator (F) $47,908 $52,651 $55,561
Payroll ManagementPayroll Supervisor (G) $50,559 $52,851 $63,558
Payroll Manager/Director (H) $68,865 $73,898 $83,583
Director/Vice President of Payroll (I) $87,923 $94,108 $111,132
Technical/Professional StaffAccounting Clerk (J) $34,846 * $46,332
Payroll Accountant/Payroll Analyst (K) $44,405 $52,261 $50,776
Payroll Records/Benefits Administrator (L) $49,653 * $60,291
Payroll Tax Administrator (M) $49,819 * $58,205
Payroll Systems/Information TechnologyData Processing/Entry Operator (N) * n/a $40,267
Lead Operator (O) n/a n/a n/a
Payroll Systems Coordinator (P) $44,581 * $55,205
Payroll Systems Analyst (Q) $61,335 $67,181 $73,395
* Insufficient data

2011 Survey of Salaries and the Payroll Profession 18
III. Organization Characteristics

2011 Survey of Salaries and the Payroll Profession 19
Annual Gross Revenue
Q49. What was the annual gross revenue of your entire organization
for the most recent year?
Frequency Percent
Valid
Percent
Cumulative
Percent
Valid < $50 million 78 26.0 33.2 33.2
$50 million – $100 million 37 12.3 15.7 48.9
> $100 million but < $500 million 45 15.0 19.1 68.1
$500 million – $1 billion 28 9.3 11.9 80.0
> $1 billion but < $5 billion 32 10.7 13.6 93.6
$5 billion – $10 billion 9 3.0 3.8 97.4
More than $10 billion 6 2.0 2.6 100.0
Total valid responses 235 78.3 100.0
Missing (No answer) 65 21.7
Total respondents 300 100.0
� Approximately one-third of the respondents in 2011 (33.2%) and 2009 (31.7%) who answered
the question above indicated that their organization's annual gross revenue was less than $50
million. On the other end of the spectrum, a small proportion each year (approximately 6%)
reported that their organization had $5 billion or more in annual gross revenue.
� Many (65 respondents in 2011) did not provide an answer to this question, but annual revenue is
not necessarily applicable to all organizations (e.g., government, education, non-profit).
31.7%
33.2%
15.1%
15.7%
21.9%
19.1%
14.3%
11.9%
10.8%
13.6%
6.2%
6.4%
0% 20% 40% 60% 80% 100%
2009
2011
< $50 million $50 million – $100 million
> $100 million but < $500 million $500 million – $1 billion
> $1 billion but < $5 billion $5 billion or more

2011 Survey of Salaries and the Payroll Profession 20
Type of Organization
Q1. Which ONE of the following best describes your organization?
Frequency Percent
Valid
Percent
Cumulative
Percent
Valid Education: Pre-K thru HS (public) 9 3.0 3.1 3.1
Education: Pre-K thru HS (private) 1 .3 .3 3.4
Education: Post-secondary (public) 12 4.0 4.1 7.5
Education: Post-secondary (private) 7 2.3 2.4 9.9
Finance: Banking 7 2.3 2.4 12.3
Finance: Investments 2 .7 .7 13.0
Finance: Insurance 13 4.3 4.5 17.5
Finance: Real estate, other finance 3 1.0 1.0 18.5
Government: Federal 1 .3 .3 18.8
Government: State (excluding education) 1 .3 .3 19.2
Government: Local (excluding education) 26 8.7 8.9 28.1
Hospitality: Eating & drinking 5 1.7 1.7 29.8
Hospitality: Hotels, other lodging 1 .3 .3 30.1
Manufacturing: Food 4 1.3 1.4 31.5
Manufacturing: Textiles 1 .3 .3 31.8
Manufacturing: Lumber, wood products 2 .7 .7 32.5
Manufacturing: Printing, publishing 5 1.7 1.7 34.2
Manufacturing: Chemicals, allied products 1 .3 .3 34.6
Manufacturing: Petroleum refining, distribution 2 .7 .7 35.3
Manufacturing: Metal industries 6 2.0 2.1 37.3
Manufacturing: Machinery, except electrical 3 1.0 1.0 38.4
Manufacturing: Electrical, electronics 3 1.0 1.0 39.4
Manufacturing: Transportation equipment 8 2.7 2.7 42.1
Manufacturing: Other 9 3.0 3.1 45.2
Sales: Food stores 2 .7 .7 45.9
Sales: Merchandise 5 1.7 1.7 47.6
Sales: Wholesale 5 1.7 1.7 49.3
Services: Business services 14 4.7 4.8 54.1
Services: Health care 27 9.0 9.2 63.4
Services: Legal services 4 1.3 1.4 64.7
Services: Other 24 8.0 8.2 72.9

2011 Survey of Salaries and the Payroll Profession 21
Other Industries: Agriculture, fisheries, forestry 2 .7 .7 73.6
Other Industries: Mining 2 .7 .7 74.3
Other Industries: Oil and gas extraction 3 1.0 1.0 75.3
Other Industries: Construction 13 4.3 4.5 79.8
Other Industries: Transportation services 2 .7 .7 80.5
Other Industries: Communications 5 1.7 1.7 82.2
Other Industries: Utilities 12 4.0 4.1 86.3
Other Industries: Entertainment 2 .7 .7 87.0
Other Industries: Religious (except education) 4 1.3 1.4 88.4
Other Industries: Consulting 3 1.0 1.0 89.4
Other Industries: All others 31 10.3 10.6 100.0
Total valid responses 292 97.3 100.0
Missing (No answer) 8 2.7
Total respondents 300 100.0
� The table above shows that a wide variety of industries were represented in the 2011 survey.
� The chart below shows the proportions in broader categories, such as "Education" and "Finance"
in both the 2011 and 2009 surveys. For example, nearly one-fourth of the respondents worked
for an organization that can be classified into the broad category of "Services."
� "Manufacturing" was another common category, although the proportion for this category in
2011 (15.1%) was slightly lower than in 2009 (20.6%).
8.8%
9.9%
6.6%
8.6%
10.2%
9.6%
20.6%
15.1%
5.6%
4.1%
24.8%
23.6%
21.2%
27.1%
0% 20% 40% 60% 80% 100%
2009
2011
Education Finance Government Hospitality
Manufacturing Sales Services Other Industries

2011 Survey of Salaries and the Payroll Profession 22
Number of Full-time Employees
Q47. How many people are employed full-time by your
entire organization?
Frequency Percent
Valid
Percent
Cumulative
Percent
Valid < 150 57 19.0 19.9 19.9
150 - 499 91 30.3 31.7 51.6
500 - 1,499 62 20.7 21.6 73.2
1,500 - 4,999 36 12.0 12.5 85.7
5,000 + 41 13.7 14.3 100.0
Total valid responses 287 95.7 100.0
Missing (No answer) 13 4.3
Total respondents 300 100.0
� Approximately one-fifth of the survey respondents in 2011 (19.9%) reported that their
organization has fewer than 150 full-time employees, while slightly less than one-fifth in 2009
(16.0%) reported fewer than 150 full-time employees at their organization.
� The proportion reporting 150 to 499 full-time employees was significantly higher in 2011
(31.7%), compared to 2009 (24.1%). At the same time, the proportion reporting 1,500 to 4,999
full-time employees was significantly lower in 2011 (12.5%), compared to 2009 (25.6%).
However, the proportion with 5,000 or more full-time employees did not differ significantly
between 2011 and 2009.
� The median number of full-time employees was 450 in 2011 and 800 in 2009.
16.0%
19.9%
24.1%
31.7%
21.5%
21.6%
25.6%
12.5%
12.8%
14.3%
0% 20% 40% 60% 80% 100%
2009
2011
< 150 150 - 499 500 - 1,499 1,500 - 4,999 5,000 +
2011 Survey of Salaries and the Payroll Profession 23
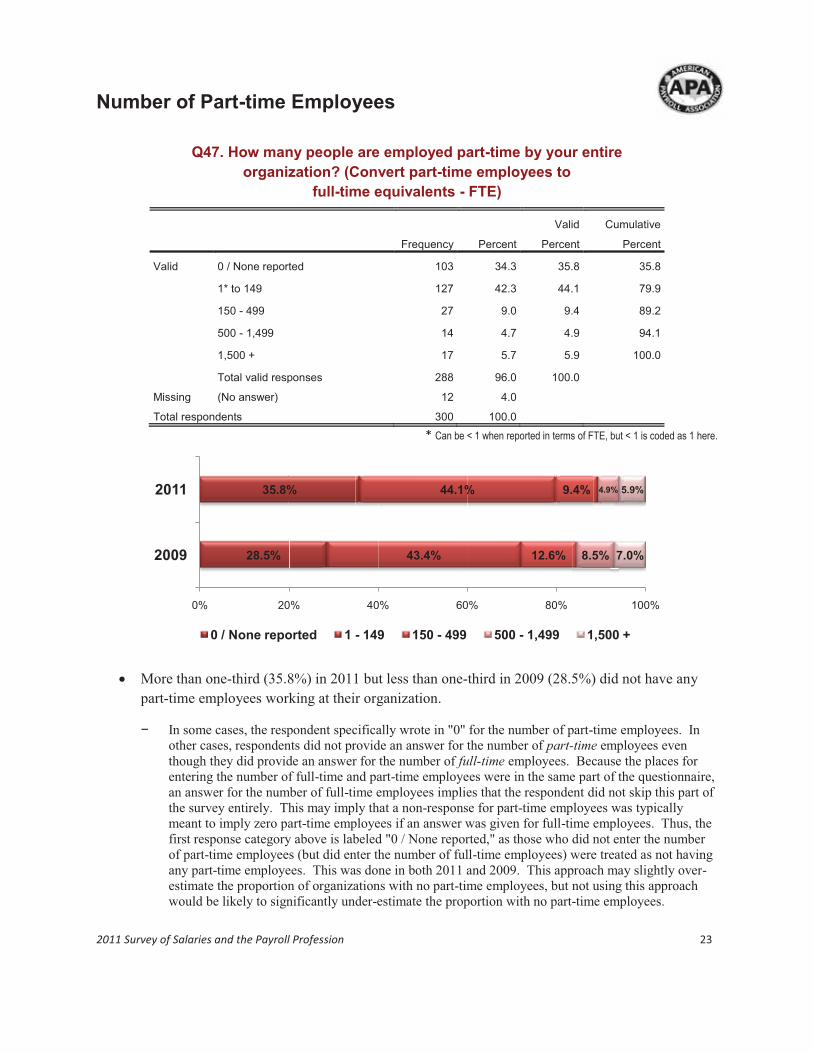
Number of Part-time Employees
Q47. How many people are employed part-time by your entire
organization? (Convert part-time employees to
full-time equivalents - FTE)
Frequency Percent
Valid
Percent
Cumulative
Percent
Valid 0 / None reported 103 34.3 35.8 35.8
1* to 149 127 42.3 44.1 79.9
150 - 499 27 9.0 9.4 89.2
500 - 1,499 14 4.7 4.9 94.1
1,500 + 17 5.7 5.9 100.0
Total valid responses 288 96.0 100.0
Missing (No answer) 12 4.0
Total respondents 300 100.0
* Can be < 1 when reported in terms of FTE, but < 1 is coded as 1 here.
� More than one-third (35.8%) in 2011 but less than one-third in 2009 (28.5%) did not have any
part-time employees working at their organization.
− In some cases, the respondent specifically wrote in "0" for the number of part-time employees. In other cases, respondents did not provide an answer for the number of part-time employees even though they did provide an answer for the number of full-time employees. Because the places for entering the number of full-time and part-time employees were in the same part of the questionnaire, an answer for the number of full-time employees implies that the respondent did not skip this part of the survey entirely. This may imply that a non-response for part-time employees was typically meant to imply zero part-time employees if an answer was given for full-time employees. Thus, the first response category above is labeled "0 / None reported," as those who did not enter the number of part-time employees (but did enter the number of full-time employees) were treated as not having any part-time employees. This was done in both 2011 and 2009. This approach may slightly over-estimate the proportion of organizations with no part-time employees, but not using this approach would be likely to significantly under-estimate the proportion with no part-time employees.
28.5%
35.8%
43.4%
44.1%
12.6%
9.4%
8.5%
4.9%
7.0%
5.9%
0% 20% 40% 60% 80% 100%
2009
2011
0 / None reported 1 - 149 150 - 499 500 - 1,499 1,500 +

2011 Survey of Salaries and the Payroll Profession 24
Merger, Acquisition, or Divestiture in Last 2 Years
Q50. Has your organization been involved in a merger, acquisition, or
divestiture in the last two years?
Frequency Percent
Valid
Percent
Cumulative
Percent
Valid Yes 78 26.0 27.5 27.5
No 206 68.7 72.5 100.0
Total valid responses 284 94.7 100.0
Missing (No answer) 16 5.3
Total respondents 300 100.0
� As shown above, more than one-fourth in 2011 (27.5%) and nearly one-third in 2009 (32.8%)
indicated that their organization has been involved in a merger, acquisition, or divestiture in the
last two years.
� As shown below, among those who were involved in such an event, 71.4% in 2011 and 65.4% in
2009 now pay more employees as a result.
2011 2009
Q50a. How did it affect
your payroll operations?
(Asked only if "Yes" to Q50
shown above)
Pay more employees now 71.4% 65.4%
Pay fewer employees now 10.4% 19.5%
Pay same number of employees now 13.0% 11.9%
Payroll staff has increased 13.0% 15.7%
Payroll staff has decreased 11.7% 12.6%
Payroll staff is unchanged 45.5% 47.2%
32.8%
27.5%
67.2%
72.5%
0% 20% 40% 60% 80% 100%
2009
2011
Yes No

2011 Survey of Salaries and the Payroll Profession 25
Location of Payroll Jobs
Q48. What is the location of all or most of the payroll-related jobs?
Frequency Percent
Valid
Percent
Cumulative
Percent
Valid Metro area with a population of 1,000,000 or more 94 31.3 33.1 33.1
Metro area with a population of 500,000 to 999,999 46 15.3 16.2 49.3
Metro area with a population of 250,000 to 499,999 28 9.3 9.9 59.2
Metro area with a population of 50,000 to 249,999 58 19.3 20.4 79.6
City of 10,000 to 49,999 43 14.3 15.1 94.7
Town of fewer than 10,000 / rural area 15 5.0 5.3 100.0
Total valid responses 284 94.7 100.0
Missing (No answer) 16 5.3
Total respondents 300 100.0
� Approximately one-third of the respondents in 2011 (33.1%) and slightly more than one-third in
2009 (39.1%) indicated that all or most of the payroll-related jobs are located in a Metro area
with a population of 1,000,000 or more.
� Others reported a variety of settings, ranging from a Metro area with just under 1 million people
to a small town or rural area.
39.1%
33.1%
11.2%
16.2%
9.5%
9.9%
18.5%
20.4%
15.7%
15.1%
6.0%
5.3%
0% 20% 40% 60% 80% 100%
2009
2011
Population 1,000,000 + 500,000 to 999,999 250,000 to 499,999
50,000 to 249,999 10,000 to 49,999 < 10,000

2011 Survey of Salaries and the Payroll Profession 26
IV. Payroll Staff
2011 Survey of Salaries and the Payroll Profession 27
Payroll Functions Provided at Multiple Sites
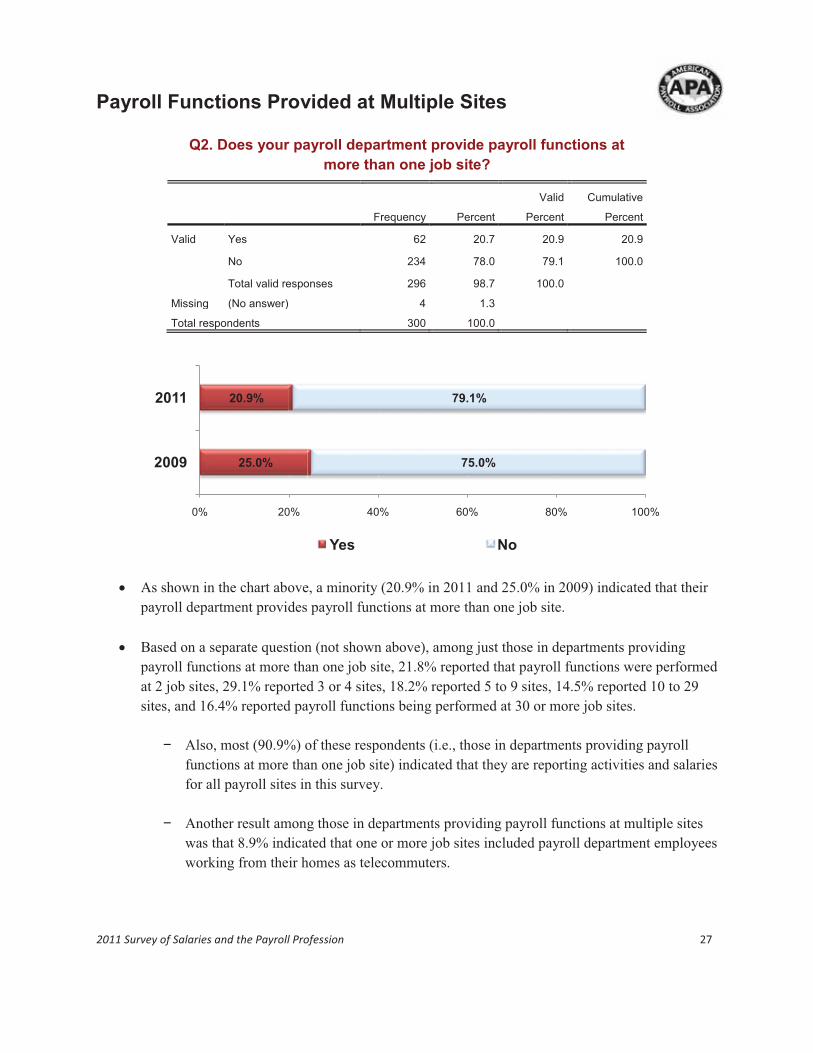
Q2. Does your payroll department provide payroll functions at
more than one job site?
Frequency Percent
Valid
Percent
Cumulative
Percent
Valid Yes 62 20.7 20.9 20.9
No 234 78.0 79.1 100.0
Total valid responses 296 98.7 100.0
Missing (No answer) 4 1.3
Total respondents 300 100.0
� As shown in the chart above, a minority (20.9% in 2011 and 25.0% in 2009) indicated that their
payroll department provides payroll functions at more than one job site.
� Based on a separate question (not shown above), among just those in departments providing
payroll functions at more than one job site, 21.8% reported that payroll functions were performed
at 2 job sites, 29.1% reported 3 or 4 sites, 18.2% reported 5 to 9 sites, 14.5% reported 10 to 29
sites, and 16.4% reported payroll functions being performed at 30 or more job sites.
− Also, most (90.9%) of these respondents (i.e., those in departments providing payroll
functions at more than one job site) indicated that they are reporting activities and salaries
for all payroll sites in this survey.
− Another result among those in departments providing payroll functions at multiple sites
was that 8.9% indicated that one or more job sites included payroll department employees
working from their homes as telecommuters.
25.0%
20.9%
75.0%
79.1%
0% 20% 40% 60% 80% 100%
2009
2011
Yes No

2011 Survey of Salaries and the Payroll Profession 28
Number Employed Full-time in Payroll Department
Q3. How many people are employed full-time in your
payroll department?
Frequency Percent
Valid
Percent
Cumulative
Percent
Valid 0 5 1.7 1.7 1.7
1 139 46.3 46.3 48.0
2 to 3 81 27.0 27.0 75.0
4 to 5 25 8.3 8.3 83.3
6 or more 50 16.7 16.7 100.0
Total 300 100.0 100.0
� Nearly half (46.3%) of the respondents in the 2011 survey reported that their payroll department
has one full-time employee. In 2009, a significantly lower proportion (30.3%) had reported one
full-time employee in the payroll department.
� On the other end of the spectrum, one-in-six (16.7%) in 2011 and more than one-in-five (21.8%)
in 2009 reported having 6 or more full-time employees in their payroll department.
� In a separate question, 15.0% in 2011 reported having at least one part-time employee in the
payroll department. In 2009, 13.2% had reported at least one part-time employee in the payroll
department.
30.3%
46.3%
32.1%
27.0%
15.4%
8.3%
21.8%
16.7%
0% 20% 40% 60% 80% 100%
2009
2011
None 1 2 to 3 4 to 5 6 or more
2011 Survey of Salaries and the Payroll Profession 29
Education & Certifications
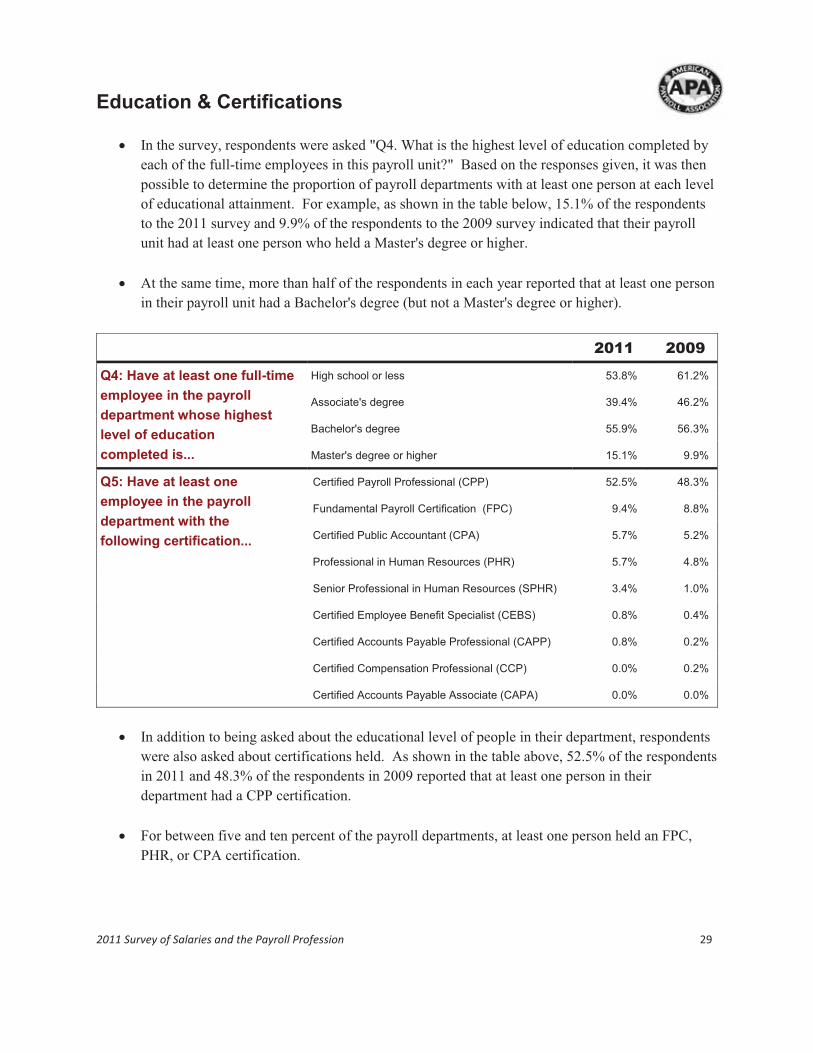
� In the survey, respondents were asked "Q4. What is the highest level of education completed by
each of the full-time employees in this payroll unit?" Based on the responses given, it was then
possible to determine the proportion of payroll departments with at least one person at each level
of educational attainment. For example, as shown in the table below, 15.1% of the respondents
to the 2011 survey and 9.9% of the respondents to the 2009 survey indicated that their payroll
unit had at least one person who held a Master's degree or higher.
� At the same time, more than half of the respondents in each year reported that at least one person
in their payroll unit had a Bachelor's degree (but not a Master's degree or higher).
2011 2009
Q4: Have at least one full-time
employee in the payroll
department whose highest
level of education
completed is...
High school or less 53.8% 61.2%
Associate's degree 39.4% 46.2%
Bachelor's degree 55.9% 56.3%
Master's degree or higher 15.1% 9.9%
Q5: Have at least one
employee in the payroll
department with the
following certification...
Certified Payroll Professional (CPP) 52.5% 48.3%
Fundamental Payroll Certification (FPC) 9.4% 8.8%
Certified Public Accountant (CPA) 5.7% 5.2%
Professional in Human Resources (PHR) 5.7% 4.8%
Senior Professional in Human Resources (SPHR) 3.4% 1.0%
Certified Employee Benefit Specialist (CEBS) 0.8% 0.4%
Certified Accounts Payable Professional (CAPP) 0.8% 0.2%
Certified Compensation Professional (CCP) 0.0% 0.2%
Certified Accounts Payable Associate (CAPA) 0.0% 0.0%
� In addition to being asked about the educational level of people in their department, respondents
were also asked about certifications held. As shown in the table above, 52.5% of the respondents
in 2011 and 48.3% of the respondents in 2009 reported that at least one person in their
department had a CPP certification.
� For between five and ten percent of the payroll departments, at least one person held an FPC,
PHR, or CPA certification.
2011 Survey of Salaries and the Payroll Profession 30
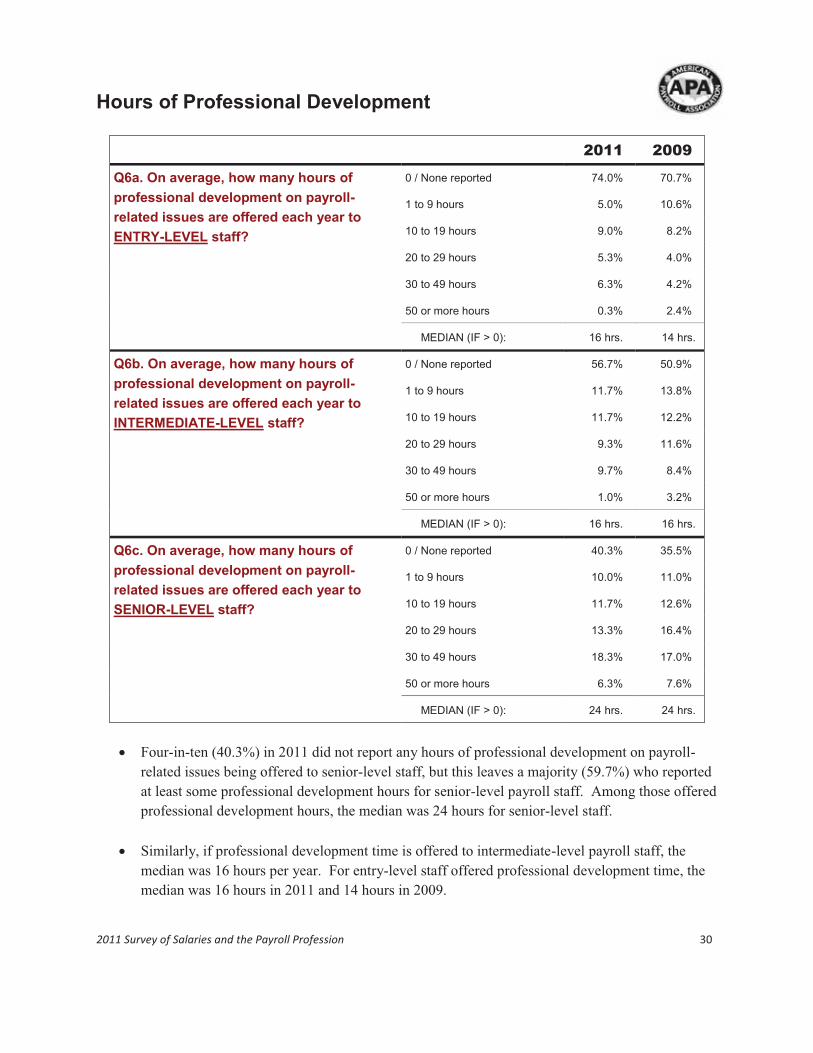
Hours of Professional Development
2011 2009
Q6a. On average, how many hours of
professional development on payroll-
related issues are offered each year to
ENTRY-LEVEL staff?
0 / None reported 74.0% 70.7%
1 to 9 hours 5.0% 10.6%
10 to 19 hours 9.0% 8.2%
20 to 29 hours 5.3% 4.0%
30 to 49 hours 6.3% 4.2%
50 or more hours 0.3% 2.4%
MEDIAN (IF > 0): 16 hrs. 14 hrs.
Q6b. On average, how many hours of
professional development on payroll-
related issues are offered each year to
INTERMEDIATE-LEVEL staff?
0 / None reported 56.7% 50.9%
1 to 9 hours 11.7% 13.8%
10 to 19 hours 11.7% 12.2%
20 to 29 hours 9.3% 11.6%
30 to 49 hours 9.7% 8.4%
50 or more hours 1.0% 3.2%
MEDIAN (IF > 0): 16 hrs. 16 hrs.
Q6c. On average, how many hours of
professional development on payroll-
related issues are offered each year to
SENIOR-LEVEL staff?
0 / None reported 40.3% 35.5%
1 to 9 hours 10.0% 11.0%
10 to 19 hours 11.7% 12.6%
20 to 29 hours 13.3% 16.4%
30 to 49 hours 18.3% 17.0%
50 or more hours 6.3% 7.6%
MEDIAN (IF > 0): 24 hrs. 24 hrs.
� Four-in-ten (40.3%) in 2011 did not report any hours of professional development on payroll-
related issues being offered to senior-level staff, but this leaves a majority (59.7%) who reported
at least some professional development hours for senior-level payroll staff. Among those offered
professional development hours, the median was 24 hours for senior-level staff.
� Similarly, if professional development time is offered to intermediate-level payroll staff, the
median was 16 hours per year. For entry-level staff offered professional development time, the
median was 16 hours in 2011 and 14 hours in 2009.

2011 Survey of Salaries and the Payroll Profession 31
Training Budget
Q7. What is your budget for training and education of payroll staff
for the current fiscal year?
Frequency Percent
Valid
Percent
Cumulative
Percent
Valid $0 107 35.7 40.8 40.8
$1 - $999 36 12.0 13.7 54.6
$1,000 - $1,999 32 10.7 12.2 66.8
$2,000 - $4,999 41 13.7 15.6 82.4
$5,000 + 46 15.3 17.6 100.0
Total valid responses 262 87.3 100.0
Missing (No answer) 38 12.7
Total respondents 300 100.0
� While approximately four-in-ten (40.8% in 2011 and 41.4% in 2009) did not have funds
allocated for training and education of payroll staff, more than half had at least some money
budgeted for this purpose.
� Some organizations had $5,000 or more budgeted for training and education of payroll staff for
the current fiscal year (17.6% in 2011 and 14.8% in 2009).
� Among those who had at least some money budgeted, the median amount was $2,000 in both
2011 and 2009 for training and education of payroll staff.
41.4%
40.8%
11.5%
13.7%
13.0%
12.2%
19.3%
15.6%
14.8%
17.6%
0% 20% 40% 60% 80% 100%
2009
2011
$0 $1 - $999 $1,000 - $1,999 $2,000 - $4,999 $5,000 +

2011 Survey of Salaries and the Payroll Profession 32
V. Payroll Processing

2011 Survey of Salaries and the Payroll Profession 33
Department to Which Payroll Function Reports
Q8. Where does the payroll function report in your organization?
Frequency Percent
Valid
Percent
Cumulative
Percent
Valid Payroll is a stand-alone department 14 4.7 4.8 4.8
Payroll is a unit within an accounting or finance
department 182 60.7 61.9 66.7
Payroll is a unit within a human resources or
personnel department 70 23.3 23.8 90.5
Payroll is a unit within a shared services department 21 7.0 7.1 97.6
Other 7 2.3 2.4 100.0
Total valid responses 294 98.0 100.0
Missing (No answer) 6 2.0
Total respondents 300 100.0
� The majority (61.9% in 2011 and 65.7% in 2009) indicated that the payroll function in their
organization reports to an accounting or finance department.
� For nearly one-fourth, the payroll function is a unit within a human resources or personnel
department.
5.4%
4.8%
65.7%
61.9%
24.1%
23.8% 7.1%
0% 20% 40% 60% 80% 100%
2009
2011
Stand-alone Accounting / Finance HR / Personnel Shared Services Other

2011 Survey of Salaries and the Payroll Profession 34
Methods Used to Input Payroll Data
� More than half of the respondents in 2011 (52.0%) and 2009 (59.0%) indicated that "Batch input
by payroll" is used to input payroll data. This was the most frequently used method, although it
is possible to use more than one method, and the table below shows that many different methods
were selected by sizable proportions.
2011 2009
Q9. Which methods are
used to input payroll
data?
Batch input by payroll 52.0% 59.0%
System input by payroll 36.5% 42.5%
File transfers by payroll 36.1% 42.5%
File transfers from systems 32.8% 46.5%
Web-based input by payroll 27.0% 19.3%
Web-based input by employees (self-service) 25.0% 21.3%
Web-based input by managers (self-service) 17.2% 15.1%
System input by others 12.5% 15.7%
Batch input by others 8.4% 14.1%
Voice response by employees 0.7% 1.4%
Other 2.4% 1.0%
� The method of "Web-based input by payroll" was selected in the 2011 survey significantly more
often than it was selected in the 2009 survey (27.0% vs. 19.3%, respectively, as shown in the
table above).
� In contrast to the higher proportion using web-based input by payroll, the proportion was lower
in 2011 than in 2009 for each of the first four methods shown in the table.
− The 2011 result of 32.8% for file transfers from systems was significantly lower than the 2009 result of 46.5%.

2011 Survey of Salaries and the Payroll Profession 35
Payroll Frequency
� Approximately two-thirds in 2011 (66.3%) and slightly more than two-thirds in 2009 (72.7%)
reported that their organization used a biweekly payroll. This was the most frequently selected
payroll frequency, although it is possible to have more than one payroll frequency used by an
organization, and the table below shows that sizable proportions have semimonthly, weekly, and
monthly payrolls.
2011 2009
Q10. Which of the following pay
frequencies does your
organization use?
Biweekly 66.3% 72.7%
Semimonthly 30.3% 25.9%
Weekly 25.7% 29.3%
Monthly 20.3% 22.8%
Other 1.0% 1.4%
Q11. What is the pay frequency
of the largest payroll?
Biweekly 55.4% 58.6%
Semimonthly 22.8% 17.8%
Weekly 15.1% 15.6%
Monthly 6.0% 7.6%
Other 0.7% 0.4%
� Slightly more than half (55.4% in 2011 and 58.6% in 2009) reported that their largest payroll
was biweekly.
� Overall, the results for the two questions shown in the table above were similar in 2011 and
2009.

2011 Survey of Salaries and the Payroll Profession 36
Delivery Method for Payroll
2011 2009
Q12a. Approximately what percentage of
your organization’s payroll is delivered by paper paycheck?
0% 22.6% 13.9%
1% to 33% 66.7% 70.5%
34% to 66% 6.4% 10.7%
67% to 99% 3.0% 3.6%
100% 1.3% 1.2%
AVERAGE (including 0): 13.3% 17.3%
Q12b. Approximately what percentage of
your organization’s payroll is delivered by direct deposit?
0% 1.3% 1.2%
1% to 33% 3.4% 3.8%
34% to 66% 7.7% 11.9%
67% to 99% 68.7% 70.9%
100% 18.9% 12.1%
AVERAGE (including 0): 85.0% 81.8%
Q12c. Approximately what percentage of
your organization’s payroll is delivered by paycard?
0% 86.2% 90.5%
1% to 33% 13.5% 9.3%
34% to 66% 0.3% 0.2%
67% to 99% 0.0% 0.0%
100% 0.0% 0.0%
AVERAGE (including 0): 1.2% 0.8%
Q12d. Approximately what percentage of
your organization’s payroll is delivered by other?
0% 99.0% 99.4%
1% to 33% 0.3% 0.6%
34% to 66% 0.3% 0.0%
67% to 99% 0.3% 0.0%
100% 0.0% 0.0%
AVERAGE (including 0): 0.4% 0.1%
� The proportion not delivering any of their payroll by paper paycheck was up significantly in
2011 (22.6%), compared to 2009 (13.9%).
� The proportion delivering 100% of their payroll by direct deposit was also up significantly in
2011 (18.9%), compared to 2009 (12.1%).
� On average, 85.0% of payroll was delivered by direct deposit in 2011 vs. 81.8% in 2009.

2011 Survey of Salaries and the Payroll Profession 37
Delivery Method for Paystubs
2011 2009
Q13a. Approximately what percentage of
your organization’s paystubs are delivered by e-mail?
0% 90.4% 95.3%
1% to 33% 3.8% 1.8%
34% to 66% 1.7% 0.2%
67% to 99% 2.0% 1.8%
100% 2.0% 0.8%
AVERAGE (including 0): 5.0% 2.7%
Q13b. Approximately what percentage of
your organization’s paystubs are delivered by online posting?
0% 45.1% 56.6%
1% to 33% 5.1% 9.2%
34% to 66% 6.1% 3.9%
67% to 99% 18.8% 11.0%
100% 24.9% 19.3%
AVERAGE (including 0): 46.2% 32.2%
Q13c. Approximately what percentage of
your organization’s paystubs are delivered by paper paystub?
0% 23.5% 14.3%
1% to 33% 22.5% 14.9%
34% to 66% 8.9% 4.5%
67% to 99% 7.5% 11.6%
100% 37.5% 54.8%
AVERAGE (including 0): 50.3% 69.0%
Q13d. Approximately what percentage of
your organization’s paystubs are delivered by other?
0% 98.3% 98.4%
1% to 33% 0.7% 1.0%
34% to 66% 0.0% 0.2%
67% to 99% 0.3% 0.2%
100% 0.7% 0.2%
AVERAGE (including 0): 1.1% 0.5%
� The proportion delivering 100% of paystubs by paper was down significantly in 2011 (37.5%),
compared to 2009 (54.8%).
� Focusing on 2011, an average of 50.3% of paystubs were delivered by paper and 46.2% were
delivered by online posting. (Note that it was possible for the same employees to have their
paystubs delivered in more than one way, although this was not common.)
2011 Survey of Salaries and the Payroll Profession 38
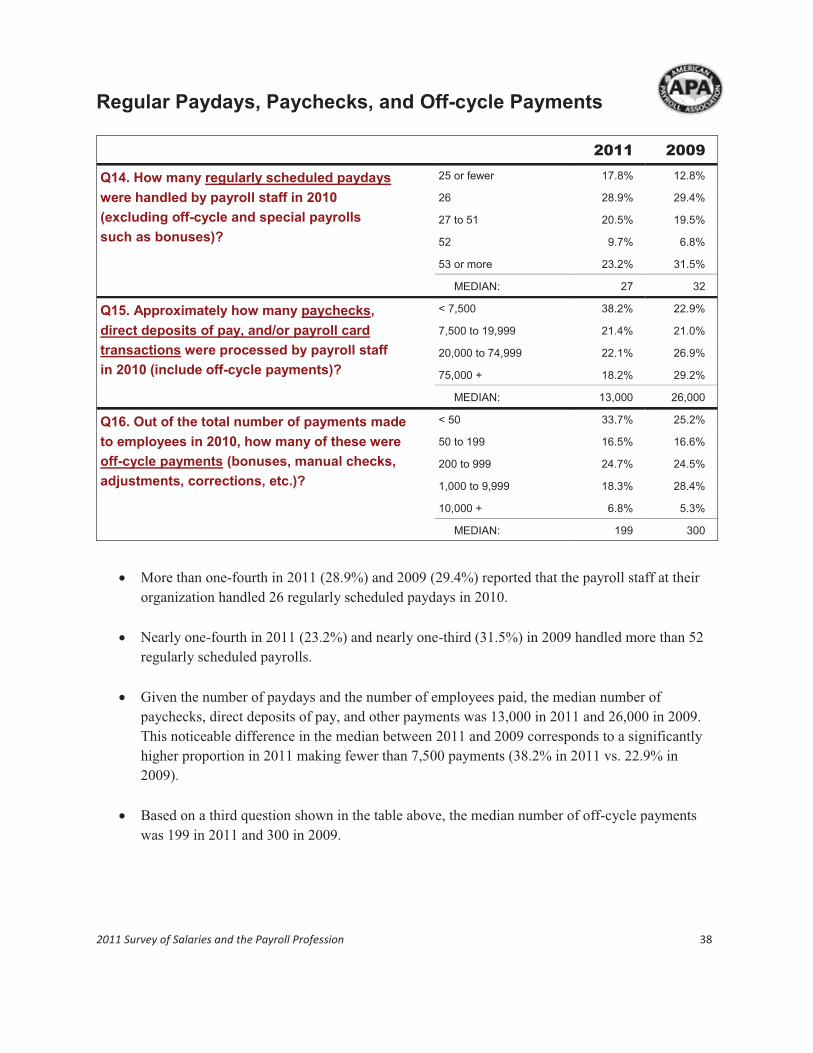
Regular Paydays, Paychecks, and Off-cycle Payments
2011 2009
Q14. How many regularly scheduled paydays
were handled by payroll staff in 2010
(excluding off-cycle and special payrolls
such as bonuses)?
25 or fewer 17.8% 12.8%
26 28.9% 29.4%
27 to 51 20.5% 19.5%
52 9.7% 6.8%
53 or more 23.2% 31.5%
MEDIAN: 27 32
Q15. Approximately how many paychecks,
direct deposits of pay, and/or payroll card
transactions were processed by payroll staff
in 2010 (include off-cycle payments)?
< 7,500 38.2% 22.9%
7,500 to 19,999 21.4% 21.0%
20,000 to 74,999 22.1% 26.9%
75,000 + 18.2% 29.2%
MEDIAN: 13,000 26,000
Q16. Out of the total number of payments made
to employees in 2010, how many of these were
off-cycle payments (bonuses, manual checks,
adjustments, corrections, etc.)?
< 50 33.7% 25.2%
50 to 199 16.5% 16.6%
200 to 999 24.7% 24.5%
1,000 to 9,999 18.3% 28.4%
10,000 + 6.8% 5.3%
MEDIAN: 199 300
� More than one-fourth in 2011 (28.9%) and 2009 (29.4%) reported that the payroll staff at their
organization handled 26 regularly scheduled paydays in 2010.
� Nearly one-fourth in 2011 (23.2%) and nearly one-third (31.5%) in 2009 handled more than 52
regularly scheduled payrolls.
� Given the number of paydays and the number of employees paid, the median number of
paychecks, direct deposits of pay, and other payments was 13,000 in 2011 and 26,000 in 2009.
This noticeable difference in the median between 2011 and 2009 corresponds to a significantly
higher proportion in 2011 making fewer than 7,500 payments (38.2% in 2011 vs. 22.9% in
2009).
� Based on a third question shown in the table above, the median number of off-cycle payments
was 199 in 2011 and 300 in 2009.
2011 Survey of Salaries and the Payroll Profession 39
Payroll Operating Budget
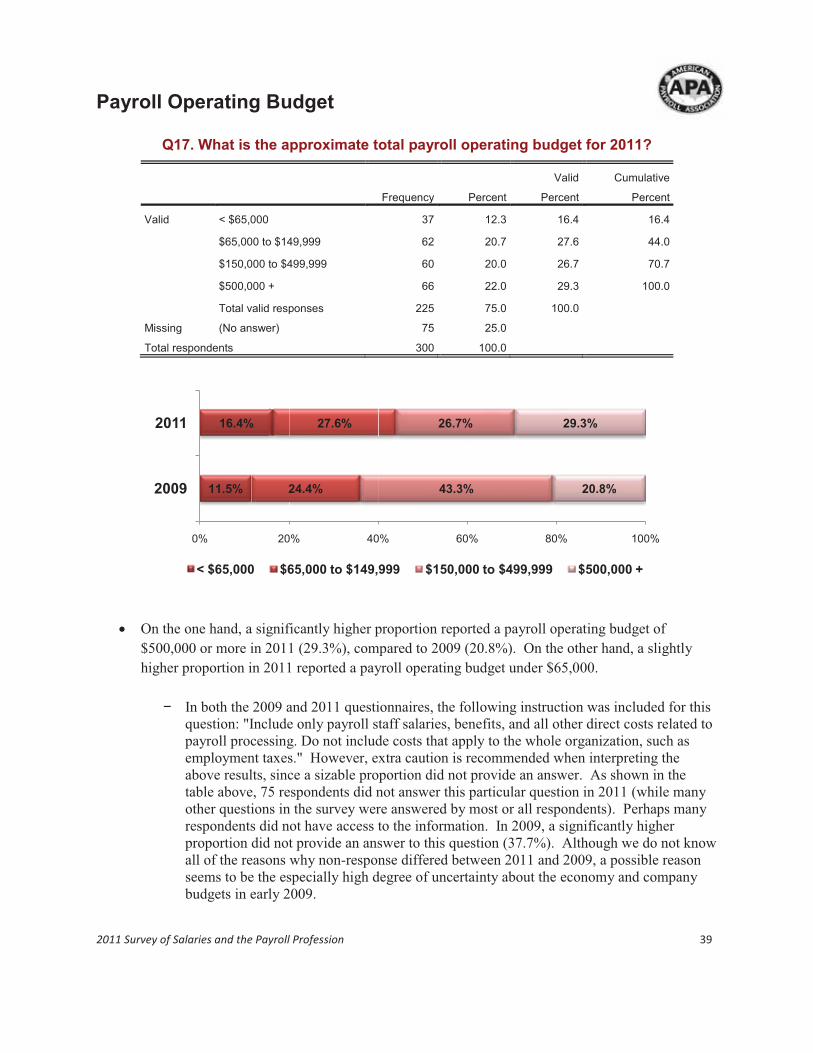
Q17. What is the approximate total payroll operating budget for 2011?
Frequency Percent
Valid
Percent
Cumulative
Percent
Valid < $65,000 37 12.3 16.4 16.4
$65,000 to $149,999 62 20.7 27.6 44.0
$150,000 to $499,999 60 20.0 26.7 70.7
$500,000 + 66 22.0 29.3 100.0
Total valid responses 225 75.0 100.0
Missing (No answer) 75 25.0
Total respondents 300 100.0
� On the one hand, a significantly higher proportion reported a payroll operating budget of
$500,000 or more in 2011 (29.3%), compared to 2009 (20.8%). On the other hand, a slightly
higher proportion in 2011 reported a payroll operating budget under $65,000.
− In both the 2009 and 2011 questionnaires, the following instruction was included for this question: "Include only payroll staff salaries, benefits, and all other direct costs related to payroll processing. Do not include costs that apply to the whole organization, such as employment taxes." However, extra caution is recommended when interpreting the above results, since a sizable proportion did not provide an answer. As shown in the table above, 75 respondents did not answer this particular question in 2011 (while many other questions in the survey were answered by most or all respondents). Perhaps many respondents did not have access to the information. In 2009, a significantly higher proportion did not provide an answer to this question (37.7%). Although we do not know all of the reasons why non-response differed between 2011 and 2009, a possible reason seems to be the especially high degree of uncertainty about the economy and company budgets in early 2009.
11.5%
16.4%
24.4%
27.6%
43.3%
26.7%
20.8%
29.3%
0% 20% 40% 60% 80% 100%
2009
2011
< $65,000 $65,000 to $149,999 $150,000 to $499,999 $500,000 +

2011 Survey of Salaries and the Payroll Profession 40
Number of W-2s Issued for Past Year
Q18. Approximately how many W-2s did your organization issue for
calendar year 2010?
Frequency Percent
Valid
Percent
Cumulative
Percent
Valid < 500 118 39.3 42.3 42.3
500 to 1,499 63 21.0 22.6 64.9
1,500 to 4,999 48 16.0 17.2 82.1
5,000 to 9,999 25 8.3 9.0 91.0
10,000 + 25 8.3 9.0 100.0
Total responses 279 93.0 100.0
Missing (No answer) 21 7.0
Total respondents 300 100.0
� Slightly more than four-in-ten (42.3%) in 2011 reported issuing fewer than 500 W-2s for
calendar year 2010. In the 2009 survey, a significantly lower proportion (28.3%) reported
issuing fewer than 500 W-2s for calendar year 2008.
� On the other end of the spectrum, 9.0% in 2011 and 12.3% in 2009 issued 10,000 or more W-2s.
� The median number of W-2s issued was 625 in the 2011 survey and 1,431 in the 2009 survey.
� In a separate question, respondents were asked how many W-2s were delivered to employees
electronically. A strong majority (73.1%) in 2011 reported that none of their W-2s were
delivered electronically. However, this is significantly lower than in 2009, when 83.5%
indicated that none of their W-2s were delivered electronically. Said another way, the proportion
issuing at least some W-2s electronically increased significantly from 16.5% in the 2009 survey
to 26.9% in the 2011 survey.
28.3%
42.3%
22.5%
22.6%
26.3%
17.2%
10.6%
9.0%
12.3%
9.0%
0% 20% 40% 60% 80% 100%
2009
2011
< 500 500 to 1,499 1,500 to 4,999 5,000 to 9,999 10,000 +

2011 Survey of Salaries and the Payroll Profession 41
Number of U.S. States in Which Pay Unemployment Tax
Q20. In how many U.S. states or territories (including Washington,
D.C., Puerto Rico, U.S. Virgin Islands, and Trust Territories) does your
organization pay state unemployment taxes?
Frequency Percent Valid Percent
Cumulative
Percent
Valid None 17 5.7 5.8 5.8
1 99 33.0 33.7 39.5
2 to 4 48 16.0 16.3 55.8
5 to 19 71 23.7 24.1 79.9
20 + 59 19.7 20.1 100.0
Total valid responses 294 98.0 100.0
Missing (No answer) 6 2.0
Total respondents 300 100.0
� Approximately one-third each year (33.7% in 2011 and 32.4% in 2009) reported that their
organization pays state unemployment taxes in one state.
� On the other end of the spectrum, 20.1% in 2011 and 26.1% in 2009 were paying unemployment
taxes in 20 or more states.
� The median number of states was 3 in 2011 and 4 in 2009. The average number of states was 10
in 2011 and 14 in 2009.
6.4%
5.8%
32.4%
33.7%
13.9%
16.3%
21.2%
24.1%
26.1%
20.1%
0% 20% 40% 60% 80% 100%
2009
2011
None 1 2 to 4 5 to 19 20 +

2011 Survey of Salaries and the Payroll Profession 42
Involvement with Countries Outside the U.S.
2011 2009
Q21. In how many foreign countries does
your organization pay expatriate
employees?
None 84.2% 80.8%
1 to 4 11.4% 14.2%
5 or more 4.4% 5.0%
MEDIAN (IF > 0): 3 countries 3 countries
Q22. How many expatriate employees
does your organization pay?
None 83.5% 78.9%
1 to 9 9.1% 12.1%
10 or more 7.4% 9.0%
MEDIAN (IF > 0): 6 employees 6 employees
Q23. In how many foreign countries does
your organization pay local national
employees?
None 86.2% 87.3%
1 to 4 10.8% 7.8%
5 or more 3.0% 4.9%
MEDIAN (IF > 0): 2 countries 2 countries
Q24. How many local national employees
does your organization pay?
None 82.3% 86.0%
1 to 9 4.0% 5.1%
10 or more 13.7% 8.9%
MEDIAN (IF > 0): 100 employees 25 employees
Q26. How many nonresident alien
employees in the U.S. does your
organization pay?
None 72.3% 67.4%
1 to 9 14.4% 14.6%
10 or more 13.3% 18.0%
MEDIAN (IF > 0): 8 employees 10 employees
� The table above summarizes the results from five questions in the survey that each in some way
involve countries outside the U.S. For example, Q21 asks about the number of foreign countries
and Q22 asks about the number of expatriate employees paid in those countries. Q23 and Q24
ask about the countries and number of local national employees paid in those countries.
Although Q26 involves workers in the U.S., these employees are nonresident aliens.
� The median values shown for each question are based only on the non-zero responses. For
example, the median in Q21 of 3 countries is based only on those who pay expatriate employees
in a foreign country. The median calculation does not include the 84.2% in 2011 and 80.8% in
2009 not paying expatriate employees in any foreign country.
� The proportion saying "None" to Q21 was slightly higher than in Q22, and the proportion saying
"None" in Q23 was slightly higher than in Q24. This suggests that there may have been some
confusion among a small number of respondents about how to interpret these questions.
2011 Survey of Salaries and the Payroll Profession 43
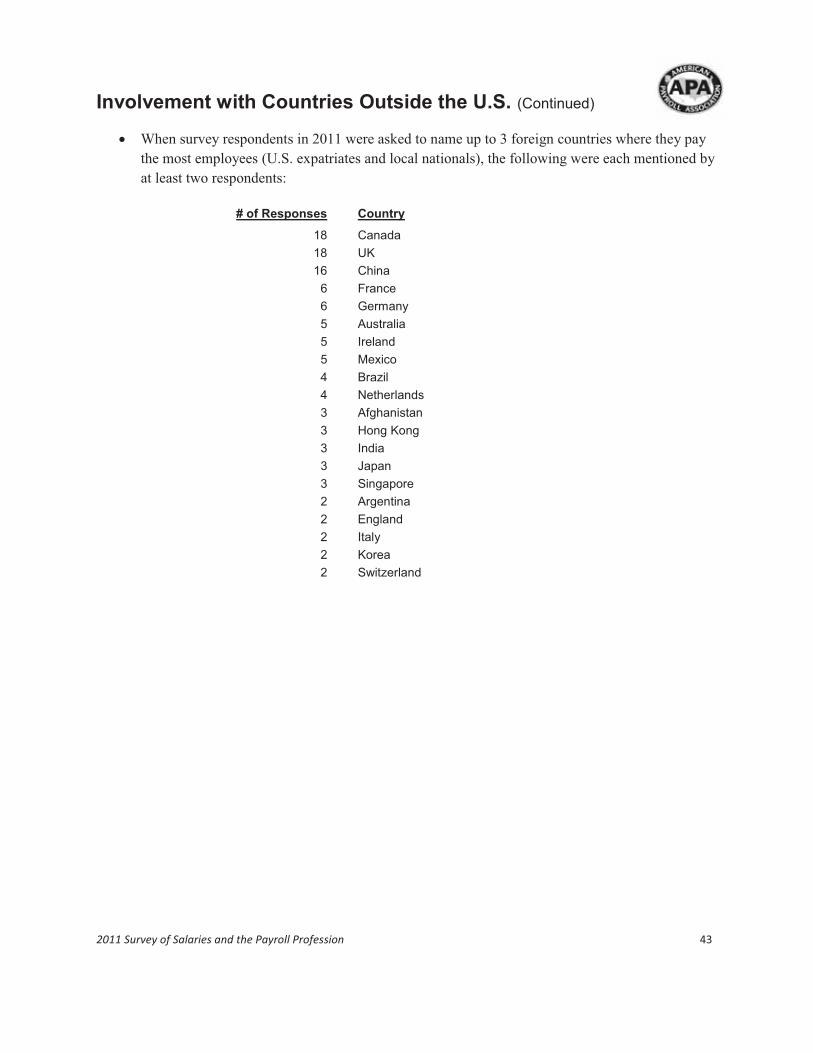
Involvement with Countries Outside the U.S. (Continued)
� When survey respondents in 2011 were asked to name up to 3 foreign countries where they pay
the most employees (U.S. expatriates and local nationals), the following were each mentioned by
at least two respondents:
# of Responses
Country
18 Canada
18 UK
16 China
6 France
6 Germany
5 Australia
5 Ireland
5 Mexico
4 Brazil
4 Netherlands
3 Afghanistan
3 Hong Kong
3 India
3 Japan
3 Singapore
2 Argentina
2 England
2 Italy
2 Korea
2 Switzerland

2011 Survey of Salaries and the Payroll Profession 44
Reporting Time Manually vs. Automated Method
2011 2009
Q27a. What percentage of
nonexempt employees report
their time manually (for
example, on a time sheet)?
0% 43.1% 40.7%
1% to 33% 20.8% 23.0%
34% to 66% 4.5% 3.6%
67% to 99% 4.8% 4.6%
100% 26.8% 28.1%
AVERAGE (including 0): 35.1% 35.6%
Q27b. What percentage of
nonexempt employees report
their time via an automated
method?
0% 26.8% 28.1%
1% to 33% 4.8% 4.6%
34% to 66% 4.5% 3.6%
67% to 99% 20.8% 23.0%
100% 43.1% 40.7%
AVERAGE (including 0): 64.9% 64.4%
Q28. Which automated methods
are used by nonexempt
employees to report their
time? (Among only those using
automated method)
Web-based input 72.4% 57.5%
Badge reader 39.1% 37.8%
Biometric device (hand reader; optical scan) 13.0% 14.2%
Interactive voice response (telephone) 3.6% 3.5%
Other 15.1% 18.0%
� Slightly more than four-in-ten reported that none of the nonexempt employees at their
organization report their time manually (43.1% in 2011 and 40.7% in 2009).
� Slightly more than one-fourth in 2011 (26.8%) and 2009 (28.1%) reported that all of the
nonexempt employees report their time manually.
� On average, nearly two-thirds (64.9% in 2011 and 64.4% in 2009) use an automated method to
report their time.
� Among those using automated methods to report time, a significantly higher proportion in 2011
(72.4%), compared to 2009 (57.5%), reported using web-based input.
� Also, "Badge readers" were used by more than one-third of the organizations that use automated
methods for recording time.

2011 Survey of Salaries and the Payroll Profession 45
VI. Payroll Department Functions

2011 Survey of Salaries and the Payroll Profession 46
Functions Performed by Payroll Staff
� The table below shows the proportion selecting each of 33 possible items when asked which
functions are performed by their organization's payroll staff. The items are sorted in descending
order, with the items most often selected in 2011 shown toward the top.
2011 2009
Q29. Which functions are
performed by your
organization’s payroll staff?
W-2 reprints 90.3% 94.5%
Employee inquiries 89.9% 90.9%
Employee time processing 82.2% 83.9%
Year-end and period-end closing 80.9% 83.3%
Time and attendance 80.2% 79.5%
Check distribution 79.5% 81.5%
Deduction processing 78.2% 84.3%
Payroll accounting 74.2% 71.7%
Payroll tax disbursement / reporting 65.8% 73.8%
Federal tax filing 63.8% 62.8%
General ledger interface 63.4% 68.1%
State and local tax filing 60.1% 61.4%
Employee data management 60.1% 58.9%
Ad hoc reports 56.7% 62.0%
Employee services 54.7% 52.4%
General ledger reconciliation 48.3% 50.6%
Document management 41.9% 44.3%
Personnel records administration 38.3% 37.2%
Expense reimbursements 35.6% n/a
IT liaison and testing 33.6% 42.7%
Training and development 32.2% 40.2%
Workers’ compensation plan 32.2% 29.3%
Sarbanes-Oxley compliance 31.9% 36.2%
Bank account reconciliation 29.2% 26.6%
Benefits program administration 27.2% 24.0%
Labor and cost accounting 25.2% 24.8%
Accounts payable 22.8% 14.4%
Benefits program management 22.1% 18.7%
Salary budgeting 22.1% 17.3%
Control validation 17.1% 34.6%
Compensation program management 13.1% 13.8%
Independent contractor payments 12.4% 8.3%
Other 5.4% 6.7%
� The results for most items were similar in 2011 and 2009. A noticeable exception was "Control
validation," selected much less often in 2011. Some other exceptions with smaller but still
significant declines in 2011 were payroll tax disbursement / reporting, IT liaison and testing, and
training and development, while a significantly higher proportion selected accounts payable.

2011 Survey of Salaries and the Payroll Profession 47
Other Types of Payments Through Payroll
2011 2009
Q30. Which types of
payments, other than wage
and salary payments, are
made to employees
through the payroll
system?
Relocation (moving) expenses 60.3% 61.8%
Commission payments 48.7% 51.0%
Tuition reimbursements 36.6% 47.2%
Business expense reimbursements 35.7% 30.0%
Travel reimbursements 35.3% 29.7%
Stock purchase sales 16.1% 22.3%
Pension payments 11.6% 15.4%
Petty cash 3.1% 2.3%
Other 13.4% 13.1%
� In both years, more than half reported relocation expenses are paid through the payroll system,
while approximately half reported making commission payments through the payroll system.
� The proportion making tuition reimbursements through the payroll system was significantly
lower in 2011 (36.6%), compared to 2009 (47.2%).
� Some extra caution is recommended when interpreting the above results, however, as 25.3% in
2011 and 22.1% in 2009 did not answer this question.

2011 Survey of Salaries and the Payroll Profession 48
Collect Fee for Replacement W-2s
Q31. Does your organization collect a fee from employees who request
a replacement Form W-2?
Frequency Percent
Valid
Percent
Cumulative
Percent
Valid Yes 29 9.7 9.8 9.8
No 268 89.3 90.2 100.0
Total valid responses 297 99.0 100.0
Missing (No answer) 3 1.0
Total respondents 300 100.0
� Approximately one-in-ten reported that their organization collects a fee for employees who
request a replacement Form W-2.
� When those who charge a fee were asked what fee is charged for a replacement W-2, the answers
ranged from $5 to $25. The median fee was $10.
9.5%
9.8%
90.5%
90.2%
0% 20% 40% 60% 80% 100%
2009
2011
Yes No

2011 Survey of Salaries and the Payroll Profession 49
Payroll Deductions Required
2011 2009
Q32a. Approximately what percentage of
your organization’s employees require child support orders?
0% / None reported 17.0% 17.6%
Greater than 0%, up to 1% 25.7% 24.2%
More than 1%, up to 3% 20.0% 23.8%
More than 3%, up to 10% 27.0% 26.1%
More than 10% 10.3% 8.4%
Q32b. Approximately what percentage of
your organization’s employees require student loan garnishments?
0% / None reported 50.0% 49.9%
Greater than 0%, up to 1% 37.0% 36.9%
More than 1%, up to 3% 7.3% 8.6%
More than 3% 5.7% 4.6%
Q32c. Approximately what percentage of
your organization’s employees require state tax levies?
0% / None reported 60.7% 62.1%
Greater than 0%, up to 1% 27.7% 28.3%
More than 1%, up to 3% 5.0% 6.6%
More than 3% 6.7% 3.0%
Q32d. Approximately what percentage of
your organization’s employees require federal tax levies?
0% / None reported 41.3% 40.7%
Greater than 0%, up to 1% 42.3% 41.5%
More than 1%, up to 3% 9.0% 12.6%
More than 3% 7.3% 5.2%
Q32e. Approximately what percentage of
your organization’s employees require creditor garnishments?
0% / None reported 44.0% 40.1%
Greater than 0%, up to 1% 27.7% 35.1%
More than 1%, up to 3% 14.3% 13.6%
More than 3% 14.0% 11.2%
Q32f. Approximately what percentage of
your organization’s employees require bankruptcy orders?
0% / None reported 54.0% 57.1%
Greater than 0%, up to 1% 32.0% 32.3%
More than 1%, up to 3% 9.0% 7.8%
More than 3% 5.0% 2.8%
� The questions above may have been difficult for some respondents to answer, given comments
written on some questionnaires. For example, some answered "> 1" or "< 1" or "< 5" or "> 2" or
"1-5" or another description that suggested the respondent was not able to provide a precise
answer. For this reason, the responses were grouped into a small number of categories in the
table above. For example, 25.7% of the respondents in 2011 and 24.2% of the respondents in
2009 indicated that somewhere between .001% and 1% of the employees in their organization
require child support orders. On the high end, 10.3% of the respondents in 2011 and 8.4% of the
respondents in 2009 reported that more than 10% of employees required child support orders.

2011 Survey of Salaries and the Payroll Profession 50
Number of Garnishments
Q33. Approximately how many garnishment payments of all types (both by
check and electronic payments) did your organization make in 2010?
Frequency Percent
Valid
Percent
Cumulative
Percent
Valid 0 21 7.0 7.5 7.5
1 to 99 78 26.0 27.9 35.4
100 to 349 62 20.7 22.1 57.5
350 to 1,249 56 18.7 20.0 77.5
1,250 or more 63 21.0 22.5 100.0
Total valid responses 280 93.3 100.0
Missing (No answer) 20 6.7
Total respondents 300 100.0
� More than one-fourth in 2011 (27.9%) and approximately one-fourth in 2009 (24.6%) reported
that their organization made between 1 and 99 garnishments in the prior full year.
� On the high end, more than one-fifth (22.5%) in 2011 reported that 1,250 or more garnishments
were made during 2010, while a significantly higher proportion in 2009 (29.2%) reported that
1,250 or more garnishments were made during 2008.
� In a separate question, the proportion collecting an administrative free from employees whose
earnings are subject to withholding for child support was 15.0% in 2011, while 10.7% reported
collecting a fee for creditor garnishments. The corresponding results in 2009 were 19.0% and
16.1%, respectively.
5.1%
7.5%
24.6%
27.9%
16.7%
22.1%
24.4%
20.0%
29.2%
22.5%
0% 20% 40% 60% 80% 100%
2009
2011
0 1 to 99 100 to 349 350 to 1,249 1,250 or more

2011 Survey of Salaries and the Payroll Profession 51
HRIS Integration
Q35. Is your largest payroll integrated with an HRIS (Human Resource
Information System)?
Frequency Percent
Valid
Percent
Cumulative
Percent
Valid Yes 208 69.3 72.5 72.5
No 79 26.3 27.5 100.0
Total valid responses 287 95.7 100.0
Missing (No answer) 13 4.3
Total respondents 300 100.0
� Slightly less than three-fourths in 2011 (72.5%) and slightly more than three-fourths in 2009
(78.9%) indicated that their largest payroll is integrated with a Human Resource Information
System (HRIS).
� In a separate question among just those who said "Yes" to the above question, 47.8% in 2011
and 42.1% in 2009 indicated that the payroll staff at their organization maintains the HRIS (for
example, keeping benefits or personnel records up-to-date).
78.9%
72.5%
21.1%
27.5%
0% 20% 40% 60% 80% 100%
2009
2011
Yes No

2011 Survey of Salaries and the Payroll Profession 52
Employee Benefits Recordkeeping by Payroll Staff
Q36. Approximately what percentage of your organization’s employee benefits recordkeeping (with or without an HRIS)
is handled by payroll staff?
Frequency Percent
Valid
Percent
Cumulative
Percent
Valid Less than 15% 146 48.7 50.2 50.2
15% – 24% 30 10.0 10.3 60.5
25% – 49% 17 5.7 5.8 66.3
50% – 84% 21 7.0 7.2 73.5
85% or more 77 25.7 26.5 100.0
Total valid responses 291 97.0 100.0
Missing (No answer) 9 3.0
Total respondents 300 100.0
� Slightly more than half (50.2% in 2011 and 54.8% in 2009) reported that payroll staff handles
less than 15% of their organization's employee benefits recordkeeping.
� However, more than one-fourth in 2011 (26.5%) and slightly less than one-fourth in 2009
(22.4%) indicated that 85% or more of their organization's employee benefits recordkeeping is
handled by payroll staff.
54.8%
50.2%
10.4%
10.3%
6.5%
5.8%
5.9%
7.2%
22.4%
26.5%
0% 20% 40% 60% 80% 100%
2009
2011
< 15% 15% – 24% 25% – 49% 50% – 84% 85% or more

2011 Survey of Salaries and the Payroll Profession 53
Products / Services Recommended by Payroll
2011 2009
Q37. For which of the
following types of payroll-
related products/services
does someone in the
payroll department
recommend or approve
acquisitions?
Payroll processing software 55.4% 53.2%
Training 46.9% 55.9%
Outsourcing vendors (e.g., service providers) 35.0% 41.3%
Payroll processing hardware 33.7% 32.4%
Payroll cards 32.0% n/a
Unemployment insurance processing 23.1% n/a
Other 5.8% 7.3%
No one in the payroll department recommends or approves any acquisitions
29.9% 27.6%
� In both years, slightly more than half (55.4% in 2011 and 53.2% in 2009) indicated that payroll
processing software is a type of product / service that someone in the payroll department may
recommend or approve.
� "Training" was selected by roughly half, although the proportion selecting this response option in
2011 (46.9%) was significantly lower than the proportion selecting it in 2009 (55.9%).
� Two of the options in the table above have "n/a" for 2009 because these options were introduced
for the first time in the 2011 questionnaire. Interestingly, these new response options appeared
to be needed additions, as sizable proportions selected them in 2011 (32.0% and 23.1%, as
shown in the table).

2011 Survey of Salaries and the Payroll Profession 54
Payroll Processing In-House vs. Service Provider
Q38. How is your organization’s payroll processing handled?
Frequency Percent
Valid
Percent
Cumulative
Percent
Valid All in-house (company-developed system) 23 7.7 7.9 7.9
All in-house (licensed system) 122 40.7 41.9 49.8
Part in-house developed system, part by a service provider 13 4.3 4.5 54.3
Part in-house licensed system, part by a service provider 29 9.7 10.0 64.3
All by a service provider within the U.S. 100 33.3 34.4 98.6
All by a service provider outside the U.S. 4 1.3 1.4 100.0
Total valid responses 291 97.0 100.0
Missing (No answer) 9 3.0
Total respondents 300 100.0
� The mix of in-house vs. service provider handling of the organization's payroll was similar in
2011 and 2009, as shown in the chart above.
� The next section in this report covers questions that are relevant to organizations with in-house
processing (all or part in-house), while the section after that covers questions that are relevant to
organizations that outsource payroll processing (all or part) to a service provider.
53.6%
49.8%
10.5%
14.4%
35.9%
35.8%
0% 20% 40% 60% 80% 100%
2009
2011
All In-House Part In-House All Service Provider

2011 Survey of Salaries and the Payroll Profession 55
VII. In-House Payroll Processing Systems
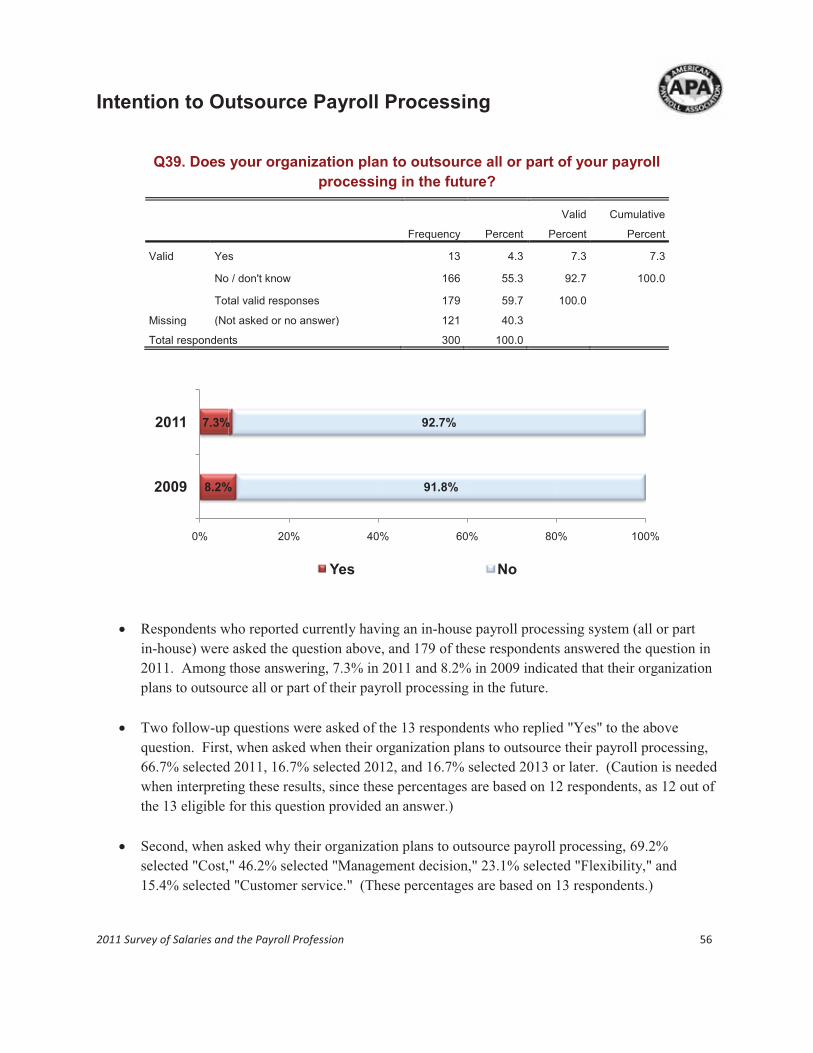
2011 Survey of Salaries and the Payroll Profession 56
Intention to Outsource Payroll Processing
Q39. Does your organization plan to outsource all or part of your payroll
processing in the future?
Frequency Percent
Valid
Percent
Cumulative
Percent
Valid Yes 13 4.3 7.3 7.3
No / don't know 166 55.3 92.7 100.0
Total valid responses 179 59.7 100.0
Missing (Not asked or no answer) 121 40.3
Total respondents 300 100.0
� Respondents who reported currently having an in-house payroll processing system (all or part
in-house) were asked the question above, and 179 of these respondents answered the question in
2011. Among those answering, 7.3% in 2011 and 8.2% in 2009 indicated that their organization
plans to outsource all or part of their payroll processing in the future.
� Two follow-up questions were asked of the 13 respondents who replied "Yes" to the above
question. First, when asked when their organization plans to outsource their payroll processing,
66.7% selected 2011, 16.7% selected 2012, and 16.7% selected 2013 or later. (Caution is needed
when interpreting these results, since these percentages are based on 12 respondents, as 12 out of
the 13 eligible for this question provided an answer.)
� Second, when asked why their organization plans to outsource payroll processing, 69.2%
selected "Cost," 46.2% selected "Management decision," 23.1% selected "Flexibility," and
15.4% selected "Customer service." (These percentages are based on 13 respondents.)
8.2%
7.3%
91.8%
92.7%
0% 20% 40% 60% 80% 100%
2009
2011
Yes No

2011 Survey of Salaries and the Payroll Profession 57
In-House Payroll Processing Software
2011 2009
Q40. When was the last time the payroll
department began using new payroll
processing software?
In the last year 10.3% 10.9%
1 to < 2 years ago 7.1% 10.9%
2 to < 5 years ago 28.3% 24.0%
5 years ago or longer 54.3% 54.2%
Q41. What was the source of the last-installed
payroll processing software?
Custom-built, in house 4.5% 5.0%
Purchased from a vendor 43.6% 41.3%
Licensed from a vendor 48.0% 47.6%
Not applicable 3.9% 6.1%
Q42. What was the approximate cost of
building/acquiring and installing this last-
installed payroll processing software?
Less than $10,000 26.7% 12.8%
$10,000 to $99,999 25.3% 37.6%
$100,000 to $749,999 30.7% 30.1%
$750,000 + 17.3% 19.5%
MEDIAN: $60,000 $87,000
Q43. Does your organization plan to purchase
new payroll-related software in the future?
Yes 24.6% 14.5%
No 75.4% 85.5%
� The above questions were asked only of those who have an in-house payroll processing system,
and each question is related to the topic of payroll processing software used in the payroll
department. For example, slightly more than half (54.3% in 2011 and 54.2% in 2010) indicated
that the last time their department began using new payroll processing software was 5 or more
years ago. Also, based on the responses to Q41, the software was typically purchased or licensed
from a vendor, as opposed to being custom built by in-house personnel.
� A higher proportion in 2011 (24.6%), compared to 2009 (14.5%), indicated that their
organization plans to purchase new payroll-related software in the future. However, the wording
in the 2009 questionnaire referred to the "next 12 months" rather than "in the future" as above.
− In a separate question, among those reporting plans to purchase new payroll-related software, 22.5% indicated that their organization plans to implement the new payroll software in 2011, while 37.5% thought 2012 was more likely, and 40.0% thought that implementation would be in 2013 or later. (However, caution is recommended when interpreting these results, as the percentages here are based on 40 respondents who both responded "Yes" to Q43 above and provided an answer to the follow-up question "When does your organization plan to implement the new payroll software?")
− In another follow-up question for those who answered "Yes" to Q43, the median was $75,000 when asked "What is the anticipated amount of the planned expense?" (However, this median amount is based on 18 respondents who answered the question.)

2011 Survey of Salaries and the Payroll Profession 58
VIII. Outsourced Payroll Processing

2011 Survey of Salaries and the Payroll Profession 59
Intention to Bring Payroll Processing In-House
Q45. Does your organization plan to bring all or part of your payroll
processing in-house in the future?
Frequency Percent
Valid
Percent
Cumulative
Percent
Valid Yes 9 3.0 7.3 7.3
No 114 38.0 92.7 100.0
Total valid responses 123 41.0 100.0
Missing (Not asked or no answer) 177 59.0
Total respondents 300 100.0
� Respondents who reported having all or part of their payroll processing handled by a service
provider were asked the question above, and 123 of these respondents answered the question in
2011. Among those answering, 7.3% in 2011 and 12.4% in 2009 indicated that their
organization plans to bring all or part of their payroll processing in-house in the future.
� Two follow-up questions were asked of the 9 respondents who replied "Yes" to the above
question. First, when asked when their organization plans to bring all or part of their payroll
processing in-house, 57.1% selected 2012, and 42.9% selected 2013 or later. (Caution is needed
when interpreting these results, since these percentages are based on only 7 respondents, as 7 out
of the 9 eligible for this question provided an answer.)
� Second, when asked why their organization plans to bring payroll processing in-house, 66.7%
selected "Cost," 55.6% selected "Flexibility," 44.4% selected "System integration," 33.3%
selected "Management decision," and 22.2% selected "Customer service." (However, these
percentages are based on 9 respondents.)
12.4%
7.3%
87.6%
92.7%
0% 20% 40% 60% 80% 100%
2009
2011
Yes No

2011 Survey of Salaries and the Payroll Profession 60
Year Began Using Service Provider
� A wide range of responses surfaced when respondents were asked which year they began using a
service provider, as shown below.
Q44. In what year did your organization begin using a
service provider?
Frequency Percent
Valid
Percent
Cumulative
Percent
Valid 1970 1 .3 .9 .9
1976 1 .3 .9 1.7
1980 4 1.3 3.5 5.2
1981 1 .3 .9 6.1
1982 2 .7 1.7 7.8
1985 7 2.3 6.1 13.9
1987 1 .3 .9 14.8
1989 1 .3 .9 15.7
1990 4 1.3 3.5 19.1
1992 1 .3 .9 20.0
1993 5 1.7 4.3 24.3
1994 1 .3 .9 25.2
1995 5 1.7 4.3 29.6
1996 1 .3 .9 30.4
1997 6 2.0 5.2 35.7
1998 6 2.0 5.2 40.9
1999 5 1.7 4.3 45.2
2000 13 4.3 11.3 56.5
2001 5 1.7 4.3 60.9
2002 5 1.7 4.3 65.2
2003 5 1.7 4.3 69.6
2004 4 1.3 3.5 73.0
2005 8 2.7 7.0 80.0
2006 6 2.0 5.2 85.2
2007 3 1.0 2.6 87.8
2008 4 1.3 3.5 91.3
2009 5 1.7 4.3 95.7
2010 5 1.7 4.3 100.0
Total 115 38.3 100.0
Missing (Not asked or no answer)
185 61.7
Total respondents 300 100.0
2011 Survey of Salaries and the Payroll Profession 61
IX. Cross-tabulations by Number of W-2s Issued for 2010

2011 Survey of Salaries and the Payroll Profession 62
� The "cross-tabulations" below are shown for readers who may be interested in
examining how the results differ by the number of W-2s an organization issued for
2010. For example, in the table below, 3.5% of the organizations that issued fewer than 500 W-
2s were in the education sector. Among organizations that issued 5,000 or more W-2s for 2010,
18.8% were in the education sector. ("NA" refers to those who did not answer the question
about W-2s.)
− Note that the total number of respondents included in each table is the number who
answered the question that is being cross-tabulated by W-2s issued. For example, the table below includes 292 respondents because that is the number of respondents who gave a valid answer to Q1.
W-2s *
Total < 500 500 - 1,499 1,500 - 4,999 5,000 + NA
Q1. Which ONE of the
following best describes your
organization?
Education Count 4 9 5 9 2 29
% within W-2s 3.5% 14.5% 10.6% 18.8% 10.0% 9.9%
Finance Count 9 8 4 3 1 25
% within W-2s 7.8% 12.9% 8.5% 6.3% 5.0% 8.6%
Government Count 15 6 3 2 2 28
% within W-2s 13.0% 9.7% 6.4% 4.2% 10.0% 9.6%
Hospitality Count 0 1 1 3 1 6
% within W-2s .0% 1.6% 2.1% 6.3% 5.0% 2.1%
Manufacturing Count 14 11 9 6 4 44
% within W-2s 12.2% 17.7% 19.1% 12.5% 20.0% 15.1%
Sales Count 2 3 1 6 0 12
% within W-2s 1.7% 4.8% 2.1% 12.5% .0% 4.1%
Services Count 29 13 13 10 4 69
% within W-2s 25.2% 21.0% 27.7% 20.8% 20.0% 23.6%
Other Industries Count 42 11 11 9 6 79
% within W-2s 36.5% 17.7% 23.4% 18.8% 30.0% 27.1%
Total Count 115 62 47 48 20 292
% within W-2s 100.0% 100.0% 100.0% 100.0% 100.0% 100.0%
* An orange asterisk indicates that there is a "statistically significant" relationship (at the 95%
confidence level) between the number of W-2s issued and the responses to the question. For tables with
the percentages giving each response, statistical significance is based on a Chi-Square test. For means,
an ANOVA test is used. For medians, a special non-parametric test (using SPSS software) is used.

2011 Survey of Salaries and the Payroll Profession 63
W-2s *
Total < 500 500 - 1,499 1,500 - 4,999 5,000 + NA
Q2. Does your payroll department
provide payroll functions at more
than one job site?
Yes Count 14 16 15 15 2 62
% within W-2s 12.2% 25.8% 31.3% 30.0% 9.5% 20.9%
No Count 101 46 33 35 19 234
% within W-2s 87.8% 74.2% 68.8% 70.0% 90.5% 79.1%
Total Count 115 62 48 50 21 296
% within W-2s 100.0% 100.0% 100.0% 100.0% 100.0% 100.0%
W-2s *
Total < 500 500 - 1,499 1,500 - 4,999 5,000 + NA
Q3. How many people are
employed full-time in your
payroll department?
0 Count 4 1 0 0 0 5
% within W-2s 3.4% 1.6% .0% .0% .0% 1.7%
1 Count 97 26 5 0 11 139
% within W-2s 82.2% 41.3% 10.4% .0% 52.4% 46.3%
2 to 3 Count 16 32 23 6 4 81
% within W-2s 13.6% 50.8% 47.9% 12.0% 19.0% 27.0%
4 to 5 Count 1 1 14 7 2 25
% within W-2s .8% 1.6% 29.2% 14.0% 9.5% 8.3%
6 or more Count 0 3 6 37 4 50
% within W-2s .0% 4.8% 12.5% 74.0% 19.0% 16.7%
Total Count 118 63 48 50 21 300
% within W-2s 100.0% 100.0% 100.0% 100.0% 100.0% 100.0%
* The above table provides a good example of what is meant by a "statistically significant" relationship between the number of W-2s issued and the responses to the question. Note that the proportion with 6 or more full-time employees in the payroll department goes from 0% among those issuing < 500 W-2s to 4.8% among those issuing 500 to 1,499 W-2s to 12.5% among those issuing 1,500 to 4,999 W-2s to 74.0% among those issuing 5,000 or more W-2s. These results, and other results in the table above, show a tendency to have more full-time payroll staff as the number of W-2s issued gets larger. The orange asterisk indicates that this apparent relationship is not likely to be due to chance alone (i.e., "sampling error"). In other words, the orange asterisk indicates that the survey data is providing enough evidence to conclude with reasonable confidence that there is a relationship between the number of W-2s issued and the pattern of response to the question.

2011 Survey of Salaries and the Payroll Profession 64
� For some questions, it is reasonable to show the median or mean (average) by the number of
W-2s issued, as shown below. For example, in the table below, the median number of full-time
employees in the payroll department was 8 among organizations that issued 5,000 or more W-2s.
Median
W-2s Q3. How many
people are employed
full-time in your
payroll department?
*
< 500 1.00
500 - 1,499 2.00
1,500 - 4,999 3.00
5,000 + 8.00
NA 1.00
Total 2.00
W-2s
Total < 500 500 - 1,499 1,500 - 4,999 5,000 + NA
Q3. How many people are
employed part-time in your
payroll department? (Convert
part-time employees to full-
time equivalents - FTE)
0 / None reported Count 99 53 42 44 17 255
% within W-2s 83.9% 84.1% 87.5% 88.0% 81.0% 85.0%
0.1 to 1 Count 17 8 4 5 3 37
% within W-2s 14.4% 12.7% 8.3% 10.0% 14.3% 12.3%
2 to 3 Count 0 2 2 1 0 5
% within W-2s .0% 3.2% 4.2% 2.0% .0% 1.7%
4 or more Count 2 0 0 0 1 3
% within W-2s 1.7% .0% .0% .0% 4.8% 1.0%
Total Count 118 63 48 50 21 300
% within W-2s 100.0% 100.0% 100.0% 100.0% 100.0% 100.0%

2011 Survey of Salaries and the Payroll Profession 65
W-2s *
Total < 500 500 - 1,499 1,500 - 4,999 5,000 + NA
Q4: The highest level of
education completed is high
school or less for at least one full-
time employee in the payroll
department
No Count 74 37 7 4 7 129
% within W-2s 69.2% 60.7% 15.6% 8.7% 35.0% 46.2%
Yes Count 33 24 38 42 13 150
% within W-2s 30.8% 39.3% 84.4% 91.3% 65.0% 53.8%
Total Count 107 61 45 46 20 279
% within W-2s 100.0% 100.0% 100.0% 100.0% 100.0% 100.0%
W-2s *
Total < 500 500 - 1,499 1,500 - 4,999 5,000 + NA
Q4: The highest level of
education completed is an
Associate's degree for at least
one full-time employee in the
payroll department
No Count 70 40 27 18 14 169
% within W-2s 65.4% 65.6% 60.0% 39.1% 70.0% 60.6%
Yes Count 37 21 18 28 6 110
% within W-2s 34.6% 34.4% 40.0% 60.9% 30.0% 39.4%
Total Count 107 61 45 46 20 279
% within W-2s 100.0% 100.0% 100.0% 100.0% 100.0% 100.0%
W-2s *
Total < 500 500 - 1,499 1,500 - 4,999 5,000 + NA
Q4: The highest level of
education completed is a
Bachelor's degree for at least one
full-time employee in the payroll
department
No Count 63 29 17 7 7 123
% within W-2s 58.9% 47.5% 37.8% 15.2% 35.0% 44.1%
Yes Count 44 32 28 39 13 156
% within W-2s 41.1% 52.5% 62.2% 84.8% 65.0% 55.9%
Total Count 107 61 45 46 20 279
% within W-2s 100.0% 100.0% 100.0% 100.0% 100.0% 100.0%
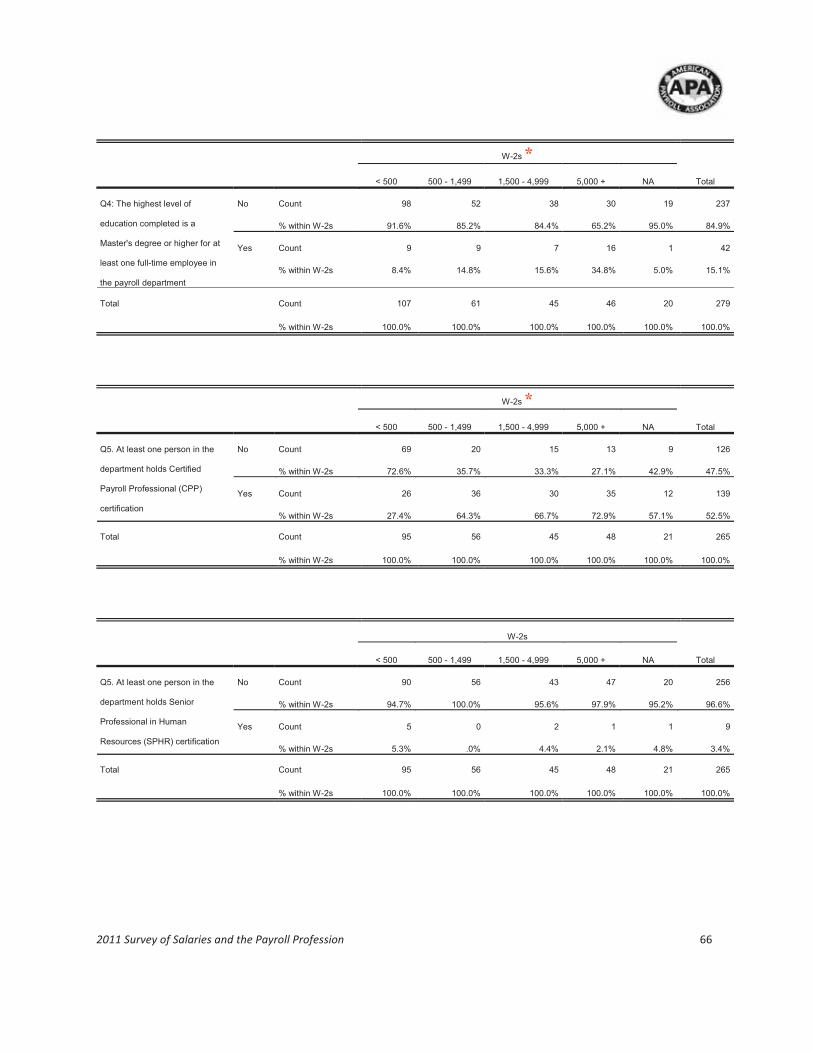
2011 Survey of Salaries and the Payroll Profession 66
W-2s *
Total < 500 500 - 1,499 1,500 - 4,999 5,000 + NA
Q4: The highest level of
education completed is a
Master's degree or higher for at
least one full-time employee in
the payroll department
No Count 98 52 38 30 19 237
% within W-2s 91.6% 85.2% 84.4% 65.2% 95.0% 84.9%
Yes Count 9 9 7 16 1 42
% within W-2s 8.4% 14.8% 15.6% 34.8% 5.0% 15.1%
Total Count 107 61 45 46 20 279
% within W-2s 100.0% 100.0% 100.0% 100.0% 100.0% 100.0%
W-2s *
Total < 500 500 - 1,499 1,500 - 4,999 5,000 + NA
Q5. At least one person in the
department holds Certified
Payroll Professional (CPP)
certification
No Count 69 20 15 13 9 126
% within W-2s 72.6% 35.7% 33.3% 27.1% 42.9% 47.5%
Yes Count 26 36 30 35 12 139
% within W-2s 27.4% 64.3% 66.7% 72.9% 57.1% 52.5%
Total Count 95 56 45 48 21 265
% within W-2s 100.0% 100.0% 100.0% 100.0% 100.0% 100.0%
W-2s
Total < 500 500 - 1,499 1,500 - 4,999 5,000 + NA
Q5. At least one person in the
department holds Senior
Professional in Human
Resources (SPHR) certification
No Count 90 56 43 47 20 256
% within W-2s 94.7% 100.0% 95.6% 97.9% 95.2% 96.6%
Yes Count 5 0 2 1 1 9
% within W-2s 5.3% .0% 4.4% 2.1% 4.8% 3.4%
Total Count 95 56 45 48 21 265
% within W-2s 100.0% 100.0% 100.0% 100.0% 100.0% 100.0%
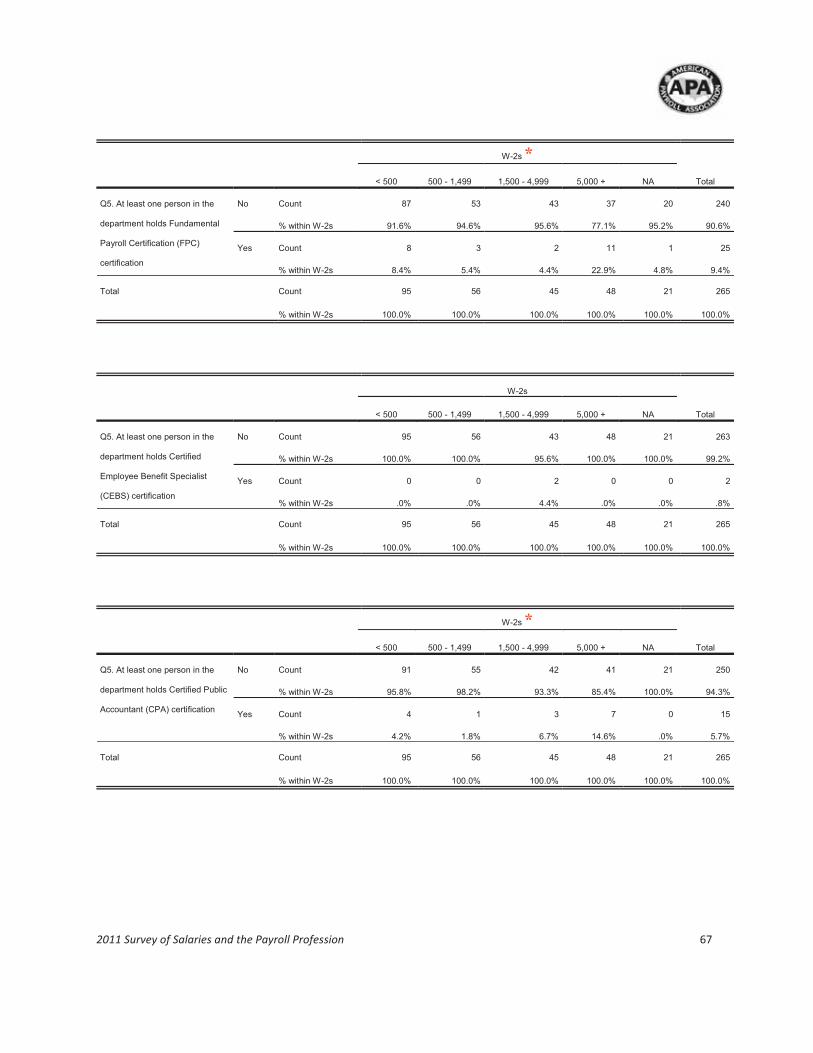
2011 Survey of Salaries and the Payroll Profession 67
W-2s *
Total < 500 500 - 1,499 1,500 - 4,999 5,000 + NA
Q5. At least one person in the
department holds Fundamental
Payroll Certification (FPC)
certification
No Count 87 53 43 37 20 240
% within W-2s 91.6% 94.6% 95.6% 77.1% 95.2% 90.6%
Yes Count 8 3 2 11 1 25
% within W-2s 8.4% 5.4% 4.4% 22.9% 4.8% 9.4%
Total Count 95 56 45 48 21 265
% within W-2s 100.0% 100.0% 100.0% 100.0% 100.0% 100.0%
W-2s
Total < 500 500 - 1,499 1,500 - 4,999 5,000 + NA
Q5. At least one person in the
department holds Certified
Employee Benefit Specialist
(CEBS) certification
No Count 95 56 43 48 21 263
% within W-2s 100.0% 100.0% 95.6% 100.0% 100.0% 99.2%
Yes Count 0 0 2 0 0 2
% within W-2s .0% .0% 4.4% .0% .0% .8%
Total Count 95 56 45 48 21 265
% within W-2s 100.0% 100.0% 100.0% 100.0% 100.0% 100.0%
W-2s *
Total < 500 500 - 1,499 1,500 - 4,999 5,000 + NA
Q5. At least one person in the
department holds Certified Public
Accountant (CPA) certification
No Count 91 55 42 41 21 250
% within W-2s 95.8% 98.2% 93.3% 85.4% 100.0% 94.3%
Yes Count 4 1 3 7 0 15
% within W-2s 4.2% 1.8% 6.7% 14.6% .0% 5.7%
Total Count 95 56 45 48 21 265
% within W-2s 100.0% 100.0% 100.0% 100.0% 100.0% 100.0%

2011 Survey of Salaries and the Payroll Profession 68
W-2s
Total < 500 500 - 1,499 1,500 - 4,999 5,000 + NA
Q5. At least one person in the
department holds Certified
Accounts Payable Professional
(CAPP) certification
No Count 94 56 45 47 21 263
% within W-2s 98.9% 100.0% 100.0% 97.9% 100.0% 99.2%
Yes Count 1 0 0 1 0 2
% within W-2s 1.1% .0% .0% 2.1% .0% .8%
Total Count 95 56 45 48 21 265
% within W-2s 100.0% 100.0% 100.0% 100.0% 100.0% 100.0%
W-2s
Total < 500 500 - 1,499 1,500 - 4,999 5,000 + NA
Q5. At least one person in the
department holds Professional in
Human Resources (PHR)
certification
No Count 91 54 44 42 19 250
% within W-2s 95.8% 96.4% 97.8% 87.5% 90.5% 94.3%
Yes Count 4 2 1 6 2 15
% within W-2s 4.2% 3.6% 2.2% 12.5% 9.5% 5.7%
Total Count 95 56 45 48 21 265
% within W-2s 100.0% 100.0% 100.0% 100.0% 100.0% 100.0%

2011 Survey of Salaries and the Payroll Profession 69
W-2s *
Total < 500 500 - 1,499 1,500 - 4,999 5,000 + NA
Q6a. On average, how many
hours of professional
development on payroll-related
issues are offered each year to
ENTRY-LEVEL payroll staff?
0 / None reported Count 107 48 30 19 18 222
% within W-2s 90.7% 76.2% 62.5% 38.0% 85.7% 74.0%
1 to 9 hours Count 1 5 0 8 1 15
% within W-2s .8% 7.9% .0% 16.0% 4.8% 5.0%
10 to 19 hours Count 4 6 5 11 1 27
% within W-2s 3.4% 9.5% 10.4% 22.0% 4.8% 9.0%
20 to 29 hours Count 3 3 5 5 0 16
% within W-2s 2.5% 4.8% 10.4% 10.0% .0% 5.3%
30 to 49 hours Count 3 1 7 7 1 19
% within W-2s 2.5% 1.6% 14.6% 14.0% 4.8% 6.3%
50 or more hours Count 0 0 1 0 0 1
% within W-2s .0% .0% 2.1% .0% .0% .3%
Total Count 118 63 48 50 21 300
% within W-2s 100.0% 100.0% 100.0% 100.0% 100.0% 100.0%
W-2s *
Total < 500 500 - 1,499 1,500 - 4,999 5,000 + NA
Q6b. On average, how many
hours of professional
development on payroll-related
issues are offered each year to
INTERMEDIATE-LEVEL
payroll staff?
0 / None reported Count 85 37 22 14 12 170
% within W-2s 72.0% 58.7% 45.8% 28.0% 57.1% 56.7%
1 to 9 hours Count 11 9 4 6 5 35
% within W-2s 9.3% 14.3% 8.3% 12.0% 23.8% 11.7%
10 to 19 hours Count 10 10 7 7 1 35
% within W-2s 8.5% 15.9% 14.6% 14.0% 4.8% 11.7%
20 to 29 hours Count 6 5 7 10 0 28
% within W-2s 5.1% 7.9% 14.6% 20.0% .0% 9.3%
30 to 49 hours Count 5 2 7 12 3 29
% within W-2s 4.2% 3.2% 14.6% 24.0% 14.3% 9.7%
50 or more hours Count 1 0 1 1 0 3
% within W-2s .8% .0% 2.1% 2.0% .0% 1.0%
Total Count 118 63 48 50 21 300
% within W-2s 100.0% 100.0% 100.0% 100.0% 100.0% 100.0%

2011 Survey of Salaries and the Payroll Profession 70
W-2s *
Total < 500 500 - 1,499 1,500 - 4,999 5,000 + NA
Q6c. On average, how many
hours of professional
development on payroll-related
issues are offered each year to
SENIOR-LEVEL payroll staff?
0 / None reported Count 59 28 15 9 10 121
% within W-2s 50.0% 44.4% 31.3% 18.0% 47.6% 40.3%
1 to 9 hours Count 19 4 2 3 2 30
% within W-2s 16.1% 6.3% 4.2% 6.0% 9.5% 10.0%
10 to 19 hours Count 11 11 4 7 2 35
% within W-2s 9.3% 17.5% 8.3% 14.0% 9.5% 11.7%
20 to 29 hours Count 11 11 10 4 4 40
% within W-2s 9.3% 17.5% 20.8% 8.0% 19.0% 13.3%
30 to 49 hours Count 14 5 12 21 3 55
% within W-2s 11.9% 7.9% 25.0% 42.0% 14.3% 18.3%
50 or more hours Count 4 4 5 6 0 19
% within W-2s 3.4% 6.3% 10.4% 12.0% .0% 6.3%
Total Count 118 63 48 50 21 300
% within W-2s 100.0% 100.0% 100.0% 100.0% 100.0% 100.0%
W-2s *
Total < 500 500 - 1,499 1,500 - 4,999 5,000 + NA
Q7. What is your budget for
training and education of
payroll staff for the current
fiscal year?
$0 Count 45 26 14 14 8 107
% within W-2s 44.6% 44.8% 35.0% 29.8% 50.0% 40.8%
$1 - $999 Count 22 7 6 0 1 36
% within W-2s 21.8% 12.1% 15.0% .0% 6.3% 13.7%
$1,000 - $1,999 Count 14 11 3 4 0 32
% within W-2s 13.9% 19.0% 7.5% 8.5% .0% 12.2%
$2,000 - $4,999 Count 15 10 5 6 5 41
% within W-2s 14.9% 17.2% 12.5% 12.8% 31.3% 15.6%
$5,000 + Count 5 4 12 23 2 46
% within W-2s 5.0% 6.9% 30.0% 48.9% 12.5% 17.6%
Total Count 101 58 40 47 16 262
% within W-2s 100.0% 100.0% 100.0% 100.0% 100.0% 100.0%
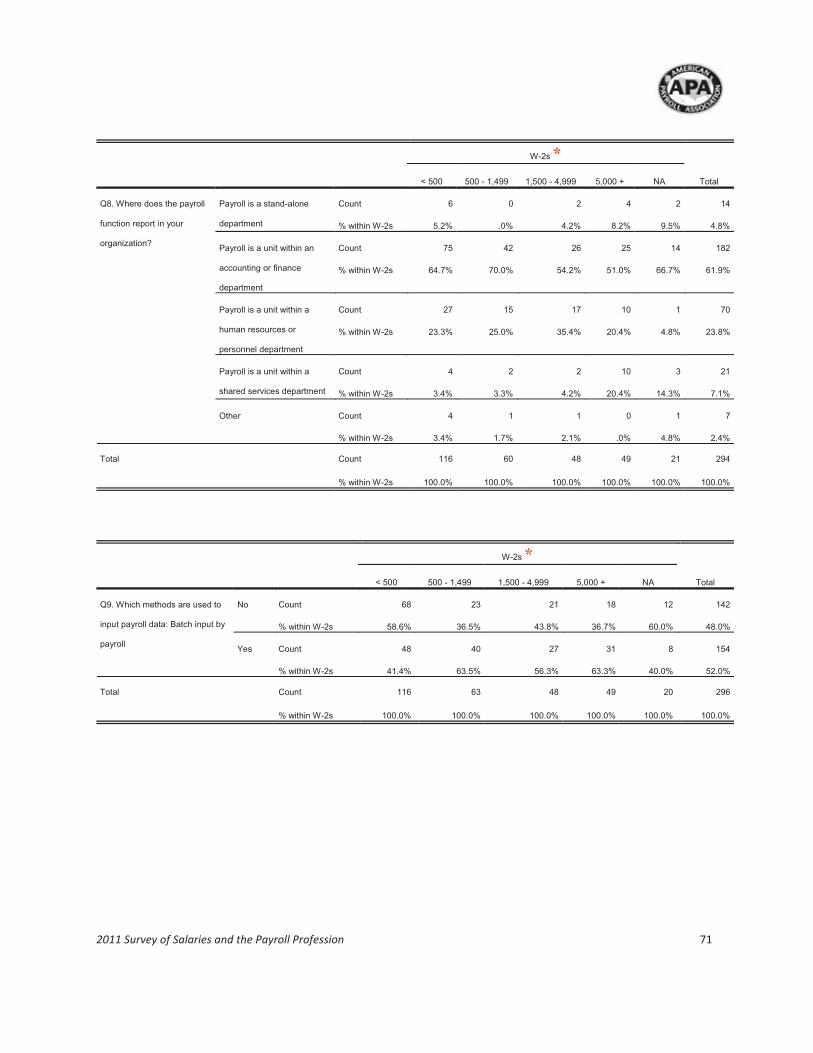
2011 Survey of Salaries and the Payroll Profession 71
W-2s *
Total < 500 500 - 1,499 1,500 - 4,999 5,000 + NA
Q8. Where does the payroll
function report in your
organization?
Payroll is a stand-alone
department
Count 6 0 2 4 2 14
% within W-2s 5.2% .0% 4.2% 8.2% 9.5% 4.8%
Payroll is a unit within an
accounting or finance
department
Count 75 42 26 25 14 182
% within W-2s 64.7% 70.0% 54.2% 51.0% 66.7% 61.9%
Payroll is a unit within a
human resources or
personnel department
Count 27 15 17 10 1 70
% within W-2s 23.3% 25.0% 35.4% 20.4% 4.8% 23.8%
Payroll is a unit within a
shared services department
Count 4 2 2 10 3 21
% within W-2s 3.4% 3.3% 4.2% 20.4% 14.3% 7.1%
Other Count 4 1 1 0 1 7
% within W-2s 3.4% 1.7% 2.1% .0% 4.8% 2.4%
Total Count 116 60 48 49 21 294
% within W-2s 100.0% 100.0% 100.0% 100.0% 100.0% 100.0%
W-2s *
Total < 500 500 - 1,499 1,500 - 4,999 5,000 + NA
Q9. Which methods are used to
input payroll data: Batch input by
payroll
No Count 68 23 21 18 12 142
% within W-2s 58.6% 36.5% 43.8% 36.7% 60.0% 48.0%
Yes Count 48 40 27 31 8 154
% within W-2s 41.4% 63.5% 56.3% 63.3% 40.0% 52.0%
Total Count 116 63 48 49 20 296
% within W-2s 100.0% 100.0% 100.0% 100.0% 100.0% 100.0%

2011 Survey of Salaries and the Payroll Profession 72
W-2s *
Total < 500 500 - 1,499 1,500 - 4,999 5,000 + NA
Q9. Which methods are used to
input payroll data: File transfers
from systems
No Count 94 40 34 19 12 199
% within W-2s 81.0% 63.5% 70.8% 38.8% 60.0% 67.2%
Yes Count 22 23 14 30 8 97
% within W-2s 19.0% 36.5% 29.2% 61.2% 40.0% 32.8%
Total Count 116 63 48 49 20 296
% within W-2s 100.0% 100.0% 100.0% 100.0% 100.0% 100.0%
W-2s *
Total < 500 500 - 1,499 1,500 - 4,999 5,000 + NA
Q9. Which methods are used to
input payroll data: Web-based
input by managers (self-service)
No Count 104 52 40 32 17 245
% within W-2s 89.7% 82.5% 83.3% 65.3% 85.0% 82.8%
Yes Count 12 11 8 17 3 51
% within W-2s 10.3% 17.5% 16.7% 34.7% 15.0% 17.2%
Total Count 116 63 48 49 20 296
% within W-2s 100.0% 100.0% 100.0% 100.0% 100.0% 100.0%
W-2s *
Total < 500 500 - 1,499 1,500 - 4,999 5,000 + NA
Q9. Which methods are used to
input payroll data: System input
by payroll
No Count 83 43 28 21 13 188
% within W-2s 71.6% 68.3% 58.3% 42.9% 65.0% 63.5%
Yes Count 33 20 20 28 7 108
% within W-2s 28.4% 31.7% 41.7% 57.1% 35.0% 36.5%
Total Count 116 63 48 49 20 296
% within W-2s 100.0% 100.0% 100.0% 100.0% 100.0% 100.0%

2011 Survey of Salaries and the Payroll Profession 73
W-2s *
Total < 500 500 - 1,499 1,500 - 4,999 5,000 + NA
Q9. Which methods are used to
input payroll data: System input
by others
No Count 113 56 39 35 16 259
% within W-2s 97.4% 88.9% 81.3% 71.4% 80.0% 87.5%
Yes Count 3 7 9 14 4 37
% within W-2s 2.6% 11.1% 18.8% 28.6% 20.0% 12.5%
Total Count 116 63 48 49 20 296
% within W-2s 100.0% 100.0% 100.0% 100.0% 100.0% 100.0%
W-2s *
Total < 500 500 - 1,499 1,500 - 4,999 5,000 + NA
Q9. Which methods are used to
input payroll data: Web-based
input by employees (self-service)
No Count 95 48 35 28 16 222
% within W-2s 81.9% 76.2% 72.9% 57.1% 80.0% 75.0%
Yes Count 21 15 13 21 4 74
% within W-2s 18.1% 23.8% 27.1% 42.9% 20.0% 25.0%
Total Count 116 63 48 49 20 296
% within W-2s 100.0% 100.0% 100.0% 100.0% 100.0% 100.0%
W-2s *
Total < 500 500 - 1,499 1,500 - 4,999 5,000 + NA
Q9. Which methods are used to
input payroll data: Batch input by
others
No Count 113 61 44 36 17 271
% within W-2s 97.4% 96.8% 91.7% 73.5% 85.0% 91.6%
Yes Count 3 2 4 13 3 25
% within W-2s 2.6% 3.2% 8.3% 26.5% 15.0% 8.4%
Total Count 116 63 48 49 20 296
% within W-2s 100.0% 100.0% 100.0% 100.0% 100.0% 100.0%
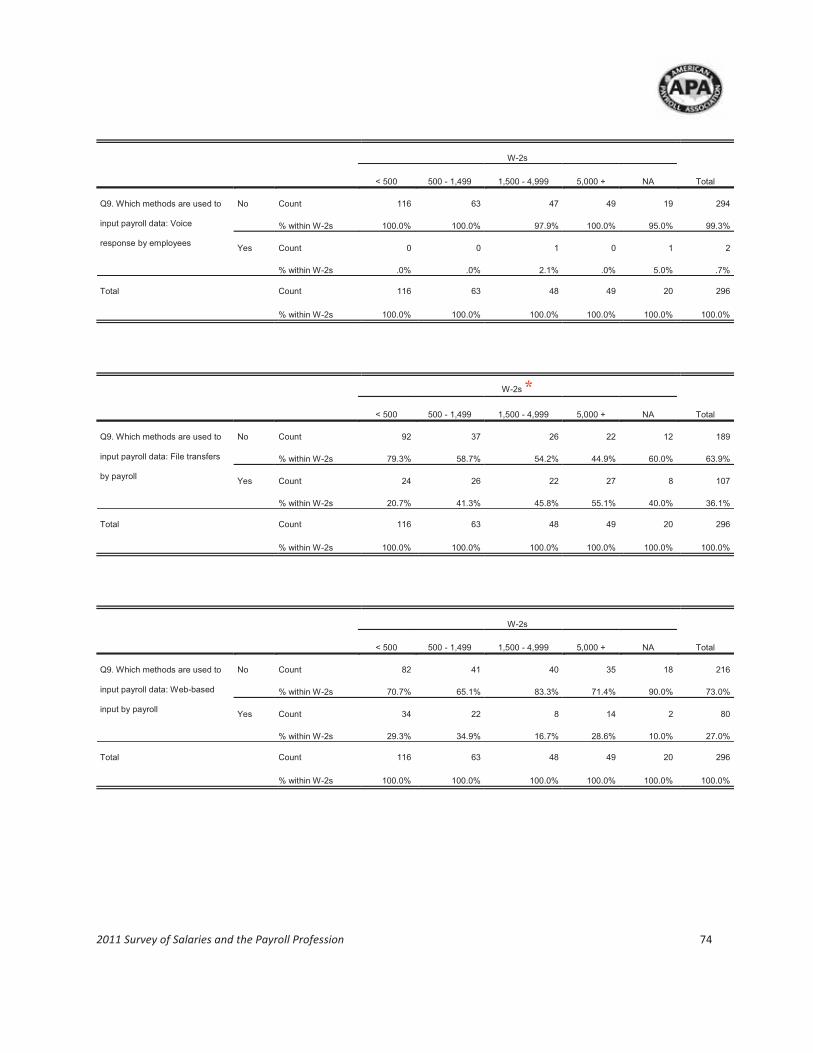
2011 Survey of Salaries and the Payroll Profession 74
W-2s
Total < 500 500 - 1,499 1,500 - 4,999 5,000 + NA
Q9. Which methods are used to
input payroll data: Voice
response by employees
No Count 116 63 47 49 19 294
% within W-2s 100.0% 100.0% 97.9% 100.0% 95.0% 99.3%
Yes Count 0 0 1 0 1 2
% within W-2s .0% .0% 2.1% .0% 5.0% .7%
Total Count 116 63 48 49 20 296
% within W-2s 100.0% 100.0% 100.0% 100.0% 100.0% 100.0%
W-2s *
Total < 500 500 - 1,499 1,500 - 4,999 5,000 + NA
Q9. Which methods are used to
input payroll data: File transfers
by payroll
No Count 92 37 26 22 12 189
% within W-2s 79.3% 58.7% 54.2% 44.9% 60.0% 63.9%
Yes Count 24 26 22 27 8 107
% within W-2s 20.7% 41.3% 45.8% 55.1% 40.0% 36.1%
Total Count 116 63 48 49 20 296
% within W-2s 100.0% 100.0% 100.0% 100.0% 100.0% 100.0%
W-2s
Total < 500 500 - 1,499 1,500 - 4,999 5,000 + NA
Q9. Which methods are used to
input payroll data: Web-based
input by payroll
No Count 82 41 40 35 18 216
% within W-2s 70.7% 65.1% 83.3% 71.4% 90.0% 73.0%
Yes Count 34 22 8 14 2 80
% within W-2s 29.3% 34.9% 16.7% 28.6% 10.0% 27.0%
Total Count 116 63 48 49 20 296
% within W-2s 100.0% 100.0% 100.0% 100.0% 100.0% 100.0%

2011 Survey of Salaries and the Payroll Profession 75
W-2s
Total < 500 500 - 1,499 1,500 - 4,999 5,000 + NA
Q9. Which methods are used to
input payroll data: Other
No Count 111 63 48 49 18 289
% within W-2s 95.7% 100.0% 100.0% 100.0% 90.0% 97.6%
Yes Count 5 0 0 0 2 7
% within W-2s 4.3% .0% .0% .0% 10.0% 2.4%
Total Count 116 63 48 49 20 296
% within W-2s 100.0% 100.0% 100.0% 100.0% 100.0% 100.0%
W-2s
Total < 500 500 - 1,499 1,500 - 4,999 5,000 + NA
Q10. Which of the following pay
frequencies does your
organization use: Weekly
No Count 95 46 34 32 16 223
% within W-2s 80.5% 73.0% 70.8% 64.0% 76.2% 74.3%
Yes Count 23 17 14 18 5 77
% within W-2s 19.5% 27.0% 29.2% 36.0% 23.8% 25.7%
Total Count 118 63 48 50 21 300
% within W-2s 100.0% 100.0% 100.0% 100.0% 100.0% 100.0%
W-2s
Total < 500 500 - 1,499 1,500 - 4,999 5,000 + NA
Q10. Which of the following pay
frequencies does your
organization use: Semimonthly
No Count 77 47 32 35 18 209
% within W-2s 65.3% 74.6% 66.7% 70.0% 85.7% 69.7%
Yes Count 41 16 16 15 3 91
% within W-2s 34.7% 25.4% 33.3% 30.0% 14.3% 30.3%
Total Count 118 63 48 50 21 300
% within W-2s 100.0% 100.0% 100.0% 100.0% 100.0% 100.0%

2011 Survey of Salaries and the Payroll Profession 76
W-2s *
Total < 500 500 - 1,499 1,500 - 4,999 5,000 + NA
Q10. Which of the following pay
frequencies does your
organization use: Biweekly
No Count 57 23 12 6 3 101
% within W-2s 48.3% 36.5% 25.0% 12.0% 14.3% 33.7%
Yes Count 61 40 36 44 18 199
% within W-2s 51.7% 63.5% 75.0% 88.0% 85.7% 66.3%
Total Count 118 63 48 50 21 300
% within W-2s 100.0% 100.0% 100.0% 100.0% 100.0% 100.0%
W-2s *
Total < 500 500 - 1,499 1,500 - 4,999 5,000 + NA
Q10. Which of the following pay
frequencies does your
organization use: Monthly
No Count 103 52 38 27 19 239
% within W-2s 87.3% 82.5% 79.2% 54.0% 90.5% 79.7%
Yes Count 15 11 10 23 2 61
% within W-2s 12.7% 17.5% 20.8% 46.0% 9.5% 20.3%
Total Count 118 63 48 50 21 300
% within W-2s 100.0% 100.0% 100.0% 100.0% 100.0% 100.0%
W-2s
Total < 500 500 - 1,499 1,500 - 4,999 5,000 + NA
Q10. Which of the following pay
frequencies does your
organization use: Other
No Count 117 63 47 50 20 297
% within W-2s 99.2% 100.0% 97.9% 100.0% 95.2% 99.0%
Yes Count 1 0 1 0 1 3
% within W-2s .8% .0% 2.1% .0% 4.8% 1.0%
Total Count 118 63 48 50 21 300
% within W-2s 100.0% 100.0% 100.0% 100.0% 100.0% 100.0%

2011 Survey of Salaries and the Payroll Profession 77
W-2s
Total < 500 500 - 1,499 1,500 - 4,999 5,000 + NA
Q11. What is the pay frequency
of the largest payroll?
Weekly Count 19 11 7 7 1 45
% within W-2s 16.2% 17.5% 14.6% 14.3% 4.8% 15.1%
Semimonthly Count 35 13 10 7 3 68
% within W-2s 29.9% 20.6% 20.8% 14.3% 14.3% 22.8%
Biweekly Count 55 35 28 31 16 165
% within W-2s 47.0% 55.6% 58.3% 63.3% 76.2% 55.4%
Monthly Count 6 4 3 4 1 18
% within W-2s 5.1% 6.3% 6.3% 8.2% 4.8% 6.0%
Other Count 2 0 0 0 0 2
% within W-2s 1.7% .0% .0% .0% .0% .7%
Total Count 117 63 48 49 21 298
% within W-2s 100.0% 100.0% 100.0% 100.0% 100.0% 100.0%
W-2s *
Total < 500 500 - 1,499 1,500 - 4,999 5,000 + NA
Q12a. Approximately what
percentage of your
organization’s payroll is
delivered by paper paycheck?
0% Count 45 9 6 4 3 67
% within W-2s 38.5% 14.3% 12.5% 8.2% 15.0% 22.6%
1% to 33% Count 63 47 33 41 14 198
% within W-2s 53.8% 74.6% 68.8% 83.7% 70.0% 66.7%
34% to 66% Count 5 5 5 2 2 19
% within W-2s 4.3% 7.9% 10.4% 4.1% 10.0% 6.4%
67% to 99% Count 0 2 4 2 1 9
% within W-2s .0% 3.2% 8.3% 4.1% 5.0% 3.0%
100% Count 4 0 0 0 0 4
% within W-2s 3.4% .0% .0% .0% .0% 1.3%
Total Count 117 63 48 49 20 297
% within W-2s 100.0% 100.0% 100.0% 100.0% 100.0% 100.0%

2011 Survey of Salaries and the Payroll Profession 78
W-2s *
Total < 500 500 - 1,499 1,500 - 4,999 5,000 + NA
Q12b. Approximately what
percentage of your
organization’s payroll is
delivered by direct deposit?
0% Count 4 0 0 0 0 4
% within W-2s 3.4% .0% .0% .0% .0% 1.3%
1% to 33% Count 0 2 4 2 2 10
% within W-2s .0% 3.2% 8.3% 4.1% 10.0% 3.4%
34% to 66% Count 5 6 5 3 4 23
% within W-2s 4.3% 9.5% 10.4% 6.1% 20.0% 7.7%
67% to 99% Count 64 51 36 41 12 204
% within W-2s 54.7% 81.0% 75.0% 83.7% 60.0% 68.7%
100% Count 44 4 3 3 2 56
% within W-2s 37.6% 6.3% 6.3% 6.1% 10.0% 18.9%
Total Count 117 63 48 49 20 297
% within W-2s 100.0% 100.0% 100.0% 100.0% 100.0% 100.0%
W-2s *
Total < 500 500 - 1,499 1,500 - 4,999 5,000 + NA
Q12c. Approximately what
percentage of your
organization’s payroll is
delivered by paycard?
0% Count 112 55 39 34 16 256
% within W-2s 95.7% 87.3% 81.3% 69.4% 80.0% 86.2%
1% to 33% Count 5 8 9 14 4 40
% within W-2s 4.3% 12.7% 18.8% 28.6% 20.0% 13.5%
34% to 66% Count 0 0 0 1 0 1
% within W-2s .0% .0% .0% 2.0% .0% .3%
Total Count 117 63 48 49 20 297
% within W-2s 100.0% 100.0% 100.0% 100.0% 100.0% 100.0%

2011 Survey of Salaries and the Payroll Profession 79
W-2s
Total < 500 500 - 1,499 1,500 - 4,999 5,000 + NA
Q12d. Approximately what
percentage of your
organization’s payroll is
delivered by other?
0% Count 116 61 48 49 19 293
% within W-2s 100.0% 96.8% 100.0% 100.0% 95.0% 99.0%
1% to 33% Count 0 1 0 0 0 1
% within W-2s .0% 1.6% .0% .0% .0% .3%
34% to 66% Count 0 1 0 0 0 1
% within W-2s .0% 1.6% .0% .0% .0% .3%
67% to 99% Count 0 0 0 0 1 1
% within W-2s .0% .0% .0% .0% 5.0% .3%
Total Count 116 63 48 49 20 296
% within W-2s 100.0% 100.0% 100.0% 100.0% 100.0% 100.0%
Mean
W-2s Q12a. Approximately
what percentage of
your organization’s
payroll is delivered by
paper paycheck?
Q12b. Approximately
what percentage of
your organization’s
payroll is delivered by
direct deposit?
Q12c. Approximately
what percentage of
your organization’s
payroll is delivered by
paycard? *
Q12d. Approximately
what percentage of
your organization’s
payroll is delivered by
other?
< 500 10.60 89.01 .39 .00
500 - 1,499 13.83 84.38 .86 .94
1,500 - 4,999 17.77 80.81 1.42 .00
5,000 + 13.37 83.94 2.69 .00
NA 16.90 76.55 3.05 3.50
Total 13.32 85.03 1.22 .44

2011 Survey of Salaries and the Payroll Profession 80
W-2s
Total < 500 500 - 1,499 1,500 - 4,999 5,000 + NA
Q13a. Approximately what
percentage of your
organization’s paystubs are
delivered by e-mail?
0% Count 102 57 46 46 14 265
% within W-2s 88.7% 91.9% 95.8% 95.8% 70.0% 90.4%
1% to 33% Count 5 2 1 1 2 11
% within W-2s 4.3% 3.2% 2.1% 2.1% 10.0% 3.8%
34% to 66% Count 3 1 0 0 1 5
% within W-2s 2.6% 1.6% .0% .0% 5.0% 1.7%
67% to 99% Count 2 2 1 0 1 6
% within W-2s 1.7% 3.2% 2.1% .0% 5.0% 2.0%
100% Count 3 0 0 1 2 6
% within W-2s 2.6% .0% .0% 2.1% 10.0% 2.0%
Total Count 115 62 48 48 20 293
% within W-2s 100.0% 100.0% 100.0% 100.0% 100.0% 100.0%
W-2s *
Total < 500 500 - 1,499 1,500 - 4,999 5,000 + NA
Q13b. Approximately what
percentage of your
organization’s paystubs are
delivered by online posting?
0% Count 72 18 20 12 10 132
% within W-2s 62.6% 29.0% 41.7% 25.0% 50.0% 45.1%
1% to 33% Count 3 8 2 1 1 15
% within W-2s 2.6% 12.9% 4.2% 2.1% 5.0% 5.1%
34% to 66% Count 1 4 5 6 2 18
% within W-2s .9% 6.5% 10.4% 12.5% 10.0% 6.1%
67% to 99% Count 9 19 10 16 1 55
% within W-2s 7.8% 30.6% 20.8% 33.3% 5.0% 18.8%
100% Count 30 13 11 13 6 73
% within W-2s 26.1% 21.0% 22.9% 27.1% 30.0% 24.9%
Total Count 115 62 48 48 20 293
% within W-2s 100.0% 100.0% 100.0% 100.0% 100.0% 100.0%

2011 Survey of Salaries and the Payroll Profession 81
W-2s *
Total < 500 500 - 1,499 1,500 - 4,999 5,000 + NA
Q13c. Approximately what
percentage of your
organization’s paystubs are
delivered by paper paystub?
0% Count 32 13 8 10 6 69
% within W-2s 27.8% 21.0% 16.7% 20.8% 30.0% 23.5%
1% to 33% Count 11 21 13 17 4 66
% within W-2s 9.6% 33.9% 27.1% 35.4% 20.0% 22.5%
34% to 66% Count 5 4 6 9 2 26
% within W-2s 4.3% 6.5% 12.5% 18.8% 10.0% 8.9%
67% to 99% Count 8 8 2 2 2 22
% within W-2s 7.0% 12.9% 4.2% 4.2% 10.0% 7.5%
100% Count 59 16 19 10 6 110
% within W-2s 51.3% 25.8% 39.6% 20.8% 30.0% 37.5%
Total Count 115 62 48 48 20 293
% within W-2s 100.0% 100.0% 100.0% 100.0% 100.0% 100.0%
W-2s
Total < 500 500 - 1,499 1,500 - 4,999 5,000 + NA
Q13d. Approximately what
percentage of your
organization’s paystubs are
delivered by other?
0% Count 114 60 47 47 19 287
% within W-2s 99.1% 96.8% 97.9% 100.0% 95.0% 98.3%
1% to 33% Count 0 1 0 0 1 2
% within W-2s .0% 1.6% .0% .0% 5.0% .7%
67% to 99% Count 0 0 1 0 0 1
% within W-2s .0% .0% 2.1% .0% .0% .3%
100% Count 1 1 0 0 0 2
% within W-2s .9% 1.6% .0% .0% .0% .7%
Total Count 115 62 48 47 20 292
% within W-2s 100.0% 100.0% 100.0% 100.0% 100.0% 100.0%

2011 Survey of Salaries and the Payroll Profession 82
Mean
W-2s
Q13a. Approximately
what percentage of
your organization’s
paystubs are
delivered by e-mail?
Q13b. Approximately
what percentage of
your organization’s
paystubs are
delivered by online
posting? *
Q13c. Approximately
what percentage of
your organization’s
paystubs are
delivered by paper
paystub? *
Q13d. Approximately
what percentage of
your organization’s
paystubs are
delivered by other?
< 500 5.65 33.99 60.42 .87
500 - 1,499 3.66 54.69 42.45 2.03
1,500 - 4,999 1.87 48.33 51.60 1.83
5,000 + 2.13 64.65 36.42 .00
NA 19.30 39.95 46.15 1.00
Total 4.97 46.15 50.27 1.14
W-2s *
Total < 500 500 - 1,499 1,500 - 4,999 5,000 + NA
Q14. How many regularly
scheduled paydays were
handled by payroll staff in 2010
(excluding off-cycle and special
payrolls such as bonuses)?
25 or fewer Count 35 11 4 2 1 53
% within W-2s 29.7% 17.5% 8.3% 4.1% 5.0% 17.8%
26 Count 35 22 13 9 7 86
% within W-2s 29.7% 34.9% 27.1% 18.4% 35.0% 28.9%
27 to 51 Count 20 13 11 13 4 61
% within W-2s 16.9% 20.6% 22.9% 26.5% 20.0% 20.5%
52 Count 16 6 4 2 1 29
% within W-2s 13.6% 9.5% 8.3% 4.1% 5.0% 9.7%
53 or more Count 12 11 16 23 7 69
% within W-2s 10.2% 17.5% 33.3% 46.9% 35.0% 23.2%
Total Count 118 63 48 49 20 298
% within W-2s 100.0% 100.0% 100.0% 100.0% 100.0% 100.0%

2011 Survey of Salaries and the Payroll Profession 83
W-2s *
Total < 500 500 - 1,499 1,500 - 4,999 5,000 + NA
Q15. Approximately how many
paychecks, direct deposits of
pay, and/or payroll card
transactions were processed
by payroll staff in 2010 (include
off-cycle payments)?
< 7,500 Count 94 7 1 2 5 109
% within W-2s 81.7% 11.5% 2.2% 4.3% 29.4% 38.2%
7,500 to 19,999 Count 20 34 3 0 4 61
% within W-2s 17.4% 55.7% 6.5% .0% 23.5% 21.4%
20,000 to 74,999 Count 1 20 33 4 5 63
% within W-2s .9% 32.8% 71.7% 8.7% 29.4% 22.1%
75,000 + Count 0 0 9 40 3 52
% within W-2s .0% .0% 19.6% 87.0% 17.6% 18.2%
Total Count 115 61 46 46 17 285
% within W-2s 100.0% 100.0% 100.0% 100.0% 100.0% 100.0%
W-2s *
Total < 500 500 - 1,499 1,500 - 4,999 5,000 + NA
Q16. Out of the total number of
payments made to employees
in 2010, how many of these
were off-cycle payments
(bonuses, manual checks,
adjustments, corrections, etc.)?
< 50 Count 63 14 7 1 9 94
% within W-2s 56.8% 23.0% 15.6% 2.2% 52.9% 33.7%
50 to 199 Count 20 18 7 0 1 46
% within W-2s 18.0% 29.5% 15.6% .0% 5.9% 16.5%
200 to 999 Count 24 18 13 11 3 69
% within W-2s 21.6% 29.5% 28.9% 24.4% 17.6% 24.7%
1,000 to 9,999 Count 4 10 16 19 2 51
% within W-2s 3.6% 16.4% 35.6% 42.2% 11.8% 18.3%
10,000 + Count 0 1 2 14 2 19
% within W-2s .0% 1.6% 4.4% 31.1% 11.8% 6.8%
Total Count 111 61 45 45 17 279
% within W-2s 100.0% 100.0% 100.0% 100.0% 100.0% 100.0%

2011 Survey of Salaries and the Payroll Profession 84
W-2s *
Total < 500 500 - 1,499 1,500 - 4,999 5,000 + NA
Q17. What is the approximate
total payroll operating budget
for 2011?
< 65,000 Count 29 6 0 0 2 37
% within W-2s 32.6% 12.2% .0% .0% 15.4% 16.4%
65,000 to 149,999 Count 27 17 9 2 7 62
% within W-2s 30.3% 34.7% 25.0% 5.3% 53.8% 27.6%
150,000 to 499,999 Count 7 20 22 11 0 60
% within W-2s 7.9% 40.8% 61.1% 28.9% .0% 26.7%
500,000 + Count 26 6 5 25 4 66
% within W-2s 29.2% 12.2% 13.9% 65.8% 30.8% 29.3%
Total Count 89 49 36 38 13 225
% within W-2s 100.0% 100.0% 100.0% 100.0% 100.0% 100.0%
Median
W-2s
Q14. How many
regularly scheduled
paydays were
handled by payroll
staff in 2010
(excluding off-cycle
and special payrolls
such as bonuses)?
*
Q15. Approximately
how many
paychecks, direct
deposits of pay,
and/or payroll card
transactions were
processed by payroll
staff in 2010 (include
off-cycle payments)?
*
Q16. Out of the total
number of payments
made to employees
in 2010, how many of
these were off-cycle
payments (bonuses,
manual checks,
adjustments,
corrections, etc.)? *
Q17. What is the
approximate total
payroll operating
budget for 2011? *
Q18. Approximately
how many W-2s did
your organization
issue for calendar
year 2010? *
< 500 26.00 3710.00 20.00 85000.00 200.00
500 - 1,499 26.00 16560.00 170.00 160000.00 800.00
1,500 - 4,999 40.00 54102.50 500.00 262500.00 2429.00
5,000 + 52.00 207129.50 4000.00 568752.50 9500.00
NA 28.50 18000.00 34.00 100000.00
Total 27.00 13000.00 199.00 200000.00 625.00

2011 Survey of Salaries and the Payroll Profession 85
W-2s *
Total < 500 500 - 1,499 1,500 - 4,999 5,000 + NA
Q19. How many of your
organization’s 2010 W-2s were
delivered to your employees
electronically?
0 Count 95 46 37 25 9 212
% within W-2s 81.2% 73.0% 77.1% 52.1% 64.3% 73.1%
1 to 499 Count 22 6 1 2 2 33
% within W-2s 18.8% 9.5% 2.1% 4.2% 14.3% 11.4%
500 to 1,499 Count 0 11 4 1 1 17
% within W-2s .0% 17.5% 8.3% 2.1% 7.1% 5.9%
1,500 to 4,999 Count 0 0 6 4 0 10
% within W-2s .0% .0% 12.5% 8.3% .0% 3.4%
5,000 to 9,999 Count 0 0 0 8 1 9
% within W-2s .0% .0% .0% 16.7% 7.1% 3.1%
10,000 + Count 0 0 0 8 1 9
% within W-2s .0% .0% .0% 16.7% 7.1% 3.1%
Total Count 117 63 48 48 14 290
% within W-2s 100.0% 100.0% 100.0% 100.0% 100.0% 100.0%
W-2s *
Total < 500 500 - 1,499 1,500 - 4,999 5,000 + NA
Q20. In how many U.S. states or
territories (including Washington,
D.C., Puerto Rico, U.S. Virgin
Islands, and Trust Territories)
does your organization pay state
unemployment taxes?
None Count 6 3 2 3 3 17
% within W-2s 5.2% 4.8% 4.2% 6.1% 16.7% 5.8%
1 Count 53 23 12 6 5 99
% within W-2s 45.7% 36.5% 25.0% 12.2% 27.8% 33.7%
2 to 4 Count 26 7 6 7 2 48
% within W-2s 22.4% 11.1% 12.5% 14.3% 11.1% 16.3%
5 to 19 Count 27 20 15 7 2 71
% within W-2s 23.3% 31.7% 31.3% 14.3% 11.1% 24.1%
20 + Count 4 10 13 26 6 59
% within W-2s 3.4% 15.9% 27.1% 53.1% 33.3% 20.1%
Total Count 116 63 48 49 18 294
% within W-2s 100.0% 100.0% 100.0% 100.0% 100.0% 100.0%

2011 Survey of Salaries and the Payroll Profession 86
W-2s *
Total < 500 500 - 1,499 1,500 - 4,999 5,000 + NA
Q21. In how many foreign
countries does your organization
pay expatriate employees?
None Count 113 53 36 31 18 251
% within W-2s 96.6% 84.1% 75.0% 62.0% 90.0% 84.2%
1 to 4 Count 4 8 11 11 0 34
% within W-2s 3.4% 12.7% 22.9% 22.0% .0% 11.4%
5 or more Count 0 2 1 8 2 13
% within W-2s .0% 3.2% 2.1% 16.0% 10.0% 4.4%
Total Count 117 63 48 50 20 298
% within W-2s 100.0% 100.0% 100.0% 100.0% 100.0% 100.0%
W-2s *
Total < 500 500 - 1,499 1,500 - 4,999 5,000 + NA
Q22. How many expatriate
employees does your
organization pay?
None Count 114 52 37 29 16 248
% within W-2s 97.4% 83.9% 77.1% 58.0% 80.0% 83.5%
1 to 9 Count 2 9 4 10 2 27
% within W-2s 1.7% 14.5% 8.3% 20.0% 10.0% 9.1%
10 or more Count 1 1 7 11 2 22
% within W-2s .9% 1.6% 14.6% 22.0% 10.0% 7.4%
Total Count 117 62 48 50 20 297
% within W-2s 100.0% 100.0% 100.0% 100.0% 100.0% 100.0%

2011 Survey of Salaries and the Payroll Profession 87
W-2s *
Total < 500 500 - 1,499 1,500 - 4,999 5,000 + NA
Q23. In how many foreign
countries does your organization
pay local national employees?
None Count 112 53 40 36 15 256
% within W-2s 95.7% 84.1% 83.3% 72.0% 78.9% 86.2%
1 to 4 Count 4 9 7 9 3 32
% within W-2s 3.4% 14.3% 14.6% 18.0% 15.8% 10.8%
5 or more Count 1 1 1 5 1 9
% within W-2s .9% 1.6% 2.1% 10.0% 5.3% 3.0%
Total Count 117 63 48 50 19 297
% within W-2s 100.0% 100.0% 100.0% 100.0% 100.0% 100.0%
W-2s *
Total < 500 500 - 1,499 1,500 - 4,999 5,000 + NA
Q24. How many local national
employees does your
organization pay?
None Count 106 51 38 34 18 247
% within W-2s 89.8% 81.0% 79.2% 68.0% 85.7% 82.3%
1 to 9 Count 2 2 2 5 1 12
% within W-2s 1.7% 3.2% 4.2% 10.0% 4.8% 4.0%
10 or more Count 10 10 8 11 2 41
% within W-2s 8.5% 15.9% 16.7% 22.0% 9.5% 13.7%
Total Count 118 63 48 50 21 300
% within W-2s 100.0% 100.0% 100.0% 100.0% 100.0% 100.0%
W-2s *
Total < 500 500 - 1,499 1,500 - 4,999 5,000 + NA
Q26. How many nonresident
alien employees in the U.S.
does your organization pay?
None Count 101 43 24 19 14 201
% within W-2s 90.2% 71.7% 57.1% 43.2% 70.0% 72.3%
1 to 9 Count 9 12 10 8 1 40
% within W-2s 8.0% 20.0% 23.8% 18.2% 5.0% 14.4%
10 or more Count 2 5 8 17 5 37
% within W-2s 1.8% 8.3% 19.0% 38.6% 25.0% 13.3%
Total Count 112 60 42 44 20 278
% within W-2s 100.0% 100.0% 100.0% 100.0% 100.0% 100.0%

2011 Survey of Salaries and the Payroll Profession 88
W-2s *
Total < 500 500 - 1,499 1,500 - 4,999 5,000 + NA
Q27a. What percentage of
nonexempt employees report
their time manually (for
example, on a time sheet)?
0% Count 45 23 18 19 11 116
% within W-2s 43.7% 39.0% 40.9% 41.3% 64.7% 43.1%
1% to 33% Count 9 18 12 15 2 56
% within W-2s 8.7% 30.5% 27.3% 32.6% 11.8% 20.8%
34% to 66% Count 5 1 2 4 0 12
% within W-2s 4.9% 1.7% 4.5% 8.7% .0% 4.5%
67% to 99% Count 3 0 3 6 1 13
% within W-2s 2.9% .0% 6.8% 13.0% 5.9% 4.8%
100% Count 41 17 9 2 3 72
% within W-2s 39.8% 28.8% 20.5% 4.3% 17.6% 26.8%
Total Count 103 59 44 46 17 269
% within W-2s 100.0% 100.0% 100.0% 100.0% 100.0% 100.0%
W-2s *
Total < 500 500 - 1,499 1,500 - 4,999 5,000 + NA
Q27b. What percentage of
nonexempt employees report
their time via an automated
method?
0% Count 41 17 9 2 3 72
% within W-2s 39.8% 28.8% 20.5% 4.3% 17.6% 26.8%
1% to 33% Count 3 0 3 6 1 13
% within W-2s 2.9% .0% 6.8% 13.0% 5.9% 4.8%
34% to 66% Count 5 1 2 4 0 12
% within W-2s 4.9% 1.7% 4.5% 8.7% .0% 4.5%
67% to 99% Count 9 18 12 15 2 56
% within W-2s 8.7% 30.5% 27.3% 32.6% 11.8% 20.8%
100% Count 45 23 18 19 11 116
% within W-2s 43.7% 39.0% 40.9% 41.3% 64.7% 43.1%
Total Count 103 59 44 46 17 269
% within W-2s 100.0% 100.0% 100.0% 100.0% 100.0% 100.0%

2011 Survey of Salaries and the Payroll Profession 89
Mean
W-2s Q27a. What
percentage of
nonexempt
employees report
their time manually
(for example, on a
time sheet)? *
Q27b. What
percentage of
nonexempt
employees report
their time via an
automated method?
*
< 500 45.53 54.47
500 - 1,499 31.53 68.47
1,500 - 4,999 31.52 68.48
5,000 + 23.39 76.61
NA 24.59 75.41
Total 35.06 64.94
W-2s *
Total < 500 500 - 1,499 1,500 - 4,999 5,000 + NA
Q28. Which automated methods
are used by nonexempt
employees to report their time:
Badge reader
No Count 45 25 19 21 7 117
% within W-2s 77.6% 59.5% 55.9% 47.7% 50.0% 60.9%
Yes Count 13 17 15 23 7 75
% within W-2s 22.4% 40.5% 44.1% 52.3% 50.0% 39.1%
Total Count 58 42 34 44 14 192
% within W-2s 100.0% 100.0% 100.0% 100.0% 100.0% 100.0%
W-2s
Total < 500 500 - 1,499 1,500 - 4,999 5,000 + NA
Q28. Which automated methods
are used by nonexempt
employees to report their time:
Web-based input
No Count 16 13 9 13 2 53
% within W-2s 27.6% 31.0% 26.5% 29.5% 14.3% 27.6%
Yes Count 42 29 25 31 12 139
% within W-2s 72.4% 69.0% 73.5% 70.5% 85.7% 72.4%
Total Count 58 42 34 44 14 192
% within W-2s 100.0% 100.0% 100.0% 100.0% 100.0% 100.0%
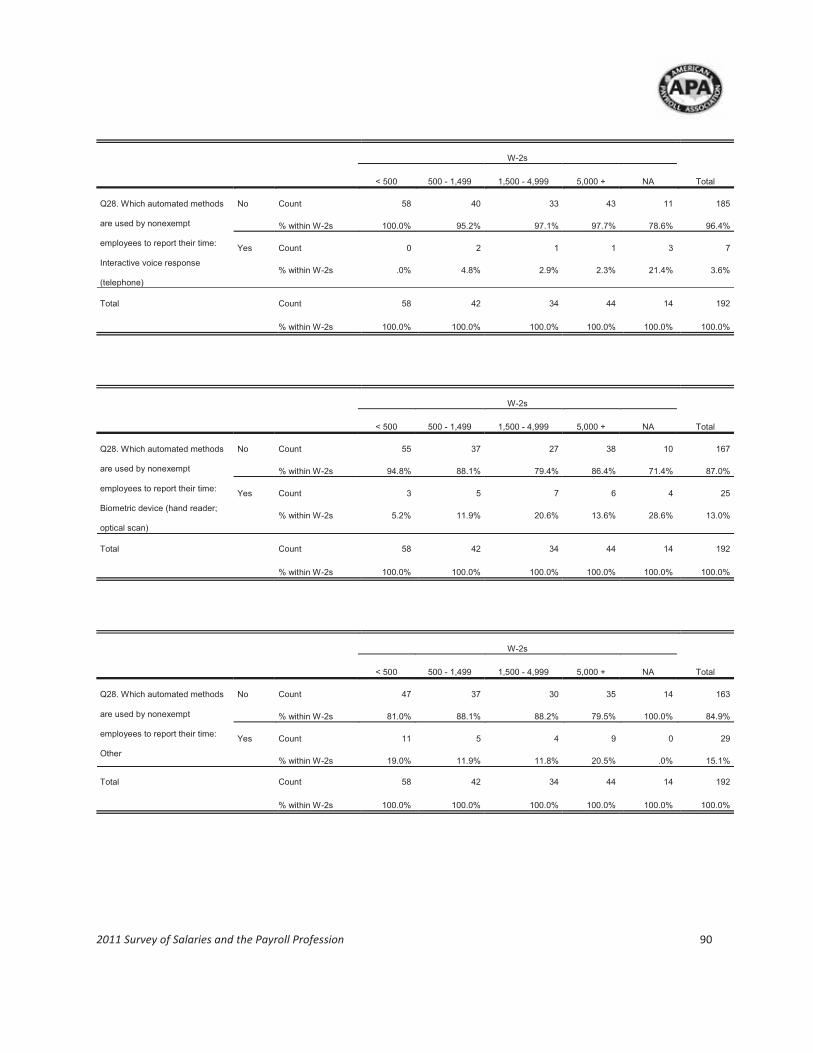
2011 Survey of Salaries and the Payroll Profession 90
W-2s
Total < 500 500 - 1,499 1,500 - 4,999 5,000 + NA
Q28. Which automated methods
are used by nonexempt
employees to report their time:
Interactive voice response
(telephone)
No Count 58 40 33 43 11 185
% within W-2s 100.0% 95.2% 97.1% 97.7% 78.6% 96.4%
Yes Count 0 2 1 1 3 7
% within W-2s .0% 4.8% 2.9% 2.3% 21.4% 3.6%
Total Count 58 42 34 44 14 192
% within W-2s 100.0% 100.0% 100.0% 100.0% 100.0% 100.0%
W-2s
Total < 500 500 - 1,499 1,500 - 4,999 5,000 + NA
Q28. Which automated methods
are used by nonexempt
employees to report their time:
Biometric device (hand reader;
optical scan)
No Count 55 37 27 38 10 167
% within W-2s 94.8% 88.1% 79.4% 86.4% 71.4% 87.0%
Yes Count 3 5 7 6 4 25
% within W-2s 5.2% 11.9% 20.6% 13.6% 28.6% 13.0%
Total Count 58 42 34 44 14 192
% within W-2s 100.0% 100.0% 100.0% 100.0% 100.0% 100.0%
W-2s
Total < 500 500 - 1,499 1,500 - 4,999 5,000 + NA
Q28. Which automated methods
are used by nonexempt
employees to report their time:
Other
No Count 47 37 30 35 14 163
% within W-2s 81.0% 88.1% 88.2% 79.5% 100.0% 84.9%
Yes Count 11 5 4 9 0 29
% within W-2s 19.0% 11.9% 11.8% 20.5% .0% 15.1%
Total Count 58 42 34 44 14 192
% within W-2s 100.0% 100.0% 100.0% 100.0% 100.0% 100.0%
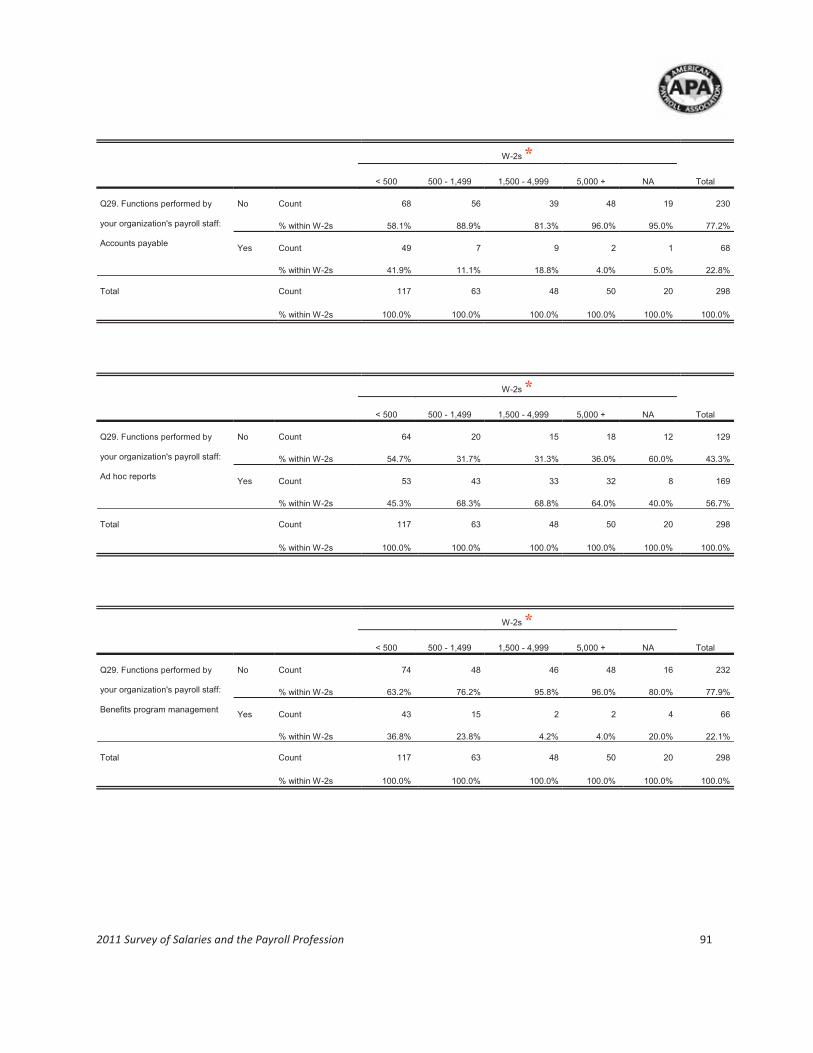
2011 Survey of Salaries and the Payroll Profession 91
W-2s *
Total < 500 500 - 1,499 1,500 - 4,999 5,000 + NA
Q29. Functions performed by
your organization's payroll staff:
Accounts payable
No Count 68 56 39 48 19 230
% within W-2s 58.1% 88.9% 81.3% 96.0% 95.0% 77.2%
Yes Count 49 7 9 2 1 68
% within W-2s 41.9% 11.1% 18.8% 4.0% 5.0% 22.8%
Total Count 117 63 48 50 20 298
% within W-2s 100.0% 100.0% 100.0% 100.0% 100.0% 100.0%
W-2s *
Total < 500 500 - 1,499 1,500 - 4,999 5,000 + NA
Q29. Functions performed by
your organization's payroll staff:
Ad hoc reports
No Count 64 20 15 18 12 129
% within W-2s 54.7% 31.7% 31.3% 36.0% 60.0% 43.3%
Yes Count 53 43 33 32 8 169
% within W-2s 45.3% 68.3% 68.8% 64.0% 40.0% 56.7%
Total Count 117 63 48 50 20 298
% within W-2s 100.0% 100.0% 100.0% 100.0% 100.0% 100.0%
W-2s *
Total < 500 500 - 1,499 1,500 - 4,999 5,000 + NA
Q29. Functions performed by
your organization's payroll staff:
Benefits program management
No Count 74 48 46 48 16 232
% within W-2s 63.2% 76.2% 95.8% 96.0% 80.0% 77.9%
Yes Count 43 15 2 2 4 66
% within W-2s 36.8% 23.8% 4.2% 4.0% 20.0% 22.1%
Total Count 117 63 48 50 20 298
% within W-2s 100.0% 100.0% 100.0% 100.0% 100.0% 100.0%

2011 Survey of Salaries and the Payroll Profession 92
W-2s *
Total < 500 500 - 1,499 1,500 - 4,999 5,000 + NA
Q29. Functions performed by
your organization's payroll staff:
Benefits program administration
No Count 70 41 43 47 16 217
% within W-2s 59.8% 65.1% 89.6% 94.0% 80.0% 72.8%
Yes Count 47 22 5 3 4 81
% within W-2s 40.2% 34.9% 10.4% 6.0% 20.0% 27.2%
Total Count 117 63 48 50 20 298
% within W-2s 100.0% 100.0% 100.0% 100.0% 100.0% 100.0%
W-2s
Total < 500 500 - 1,499 1,500 - 4,999 5,000 + NA
Q29. Functions performed by
your organization's payroll staff:
Check distribution
No Count 21 10 10 12 8 61
% within W-2s 17.9% 15.9% 20.8% 24.0% 40.0% 20.5%
Yes Count 96 53 38 38 12 237
% within W-2s 82.1% 84.1% 79.2% 76.0% 60.0% 79.5%
Total Count 117 63 48 50 20 298
% within W-2s 100.0% 100.0% 100.0% 100.0% 100.0% 100.0%
W-2s *
Total < 500 500 - 1,499 1,500 - 4,999 5,000 + NA
Q29. Functions performed by
your organization's payroll staff:
Compensation program
management
No Count 91 54 45 50 19 259
% within W-2s 77.8% 85.7% 93.8% 100.0% 95.0% 86.9%
Yes Count 26 9 3 0 1 39
% within W-2s 22.2% 14.3% 6.3% .0% 5.0% 13.1%
Total Count 117 63 48 50 20 298
% within W-2s 100.0% 100.0% 100.0% 100.0% 100.0% 100.0%

2011 Survey of Salaries and the Payroll Profession 93
W-2s *
Total < 500 500 - 1,499 1,500 - 4,999 5,000 + NA
Q29. Functions performed by
your organization's payroll staff:
Employee data management
No Count 37 22 24 30 6 119
% within W-2s 31.6% 34.9% 50.0% 60.0% 30.0% 39.9%
Yes Count 80 41 24 20 14 179
% within W-2s 68.4% 65.1% 50.0% 40.0% 70.0% 60.1%
Total Count 117 63 48 50 20 298
% within W-2s 100.0% 100.0% 100.0% 100.0% 100.0% 100.0%
W-2s
Total < 500 500 - 1,499 1,500 - 4,999 5,000 + NA
Q29. Functions performed by
your organization's payroll staff:
Employee inquiries
No Count 11 3 6 5 5 30
% within W-2s 9.4% 4.8% 12.5% 10.0% 25.0% 10.1%
Yes Count 106 60 42 45 15 268
% within W-2s 90.6% 95.2% 87.5% 90.0% 75.0% 89.9%
Total Count 117 63 48 50 20 298
% within W-2s 100.0% 100.0% 100.0% 100.0% 100.0% 100.0%
W-2s *
Total < 500 500 - 1,499 1,500 - 4,999 5,000 + NA
Q29. Functions performed by
your organization's payroll staff:
Employee services
No Count 47 20 30 24 14 135
% within W-2s 40.2% 31.7% 62.5% 48.0% 70.0% 45.3%
Yes Count 70 43 18 26 6 163
% within W-2s 59.8% 68.3% 37.5% 52.0% 30.0% 54.7%
Total Count 117 63 48 50 20 298
% within W-2s 100.0% 100.0% 100.0% 100.0% 100.0% 100.0%

2011 Survey of Salaries and the Payroll Profession 94
W-2s
Total < 500 500 - 1,499 1,500 - 4,999 5,000 + NA
Q29. Functions performed by
your organization's payroll staff:
Federal tax filing
No Count 49 26 12 13 8 108
% within W-2s 41.9% 41.3% 25.0% 26.0% 40.0% 36.2%
Yes Count 68 37 36 37 12 190
% within W-2s 58.1% 58.7% 75.0% 74.0% 60.0% 63.8%
Total Count 117 63 48 50 20 298
% within W-2s 100.0% 100.0% 100.0% 100.0% 100.0% 100.0%
W-2s
Total < 500 500 - 1,499 1,500 - 4,999 5,000 + NA
Q29. Functions performed by
your organization's payroll staff:
General ledger interface
No Count 49 18 20 14 8 109
% within W-2s 41.9% 28.6% 41.7% 28.0% 40.0% 36.6%
Yes Count 68 45 28 36 12 189
% within W-2s 58.1% 71.4% 58.3% 72.0% 60.0% 63.4%
Total Count 117 63 48 50 20 298
% within W-2s 100.0% 100.0% 100.0% 100.0% 100.0% 100.0%
W-2s *
Total < 500 500 - 1,499 1,500 - 4,999 5,000 + NA
Q29. Functions performed by
your organization's payroll staff:
Sarbanes-Oxley compliance
No Count 88 43 34 25 13 203
% within W-2s 75.2% 68.3% 70.8% 50.0% 65.0% 68.1%
Yes Count 29 20 14 25 7 95
% within W-2s 24.8% 31.7% 29.2% 50.0% 35.0% 31.9%
Total Count 117 63 48 50 20 298
% within W-2s 100.0% 100.0% 100.0% 100.0% 100.0% 100.0%

2011 Survey of Salaries and the Payroll Profession 95
W-2s *
Total < 500 500 - 1,499 1,500 - 4,999 5,000 + NA
Q29. Functions performed by
your organization's payroll staff:
Expense reimbursements
No Count 65 44 39 31 13 192
% within W-2s 55.6% 69.8% 81.3% 62.0% 65.0% 64.4%
Yes Count 52 19 9 19 7 106
% within W-2s 44.4% 30.2% 18.8% 38.0% 35.0% 35.6%
Total Count 117 63 48 50 20 298
% within W-2s 100.0% 100.0% 100.0% 100.0% 100.0% 100.0%
W-2s *
Total < 500 500 - 1,499 1,500 - 4,999 5,000 + NA
Q29. Functions performed by
your organization's payroll staff:
Independent contractor payments
No Count 87 60 46 48 20 261
% within W-2s 74.4% 95.2% 95.8% 96.0% 100.0% 87.6%
Yes Count 30 3 2 2 0 37
% within W-2s 25.6% 4.8% 4.2% 4.0% .0% 12.4%
Total Count 117 63 48 50 20 298
% within W-2s 100.0% 100.0% 100.0% 100.0% 100.0% 100.0%
W-2s
Total < 500 500 - 1,499 1,500 - 4,999 5,000 + NA
Q29. Functions performed by
your organization's payroll staff:
Labor and cost accounting
No Count 81 48 36 41 17 223
% within W-2s 69.2% 76.2% 75.0% 82.0% 85.0% 74.8%
Yes Count 36 15 12 9 3 75
% within W-2s 30.8% 23.8% 25.0% 18.0% 15.0% 25.2%
Total Count 117 63 48 50 20 298
% within W-2s 100.0% 100.0% 100.0% 100.0% 100.0% 100.0%

2011 Survey of Salaries and the Payroll Profession 96
W-2s
Total < 500 500 - 1,499 1,500 - 4,999 5,000 + NA
Q29. Functions performed by
your organization's payroll staff:
Payroll accounting
No Count 25 17 15 14 6 77
% within W-2s 21.4% 27.0% 31.3% 28.0% 30.0% 25.8%
Yes Count 92 46 33 36 14 221
% within W-2s 78.6% 73.0% 68.8% 72.0% 70.0% 74.2%
Total Count 117 63 48 50 20 298
% within W-2s 100.0% 100.0% 100.0% 100.0% 100.0% 100.0%
W-2s
Total < 500 500 - 1,499 1,500 - 4,999 5,000 + NA
Q29. Functions performed by
your organization's payroll staff:
Payroll tax disbursement /
reporting
No Count 46 23 16 11 6 102
% within W-2s 39.3% 36.5% 33.3% 22.0% 30.0% 34.2%
Yes Count 71 40 32 39 14 196
% within W-2s 60.7% 63.5% 66.7% 78.0% 70.0% 65.8%
Total Count 117 63 48 50 20 298
% within W-2s 100.0% 100.0% 100.0% 100.0% 100.0% 100.0%
W-2s
Total < 500 500 - 1,499 1,500 - 4,999 5,000 + NA
Q29. Functions performed by
your organization's payroll staff:
Personnel records administration
No Count 62 39 34 36 13 184
% within W-2s 53.0% 61.9% 70.8% 72.0% 65.0% 61.7%
Yes Count 55 24 14 14 7 114
% within W-2s 47.0% 38.1% 29.2% 28.0% 35.0% 38.3%
Total Count 117 63 48 50 20 298
% within W-2s 100.0% 100.0% 100.0% 100.0% 100.0% 100.0%

2011 Survey of Salaries and the Payroll Profession 97
W-2s *
Total < 500 500 - 1,499 1,500 - 4,999 5,000 + NA
Q29. Functions performed by
your organization's payroll staff:
Salary budgeting
No Count 79 48 40 48 17 232
% within W-2s 67.5% 76.2% 83.3% 96.0% 85.0% 77.9%
Yes Count 38 15 8 2 3 66
% within W-2s 32.5% 23.8% 16.7% 4.0% 15.0% 22.1%
Total Count 117 63 48 50 20 298
% within W-2s 100.0% 100.0% 100.0% 100.0% 100.0% 100.0%
W-2s
Total < 500 500 - 1,499 1,500 - 4,999 5,000 + NA
Q29. Functions performed by
your organization's payroll staff:
State and local tax filing
No Count 51 30 15 15 8 119
% within W-2s 43.6% 47.6% 31.3% 30.0% 40.0% 39.9%
Yes Count 66 33 33 35 12 179
% within W-2s 56.4% 52.4% 68.8% 70.0% 60.0% 60.1%
Total Count 117 63 48 50 20 298
% within W-2s 100.0% 100.0% 100.0% 100.0% 100.0% 100.0%
W-2s
Total < 500 500 - 1,499 1,500 - 4,999 5,000 + NA
Q29. Functions performed by
your organization's payroll staff:
Time and attendance
No Count 21 12 13 12 1 59
% within W-2s 17.9% 19.0% 27.1% 24.0% 5.0% 19.8%
Yes Count 96 51 35 38 19 239
% within W-2s 82.1% 81.0% 72.9% 76.0% 95.0% 80.2%
Total Count 117 63 48 50 20 298
% within W-2s 100.0% 100.0% 100.0% 100.0% 100.0% 100.0%

2011 Survey of Salaries and the Payroll Profession 98
W-2s *
Total < 500 500 - 1,499 1,500 - 4,999 5,000 + NA
Q29. Functions performed by
your organization's payroll staff:
Workers’ compensation plan
No Count 61 43 40 43 15 202
% within W-2s 52.1% 68.3% 83.3% 86.0% 75.0% 67.8%
Yes Count 56 20 8 7 5 96
% within W-2s 47.9% 31.7% 16.7% 14.0% 25.0% 32.2%
Total Count 117 63 48 50 20 298
% within W-2s 100.0% 100.0% 100.0% 100.0% 100.0% 100.0%
W-2s
Total < 500 500 - 1,499 1,500 - 4,999 5,000 + NA
Q29. Functions performed by
your organization's payroll staff:
Year-end and period-end closing
No Count 29 8 11 6 3 57
% within W-2s 24.8% 12.7% 22.9% 12.0% 15.0% 19.1%
Yes Count 88 55 37 44 17 241
% within W-2s 75.2% 87.3% 77.1% 88.0% 85.0% 80.9%
Total Count 117 63 48 50 20 298
% within W-2s 100.0% 100.0% 100.0% 100.0% 100.0% 100.0%
W-2s
Total < 500 500 - 1,499 1,500 - 4,999 5,000 + NA
Q29. Functions performed by
your organization's payroll staff:
Bank account reconciliation
No Count 73 47 36 37 18 211
% within W-2s 62.4% 74.6% 75.0% 74.0% 90.0% 70.8%
Yes Count 44 16 12 13 2 87
% within W-2s 37.6% 25.4% 25.0% 26.0% 10.0% 29.2%
Total Count 117 63 48 50 20 298
% within W-2s 100.0% 100.0% 100.0% 100.0% 100.0% 100.0%

2011 Survey of Salaries and the Payroll Profession 99
W-2s
Total < 500 500 - 1,499 1,500 - 4,999 5,000 + NA
Q29. Functions performed by
your organization's payroll staff:
Control validation
No Count 104 48 39 37 19 247
% within W-2s 88.9% 76.2% 81.3% 74.0% 95.0% 82.9%
Yes Count 13 15 9 13 1 51
% within W-2s 11.1% 23.8% 18.8% 26.0% 5.0% 17.1%
Total Count 117 63 48 50 20 298
% within W-2s 100.0% 100.0% 100.0% 100.0% 100.0% 100.0%
W-2s
Total < 500 500 - 1,499 1,500 - 4,999 5,000 + NA
Q29. Functions performed by
your organization's payroll staff:
Deduction processing
No Count 28 11 12 8 6 65
% within W-2s 23.9% 17.5% 25.0% 16.0% 30.0% 21.8%
Yes Count 89 52 36 42 14 233
% within W-2s 76.1% 82.5% 75.0% 84.0% 70.0% 78.2%
Total Count 117 63 48 50 20 298
% within W-2s 100.0% 100.0% 100.0% 100.0% 100.0% 100.0%
W-2s
Total < 500 500 - 1,499 1,500 - 4,999 5,000 + NA
Q29. Functions performed by
your organization's payroll staff:
Document management
No Count 64 35 26 33 15 173
% within W-2s 54.7% 55.6% 54.2% 66.0% 75.0% 58.1%
Yes Count 53 28 22 17 5 125
% within W-2s 45.3% 44.4% 45.8% 34.0% 25.0% 41.9%
Total Count 117 63 48 50 20 298
% within W-2s 100.0% 100.0% 100.0% 100.0% 100.0% 100.0%

2011 Survey of Salaries and the Payroll Profession 100
W-2s
Total < 500 500 - 1,499 1,500 - 4,999 5,000 + NA
Q29. Functions performed by
your organization's payroll staff:
Employee time processing
No Count 19 9 10 11 4 53
% within W-2s 16.2% 14.3% 20.8% 22.0% 20.0% 17.8%
Yes Count 98 54 38 39 16 245
% within W-2s 83.8% 85.7% 79.2% 78.0% 80.0% 82.2%
Total Count 117 63 48 50 20 298
% within W-2s 100.0% 100.0% 100.0% 100.0% 100.0% 100.0%
W-2s
Total < 500 500 - 1,499 1,500 - 4,999 5,000 + NA
Q29. Functions performed by
your organization's payroll staff:
General ledger reconciliation
No Count 59 31 24 27 13 154
% within W-2s 50.4% 49.2% 50.0% 54.0% 65.0% 51.7%
Yes Count 58 32 24 23 7 144
% within W-2s 49.6% 50.8% 50.0% 46.0% 35.0% 48.3%
Total Count 117 63 48 50 20 298
% within W-2s 100.0% 100.0% 100.0% 100.0% 100.0% 100.0%
W-2s *
Total < 500 500 - 1,499 1,500 - 4,999 5,000 + NA
Q29. Functions performed by
your organization's payroll staff:
IT liaison and testing
No Count 92 43 28 20 15 198
% within W-2s 78.6% 68.3% 58.3% 40.0% 75.0% 66.4%
Yes Count 25 20 20 30 5 100
% within W-2s 21.4% 31.7% 41.7% 60.0% 25.0% 33.6%
Total Count 117 63 48 50 20 298
% within W-2s 100.0% 100.0% 100.0% 100.0% 100.0% 100.0%
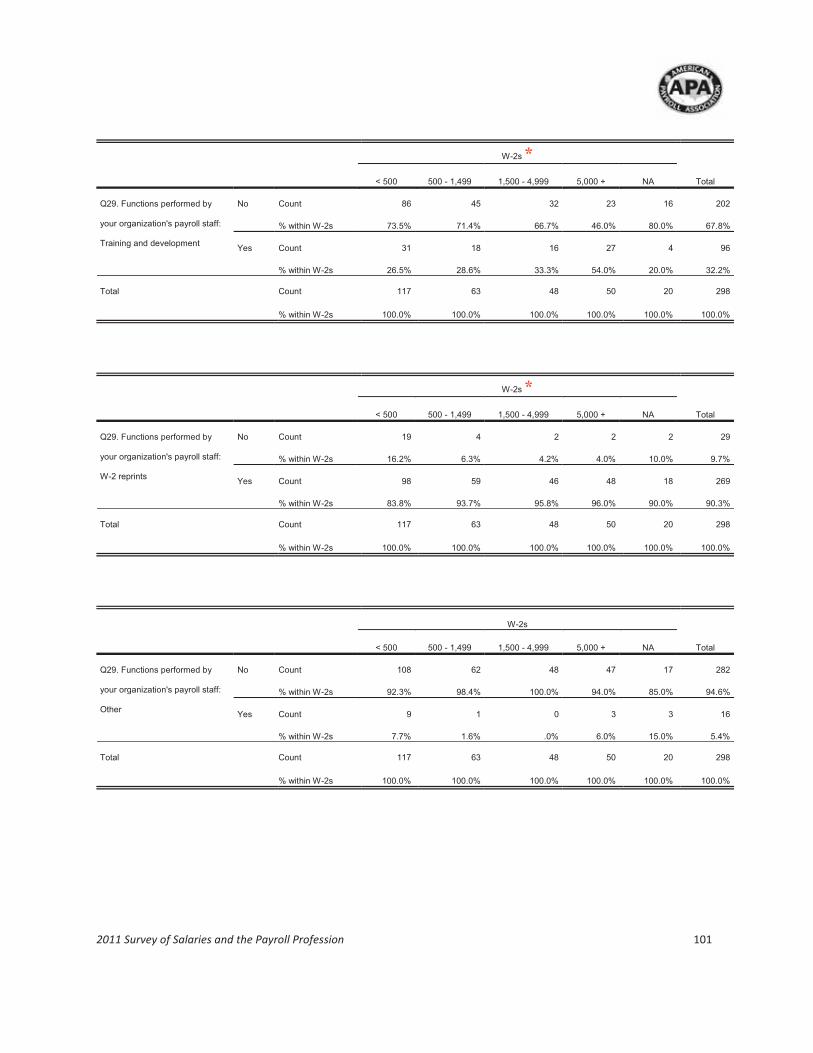
2011 Survey of Salaries and the Payroll Profession 101
W-2s *
Total < 500 500 - 1,499 1,500 - 4,999 5,000 + NA
Q29. Functions performed by
your organization's payroll staff:
Training and development
No Count 86 45 32 23 16 202
% within W-2s 73.5% 71.4% 66.7% 46.0% 80.0% 67.8%
Yes Count 31 18 16 27 4 96
% within W-2s 26.5% 28.6% 33.3% 54.0% 20.0% 32.2%
Total Count 117 63 48 50 20 298
% within W-2s 100.0% 100.0% 100.0% 100.0% 100.0% 100.0%
W-2s *
Total < 500 500 - 1,499 1,500 - 4,999 5,000 + NA
Q29. Functions performed by
your organization's payroll staff:
W-2 reprints
No Count 19 4 2 2 2 29
% within W-2s 16.2% 6.3% 4.2% 4.0% 10.0% 9.7%
Yes Count 98 59 46 48 18 269
% within W-2s 83.8% 93.7% 95.8% 96.0% 90.0% 90.3%
Total Count 117 63 48 50 20 298
% within W-2s 100.0% 100.0% 100.0% 100.0% 100.0% 100.0%
W-2s
Total < 500 500 - 1,499 1,500 - 4,999 5,000 + NA
Q29. Functions performed by
your organization's payroll staff:
Other
No Count 108 62 48 47 17 282
% within W-2s 92.3% 98.4% 100.0% 94.0% 85.0% 94.6%
Yes Count 9 1 0 3 3 16
% within W-2s 7.7% 1.6% .0% 6.0% 15.0% 5.4%
Total Count 117 63 48 50 20 298
% within W-2s 100.0% 100.0% 100.0% 100.0% 100.0% 100.0%

2011 Survey of Salaries and the Payroll Profession 102
W-2s
Total < 500 500 - 1,499 1,500 - 4,999 5,000 + NA
Q30. Which types of payments,
other than wage and salary
payments, are made to
employees through the payroll
system: Business expense
reimbursements
No Count 43 35 28 26 12 144
% within W-2s 58.1% 67.3% 77.8% 55.3% 80.0% 64.3%
Yes Count 31 17 8 21 3 80
% within W-2s 41.9% 32.7% 22.2% 44.7% 20.0% 35.7%
Total Count 74 52 36 47 15 224
% within W-2s 100.0% 100.0% 100.0% 100.0% 100.0% 100.0%
W-2s
Total < 500 500 - 1,499 1,500 - 4,999 5,000 + NA
Q30. Which types of payments,
other than wage and salary
payments, are made to
employees through the payroll
system: Petty cash
No Count 72 51 35 45 14 217
% within W-2s 97.3% 98.1% 97.2% 95.7% 93.3% 96.9%
Yes Count 2 1 1 2 1 7
% within W-2s 2.7% 1.9% 2.8% 4.3% 6.7% 3.1%
Total Count 74 52 36 47 15 224
% within W-2s 100.0% 100.0% 100.0% 100.0% 100.0% 100.0%
W-2s
Total < 500 500 - 1,499 1,500 - 4,999 5,000 + NA
Q30. Which types of payments,
other than wage and salary
payments, are made to
employees through the payroll
system: Travel reimbursements
No Count 49 39 22 24 11 145
% within W-2s 66.2% 75.0% 61.1% 51.1% 73.3% 64.7%
Yes Count 25 13 14 23 4 79
% within W-2s 33.8% 25.0% 38.9% 48.9% 26.7% 35.3%
Total Count 74 52 36 47 15 224
% within W-2s 100.0% 100.0% 100.0% 100.0% 100.0% 100.0%

2011 Survey of Salaries and the Payroll Profession 103
W-2s
Total < 500 500 - 1,499 1,500 - 4,999 5,000 + NA
Q30. Which types of payments,
other than wage and salary
payments, are made to
employees through the payroll
system: Commission payments
No Count 37 29 20 22 7 115
% within W-2s 50.0% 55.8% 55.6% 46.8% 46.7% 51.3%
Yes Count 37 23 16 25 8 109
% within W-2s 50.0% 44.2% 44.4% 53.2% 53.3% 48.7%
Total Count 74 52 36 47 15 224
% within W-2s 100.0% 100.0% 100.0% 100.0% 100.0% 100.0%
W-2s *
Total < 500 500 - 1,499 1,500 - 4,999 5,000 + NA
Q30. Which types of payments,
other than wage and salary
payments, are made to
employees through the payroll
system: Relocation (moving)
expenses
No Count 48 18 10 8 5 89
% within W-2s 64.9% 34.6% 27.8% 17.0% 33.3% 39.7%
Yes Count 26 34 26 39 10 135
% within W-2s 35.1% 65.4% 72.2% 83.0% 66.7% 60.3%
Total Count 74 52 36 47 15 224
% within W-2s 100.0% 100.0% 100.0% 100.0% 100.0% 100.0%
W-2s
Total < 500 500 - 1,499 1,500 - 4,999 5,000 + NA
Q30. Which types of payments,
other than wage and salary
payments, are made to
employees through the payroll
system: Tuition reimbursements
No Count 55 31 24 24 8 142
% within W-2s 74.3% 59.6% 66.7% 51.1% 53.3% 63.4%
Yes Count 19 21 12 23 7 82
% within W-2s 25.7% 40.4% 33.3% 48.9% 46.7% 36.6%
Total Count 74 52 36 47 15 224
% within W-2s 100.0% 100.0% 100.0% 100.0% 100.0% 100.0%

2011 Survey of Salaries and the Payroll Profession 104
W-2s
Total < 500 500 - 1,499 1,500 - 4,999 5,000 + NA
Q30. Which types of payments,
other than wage and salary
payments, are made to
employees through the payroll
system: Pension payments
No Count 68 48 31 38 13 198
% within W-2s 91.9% 92.3% 86.1% 80.9% 86.7% 88.4%
Yes Count 6 4 5 9 2 26
% within W-2s 8.1% 7.7% 13.9% 19.1% 13.3% 11.6%
Total Count 74 52 36 47 15 224
% within W-2s 100.0% 100.0% 100.0% 100.0% 100.0% 100.0%
W-2s *
Total < 500 500 - 1,499 1,500 - 4,999 5,000 + NA
Q30. Which types of payments,
other than wage and salary
payments, are made to
employees through the payroll
system: Stock purchase sales
No Count 69 43 31 33 12 188
% within W-2s 93.2% 82.7% 86.1% 70.2% 80.0% 83.9%
Yes Count 5 9 5 14 3 36
% within W-2s 6.8% 17.3% 13.9% 29.8% 20.0% 16.1%
Total Count 74 52 36 47 15 224
% within W-2s 100.0% 100.0% 100.0% 100.0% 100.0% 100.0%
W-2s
Total < 500 500 - 1,499 1,500 - 4,999 5,000 + NA
Q30. Which types of payments,
other than wage and salary
payments, are made to
employees through the payroll
system: Other
No Count 62 47 32 41 12 194
% within W-2s 83.8% 90.4% 88.9% 87.2% 80.0% 86.6%
Yes Count 12 5 4 6 3 30
% within W-2s 16.2% 9.6% 11.1% 12.8% 20.0% 13.4%
Total Count 74 52 36 47 15 224
% within W-2s 100.0% 100.0% 100.0% 100.0% 100.0% 100.0%

2011 Survey of Salaries and the Payroll Profession 105
W-2s *
Total < 500 500 - 1,499 1,500 - 4,999 5,000 + NA
Q31. Does your organization
collect a fee from employees who
request a replacement Form W-
2?
Yes Count 3 7 4 14 1 29
% within W-2s 2.6% 11.1% 8.5% 28.0% 5.0% 9.8%
No Count 114 56 43 36 19 268
% within W-2s 97.4% 88.9% 91.5% 72.0% 95.0% 90.2%
Total Count 117 63 47 50 20 297
% within W-2s 100.0% 100.0% 100.0% 100.0% 100.0% 100.0%
W-2s *
Total < 500 500 - 1,499 1,500 - 4,999 5,000 + NA
Q32a. Approximately what
percentage of your
organization’s employees
require child support orders?
0% / None reported Count 32 6 5 3 5 51
% within W-2s 27.1% 9.5% 10.4% 6.0% 23.8% 17.0%
Greater than 0%, up to 1% Count 33 18 11 8 7 77
% within W-2s 28.0% 28.6% 22.9% 16.0% 33.3% 25.7%
More than 1%, up to 3% Count 16 16 15 12 1 60
% within W-2s 13.6% 25.4% 31.3% 24.0% 4.8% 20.0%
More than 3%, up to 10% Count 30 17 15 14 5 81
% within W-2s 25.4% 27.0% 31.3% 28.0% 23.8% 27.0%
More than 10% Count 7 6 2 13 3 31
% within W-2s 5.9% 9.5% 4.2% 26.0% 14.3% 10.3%
Total Count 118 63 48 50 21 300
% within W-2s 100.0% 100.0% 100.0% 100.0% 100.0% 100.0%

2011 Survey of Salaries and the Payroll Profession 106
W-2s *
Total < 500 500 - 1,499 1,500 - 4,999 5,000 + NA
Q32b. Approximately what
percentage of your
organization’s employees
require student loan
garnishments?
0% / None reported Count 85 27 17 9 12 150
% within W-2s 72.0% 42.9% 35.4% 18.0% 57.1% 50.0%
Greater than 0%, up to 1% Count 29 29 22 24 7 111
% within W-2s 24.6% 46.0% 45.8% 48.0% 33.3% 37.0%
More than 1%, up to 3% Count 3 5 8 6 0 22
% within W-2s 2.5% 7.9% 16.7% 12.0% .0% 7.3%
More than 3% Count 1 2 1 11 2 17
% within W-2s .8% 3.2% 2.1% 22.0% 9.5% 5.7%
Total Count 118 63 48 50 21 300
% within W-2s 100.0% 100.0% 100.0% 100.0% 100.0% 100.0%
W-2s *
Total < 500 500 - 1,499 1,500 - 4,999 5,000 + NA
Q32c. Approximately what
percentage of your
organization’s employees
require state tax levies?
0% / None reported Count 95 43 18 13 13 182
% within W-2s 80.5% 68.3% 37.5% 26.0% 61.9% 60.7%
Greater than 0%, up to 1% Count 16 18 20 23 6 83
% within W-2s 13.6% 28.6% 41.7% 46.0% 28.6% 27.7%
More than 1%, up to 3% Count 5 1 7 2 0 15
% within W-2s 4.2% 1.6% 14.6% 4.0% .0% 5.0%
More than 3% Count 2 1 3 12 2 20
% within W-2s 1.7% 1.6% 6.3% 24.0% 9.5% 6.7%
Total Count 118 63 48 50 21 300
% within W-2s 100.0% 100.0% 100.0% 100.0% 100.0% 100.0%

2011 Survey of Salaries and the Payroll Profession 107
W-2s *
Total < 500 500 - 1,499 1,500 - 4,999 5,000 + NA
Q32d. Approximately what
percentage of your
organization’s employees
require federal tax levies?
0% / None reported Count 76 19 11 6 12 124
% within W-2s 64.4% 30.2% 22.9% 12.0% 57.1% 41.3%
Greater than 0%, up to 1% Count 28 37 27 28 7 127
% within W-2s 23.7% 58.7% 56.3% 56.0% 33.3% 42.3%
More than 1%, up to 3% Count 10 5 7 5 0 27
% within W-2s 8.5% 7.9% 14.6% 10.0% .0% 9.0%
More than 3% Count 4 2 3 11 2 22
% within W-2s 3.4% 3.2% 6.3% 22.0% 9.5% 7.3%
Total Count 118 63 48 50 21 300
% within W-2s 100.0% 100.0% 100.0% 100.0% 100.0% 100.0%
W-2s *
Total < 500 500 - 1,499 1,500 - 4,999 5,000 + NA
Q32e. Approximately what
percentage of your
organization’s employees
require creditor
garnishments?
0% / None reported Count 79 22 12 6 13 132
% within W-2s 66.9% 34.9% 25.0% 12.0% 61.9% 44.0%
Greater than 0%, up to 1% Count 20 24 16 20 3 83
% within W-2s 16.9% 38.1% 33.3% 40.0% 14.3% 27.7%
More than 1%, up to 3% Count 11 10 13 8 1 43
% within W-2s 9.3% 15.9% 27.1% 16.0% 4.8% 14.3%
More than 3% Count 8 7 7 16 4 42
% within W-2s 6.8% 11.1% 14.6% 32.0% 19.0% 14.0%
Total Count 118 63 48 50 21 300
% within W-2s 100.0% 100.0% 100.0% 100.0% 100.0% 100.0%

2011 Survey of Salaries and the Payroll Profession 108
W-2s *
Total < 500 500 - 1,499 1,500 - 4,999 5,000 + NA
Q32f. Approximately what
percentage of your
organization’s employees
require bankruptcy orders?
0% / None reported Count 91 29 18 12 12 162
% within W-2s 77.1% 46.0% 37.5% 24.0% 57.1% 54.0%
Greater than 0%, up to 1% Count 21 25 20 23 7 96
% within W-2s 17.8% 39.7% 41.7% 46.0% 33.3% 32.0%
More than 1%, up to 3% Count 5 7 8 6 1 27
% within W-2s 4.2% 11.1% 16.7% 12.0% 4.8% 9.0%
More than 3% Count 1 2 2 9 1 15
% within W-2s .8% 3.2% 4.2% 18.0% 4.8% 5.0%
Total Count 118 63 48 50 21 300
% within W-2s 100.0% 100.0% 100.0% 100.0% 100.0% 100.0%
W-2s *
Total < 500 500 - 1,499 1,500 - 4,999 5,000 + NA
Q33. Approximately how many
garnishment payments of all
types (both by check and
electronic payments) did your
organization make in 2010?
0 Count 18 0 0 1 2 21
% within W-2s 16.2% .0% .0% 2.3% 11.8% 7.5%
1 to 99 Count 49 17 7 1 4 78
% within W-2s 44.1% 27.9% 14.9% 2.3% 23.5% 27.9%
100 to 349 Count 30 16 7 4 5 62
% within W-2s 27.0% 26.2% 14.9% 9.1% 29.4% 22.1%
350 to 1,249 Count 13 20 12 8 3 56
% within W-2s 11.7% 32.8% 25.5% 18.2% 17.6% 20.0%
1,250 or more Count 1 8 21 30 3 63
% within W-2s .9% 13.1% 44.7% 68.2% 17.6% 22.5%
Total Count 111 61 47 44 17 280
% within W-2s 100.0% 100.0% 100.0% 100.0% 100.0% 100.0%
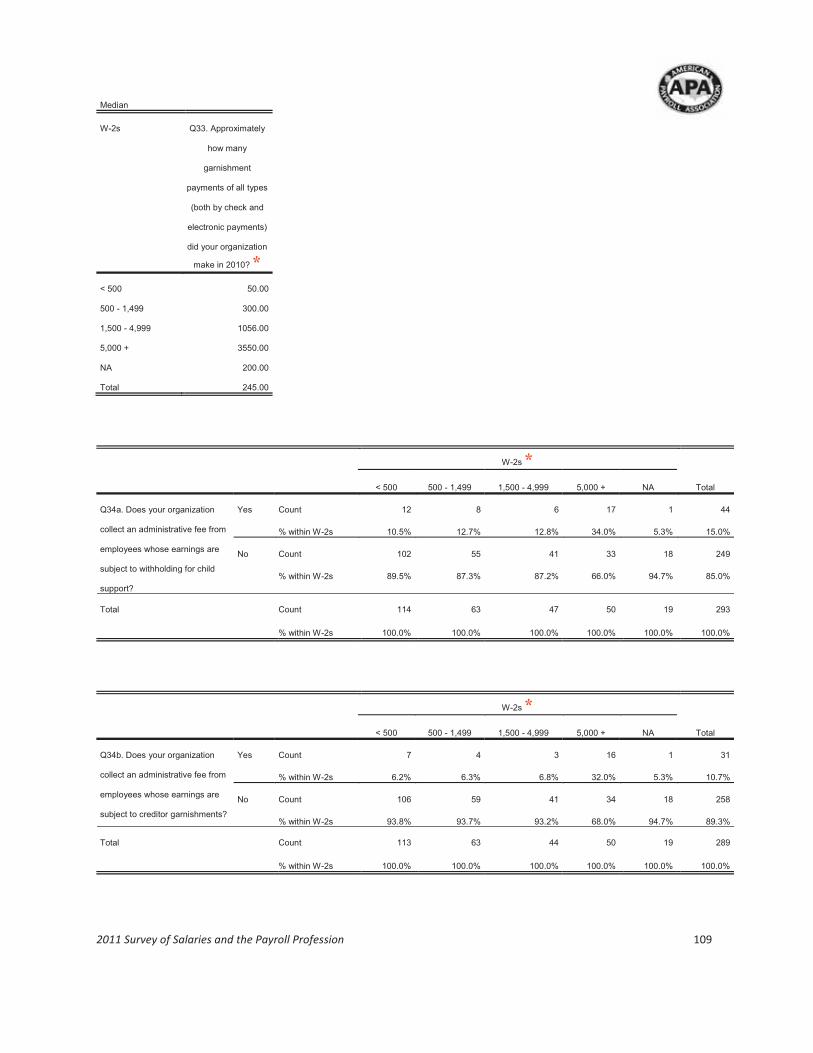
2011 Survey of Salaries and the Payroll Profession 109
Median
W-2s Q33. Approximately
how many
garnishment
payments of all types
(both by check and
electronic payments)
did your organization
make in 2010? *
< 500 50.00
500 - 1,499 300.00
1,500 - 4,999 1056.00
5,000 + 3550.00
NA 200.00
Total 245.00
W-2s *
Total < 500 500 - 1,499 1,500 - 4,999 5,000 + NA
Q34a. Does your organization
collect an administrative fee from
employees whose earnings are
subject to withholding for child
support?
Yes Count 12 8 6 17 1 44
% within W-2s 10.5% 12.7% 12.8% 34.0% 5.3% 15.0%
No Count 102 55 41 33 18 249
% within W-2s 89.5% 87.3% 87.2% 66.0% 94.7% 85.0%
Total Count 114 63 47 50 19 293
% within W-2s 100.0% 100.0% 100.0% 100.0% 100.0% 100.0%
W-2s *
Total < 500 500 - 1,499 1,500 - 4,999 5,000 + NA
Q34b. Does your organization
collect an administrative fee from
employees whose earnings are
subject to creditor garnishments?
Yes Count 7 4 3 16 1 31
% within W-2s 6.2% 6.3% 6.8% 32.0% 5.3% 10.7%
No Count 106 59 41 34 18 258
% within W-2s 93.8% 93.7% 93.2% 68.0% 94.7% 89.3%
Total Count 113 63 44 50 19 289
% within W-2s 100.0% 100.0% 100.0% 100.0% 100.0% 100.0%

2011 Survey of Salaries and the Payroll Profession 110
W-2s *
Total < 500 500 - 1,499 1,500 - 4,999 5,000 + NA
Q35. Is your largest payroll
integrated with an HRIS (Human
Resource Information System)?
Yes Count 65 49 37 44 13 208
% within W-2s 58.0% 79.0% 80.4% 88.0% 76.5% 72.5%
No Count 47 13 9 6 4 79
% within W-2s 42.0% 21.0% 19.6% 12.0% 23.5% 27.5%
Total Count 112 62 46 50 17 287
% within W-2s 100.0% 100.0% 100.0% 100.0% 100.0% 100.0%
W-2s *
Total < 500 500 - 1,499 1,500 - 4,999 5,000 + NA
Q36. Approximately what
percentage of your
organization’s employee
benefits recordkeeping (with or
without an HRIS) is handled by
payroll staff?
Less than 15% Count 40 32 31 33 10 146
% within W-2s 34.8% 51.6% 66.0% 67.3% 55.6% 50.2%
15% – 24% Count 8 8 5 7 2 30
% within W-2s 7.0% 12.9% 10.6% 14.3% 11.1% 10.3%
25% – 49% Count 6 4 4 2 1 17
% within W-2s 5.2% 6.5% 8.5% 4.1% 5.6% 5.8%
50% – 84% Count 10 5 2 4 0 21
% within W-2s 8.7% 8.1% 4.3% 8.2% .0% 7.2%
85% or more Count 51 13 5 3 5 77
% within W-2s 44.3% 21.0% 10.6% 6.1% 27.8% 26.5%
Total Count 115 62 47 49 18 291
% within W-2s 100.0% 100.0% 100.0% 100.0% 100.0% 100.0%

2011 Survey of Salaries and the Payroll Profession 111
W-2s
Total < 500 500 - 1,499 1,500 - 4,999 5,000 + NA
Q37. For which of the following
types of payroll-related
products/services does someone
in the payroll department
recommend or approve
acquisitions: Payroll processing
hardware
No Count 82 40 29 31 13 195
% within W-2s 71.3% 63.5% 61.7% 62.0% 68.4% 66.3%
Yes Count 33 23 18 19 6 99
% within W-2s 28.7% 36.5% 38.3% 38.0% 31.6% 33.7%
Total Count 115 63 47 50 19 294
% within W-2s 100.0% 100.0% 100.0% 100.0% 100.0% 100.0%
W-2s
Total < 500 500 - 1,499 1,500 - 4,999 5,000 + NA
Q37. For which of the following
types of payroll-related
products/services does someone
in the payroll department
recommend or approve
acquisitions: Unemployment
insurance processing
No Count 88 48 36 38 16 226
% within W-2s 76.5% 76.2% 76.6% 76.0% 84.2% 76.9%
Yes Count 27 15 11 12 3 68
% within W-2s 23.5% 23.8% 23.4% 24.0% 15.8% 23.1%
Total Count 115 63 47 50 19 294
% within W-2s 100.0% 100.0% 100.0% 100.0% 100.0% 100.0%

2011 Survey of Salaries and the Payroll Profession 112
W-2s
Total < 500 500 - 1,499 1,500 - 4,999 5,000 + NA
Q37. For which of the following
types of payroll-related
products/services does someone
in the payroll department
recommend or approve
acquisitions: Payroll processing
software
No Count 60 25 20 19 7 131
% within W-2s 52.2% 39.7% 42.6% 38.0% 36.8% 44.6%
Yes Count 55 38 27 31 12 163
% within W-2s 47.8% 60.3% 57.4% 62.0% 63.2% 55.4%
Total Count 115 63 47 50 19 294
% within W-2s 100.0% 100.0% 100.0% 100.0% 100.0% 100.0%
W-2s *
Total < 500 500 - 1,499 1,500 - 4,999 5,000 + NA
Q37. For which of the following
types of payroll-related
products/services does someone
in the payroll department
recommend or approve
acquisitions: Outsourcing vendors
(for example, service providers)
No Count 86 41 27 26 11 191
% within W-2s 74.8% 65.1% 57.4% 52.0% 57.9% 65.0%
Yes Count 29 22 20 24 8 103
% within W-2s 25.2% 34.9% 42.6% 48.0% 42.1% 35.0%
Total Count 115 63 47 50 19 294
% within W-2s 100.0% 100.0% 100.0% 100.0% 100.0% 100.0%

2011 Survey of Salaries and the Payroll Profession 113
W-2s *
Total < 500 500 - 1,499 1,500 - 4,999 5,000 + NA
Q37. For which of the following
types of payroll-related
products/services does someone
in the payroll department
recommend or approve
acquisitions: Payroll cards
No Count 91 44 27 24 14 200
% within W-2s 79.1% 69.8% 57.4% 48.0% 73.7% 68.0%
Yes Count 24 19 20 26 5 94
% within W-2s 20.9% 30.2% 42.6% 52.0% 26.3% 32.0%
Total Count 115 63 47 50 19 294
% within W-2s 100.0% 100.0% 100.0% 100.0% 100.0% 100.0%
W-2s *
Total < 500 500 - 1,499 1,500 - 4,999 5,000 + NA
Q37. For which of the following
types of payroll-related
products/services does someone
in the payroll department
recommend or approve
acquisitions: Training
No Count 76 34 20 16 10 156
% within W-2s 66.1% 54.0% 42.6% 32.0% 52.6% 53.1%
Yes Count 39 29 27 34 9 138
% within W-2s 33.9% 46.0% 57.4% 68.0% 47.4% 46.9%
Total Count 115 63 47 50 19 294
% within W-2s 100.0% 100.0% 100.0% 100.0% 100.0% 100.0%
W-2s
Total < 500 500 - 1,499 1,500 - 4,999 5,000 + NA
Q37. For which of the following
types of payroll-related
products/services does someone
in the payroll department
recommend or approve
acquisitions: Other
No Count 110 58 44 47 18 277
% within W-2s 95.7% 92.1% 93.6% 94.0% 94.7% 94.2%
Yes Count 5 5 3 3 1 17
% within W-2s 4.3% 7.9% 6.4% 6.0% 5.3% 5.8%
Total Count 115 63 47 50 19 294
% within W-2s 100.0% 100.0% 100.0% 100.0% 100.0% 100.0%

2011 Survey of Salaries and the Payroll Profession 114
W-2s *
Total < 500 500 - 1,499 1,500 - 4,999 5,000 + NA
Q37. For which of the following
types of payroll-related
products/services does someone
in the payroll department
recommend or approve
acquisitions: None
No Count 68 47 37 40 14 206
% within W-2s 59.1% 74.6% 78.7% 80.0% 73.7% 70.1%
Yes Count 47 16 10 10 5 88
% within W-2s 40.9% 25.4% 21.3% 20.0% 26.3% 29.9%
Total Count 115 63 47 50 19 294
% within W-2s 100.0% 100.0% 100.0% 100.0% 100.0% 100.0%
W-2s
Total < 500 500 - 1,499 1,500 - 4,999 5,000 + NA
Q38. How is your
organization’s payroll
processing handled?
All in-house (company-
developed system)
Count 10 1 2 9 1 23
% within W-2s 8.8% 1.7% 4.3% 18.0% 5.0% 7.9%
All in-house (licensed
system)
Count 44 24 23 24 7 122
% within W-2s 38.6% 40.0% 48.9% 48.0% 35.0% 41.9%
Part in-house developed
system, part by a service
provider
Count 5 3 0 3 2 13
% within W-2s 4.4% 5.0% .0% 6.0% 10.0% 4.5%
Part in-house licensed
system, part by a service
provider
Count 13 6 4 5 1 29
% within W-2s 11.4% 10.0% 8.5% 10.0% 5.0% 10.0%
All by a service provider
within the U.S.
Count 40 25 17 9 9 100
% within W-2s 35.1% 41.7% 36.2% 18.0% 45.0% 34.4%
All by a service provider
outside the U.S.
Count 2 1 1 0 0 4
% within W-2s 1.8% 1.7% 2.1% .0% .0% 1.4%
Total Count 114 60 47 50 20 291
% within W-2s 100.0% 100.0% 100.0% 100.0% 100.0% 100.0%

2011 Survey of Salaries and the Payroll Profession 115
W-2s
Total < 500 500 - 1,499 1,500 - 4,999 5,000 + NA
Q39. Does your organization
plan to outsource all or part of
your payroll processing in the
future?
Yes Count 7 3 1 2 0 13
% within W-2s 10.0% 9.4% 3.6% 5.0% .0% 7.3%
No / don't know Count 63 29 27 38 9 166
% within W-2s 90.0% 90.6% 96.4% 95.0% 100.0% 92.7%
Total Count 70 32 28 40 9 179
% within W-2s 100.0% 100.0% 100.0% 100.0% 100.0% 100.0%
W-2s
Total < 500 500 - 1,499 1,500 - 4,999 5,000 + NA
Q40. When was the last time
the payroll department began
using new payroll processing
software?
In the last year Count 11 1 2 4 1 19
% within W-2s 15.7% 3.0% 6.9% 9.8% 9.1% 10.3%
1 to < 2 years ago Count 6 2 2 2 1 13
% within W-2s 8.6% 6.1% 6.9% 4.9% 9.1% 7.1%
2 to < 5 years ago Count 21 6 6 17 2 52
% within W-2s 30.0% 18.2% 20.7% 41.5% 18.2% 28.3%
5 years ago or longer Count 32 24 19 18 7 100
% within W-2s 45.7% 72.7% 65.5% 43.9% 63.6% 54.3%
Total Count 70 33 29 41 11 184
% within W-2s 100.0% 100.0% 100.0% 100.0% 100.0% 100.0%

2011 Survey of Salaries and the Payroll Profession 116
W-2s
Total < 500 500 - 1,499 1,500 - 4,999 5,000 + NA
Q41. What was the source of
the last-installed payroll
processing software?
Custom-built, in house Count 3 1 0 3 1 8
% within W-2s 4.3% 3.0% .0% 7.5% 10.0% 4.5%
Purchased from a vendor Count 30 16 10 15 7 78
% within W-2s 43.5% 48.5% 37.0% 37.5% 70.0% 43.6%
Licensed from a vendor Count 33 16 15 20 2 86
% within W-2s 47.8% 48.5% 55.6% 50.0% 20.0% 48.0%
Not applicable Count 3 0 2 2 0 7
% within W-2s 4.3% .0% 7.4% 5.0% .0% 3.9%
Total Count 69 33 27 40 10 179
% within W-2s 100.0% 100.0% 100.0% 100.0% 100.0% 100.0%
W-2s *
Total < 500 500 - 1,499 1,500 - 4,999 5,000 + NA
Q42. What was the
approximate cost of
building/acquiring and
installing this last-installed
payroll processing software?
Less than $10,000 Count 16 2 1 0 1 20
% within W-2s 47.1% 20.0% 8.3% .0% 33.3% 26.7%
$10,000 to $99,999 Count 13 3 2 1 0 19
% within W-2s 38.2% 30.0% 16.7% 6.3% .0% 25.3%
$100,000 to $749,999 Count 5 5 7 6 0 23
% within W-2s 14.7% 50.0% 58.3% 37.5% .0% 30.7%
$750,000 + Count 0 0 2 9 2 13
% within W-2s .0% .0% 16.7% 56.3% 66.7% 17.3%
Total Count 34 10 12 16 3 75
% within W-2s 100.0% 100.0% 100.0% 100.0% 100.0% 100.0%

2011 Survey of Salaries and the Payroll Profession 117
W-2s
Total < 500 500 - 1,499 1,500 - 4,999 5,000 + NA
Q43. Does your organization plan
to purchase new payroll-related
software in the future?
Yes Count 14 8 4 12 7 45
% within W-2s 20.0% 24.2% 14.3% 29.3% 63.6% 24.6%
No Count 56 25 24 29 4 138
% within W-2s 80.0% 75.8% 85.7% 70.7% 36.4% 75.4%
Total Count 70 33 28 41 11 183
% within W-2s 100.0% 100.0% 100.0% 100.0% 100.0% 100.0%
W-2s
Total < 500 500 - 1,499 1,500 - 4,999 5,000 + NA
Q45. Does your organization plan
to bring all or part of your payroll
processing in house in the future?
Yes Count 3 1 2 1 2 9
% within W-2s 5.9% 3.6% 10.0% 7.7% 18.2% 7.3%
No Count 48 27 18 12 9 114
% within W-2s 94.1% 96.4% 90.0% 92.3% 81.8% 92.7%
Total Count 51 28 20 13 11 123
% within W-2s 100.0% 100.0% 100.0% 100.0% 100.0% 100.0%

2011 Survey of Salaries and the Payroll Profession 118
W-2s *
Total < 500 500 - 1,499 1,500 - 4,999 5,000 + NA
Q47. How many people are
employed full-time by your
entire organization?
< 150 Count 51 2 1 1 2 57
% within W-2s 45.9% 3.2% 2.2% 2.0% 10.5% 19.9%
150 - 499 Count 59 22 2 1 7 91
% within W-2s 53.2% 35.5% 4.4% 2.0% 36.8% 31.7%
500 - 1,499 Count 0 38 20 0 4 62
% within W-2s .0% 61.3% 44.4% .0% 21.1% 21.6%
1,500 - 4,999 Count 1 0 22 13 0 36
% within W-2s .9% .0% 48.9% 26.0% .0% 12.5%
5,000 + Count 0 0 0 35 6 41
% within W-2s .0% .0% .0% 70.0% 31.6% 14.3%
Total Count 111 62 45 50 19 287
% within W-2s 100.0% 100.0% 100.0% 100.0% 100.0% 100.0%
Median
W-2s Q47. How many
people are employed
full-time by your
entire organization?
*
< 500 160.00
500 - 1,499 533.50
1,500 - 4,999 1425.00
5,000 + 6725.00
NA 741.00
Total 450.00

2011 Survey of Salaries and the Payroll Profession 119
W-2s *
Total < 500 500 - 1,499 1,500 - 4,999 5,000 + NA
Q47. How many people are
employed part-time by your
entire organization? (Convert
part-time employees to full-
time equivalents - FTE)
0 / None reported Count 46 21 14 16 6 103
% within W-2s 41.1% 33.9% 31.1% 32.0% 31.6% 35.8%
1 - 149 Count 62 34 14 8 9 127
% within W-2s 55.4% 54.8% 31.1% 16.0% 47.4% 44.1%
150 - 499 Count 4 6 9 6 2 27
% within W-2s 3.6% 9.7% 20.0% 12.0% 10.5% 9.4%
500 - 1,499 Count 0 1 7 6 0 14
% within W-2s .0% 1.6% 15.6% 12.0% .0% 4.9%
1,500 + Count 0 0 1 14 2 17
% within W-2s .0% .0% 2.2% 28.0% 10.5% 5.9%
Total Count 112 62 45 50 19 288
% within W-2s 100.0% 100.0% 100.0% 100.0% 100.0% 100.0%
W-2s
Total < 500 500 - 1,499 1,500 - 4,999 5,000 + NA
Q48. What is the location of
all or most of the payroll-
related jobs?
Metro area with a population
of 1,000,000 or more
Count 32 20 12 21 9 94
% within W-2s 29.4% 32.3% 25.5% 44.7% 47.4% 33.1%
Metro area with a population
of 500,000 to 999,999
Count 13 15 6 11 1 46
% within W-2s 11.9% 24.2% 12.8% 23.4% 5.3% 16.2%
Metro area with a population
of 250,000 to 499,999
Count 14 3 6 4 1 28
% within W-2s 12.8% 4.8% 12.8% 8.5% 5.3% 9.9%
Metro area with a population
of 50,000 to 249,999
Count 22 14 12 7 3 58
% within W-2s 20.2% 22.6% 25.5% 14.9% 15.8% 20.4%
City of 10,000 to 49,999 Count 22 6 11 2 2 43
% within W-2s 20.2% 9.7% 23.4% 4.3% 10.5% 15.1%
Town of fewer than
10,000/rural area
Count 6 4 0 2 3 15
% within W-2s 5.5% 6.5% .0% 4.3% 15.8% 5.3%
Total Count 109 62 47 47 19 284
% within W-2s 100.0% 100.0% 100.0% 100.0% 100.0% 100.0%

2011 Survey of Salaries and the Payroll Profession 120
W-2s *
Total < 500 500 - 1,499 1,500 - 4,999 5,000 + NA
Q49. What was the annual
gross revenue of your entire
organization for the most
recent year?
< $50 million Count 59 7 4 3 5 78
% within W-2s 61.5% 14.6% 11.1% 7.0% 41.7% 33.2%
$50 million – $100 million Count 19 12 3 3 0 37
% within W-2s 19.8% 25.0% 8.3% 7.0% .0% 15.7%
> $100 million but < $500
million
Count 12 17 10 3 3 45
% within W-2s 12.5% 35.4% 27.8% 7.0% 25.0% 19.1%
$500 million – $1 billion Count 3 10 7 7 1 28
% within W-2s 3.1% 20.8% 19.4% 16.3% 8.3% 11.9%
> $1 billion but < $5 billion Count 2 2 12 14 2 32
% within W-2s 2.1% 4.2% 33.3% 32.6% 16.7% 13.6%
$5 billion – $10 billion Count 1 0 0 8 0 9
% within W-2s 1.0% .0% .0% 18.6% .0% 3.8%
More than $10 billion Count 0 0 0 5 1 6
% within W-2s .0% .0% .0% 11.6% 8.3% 2.6%
Total Count 96 48 36 43 12 235
% within W-2s 100.0% 100.0% 100.0% 100.0% 100.0% 100.0%
W-2s *
Total < 500 500 - 1,499 1,500 - 4,999 5,000 + NA
Q50. Has your organization been
involved in a merger, acquisition,
or divestiture in the last two
years?
Yes Count 12 23 16 21 6 78
% within W-2s 11.0% 37.1% 34.0% 42.9% 35.3% 27.5%
No Count 97 39 31 28 11 206
% within W-2s 89.0% 62.9% 66.0% 57.1% 64.7% 72.5%
Total Count 109 62 47 49 17 284
% within W-2s 100.0% 100.0% 100.0% 100.0% 100.0% 100.0%

2011 Survey of Salaries and the Payroll Profession 121
X. Cross-tabulations by Region

2011 Survey of Salaries and the Payroll Profession 122
Cross-tabulations by region begin on the next page and are based on the state (re-coded into four regions) from membership records. (However, one returned survey had the tracking ID removed by the respondent, and it was not possible to determine the state for that record.) The table below shows common definitions for 5 regions, however it was necessary to combine the West and Pacific regions to allow a sufficient number of respondents for analysis.
Northeast South Midwest West Pacific
Connecticut Alabama Illinois Arizona Alaska
Maine Arkansas Indiana Colorado California
Massachusetts Delaware Iowa Idaho Hawaii
New Hampshire Florida Kansas Montana Oregon
New Jersey Georgia Michigan Nevada Washington
New York Kentucky Minnesota New Mexico
Pennsylvania Louisiana Missouri Utah
Rhode Island Maryland Nebraska Wyoming
Vermont Mississippi North Dakota
North Carolina Ohio
Oklahoma South Dakota
South Carolina Wisconsin
Tennessee
Texas
Virginia
Washington, DC
West Virginia

2011 Survey of Salaries and the Payroll Profession 123
Region
Total Northeast South Midwest West / Pacific
Q1. Which ONE of the
following best describes your
organization?
Education Count 6 9 6 8 29
% within Region 14.3% 10.0% 7.0% 11.0% 10.0%
Finance Count 5 8 8 4 25
% within Region 11.9% 8.9% 9.3% 5.5% 8.6%
Government Count 1 12 9 6 28
% within Region 2.4% 13.3% 10.5% 8.2% 9.6%
Hospitality Count 0 3 2 1 6
% within Region .0% 3.3% 2.3% 1.4% 2.1%
Manufacturing Count 11 13 12 8 44
% within Region 26.2% 14.4% 14.0% 11.0% 15.1%
Sales Count 1 3 5 3 12
% within Region 2.4% 3.3% 5.8% 4.1% 4.1%
Services Count 10 16 27 15 68
% within Region 23.8% 17.8% 31.4% 20.5% 23.4%
Other Industries Count 8 26 17 28 79
% within Region 19.0% 28.9% 19.8% 38.4% 27.1%
Total Count 42 90 86 73 291
% within Region 100.0% 100.0% 100.0% 100.0% 100.0%
Region
Total Northeast South Midwest West / Pacific
Q2. Does your payroll department
provide payroll functions at more
than one job site?
Yes Count 8 21 22 10 61
% within Region 18.6% 23.1% 25.6% 13.3% 20.7%
No Count 35 70 64 65 234
% within Region 81.4% 76.9% 74.4% 86.7% 79.3%
Total Count 43 91 86 75 295
% within Region 100.0% 100.0% 100.0% 100.0% 100.0%
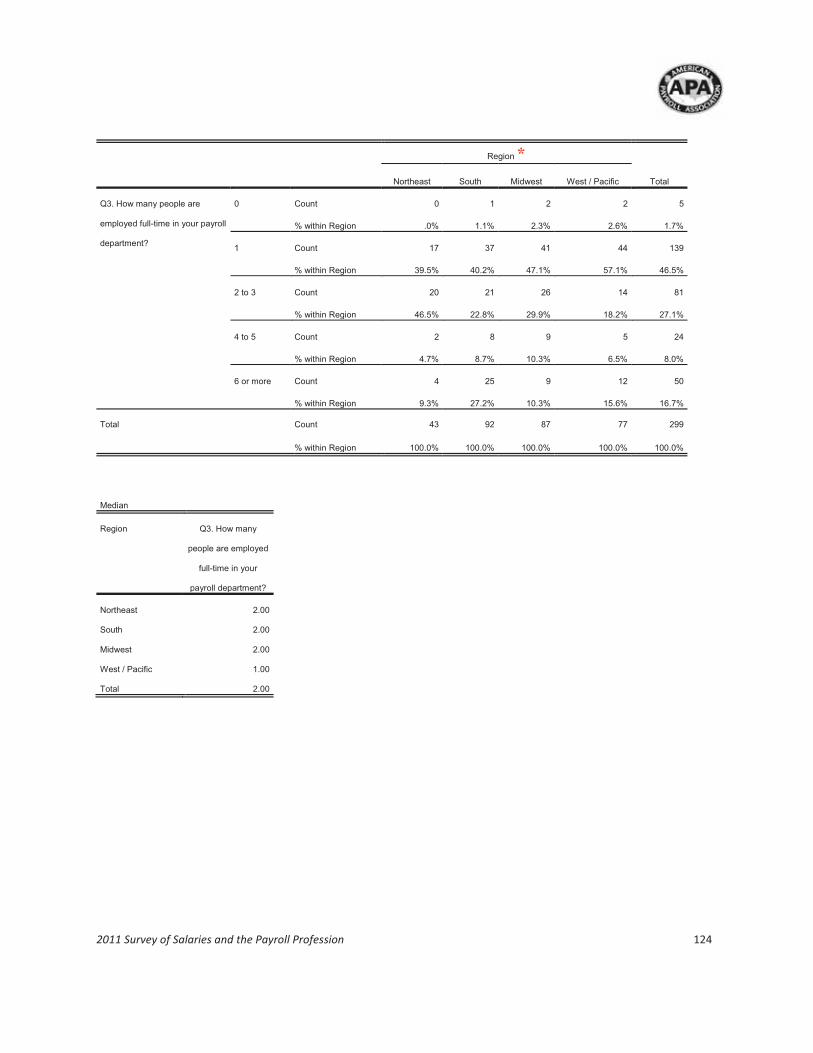
2011 Survey of Salaries and the Payroll Profession 124
Region *
Total Northeast South Midwest West / Pacific
Q3. How many people are
employed full-time in your payroll
department?
0 Count 0 1 2 2 5
% within Region .0% 1.1% 2.3% 2.6% 1.7%
1 Count 17 37 41 44 139
% within Region 39.5% 40.2% 47.1% 57.1% 46.5%
2 to 3 Count 20 21 26 14 81
% within Region 46.5% 22.8% 29.9% 18.2% 27.1%
4 to 5 Count 2 8 9 5 24
% within Region 4.7% 8.7% 10.3% 6.5% 8.0%
6 or more Count 4 25 9 12 50
% within Region 9.3% 27.2% 10.3% 15.6% 16.7%
Total Count 43 92 87 77 299
% within Region 100.0% 100.0% 100.0% 100.0% 100.0%
Median
Region Q3. How many
people are employed
full-time in your
payroll department?
Northeast 2.00
South 2.00
Midwest 2.00
West / Pacific 1.00
Total 2.00

2011 Survey of Salaries and the Payroll Profession 125
Region
Total Northeast South Midwest West / Pacific
Q3. How many people are
employed part-time in your
payroll department? (Convert
part-time employees to full-
time equivalents - FTE)
0 / None reported Count 37 81 71 65 254
% within Region 86.0% 88.0% 81.6% 84.4% 84.9%
0.1 to 1 Count 5 6 15 11 37
% within Region 11.6% 6.5% 17.2% 14.3% 12.4%
2 to 3 Count 1 4 0 0 5
% within Region 2.3% 4.3% .0% .0% 1.7%
4 or more Count 0 1 1 1 3
% within Region .0% 1.1% 1.1% 1.3% 1.0%
Total Count 43 92 87 77 299
% within Region 100.0% 100.0% 100.0% 100.0% 100.0%
Region
Total Northeast South Midwest West / Pacific
Q4: The highest level of education
completed is high school or less
for at least one full-time employee
in the payroll department
No Count 20 31 42 36 129
% within Region 51.3% 34.8% 53.2% 50.7% 46.4%
Yes Count 19 58 37 35 149
% within Region 48.7% 65.2% 46.8% 49.3% 53.6%
Total Count 39 89 79 71 278
% within Region 100.0% 100.0% 100.0% 100.0% 100.0%
Region
Total Northeast South Midwest West / Pacific
Q4: The highest level of education
completed is an Associate's
degree for at least one full-time
employee in the payroll
department
No Count 24 54 44 47 169
% within Region 61.5% 60.7% 55.7% 66.2% 60.8%
Yes Count 15 35 35 24 109
% within Region 38.5% 39.3% 44.3% 33.8% 39.2%
Total Count 39 89 79 71 278
% within Region 100.0% 100.0% 100.0% 100.0% 100.0%

2011 Survey of Salaries and the Payroll Profession 126
Region
Total Northeast South Midwest West / Pacific
Q4: The highest level of education
completed is a Bachelor's degree
for at least one full-time employee
in the payroll department
No Count 20 34 36 33 123
% within Region 51.3% 38.2% 45.6% 46.5% 44.2%
Yes Count 19 55 43 38 155
% within Region 48.7% 61.8% 54.4% 53.5% 55.8%
Total Count 39 89 79 71 278
% within Region 100.0% 100.0% 100.0% 100.0% 100.0%
Region
Total Northeast South Midwest West / Pacific
Q4: The highest level of education
completed is a Master's degree or
higher for at least one full-time
employee in the payroll
department
No Count 31 73 70 62 236
% within Region 79.5% 82.0% 88.6% 87.3% 84.9%
Yes Count 8 16 9 9 42
% within Region 20.5% 18.0% 11.4% 12.7% 15.1%
Total Count 39 89 79 71 278
% within Region 100.0% 100.0% 100.0% 100.0% 100.0%
Region
Total Northeast South Midwest West / Pacific
Q5. At least one person in the
department holds Certified Payroll
Professional (CPP) certification
No Count 14 41 39 32 126
% within Region 38.9% 48.8% 49.4% 49.2% 47.7%
Yes Count 22 43 40 33 138
% within Region 61.1% 51.2% 50.6% 50.8% 52.3%
Total Count 36 84 79 65 264
% within Region 100.0% 100.0% 100.0% 100.0% 100.0%

2011 Survey of Salaries and the Payroll Profession 127
Region
Total Northeast South Midwest West / Pacific
Q5. At least one person in the
department holds Senior
Professional in Human Resources
(SPHR) certification
No Count 35 81 76 63 255
% within Region 97.2% 96.4% 96.2% 96.9% 96.6%
Yes Count 1 3 3 2 9
% within Region 2.8% 3.6% 3.8% 3.1% 3.4%
Total Count 36 84 79 65 264
% within Region 100.0% 100.0% 100.0% 100.0% 100.0%
Region
Total Northeast South Midwest West / Pacific
Q5. At least one person in the
department holds Fundamental
Payroll Certification (FPC)
certification
No Count 34 75 74 56 239
% within Region 94.4% 89.3% 93.7% 86.2% 90.5%
Yes Count 2 9 5 9 25
% within Region 5.6% 10.7% 6.3% 13.8% 9.5%
Total Count 36 84 79 65 264
% within Region 100.0% 100.0% 100.0% 100.0% 100.0%
Region
Total Northeast South Midwest West / Pacific
Q5. At least one person in the
department holds Certified
Employee Benefit Specialist
(CEBS) certification
No Count 36 83 78 65 262
% within Region 100.0% 98.8% 98.7% 100.0% 99.2%
Yes Count 0 1 1 0 2
% within Region .0% 1.2% 1.3% .0% .8%
Total Count 36 84 79 65 264
% within Region 100.0% 100.0% 100.0% 100.0% 100.0%

2011 Survey of Salaries and the Payroll Profession 128
Region
Total Northeast South Midwest West / Pacific
Q5. At least one person in the
department holds Certified Public
Accountant (CPA) certification
No Count 36 76 76 61 249
% within Region 100.0% 90.5% 96.2% 93.8% 94.3%
Yes Count 0 8 3 4 15
% within Region .0% 9.5% 3.8% 6.2% 5.7%
Total Count 36 84 79 65 264
% within Region 100.0% 100.0% 100.0% 100.0% 100.0%
Region
Total Northeast South Midwest West / Pacific
Q5. At least one person in the
department holds Certified
Accounts Payable Professional
(CAPP) certification
No Count 35 84 78 65 262
% within Region 97.2% 100.0% 98.7% 100.0% 99.2%
Yes Count 1 0 1 0 2
% within Region 2.8% .0% 1.3% .0% .8%
Total Count 36 84 79 65 264
% within Region 100.0% 100.0% 100.0% 100.0% 100.0%
Region
Total Northeast South Midwest West / Pacific
Q5. At least one person in the
department holds Professional in
Human Resources (PHR)
certification
No Count 36 76 75 62 249
% within Region 100.0% 90.5% 94.9% 95.4% 94.3%
Yes Count 0 8 4 3 15
% within Region .0% 9.5% 5.1% 4.6% 5.7%
Total Count 36 84 79 65 264
% within Region 100.0% 100.0% 100.0% 100.0% 100.0%

2011 Survey of Salaries and the Payroll Profession 129
Region
Total Northeast South Midwest West / Pacific
Q6a. On average, how many
hours of professional
development on payroll-related
issues are offered each year to
ENTRY-LEVEL payroll staff?
0 / None reported Count 32 69 68 52 221
% within Region 74.4% 75.0% 78.2% 67.5% 73.9%
1 to 9 hours Count 2 6 2 5 15
% within Region 4.7% 6.5% 2.3% 6.5% 5.0%
10 to 19 hours Count 2 6 9 10 27
% within Region 4.7% 6.5% 10.3% 13.0% 9.0%
20 to 29 hours Count 3 5 3 5 16
% within Region 7.0% 5.4% 3.4% 6.5% 5.4%
30 to 49 hours Count 4 6 4 5 19
% within Region 9.3% 6.5% 4.6% 6.5% 6.4%
50 or more hours Count 0 0 1 0 1
% within Region .0% .0% 1.1% .0% .3%
Total Count 43 92 87 77 299
% within Region 100.0% 100.0% 100.0% 100.0% 100.0%
Region
Total Northeast South Midwest West / Pacific
Q6b. On average, how many
hours of professional
development on payroll-related
issues are offered each year to
INTERMEDIATE-LEVEL
payroll staff?
0 / None reported Count 28 50 48 44 170
% within Region 65.1% 54.3% 55.2% 57.1% 56.9%
1 to 9 hours Count 3 12 11 9 35
% within Region 7.0% 13.0% 12.6% 11.7% 11.7%
10 to 19 hours Count 5 10 14 6 35
% within Region 11.6% 10.9% 16.1% 7.8% 11.7%
20 to 29 hours Count 2 5 10 10 27
% within Region 4.7% 5.4% 11.5% 13.0% 9.0%
30 to 49 hours Count 4 15 2 8 29
% within Region 9.3% 16.3% 2.3% 10.4% 9.7%
50 or more hours Count 1 0 2 0 3
% within Region 2.3% .0% 2.3% .0% 1.0%
Total Count 43 92 87 77 299
% within Region 100.0% 100.0% 100.0% 100.0% 100.0%

2011 Survey of Salaries and the Payroll Profession 130
Region
Total Northeast South Midwest West / Pacific
Q6c. On average, how many
hours of professional
development on payroll-related
issues are offered each year to
SENIOR-LEVEL payroll staff?
0 / None reported Count 15 35 36 34 120
% within Region 34.9% 38.0% 41.4% 44.2% 40.1%
1 to 9 hours Count 5 7 8 10 30
% within Region 11.6% 7.6% 9.2% 13.0% 10.0%
10 to 19 hours Count 9 10 11 5 35
% within Region 20.9% 10.9% 12.6% 6.5% 11.7%
20 to 29 hours Count 6 15 11 8 40
% within Region 14.0% 16.3% 12.6% 10.4% 13.4%
30 to 49 hours Count 7 20 13 15 55
% within Region 16.3% 21.7% 14.9% 19.5% 18.4%
50 or more hours Count 1 5 8 5 19
% within Region 2.3% 5.4% 9.2% 6.5% 6.4%
Total Count 43 92 87 77 299
% within Region 100.0% 100.0% 100.0% 100.0% 100.0%
Region
Total Northeast South Midwest West / Pacific
Q7. What is your budget for
training and education of
payroll staff for the current
fiscal year?
$0 Count 16 31 33 26 106
% within Region 44.4% 38.3% 42.9% 38.8% 40.6%
$1 - $999 Count 4 7 13 12 36
% within Region 11.1% 8.6% 16.9% 17.9% 13.8%
$1,000 - $1,999 Count 3 13 8 8 32
% within Region 8.3% 16.0% 10.4% 11.9% 12.3%
$2,000 - $4,999 Count 8 13 10 10 41
% within Region 22.2% 16.0% 13.0% 14.9% 15.7%
$5,000 + Count 5 17 13 11 46
% within Region 13.9% 21.0% 16.9% 16.4% 17.6%
Total Count 36 81 77 67 261
% within Region 100.0% 100.0% 100.0% 100.0% 100.0%

2011 Survey of Salaries and the Payroll Profession 131
Region
Total Northeast South Midwest West / Pacific
Q8. Where does the payroll
function report in your
organization?
Payroll is a stand-alone
department
Count 1 7 4 2 14
% within Region 2.4% 7.8% 4.7% 2.6% 4.8%
Payroll is a unit within an
accounting or finance
department
Count 28 46 57 51 182
% within Region 66.7% 51.1% 67.1% 67.1% 62.1%
Payroll is a unit within a
human resources or
personnel department
Count 8 27 16 19 70
% within Region 19.0% 30.0% 18.8% 25.0% 23.9%
Payroll is a unit within a
shared services department
Count 3 9 6 2 20
% within Region 7.1% 10.0% 7.1% 2.6% 6.8%
Other Count 2 1 2 2 7
% within Region 4.8% 1.1% 2.4% 2.6% 2.4%
Total Count 42 90 85 76 293
% within Region 100.0% 100.0% 100.0% 100.0% 100.0%
Region
Total Northeast South Midwest West / Pacific
Q9. Which methods are used to
input payroll data: Batch input by
payroll
No Count 20 45 36 40 141
% within Region 46.5% 50.6% 41.9% 51.9% 47.8%
Yes Count 23 44 50 37 154
% within Region 53.5% 49.4% 58.1% 48.1% 52.2%
Total Count 43 89 86 77 295
% within Region 100.0% 100.0% 100.0% 100.0% 100.0%

2011 Survey of Salaries and the Payroll Profession 132
Region
Total Northeast South Midwest West / Pacific
Q9. Which methods are used to
input payroll data: File transfers
from systems
No Count 28 62 56 52 198
% within Region 65.1% 69.7% 65.1% 67.5% 67.1%
Yes Count 15 27 30 25 97
% within Region 34.9% 30.3% 34.9% 32.5% 32.9%
Total Count 43 89 86 77 295
% within Region 100.0% 100.0% 100.0% 100.0% 100.0%
Region *
Total Northeast South Midwest West / Pacific
Q9. Which methods are used to
input payroll data: Web-based
input by managers (self-service)
No Count 41 66 69 68 244
% within Region 95.3% 74.2% 80.2% 88.3% 82.7%
Yes Count 2 23 17 9 51
% within Region 4.7% 25.8% 19.8% 11.7% 17.3%
Total Count 43 89 86 77 295
% within Region 100.0% 100.0% 100.0% 100.0% 100.0%
Region
Total Northeast South Midwest West / Pacific
Q9. Which methods are used to
input payroll data: System input
by payroll
No Count 27 50 62 48 187
% within Region 62.8% 56.2% 72.1% 62.3% 63.4%
Yes Count 16 39 24 29 108
% within Region 37.2% 43.8% 27.9% 37.7% 36.6%
Total Count 43 89 86 77 295
% within Region 100.0% 100.0% 100.0% 100.0% 100.0%

2011 Survey of Salaries and the Payroll Profession 133
Region
Total Northeast South Midwest West / Pacific
Q9. Which methods are used to
input payroll data: System input
by others
No Count 40 71 77 70 258
% within Region 93.0% 79.8% 89.5% 90.9% 87.5%
Yes Count 3 18 9 7 37
% within Region 7.0% 20.2% 10.5% 9.1% 12.5%
Total Count 43 89 86 77 295
% within Region 100.0% 100.0% 100.0% 100.0% 100.0%
Region
Total Northeast South Midwest West / Pacific
Q9. Which methods are used to
input payroll data: Web-based
input by employees (self-service)
No Count 33 69 65 54 221
% within Region 76.7% 77.5% 75.6% 70.1% 74.9%
Yes Count 10 20 21 23 74
% within Region 23.3% 22.5% 24.4% 29.9% 25.1%
Total Count 43 89 86 77 295
% within Region 100.0% 100.0% 100.0% 100.0% 100.0%
Region
Total Northeast South Midwest West / Pacific
Q9. Which methods are used to
input payroll data: Batch input by
others
No Count 41 76 80 73 270
% within Region 95.3% 85.4% 93.0% 94.8% 91.5%
Yes Count 2 13 6 4 25
% within Region 4.7% 14.6% 7.0% 5.2% 8.5%
Total Count 43 89 86 77 295
% within Region 100.0% 100.0% 100.0% 100.0% 100.0%
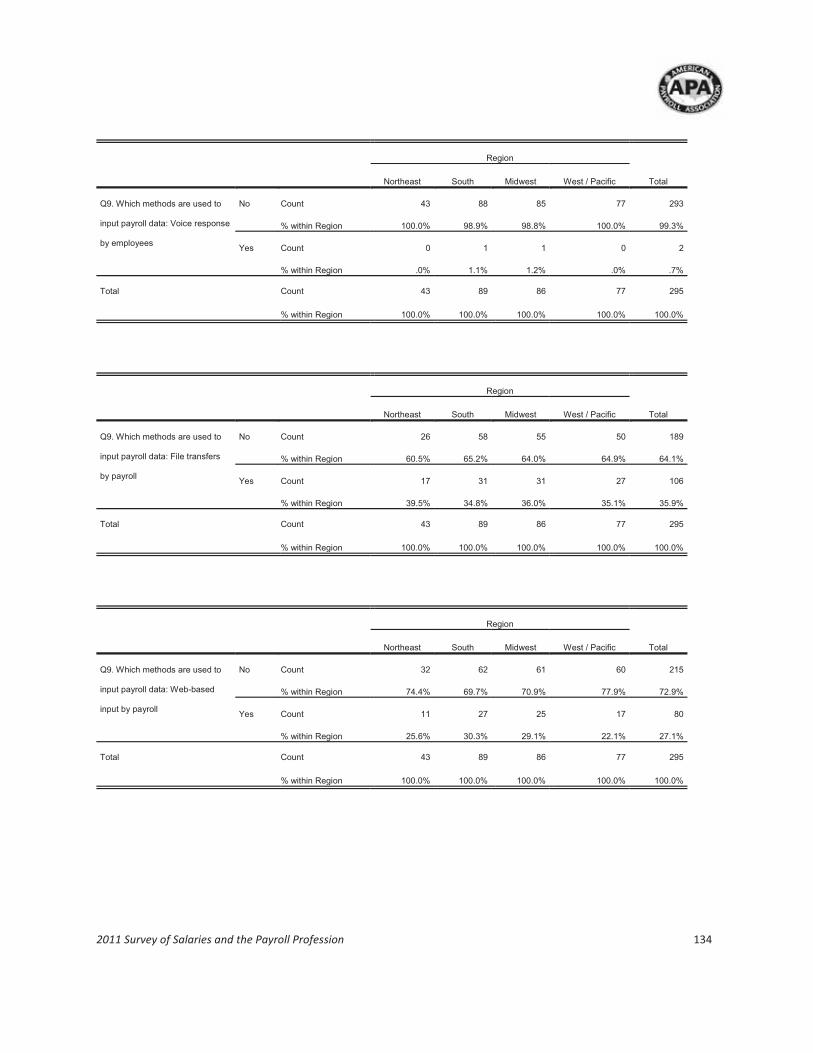
2011 Survey of Salaries and the Payroll Profession 134
Region
Total Northeast South Midwest West / Pacific
Q9. Which methods are used to
input payroll data: Voice response
by employees
No Count 43 88 85 77 293
% within Region 100.0% 98.9% 98.8% 100.0% 99.3%
Yes Count 0 1 1 0 2
% within Region .0% 1.1% 1.2% .0% .7%
Total Count 43 89 86 77 295
% within Region 100.0% 100.0% 100.0% 100.0% 100.0%
Region
Total Northeast South Midwest West / Pacific
Q9. Which methods are used to
input payroll data: File transfers
by payroll
No Count 26 58 55 50 189
% within Region 60.5% 65.2% 64.0% 64.9% 64.1%
Yes Count 17 31 31 27 106
% within Region 39.5% 34.8% 36.0% 35.1% 35.9%
Total Count 43 89 86 77 295
% within Region 100.0% 100.0% 100.0% 100.0% 100.0%
Region
Total Northeast South Midwest West / Pacific
Q9. Which methods are used to
input payroll data: Web-based
input by payroll
No Count 32 62 61 60 215
% within Region 74.4% 69.7% 70.9% 77.9% 72.9%
Yes Count 11 27 25 17 80
% within Region 25.6% 30.3% 29.1% 22.1% 27.1%
Total Count 43 89 86 77 295
% within Region 100.0% 100.0% 100.0% 100.0% 100.0%

2011 Survey of Salaries and the Payroll Profession 135
Region
Total Northeast South Midwest West / Pacific
Q9. Which methods are used to
input payroll data: Other
No Count 42 87 85 74 288
% within Region 97.7% 97.8% 98.8% 96.1% 97.6%
Yes Count 1 2 1 3 7
% within Region 2.3% 2.2% 1.2% 3.9% 2.4%
Total Count 43 89 86 77 295
% within Region 100.0% 100.0% 100.0% 100.0% 100.0%
Region *
Total Northeast South Midwest West / Pacific
Q10. Which of the following pay
frequencies does your
organization use: Weekly
No Count 27 67 62 66 222
% within Region 62.8% 72.8% 71.3% 85.7% 74.2%
Yes Count 16 25 25 11 77
% within Region 37.2% 27.2% 28.7% 14.3% 25.8%
Total Count 43 92 87 77 299
% within Region 100.0% 100.0% 100.0% 100.0% 100.0%
Region
Total Northeast South Midwest West / Pacific
Q10. Which of the following pay
frequencies does your
organization use: Semimonthly
No Count 32 62 63 51 208
% within Region 74.4% 67.4% 72.4% 66.2% 69.6%
Yes Count 11 30 24 26 91
% within Region 25.6% 32.6% 27.6% 33.8% 30.4%
Total Count 43 92 87 77 299
% within Region 100.0% 100.0% 100.0% 100.0% 100.0%

2011 Survey of Salaries and the Payroll Profession 136
Region
Total Northeast South Midwest West / Pacific
Q10. Which of the following pay
frequencies does your
organization use: Biweekly
No Count 16 28 29 28 101
% within Region 37.2% 30.4% 33.3% 36.4% 33.8%
Yes Count 27 64 58 49 198
% within Region 62.8% 69.6% 66.7% 63.6% 66.2%
Total Count 43 92 87 77 299
% within Region 100.0% 100.0% 100.0% 100.0% 100.0%
Region
Total Northeast South Midwest West / Pacific
Q10. Which of the following pay
frequencies does your
organization use: Monthly
No Count 36 70 73 59 238
% within Region 83.7% 76.1% 83.9% 76.6% 79.6%
Yes Count 7 22 14 18 61
% within Region 16.3% 23.9% 16.1% 23.4% 20.4%
Total Count 43 92 87 77 299
% within Region 100.0% 100.0% 100.0% 100.0% 100.0%
Region
Total Northeast South Midwest West / Pacific
Q10. Which of the following pay
frequencies does your
organization use: Other
No Count 43 90 86 77 296
% within Region 100.0% 97.8% 98.9% 100.0% 99.0%
Yes Count 0 2 1 0 3
% within Region .0% 2.2% 1.1% .0% 1.0%
Total Count 43 92 87 77 299
% within Region 100.0% 100.0% 100.0% 100.0% 100.0%

2011 Survey of Salaries and the Payroll Profession 137
Region
Total Northeast South Midwest West / Pacific
Q11. What is the pay frequency
of the largest payroll?
Weekly Count 10 15 14 6 45
% within Region 23.3% 16.7% 16.1% 7.8% 15.2%
Semimonthly Count 9 19 22 18 68
% within Region 20.9% 21.1% 25.3% 23.4% 22.9%
Biweekly Count 24 47 49 44 164
% within Region 55.8% 52.2% 56.3% 57.1% 55.2%
Monthly Count 0 8 2 8 18
% within Region .0% 8.9% 2.3% 10.4% 6.1%
Other Count 0 1 0 1 2
% within Region .0% 1.1% .0% 1.3% .7%
Total Count 43 90 87 77 297
% within Region 100.0% 100.0% 100.0% 100.0% 100.0%
Region
Total Northeast South Midwest West / Pacific
Q12a. Approximately what
percentage of your
organization’s payroll is
delivered by paper paycheck?
0% Count 9 22 17 19 67
% within Region 20.9% 23.9% 19.8% 25.3% 22.6%
1% to 33% Count 30 57 63 48 198
% within Region 69.8% 62.0% 73.3% 64.0% 66.9%
34% to 66% Count 3 9 3 4 19
% within Region 7.0% 9.8% 3.5% 5.3% 6.4%
67% to 99% Count 0 3 2 3 8
% within Region .0% 3.3% 2.3% 4.0% 2.7%
100% Count 1 1 1 1 4
% within Region 2.3% 1.1% 1.2% 1.3% 1.4%
Total Count 43 92 86 75 296
% within Region 100.0% 100.0% 100.0% 100.0% 100.0%

2011 Survey of Salaries and the Payroll Profession 138
Region
Total Northeast South Midwest West / Pacific
Q12b. Approximately what
percentage of your
organization’s payroll is
delivered by direct deposit?
0% Count 1 1 1 1 4
% within Region 2.3% 1.1% 1.2% 1.3% 1.4%
1% to 33% Count 0 3 3 3 9
% within Region .0% 3.3% 3.5% 4.0% 3.0%
34% to 66% Count 4 11 3 5 23
% within Region 9.3% 12.0% 3.5% 6.7% 7.8%
67% to 99% Count 31 58 66 49 204
% within Region 72.1% 63.0% 76.7% 65.3% 68.9%
100% Count 7 19 13 17 56
% within Region 16.3% 20.7% 15.1% 22.7% 18.9%
Total Count 43 92 86 75 296
% within Region 100.0% 100.0% 100.0% 100.0% 100.0%
Region
Total Northeast South Midwest West / Pacific
Q12c. Approximately what
percentage of your
organization’s payroll is
delivered by paycard?
0% Count 40 78 68 69 255
% within Region 93.0% 84.8% 79.1% 92.0% 86.1%
1% to 33% Count 3 13 18 6 40
% within Region 7.0% 14.1% 20.9% 8.0% 13.5%
34% to 66% Count 0 1 0 0 1
% within Region .0% 1.1% .0% .0% .3%
Total Count 43 92 86 75 296
% within Region 100.0% 100.0% 100.0% 100.0% 100.0%

2011 Survey of Salaries and the Payroll Profession 139
Region
Total Northeast South Midwest West / Pacific
Q12d. Approximately what
percentage of your
organization’s payroll is
delivered by other?
0% Count 42 91 85 74 292
% within Region 97.7% 100.0% 98.8% 98.7% 99.0%
1% to 33% Count 1 0 0 0 1
% within Region 2.3% .0% .0% .0% .3%
34% to 66% Count 0 0 0 1 1
% within Region .0% .0% .0% 1.3% .3%
67% to 99% Count 0 0 1 0 1
% within Region .0% .0% 1.2% .0% .3%
Total Count 43 91 86 75 295
% within Region 100.0% 100.0% 100.0% 100.0% 100.0%
Mean
Region Q12a. Approximately
what percentage of
your organization’s
payroll is delivered by
paper paycheck?
Q12b. Approximately
what percentage of
your organization’s
payroll is delivered by
direct deposit?
Q12c. Approximately
what percentage of
your organization’s
payroll is delivered by
paycard?
Q12d. Approximately
what percentage of
your organization’s
payroll is delivered by
other?
Northeast 16.84 82.37 .77 .02
South 13.78 84.45 1.77 .00
Midwest 10.52 87.19 1.48 .81
West / Pacific 13.13 85.59 .51 .77
Total 13.11 85.23 1.22 .44

2011 Survey of Salaries and the Payroll Profession 140
Region
Total Northeast South Midwest West / Pacific
Q13a. Approximately what
percentage of your
organization’s paystubs are
delivered by e-mail?
0% Count 39 84 75 66 264
% within Region 90.7% 93.3% 89.3% 88.0% 90.4%
1% to 33% Count 1 3 3 4 11
% within Region 2.3% 3.3% 3.6% 5.3% 3.8%
34% to 66% Count 0 1 3 1 5
% within Region .0% 1.1% 3.6% 1.3% 1.7%
67% to 99% Count 1 0 2 3 6
% within Region 2.3% .0% 2.4% 4.0% 2.1%
100% Count 2 2 1 1 6
% within Region 4.7% 2.2% 1.2% 1.3% 2.1%
Total Count 43 90 84 75 292
% within Region 100.0% 100.0% 100.0% 100.0% 100.0%
Region
Total Northeast South Midwest West / Pacific
Q13b. Approximately what
percentage of your
organization’s paystubs are
delivered by online posting?
0% Count 20 38 40 33 131
% within Region 46.5% 42.2% 47.6% 44.0% 44.9%
1% to 33% Count 2 2 6 5 15
% within Region 4.7% 2.2% 7.1% 6.7% 5.1%
34% to 66% Count 4 7 2 5 18
% within Region 9.3% 7.8% 2.4% 6.7% 6.2%
67% to 99% Count 6 18 15 16 55
% within Region 14.0% 20.0% 17.9% 21.3% 18.8%
100% Count 11 25 21 16 73
% within Region 25.6% 27.8% 25.0% 21.3% 25.0%
Total Count 43 90 84 75 292
% within Region 100.0% 100.0% 100.0% 100.0% 100.0%

2011 Survey of Salaries and the Payroll Profession 141
Region
Total Northeast South Midwest West / Pacific
Q13c. Approximately what
percentage of your
organization’s paystubs are
delivered by paper paystub?
0% Count 7 26 20 16 69
% within Region 16.3% 28.9% 23.8% 21.3% 23.6%
1% to 33% Count 9 18 21 18 66
% within Region 20.9% 20.0% 25.0% 24.0% 22.6%
34% to 66% Count 5 8 5 8 26
% within Region 11.6% 8.9% 6.0% 10.7% 8.9%
67% to 99% Count 3 4 8 7 22
% within Region 7.0% 4.4% 9.5% 9.3% 7.5%
100% Count 19 34 30 26 109
% within Region 44.2% 37.8% 35.7% 34.7% 37.3%
Total Count 43 90 84 75 292
% within Region 100.0% 100.0% 100.0% 100.0% 100.0%
Region
Total Northeast South Midwest West / Pacific
Q13d. Approximately what
percentage of your
organization’s paystubs are
delivered by other?
0% Count 42 89 81 74 286
% within Region 100.0% 98.9% 96.4% 98.7% 98.3%
1% to 33% Count 0 0 2 0 2
% within Region .0% .0% 2.4% .0% .7%
67% to 99% Count 0 0 1 0 1
% within Region .0% .0% 1.2% .0% .3%
100% Count 0 1 0 1 2
% within Region .0% 1.1% .0% 1.3% .7%
Total Count 42 90 84 75 291
% within Region 100.0% 100.0% 100.0% 100.0% 100.0%

2011 Survey of Salaries and the Payroll Profession 142
Mean
Region
Q13a. Approximately
what percentage of
your organization’s
paystubs are
delivered by e-mail?
Q13b. Approximately
what percentage of
your organization’s
paystubs are
delivered by online
posting?
Q13c. Approximately
what percentage of
your organization’s
paystubs are
delivered by paper
paystub?
Q13d. Approximately
what percentage of
your organization’s
paystubs are
delivered by other?
Northeast 6.72 43.49 58.28 .00
South 3.22 50.53 47.24 1.11
Midwest 5.48 43.70 49.26 1.60
West / Pacific 5.55 45.77 49.76 1.33
Total 4.98 46.31 50.10 1.15
Region
Total Northeast South Midwest West / Pacific
Q14. How many regularly
scheduled paydays were
handled by payroll staff in 2010
(excluding off-cycle and special
payrolls such as bonuses)?
25 or fewer Count 4 15 15 19 53
% within Region 9.3% 16.3% 17.4% 25.0% 17.8%
26 Count 15 24 25 21 85
% within Region 34.9% 26.1% 29.1% 27.6% 28.6%
27 to 51 Count 7 20 15 19 61
% within Region 16.3% 21.7% 17.4% 25.0% 20.5%
52 Count 7 6 11 5 29
% within Region 16.3% 6.5% 12.8% 6.6% 9.8%
53 or more Count 10 27 20 12 69
% within Region 23.3% 29.3% 23.3% 15.8% 23.2%
Total Count 43 92 86 76 297
% within Region 100.0% 100.0% 100.0% 100.0% 100.0%

2011 Survey of Salaries and the Payroll Profession 143
Region
Total Northeast South Midwest West / Pacific
Q15. Approximately how many
paychecks, direct deposits of
pay, and/or payroll card
transactions were processed
by payroll staff in 2010 (include
off-cycle payments)?
< 7,500 Count 13 30 35 31 109
% within Region 31.7% 34.5% 40.7% 43.7% 38.2%
7,500 to 19,999 Count 9 16 19 17 61
% within Region 22.0% 18.4% 22.1% 23.9% 21.4%
20,000 to 74,999 Count 14 18 22 9 63
% within Region 34.1% 20.7% 25.6% 12.7% 22.1%
75,000 + Count 5 23 10 14 52
% within Region 12.2% 26.4% 11.6% 19.7% 18.2%
Total Count 41 87 86 71 285
% within Region 100.0% 100.0% 100.0% 100.0% 100.0%
Region
Total Northeast South Midwest West / Pacific
Q16. Out of the total number of
payments made to employees
in 2010, how many of these
were off-cycle payments
(bonuses, manual checks,
adjustments, corrections, etc.)?
< 50 Count 14 22 35 23 94
% within Region 35.0% 25.6% 42.7% 32.4% 33.7%
50 to 199 Count 8 11 15 12 46
% within Region 20.0% 12.8% 18.3% 16.9% 16.5%
200 to 999 Count 10 26 17 16 69
% within Region 25.0% 30.2% 20.7% 22.5% 24.7%
1,000 to 9,999 Count 7 18 11 15 51
% within Region 17.5% 20.9% 13.4% 21.1% 18.3%
10,000 + Count 1 9 4 5 19
% within Region 2.5% 10.5% 4.9% 7.0% 6.8%
Total Count 40 86 82 71 279
% within Region 100.0% 100.0% 100.0% 100.0% 100.0%

2011 Survey of Salaries and the Payroll Profession 144
Region
Total Northeast South Midwest West / Pacific
Q17. What is the approximate
total payroll operating budget
for 2011?
< 65,000 Count 4 11 9 13 37
% within Region 12.5% 15.5% 13.6% 23.2% 16.4%
65,000 to 149,999 Count 11 17 22 12 62
% within Region 34.4% 23.9% 33.3% 21.4% 27.6%
150,000 to 499,999 Count 11 20 14 15 60
% within Region 34.4% 28.2% 21.2% 26.8% 26.7%
500,000 + Count 6 23 21 16 66
% within Region 18.8% 32.4% 31.8% 28.6% 29.3%
Total Count 32 71 66 56 225
% within Region 100.0% 100.0% 100.0% 100.0% 100.0%
Median
Region
Q14. How many
regularly scheduled
paydays were
handled by payroll
staff in 2010
(excluding off-cycle
and special payrolls
such as bonuses)?
Q15. Approximately
how many
paychecks, direct
deposits of pay,
and/or payroll card
transactions were
processed by payroll
staff in 2010 (include
off-cycle payments)?
Q16. Out of the total
number of payments
made to employees
in 2010, how many of
these were off-cycle
payments (bonuses,
manual checks,
adjustments,
corrections, etc.)? *
Q17. What is the
approximate total
payroll operating
budget for 2011?
Q18. Approximately
how many W-2s did
your organization
issue for calendar
year 2010?
Northeast 27.00 17000.00 91.00 166500.00 789.00
South 30.00 16947.00 259.00 234000.00 920.00
Midwest 27.50 12750.00 97.50 174500.00 597.50
West / Pacific 26.00 8931.00 200.00 220250.00 530.00
Total 27.00 13000.00 199.00 200000.00 622.50
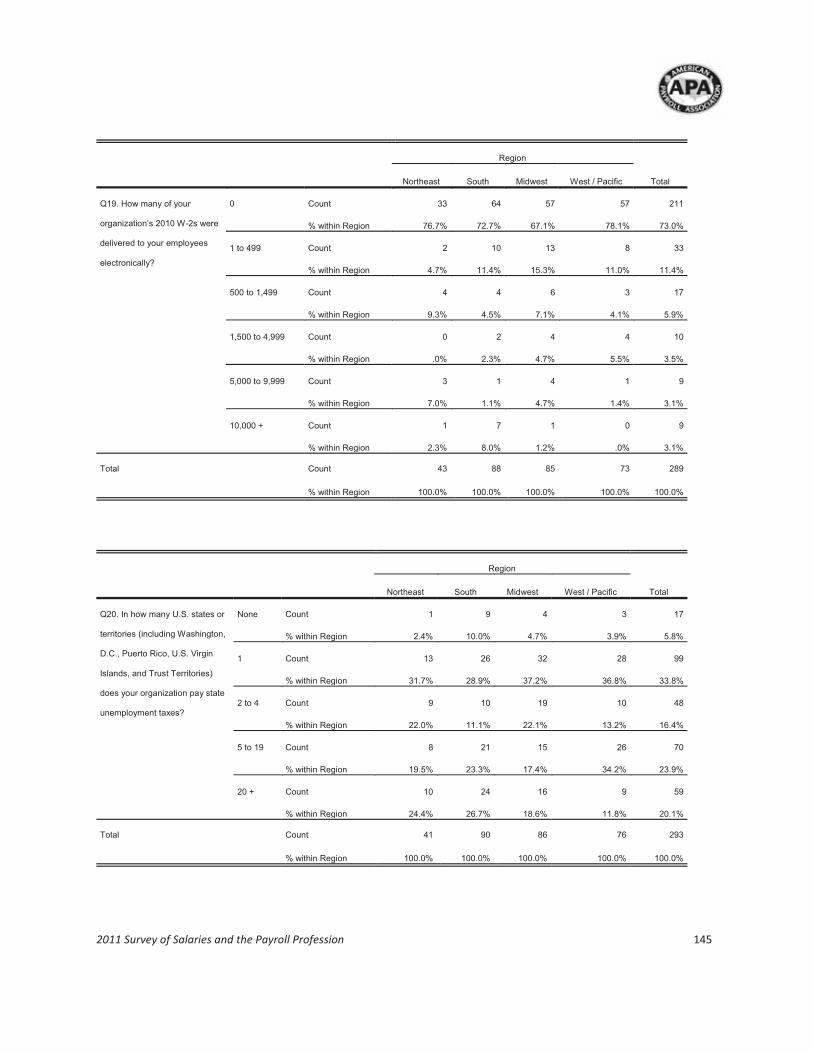
2011 Survey of Salaries and the Payroll Profession 145
Region
Total Northeast South Midwest West / Pacific
Q19. How many of your
organization’s 2010 W-2s were
delivered to your employees
electronically?
0 Count 33 64 57 57 211
% within Region 76.7% 72.7% 67.1% 78.1% 73.0%
1 to 499 Count 2 10 13 8 33
% within Region 4.7% 11.4% 15.3% 11.0% 11.4%
500 to 1,499 Count 4 4 6 3 17
% within Region 9.3% 4.5% 7.1% 4.1% 5.9%
1,500 to 4,999 Count 0 2 4 4 10
% within Region .0% 2.3% 4.7% 5.5% 3.5%
5,000 to 9,999 Count 3 1 4 1 9
% within Region 7.0% 1.1% 4.7% 1.4% 3.1%
10,000 + Count 1 7 1 0 9
% within Region 2.3% 8.0% 1.2% .0% 3.1%
Total Count 43 88 85 73 289
% within Region 100.0% 100.0% 100.0% 100.0% 100.0%
Region
Total Northeast South Midwest West / Pacific
Q20. In how many U.S. states or
territories (including Washington,
D.C., Puerto Rico, U.S. Virgin
Islands, and Trust Territories)
does your organization pay state
unemployment taxes?
None Count 1 9 4 3 17
% within Region 2.4% 10.0% 4.7% 3.9% 5.8%
1 Count 13 26 32 28 99
% within Region 31.7% 28.9% 37.2% 36.8% 33.8%
2 to 4 Count 9 10 19 10 48
% within Region 22.0% 11.1% 22.1% 13.2% 16.4%
5 to 19 Count 8 21 15 26 70
% within Region 19.5% 23.3% 17.4% 34.2% 23.9%
20 + Count 10 24 16 9 59
% within Region 24.4% 26.7% 18.6% 11.8% 20.1%
Total Count 41 90 86 76 293
% within Region 100.0% 100.0% 100.0% 100.0% 100.0%

2011 Survey of Salaries and the Payroll Profession 146
Region
Total Northeast South Midwest West / Pacific
Q21. In how many foreign
countries does your organization
pay expatriate employees?
None Count 34 76 78 62 250
% within Region 81.0% 82.6% 89.7% 81.6% 84.2%
1 to 4 Count 8 10 6 10 34
% within Region 19.0% 10.9% 6.9% 13.2% 11.4%
5 or more Count 0 6 3 4 13
% within Region .0% 6.5% 3.4% 5.3% 4.4%
Total Count 42 92 87 76 297
% within Region 100.0% 100.0% 100.0% 100.0% 100.0%
Region
Total Northeast South Midwest West / Pacific
Q22. How many expatriate
employees does your
organization pay?
None Count 34 75 77 61 247
% within Region 81.0% 81.5% 89.5% 80.3% 83.4%
1 to 9 Count 4 9 4 10 27
% within Region 9.5% 9.8% 4.7% 13.2% 9.1%
10 or more Count 4 8 5 5 22
% within Region 9.5% 8.7% 5.8% 6.6% 7.4%
Total Count 42 92 86 76 296
% within Region 100.0% 100.0% 100.0% 100.0% 100.0%

2011 Survey of Salaries and the Payroll Profession 147
Region
Total Northeast South Midwest West / Pacific
Q23. In how many foreign
countries does your organization
pay local national employees?
None Count 36 79 77 63 255
% within Region 85.7% 86.8% 88.5% 82.9% 86.1%
1 to 4 Count 4 10 9 9 32
% within Region 9.5% 11.0% 10.3% 11.8% 10.8%
5 or more Count 2 2 1 4 9
% within Region 4.8% 2.2% 1.1% 5.3% 3.0%
Total Count 42 91 87 76 296
% within Region 100.0% 100.0% 100.0% 100.0% 100.0%
Region
Total Northeast South Midwest West / Pacific
Q24. How many local national
employees does your
organization pay?
None Count 34 77 74 61 246
% within Region 79.1% 83.7% 85.1% 79.2% 82.3%
1 to 9 Count 1 4 4 3 12
% within Region 2.3% 4.3% 4.6% 3.9% 4.0%
10 or more Count 8 11 9 13 41
% within Region 18.6% 12.0% 10.3% 16.9% 13.7%
Total Count 43 92 87 77 299
% within Region 100.0% 100.0% 100.0% 100.0% 100.0%
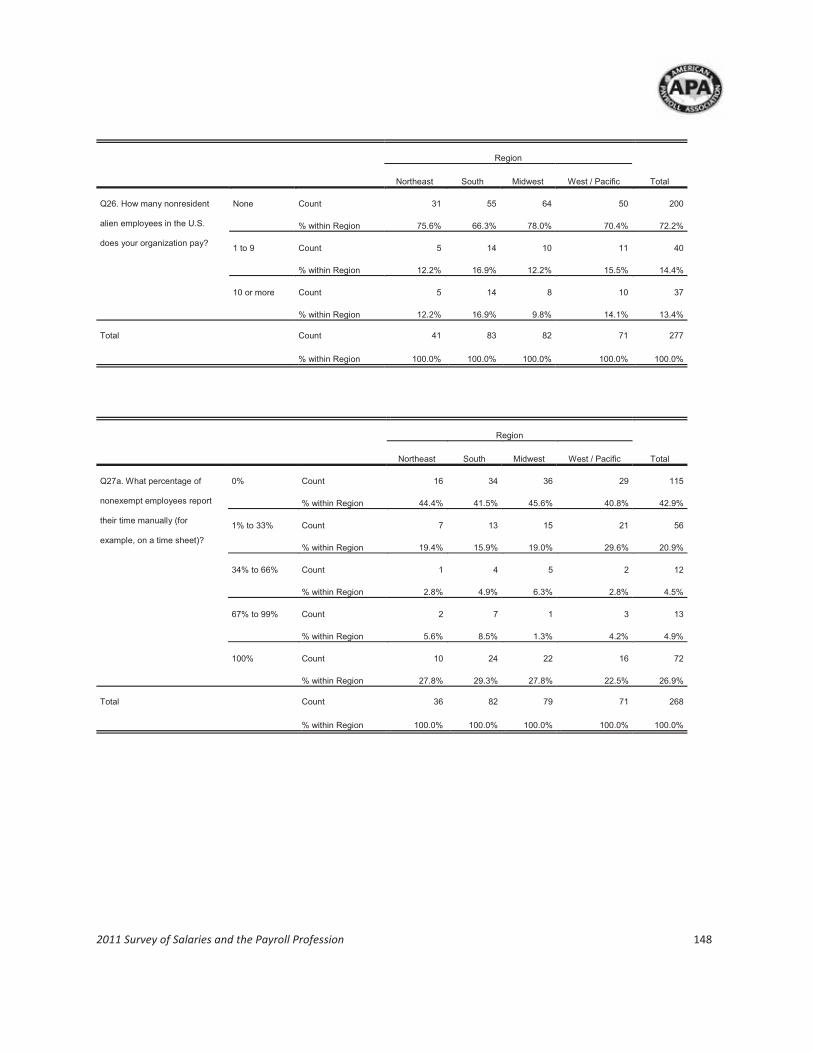
2011 Survey of Salaries and the Payroll Profession 148
Region
Total Northeast South Midwest West / Pacific
Q26. How many nonresident
alien employees in the U.S.
does your organization pay?
None Count 31 55 64 50 200
% within Region 75.6% 66.3% 78.0% 70.4% 72.2%
1 to 9 Count 5 14 10 11 40
% within Region 12.2% 16.9% 12.2% 15.5% 14.4%
10 or more Count 5 14 8 10 37
% within Region 12.2% 16.9% 9.8% 14.1% 13.4%
Total Count 41 83 82 71 277
% within Region 100.0% 100.0% 100.0% 100.0% 100.0%
Region
Total Northeast South Midwest West / Pacific
Q27a. What percentage of
nonexempt employees report
their time manually (for
example, on a time sheet)?
0% Count 16 34 36 29 115
% within Region 44.4% 41.5% 45.6% 40.8% 42.9%
1% to 33% Count 7 13 15 21 56
% within Region 19.4% 15.9% 19.0% 29.6% 20.9%
34% to 66% Count 1 4 5 2 12
% within Region 2.8% 4.9% 6.3% 2.8% 4.5%
67% to 99% Count 2 7 1 3 13
% within Region 5.6% 8.5% 1.3% 4.2% 4.9%
100% Count 10 24 22 16 72
% within Region 27.8% 29.3% 27.8% 22.5% 26.9%
Total Count 36 82 79 71 268
% within Region 100.0% 100.0% 100.0% 100.0% 100.0%

2011 Survey of Salaries and the Payroll Profession 149
Region
Total Northeast South Midwest West / Pacific
Q27b. What percentage of
nonexempt employees report
their time via an automated
method?
0% Count 10 24 22 16 72
% within Region 27.8% 29.3% 27.8% 22.5% 26.9%
1% to 33% Count 2 7 1 3 13
% within Region 5.6% 8.5% 1.3% 4.2% 4.9%
34% to 66% Count 1 4 5 2 12
% within Region 2.8% 4.9% 6.3% 2.8% 4.5%
67% to 99% Count 7 13 15 21 56
% within Region 19.4% 15.9% 19.0% 29.6% 20.9%
100% Count 16 34 36 29 115
% within Region 44.4% 41.5% 45.6% 40.8% 42.9%
Total Count 36 82 79 71 268
% within Region 100.0% 100.0% 100.0% 100.0% 100.0%
Mean
Region Q27a. What
percentage of
nonexempt
employees report
their time manually
(for example, on a
time sheet)?
Q27b. What
percentage of
nonexempt
employees report
their time via an
automated method?
Northeast 35.56 64.44
South 40.51 59.49
Midwest 34.04 65.96
West / Pacific 30.14 69.86
Total 35.19 64.81

2011 Survey of Salaries and the Payroll Profession 150
Region
Total Northeast South Midwest West / Pacific
Q28. Which automated methods
are used by nonexempt
employees to report their time:
Badge reader
No Count 13 33 33 38 117
% within Region 52.0% 60.0% 58.9% 69.1% 61.3%
Yes Count 12 22 23 17 74
% within Region 48.0% 40.0% 41.1% 30.9% 38.7%
Total Count 25 55 56 55 191
% within Region 100.0% 100.0% 100.0% 100.0% 100.0%
Region
Total Northeast South Midwest West / Pacific
Q28. Which automated methods
are used by nonexempt
employees to report their time:
Web-based input
No Count 7 13 15 17 52
% within Region 28.0% 23.6% 26.8% 30.9% 27.2%
Yes Count 18 42 41 38 139
% within Region 72.0% 76.4% 73.2% 69.1% 72.8%
Total Count 25 55 56 55 191
% within Region 100.0% 100.0% 100.0% 100.0% 100.0%
Region
Total Northeast South Midwest West / Pacific
Q28. Which automated methods
are used by nonexempt
employees to report their time:
Interactive voice response
(telephone)
No Count 23 54 54 53 184
% within Region 92.0% 98.2% 96.4% 96.4% 96.3%
Yes Count 2 1 2 2 7
% within Region 8.0% 1.8% 3.6% 3.6% 3.7%
Total Count 25 55 56 55 191
% within Region 100.0% 100.0% 100.0% 100.0% 100.0%

2011 Survey of Salaries and the Payroll Profession 151
Region
Total Northeast South Midwest West / Pacific
Q28. Which automated methods
are used by nonexempt
employees to report their time:
Biometric device (hand reader;
optical scan)
No Count 21 49 50 47 167
% within Region 84.0% 89.1% 89.3% 85.5% 87.4%
Yes Count 4 6 6 8 24
% within Region 16.0% 10.9% 10.7% 14.5% 12.6%
Total Count 25 55 56 55 191
% within Region 100.0% 100.0% 100.0% 100.0% 100.0%
Region
Total Northeast South Midwest West / Pacific
Q28. Which automated methods
are used by nonexempt
employees to report their time:
Other
No Count 23 47 45 47 162
% within Region 92.0% 85.5% 80.4% 85.5% 84.8%
Yes Count 2 8 11 8 29
% within Region 8.0% 14.5% 19.6% 14.5% 15.2%
Total Count 25 55 56 55 191
% within Region 100.0% 100.0% 100.0% 100.0% 100.0%
Region
Total Northeast South Midwest West / Pacific
Q29. Functions performed by your
organization's payroll staff:
Accounts payable
No Count 33 75 66 56 230
% within Region 76.7% 81.5% 75.9% 74.7% 77.4%
Yes Count 10 17 21 19 67
% within Region 23.3% 18.5% 24.1% 25.3% 22.6%
Total Count 43 92 87 75 297
% within Region 100.0% 100.0% 100.0% 100.0% 100.0%

2011 Survey of Salaries and the Payroll Profession 152
Region
Total Northeast South Midwest West / Pacific
Q29. Functions performed by your
organization's payroll staff: Ad hoc
reports
No Count 16 40 38 34 128
% within Region 37.2% 43.5% 43.7% 45.3% 43.1%
Yes Count 27 52 49 41 169
% within Region 62.8% 56.5% 56.3% 54.7% 56.9%
Total Count 43 92 87 75 297
% within Region 100.0% 100.0% 100.0% 100.0% 100.0%
Region
Total Northeast South Midwest West / Pacific
Q29. Functions performed by your
organization's payroll staff:
Benefits program management
No Count 34 72 69 57 232
% within Region 79.1% 78.3% 79.3% 76.0% 78.1%
Yes Count 9 20 18 18 65
% within Region 20.9% 21.7% 20.7% 24.0% 21.9%
Total Count 43 92 87 75 297
% within Region 100.0% 100.0% 100.0% 100.0% 100.0%
Region
Total Northeast South Midwest West / Pacific
Q29. Functions performed by your
organization's payroll staff:
Benefits program administration
No Count 31 70 62 53 216
% within Region 72.1% 76.1% 71.3% 70.7% 72.7%
Yes Count 12 22 25 22 81
% within Region 27.9% 23.9% 28.7% 29.3% 27.3%
Total Count 43 92 87 75 297
% within Region 100.0% 100.0% 100.0% 100.0% 100.0%
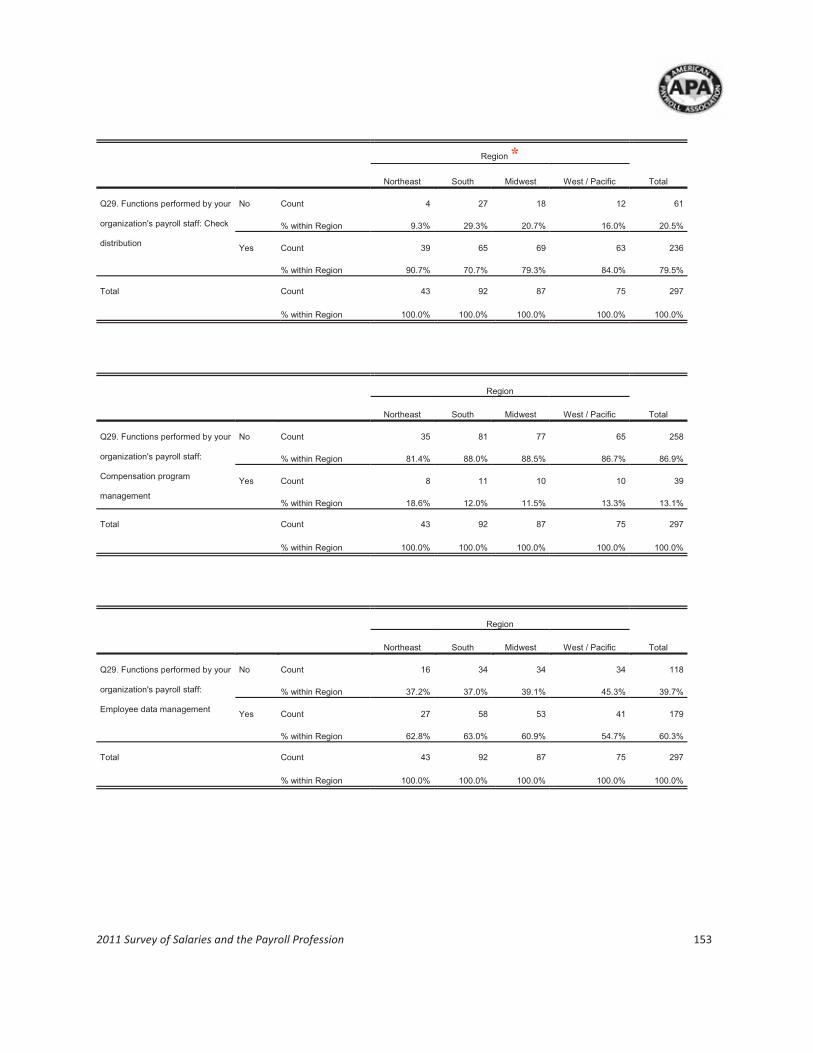
2011 Survey of Salaries and the Payroll Profession 153
Region *
Total Northeast South Midwest West / Pacific
Q29. Functions performed by your
organization's payroll staff: Check
distribution
No Count 4 27 18 12 61
% within Region 9.3% 29.3% 20.7% 16.0% 20.5%
Yes Count 39 65 69 63 236
% within Region 90.7% 70.7% 79.3% 84.0% 79.5%
Total Count 43 92 87 75 297
% within Region 100.0% 100.0% 100.0% 100.0% 100.0%
Region
Total Northeast South Midwest West / Pacific
Q29. Functions performed by your
organization's payroll staff:
Compensation program
management
No Count 35 81 77 65 258
% within Region 81.4% 88.0% 88.5% 86.7% 86.9%
Yes Count 8 11 10 10 39
% within Region 18.6% 12.0% 11.5% 13.3% 13.1%
Total Count 43 92 87 75 297
% within Region 100.0% 100.0% 100.0% 100.0% 100.0%
Region
Total Northeast South Midwest West / Pacific
Q29. Functions performed by your
organization's payroll staff:
Employee data management
No Count 16 34 34 34 118
% within Region 37.2% 37.0% 39.1% 45.3% 39.7%
Yes Count 27 58 53 41 179
% within Region 62.8% 63.0% 60.9% 54.7% 60.3%
Total Count 43 92 87 75 297
% within Region 100.0% 100.0% 100.0% 100.0% 100.0%

2011 Survey of Salaries and the Payroll Profession 154
Region
Total Northeast South Midwest West / Pacific
Q29. Functions performed by your
organization's payroll staff:
Employee inquiries
No Count 2 11 10 7 30
% within Region 4.7% 12.0% 11.5% 9.3% 10.1%
Yes Count 41 81 77 68 267
% within Region 95.3% 88.0% 88.5% 90.7% 89.9%
Total Count 43 92 87 75 297
% within Region 100.0% 100.0% 100.0% 100.0% 100.0%
Region
Total Northeast South Midwest West / Pacific
Q29. Functions performed by your
organization's payroll staff:
Employee services
No Count 20 39 45 30 134
% within Region 46.5% 42.4% 51.7% 40.0% 45.1%
Yes Count 23 53 42 45 163
% within Region 53.5% 57.6% 48.3% 60.0% 54.9%
Total Count 43 92 87 75 297
% within Region 100.0% 100.0% 100.0% 100.0% 100.0%
Region
Total Northeast South Midwest West / Pacific
Q29. Functions performed by your
organization's payroll staff:
Federal tax filing
No Count 21 33 30 24 108
% within Region 48.8% 35.9% 34.5% 32.0% 36.4%
Yes Count 22 59 57 51 189
% within Region 51.2% 64.1% 65.5% 68.0% 63.6%
Total Count 43 92 87 75 297
% within Region 100.0% 100.0% 100.0% 100.0% 100.0%

2011 Survey of Salaries and the Payroll Profession 155
Region
Total Northeast South Midwest West / Pacific
Q29. Functions performed by your
organization's payroll staff:
General ledger interface
No Count 20 34 31 23 108
% within Region 46.5% 37.0% 35.6% 30.7% 36.4%
Yes Count 23 58 56 52 189
% within Region 53.5% 63.0% 64.4% 69.3% 63.6%
Total Count 43 92 87 75 297
% within Region 100.0% 100.0% 100.0% 100.0% 100.0%
Region
Total Northeast South Midwest West / Pacific
Q29. Functions performed by your
organization's payroll staff:
Sarbanes-Oxley compliance
No Count 29 61 61 51 202
% within Region 67.4% 66.3% 70.1% 68.0% 68.0%
Yes Count 14 31 26 24 95
% within Region 32.6% 33.7% 29.9% 32.0% 32.0%
Total Count 43 92 87 75 297
% within Region 100.0% 100.0% 100.0% 100.0% 100.0%
Region
Total Northeast South Midwest West / Pacific
Q29. Functions performed by your
organization's payroll staff:
Expense reimbursements
No Count 27 63 54 47 191
% within Region 62.8% 68.5% 62.1% 62.7% 64.3%
Yes Count 16 29 33 28 106
% within Region 37.2% 31.5% 37.9% 37.3% 35.7%
Total Count 43 92 87 75 297
% within Region 100.0% 100.0% 100.0% 100.0% 100.0%

2011 Survey of Salaries and the Payroll Profession 156
Region
Total Northeast South Midwest West / Pacific
Q29. Functions performed by your
organization's payroll staff:
Independent contractor payments
No Count 37 82 79 62 260
% within Region 86.0% 89.1% 90.8% 82.7% 87.5%
Yes Count 6 10 8 13 37
% within Region 14.0% 10.9% 9.2% 17.3% 12.5%
Total Count 43 92 87 75 297
% within Region 100.0% 100.0% 100.0% 100.0% 100.0%
Region
Total Northeast South Midwest West / Pacific
Q29. Functions performed by your
organization's payroll staff: Labor
and cost accounting
No Count 29 73 67 53 222
% within Region 67.4% 79.3% 77.0% 70.7% 74.7%
Yes Count 14 19 20 22 75
% within Region 32.6% 20.7% 23.0% 29.3% 25.3%
Total Count 43 92 87 75 297
% within Region 100.0% 100.0% 100.0% 100.0% 100.0%
Region
Total Northeast South Midwest West / Pacific
Q29. Functions performed by your
organization's payroll staff: Payroll
accounting
No Count 13 26 22 15 76
% within Region 30.2% 28.3% 25.3% 20.0% 25.6%
Yes Count 30 66 65 60 221
% within Region 69.8% 71.7% 74.7% 80.0% 74.4%
Total Count 43 92 87 75 297
% within Region 100.0% 100.0% 100.0% 100.0% 100.0%

2011 Survey of Salaries and the Payroll Profession 157
Region
Total Northeast South Midwest West / Pacific
Q29. Functions performed by your
organization's payroll staff: Payroll
tax disbursement / reporting
No Count 17 30 32 22 101
% within Region 39.5% 32.6% 36.8% 29.3% 34.0%
Yes Count 26 62 55 53 196
% within Region 60.5% 67.4% 63.2% 70.7% 66.0%
Total Count 43 92 87 75 297
% within Region 100.0% 100.0% 100.0% 100.0% 100.0%
Region
Total Northeast South Midwest West / Pacific
Q29. Functions performed by your
organization's payroll staff:
Personnel records administration
No Count 28 55 54 46 183
% within Region 65.1% 59.8% 62.1% 61.3% 61.6%
Yes Count 15 37 33 29 114
% within Region 34.9% 40.2% 37.9% 38.7% 38.4%
Total Count 43 92 87 75 297
% within Region 100.0% 100.0% 100.0% 100.0% 100.0%
Region
Total Northeast South Midwest West / Pacific
Q29. Functions performed by your
organization's payroll staff: Salary
budgeting
No Count 29 76 68 58 231
% within Region 67.4% 82.6% 78.2% 77.3% 77.8%
Yes Count 14 16 19 17 66
% within Region 32.6% 17.4% 21.8% 22.7% 22.2%
Total Count 43 92 87 75 297
% within Region 100.0% 100.0% 100.0% 100.0% 100.0%

2011 Survey of Salaries and the Payroll Profession 158
Region
Total Northeast South Midwest West / Pacific
Q29. Functions performed by your
organization's payroll staff: State
and local tax filing
No Count 16 44 30 29 119
% within Region 37.2% 47.8% 34.5% 38.7% 40.1%
Yes Count 27 48 57 46 178
% within Region 62.8% 52.2% 65.5% 61.3% 59.9%
Total Count 43 92 87 75 297
% within Region 100.0% 100.0% 100.0% 100.0% 100.0%
Region
Total Northeast South Midwest West / Pacific
Q29. Functions performed by your
organization's payroll staff: Time
and attendance
No Count 8 17 20 13 58
% within Region 18.6% 18.5% 23.0% 17.3% 19.5%
Yes Count 35 75 67 62 239
% within Region 81.4% 81.5% 77.0% 82.7% 80.5%
Total Count 43 92 87 75 297
% within Region 100.0% 100.0% 100.0% 100.0% 100.0%
Region
Total Northeast South Midwest West / Pacific
Q29. Functions performed by your
organization's payroll staff:
Workers’ compensation plan
No Count 29 68 60 44 201
% within Region 67.4% 73.9% 69.0% 58.7% 67.7%
Yes Count 14 24 27 31 96
% within Region 32.6% 26.1% 31.0% 41.3% 32.3%
Total Count 43 92 87 75 297
% within Region 100.0% 100.0% 100.0% 100.0% 100.0%
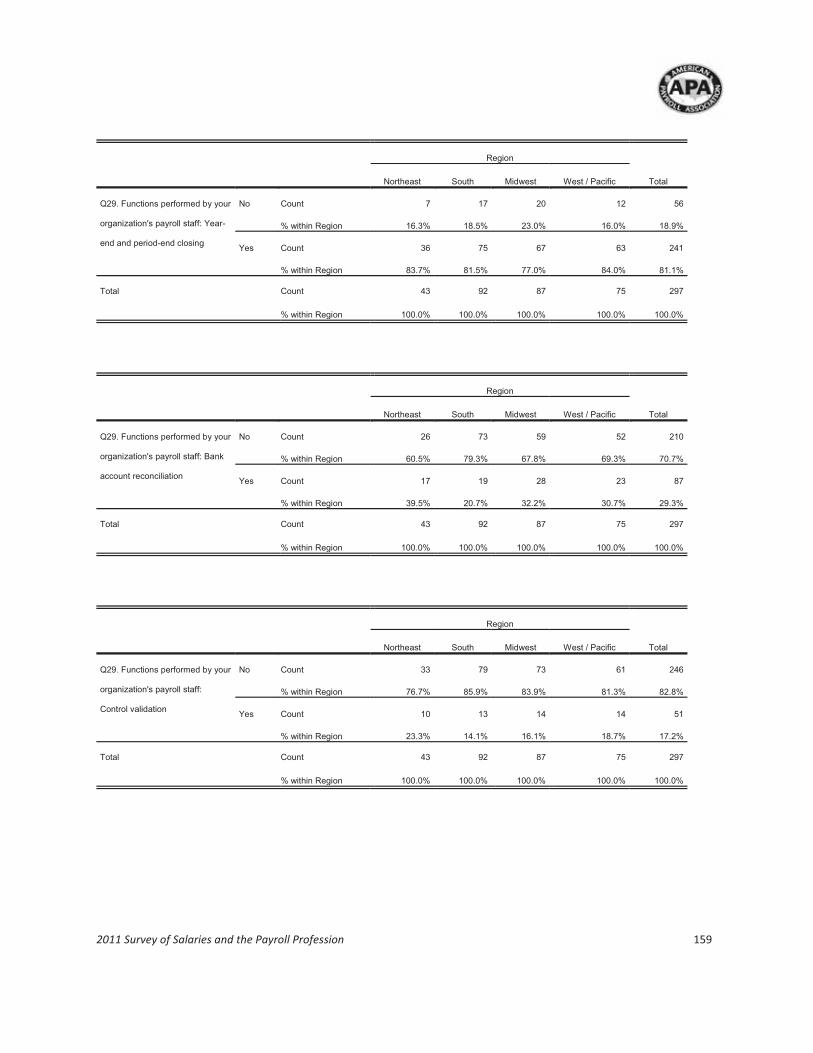
2011 Survey of Salaries and the Payroll Profession 159
Region
Total Northeast South Midwest West / Pacific
Q29. Functions performed by your
organization's payroll staff: Year-
end and period-end closing
No Count 7 17 20 12 56
% within Region 16.3% 18.5% 23.0% 16.0% 18.9%
Yes Count 36 75 67 63 241
% within Region 83.7% 81.5% 77.0% 84.0% 81.1%
Total Count 43 92 87 75 297
% within Region 100.0% 100.0% 100.0% 100.0% 100.0%
Region
Total Northeast South Midwest West / Pacific
Q29. Functions performed by your
organization's payroll staff: Bank
account reconciliation
No Count 26 73 59 52 210
% within Region 60.5% 79.3% 67.8% 69.3% 70.7%
Yes Count 17 19 28 23 87
% within Region 39.5% 20.7% 32.2% 30.7% 29.3%
Total Count 43 92 87 75 297
% within Region 100.0% 100.0% 100.0% 100.0% 100.0%
Region
Total Northeast South Midwest West / Pacific
Q29. Functions performed by your
organization's payroll staff:
Control validation
No Count 33 79 73 61 246
% within Region 76.7% 85.9% 83.9% 81.3% 82.8%
Yes Count 10 13 14 14 51
% within Region 23.3% 14.1% 16.1% 18.7% 17.2%
Total Count 43 92 87 75 297
% within Region 100.0% 100.0% 100.0% 100.0% 100.0%

2011 Survey of Salaries and the Payroll Profession 160
Region
Total Northeast South Midwest West / Pacific
Q29. Functions performed by your
organization's payroll staff:
Deduction processing
No Count 6 21 19 18 64
% within Region 14.0% 22.8% 21.8% 24.0% 21.5%
Yes Count 37 71 68 57 233
% within Region 86.0% 77.2% 78.2% 76.0% 78.5%
Total Count 43 92 87 75 297
% within Region 100.0% 100.0% 100.0% 100.0% 100.0%
Region
Total Northeast South Midwest West / Pacific
Q29. Functions performed by your
organization's payroll staff:
Document management
No Count 18 55 56 43 172
% within Region 41.9% 59.8% 64.4% 57.3% 57.9%
Yes Count 25 37 31 32 125
% within Region 58.1% 40.2% 35.6% 42.7% 42.1%
Total Count 43 92 87 75 297
% within Region 100.0% 100.0% 100.0% 100.0% 100.0%
Region
Total Northeast South Midwest West / Pacific
Q29. Functions performed by your
organization's payroll staff:
Employee time processing
No Count 13 12 17 10 52
% within Region 30.2% 13.0% 19.5% 13.3% 17.5%
Yes Count 30 80 70 65 245
% within Region 69.8% 87.0% 80.5% 86.7% 82.5%
Total Count 43 92 87 75 297
% within Region 100.0% 100.0% 100.0% 100.0% 100.0%

2011 Survey of Salaries and the Payroll Profession 161
Region
Total Northeast South Midwest West / Pacific
Q29. Functions performed by your
organization's payroll staff:
General ledger reconciliation
No Count 23 49 47 35 154
% within Region 53.5% 53.3% 54.0% 46.7% 51.9%
Yes Count 20 43 40 40 143
% within Region 46.5% 46.7% 46.0% 53.3% 48.1%
Total Count 43 92 87 75 297
% within Region 100.0% 100.0% 100.0% 100.0% 100.0%
Region
Total Northeast South Midwest West / Pacific
Q29. Functions performed by your
organization's payroll staff: IT
liaison and testing
No Count 29 61 60 47 197
% within Region 67.4% 66.3% 69.0% 62.7% 66.3%
Yes Count 14 31 27 28 100
% within Region 32.6% 33.7% 31.0% 37.3% 33.7%
Total Count 43 92 87 75 297
% within Region 100.0% 100.0% 100.0% 100.0% 100.0%
Region
Total Northeast South Midwest West / Pacific
Q29. Functions performed by your
organization's payroll staff:
Training and development
No Count 28 59 65 49 201
% within Region 65.1% 64.1% 74.7% 65.3% 67.7%
Yes Count 15 33 22 26 96
% within Region 34.9% 35.9% 25.3% 34.7% 32.3%
Total Count 43 92 87 75 297
% within Region 100.0% 100.0% 100.0% 100.0% 100.0%

2011 Survey of Salaries and the Payroll Profession 162
Region
Total Northeast South Midwest West / Pacific
Q29. Functions performed by your
organization's payroll staff: W-2
reprints
No Count 4 10 11 4 29
% within Region 9.3% 10.9% 12.6% 5.3% 9.8%
Yes Count 39 82 76 71 268
% within Region 90.7% 89.1% 87.4% 94.7% 90.2%
Total Count 43 92 87 75 297
% within Region 100.0% 100.0% 100.0% 100.0% 100.0%
Region
Total Northeast South Midwest West / Pacific
Q29. Functions performed by your
organization's payroll staff: Other
No Count 40 86 85 70 281
% within Region 93.0% 93.5% 97.7% 93.3% 94.6%
Yes Count 3 6 2 5 16
% within Region 7.0% 6.5% 2.3% 6.7% 5.4%
Total Count 43 92 87 75 297
% within Region 100.0% 100.0% 100.0% 100.0% 100.0%
Region
Total Northeast South Midwest West / Pacific
Q30. Which types of payments,
other than wage and salary
payments, are made to
employees through the payroll
system: Business expense
reimbursements
No Count 22 45 40 37 144
% within Region 62.9% 63.4% 64.5% 67.3% 64.6%
Yes Count 13 26 22 18 79
% within Region 37.1% 36.6% 35.5% 32.7% 35.4%
Total Count 35 71 62 55 223
% within Region 100.0% 100.0% 100.0% 100.0% 100.0%

2011 Survey of Salaries and the Payroll Profession 163
Region *
Total Northeast South Midwest West / Pacific
Q30. Which types of payments,
other than wage and salary
payments, are made to
employees through the payroll
system: Petty cash
No Count 31 69 61 55 216
% within Region 88.6% 97.2% 98.4% 100.0% 96.9%
Yes Count 4 2 1 0 7
% within Region 11.4% 2.8% 1.6% .0% 3.1%
Total Count 35 71 62 55 223
% within Region 100.0% 100.0% 100.0% 100.0% 100.0%
Region
Total Northeast South Midwest West / Pacific
Q30. Which types of payments,
other than wage and salary
payments, are made to
employees through the payroll
system: Travel reimbursements
No Count 21 45 40 39 145
% within Region 60.0% 63.4% 64.5% 70.9% 65.0%
Yes Count 14 26 22 16 78
% within Region 40.0% 36.6% 35.5% 29.1% 35.0%
Total Count 35 71 62 55 223
% within Region 100.0% 100.0% 100.0% 100.0% 100.0%
Region
Total Northeast South Midwest West / Pacific
Q30. Which types of payments,
other than wage and salary
payments, are made to
employees through the payroll
system: Commission payments
No Count 15 39 30 30 114
% within Region 42.9% 54.9% 48.4% 54.5% 51.1%
Yes Count 20 32 32 25 109
% within Region 57.1% 45.1% 51.6% 45.5% 48.9%
Total Count 35 71 62 55 223
% within Region 100.0% 100.0% 100.0% 100.0% 100.0%

2011 Survey of Salaries and the Payroll Profession 164
Region
Total Northeast South Midwest West / Pacific
Q30. Which types of payments,
other than wage and salary
payments, are made to
employees through the payroll
system: Relocation (moving)
expenses
No Count 15 26 27 20 88
% within Region 42.9% 36.6% 43.5% 36.4% 39.5%
Yes Count 20 45 35 35 135
% within Region 57.1% 63.4% 56.5% 63.6% 60.5%
Total Count 35 71 62 55 223
% within Region 100.0% 100.0% 100.0% 100.0% 100.0%
Region
Total Northeast South Midwest West / Pacific
Q30. Which types of payments,
other than wage and salary
payments, are made to
employees through the payroll
system: Tuition reimbursements
No Count 24 39 41 37 141
% within Region 68.6% 54.9% 66.1% 67.3% 63.2%
Yes Count 11 32 21 18 82
% within Region 31.4% 45.1% 33.9% 32.7% 36.8%
Total Count 35 71 62 55 223
% within Region 100.0% 100.0% 100.0% 100.0% 100.0%
Region
Total Northeast South Midwest West / Pacific
Q30. Which types of payments,
other than wage and salary
payments, are made to
employees through the payroll
system: Pension payments
No Count 33 61 53 50 197
% within Region 94.3% 85.9% 85.5% 90.9% 88.3%
Yes Count 2 10 9 5 26
% within Region 5.7% 14.1% 14.5% 9.1% 11.7%
Total Count 35 71 62 55 223
% within Region 100.0% 100.0% 100.0% 100.0% 100.0%
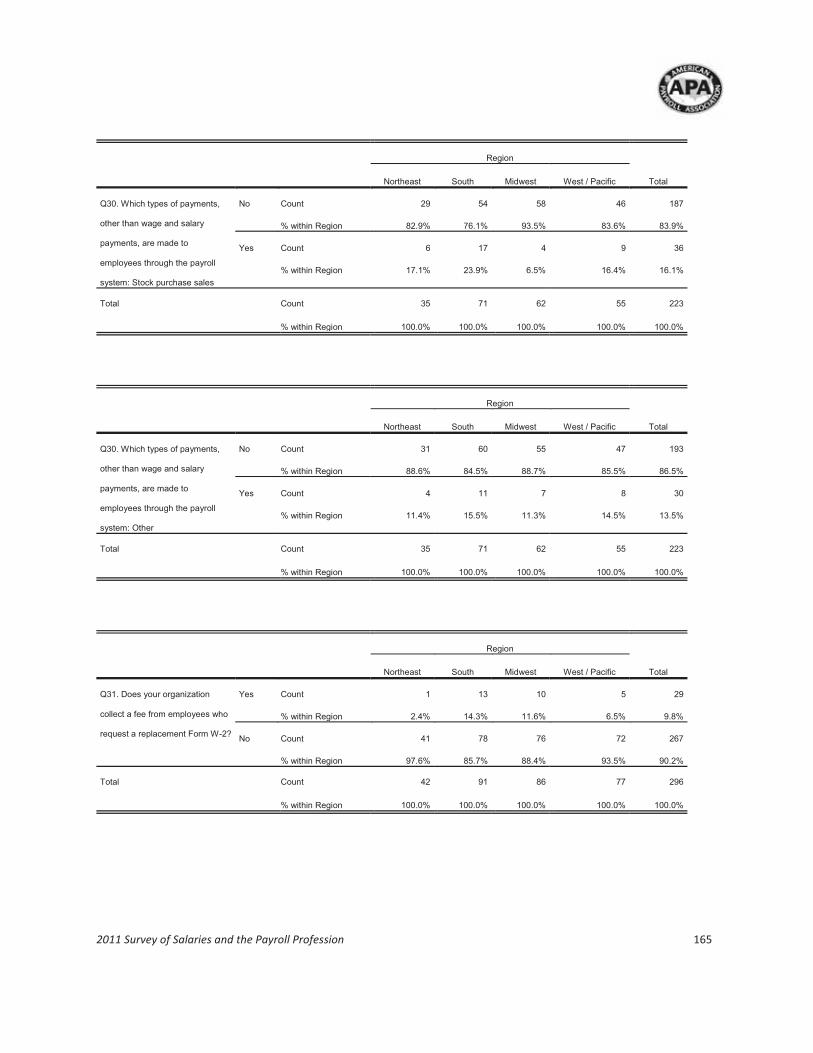
2011 Survey of Salaries and the Payroll Profession 165
Region
Total Northeast South Midwest West / Pacific
Q30. Which types of payments,
other than wage and salary
payments, are made to
employees through the payroll
system: Stock purchase sales
No Count 29 54 58 46 187
% within Region 82.9% 76.1% 93.5% 83.6% 83.9%
Yes Count 6 17 4 9 36
% within Region 17.1% 23.9% 6.5% 16.4% 16.1%
Total Count 35 71 62 55 223
% within Region 100.0% 100.0% 100.0% 100.0% 100.0%
Region
Total Northeast South Midwest West / Pacific
Q30. Which types of payments,
other than wage and salary
payments, are made to
employees through the payroll
system: Other
No Count 31 60 55 47 193
% within Region 88.6% 84.5% 88.7% 85.5% 86.5%
Yes Count 4 11 7 8 30
% within Region 11.4% 15.5% 11.3% 14.5% 13.5%
Total Count 35 71 62 55 223
% within Region 100.0% 100.0% 100.0% 100.0% 100.0%
Region
Total Northeast South Midwest West / Pacific
Q31. Does your organization
collect a fee from employees who
request a replacement Form W-2?
Yes Count 1 13 10 5 29
% within Region 2.4% 14.3% 11.6% 6.5% 9.8%
No Count 41 78 76 72 267
% within Region 97.6% 85.7% 88.4% 93.5% 90.2%
Total Count 42 91 86 77 296
% within Region 100.0% 100.0% 100.0% 100.0% 100.0%

2011 Survey of Salaries and the Payroll Profession 166
Region
Total Northeast South Midwest West / Pacific
Q32a. Approximately what
percentage of your
organization’s employees
require child support orders?
0% / None reported Count 7 14 10 19 50
% within Region 16.3% 15.2% 11.5% 24.7% 16.7%
Greater than 0%, up to 1% Count 13 20 25 19 77
% within Region 30.2% 21.7% 28.7% 24.7% 25.8%
More than 1%, up to 3% Count 8 17 17 18 60
% within Region 18.6% 18.5% 19.5% 23.4% 20.1%
More than 3%, up to 10% Count 12 29 24 16 81
% within Region 27.9% 31.5% 27.6% 20.8% 27.1%
More than 10% Count 3 12 11 5 31
% within Region 7.0% 13.0% 12.6% 6.5% 10.4%
Total Count 43 92 87 77 299
% within Region 100.0% 100.0% 100.0% 100.0% 100.0%
Region
Total Northeast South Midwest West / Pacific
Q32b. Approximately what
percentage of your
organization’s employees
require student loan
garnishments?
0% / None reported Count 20 36 46 47 149
% within Region 46.5% 39.1% 52.9% 61.0% 49.8%
Greater than 0%, up to 1% Count 18 41 28 24 111
% within Region 41.9% 44.6% 32.2% 31.2% 37.1%
More than 1%, up to 3% Count 1 8 10 3 22
% within Region 2.3% 8.7% 11.5% 3.9% 7.4%
More than 3% Count 4 7 3 3 17
% within Region 9.3% 7.6% 3.4% 3.9% 5.7%
Total Count 43 92 87 77 299
% within Region 100.0% 100.0% 100.0% 100.0% 100.0%

2011 Survey of Salaries and the Payroll Profession 167
Region
Total Northeast South Midwest West / Pacific
Q32c. Approximately what
percentage of your
organization’s employees
require state tax levies?
0% / None reported Count 29 56 58 38 181
% within Region 67.4% 60.9% 66.7% 49.4% 60.5%
Greater than 0%, up to 1% Count 8 27 20 28 83
% within Region 18.6% 29.3% 23.0% 36.4% 27.8%
More than 1%, up to 3% Count 2 2 6 5 15
% within Region 4.7% 2.2% 6.9% 6.5% 5.0%
More than 3% Count 4 7 3 6 20
% within Region 9.3% 7.6% 3.4% 7.8% 6.7%
Total Count 43 92 87 77 299
% within Region 100.0% 100.0% 100.0% 100.0% 100.0%
Region
Total Northeast South Midwest West / Pacific
Q32d. Approximately what
percentage of your
organization’s employees
require federal tax levies?
0% / None reported Count 21 33 38 31 123
% within Region 48.8% 35.9% 43.7% 40.3% 41.1%
Greater than 0%, up to 1% Count 17 41 33 36 127
% within Region 39.5% 44.6% 37.9% 46.8% 42.5%
More than 1%, up to 3% Count 2 7 12 6 27
% within Region 4.7% 7.6% 13.8% 7.8% 9.0%
More than 3% Count 3 11 4 4 22
% within Region 7.0% 12.0% 4.6% 5.2% 7.4%
Total Count 43 92 87 77 299
% within Region 100.0% 100.0% 100.0% 100.0% 100.0%

2011 Survey of Salaries and the Payroll Profession 168
Region
Total Northeast South Midwest West / Pacific
Q32e. Approximately what
percentage of your
organization’s employees
require creditor
garnishments?
0% / None reported Count 21 43 34 33 131
% within Region 48.8% 46.7% 39.1% 42.9% 43.8%
Greater than 0%, up to 1% Count 10 26 24 23 83
% within Region 23.3% 28.3% 27.6% 29.9% 27.8%
More than 1%, up to 3% Count 8 10 12 13 43
% within Region 18.6% 10.9% 13.8% 16.9% 14.4%
More than 3% Count 4 13 17 8 42
% within Region 9.3% 14.1% 19.5% 10.4% 14.0%
Total Count 43 92 87 77 299
% within Region 100.0% 100.0% 100.0% 100.0% 100.0%
Region
Total Northeast South Midwest West / Pacific
Q32f. Approximately what
percentage of your
organization’s employees
require bankruptcy orders?
0% / None reported Count 28 42 43 48 161
% within Region 65.1% 45.7% 49.4% 62.3% 53.8%
Greater than 0%, up to 1% Count 9 36 29 22 96
% within Region 20.9% 39.1% 33.3% 28.6% 32.1%
More than 1%, up to 3% Count 3 9 9 6 27
% within Region 7.0% 9.8% 10.3% 7.8% 9.0%
More than 3% Count 3 5 6 1 15
% within Region 7.0% 5.4% 6.9% 1.3% 5.0%
Total Count 43 92 87 77 299
% within Region 100.0% 100.0% 100.0% 100.0% 100.0%
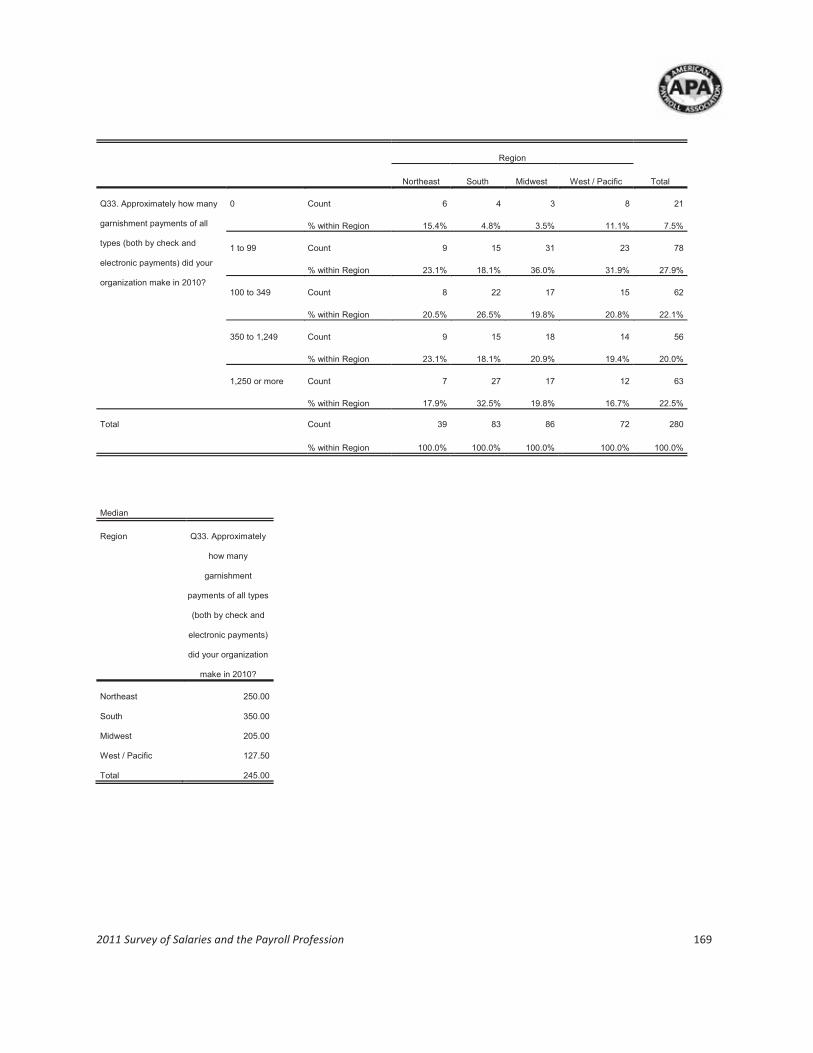
2011 Survey of Salaries and the Payroll Profession 169
Region
Total Northeast South Midwest West / Pacific
Q33. Approximately how many
garnishment payments of all
types (both by check and
electronic payments) did your
organization make in 2010?
0 Count 6 4 3 8 21
% within Region 15.4% 4.8% 3.5% 11.1% 7.5%
1 to 99 Count 9 15 31 23 78
% within Region 23.1% 18.1% 36.0% 31.9% 27.9%
100 to 349 Count 8 22 17 15 62
% within Region 20.5% 26.5% 19.8% 20.8% 22.1%
350 to 1,249 Count 9 15 18 14 56
% within Region 23.1% 18.1% 20.9% 19.4% 20.0%
1,250 or more Count 7 27 17 12 63
% within Region 17.9% 32.5% 19.8% 16.7% 22.5%
Total Count 39 83 86 72 280
% within Region 100.0% 100.0% 100.0% 100.0% 100.0%
Median
Region Q33. Approximately
how many
garnishment
payments of all types
(both by check and
electronic payments)
did your organization
make in 2010?
Northeast 250.00
South 350.00
Midwest 205.00
West / Pacific 127.50
Total 245.00

2011 Survey of Salaries and the Payroll Profession 170
Region
Total Northeast South Midwest West / Pacific
Q34a. Does your organization
collect an administrative fee from
employees whose earnings are
subject to withholding for child
support?
Yes Count 2 18 15 9 44
% within Region 4.8% 20.2% 17.4% 12.0% 15.1%
No Count 40 71 71 66 248
% within Region 95.2% 79.8% 82.6% 88.0% 84.9%
Total Count 42 89 86 75 292
% within Region 100.0% 100.0% 100.0% 100.0% 100.0%
Region
Total Northeast South Midwest West / Pacific
Q34b. Does your organization
collect an administrative fee from
employees whose earnings are
subject to creditor garnishments?
Yes Count 2 12 13 4 31
% within Region 4.8% 13.8% 15.1% 5.5% 10.8%
No Count 40 75 73 69 257
% within Region 95.2% 86.2% 84.9% 94.5% 89.2%
Total Count 42 87 86 73 288
% within Region 100.0% 100.0% 100.0% 100.0% 100.0%
Region
Total Northeast South Midwest West / Pacific
Q35. Is your largest payroll
integrated with an HRIS (Human
Resource Information System)?
Yes Count 31 66 57 54 208
% within Region 73.8% 75.9% 67.9% 74.0% 72.7%
No Count 11 21 27 19 78
% within Region 26.2% 24.1% 32.1% 26.0% 27.3%
Total Count 42 87 84 73 286
% within Region 100.0% 100.0% 100.0% 100.0% 100.0%

2011 Survey of Salaries and the Payroll Profession 171
Region
Total Northeast South Midwest West / Pacific
Q36. Approximately what
percentage of your
organization’s employee
benefits recordkeeping (with or
without an HRIS) is handled by
payroll staff?
Less than 15% Count 24 41 44 37 146
% within Region 55.8% 48.2% 50.6% 49.3% 50.3%
15% – 24% Count 2 9 7 12 30
% within Region 4.7% 10.6% 8.0% 16.0% 10.3%
25% – 49% Count 2 5 7 3 17
% within Region 4.7% 5.9% 8.0% 4.0% 5.9%
50% – 84% Count 5 6 5 5 21
% within Region 11.6% 7.1% 5.7% 6.7% 7.2%
85% or more Count 10 24 24 18 76
% within Region 23.3% 28.2% 27.6% 24.0% 26.2%
Total Count 43 85 87 75 290
% within Region 100.0% 100.0% 100.0% 100.0% 100.0%
Region
Total Northeast South Midwest West / Pacific
Q37. For which of the following
types of payroll-related
products/services does someone
in the payroll department
recommend or approve
acquisitions: Payroll processing
hardware
No Count 32 59 58 45 194
% within Region 74.4% 66.3% 67.4% 60.0% 66.2%
Yes Count 11 30 28 30 99
% within Region 25.6% 33.7% 32.6% 40.0% 33.8%
Total Count 43 89 86 75 293
% within Region 100.0% 100.0% 100.0% 100.0% 100.0%

2011 Survey of Salaries and the Payroll Profession 172
Region
Total Northeast South Midwest West / Pacific
Q37. For which of the following
types of payroll-related
products/services does someone
in the payroll department
recommend or approve
acquisitions: Unemployment
insurance processing
No Count 35 63 66 61 225
% within Region 81.4% 70.8% 76.7% 81.3% 76.8%
Yes Count 8 26 20 14 68
% within Region 18.6% 29.2% 23.3% 18.7% 23.2%
Total Count 43 89 86 75 293
% within Region 100.0% 100.0% 100.0% 100.0% 100.0%
Region
Total Northeast South Midwest West / Pacific
Q37. For which of the following
types of payroll-related
products/services does someone
in the payroll department
recommend or approve
acquisitions: Payroll processing
software
No Count 20 38 40 32 130
% within Region 46.5% 42.7% 46.5% 42.7% 44.4%
Yes Count 23 51 46 43 163
% within Region 53.5% 57.3% 53.5% 57.3% 55.6%
Total Count 43 89 86 75 293
% within Region 100.0% 100.0% 100.0% 100.0% 100.0%

2011 Survey of Salaries and the Payroll Profession 173
Region *
Total Northeast South Midwest West / Pacific
Q37. For which of the following
types of payroll-related
products/services does someone
in the payroll department
recommend or approve
acquisitions: Outsourcing vendors
(for example, service providers)
No Count 26 50 66 48 190
% within Region 60.5% 56.2% 76.7% 64.0% 64.8%
Yes Count 17 39 20 27 103
% within Region 39.5% 43.8% 23.3% 36.0% 35.2%
Total Count 43 89 86 75 293
% within Region 100.0% 100.0% 100.0% 100.0% 100.0%
Region
Total Northeast South Midwest West / Pacific
Q37. For which of the following
types of payroll-related
products/services does someone
in the payroll department
recommend or approve
acquisitions: Payroll cards
No Count 31 55 61 52 199
% within Region 72.1% 61.8% 70.9% 69.3% 67.9%
Yes Count 12 34 25 23 94
% within Region 27.9% 38.2% 29.1% 30.7% 32.1%
Total Count 43 89 86 75 293
% within Region 100.0% 100.0% 100.0% 100.0% 100.0%
Region
Total Northeast South Midwest West / Pacific
Q37. For which of the following
types of payroll-related
products/services does someone
in the payroll department
recommend or approve
acquisitions: Training
No Count 22 42 53 38 155
% within Region 51.2% 47.2% 61.6% 50.7% 52.9%
Yes Count 21 47 33 37 138
% within Region 48.8% 52.8% 38.4% 49.3% 47.1%
Total Count 43 89 86 75 293
% within Region 100.0% 100.0% 100.0% 100.0% 100.0%

2011 Survey of Salaries and the Payroll Profession 174
Region
Total Northeast South Midwest West / Pacific
Q37. For which of the following
types of payroll-related
products/services does someone
in the payroll department
recommend or approve
acquisitions: Other
No Count 41 81 83 71 276
% within Region 95.3% 91.0% 96.5% 94.7% 94.2%
Yes Count 2 8 3 4 17
% within Region 4.7% 9.0% 3.5% 5.3% 5.8%
Total Count 43 89 86 75 293
% within Region 100.0% 100.0% 100.0% 100.0% 100.0%
Region
Total Northeast South Midwest West / Pacific
Q37. For which of the following
types of payroll-related
products/services does someone
in the payroll department
recommend or approve
acquisitions: None
No Count 30 65 55 56 206
% within Region 69.8% 73.0% 64.0% 74.7% 70.3%
Yes Count 13 24 31 19 87
% within Region 30.2% 27.0% 36.0% 25.3% 29.7%
Total Count 43 89 86 75 293
% within Region 100.0% 100.0% 100.0% 100.0% 100.0%

2011 Survey of Salaries and the Payroll Profession 175
Region
Total Northeast South Midwest West / Pacific
Q38. How is your
organization’s payroll
processing handled?
All in-house (company-
developed system)
Count 0 12 7 4 23
% within Region .0% 13.3% 8.2% 5.5% 7.9%
All in-house (licensed
system)
Count 13 38 33 37 121
% within Region 31.0% 42.2% 38.8% 50.7% 41.7%
Part in-house developed
system, part by a service
provider
Count 2 4 4 3 13
% within Region 4.8% 4.4% 4.7% 4.1% 4.5%
Part in-house licensed
system, part by a service
provider
Count 4 13 6 6 29
% within Region 9.5% 14.4% 7.1% 8.2% 10.0%
All by a service provider
within the U.S.
Count 23 21 34 22 100
% within Region 54.8% 23.3% 40.0% 30.1% 34.5%
All by a service provider
outside the U.S.
Count 0 2 1 1 4
% within Region .0% 2.2% 1.2% 1.4% 1.4%
Total Count 42 90 85 73 290
% within Region 100.0% 100.0% 100.0% 100.0% 100.0%
Region
Total Northeast South Midwest West / Pacific
Q39. Does your organization
plan to outsource all or part of
your payroll processing in the
future?
Yes Count 1 4 3 5 13
% within Region 5.3% 6.3% 6.5% 10.2% 7.3%
No / don't know Count 18 60 43 44 165
% within Region 94.7% 93.8% 93.5% 89.8% 92.7%
Total Count 19 64 46 49 178
% within Region 100.0% 100.0% 100.0% 100.0% 100.0%

2011 Survey of Salaries and the Payroll Profession 176
Region
Total Northeast South Midwest West / Pacific
Q40. When was the last time
the payroll department began
using new payroll processing
software?
In the last year Count 1 10 5 3 19
% within Region 5.3% 15.4% 10.2% 6.0% 10.4%
1 to < 2 years ago Count 1 5 4 3 13
% within Region 5.3% 7.7% 8.2% 6.0% 7.1%
2 to < 5 years ago Count 5 15 12 20 52
% within Region 26.3% 23.1% 24.5% 40.0% 28.4%
5 years ago or longer Count 12 35 28 24 99
% within Region 63.2% 53.8% 57.1% 48.0% 54.1%
Total Count 19 65 49 50 183
% within Region 100.0% 100.0% 100.0% 100.0% 100.0%
Region
Total Northeast South Midwest West / Pacific
Q41. What was the source of
the last-installed payroll
processing software?
Custom-built, in house Count 0 5 2 1 8
% within Region .0% 7.8% 4.1% 2.1% 4.5%
Purchased from a vendor Count 9 25 21 22 77
% within Region 50.0% 39.1% 42.9% 46.8% 43.3%
Licensed from a vendor Count 8 33 23 22 86
% within Region 44.4% 51.6% 46.9% 46.8% 48.3%
Not applicable Count 1 1 3 2 7
% within Region 5.6% 1.6% 6.1% 4.3% 3.9%
Total Count 18 64 49 47 178
% within Region 100.0% 100.0% 100.0% 100.0% 100.0%

2011 Survey of Salaries and the Payroll Profession 177
Region
Total Northeast South Midwest West / Pacific
Q42. What was the
approximate cost of
building/acquiring and
installing this last-installed
payroll processing software?
Less than $10,000 Count 2 5 6 7 20
% within Region 33.3% 17.9% 27.3% 36.8% 26.7%
$10,000 to $99,999 Count 2 7 9 1 19
% within Region 33.3% 25.0% 40.9% 5.3% 25.3%
$100,000 to $749,999 Count 2 9 4 8 23
% within Region 33.3% 32.1% 18.2% 42.1% 30.7%
$750,000 + Count 0 7 3 3 13
% within Region .0% 25.0% 13.6% 15.8% 17.3%
Total Count 6 28 22 19 75
% within Region 100.0% 100.0% 100.0% 100.0% 100.0%
Region
Total Northeast South Midwest West / Pacific
Q43. Does your organization plan
to purchase new payroll-related
software in the future?
Yes Count 3 17 14 11 45
% within Region 15.8% 26.2% 29.2% 22.0% 24.7%
No Count 16 48 34 39 137
% within Region 84.2% 73.8% 70.8% 78.0% 75.3%
Total Count 19 65 48 50 182
% within Region 100.0% 100.0% 100.0% 100.0% 100.0%
Region
Total Northeast South Midwest West / Pacific
Q45. Does your organization plan
to bring all or part of your payroll
processing in house in the future?
Yes Count 1 3 2 3 9
% within Region 4.2% 9.4% 4.8% 12.0% 7.3%
No Count 23 29 40 22 114
% within Region 95.8% 90.6% 95.2% 88.0% 92.7%
Total Count 24 32 42 25 123
% within Region 100.0% 100.0% 100.0% 100.0% 100.0%

2011 Survey of Salaries and the Payroll Profession 178
The next table shows results for current base salary by region. However, job classifications with fewer than 10 salaries reported in total are excluded. Also, even for job classifications with more salaries reported in total, the number of salaries reported in a particular region is sometimes small (the column with "N" indicates the number reported), and extra caution is recommended when interpreting these results. Given the small number in some regions, statistical testing is not recommended for these results, as statistical testing is best applied when each subgroup has at least 30 respondents. (Recall that the region for one respondent was unknown, and totals here may differ from tables earlier in this report.)
Current Base Salary N Average Minimum Maximum
Payroll Clerk/Assistant (A)
Northeast 2 37,794 35,360 40,228
South 19 34,673 21,822 50,000
Midwest 8 31,859 20,592 37,000
West / Pacific 7 40,355 31,200 51,000
Total 36 35,326 20,592 51,000
Payroll Practitioner I (Entry-
level) (B)
Northeast 4 40,464 34,000 48,000
South 29 37,987 21,000 54,300
Midwest 16 34,902 23,000 43,000
West / Pacific 9 40,452 29,000 50,000
Total 58 37,689 21,000 54,300
Payroll Practitioner II
(Intermediate) (C)
Northeast 18 40,115 28,275 58,000
South 69 41,168 21,673 70,000
Midwest 32 35,208 18,928 55,000
West / Pacific 38 45,269 25,680 72,000
Total 157 40,825 18,928 72,000
Payroll Practitioner III
(Senior) (D)
Northeast 15 48,479 37,440 65,000
South 32 50,751 33,819 73,216
Midwest 12 43,007 35,500 57,100
West / Pacific 21 48,178 27,418 101,650
Total 80 48,488 27,418 101,650
Payroll Administrator (E)
Northeast 15 51,103 30,746 72,800
South 35 50,021 24,960 87,500
Midwest 43 46,697 20,000 88,288
West / Pacific 36 55,876 32,000 100,000
Total 129 50,673 20,000 100,000
Lead Payroll Administrator
(F)
Northeast 6 57,791 49,130 75,000
South 16 61,378 39,800 95,000
Midwest 8 47,014 31,000 58,510
West / Pacific 12 52,387 32,760 81,000
Total 42 55,561 31,000 95,000
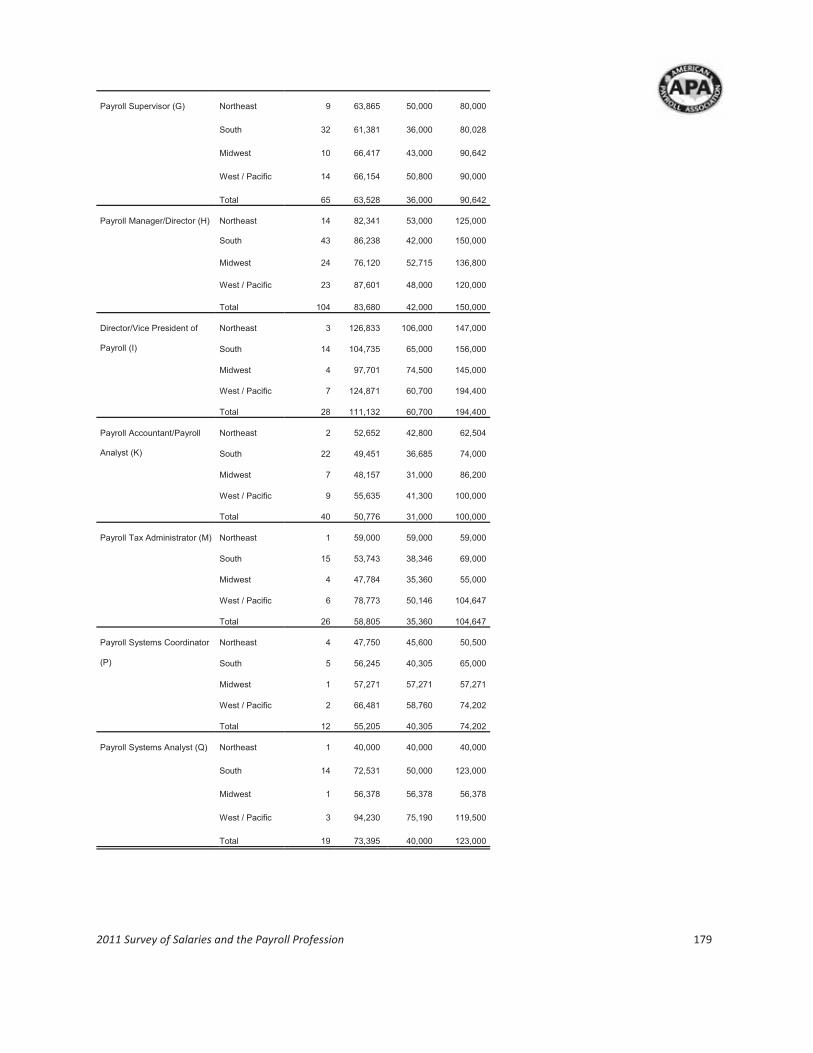
2011 Survey of Salaries and the Payroll Profession 179
Payroll Supervisor (G) Northeast 9 63,865 50,000 80,000
South 32 61,381 36,000 80,028
Midwest 10 66,417 43,000 90,642
West / Pacific 14 66,154 50,800 90,000
Total 65 63,528 36,000 90,642
Payroll Manager/Director (H) Northeast 14 82,341 53,000 125,000
South 43 86,238 42,000 150,000
Midwest 24 76,120 52,715 136,800
West / Pacific 23 87,601 48,000 120,000
Total 104 83,680 42,000 150,000
Director/Vice President of
Payroll (I)
Northeast 3 126,833 106,000 147,000
South 14 104,735 65,000 156,000
Midwest 4 97,701 74,500 145,000
West / Pacific 7 124,871 60,700 194,400
Total 28 111,132 60,700 194,400
Payroll Accountant/Payroll
Analyst (K)
Northeast 2 52,652 42,800 62,504
South 22 49,451 36,685 74,000
Midwest 7 48,157 31,000 86,200
West / Pacific 9 55,635 41,300 100,000
Total 40 50,776 31,000 100,000
Payroll Tax Administrator (M)
Northeast 1 59,000 59,000 59,000
South 15 53,743 38,346 69,000
Midwest 4 47,784 35,360 55,000
West / Pacific 6 78,773 50,146 104,647
Total 26 58,805 35,360 104,647
Payroll Systems Coordinator
(P)
Northeast 4 47,750 45,600 50,500
South 5 56,245 40,305 65,000
Midwest 1 57,271 57,271 57,271
West / Pacific 2 66,481 58,760 74,202
Total 12 55,205 40,305 74,202
Payroll Systems Analyst (Q) Northeast 1 40,000 40,000 40,000
South 14 72,531 50,000 123,000
Midwest 1 56,378 56,378 56,378
West / Pacific 3 94,230 75,190 119,500
Total 19 73,395 40,000 123,000
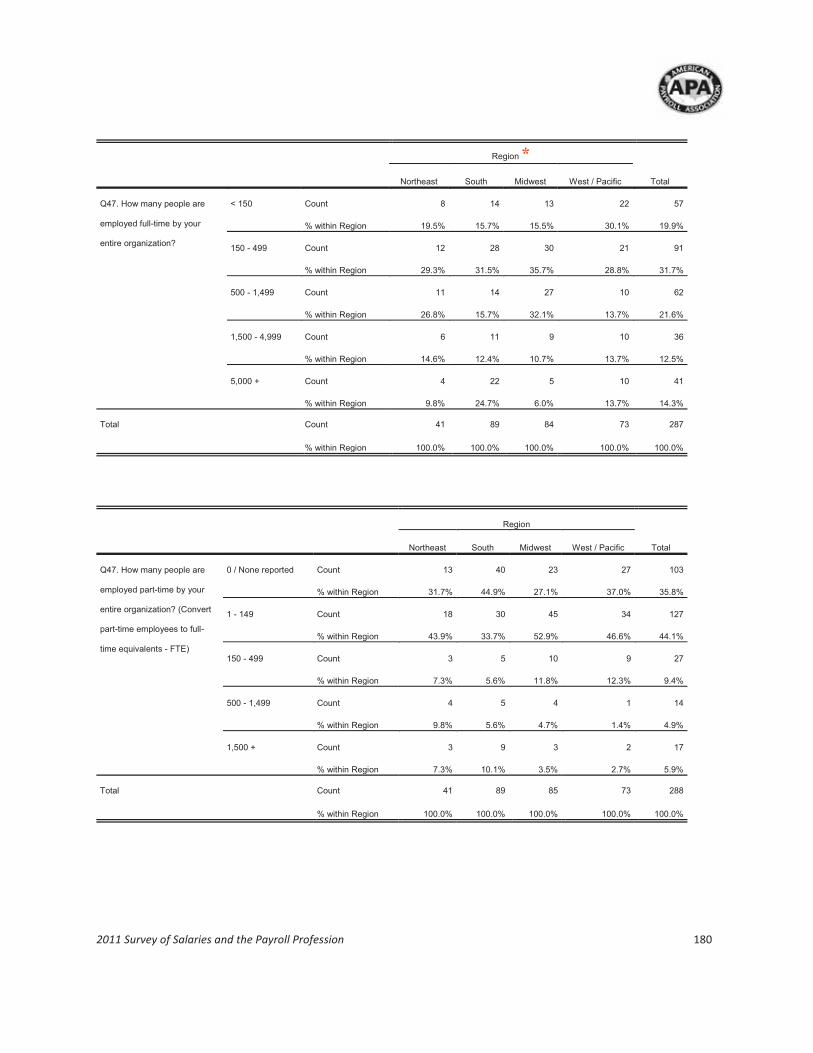
2011 Survey of Salaries and the Payroll Profession 180
Region *
Total Northeast South Midwest West / Pacific
Q47. How many people are
employed full-time by your
entire organization?
< 150 Count 8 14 13 22 57
% within Region 19.5% 15.7% 15.5% 30.1% 19.9%
150 - 499 Count 12 28 30 21 91
% within Region 29.3% 31.5% 35.7% 28.8% 31.7%
500 - 1,499 Count 11 14 27 10 62
% within Region 26.8% 15.7% 32.1% 13.7% 21.6%
1,500 - 4,999 Count 6 11 9 10 36
% within Region 14.6% 12.4% 10.7% 13.7% 12.5%
5,000 + Count 4 22 5 10 41
% within Region 9.8% 24.7% 6.0% 13.7% 14.3%
Total Count 41 89 84 73 287
% within Region 100.0% 100.0% 100.0% 100.0% 100.0%
Region
Total Northeast South Midwest West / Pacific
Q47. How many people are
employed part-time by your
entire organization? (Convert
part-time employees to full-
time equivalents - FTE)
0 / None reported Count 13 40 23 27 103
% within Region 31.7% 44.9% 27.1% 37.0% 35.8%
1 - 149 Count 18 30 45 34 127
% within Region 43.9% 33.7% 52.9% 46.6% 44.1%
150 - 499 Count 3 5 10 9 27
% within Region 7.3% 5.6% 11.8% 12.3% 9.4%
500 - 1,499 Count 4 5 4 1 14
% within Region 9.8% 5.6% 4.7% 1.4% 4.9%
1,500 + Count 3 9 3 2 17
% within Region 7.3% 10.1% 3.5% 2.7% 5.9%
Total Count 41 89 85 73 288
% within Region 100.0% 100.0% 100.0% 100.0% 100.0%

2011 Survey of Salaries and the Payroll Profession 181
Region
Total Northeast South Midwest West / Pacific
Q48. What is the location of
all or most of the payroll-
related jobs?
Metro area with a population
of 1,000,000 or more
Count 9 37 23 25 94
% within Region 20.9% 43.0% 28.4% 34.2% 33.2%
Metro area with a population
of 500,000 to 999,999
Count 8 17 12 9 46
% within Region 18.6% 19.8% 14.8% 12.3% 16.3%
Metro area with a population
of 250,000 to 499,999
Count 6 9 8 5 28
% within Region 14.0% 10.5% 9.9% 6.8% 9.9%
Metro area with a population
of 50,000 to 249,999
Count 7 10 23 17 57
% within Region 16.3% 11.6% 28.4% 23.3% 20.1%
City of 10,000 to 49,999 Count 7 10 13 13 43
% within Region 16.3% 11.6% 16.0% 17.8% 15.2%
Town of fewer than
10,000/rural area
Count 6 3 2 4 15
% within Region 14.0% 3.5% 2.5% 5.5% 5.3%
Total Count 43 86 81 73 283
% within Region 100.0% 100.0% 100.0% 100.0% 100.0%
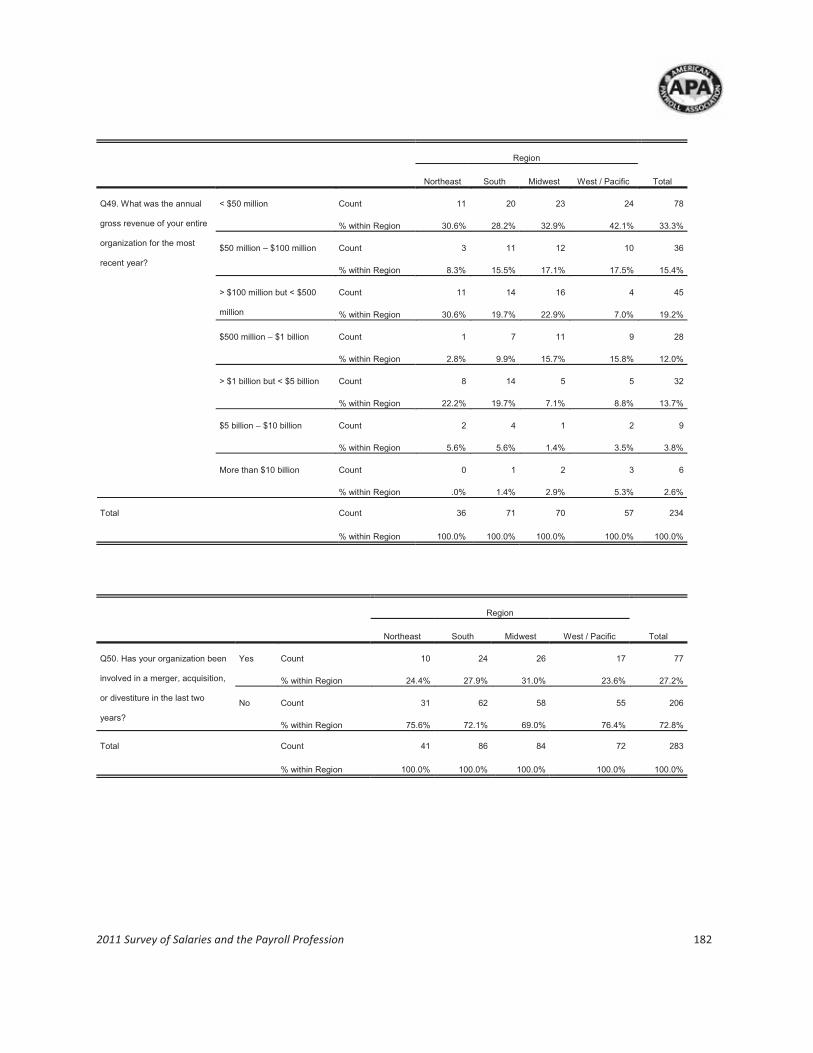
2011 Survey of Salaries and the Payroll Profession 182
Region
Total Northeast South Midwest West / Pacific
Q49. What was the annual
gross revenue of your entire
organization for the most
recent year?
< $50 million Count 11 20 23 24 78
% within Region 30.6% 28.2% 32.9% 42.1% 33.3%
$50 million – $100 million Count 3 11 12 10 36
% within Region 8.3% 15.5% 17.1% 17.5% 15.4%
> $100 million but < $500
million
Count 11 14 16 4 45
% within Region 30.6% 19.7% 22.9% 7.0% 19.2%
$500 million – $1 billion Count 1 7 11 9 28
% within Region 2.8% 9.9% 15.7% 15.8% 12.0%
> $1 billion but < $5 billion Count 8 14 5 5 32
% within Region 22.2% 19.7% 7.1% 8.8% 13.7%
$5 billion – $10 billion Count 2 4 1 2 9
% within Region 5.6% 5.6% 1.4% 3.5% 3.8%
More than $10 billion Count 0 1 2 3 6
% within Region .0% 1.4% 2.9% 5.3% 2.6%
Total Count 36 71 70 57 234
% within Region 100.0% 100.0% 100.0% 100.0% 100.0%
Region
Total Northeast South Midwest West / Pacific
Q50. Has your organization been
involved in a merger, acquisition,
or divestiture in the last two
years?
Yes Count 10 24 26 17 77
% within Region 24.4% 27.9% 31.0% 23.6% 27.2%
No Count 31 62 58 55 206
% within Region 75.6% 72.1% 69.0% 76.4% 72.8%
Total Count 41 86 84 72 283
% within Region 100.0% 100.0% 100.0% 100.0% 100.0%

2011 Survey of Salaries and the Payroll Profession 183
XI. Appendix

2011 Survey of Salaries and the Payroll Profession 184
American Payroll Association
2011 Survey of Salaries and the Payroll Profession

2011 Survey of Salaries and the Payroll Profession 185

2011 Survey of Salaries and the Payroll Profession 186

2011 Survey of Salaries and the Payroll Profession 187
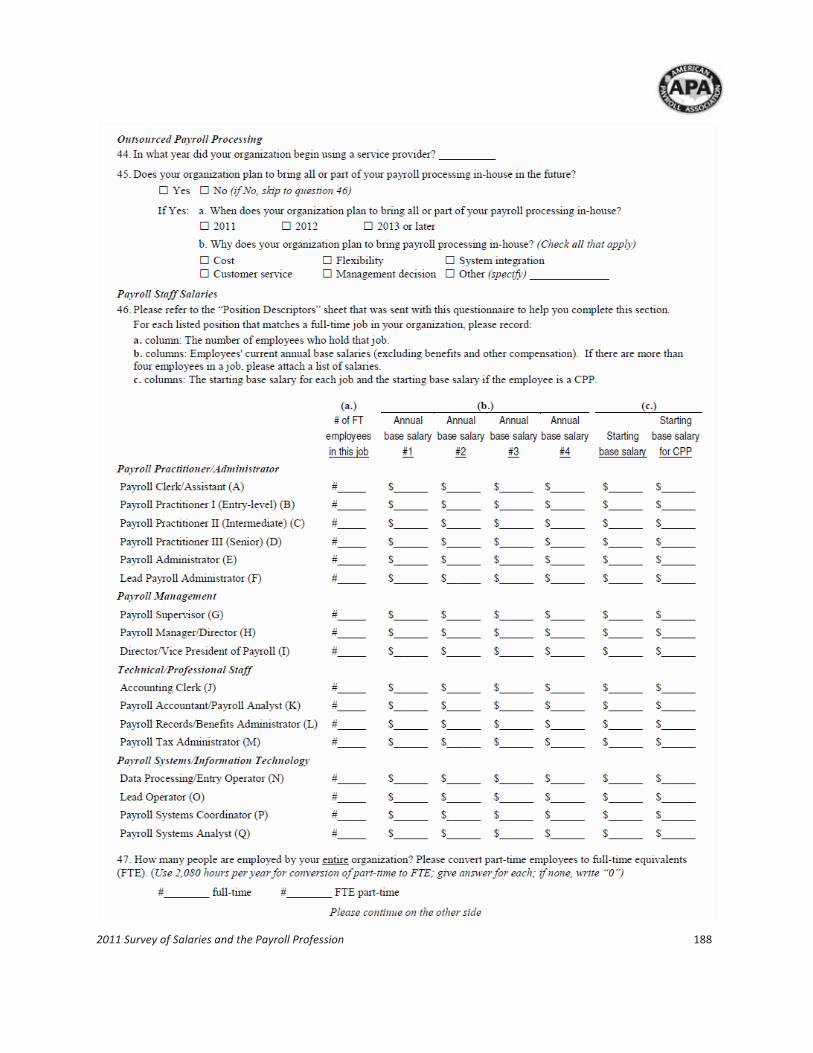
2011 Survey of Salaries and the Payroll Profession 188
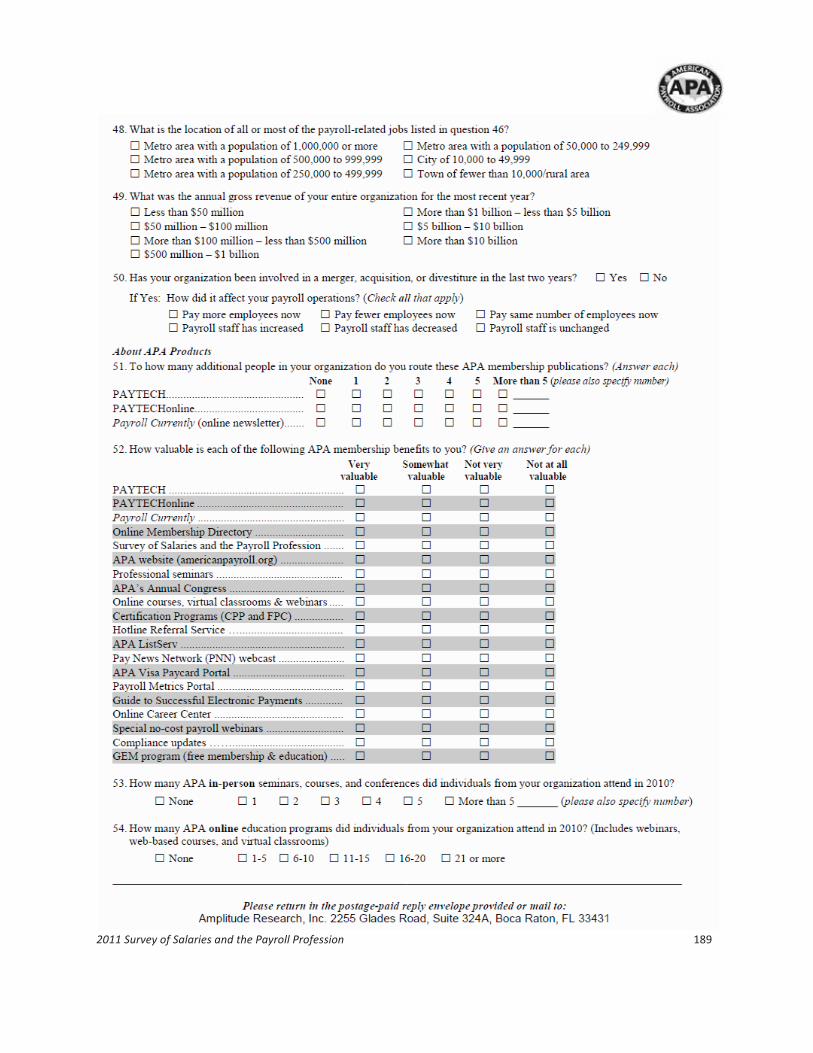
2011 Survey of Salaries and the Payroll Profession 189

2011 Survey of Salaries and the Payroll Profession 190
APA Position Descriptors
A job title alone is not sufficient in determining which payroll position best fits the job duties. Please carefully study all position descriptors to determine the survey position that best matches the duties and responsibilities of your job and other payroll-related jobs at your organization. If your organization has payroll positions that do not match any of the jobs in this survey, please submit the job descriptions for such positions to [email protected] so these positions may be considered for future surveys.
Payroll Practitioner/Administrator
A. Payroll Clerk/Assistant
Performs a variety of routine office/clerical duties such as filing, coding, posting, and typing. May require keyboard skills and elementary knowledge of word processing, spreadsheet, or database programs. Generally requires 6 months to 1 year of office experience. Does not require payroll or accounting knowledge. Works under close supervision.
B. Payroll Practitioner I (Entry-level)
Performs tasks to establish and maintain employee/payroll records. Duties may include checking and auditing timekeeping records for compliance with established standards, maintaining time and attendance records, entering new hires into the payroll system, posting changes in pay and tax status, and miscellaneous changes. Tasks are generally routine and require little or no deviation from established procedures. Works under close supervision. Usually requires a high school diploma or equivalent and a good math/accounting aptitude. This entry-level position requires office experience plus knowledge of calculator and word processing and spreadsheet programs. This position is generally found only in payroll departments of 3 or more people. FPC designation preferred.
C. Payroll Practitioner II (Intermediate)
Performs a wide variety of record keeping and payroll processing activities, including computing wage and overtime payments, calculating and recording payroll deductions, processing requests for paycheck advances, and processing terminations. Operates all departmental equipment. Although duties normally follow established procedures, responsibilities may include routine, minor corrections to make documents acceptable for processing. Works under general supervision. Requires 1 to 2 years of related experience and normally requires specific bookkeeping/accounting/payroll training. FPC designation preferred.
D. Payroll Practitioner III (Senior)
Performs all duties of Payroll Practitioner I and II and other duties including balancing and controlling earnings and deduction totals, calculating and preparing general ledger entries, inspecting automated system output such as registers and standard reports, determining and correcting out-of-balance conditions, preparing and filing tax reports, gathering payroll data for inclusion in financial statements, and researching and preparing special reports for management, calculating military and jury duty pay, and processing garnishments and levies. May train less experienced payroll practitioners and direct their daily work. Requires 2 to 4 years of payroll experience and may require experience with a specific payroll system. May require an associate’s degree or equivalent experience. FPC or CPP designation preferred.
E. Payroll Administrator (1-Person Payroll Department)
Performs all activities necessary to process 1 or more payrolls, including maintaining related records, filing tax reports and voluntary deduction reports, processing involuntary deductions such as levies and garnishments, preparing accounting transactions and documents, documenting and updating procedures, and preparing special reports for management. As the highest-ranking employee whose primary responsibility is payroll, incumbent is solely responsible for all payroll and related activities. Responsibilities generally encompass a single payroll for a smaller organization. Typically requires 3 to 5 years of payroll experience and may require an associate’s degree or equivalent training and education beyond high school. CPP designation preferred. Title of this position is irrelevant so long as the position is the only payroll position in a organization.

2011 Survey of Salaries and the Payroll Profession 191
F. Lead Payroll Administrator (2- or 3-Person Unit)
Performs and supervises all activities necessary to process 1 or more payrolls, including maintaining related records, filing tax reports and voluntary deduction reports, processing involuntary deductions such as levies and garnishments, preparing accounting transactions and documents, documenting and updating procedures, and preparing special reports for senior management. Supervises or leads a team of 1 or 2 Payroll Practitioners or assistants. Usually requires 3 to 5 years of payroll experience and typically requires an associate’s degree or equivalent training and education beyond high school. CPP designation preferred. This is typically a “working supervisor” who spends more than 50% of time personally performing payroll processing and related activities. If incumbent spends more than 50% of time planning, coordinating, and supervising, match the position to one of the payroll management positions.
Payroll Management
G. Payroll Supervisor
Supervises 2 or more Payroll Practitioners in carrying out responsibility for payroll preparation/production in the payroll department. Reports to the top payroll position or to a Payroll Manager. Typically requires 3 to 5 years of payroll experience and an associate’s degree or equivalent training and education. This is a unit supervisor in a department where one unit is responsible for payroll preparation/processing and one or more other units are responsible for tax reporting/records and benefits administration/payroll systems. CPP designation preferred. This is not the most senior payroll position.
H. Payroll Manager/Director
Manages the activities of 2 or more units within a large centralized payroll department in carrying out responsibility for payroll preparation/processing and one or more related responsibilities such as tax reporting, benefits-records administration, or payroll systems maintenance. Generally will have one or more Payroll Supervisors as direct reports. Alternately, this employee may manage a regional or sectional payroll and related activities in an organization that has multiple stand-alone payrolls reporting to a centralized payroll authority. Generally requires 5 or more years of payroll or closely related experience. May require a bachelor’s degree in accounting, business, or a related field. CPP designation preferred. This position reports to the most senior payroll position. If this employee spends more than 50% of time personally performing payroll processing and related activities, match the position to Lead Payroll Administrator.
I. Director/Vice President of Payroll
As the most senior person in the organization whose primary responsibility is payroll and related activities, incumbent directs the activities of the senior payroll management team and respective staff members. Incumbent develops and controls all tasks necessary to accomplish the organization’s payroll processing objectives, including relationships with internal and external auditors and state and federal agencies. More than 50% of incumbent’s time is spent on corporate payroll strategy, planning, communications, and marketing the payroll function and related services. Generally requires 5 to 7 years of payroll or closely related experience. May require a bachelor’s degree in accounting, business, or a related field. CPP designation preferred. Regardless of title, this is the most senior payroll position in the organization; the primary task is managing and directing the activities of others.
Technical/Professional Staff
J. Accounting Clerk
Performs a variety of accounting clerical tasks involving the preparation and maintenance of financial and related records. Duties may include auditing and reconciling bank statements, clearing payroll accounts and maintaining payroll general ledger accounts, and remitting taxes, levies, and garnishments. This is generally an intermediate position requiring knowledge of accounting terminology and methods, standard office procedures, and 1 to 2 years of related experience.
K. Payroll Accountant/Payroll Analyst
Maintains payroll-related accounts and is responsible for the reconciliation and accuracy of one or more accounts within a complex accounting system. Prepares various accounting papers, schedules, exhibits, and summaries. Determines the need for new accounts and revisions in the account structure. Researches and advises payroll staff concerning the accounting treatment of complex transactions. May perform periodic internal audits of various payroll areas and prepare materials for external or internal auditors. Generally requires a bachelor’s degree in accounting and 2 to 4 years of related experience. FPC or CPP designation preferred. This is the most senior position in which the incumbent’s primary responsibility is payroll accounting.

2011 Survey of Salaries and the Payroll Profession 192
L. Payroll Records/Benefits Administrator
Maintains payroll and related records recording the accumulation and use of vacations, holidays, sick days, and miscellaneous leaves of absence. May calculate deductions for group health, life, and disability insurance premiums and communicate to employees and payroll staff. May prepare premium reports and communicate with insurance carriers and other program vendors. May administer a variety of voluntary deductions such as United Way contributions, U.S. government bond purchases, and stock purchase plans. May administer pension benefits, retirement programs, 401(k) plan contributions and disbursements, and contributions to various thrift plans. This is the most senior position in which the primary responsibility is payroll-related leave and benefit records administration. Generally requires 2 to 4 years of related experience. May require a related degree or equivalent technical training. FPC or CPP designation preferred.
M. Payroll Tax Administrator
Responsible for all payroll tax activities, including compliance with local, state, and federal regulations and filing local, state, and federal payroll tax returns. May supervise 1 or more subordinates in the calculation and reporting of tax liabilities, in responding to questions and special requests from employees and regulatory agencies, in researching laws and regulations regarding taxes and payroll withholding procedures, and in preparing budgets, projections, and special reports for senior management. This is the most senior position in which the incumbent’s primary responsibility is payroll taxes. Generally requires 2 to 4 years of related experience. May require supervisory experience. May require a bachelor’s degree in accounting or equivalent technical training. CPP designation preferred.
Payroll Systems/Information Technology
N. Data Processing/Entry Operator
Uses computer terminal to input payroll data. Deciphers, translates, and codes complex alpha numeric payroll data and verifies input for accuracy and completeness. Does not require knowledge of payroll processing. Generally requires 1 to 2 years of related data entry experience.
O. Lead Operator
In addition to coding complex alpha numeric payroll data and verifying data input, may direct the work of subordinate or less experienced operators. Follows standard procedures to balance and control payroll system input and output. May set up coding procedures or format source documents for coding. Generally requires 2 to 3 years of related experience.
P. Payroll Systems Coordinator
Acts as liaison between payroll department and data processing, systems, or Information Systems department to ensure payroll staff understanding and implementation of payroll system requirements and revisions. Works closely with payroll staff in identifying need for system revisions, formulating system requests and recommendations, and analyzing post-implementation results of system changes. Keeps payroll staff informed of easier, quicker methods available for their use. Requires 3 to 5 years of experience with automated payroll systems and extensive knowledge of specific payroll systems. Generally requires excellent written and oral communications skills. FPC or CPP designation preferred.
Q. Payroll Systems Analyst
Prepares detailed design and program specifications for automated payroll systems. Verifies and evaluates payroll program specifications created by programmers. May provide work direction to programmers. Implements and maintains payroll systems developed in-house. May implement and maintain payroll systems purchased from outside vendors. Prepares feasibility studies of potential systems modifications and changes. May act as liaison between payroll and systems to ensure documentation of system functions and capabilities and to facilitate the training of payroll staff in the use of the automated system. Generally requires 3 to 4 years of related experience as a systems analyst and may require specific training in payroll and accounting systems. FPC or CPP designation preferred.