
Survey of Plasticisers in Australian Foods › publications › Documents › Surve… · The...
101
i Survey of Plasticisers in Australian Foods An Implementation Subcommittee for Food Regulation Coordinated Survey March 2018
Transcript of Survey of Plasticisers in Australian Foods › publications › Documents › Surve… · The...

i
Survey of Plasticisers in Australian Foods
An Implementation Subcommittee for Food Regulation Coordinated Survey
March 2018

ii
Table of Contents Acknowledgements ............................................................................................................... iv
Abbreviations ........................................................................................................................ iv
Executive summary ............................................................................................................... 1
Introduction .................................................................................................................... 2
Regulation of food packaging material ............................................................................ 3
Previous Australian and international survey activities ................................................... 3
3.1 Australia .................................................................................................................. 3
3.2 International ............................................................................................................ 4
Analytical survey summary ............................................................................................. 4
4.1 Plasticisers included in the survey ........................................................................... 4
4.2 Sample collection and preparation .......................................................................... 6
4.3 Sample analysis ...................................................................................................... 7
4.4 Discussion of analytical results ................................................................................ 7
Hazard identification ....................................................................................................... 8
5.1 Di(2-ethylhexyl) phthalate (DEHP) ........................................................................... 9
5.2 Diisononyl phthalate (DINP) .................................................................................... 9
5.3 Butyl benzyl phthalate (BBP) ................................................................................... 9
5.4 Dibutyl phthalate (DBP) ........................................................................................... 9
5.5 Diisodecyl phthalate (DIDP) ...................................................................................10
5.6 Di(2-ethylhexyl) adipate (DEHA).............................................................................10
5.7 Acetyltributylcitrate (ATBC) ....................................................................................10
Dietary exposure assessment .......................................................................................10
6.1 Approach to estimating dietary exposure to plasticisers .........................................10
Food consumption data .................................................................................................10
Food chemical concentrations for dietary exposure assessment ...................................11
6.2 Assumptions and limitations in dietary modelling ....................................................12
6.3 Dietary exposure results .........................................................................................13
Di(2-ethylhexyl) phthalate (DEHP) .................................................................................15
Diisononyl phthalate (DINP) ..........................................................................................16
Butylbenzyl phthalate (BBP) ..........................................................................................18
Dibutyl phthalate (DBP) .................................................................................................20
Diisodecyl phthalate (DIDP) ..........................................................................................21
Di(2-ethylhexyl) adipate (DEHA) ....................................................................................22
Acetyl tributyl citrate (ATBC) .........................................................................................24
xx 2018
iii
Risk characterisation .....................................................................................................26
Conclusions ...................................................................................................................26
References ...........................................................................................................................28
Appendix 1: Foods sampled .................................................................................................32
Appendix 2 : Food preparation instructions ...........................................................................33
General instructions ..........................................................................................................33
Avoiding cross contamination ........................................................................................33
Gloves ...........................................................................................................................33
Equipment .....................................................................................................................33
Washing of equipment ...................................................................................................33
Handling purchases for food preparation .......................................................................33
Preparing and storing samples .........................................................................................33
Food preparation instructions ............................................................................................34
Appendix 3: Analytical results for Plasticisers .......................................................................38
Appendix 4: Estimating dietary exposures ............................................................................66
What is dietary modelling? ................................................................................................66
How the dietary modelling was conducted ........................................................................66
Food consumption data ....................................................................................................67
Number of respondents in each of the population groups assessed .................................67
Construction of the model diet for 9 month old infants .......................................................67
Respondents versus consumers .......................................................................................68
Use of median food chemical concentration values ..........................................................68
Food mapping ...................................................................................................................69
Food contribution calculations ...........................................................................................70
Appendix 5: Median Plasticiser concentrations (mg/kg) in foods for dietary exposure assessment ..........................................................................................................................71
Appendix 6: Estimated dietary exposures to plasticisers ......................................................75
Appendix 7: Major food contributors to plasticiser dietary exposures, derived using median concentrations ......................................................................................................................78
Appendix 8: Mapping ............................................................................................................92
iv
Acknowledgements
FSANZ would like to thank:
Officers from State and Territory food regulatory agencies including New South Wales Department of Primary Industries Food Authority, South Australia Health, Victoria Department of Health and Human Services and Western Australia Department of Health for collecting samples and dispatching them to the laboratory
National Measurement Institute for preparing samples
Eurofins for analysing samples
New Zealand Ministry for Primary Industries for technical discussions.
Abbreviations
ABS Australian Bureau of Statistics
AHS Australian Health Survey
ATBC Acetyltributylcitrate
ATDS Australian Total Diet Study
BBP Butyl benzyl phthalate
bw Body weight
CMPF Chemical migration from packaging into food
CURF Confidentialised Unit Record Files
DBP Dibutyl phthalate
DEA Dietary exposure assessment
DEHA Di(2-ethylhexyl) adipate
DEHP Di(2-ethylhexyl) phthalate
DIDP Diisodecyl phthalate
DINP Diisononyl phthalate
FAO Food and Agriculture Organisation of the United Nations
FSANZ Food Standards Australia New Zealand
HBGV Health Based Guidance Values
ISFR Implementation Subcommittee for Food Regulation
LOD Limit of detection
LOQ Limit of quantitation
LOR Limit of reporting
NATA National Association for Testing Authorities
NHMRC National Health and Medical Research Council
NMI National Measurement Institute
NNPAS National Nutrition and Physical Activity Survey
PVC Polyvinyl chloride
SME Small and medium-sized enterprises
TDI Tolerable daily intake (mg/kg bw/day)
WHO World Health Organisation

1
Executive summary
Over the past ten years, there has been increased international scrutiny regarding food packaging chemicals and potential adverse effects on human health. FSANZ has completed a proposal, P1034, investigating and managing risks to Australian and New Zealand consumers from chemical migration from packaging into foods. To support this work, FSANZ has undertaken a number of analytical surveys, which have consistently found that migration of packaging chemicals into Australian foods is very low and presents a negligible risk for Australian consumers. However, the recent 24th Australian Total Diet Study (ATDS) Phase 2, found that more comprehensive analytical data was required for two phthalate plasticisers, di(2-ethylhexyl) phthalate (DEHP) and diisononyl phthalate (DINP), to enable a more refined assessment of potential human health risks. The Survey of Plasticisers in Australian Foods was conducted as a follow-up to the 24th ATDS Phase 2, and investigated the levels of DEHP, DINP and other phthalate plasticisers butyl benzyl phthalate (BBP), dibutyl phthalate (DBP), and diisodecyl phthalate (DIDP), the adipate plasticiser; di(2-ethylhexyl) adipate (DEHA), and the citrate plasticiser; acetyltributylcitrate (ATBC) in a broad range of Australian foods. These substances may be used in plastic, paper and cardboard food packaging as well as food grade adhesives and sealants. They are also utilised for a wider variety of industrial purposes including but not restricted to use in building materials, toys, electronic equipment, vehicles, textiles and many other manufacturing and processing applications (ECHA, 2017). Phthalates are ubiquitous environmental contaminants, and may be present in foods at low levels from sources other than food packaging migration. The survey involved the analysis of 65 different packaged foods and beverages broadly representative of typical consumption patterns for Australian consumers and the variety of packaging materials used for Australian foods, including those considered likely to contain higher levels of phthalates. Overall, the analytical results indicated that levels of these substances were generally low in the majority of tested foods, with the highest concentrations being inconsistently found in a limited number of fatty food samples. Analytical results were then used to undertake a risk assessment which found that estimated dietary exposure for Australian consumers was well below internationally recognised tolerable daily intakes (TDIs1). For all seven plasticisers, average and high (90th percentile) estimated dietary exposure was no greater than 25% and 50% of the TDI respectively, using
1 The TDI is an estimate of the amount of a substance in food that can be ingested daily over a lifetime without appreciable health risk.
Key findings
The Survey of Plasticisers in Australian Foods investigated the levels of seven plasticisers which may be used in food packaging materials, including DEHP, DINP, BBP, DBP, DIDP, DEHA and ATBC in a broad range of Australian foods.
The survey results indicate that the levels of these seven plasticisers in a broad range of Australian foods are generally low.
Estimated dietary exposure for Australian consumers was below internationally recognised safe levels. No public health and safety concerns were identified for the Australian population.
The conclusions from this survey formed part of the evidence base for the FSANZ packaging proposal: P1034 – Chemical Migration from Packaging into Food.

2
highly conservative modelling scenarios representing a range of Australian population groups. Based on these outcomes, current dietary exposures of Australian consumers to the seven plasticisers included in this study are not considered to be of health concern. These outcomes were used as part of the evidence base to inform the FSANZ packaging proposal (P1034 – Chemical Migration from Packaging into Food), which considered several options for managing the risks associated with potential migration of a broader range of substances found in food contact materials.
Introduction
The Survey of Plasticisers in Australian Foods was conducted as part of the Implementation Subcommittee for Food Regulation’s (ISFR) Coordinated Food Survey Plan. The role of ISFR is to develop and ensure consistent approaches across jurisdictions for implementation of the joint Australia New Zealand food regulation system. A key output of ISFR is the Coordinated Food Survey Plan, which is developed to promote a bi-nationally consistent approach to food surveillance activities to inform food regulation policy, standards development and compliance priorities. The survey was conducted as a follow-up to Phase 2 of the 24th ATDS, a screening study which involved the analysis of a broad range of Australian foods for 30 food packaging chemicals and printing inks. The 24th ATDS found that there were no public health and safety concerns for 28 of the 30 chemicals, even using highly conservative dietary exposure screening approaches to determine theoretical maximum daily exposures. However, the study identified that more survey work needed to be done on two phthalate plasticisers: DEHP and DINP, to allow a refined dietary exposure assessment to be conducted and determine whether there are any public health and safety concerns. The survey examined the levels of several phthalates, including DEHP and DINP, BBP, DBP and DIDP), the adipate plasticiser; DEHA, and the citrate plasticiser; ATBC, in a broad range of packaged foods with a relatively high potential to be exposed to food packaging and processing equipment containing these chemicals. It was designed to enable a robust dietary exposure assessment to assess potential risks to public health and inform whether further risk management measures are required. The outcomes have contributed important information to the FSANZ packaging proposal P10342. Current requirements for food packaging materials in the Australia New Zealand Food Standards Code (the Code; FSANZ, 2017) are largely non-directive and place an amount of responsibility for the safety of food contact materials with food industry manufacturers and retailers. Other comparable food regulatory authorities such as the United States of America (US) and the European Union (EU) have more prescriptive requirements for food contact materials. These are discussed in more detail in Section 2. Further information on FSANZ’s approach to assessing public health and safety risks relating to chemical migration from packaging into food can be found in FSANZ’s consultation paper for Proposal 1034 available on the FSANZ website (FSANZ, 2016a).
2 FSANZ has decided to abandon the proposal. That is, the development of a food regulatory measure was not warranted. This decision was taken after having regard to the risk assessment outcomes, risk management considerations, the submissions received and feedback from stakeholder consultations. The decision to abandon was publicly notified in October 2017 and proposal reports are available on the FSANZ website.
3
Regulation of food packaging material
Food safety risks from potential migration from food packaging into foods are managed primarily through the Food Acts of New Zealand and the Australian States and Territories. These Acts make it an offence to sell food packaging or handling materials that are unsafe or will make the food unsafe. The Australian New Zealand Food Standards Code (the Code) contains various requirements which apply to food businesses and to food for sale. The Food Acts also make it an offence to contravene these requirements. The Code’s requirements relating to food packaging requirements pertinent to both Australia and New Zealand include the general packaging requirements in Standard 1.1.1 (subsections1.1.1—10(10) and (11) (Packaging requirements) and maximum levels (MLs) for three packaging contaminants, regulated by subsection 1.1.1—10(5) and Standard 1.4.1. Details of maximum levels for specific foods are provided in Schedule 19 (sections S19—4 (metal contaminants) and S19—5 (non-metal contaminants). Standard 2.6.2 has requirements for chemical limits in packaged water which align with World Health Organisation drinking water guidelines (WHO, 2011). For Australia, Standard 3.2.2 and Standard 4.2.1 have requirements pertaining to food packaging. Standard 3.2.2 contains requirements for food businesses (including manufacturers, caterers, importers and retailers) regarding the safety of packaging. Standard 4.2.1 also contains requirements for seafood businesses regarding the safety of packaging. The relevant provisions of the Food Acts and of the Code are detailed in the Supporting Documents 1 and 2 released with the November 2014 Consultation Paper. These are available on the FSANZ website. In contrast, the United States of America (USA) and member countries of the European Union (EU) have more specific and prescriptive requirements to control chemical migration from packaging into food (CMPF). These benchmark regulations are recognised globally and most other countries either adopt them or use them as the foundation for their own regulations3.
Previous Australian and international survey activities
3.1 Australia
FSANZ has undertaken a number of analytical surveys investigating migration of packaging materials into food. In 2010, FSANZ published two analytical survey reports on bisphenol A (BPA) and other food packaging materials including phthalates, semicarbazide, perfluorinated compounds, acrylonitrile, vinyl chloride and epoxidised soy bean oil (ESBO). The results found that only a limited number of samples had detectable levels of BPA and ESBO. Estimated dietary exposures to these substances were considered to be low and there were no human health concerns identified (FSANZ, 2010a; 2010b).
3 See Consultation Paper SD2 – International regulations for food contact materials: http://www.foodstandards.gov.au/code/proposals/Documents/P1034-Packaging-CFS-SD2.pdf
4
In 2016, FSANZ published the 24th ATDS Phase 2, a screening study which involved the analysis of a broad range of Australian foods for 30 food packaging chemicals. These included BPA, ESBO, perfluorinated compounds, 14 phthalates (and adipate DEHA) and 11 printing inks. The results indicated that there were no public health and safety concerns for 28 of the 30 chemicals, using highly conservative dietary exposure screening methods. However, the study identified that more survey work needed to be done on two phthalate plasticisers; DEHP and DINP, to allow a refined dietary exposure assessment to be conducted and determine whether there are any public health and safety concerns (FSANZ, 2016c). The outcomes of the 24th ATDS Phase 2 led to the initiation on the current Survey of Plasticisers in Australian Foods.
3.2 International
In Europe, routine monitoring of food packaging chemicals is undertaken and reported through the Rapid Alert System for Food and Feed (RASFF). These notifications include reports on identified risks relating to food packaging chemicals (such as through migration into food and feed) for products which are rejected or detained at the border. The notifying country typically reports details on the product, its traceability, the identified risks and any measures it has taken (EC, 2016). In 2016, there were 131 food packaging chemical notifications made4, 27 of which were alerts (i.e. where a food packaging chemical is considered to pose a serious risk and when rapid action such as product withdrawal or recall might be required in an importing country). These have included numerous exceedances of relevant regulatory limits for phthalates, including DEHP in food (EC, 2017). International surveys investigating food packaging chemicals, including several total diet studies in the UK (Bradley et al. 2013a), Denmark (Petersen and Breindahl, 2000), China (Guo et al, 2012), the US (Schecter et al, 2013) and Canada (Cao et al, 2015) have consistently reported the presence of phthalates in food. Studies carried out in the UK and Denmark were used by EFSA (2005a) to undertake a risk assessment of DEHP. The assessment noted that exposure to DEHP from food consumption is in the range of the relevant Health Based Guidance Value (HBGV), the TDI, though it was noted that there are a number of other sources which contribute to the overall human exposure. The UK Committee on Toxicity (UK COT 2011) concluded from an analysis of the dietary exposure to phthalates (Bradley et al, 2013a) that levels of phthalates detected in the total diet study did not indicate a risk to human health from dietary exposure alone. Other non-dietary sources of exposure would also need to be considered in a full risk assessment for phthalates. The results from diet studies in China and the US are consistent with these conclusions.
Analytical survey summary
4.1 Plasticisers included in the survey
Seven different chemicals which are known to be used as plasticisers were included in the survey, including five phthalates, one adipate and one citrate. Phthalates are also used in various solvents, coatings and adhesives. The major uses of phthalates in food packaging and production materials are in polyvinyl chloride (PVC) tubing, gaskets, cling wraps, printing inks, paper and cardboard packaging and laminated aluminium foil (Cao 2010).
4 There are three kinds of RASFF notifications: alert notifications, information notifications and border rejection notifications: https://ec.europa.eu/food/sites/food/files/safety/docs/rasff_annual_report_2015.pdf.
5
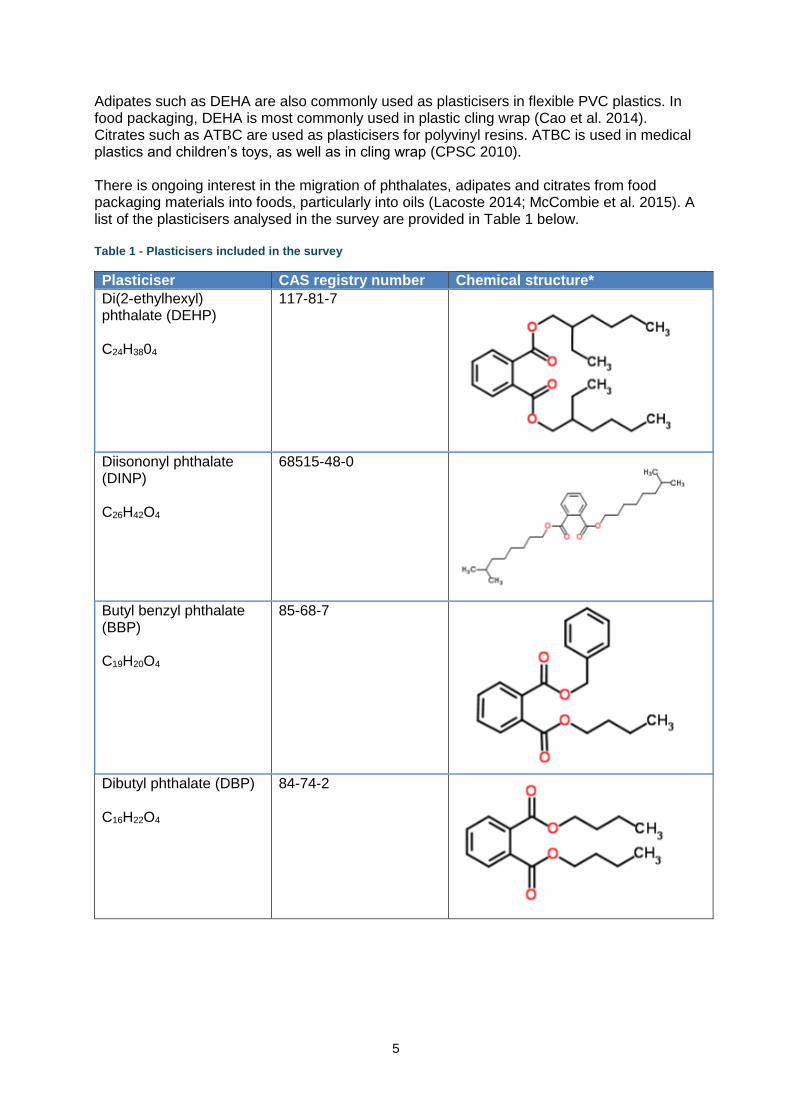
Adipates such as DEHA are also commonly used as plasticisers in flexible PVC plastics. In food packaging, DEHA is most commonly used in plastic cling wrap (Cao et al. 2014). Citrates such as ATBC are used as plasticisers for polyvinyl resins. ATBC is used in medical plastics and children’s toys, as well as in cling wrap (CPSC 2010). There is ongoing interest in the migration of phthalates, adipates and citrates from food packaging materials into foods, particularly into oils (Lacoste 2014; McCombie et al. 2015). A list of the plasticisers analysed in the survey are provided in Table 1 below. Table 1 - Plasticisers included in the survey
Plasticiser CAS registry number Chemical structure*
Di(2-ethylhexyl) phthalate (DEHP) C24H3804
117-81-7
Diisononyl phthalate (DINP) C26H42O4
68515-48-0
Butyl benzyl phthalate (BBP) C19H20O4
85-68-7
Dibutyl phthalate (DBP) C16H22O4
84-74-2
6
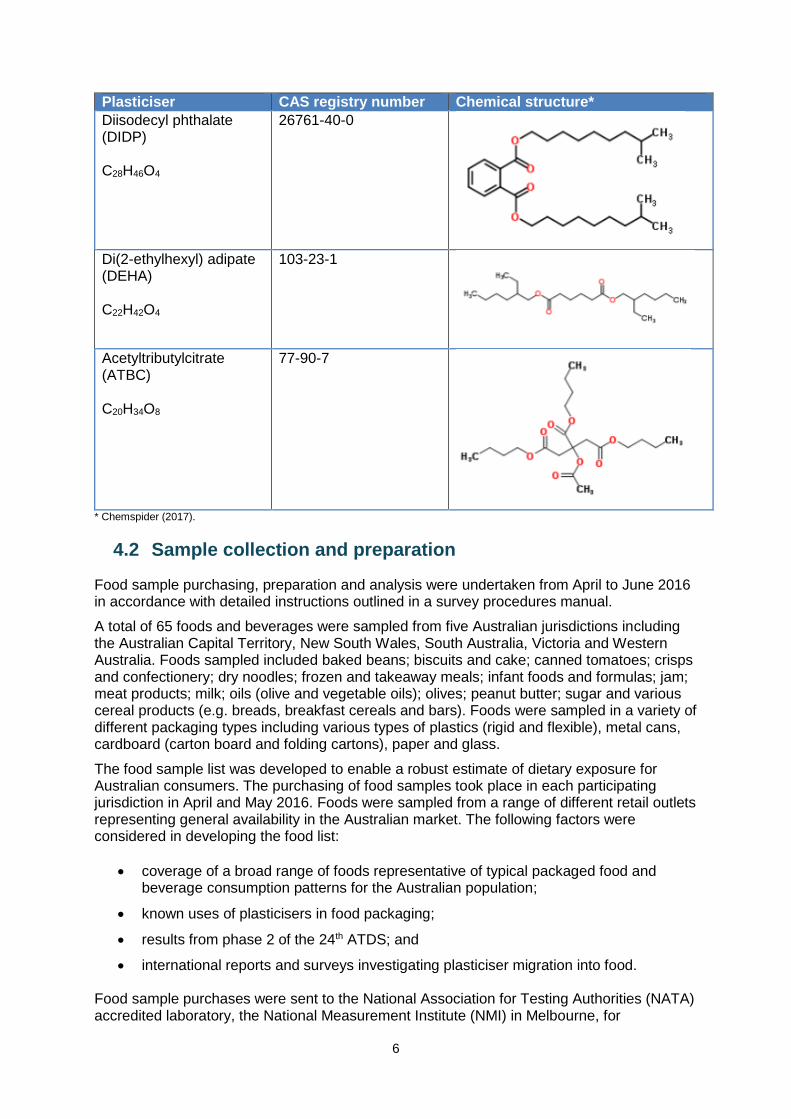
Plasticiser CAS registry number Chemical structure*
Diisodecyl phthalate (DIDP) C28H46O4
26761-40-0
Di(2-ethylhexyl) adipate (DEHA) C22H42O4
103-23-1
Acetyltributylcitrate (ATBC) C20H34O8
77-90-7
* Chemspider (2017).
4.2 Sample collection and preparation
Food sample purchasing, preparation and analysis were undertaken from April to June 2016 in accordance with detailed instructions outlined in a survey procedures manual.
A total of 65 foods and beverages were sampled from five Australian jurisdictions including the Australian Capital Territory, New South Wales, South Australia, Victoria and Western Australia. Foods sampled included baked beans; biscuits and cake; canned tomatoes; crisps and confectionery; dry noodles; frozen and takeaway meals; infant foods and formulas; jam; meat products; milk; oils (olive and vegetable oils); olives; peanut butter; sugar and various cereal products (e.g. breads, breakfast cereals and bars). Foods were sampled in a variety of different packaging types including various types of plastics (rigid and flexible), metal cans, cardboard (carton board and folding cartons), paper and glass.
The food sample list was developed to enable a robust estimate of dietary exposure for Australian consumers. The purchasing of food samples took place in each participating jurisdiction in April and May 2016. Foods were sampled from a range of different retail outlets representing general availability in the Australian market. The following factors were considered in developing the food list:
coverage of a broad range of foods representative of typical packaged food and beverage consumption patterns for the Australian population;
known uses of plasticisers in food packaging;
results from phase 2 of the 24th ATDS; and
international reports and surveys investigating plasticiser migration into food. Food sample purchases were sent to the National Association for Testing Authorities (NATA) accredited laboratory, the National Measurement Institute (NMI) in Melbourne, for
7
preparation as soon as practicable after purchase. Before analysis, the majority of samples were prepared to a table ready state, including cooking (where required) and removal of inedible portions. The sample preparation process also included heat-treating of meat and dairy products to an internal temperature of 80ºC to meet European importation requirements. For example, beef steak was dry fried before analysis. Some of the foods surveyed, such as sugar and infant desserts, were in a table-ready form at the time of purchase and did not require additional preparation. Perishable foods were all prepared within 48 hours of purchasing. Frozen and shelf-stable foods were prepared within a week of purchase. Further details on food preparation instructions are outlined in Appendix 2.
4.3 Sample analysis
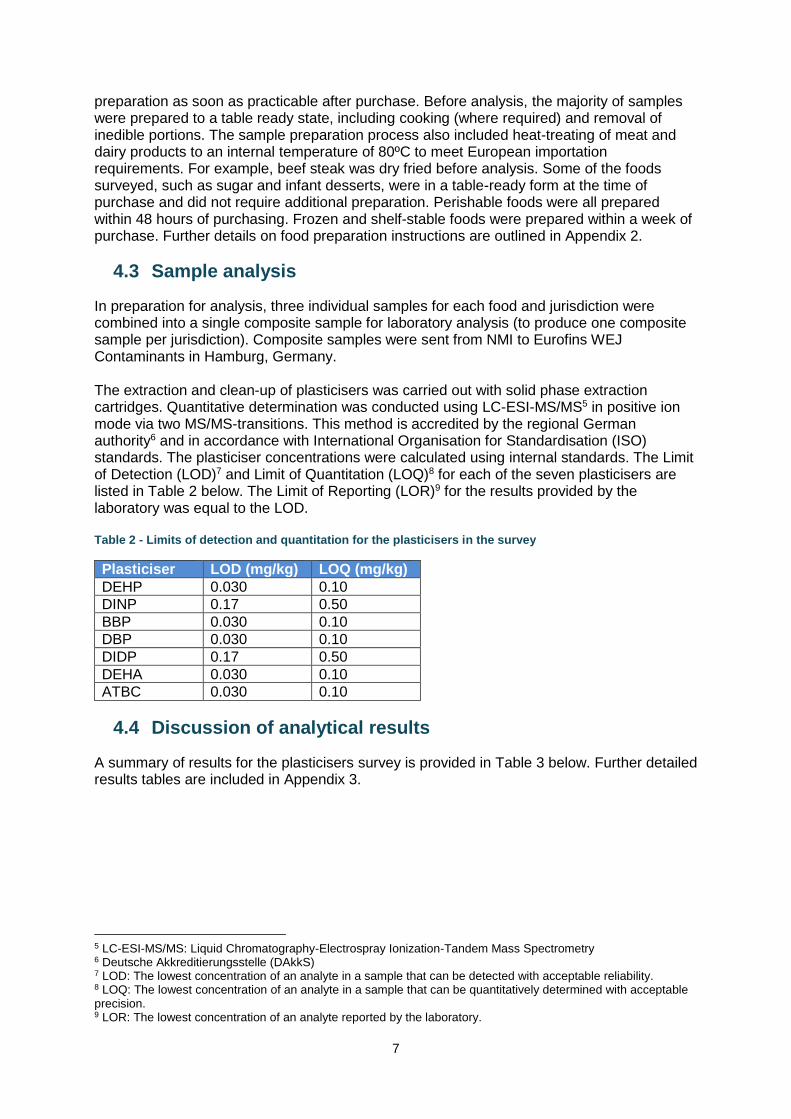
In preparation for analysis, three individual samples for each food and jurisdiction were combined into a single composite sample for laboratory analysis (to produce one composite sample per jurisdiction). Composite samples were sent from NMI to Eurofins WEJ Contaminants in Hamburg, Germany. The extraction and clean-up of plasticisers was carried out with solid phase extraction cartridges. Quantitative determination was conducted using LC-ESI-MS/MS5 in positive ion mode via two MS/MS-transitions. This method is accredited by the regional German authority6 and in accordance with International Organisation for Standardisation (ISO) standards. The plasticiser concentrations were calculated using internal standards. The Limit of Detection (LOD)7 and Limit of Quantitation (LOQ)8 for each of the seven plasticisers are listed in Table 2 below. The Limit of Reporting (LOR)9 for the results provided by the laboratory was equal to the LOD. Table 2 - Limits of detection and quantitation for the plasticisers in the survey
Plasticiser LOD (mg/kg) LOQ (mg/kg)
DEHP 0.030 0.10
DINP 0.17 0.50
BBP 0.030 0.10
DBP 0.030 0.10
DIDP 0.17 0.50
DEHA 0.030 0.10
ATBC 0.030 0.10
4.4 Discussion of analytical results
A summary of results for the plasticisers survey is provided in Table 3 below. Further detailed results tables are included in Appendix 3.
5 LC-ESI-MS/MS: Liquid Chromatography-Electrospray Ionization-Tandem Mass Spectrometry 6 Deutsche Akkreditierungsstelle (DAkkS) 7 LOD: The lowest concentration of an analyte in a sample that can be detected with acceptable reliability. 8 LOQ: The lowest concentration of an analyte in a sample that can be quantitatively determined with acceptable precision. 9 LOR: The lowest concentration of an analyte reported by the laboratory.
8
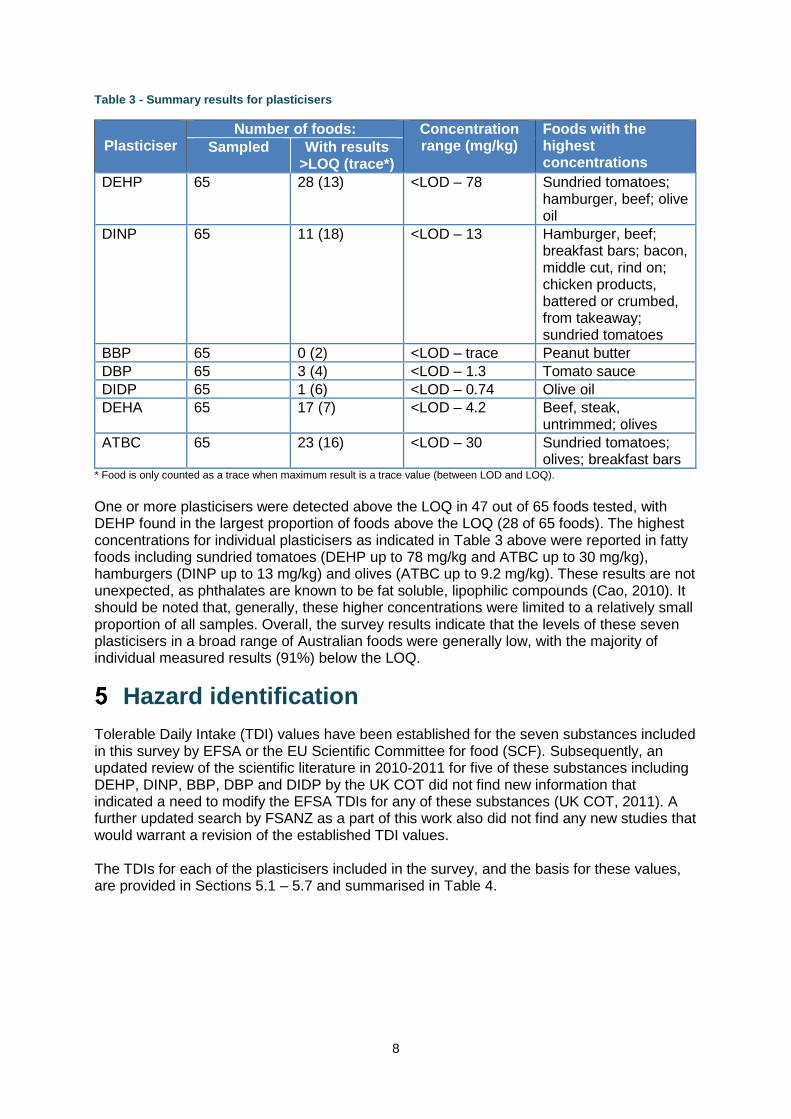
Table 3 - Summary results for plasticisers
Plasticiser
Number of foods: Concentration range (mg/kg)
Foods with the highest concentrations
Sampled With results >LOQ (trace*)
DEHP 65 28 (13) <LOD – 78 Sundried tomatoes; hamburger, beef; olive oil
DINP 65 11 (18) <LOD – 13 Hamburger, beef; breakfast bars; bacon, middle cut, rind on; chicken products, battered or crumbed, from takeaway; sundried tomatoes
BBP 65 0 (2) <LOD – trace Peanut butter
DBP 65 3 (4) <LOD – 1.3 Tomato sauce
DIDP 65 1 (6) <LOD – 0.74 Olive oil
DEHA 65 17 (7) <LOD – 4.2 Beef, steak, untrimmed; olives
ATBC 65 23 (16) <LOD – 30 Sundried tomatoes; olives; breakfast bars
* Food is only counted as a trace when maximum result is a trace value (between LOD and LOQ). One or more plasticisers were detected above the LOQ in 47 out of 65 foods tested, with DEHP found in the largest proportion of foods above the LOQ (28 of 65 foods). The highest concentrations for individual plasticisers as indicated in Table 3 above were reported in fatty foods including sundried tomatoes (DEHP up to 78 mg/kg and ATBC up to 30 mg/kg), hamburgers (DINP up to 13 mg/kg) and olives (ATBC up to 9.2 mg/kg). These results are not unexpected, as phthalates are known to be fat soluble, lipophilic compounds (Cao, 2010). It should be noted that, generally, these higher concentrations were limited to a relatively small proportion of all samples. Overall, the survey results indicate that the levels of these seven plasticisers in a broad range of Australian foods were generally low, with the majority of individual measured results (91%) below the LOQ.
Hazard identification
Tolerable Daily Intake (TDI) values have been established for the seven substances included in this survey by EFSA or the EU Scientific Committee for food (SCF). Subsequently, an updated review of the scientific literature in 2010-2011 for five of these substances including DEHP, DINP, BBP, DBP and DIDP by the UK COT did not find new information that indicated a need to modify the EFSA TDIs for any of these substances (UK COT, 2011). A further updated search by FSANZ as a part of this work also did not find any new studies that would warrant a revision of the established TDI values. The TDIs for each of the plasticisers included in the survey, and the basis for these values, are provided in Sections 5.1 – 5.7 and summarised in Table 4.

9
Table 4 - Hazard summary for plasticisers included in the survey
Plasticiser Endpoint NOAEL (mg/kg bw/day)
Uncertainty factor
TDI (mg/kg bw/day)
Source
DEHP Testicular toxicity in
rats 5 100 0.05
EFSA (2005a)
DINP Liver and kidney
effects in rats 15 100 0.15
EFSA (2005b)
BBP Testicular toxicity and reduced anogenital
distance in rats 50 100 0.5
EFSA (2005e)
DBP Developmental effects
in rats 2
(LOAEL) 200 0.01
EFSA (2005d)
DIDP Liver effects in dogs
15 100 0.15 EFSA
(2005c)
DEHA Foetotoxicty in rats
30 100 0.3 SCF
(2000)
ATBC Reduced body weight
in rats 100 100 1
EFSA (2005f)
5.1 Di(2-ethylhexyl) phthalate (DEHP)
Effects on reproduction and development are the critical toxicological effects of DEHP, and are the most sensitive endpoints on which to base a risk assessment. EFSA has established a TDI for DEHP of 0.05 mg/kg bw/day. This was based on a no observed adverse effect level (NOAEL) of 5 mg/kg bw/day for testicular toxicity and developmental toxicity in a multigenerational reproductive toxicity study in rats, and application of an uncertainty factor of 100 (EFSA 2005a).
5.2 Diisononyl phthalate (DINP)
Although carcinogenic effects have been observed in the liver of rodents in studies involving administration of DINP, these effects are caused by peroxisome proliferation, a mechanism which is not considered relevant to humans (FAO/WHO 2009). EFSA derived a TDI of 0.15 mg/kg bw/day for DINP, based on a NOAEL of 15 mg/kg bw/day in a two-year rat study and application of an uncertainty factor of 100 (EFSA 2005b). Adverse effects in the liver and kidney were observed at the next highest dose, with effects on reproduction and development occurring at higher doses.
5.3 Butyl benzyl phthalate (BBP)
BBP has been shown to cause adverse effects on reproduction and development in laboratory animals. Based on an overall NOAEL of 50 mg/kg bw/day from reproduction studies in rats showing testicular toxicity and reduced anogenital distance at higher doses, EFSA established a TDI of 0.5 mg/kg bw/day, using an uncertainty factor of 100 (EFSA 2005e).
5.4 Dibutyl phthalate (DBP)
Effects on reproduction and development are also the most sensitive endpoints on which to base a risk assessment of DBP. Reduction of testicular spermatocyte development and mammary gland changes were seen in offspring in a developmental toxicity study in rats at a dose of approximately 2 mg/kg bw/day, the lowest dose tested in this study. These effects

10
resolved over time. Adverse effects on reproduction and development have been observed at higher doses in a number of studies. The effects at the lowest observed adverse effect level (LOAEL) in the developmental study were reversible, and approximately 30-fold higher NOAELs or LOAELs have been determined in several reproductive toxicity studies with longer exposure periods. EFSA therefore considered it was appropriate to apply an uncertainty factor of 200 to the LOAEL of 2 mg/kg bw/day to derive a TDI of 0.01 mg/kg bw/day for DBP (EFSA 2005d).
5.5 Diisodecyl phthalate (DIDP)
An EFSA review of DIDP concluded that effects on liver, reproduction and development are the critical end-points on which to base a risk assessment of DIDP. A NOAEL of 33 mg/kg bw/day was identified for effects on offspring survival in multigenerational studies of rats, and a NOAEL of 15 mg/kg bw/day was identified for liver effects in a repeated dose toxicity study in dogs. Based on the lowest NOAEL from these studies and application of an uncertainty factor of 100, a TDI of 0.15 mg/kg bw/day was derived for DIDP (EFSA 2005c).
5.6 Di(2-ethylhexyl) adipate (DEHA)
The most sensitive endpoints in toxicity studies involving administration of DEHA are on reproduction and development. The SCF established a TDI for DEHA of 0.3 mg/kg bw/day. This was based on a NOAEL of 30 mg/kg bw/day based on findings of foetotoxicity at 110 mg/kg bw/day in a teratogenicity study in rats. An uncertainty factor of 100 was applied to the NOAEL (SCF, 2000).
5.7 Acetyltributylcitrate (ATBC)
A TDI of 1.0 mg/kg bw/day has been established for ATBC by EFSA (EFSA 2005f). This is based on a NOAEL of 100 mg/kg bw/day identified in repeated dose toxicity and reproductive toxicity studies in rats and application of an uncertainty factor of 100. In these studies mild effects on body weight and some biochemical parameters were observed at higher doses.
Dietary exposure assessment
6.1 Approach to estimating dietary exposure to plasticisers
Dietary exposure assessments (DEAs) require information on both the concentrations of the chemicals of interest in foods and how much of these foods are consumed by the population of interest. For the purposes of this DEA a 'total diet study' approach was used, where survey foods were prepared to an 'as consumed' state prior to analysis and were 'mapped' to similar foods identified as consumed in the most recent Australian national nutrition surveys. For detailed information regarding the methodology used for this dietary exposure assessment, refer to the supplementary information provided in Appendix 4. Information on FSANZ's general methodologies and approach to conducting DEAs is set out in the Principles and Practices of Dietary Exposure Assessment for Food Regulatory Purposes (FSANZ 2009).
Food consumption data
The DEA uses food consumption data from the 2011–12 Australian National Nutrition and Physical Activity Survey (2011-12 NNPAS), a component of the 2011–13 Australian Health

11
Survey (AHS), that surveyed 12,153 Australians aged 2 years and above using a 24-hour recall methodology. A second 24-hour recall was also collected on a subset (64%) of NNPAS respondents on a non-consecutive day. An average of two days of data for this subset of respondents was used in this assessment to better estimate longer term dietary exposures. For further information on the food consumption data, refer to Appendix 4. As no food consumption data from the NNPAS were available for children under two years of age, a model diet was constructed to enable dietary exposure to be assessed for infants. For further information on this process, see Appendix 4.
6.1.1.1 Population groups assessed
Dietary exposures to plasticisers were estimated for a range of Australian population groups including:
9 month old infants
children aged 2-5 years
children aged 6-12 years
children aged 13-16 years
general population 17 years and above.
Information on the number of survey respondents within each population group is provided in Appendix 4. Dietary exposure assessments were conducted for infants and children as separate groups as they generally have higher exposures because they consume more food on a kilogram body weight basis compared to adults. For further information about the methods and data used to underpin the dietary exposure assessment of the different age groups, refer to the supplementary information in Appendix 4.
Food chemical concentrations for dietary exposure assessment
As discussed in Section 4.3 above, there were a number of composite samples analysed for each food in the survey. For the purposes of the DEA, the median concentrations of plasticisers in each food was used (refer to Appendix 4 for further discussion on the use of median concentration values). In the case of hamburgers and noodles, two different varieties were analysed and reported separately but all results for each food were combined for the purposes of calculating a median concentration for use in the DEA. This was because food consumption data for each of the types of these foods could not be sufficiently differentiated. A summary of median analytical results for each plasticiser for each survey food is provided in Appendix 5.
6.1.1.2 Treatment of analytical values below the Limit of Reporting (LOR)
Some analytical results for some samples were below the LOR for the analytical method. In order to take account of these results in the dietary exposure assessment, a numerical concentration value must be assigned to these samples. Assumptions were made about the concentration of the plasticisers in food samples where the analytical results were below the LOR. In the case of contaminants that occur naturally in the environment, it is not reasonable to assume that the contaminant is not present in the food when the analytical concentrations are less than the LOR. In the case of the plasticisers assessed, the LOR was reported as

12
equal to the LOD. Actual concentrations below the LOR could in reality be anywhere between zero and the LOR. To allow for this uncertainty, the results for dietary exposure to plasticisers were presented as a range. The lower end of the range is calculated based on the assumption that results below the LOR are equal to zero. The upper end of the range, representing a very conservative ‘worst-case’ estimate, is calculated on the assumption that results below the LOR are equal to the LOR.
6.1.1.3 Food mapping
As it is not possible to analyse all foods in the food supply, foods selected in the analytical survey were ‘mapped’ to a wider number of similar foods reported as consumed in the national nutrition survey. Nutrition Survey foods are then assumed to contain the same concentration of the chemical as the analysed food it was mapped to. In the 2011-12 NNPAS, foods were typically not reported with details of their packaging type, with the exception of some canned food. Therefore, for the purposes of this survey, it was not possible to directly map analysed foods to similar foods that also had the same type of packaging. For this survey, the mapping was based on the food additive classification system used in Standard 1.3.1 in the Code. The food groups for reporting purposes for the DEA were named to include all of the types of foods that were mapped together and may not be specifically the food that was analysed. For further information refer to Appendix 4 for an explanation on the food mapping process, and Appendix 8 for specific details.
6.2 Assumptions and limitations in dietary modelling
The aim of the DEA is to make an estimate of dietary exposure to the food chemicals of interest which is as realistic as possible. DEAs using the 2011-12 NNPAS are based on the best available estimates of actual consumption of foods in Australia. Nevertheless, limitations still exist in DEA methods as well as in the data. Limitations relating to the food consumption and chemical concentration data include:
Diets derived from one or two 24-hour food recall surveys are used as the basis for drawing conclusions on lifetime eating patterns (Appendix 4). This normally leads to conservative dietary exposure assessments (over-estimated dietary exposure),
particularly where exposure arises from the consumption of non-habitually eaten foods.
Participants in 24-hour food recalls may over- or under- report food consumption, particularly for certain types of foods.
The model diet used for 9 month old infants is not as specific as the data derived for other population groups from the 2011-12 NNPAS that use reports of food consumption data of individuals because the model diet includes only mean consumption amounts for the population group as a whole.
The list of analysed foods is only a sample of the foods consumed by the population and may not accurately represent the whole diet.
Only a small number of samples of each food was collected and analysed. These samples were then used to represent the whole range of that food or similar foods, therefore limiting the potential range of variability in concentrations captured.
Assumptions made in the dietary exposure assessment for the survey include:
13
The food chemical concentration (median) in the analysed food was representative of the concentration of that chemical in all of the other foods to which it was mapped.
No contribution to dietary exposures was included for medicines or vitamin and mineral supplements.
Public health and safety risk is characterised by comparing estimates of dietary exposure with relevant HBGVs. Different types of food chemicals have different types of HBGVs. For the seven plasticisers estimated dietary exposures were compared to the TDI as noted in Section 5 for risk characterisation purposes.
6.3 Dietary exposure results
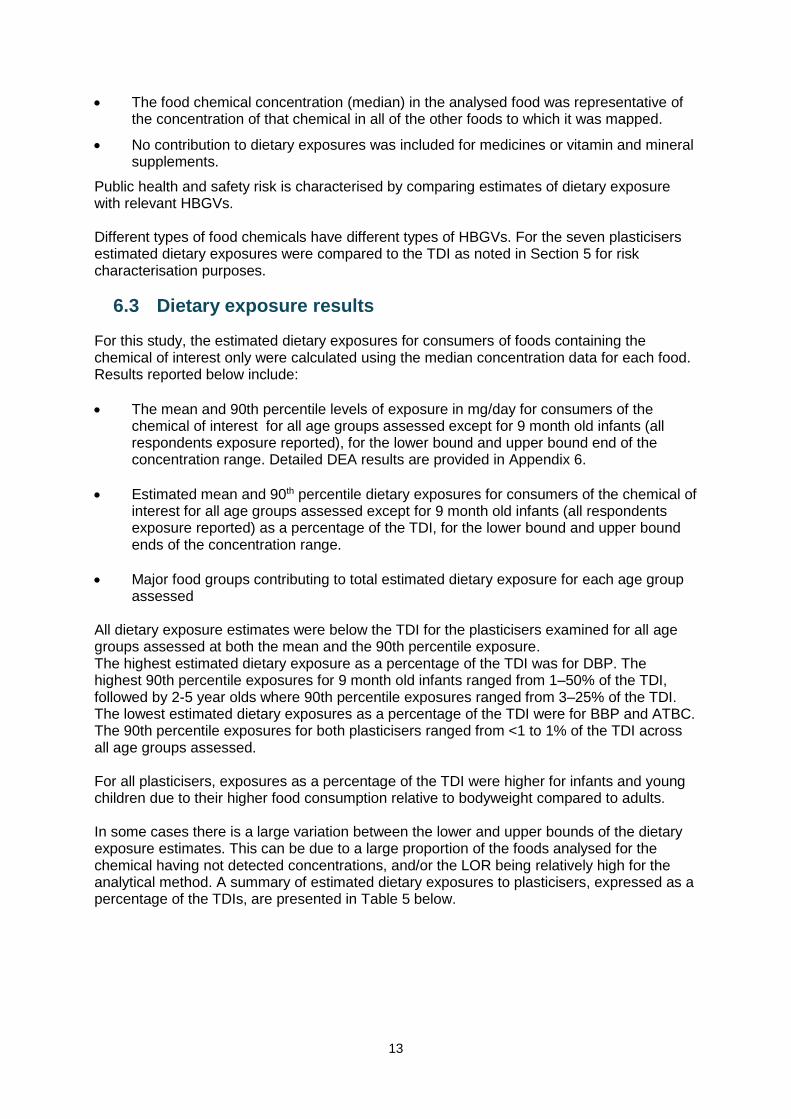
For this study, the estimated dietary exposures for consumers of foods containing the chemical of interest only were calculated using the median concentration data for each food. Results reported below include:
The mean and 90th percentile levels of exposure in mg/day for consumers of the chemical of interest for all age groups assessed except for 9 month old infants (all respondents exposure reported), for the lower bound and upper bound end of the concentration range. Detailed DEA results are provided in Appendix 6.
Estimated mean and 90th percentile dietary exposures for consumers of the chemical of interest for all age groups assessed except for 9 month old infants (all respondents exposure reported) as a percentage of the TDI, for the lower bound and upper bound ends of the concentration range.
Major food groups contributing to total estimated dietary exposure for each age group assessed
All dietary exposure estimates were below the TDI for the plasticisers examined for all age groups assessed at both the mean and the 90th percentile exposure. The highest estimated dietary exposure as a percentage of the TDI was for DBP. The highest 90th percentile exposures for 9 month old infants ranged from 1–50% of the TDI, followed by 2-5 year olds where 90th percentile exposures ranged from 3–25% of the TDI. The lowest estimated dietary exposures as a percentage of the TDI were for BBP and ATBC. The 90th percentile exposures for both plasticisers ranged from <1 to 1% of the TDI across all age groups assessed. For all plasticisers, exposures as a percentage of the TDI were higher for infants and young children due to their higher food consumption relative to bodyweight compared to adults. In some cases there is a large variation between the lower and upper bounds of the dietary exposure estimates. This can be due to a large proportion of the foods analysed for the chemical having not detected concentrations, and/or the LOR being relatively high for the analytical method. A summary of estimated dietary exposures to plasticisers, expressed as a percentage of the TDIs, are presented in Table 5 below.
14
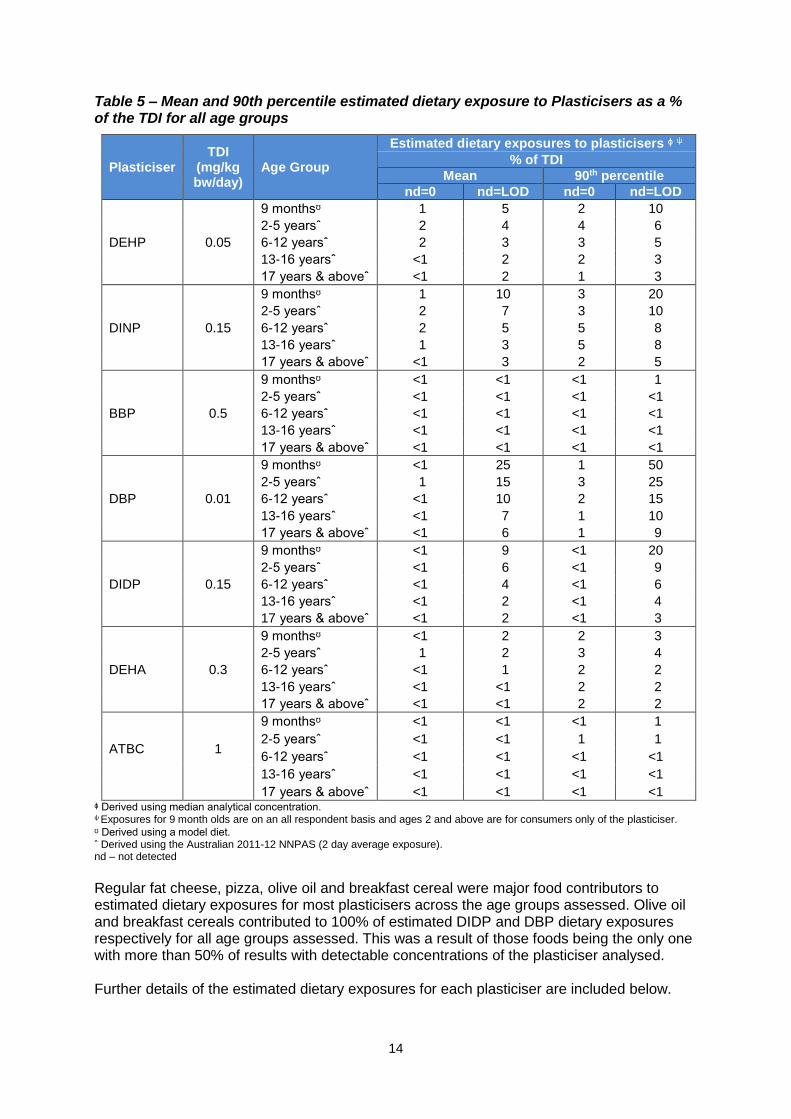
Table 5 – Mean and 90th percentile estimated dietary exposure to Plasticisers as a % of the TDI for all age groups
Plasticiser TDI
(mg/kg bw/day)
Age Group
Estimated dietary exposures to plasticisers ᶲ ѱ
% of TDI
Mean 90th percentile
nd=0 nd=LOD nd=0 nd=LOD
DEHP 0.05
9 monthsᶷ 1 5 2 10
2-5 yearsˆ 2 4 4 6
6-12 yearsˆ 2 3 3 5
13-16 yearsˆ <1 2 2 3
17 years & aboveˆ <1 2 1 3
DINP 0.15
9 monthsᶷ 1 10 3 20
2-5 yearsˆ 2 7 3 10
6-12 yearsˆ 2 5 5 8
13-16 yearsˆ 1 3 5 8
17 years & aboveˆ <1 3 2 5
BBP 0.5
9 monthsᶷ <1 <1 <1 1
2-5 yearsˆ <1 <1 <1 <1
6-12 yearsˆ <1 <1 <1 <1
13-16 yearsˆ <1 <1 <1 <1
17 years & aboveˆ <1 <1 <1 <1
DBP 0.01
9 monthsᶷ <1 25 1 50
2-5 yearsˆ 1 15 3 25
6-12 yearsˆ <1 10 2 15
13-16 yearsˆ <1 7 1 10
17 years & aboveˆ <1 6 1 9
DIDP 0.15
9 monthsᶷ <1 9 <1 20
2-5 yearsˆ <1 6 <1 9
6-12 yearsˆ <1 4 <1 6
13-16 yearsˆ <1 2 <1 4
17 years & aboveˆ <1 2 <1 3
DEHA 0.3
9 monthsᶷ <1 2 2 3
2-5 yearsˆ 1 2 3 4
6-12 yearsˆ <1 1 2 2
13-16 yearsˆ <1 <1 2 2
17 years & aboveˆ <1 <1 2 2
ATBC
1
9 monthsᶷ <1 <1 <1 1
2-5 yearsˆ <1 <1 1 1
6-12 yearsˆ <1 <1 <1 <1
13-16 yearsˆ <1 <1 <1 <1
17 years & aboveˆ <1 <1 <1 <1 ᶲ Derived using median analytical concentration. ѱ Exposures for 9 month olds are on an all respondent basis and ages 2 and above are for consumers only of the plasticiser.
ᶷ Derived using a model diet. ˆ Derived using the Australian 2011-12 NNPAS (2 day average exposure). nd – not detected
Regular fat cheese, pizza, olive oil and breakfast cereal were major food contributors to estimated dietary exposures for most plasticisers across the age groups assessed. Olive oil and breakfast cereals contributed to 100% of estimated DIDP and DBP dietary exposures respectively for all age groups assessed. This was a result of those foods being the only one with more than 50% of results with detectable concentrations of the plasticiser analysed. Further details of the estimated dietary exposures for each plasticiser are included below.
15
The estimated dietary exposures (mg/day and %TDI) for each of the plasticisers and for each age group assessed are presented in Table A6. of Appendix 6. Major food contributors to dietary exposure for each plasticiser and for each age group assessed are presented in Appendix 7.
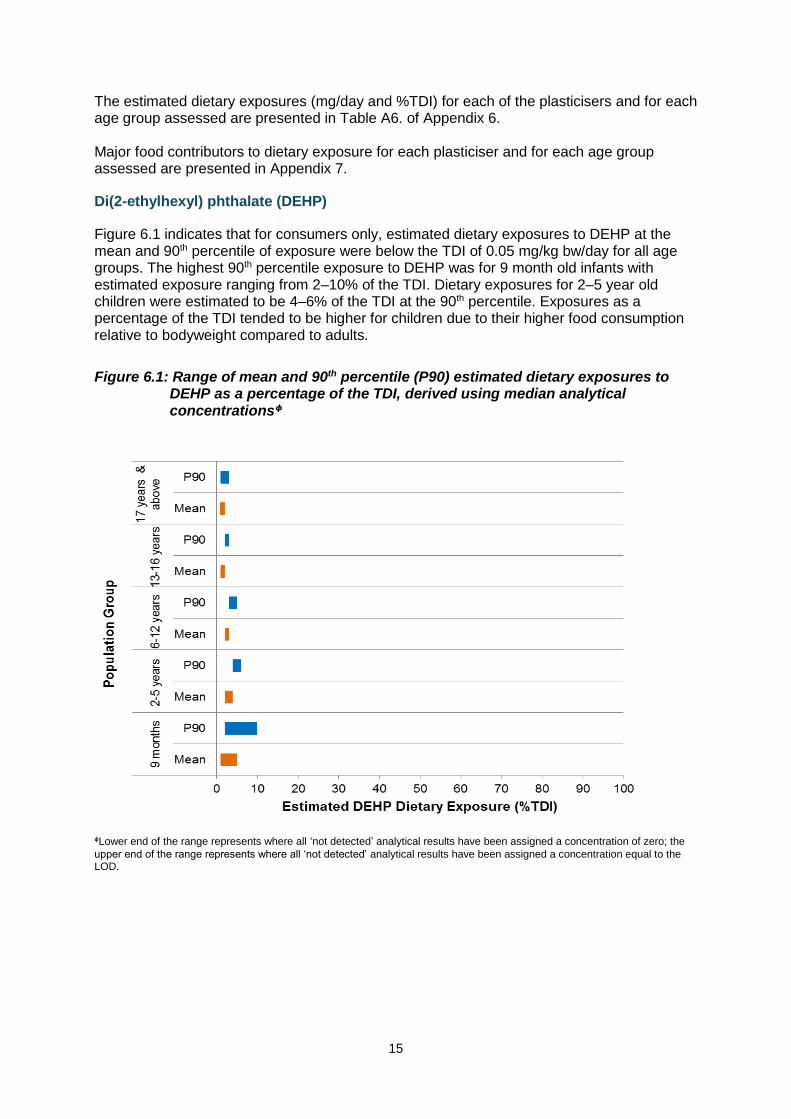
Di(2-ethylhexyl) phthalate (DEHP)
Figure 6.1 indicates that for consumers only, estimated dietary exposures to DEHP at the mean and 90th percentile of exposure were below the TDI of 0.05 mg/kg bw/day for all age groups. The highest 90th percentile exposure to DEHP was for 9 month old infants with estimated exposure ranging from 2–10% of the TDI. Dietary exposures for 2–5 year old children were estimated to be 4–6% of the TDI at the 90th percentile. Exposures as a percentage of the TDI tended to be higher for children due to their higher food consumption relative to bodyweight compared to adults.
Figure 6.1: Range of mean and 90th percentile (P90) estimated dietary exposures to DEHP as a percentage of the TDI, derived using median analytical concentrationsᶲ
ᶲLower end of the range represents where all ‘not detected’ analytical results have been assigned a concentration of zero; the
upper end of the range represents where all ‘not detected’ analytical results have been assigned a concentration equal to the LOD.

16
6.3.1.1 Major food contributors As shown in Figure 6.2, the major food contributor (>5% contribution) to total DEHP dietary exposures for all age groups assessed was rice and cereal grain products (15-20%). Other major contributors to DEHP dietary exposure across the age groups were ripened cheeses, regular fat (6-12%), and pizza and prepared pizza bases (5-10%). Seeds and tree nuts (10%) were a major contributor for respondents aged 17 years and above. More specific details of the major food contributors to DEHP dietary exposures are presented in Table A7.1 of Appendix 7.
Figure 6.2: Major food contributors to DEHP dietary exposures, derived using median
analytical concentrations
Diisononyl phthalate (DINP)
Figure 6.3 indicates that for consumers only, estimated dietary exposures to DINP for all age groups at the 90th percentile of exposure were below the TDI of 0.15 mg/kg bw/day. The highest 90th percentile exposure to DINP was for 9 month old infants, followed by 2-5 year old children due to their high food consumption relative to bodyweight. These estimated 90th percentile exposures were 3-20% and 3–10% of the TDI, respectively.

17
Figure 6.3: Range of mean and 90th percentile (P90) estimated dietary exposures to DINP as a percentage of the TDI, derived using median analytical
concentrationsᶲ
ᶲLower end of the range represents where all ‘not detected’ analytical results have been assigned a concentration of zero; the
upper end of the range represents where all ‘not detected’ analytical results have been assigned a concentration equal to the LOD.
Figure 6.4 below indicates that hamburgers were the highest percentage food contributor to DINP dietary exposures (42-57%). As Brand A hamburgers were analysed separately to other fast food chain hamburgers, an additional brand loyal hamburger scenario was undertaken applying the higher analysed DINP concentrations for these hamburgers only. This resulted in only a small increase in estimated exposures of up to 6% of the TDI for DINP, with all population groups assessed remaining below the TDI. More specific details of the estimated dietary exposures to DINP for the brand loyal scenario are presented in

18
Table A6. of Appendix 6.

19
6.3.1.2 Major food contributors As shown in Figure 6.4, the major contributor (>5%) to total DINP dietary exposures for all age groups assessed was hamburgers (all meat types) (42-57%) with the highest contribution in children ages 13-16 years. Other major contributing foods to DINP dietary exposure were ripened cheeses, regular fat (10-23%), and pizzas and prepared pizza bases (9-14%). Cured or fermented deli meats (excluding canned meats) was a major contributor for all age groups except infants aged 9 months. More specific details of the major food contributors to DINP dietary exposures are presented in Table A7.1 of Appendix 7.
Figure 6.4: Major food contributors to DINP dietary exposures, derived using median analytical concentrations
Butylbenzyl phthalate (BBP)
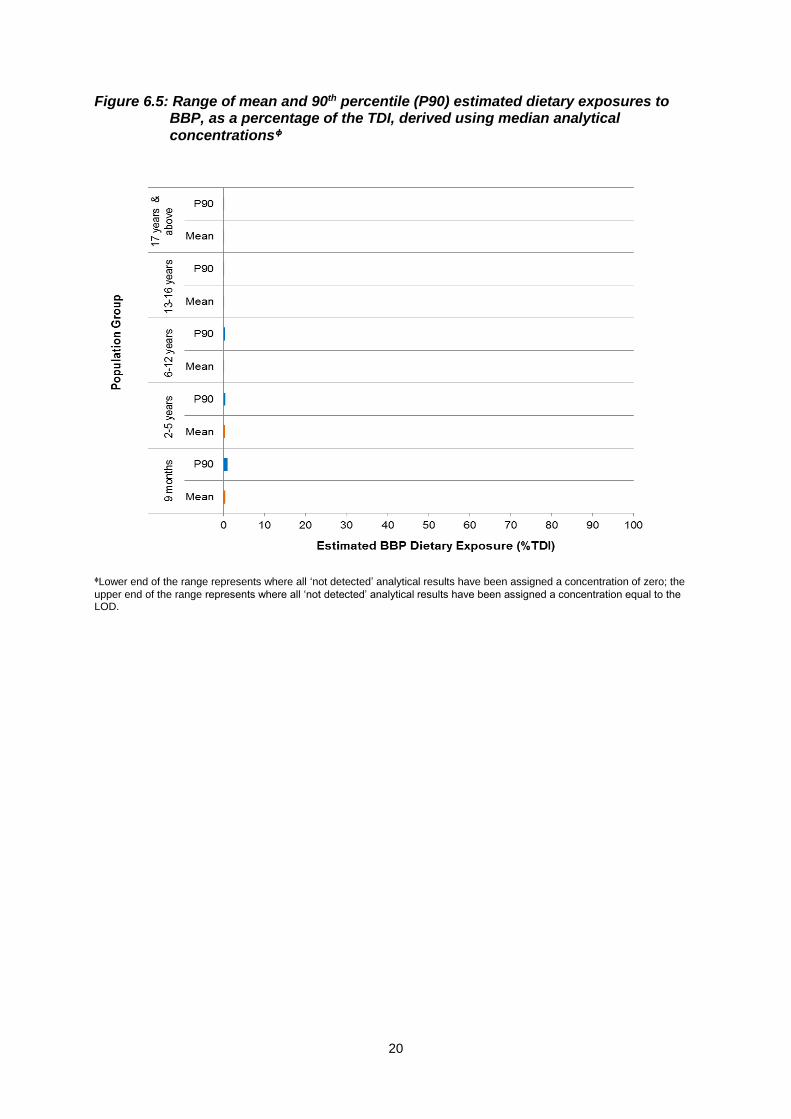
Figure 6.5 indicates that for consumers only, estimated dietary exposures to BBP were well below the TDI of 0.5 mg/kg bw/day for all age groups at both the mean and the 90th percentile exposure (≤ 1% TDI). Across all age groups assessed, the highest percentage of the TDI was 1% at the upper end of the 90th percentile for infants 9 months of age.
20
Figure 6.5: Range of mean and 90th percentile (P90) estimated dietary exposures to BBP, as a percentage of the TDI, derived using median analytical
concentrationsᶲ
ᶲLower end of the range represents where all ‘not detected’ analytical results have been assigned a concentration of zero; the
upper end of the range represents where all ‘not detected’ analytical results have been assigned a concentration equal to the LOD.

21
6.3.1.3 Major food contributors Figure 6.6 indicates that olive oil, and nut and seed butters were the only two foods that are contributors to BBP dietary exposures for all age groups. These were the only foods with more than 50% results with detectable concentrations of BBP. Olive oil contributed to 46-66% of the exposure to BBP in the diets of those aged 2 years and above, with nut & seed butters contributing 34-55% to the dietary exposure to BBP. For infants aged 9 months, nut & seed butters was the major source of BBP exposure (79%), followed by olive oil (21%). More specific details of the major food contributors to BBP dietary exposures are presented in Table A7.3 of Appendix 7.
Figure 6.6: Major food contributors to BBP dietary exposures, derived using median analytical concentrations
Dibutyl phthalate (DBP)
Figure 6.7 indicates that for consumers only, estimated dietary exposures were below the TDI of 0.01 mg/kg bw/day for all age groups at both the mean and 90th percentile exposure levels. The highest 90th percentile exposure to DBP was for infants aged 9 months due to their high food consumption relative to body weight. This exposure ranged from 1–50% of the TDI. Dietary exposures for 2-5 year old children from the lower end to the upper end of the 90th percentile were estimated to be 3–25% of the TDI.

22
Figure 6.7: Range of mean and 90th percentile (P90) estimated dietary exposures to DBP as a percentage of the TDI, derived using median analytical
concentrationsᶲ
ᶲLower end of the range represents where all ‘not detected’ analytical results have been assigned a concentration of zero; the
upper end of the range represents where all ‘not detected’ analytical results have been assigned a concentration equal to the LOD.
6.3.1.4 Major food contributors Breakfast cereals contribute to 100% of total estimated DBP dietary exposure for all age groups. This was a result of breakfast cereals being the only food with more than 50% results with detectable concentrations of DBP.
Diisodecyl phthalate (DIDP)
Figure 6.8 below indicates that for consumers only, estimated dietary exposures to DIDP at the mean and 90th percentile of exposure were below the TDI of 0.15 mg/kg bw/day for all age groups. The highest 90th percentile exposures to DIDP were for 9 month old infants. This exposure ranged from <1-20% of the TDI. Dietary exposures at the 90th percentile for 2–5 year old children was estimated to be <1–9% of the TDI.

23
Figure 6.8: Range of mean and 90th percentile (P90) estimated dietary exposures to DIDP as a percentage of the TDI, derived using median analytical concentrations
ᶲLower end of the range represents where all ‘not detected’ analytical results have been assigned a concentration of zero; the
upper end of the range represents where all ‘not detected’ analytical results have been assigned a concentration equal to the LOD.
6.3.1.5 Major food contributors Olive oil contributed to 100% of estimated DIDP dietary exposure for all age groups assessed. This was a result of the DEA methodology for deriving major contributing foods being based on lower bound median concentrations. Olive oil was the only food with more than 50% results with detectable concentrations of DIDP. See Appendix 4 for further discussion on calculation of major contributors to total estimated exposure.
Di(2-ethylhexyl) adipate (DEHA)
Figure 6.9 below indicates that for consumers only, estimated dietary exposures were below the TDI of 0.3 mg/kg bw/day for all age groups at both the mean and 90th percentile exposure levels with exposures ranging between <1–2% and 2–4% of the TDI respectively.

24
Figure 6.9: Range of mean and 90th percentile (P90) estimated dietary exposures to DEHA as a percentage of the TDI, derived using median analytical
concentrationsᶲ
ᶲLower end of the range represents where all ‘not detected’ analytical results have been assigned a concentration of zero; the
upper end of the range represents where all ‘not detected’ analytical results have been assigned a concentration equal to the LOD.

25
6.3.1.6 Major food contributors As shown in Figure 6.10 below, beef, veal, lamb, game and offal meats (48-73%) and ripened cheeses, regular fat (13-36%) were the main contributors to total DEHA dietary exposures across the age groups assessed. Meat & poultry based prepared dishes, takeaway (5%) were a major contributor for children aged 6-12 years. More specific details of the major food contributors to DEHA dietary exposures are presented in Table A7.6 of Appendix 7.
Figure 6.10: Major food contributors to DEHA dietary exposures, derived using median analytical concentrations
Acetyl tributyl citrate (ATBC)
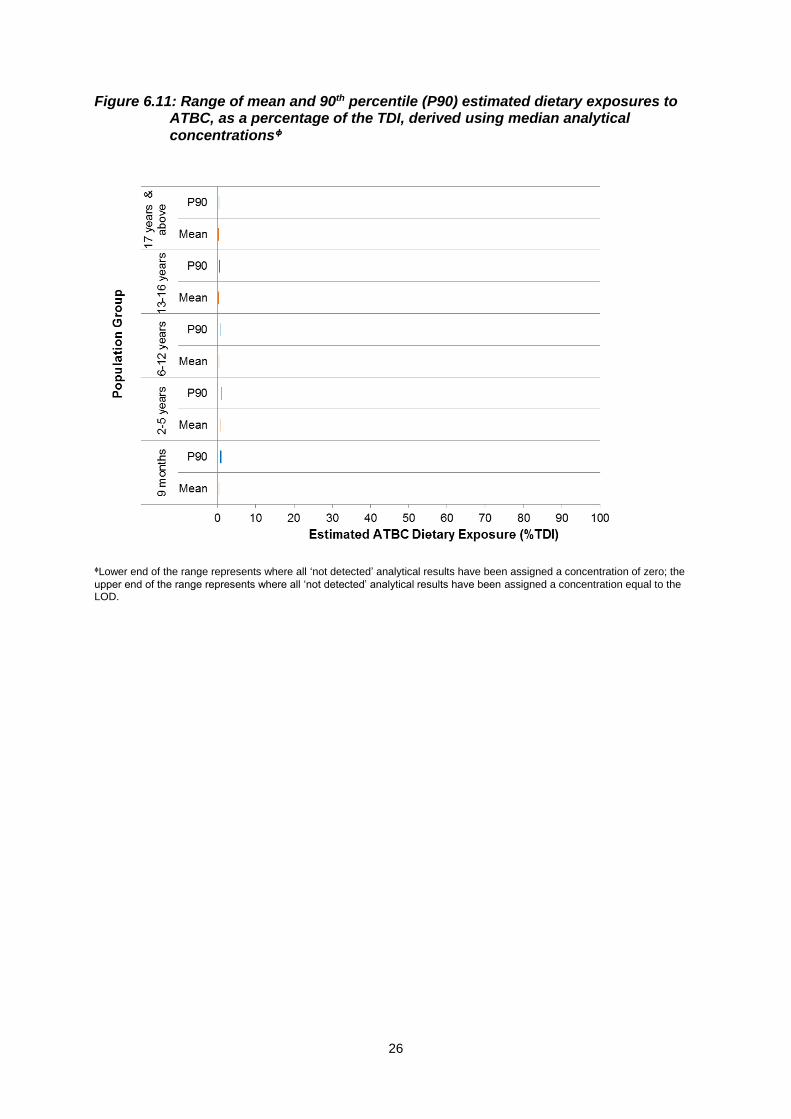
Figure 6.11 indicates that for consumers only, estimated dietary exposures to ATBC for all age groups were below the TDI of 1.0 mg/kg bw/day at both the mean and 90th percentile exposure levels (≤ 1% TDI). Across all age groups assessed, the highest percentage of the TDI was 1% at the upper end of the 90th percentile for infants 9 months of age.
26
Figure 6.11: Range of mean and 90th percentile (P90) estimated dietary exposures to ATBC, as a percentage of the TDI, derived using median analytical
concentrationsᶲ
ᶲLower end of the range represents where all ‘not detected’ analytical results have been assigned a concentration of zero; the
upper end of the range represents where all ‘not detected’ analytical results have been assigned a concentration equal to the LOD.

27
6.3.1.7 Major food contributors As shown in Figure 6.12 the food with the major contribution to ATBC dietary exposures for all age groups assessed was ripened cheeses, regular fat (57-70%) followed by commercial breads (9-13%). Ripened cheeses, reduced fat was a major contributor for infants aged 9 months (7%), children aged 6-12 years (7%) and consumers aged 17 years and above (5%). Commercially sterile olives and vegetables (non-canned) were a major contributor for those aged 17 years and above (6%). More specific details of the major food contributors to ATBC dietary exposures are presented in Table A7.7 of Appendix 7.
Figure 6.12: Major food contributors to ATBC dietary exposures, derived using median analytical concentrations
Risk characterisation
In Phase 2 of the 24th ATDS, the budget method used for estimating the theoretical maximum dietary exposure is conservative by design hence its use as a screening tool. It presumed the maximum occurrence of the chemical of interest was present in half of the food and beverage supply. For both DEHP and DINP the theoretical maximum dietary exposure that was estimated exceeded the relevant TDI. This indicated that a dietary exposure estimate was required for each chemical.
For this survey, where a wider range of foods were sampled and actual food consumption data reported through the national nutrition survey used, the estimated dietary exposures for all plasticisers were below the relevant TDI for all age groups assessed, for both mean and 90th percentile exposures. Based on these data, current dietary exposures of Australian consumers to the seven plasticisers included in this study are not considered to be of health concern.
Conclusions
This Survey of Plasticisers in Australian Foods investigated the levels of seven plasticisers which may be used in food packaging materials, including DEHP, DINP, BBP, DBP, DIDP, DEHA and ATBC in a broad range of Australian foods.
28
The survey results indicate that the levels of these seven plasticisers in Australian foods are generally low.
Estimated dietary exposure for Australian consumers was below internationally recognised HBGVs, and no appreciable health risks have been identified for the Australian population.
The conclusions from this survey formed part of the scientific evidence base to inform the FSANZ packaging proposal: P1034 – Chemical Migration from Packaging into Food.
The outcomes of the risk assessment were used to inform part of the evidence base for the FSANZ packaging proposal (P1034), which considered several options in managing the risks associated with potential migration of substances found in food contact materials. FSANZ has now decided to abandon the proposal. The reasons for this decision are outlined in the abandonment report available on the FSANZ website. In short, development of a food regulatory measure was not recommended for the following reasons:
The risk assessment concluded that exposures to most chemicals used to produce food packaging are low and unlikely to pose a public health and safety concern.
Stakeholder consultation confirmed that industry has sufficient control measures in place to control CMPF (which, as mentioned above, presents a low exposure risk).
Residual risk10 can be addressed adequately by measures other than a food regulatory measure.
Stakeholder consultation indicated that some food businesses (mainly small and medium-sized enterprises) have poor awareness of CMPF and knowledge of suitable control measures. These gaps in industry awareness can be adequately addressed through development of a food packaging information guide (i.e. as opposed to development of a variation to the Code or a Code of Practice). It is recommended that FSANZ develop the required guide in consultation with industry and jurisdictions.
To improve awareness and knowledge about CMPF, FSANZ plans to develop a food packaging information guide to provide a consolidated and comprehensive source of information for industry, address the gaps in awareness and knowledge for small and medium-sized enterprises (SMEs), provide general information on safety issues with CMPF for consumers, and describe the obligations on food businesses (particularly SMEs) to use safe packaging materials.
10 The residual risk is the remaining risk to public health posed by packaging chemicals taking into account the severity of the adverse effect, likelihood of exposure and the efficacy (including implementation) of mitigation measures.
29
References
ABS (2014) National Nutrition and Physical Activity Survey, 2011-12, Basic CURF, CD-ROM. Findings based on ABS CURF data. Australian Bureau of Statistics, Canberra
ACT Community Care (2000) From Milk to More...Introducing foods to your baby, Publishing Services, Canberra
AS 2070-1999 (1999) Australian Standard (AS 2070-1999) – Plastics materials for food contact use. Standards Australia (Standards Association of Australia). 1 The Crescent, Homebush, NSW 2140.
Bradley EL, Burden RA, Bentayeb K, Driffield M, Harmer N, Mortimer DN, Speck DR, Ticha J and Castle L 2013a. Exposure to phthalic acid, phthalate diesters and phthalate monoesters from foodstuffs: UK total diet study results. Food Additives and Contaminants Part A 30(4):735-742.
Cao X (2010) Phthalate esters in foods: sources, occurrence, and analytical methods. Comprehensive Reviews in Food Science and Food Safety 9:21-43. Cao X-L, Zhao W, Churchill R, Hilts C (2014) Occurrence of di-(2-ethylhexyl) adipate and phthalate plasticizers in samples of meat, fish, and cheese and their packaging films. Journal of Food Protection 77(4):610-620. Cao X, Zhao W & Dabeka R (2015) Di-(2-ethylhexyl) adipate and 20 phthalates in composite food samples from the 2013 Canadian Total Diet Study. Food Additives & Contaminants. 32 (11): 1893-1901. ChemSpider (2017) ChemSpider: Search and share chemistry. http://www.chemspider.com/. Accessed 15 August 2017. CPSC (2010) Review of exposure and toxicity data for phthalate substitutes. Consumer Product Safety Commission. Contract No. CPSC-D-06-0006. EC (2016) Rapid Alert System for Food and Feed 2015 annual report. European Commission – Health and Food Safety. EC (2017) Rapid Alert System for Food and Feed Portal. European Commission. https://webgate.ec.europa.eu/rasff-window/portal/?event=SearchForm&cleanSearch=1. Accessed 25 August 2017. ECHA (2017) Advanced search for chemicals. https://echa.europa.eu/advanced-search-for-chemicals. European Chemicals Agency. Accessed 16 August 2017. EFSA (2005a) Opinion of the Scientific Panel on Food Additives, Flavourings, Processing Aids and Material in Contact with Food (AFC) on a request from the Commission related to Bis(2-ethylhexyl)phthalate (DEHP) for use in food contact materials. The EFSA Journal 243:1-20. EFSA (2005b) Opinion of the Scientific Panel on Food Additives, Flavourings, Processing Aids and Materials in Contact with Food (AFC) on a request from the Commission related to Di-isononylphthalate (DINP) for use in food contact materials. The EFSA Journal 244:1-18.
30
EFSA (2005c) Opinion of the Scientific Panel on Food Additives, Flavourings, Processing Aids and Materials in Contact with Food (AFC) on a request from the Commission related to Di-isodecylphthalate (DIDP) for use in food contact materials. The EFSA Journal 245:1-14. EFSA (2005d) Opinion of the Scientific Panel on Food Additives, Flavourings, Processing Aids and Material in Contact with Food (AFC) on a request from the Commission related to Di-Butylphthalate (DBP) for use in food contact materials. The EFSA Journal 242:1-17. EFSA (2005e) Opinion of the Scientific Panel on Food Additives, Flavourings, Processing Aids and Materials in Contact with Food (AFC) on a request from the Commission related to Butylbenzylphthalate (BBP) for use in food contact materials. The EFSA Journal 241:1-14. EFSA (2005f) Opinion of the Scientific Panel on Food Additives, Flavourings, Processing Aids and Materials in Contact with Food (AFC) on a request related to a 10th list of substances for food contact materials. The EFSA Journal 273:1-26. EU (2004) Regulation (EC) No 1935/2004 of the European Parliament and of the Council of 27 October 2004 on materials and articles intended to come into contact with food. Official Journal of the European Union. 13.11.2004 EU (2011) Commission Regulation (EU) No 10/2011 on plastic materials and articles intended to come into contact with food. FAO (2004) Human Energy Requirements: Report of a Joint FAO/WHO/UNU Expert Consultation, Rome, 17‒24 October 2001. FAO, Rome. ftp://ftp.fao.org/docrep/fao/007/y5686e/y5686e00.pdf.
FAO/WHO (2009) Principles and methods for the risk assessment of chemicals in food. Environmental Health Criteria 240. Food and Agriculture Organization of the United Nations, and World Health Organization. http://www.who.int/foodsafety/publications/chemical-food/en/ Accessed 10 May 2017.
FSANZ (2009) Principles and Practices of Dietary Exposure Assessment for Food Regulatory Purposes. Food Standards Australia New Zealand, Canberra. http://www.foodstandards.gov.au/science/exposure/documents/Principles%20_%20practices%20exposure%20assessment%202009.pdf
FSANZ (2010a) FSANZ activities in relation to bisphenol A. Food Standards Australia New Zealand, Canberra, Australia.
FSANZ (2010b) Survey of chemical migration from food contact packaging materials in Australian food. Food Standards Australia New Zealand, Canberra, Australia.
FSANZ (2016a) Call for submissions – Proposal P1034: Chemical migration from packaging into food. Food Standards Australia New Zealand, Canberra, Australia.
FSANZ (2016b) Call for submissions – Proposal P1034: Chemical migration from packaging into food. Supporting document 4 – Summary of control measures. Food Standards Australia New Zealand, Canberra, Australia.
31
FSANZ (2016c) 24th Australian Total Diet Study Phase 2. Food Standards Australia New Zealand, Canberra, Australia.
FSANZ (2017) Food Standards Code. http://www.foodstandards.gov.au/code/Pages/default.aspx. Accessed 17 August 2017.
Guo Y, Zhang Z, Liu L, Li Y, Ren N, Kannan K 2012. Occurrence and profiles of phthalates in foodstuffs from China and their implications for human exposure. Journal of Agricultural and Food Chemistry 60:6913–6919.
Heinz HJ (2010a) Developmental Milestones and Behaviour: 7 to 9 months. http://www.forbaby.com.au/modules/readingroom/article.php?id=50.
Heinz HJ (2010b) What parents need to know about cow's milk. http://www.forbaby.com.au/modules/feeding_baby/article.php?id=29.
Hitchcock NE, Gracey M, Gilmour AI, Owler EN (1986) Nutrition and growth in infancy and early childhood: a longitudinal study from birth to five years. Monographs in Paediatrics 19:1–92
Lacoste F (2014) Undesirable substances in vegetable oils: anything to declare? OCL (Oilseeds and fats Crops and Lipids) 2014 21(1):1–9. McCombie G, Harling A, Bierdermann M, Beidermann-Brem S, Eicher A, Suter G, Morandini M, Pechstein S, Schmäschke G, Lauber U, Grob K (2015) Survey of plasticizers migrating from the gaskets of lids into oily food in glass jars: The second European enforcment campaign shows poor compliance work. Food Control 50:65–71. NHMRC (2003) Infant Feeding Guidelines for Health Workers. NHMRC, Canberra. Petersen JH and Breindahl T. (2000) Plasticisers in total diet samples, baby food and infant formulae. Food Additives and Contaminants 17: 133-141. SCF (2000) Reports of the Scientific Committee for Food (Thirty-sixth series). Schecter A, Lorber M, Guo Y, Hun Yun S, Kannan K, Hommel M, Imran N, Hynan L, Cheng D, Colcino J and Birmbaum L. (2013) Phthalate concentrations and dietary exposure from food purchased in New York State. Environ. Health Perspect. 12(4): 473-479. The Children's Hospital at Westmead (2008) Constipation. http://www.chw.edu.au/parents/factsheets/constipj.htm. Accessed 31 August 2017. UK Committee on Toxicity of Chemicals in Food, Consumer Products and the Environment (2011) COT statement on dietary exposure to phthalates – data from the total diet study (TDS). USFDA (United States Food and Drug Administration) 2014. Code of Federal Regulations, Title 21, Volume 3, Chapter I, Subchapter B – Food for human consumption WHO (1985) Guidelines for the study of dietary intakes of chemical contaminants. 87. World Health Organisation, Geneva

32
WHO (2006) WHO Child Growth Standards. World Health Organisation, Geneva
WHO (2011) Guidelines for drinking-water quality, fourth edition. World Health Organization, Geneva.

33
Appendix 1: Foods sampled
Table A1.1 Food preparation instructions
Plasticiser survey foods
Bacon, middle cut, rind on Infant formula, non soy-based
Baked beans in tomato sauce Infant formula, soy-based
Beef mince and meat patties Jam
Beef, steak, untrimmed Milk, fresh, full fat
Beef/Chicken Takeaway Milk, fresh, reduced fat
Biscuits, sweet and savoury Milk, UHT, full fat
Bread, fancy, sweet and savoury Noodles, instant, in a cups and bowls
Bread, flat Noodles, instant, in plastic wrapping
Bread, white Nuts, cashews
Breakfast bars Oil, canola or sunflower oil
Breakfast cereal, single and mixed grain Oil, olive oil
Cakes and muffins, iced Olives
Cakes and muffins, uniced Pasta
Cheese, cream cheese, reduced fat Peanut butter
Cheese, cream cheese, regular fat Peas, frozen
Cheese, processed, Cheddar (Tasty), reduced fat
Pizza, frozen from supermarket
Cheese, processed, Cheddar (Tasty), regular fat
Potato crisps, flavoured and unflavoured
Chicken products, battered or crumbed Ready to eat meal, frozen from supermarket
Chicken products, battered or crumbed, from takeaway
Rice, single grain, uncooked
Chicken, breast Sausages, beef
Chocolate, plain milk chocolate Shelf-stable peaches
Coffee, instant Soft drink
Confectionary, Soft candy Soup
Corn chips Spreads, full fat, including butter and vegetable spreads
Cream, sour, full fat Spreads, reduced fat, including butter and vegetable spreads
Cream, thickened, reduced fat Sugar, white
Dip Sundried tomatoes
Fish fillets, white fish, fresh Tomato sauce
Fish portions, frozen (crumbed only) from supermarket
Tomatoes, canned
Hamburger, Beef Tuna, canned
Ice cream, full fat Yoghurt, full fat, flavoured and unflavoured
Infant dessert Yoghurt, low/reduced fat, flavoured and unflavoured
Infant dinner

34
Appendix 2 : Food preparation instructions
These instructions were included in a procedures manual provided to the laboratory to specify sample preparation.
General instructions
Avoiding cross contamination
Care must be taken to ensure no mixing of any kind between food types (eg. bacon and chicken) when preparing composite samples. This means careful cleaning and drying of utensils between preparing composites of different food types.
Gloves
Gloves are to be worn whenever the food being prepared could come into contact with hands. Phthalate-free food preparation gloves must be used such as Rubberex phthalate-free vinyl gloves.
Equipment
Stainless steel knives
Wooden cutting board (good quality, smooth, crack free)
Glass/Pyrex equipment can also be used.
For the purposes of mixing liquids, a large stainless steel or Pyrex receptacle such as a jug or bowl is to be used.
Laboratory mixer with stainless steel or glass vessel.
Phthalate free storage containers
Plastic bags for enclosing sample containers11
Washing of equipment
The coordinating laboratory is to determine the detergent and solvent to be used in the washing of food preparation equipment. The detergent chosen should not interfere with the analyses for the analytes of interest.
Handling purchases for food preparation
Each purchase as provided by the Purchasing Officer should arrive in separate packaging. Purchases from each jurisdiction will be in lots of three. Each purchase will represent a primary sample. Unprocessed, raw foods such as chicken breast and fish fillets will be in separate packages clearly labelled with the name of the food and primary sample identification (A, B or C) which will correspond with the detailed information on the sample spreadsheet completed by the Purchasing Officer. The sample spreadsheet should be checked by the laboratory for completeness and to ensure that recorded information corresponds to sample labels.
Preparing and storing samples
1. Primary samples (purchases) are to be prepared either in ‘shop bought’ or ‘table ready’ state or according to the quarantine requirements for importation to the analytical laboratory in Germany. It is imperative that the Food Preparation and
11 Plastic bags and sample containers should not interfere with analysis for plasticisers.
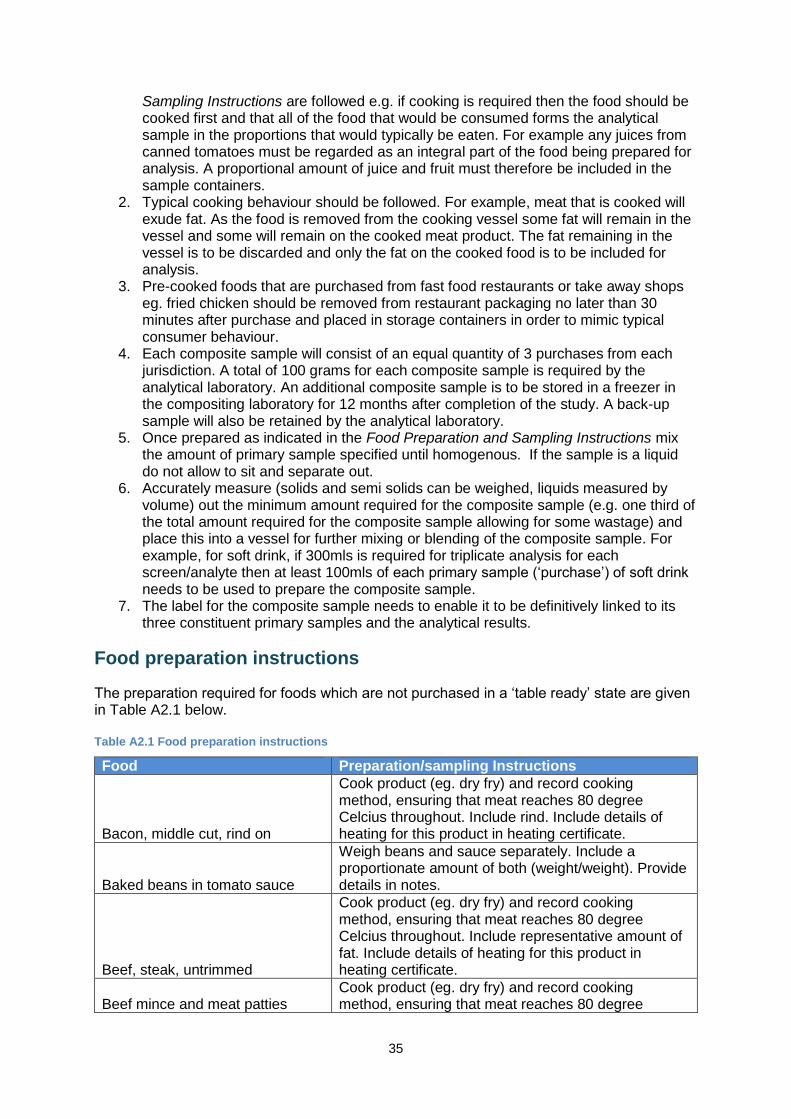
35
Sampling Instructions are followed e.g. if cooking is required then the food should be cooked first and that all of the food that would be consumed forms the analytical sample in the proportions that would typically be eaten. For example any juices from canned tomatoes must be regarded as an integral part of the food being prepared for analysis. A proportional amount of juice and fruit must therefore be included in the sample containers.
2. Typical cooking behaviour should be followed. For example, meat that is cooked will exude fat. As the food is removed from the cooking vessel some fat will remain in the vessel and some will remain on the cooked meat product. The fat remaining in the vessel is to be discarded and only the fat on the cooked food is to be included for analysis.
3. Pre-cooked foods that are purchased from fast food restaurants or take away shops eg. fried chicken should be removed from restaurant packaging no later than 30 minutes after purchase and placed in storage containers in order to mimic typical consumer behaviour.
4. Each composite sample will consist of an equal quantity of 3 purchases from each jurisdiction. A total of 100 grams for each composite sample is required by the analytical laboratory. An additional composite sample is to be stored in a freezer in the compositing laboratory for 12 months after completion of the study. A back-up sample will also be retained by the analytical laboratory.
5. Once prepared as indicated in the Food Preparation and Sampling Instructions mix the amount of primary sample specified until homogenous. If the sample is a liquid do not allow to sit and separate out.
6. Accurately measure (solids and semi solids can be weighed, liquids measured by volume) out the minimum amount required for the composite sample (e.g. one third of the total amount required for the composite sample allowing for some wastage) and place this into a vessel for further mixing or blending of the composite sample. For example, for soft drink, if 300mls is required for triplicate analysis for each screen/analyte then at least 100mls of each primary sample (‘purchase’) of soft drink needs to be used to prepare the composite sample.
7. The label for the composite sample needs to enable it to be definitively linked to its three constituent primary samples and the analytical results.
Food preparation instructions
The preparation required for foods which are not purchased in a ‘table ready’ state are given in Table A2.1 below. Table A2.1 Food preparation instructions
Food Preparation/sampling Instructions
Bacon, middle cut, rind on
Cook product (eg. dry fry) and record cooking method, ensuring that meat reaches 80 degree Celcius throughout. Include rind. Include details of heating for this product in heating certificate.
Baked beans in tomato sauce
Weigh beans and sauce separately. Include a proportionate amount of both (weight/weight). Provide details in notes.
Beef, steak, untrimmed
Cook product (eg. dry fry) and record cooking method, ensuring that meat reaches 80 degree Celcius throughout. Include representative amount of fat. Include details of heating for this product in heating certificate.
Beef mince and meat patties Cook product (eg. dry fry) and record cooking method, ensuring that meat reaches 80 degree

36
Food Preparation/sampling Instructions
Celcius throughout. Include details of heating for this product in heating certificate.
Biscuits, sweet and savoury No specific instructions
Bread, fancy, sweet and savoury Include crust
Bread, flat No specific instructions
Bread, white Include crust
Breakfast bars No specific instructions
Breakfast cereal, single and mixed grain No specific instructions
Cakes and muffins, iced Include a proportionate amount of icing. Sample through centre of product
Cakes and muffins, un- iced Sample through centre of product
Cheese, processed, Cheddar (Tasty), reduced fat
Sample through centre of product. Heat to 80 degrees Celcius throughout. Include details of heating for this product in heating certificate.
Cheese, processed, Cheddar (Tasty), regular fat
Sample through centre of product. Heat to 80 degrees Celcius throughout. Include details of heating for this product in heating certificate.
Cheese, cream cheese, reduced fat
Heat to 80 degrees Celcius throughout. Include details of heating for this product in heating certificate.
Cheese, cream cheese, regular fat
Heat to 80 degrees Celcius throughout. Include details of heating for this product in heating certificate.
Chocolate, plain milk chocolate
Sample through centre of product. Heat to 80 degrees Celcius throughout. Include details of heating for this product in heating certificate.
Chicken, breast
Cook product (eg. dry fry) and record cooking method, ensuring that meat reaches 80 degree Celcius throughout. Sample through centre of product. Include details of heating for this product in heating certificate.
Chicken products, battered or crumbed
Bake according to the instructions on the packaging or as advised by shop assistant at poultry store (Purchasing Officer to record). Ensure that product reaches 80 degree Celcius throughout. Sample through centre of product. Include skin and coating if applicable. Include details of heating for this product in heating certificate.
Chicken products, battered or crumbed from takeaway
Sample through centre of product. Include skin and coating if applicable. Oven bake ensuring product reaches 80 degrees Celcius throughout. Include details of heating for this product in heating certificate.
Coffee, instant Add 5g coffee granules to 250ml tap water. Do not add milk
Confectionery, soft candy Sample through centre of product
Corn chips No specific instructions
Cream, thickened, reduced fat Heat to 80 degrees Celcius throughout. Include details of heating for this product in heating certificate.
Cream, sour, full fat Heat to 80 degrees Celcius throughout. Include details of heating for this product in heating certificate.
Dip
Heat any dairy or meat/fish containing dips to 80 degrees Celcius throughout. Include details of heating for this product in heating certificate if appropriate.
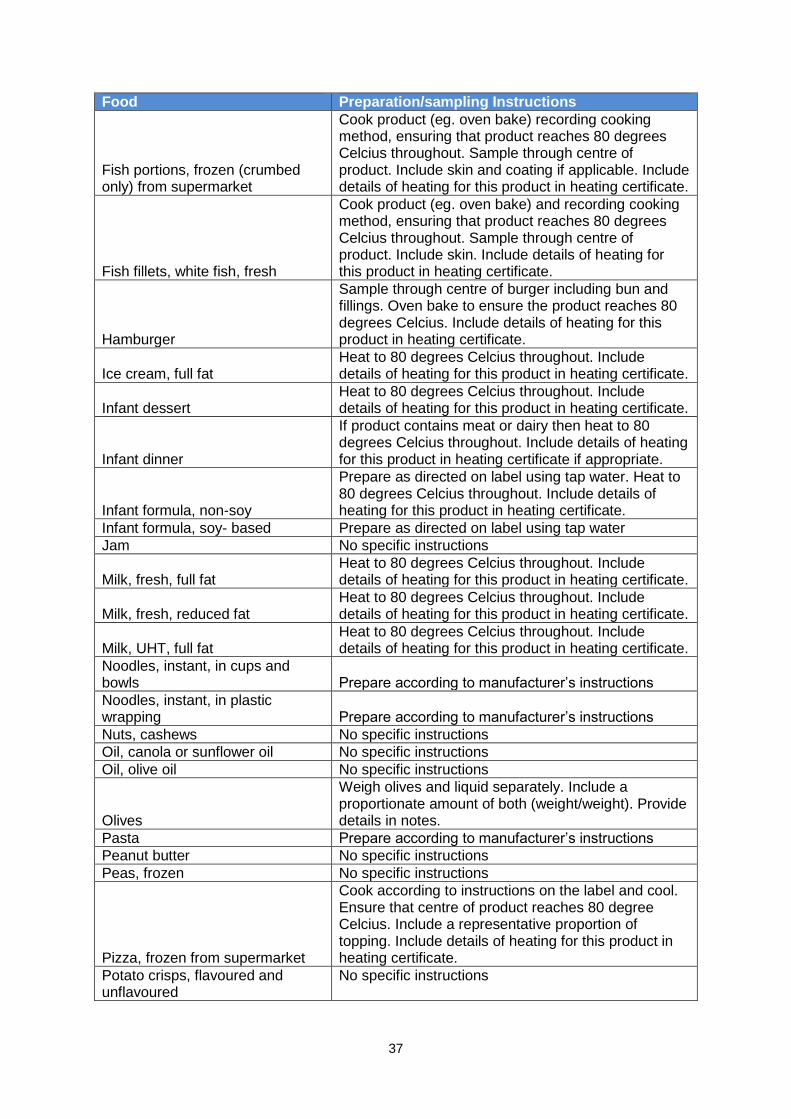
37
Food Preparation/sampling Instructions
Fish portions, frozen (crumbed only) from supermarket
Cook product (eg. oven bake) recording cooking method, ensuring that product reaches 80 degrees Celcius throughout. Sample through centre of product. Include skin and coating if applicable. Include details of heating for this product in heating certificate.
Fish fillets, white fish, fresh
Cook product (eg. oven bake) and recording cooking method, ensuring that product reaches 80 degrees Celcius throughout. Sample through centre of product. Include skin. Include details of heating for this product in heating certificate.
Hamburger
Sample through centre of burger including bun and fillings. Oven bake to ensure the product reaches 80 degrees Celcius. Include details of heating for this product in heating certificate.
Ice cream, full fat Heat to 80 degrees Celcius throughout. Include details of heating for this product in heating certificate.
Infant dessert Heat to 80 degrees Celcius throughout. Include details of heating for this product in heating certificate.
Infant dinner
If product contains meat or dairy then heat to 80 degrees Celcius throughout. Include details of heating for this product in heating certificate if appropriate.
Infant formula, non-soy
Prepare as directed on label using tap water. Heat to 80 degrees Celcius throughout. Include details of heating for this product in heating certificate.
Infant formula, soy- based Prepare as directed on label using tap water
Jam No specific instructions
Milk, fresh, full fat Heat to 80 degrees Celcius throughout. Include details of heating for this product in heating certificate.
Milk, fresh, reduced fat Heat to 80 degrees Celcius throughout. Include details of heating for this product in heating certificate.
Milk, UHT, full fat Heat to 80 degrees Celcius throughout. Include details of heating for this product in heating certificate.
Noodles, instant, in cups and bowls Prepare according to manufacturer’s instructions
Noodles, instant, in plastic wrapping Prepare according to manufacturer’s instructions
Nuts, cashews No specific instructions
Oil, canola or sunflower oil No specific instructions
Oil, olive oil No specific instructions
Olives
Weigh olives and liquid separately. Include a proportionate amount of both (weight/weight). Provide details in notes.
Pasta Prepare according to manufacturer’s instructions
Peanut butter No specific instructions
Peas, frozen No specific instructions
Pizza, frozen from supermarket
Cook according to instructions on the label and cool. Ensure that centre of product reaches 80 degree Celcius. Include a representative proportion of topping. Include details of heating for this product in heating certificate.
Potato crisps, flavoured and unflavoured
No specific instructions
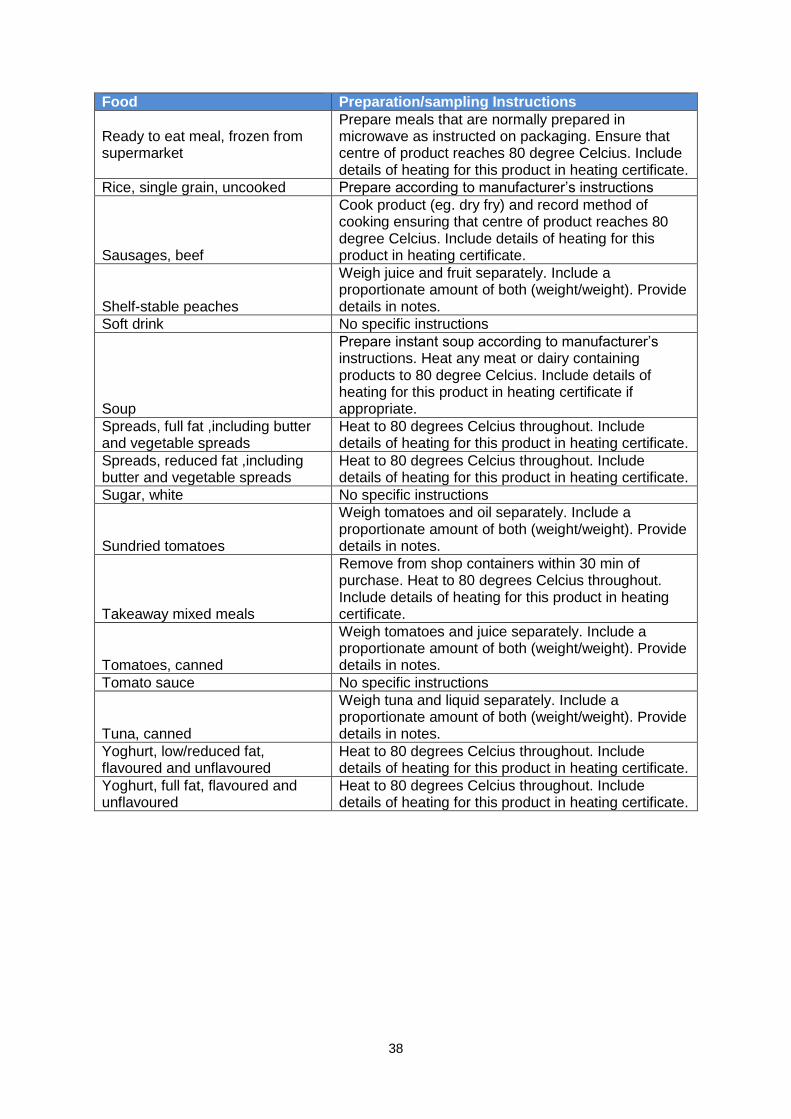
38
Food Preparation/sampling Instructions
Ready to eat meal, frozen from supermarket
Prepare meals that are normally prepared in microwave as instructed on packaging. Ensure that centre of product reaches 80 degree Celcius. Include details of heating for this product in heating certificate.
Rice, single grain, uncooked Prepare according to manufacturer’s instructions
Sausages, beef
Cook product (eg. dry fry) and record method of cooking ensuring that centre of product reaches 80 degree Celcius. Include details of heating for this product in heating certificate.
Shelf-stable peaches
Weigh juice and fruit separately. Include a proportionate amount of both (weight/weight). Provide details in notes.
Soft drink No specific instructions
Soup
Prepare instant soup according to manufacturer’s instructions. Heat any meat or dairy containing products to 80 degree Celcius. Include details of heating for this product in heating certificate if appropriate.
Spreads, full fat ,including butter and vegetable spreads
Heat to 80 degrees Celcius throughout. Include details of heating for this product in heating certificate.
Spreads, reduced fat ,including butter and vegetable spreads
Heat to 80 degrees Celcius throughout. Include details of heating for this product in heating certificate.
Sugar, white No specific instructions
Sundried tomatoes
Weigh tomatoes and oil separately. Include a proportionate amount of both (weight/weight). Provide details in notes.
Takeaway mixed meals
Remove from shop containers within 30 min of purchase. Heat to 80 degrees Celcius throughout. Include details of heating for this product in heating certificate.
Tomatoes, canned
Weigh tomatoes and juice separately. Include a proportionate amount of both (weight/weight). Provide details in notes.
Tomato sauce No specific instructions
Tuna, canned
Weigh tuna and liquid separately. Include a proportionate amount of both (weight/weight). Provide details in notes.
Yoghurt, low/reduced fat, flavoured and unflavoured
Heat to 80 degrees Celcius throughout. Include details of heating for this product in heating certificate.
Yoghurt, full fat, flavoured and unflavoured
Heat to 80 degrees Celcius throughout. Include details of heating for this product in heating certificate.
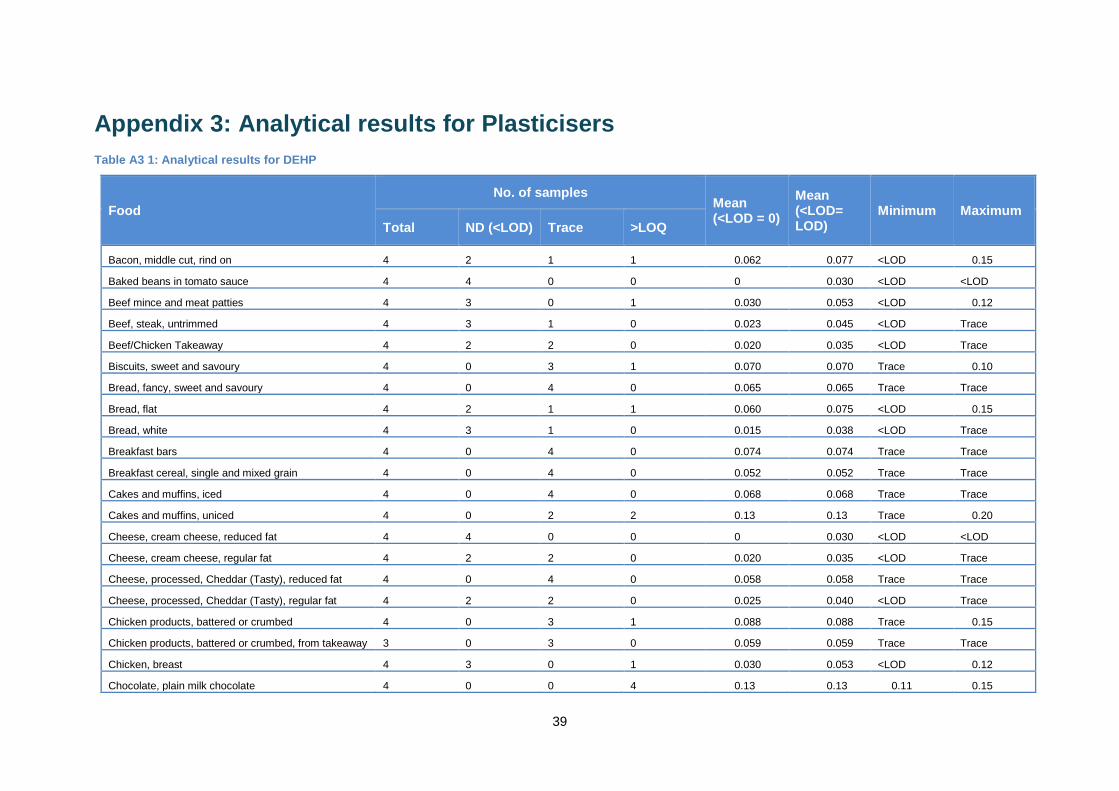
39
Appendix 3: Analytical results for Plasticisers
Table A3 1: Analytical results for DEHP
Food
No. of samples Mean (<LOD = 0)
Mean (<LOD= LOD)
Minimum Maximum
Total ND (<LOD) Trace >LOQ
Bacon, middle cut, rind on 4 2 1 1 0.062 0.077 <LOD 0.15
Baked beans in tomato sauce 4 4 0 0 0 0.030 <LOD <LOD
Beef mince and meat patties 4 3 0 1 0.030 0.053 <LOD 0.12
Beef, steak, untrimmed 4 3 1 0 0.023 0.045 <LOD Trace
Beef/Chicken Takeaway 4 2 2 0 0.020 0.035 <LOD Trace
Biscuits, sweet and savoury 4 0 3 1 0.070 0.070 Trace 0.10
Bread, fancy, sweet and savoury 4 0 4 0 0.065 0.065 Trace Trace
Bread, flat 4 2 1 1 0.060 0.075 <LOD 0.15
Bread, white 4 3 1 0 0.015 0.038 <LOD Trace
Breakfast bars 4 0 4 0 0.074 0.074 Trace Trace
Breakfast cereal, single and mixed grain 4 0 4 0 0.052 0.052 Trace Trace
Cakes and muffins, iced 4 0 4 0 0.068 0.068 Trace Trace
Cakes and muffins, uniced 4 0 2 2 0.13 0.13 Trace 0.20
Cheese, cream cheese, reduced fat 4 4 0 0 0 0.030 <LOD <LOD
Cheese, cream cheese, regular fat 4 2 2 0 0.020 0.035 <LOD Trace
Cheese, processed, Cheddar (Tasty), reduced fat 4 0 4 0 0.058 0.058 Trace Trace
Cheese, processed, Cheddar (Tasty), regular fat 4 2 2 0 0.025 0.040 <LOD Trace
Chicken products, battered or crumbed 4 0 3 1 0.088 0.088 Trace 0.15
Chicken products, battered or crumbed, from takeaway 3 0 3 0 0.059 0.059 Trace Trace
Chicken, breast 4 3 0 1 0.030 0.053 <LOD 0.12
Chocolate, plain milk chocolate 4 0 0 4 0.13 0.13 0.11 0.15
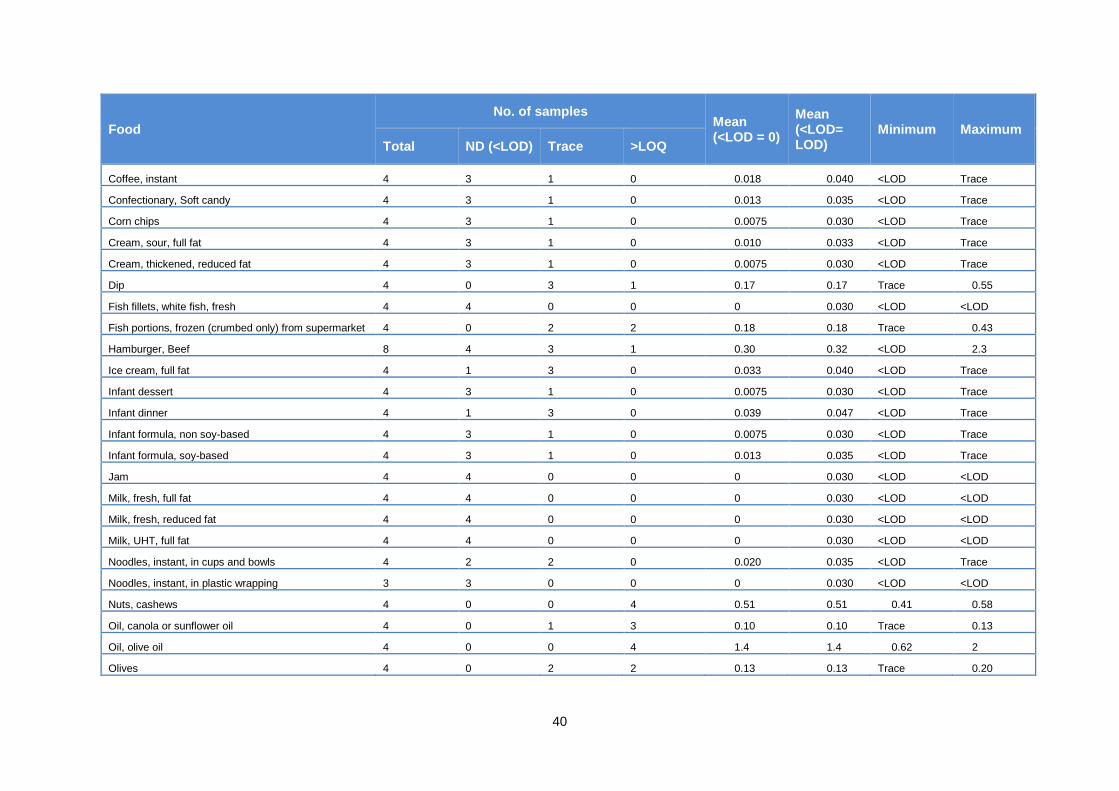
40
Food
No. of samples Mean (<LOD = 0)
Mean (<LOD= LOD)
Minimum Maximum
Total ND (<LOD) Trace >LOQ
Coffee, instant 4 3 1 0 0.018 0.040 <LOD Trace
Confectionary, Soft candy 4 3 1 0 0.013 0.035 <LOD Trace
Corn chips 4 3 1 0 0.0075 0.030 <LOD Trace
Cream, sour, full fat 4 3 1 0 0.010 0.033 <LOD Trace
Cream, thickened, reduced fat 4 3 1 0 0.0075 0.030 <LOD Trace
Dip 4 0 3 1 0.17 0.17 Trace 0.55
Fish fillets, white fish, fresh 4 4 0 0 0 0.030 <LOD <LOD
Fish portions, frozen (crumbed only) from supermarket 4 0 2 2 0.18 0.18 Trace 0.43
Hamburger, Beef 8 4 3 1 0.30 0.32 <LOD 2.3
Ice cream, full fat 4 1 3 0 0.033 0.040 <LOD Trace
Infant dessert 4 3 1 0 0.0075 0.030 <LOD Trace
Infant dinner 4 1 3 0 0.039 0.047 <LOD Trace
Infant formula, non soy-based 4 3 1 0 0.0075 0.030 <LOD Trace
Infant formula, soy-based 4 3 1 0 0.013 0.035 <LOD Trace
Jam 4 4 0 0 0 0.030 <LOD <LOD
Milk, fresh, full fat 4 4 0 0 0 0.030 <LOD <LOD
Milk, fresh, reduced fat 4 4 0 0 0 0.030 <LOD <LOD
Milk, UHT, full fat 4 4 0 0 0 0.030 <LOD <LOD
Noodles, instant, in cups and bowls 4 2 2 0 0.020 0.035 <LOD Trace
Noodles, instant, in plastic wrapping 3 3 0 0 0 0.030 <LOD <LOD
Nuts, cashews 4 0 0 4 0.51 0.51 0.41 0.58
Oil, canola or sunflower oil 4 0 1 3 0.10 0.10 Trace 0.13
Oil, olive oil 4 0 0 4 1.4 1.4 0.62 2
Olives 4 0 2 2 0.13 0.13 Trace 0.20

41
Food
No. of samples Mean (<LOD = 0)
Mean (<LOD= LOD)
Minimum Maximum
Total ND (<LOD) Trace >LOQ
Pasta 4 4 0 0 0 0.030 <LOD <LOD
Peanut butter 4 0 0 4 0.31 0.31 0.22 0.46
Peas, frozen 4 0 3 1 0.093 0.093 Trace 0.17
Pizza, frozen from supermarket 4 0 1 3 0.17 0.17 Trace 0.31
Potato crisps, flavoured and unflavoured 4 4 0 0 0 0.030 <LOD <LOD
Ready to eat meal, frozen from supermarket 4 1 2 1 0.058 0.065 <LOD 0.14
Rice, single grain, uncooked 4 1 1 2 0.088 0.095 <LOD 0.17
Sausages, beef 4 2 0 2 0.083 0.098 <LOD 0.18
Shelf-stable peaches 4 4 0 0 0 0.030 <LOD <LOD
Soft drink 4 4 0 0 0 0.030 <LOD <LOD
Soup 4 2 0 2 0.085 0.10 <LOD 0.20
Spreads, full fat, including butter and vegetable spreads 4 0 2 2 0.16 0.16 Trace 0.29
Spreads, reduced fat, including butter and vegetable spreads 4 1 2 1 0.085 0.093 <LOD 0.27
Sugar, white 4 2 1 1 0.050 0.065 <LOD 0.16
Sundried tomatoes 4 0 1 3 20 20 Trace 78
Tomato sauce 4 4 0 0 0 0.030 <LOD <LOD
Tomatoes, canned 4 3 0 1 0.035 0.058 <LOD 0.14
Tuna, canned 4 0 2 2 0.20 0.20 Trace 0.34
Yoghurt, full fat, flavoured and unflavoured 4 4 0 0 0 0.030 <LOD <LOD
Yoghurt, low/reduced fat, flavoured and unflavoured 4 4 0 0 0 0.030 <LOD <LOD
LOD = 0.030 mg/kg, LOQ = 0.10 mg/kg

42
Figure A3.5 Concentration of DEHP (mg/kg) by food

43
Table A3 2: Analytical results for DINP
Food
No. of samples Mean (<LOD = 0)
Mean (<LOD= LOD)
Minimum Maximum
Total ND (<LOD) Trace >LOQ
Bacon, middle cut, rind on 4 0 2 2 0.69 0.69 Trace 1.5
Baked beans in tomato sauce 4 4 0 0 0 0.17 <LOD <LOD
Beef mince and meat patties 4 4 0 0 0 0.17 <LOD <LOD
Beef, steak, untrimmed 4 4 0 0 0 0.17 <LOD <LOD
Beef/Chicken Takeaway 4 2 1 1 0.23 0.32 <LOD 0.70
Biscuits, sweet and savoury 4 3 1 0 0.048 0.18 <LOD Trace
Bread, fancy, sweet and savoury 4 4 0 0 0 0.17 <LOD <LOD
Bread, flat 4 3 1 0 0.090 0.22 <LOD Trace
Bread, white 4 4 0 0 0 0.17 <LOD <LOD
Breakfast bars 4 3 0 1 0.40 0.53 <LOD 1.6
Breakfast cereal, single and mixed grain 4 4 0 0 0 0.17 <LOD <LOD
Cakes and muffins, iced 4 0 4 0 0.31 0.31 Trace Trace
Cakes and muffins, uniced 4 2 1 1 0.23 0.32 <LOD 0.69
Cheese, cream cheese, reduced fat 4 4 0 0 0 0.17 <LOD <LOD
Cheese, cream cheese, regular fat 4 4 0 0 0 0.17 <LOD <LOD
Cheese, processed, Cheddar (Tasty), reduced fat 4 4 0 0 0 0.17 <LOD <LOD
Cheese, processed, Cheddar (Tasty), regular fat 4 2 2 0 0.15 0.23 <LOD Trace
Chicken products, battered or crumbed 4 1 3 0 0.20 0.24 <LOD Trace
Chicken products, battered or crumbed, from takeaway 3 0 2 1 0.73 0.73 Trace 1.5
Chicken, breast 4 2 2 0 0.11 0.19 <LOD Trace
Chocolate, plain milk chocolate 4 4 0 0 0 0.17 <LOD <LOD
Coffee, instant 4 3 1 0 0.075 0.20 <LOD Trace
Confectionary, Soft candy 4 3 1 0 0.040 0.17 <LOD Trace

44
Food
No. of samples Mean (<LOD = 0)
Mean (<LOD= LOD)
Minimum Maximum
Total ND (<LOD) Trace >LOQ
Corn chips 4 4 0 0 0 0.17 <LOD <LOD
Cream, sour, full fat 4 4 0 0 0 0.17 <LOD <LOD
Cream, thickened, reduced fat 4 4 0 0 0 0.17 <LOD <LOD
Dip 4 3 1 0 0.063 0.19 <LOD Trace
Fish fillets, white fish, fresh 4 2 2 0 0.090 0.18 <LOD Trace
Fish portions, frozen (crumbed only) from supermarket 4 3 1 0 0.053 0.18 <LOD Trace
Hamburger, Beef 8 2 1 5 5.7 5.8 <LOD 13
Ice cream, full fat 4 3 1 0 0.12 0.25 <LOD Trace
Infant dessert 4 4 0 0 0 0.17 <LOD <LOD
Infant dinner 4 4 0 0 0 0.17 <LOD <LOD
Infant formula, non soy-based 4 3 0 1 0.17 0.29 <LOD 0.66
Infant formula, soy-based 4 3 1 0 0.043 0.17 <LOD Trace
Jam 4 4 0 0 0 0.17 <LOD <LOD
Milk, fresh, full fat 4 4 0 0 0 0.17 <LOD <LOD
Milk, fresh, reduced fat 4 4 0 0 0 0.17 <LOD <LOD
Milk, UHT, full fat 4 4 0 0 0 0.17 <LOD <LOD
Noodles, instant, in cups and bowls 4 4 0 0 0 0.17 <LOD <LOD
Noodles, instant, in plastic wrapping 3 3 0 0 0 0.17 <LOD <LOD
Nuts, cashews 4 4 0 0 0 0.17 <LOD <LOD
Oil, canola or sunflower oil 4 1 3 0 0.28 0.32 <LOD Trace
Oil, olive oil 4 0 1 3 0.97 0.97 Trace 1.3
Olives 4 0 3 1 0.39 0.39 Trace 0.50
Pasta 4 4 0 0 0 0.17 <LOD <LOD
Peanut butter 4 3 1 0 0.078 0.21 <LOD Trace
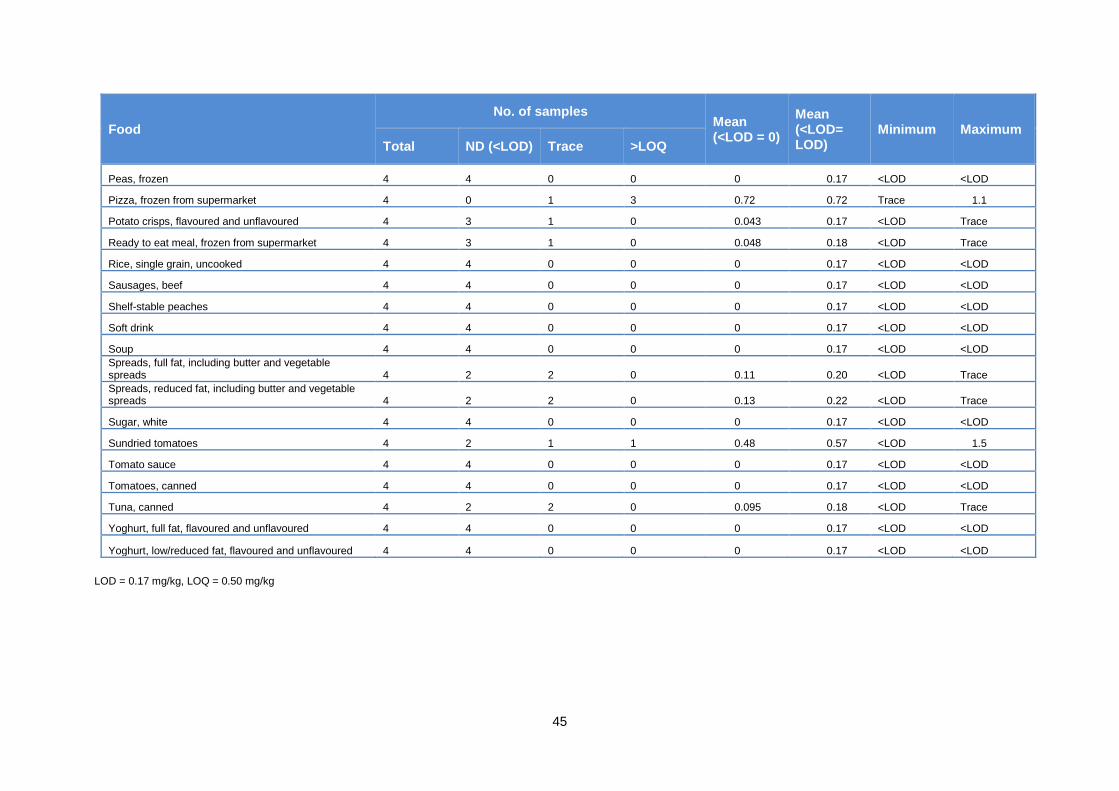
45
Food
No. of samples Mean (<LOD = 0)
Mean (<LOD= LOD)
Minimum Maximum
Total ND (<LOD) Trace >LOQ
Peas, frozen 4 4 0 0 0 0.17 <LOD <LOD
Pizza, frozen from supermarket 4 0 1 3 0.72 0.72 Trace 1.1
Potato crisps, flavoured and unflavoured 4 3 1 0 0.043 0.17 <LOD Trace
Ready to eat meal, frozen from supermarket 4 3 1 0 0.048 0.18 <LOD Trace
Rice, single grain, uncooked 4 4 0 0 0 0.17 <LOD <LOD
Sausages, beef 4 4 0 0 0 0.17 <LOD <LOD
Shelf-stable peaches 4 4 0 0 0 0.17 <LOD <LOD
Soft drink 4 4 0 0 0 0.17 <LOD <LOD
Soup 4 4 0 0 0 0.17 <LOD <LOD
Spreads, full fat, including butter and vegetable spreads 4 2 2 0 0.11 0.20 <LOD Trace
Spreads, reduced fat, including butter and vegetable spreads 4 2 2 0 0.13 0.22 <LOD Trace
Sugar, white 4 4 0 0 0 0.17 <LOD <LOD
Sundried tomatoes 4 2 1 1 0.48 0.57 <LOD 1.5
Tomato sauce 4 4 0 0 0 0.17 <LOD <LOD
Tomatoes, canned 4 4 0 0 0 0.17 <LOD <LOD
Tuna, canned 4 2 2 0 0.095 0.18 <LOD Trace
Yoghurt, full fat, flavoured and unflavoured 4 4 0 0 0 0.17 <LOD <LOD
Yoghurt, low/reduced fat, flavoured and unflavoured 4 4 0 0 0 0.17 <LOD <LOD
LOD = 0.17 mg/kg, LOQ = 0.50 mg/kg

46
Figure A3.7 Concentration of DINP (mg/kg) by food

47
Table A3 3: Analytical results for BBP (mg/kg)
Food
No. of samples Mean (<LOD = 0)
Mean (<LOD= LOD)
Minimum Maximum
Total ND (<LOD) Trace >LOQ
Bacon, middle cut, rind on 4 4 0 0 0 0.030 <LOD <LOD
Baked beans in tomato sauce 4 4 0 0 0 0.030 <LOD <LOD
Beef mince and meat patties 4 4 0 0 0 0.030 <LOD <LOD
Beef, steak, untrimmed 4 4 0 0 0 0.030 <LOD <LOD
Beef/Chicken Takeaway 4 4 0 0 0 0.030 <LOD <LOD
Biscuits, sweet and savoury 4 4 0 0 0 0.030 <LOD <LOD
Bread, fancy, sweet and savoury 4 4 0 0 0 0.030 <LOD <LOD
Bread, flat 4 4 0 0 0 0.030 <LOD <LOD
Bread, white 4 4 0 0 0 0.030 <LOD <LOD
Breakfast bars 4 4 0 0 0 0.030 <LOD <LOD
Breakfast cereal, single and mixed grain 4 4 0 0 0 0.030 <LOD <LOD
Cakes and muffins, iced 4 4 0 0 0 0.030 <LOD <LOD
Cakes and muffins, uniced 4 4 0 0 0 0.030 <LOD <LOD
Cheese, cream cheese, reduced fat 4 4 0 0 0 0.030 <LOD <LOD
Cheese, cream cheese, regular fat 4 4 0 0 0 0.030 <LOD <LOD
Cheese, processed, Cheddar (Tasty), reduced fat 4 4 0 0 0 0.030 <LOD <LOD
Cheese, processed, Cheddar (Tasty), regular fat 4 4 0 0 0 0.030 <LOD <LOD
Chicken products, battered or crumbed 4 4 0 0 0 0.030 <LOD <LOD
Chicken products, battered or crumbed, from takeaway 3 3 0 0 0 0.030 <LOD <LOD
Chicken, breast 4 4 0 0 0 0.030 <LOD <LOD
Chocolate, plain milk chocolate 4 4 0 0 0 0.030 <LOD <LOD
Coffee, instant 4 4 0 0 0 0.030 <LOD <LOD
Confectionary, Soft candy 4 4 0 0 0 0.030 <LOD <LOD
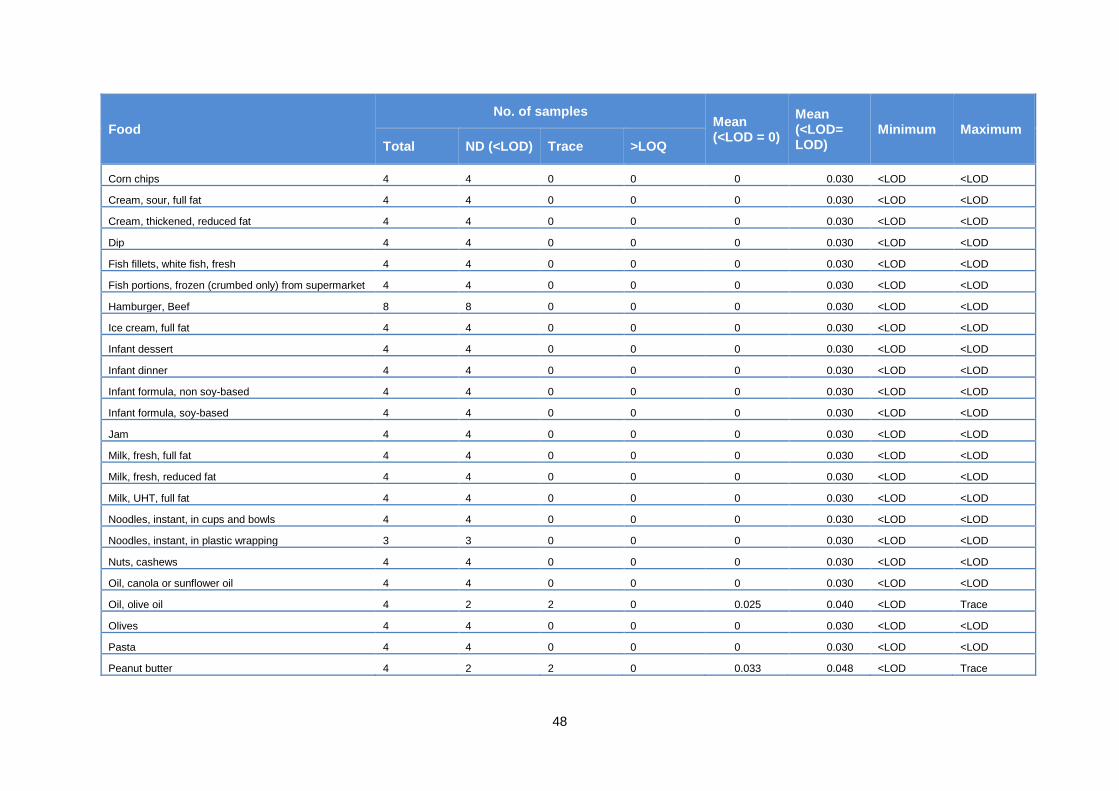
48
Food
No. of samples Mean (<LOD = 0)
Mean (<LOD= LOD)
Minimum Maximum
Total ND (<LOD) Trace >LOQ
Corn chips 4 4 0 0 0 0.030 <LOD <LOD
Cream, sour, full fat 4 4 0 0 0 0.030 <LOD <LOD
Cream, thickened, reduced fat 4 4 0 0 0 0.030 <LOD <LOD
Dip 4 4 0 0 0 0.030 <LOD <LOD
Fish fillets, white fish, fresh 4 4 0 0 0 0.030 <LOD <LOD
Fish portions, frozen (crumbed only) from supermarket 4 4 0 0 0 0.030 <LOD <LOD
Hamburger, Beef 8 8 0 0 0 0.030 <LOD <LOD
Ice cream, full fat 4 4 0 0 0 0.030 <LOD <LOD
Infant dessert 4 4 0 0 0 0.030 <LOD <LOD
Infant dinner 4 4 0 0 0 0.030 <LOD <LOD
Infant formula, non soy-based 4 4 0 0 0 0.030 <LOD <LOD
Infant formula, soy-based 4 4 0 0 0 0.030 <LOD <LOD
Jam 4 4 0 0 0 0.030 <LOD <LOD
Milk, fresh, full fat 4 4 0 0 0 0.030 <LOD <LOD
Milk, fresh, reduced fat 4 4 0 0 0 0.030 <LOD <LOD
Milk, UHT, full fat 4 4 0 0 0 0.030 <LOD <LOD
Noodles, instant, in cups and bowls 4 4 0 0 0 0.030 <LOD <LOD
Noodles, instant, in plastic wrapping 3 3 0 0 0 0.030 <LOD <LOD
Nuts, cashews 4 4 0 0 0 0.030 <LOD <LOD
Oil, canola or sunflower oil 4 4 0 0 0 0.030 <LOD <LOD
Oil, olive oil 4 2 2 0 0.025 0.040 <LOD Trace
Olives 4 4 0 0 0 0.030 <LOD <LOD
Pasta 4 4 0 0 0 0.030 <LOD <LOD
Peanut butter 4 2 2 0 0.033 0.048 <LOD Trace
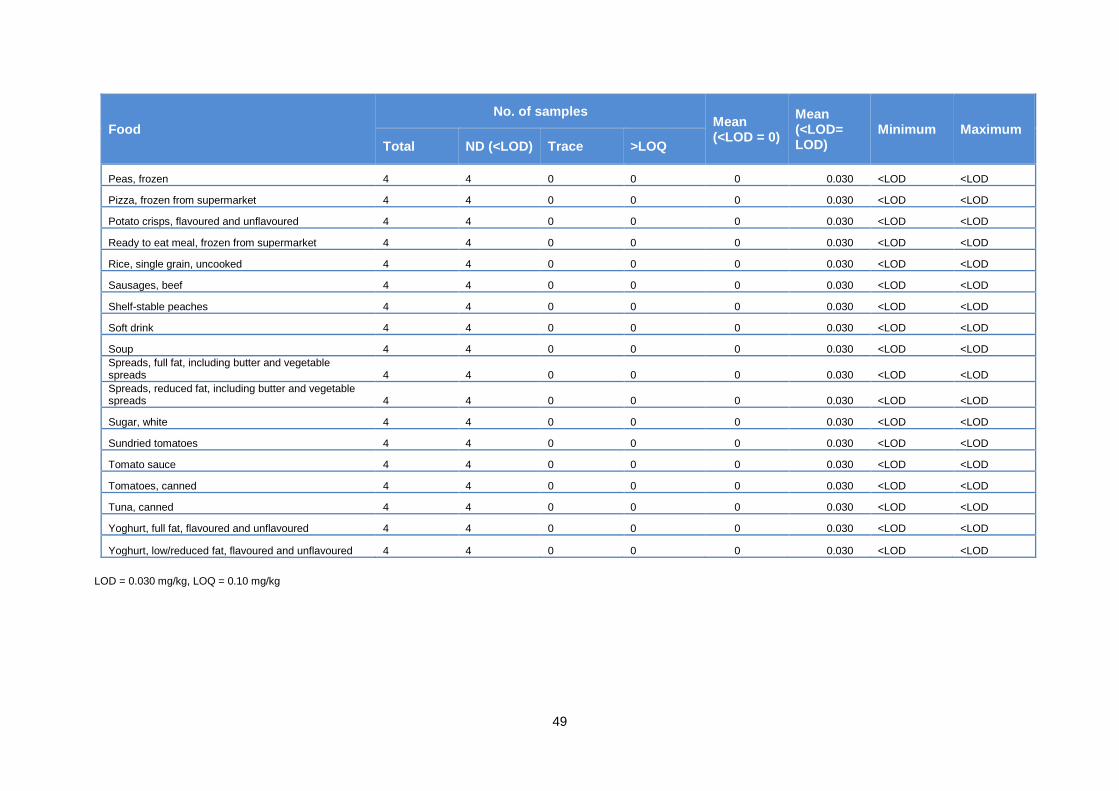
49
Food
No. of samples Mean (<LOD = 0)
Mean (<LOD= LOD)
Minimum Maximum
Total ND (<LOD) Trace >LOQ
Peas, frozen 4 4 0 0 0 0.030 <LOD <LOD
Pizza, frozen from supermarket 4 4 0 0 0 0.030 <LOD <LOD
Potato crisps, flavoured and unflavoured 4 4 0 0 0 0.030 <LOD <LOD
Ready to eat meal, frozen from supermarket 4 4 0 0 0 0.030 <LOD <LOD
Rice, single grain, uncooked 4 4 0 0 0 0.030 <LOD <LOD
Sausages, beef 4 4 0 0 0 0.030 <LOD <LOD
Shelf-stable peaches 4 4 0 0 0 0.030 <LOD <LOD
Soft drink 4 4 0 0 0 0.030 <LOD <LOD
Soup 4 4 0 0 0 0.030 <LOD <LOD
Spreads, full fat, including butter and vegetable spreads 4 4 0 0 0 0.030 <LOD <LOD
Spreads, reduced fat, including butter and vegetable spreads 4 4 0 0 0 0.030 <LOD <LOD
Sugar, white 4 4 0 0 0 0.030 <LOD <LOD
Sundried tomatoes 4 4 0 0 0 0.030 <LOD <LOD
Tomato sauce 4 4 0 0 0 0.030 <LOD <LOD
Tomatoes, canned 4 4 0 0 0 0.030 <LOD <LOD
Tuna, canned 4 4 0 0 0 0.030 <LOD <LOD
Yoghurt, full fat, flavoured and unflavoured 4 4 0 0 0 0.030 <LOD <LOD
Yoghurt, low/reduced fat, flavoured and unflavoured 4 4 0 0 0 0.030 <LOD <LOD
LOD = 0.030 mg/kg, LOQ = 0.10 mg/kg
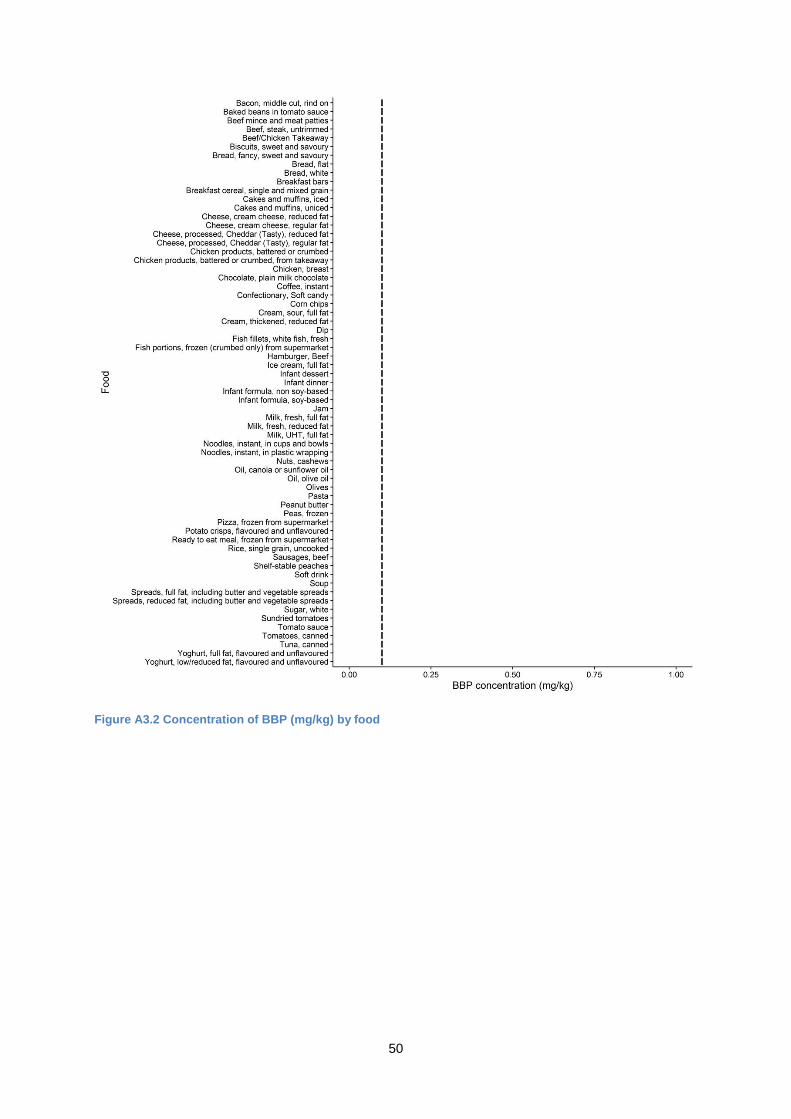
50
Figure A3.2 Concentration of BBP (mg/kg) by food
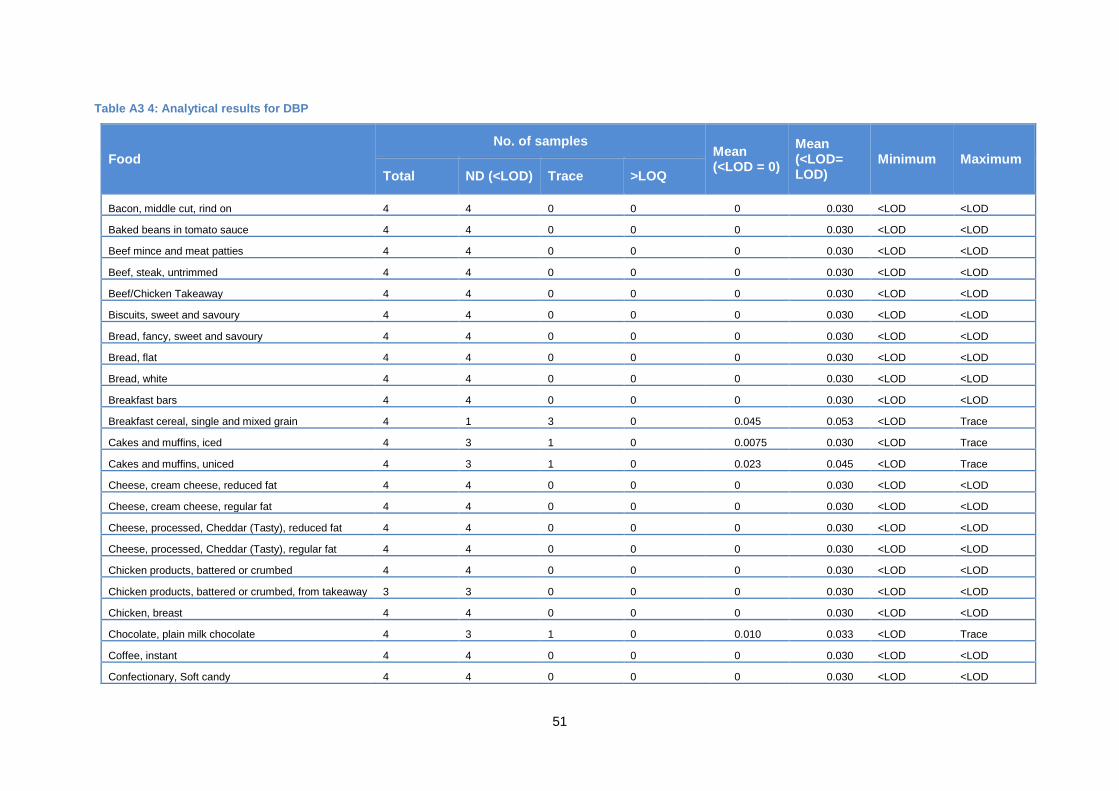
51
Table A3 4: Analytical results for DBP
Food
No. of samples Mean (<LOD = 0)
Mean (<LOD= LOD)
Minimum Maximum
Total ND (<LOD) Trace >LOQ
Bacon, middle cut, rind on 4 4 0 0 0 0.030 <LOD <LOD
Baked beans in tomato sauce 4 4 0 0 0 0.030 <LOD <LOD
Beef mince and meat patties 4 4 0 0 0 0.030 <LOD <LOD
Beef, steak, untrimmed 4 4 0 0 0 0.030 <LOD <LOD
Beef/Chicken Takeaway 4 4 0 0 0 0.030 <LOD <LOD
Biscuits, sweet and savoury 4 4 0 0 0 0.030 <LOD <LOD
Bread, fancy, sweet and savoury 4 4 0 0 0 0.030 <LOD <LOD
Bread, flat 4 4 0 0 0 0.030 <LOD <LOD
Bread, white 4 4 0 0 0 0.030 <LOD <LOD
Breakfast bars 4 4 0 0 0 0.030 <LOD <LOD
Breakfast cereal, single and mixed grain 4 1 3 0 0.045 0.053 <LOD Trace
Cakes and muffins, iced 4 3 1 0 0.0075 0.030 <LOD Trace
Cakes and muffins, uniced 4 3 1 0 0.023 0.045 <LOD Trace
Cheese, cream cheese, reduced fat 4 4 0 0 0 0.030 <LOD <LOD
Cheese, cream cheese, regular fat 4 4 0 0 0 0.030 <LOD <LOD
Cheese, processed, Cheddar (Tasty), reduced fat 4 4 0 0 0 0.030 <LOD <LOD
Cheese, processed, Cheddar (Tasty), regular fat 4 4 0 0 0 0.030 <LOD <LOD
Chicken products, battered or crumbed 4 4 0 0 0 0.030 <LOD <LOD
Chicken products, battered or crumbed, from takeaway 3 3 0 0 0 0.030 <LOD <LOD
Chicken, breast 4 4 0 0 0 0.030 <LOD <LOD
Chocolate, plain milk chocolate 4 3 1 0 0.010 0.033 <LOD Trace
Coffee, instant 4 4 0 0 0 0.030 <LOD <LOD
Confectionary, Soft candy 4 4 0 0 0 0.030 <LOD <LOD

52
Food
No. of samples Mean (<LOD = 0)
Mean (<LOD= LOD)
Minimum Maximum
Total ND (<LOD) Trace >LOQ
Corn chips 4 4 0 0 0 0.030 <LOD <LOD
Cream, sour, full fat 4 4 0 0 0 0.030 <LOD <LOD
Cream, thickened, reduced fat 4 4 0 0 0 0.030 <LOD <LOD
Dip 4 3 1 0 0.020 0.043 <LOD Trace
Fish fillets, white fish, fresh 4 4 0 0 0 0.030 <LOD <LOD
Fish portions, frozen (crumbed only) from supermarket 4 4 0 0 0 0.030 <LOD <LOD
Hamburger, Beef 8 8 0 0 0 0.030 <LOD <LOD
Ice cream, full fat 4 4 0 0 0 0.030 <LOD <LOD
Infant dessert 4 4 0 0 0 0.030 <LOD <LOD
Infant dinner 4 4 0 0 0 0.030 <LOD <LOD
Infant formula, non soy-based 4 4 0 0 0 0.030 <LOD <LOD
Infant formula, soy-based 4 4 0 0 0 0.030 <LOD <LOD
Jam 4 3 1 0 0.0075 0.030 <LOD Trace
Milk, fresh, full fat 4 4 0 0 0 0.030 <LOD <LOD
Milk, fresh, reduced fat 4 4 0 0 0 0.030 <LOD <LOD
Milk, UHT, full fat 4 4 0 0 0 0.030 <LOD <LOD
Noodles, instant, in cups and bowls 4 4 0 0 0 0.030 <LOD <LOD
Noodles, instant, in plastic wrapping 3 3 0 0 0 0.030 <LOD <LOD
Nuts, cashews 4 4 0 0 0 0.030 <LOD <LOD
Oil, canola or sunflower oil 4 4 0 0 0 0.030 <LOD <LOD
Oil, olive oil 4 4 0 0 0 0.030 <LOD <LOD
Olives 4 4 0 0 0 0.030 <LOD <LOD
Pasta 4 4 0 0 0 0.030 <LOD <LOD
Peanut butter 4 4 0 0 0 0.030 <LOD <LOD

53
Food
No. of samples Mean (<LOD = 0)
Mean (<LOD= LOD)
Minimum Maximum
Total ND (<LOD) Trace >LOQ
Peas, frozen 4 3 0 1 0.035 0.058 <LOD 0.14
Pizza, frozen from supermarket 4 3 1 0 0.013 0.035 <LOD Trace
Potato crisps, flavoured and unflavoured 4 4 0 0 0 0.030 <LOD <LOD
Ready to eat meal, frozen from supermarket 4 4 0 0 0 0.030 <LOD <LOD
Rice, single grain, uncooked 4 4 0 0 0 0.030 <LOD <LOD
Sausages, beef 4 4 0 0 0 0.030 <LOD <LOD
Shelf-stable peaches 4 4 0 0 0 0.030 <LOD <LOD
Soft drink 4 4 0 0 0 0.030 <LOD <LOD
Soup 4 4 0 0 0 0.030 <LOD <LOD
Spreads, full fat, including butter and vegetable spreads 4 4 0 0 0 0.030 <LOD <LOD
Spreads, reduced fat, including butter and vegetable spreads 4 4 0 0 0 0.030 <LOD <LOD
Sugar, white 4 4 0 0 0 0.030 <LOD <LOD
Sundried tomatoes 4 3 0 1 0.025 0.048 <LOD 0.10
Tomato sauce 4 3 0 1 0.33 0.35 <LOD 1.3
Tomatoes, canned 4 4 0 0 0 0.030 <LOD <LOD
Tuna, canned 4 4 0 0 0 0.030 <LOD <LOD
Yoghurt, full fat, flavoured and unflavoured 4 4 0 0 0 0.030 <LOD <LOD
Yoghurt, low/reduced fat, flavoured and unflavoured 4 4 0 0 0 0.030 <LOD <LOD
LOD = 0.030 mg/kg, LOQ = 0.10 mg/kg
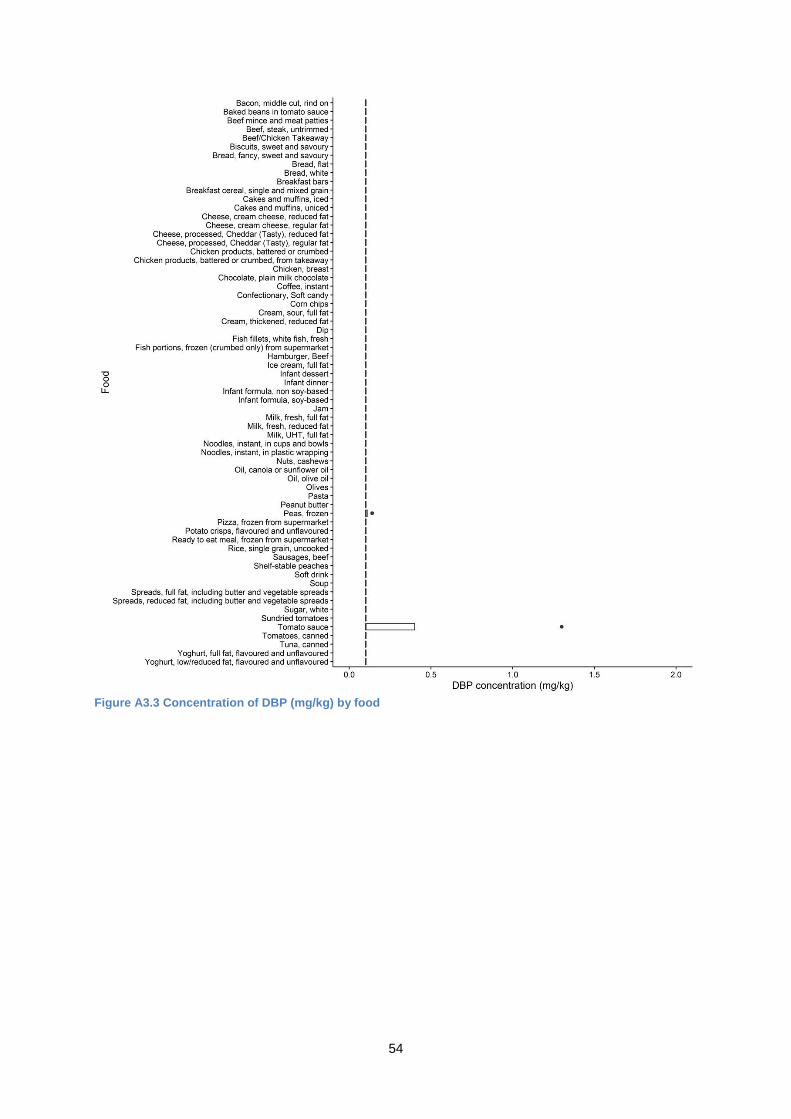
54
Figure A3.3 Concentration of DBP (mg/kg) by food
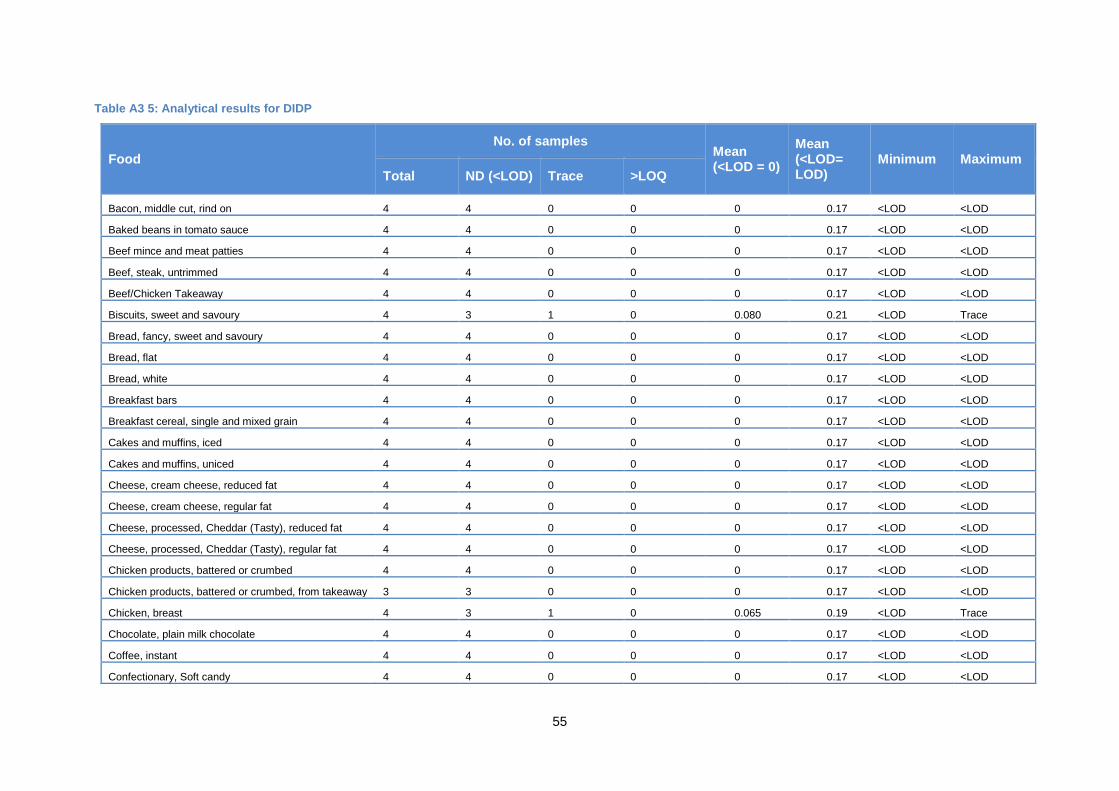
55
Table A3 5: Analytical results for DIDP
Food
No. of samples Mean (<LOD = 0)
Mean (<LOD= LOD)
Minimum Maximum
Total ND (<LOD) Trace >LOQ
Bacon, middle cut, rind on 4 4 0 0 0 0.17 <LOD <LOD
Baked beans in tomato sauce 4 4 0 0 0 0.17 <LOD <LOD
Beef mince and meat patties 4 4 0 0 0 0.17 <LOD <LOD
Beef, steak, untrimmed 4 4 0 0 0 0.17 <LOD <LOD
Beef/Chicken Takeaway 4 4 0 0 0 0.17 <LOD <LOD
Biscuits, sweet and savoury 4 3 1 0 0.080 0.21 <LOD Trace
Bread, fancy, sweet and savoury 4 4 0 0 0 0.17 <LOD <LOD
Bread, flat 4 4 0 0 0 0.17 <LOD <LOD
Bread, white 4 4 0 0 0 0.17 <LOD <LOD
Breakfast bars 4 4 0 0 0 0.17 <LOD <LOD
Breakfast cereal, single and mixed grain 4 4 0 0 0 0.17 <LOD <LOD
Cakes and muffins, iced 4 4 0 0 0 0.17 <LOD <LOD
Cakes and muffins, uniced 4 4 0 0 0 0.17 <LOD <LOD
Cheese, cream cheese, reduced fat 4 4 0 0 0 0.17 <LOD <LOD
Cheese, cream cheese, regular fat 4 4 0 0 0 0.17 <LOD <LOD
Cheese, processed, Cheddar (Tasty), reduced fat 4 4 0 0 0 0.17 <LOD <LOD
Cheese, processed, Cheddar (Tasty), regular fat 4 4 0 0 0 0.17 <LOD <LOD
Chicken products, battered or crumbed 4 4 0 0 0 0.17 <LOD <LOD
Chicken products, battered or crumbed, from takeaway 3 3 0 0 0 0.17 <LOD <LOD
Chicken, breast 4 3 1 0 0.065 0.19 <LOD Trace
Chocolate, plain milk chocolate 4 4 0 0 0 0.17 <LOD <LOD
Coffee, instant 4 4 0 0 0 0.17 <LOD <LOD
Confectionary, Soft candy 4 4 0 0 0 0.17 <LOD <LOD
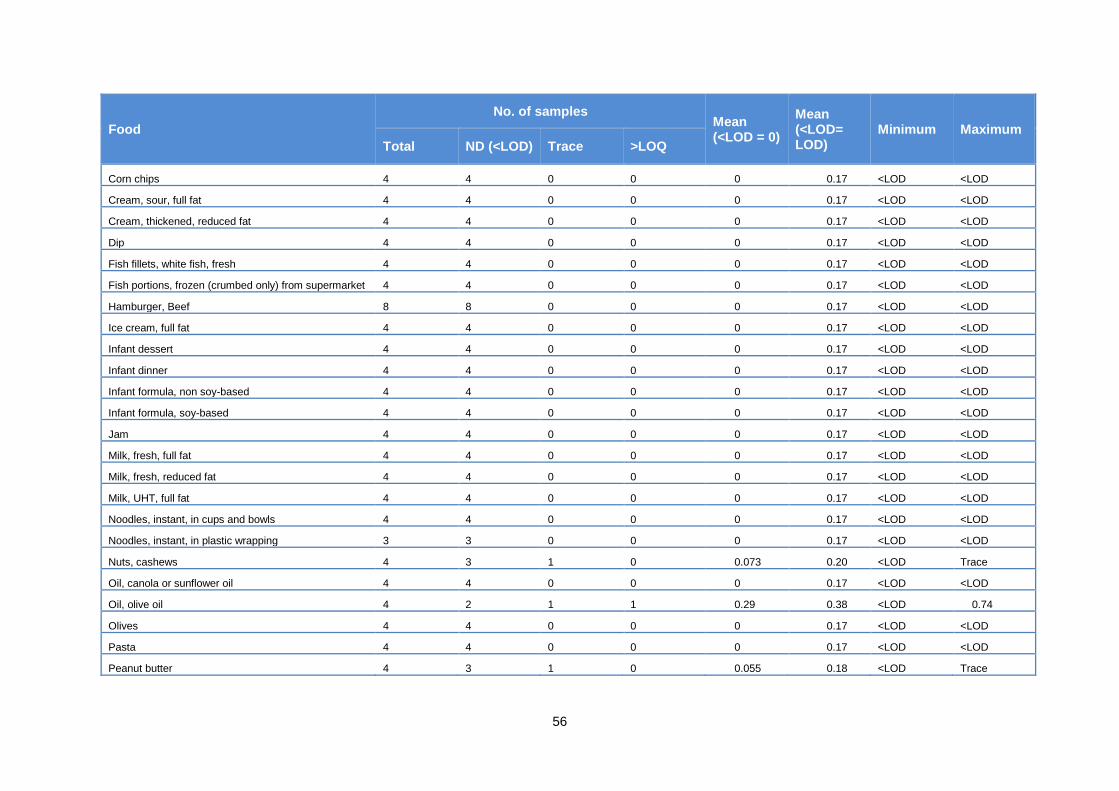
56
Food
No. of samples Mean (<LOD = 0)
Mean (<LOD= LOD)
Minimum Maximum
Total ND (<LOD) Trace >LOQ
Corn chips 4 4 0 0 0 0.17 <LOD <LOD
Cream, sour, full fat 4 4 0 0 0 0.17 <LOD <LOD
Cream, thickened, reduced fat 4 4 0 0 0 0.17 <LOD <LOD
Dip 4 4 0 0 0 0.17 <LOD <LOD
Fish fillets, white fish, fresh 4 4 0 0 0 0.17 <LOD <LOD
Fish portions, frozen (crumbed only) from supermarket 4 4 0 0 0 0.17 <LOD <LOD
Hamburger, Beef 8 8 0 0 0 0.17 <LOD <LOD
Ice cream, full fat 4 4 0 0 0 0.17 <LOD <LOD
Infant dessert 4 4 0 0 0 0.17 <LOD <LOD
Infant dinner 4 4 0 0 0 0.17 <LOD <LOD
Infant formula, non soy-based 4 4 0 0 0 0.17 <LOD <LOD
Infant formula, soy-based 4 4 0 0 0 0.17 <LOD <LOD
Jam 4 4 0 0 0 0.17 <LOD <LOD
Milk, fresh, full fat 4 4 0 0 0 0.17 <LOD <LOD
Milk, fresh, reduced fat 4 4 0 0 0 0.17 <LOD <LOD
Milk, UHT, full fat 4 4 0 0 0 0.17 <LOD <LOD
Noodles, instant, in cups and bowls 4 4 0 0 0 0.17 <LOD <LOD
Noodles, instant, in plastic wrapping 3 3 0 0 0 0.17 <LOD <LOD
Nuts, cashews 4 3 1 0 0.073 0.20 <LOD Trace
Oil, canola or sunflower oil 4 4 0 0 0 0.17 <LOD <LOD
Oil, olive oil 4 2 1 1 0.29 0.38 <LOD 0.74
Olives 4 4 0 0 0 0.17 <LOD <LOD
Pasta 4 4 0 0 0 0.17 <LOD <LOD
Peanut butter 4 3 1 0 0.055 0.18 <LOD Trace

57
Food
No. of samples Mean (<LOD = 0)
Mean (<LOD= LOD)
Minimum Maximum
Total ND (<LOD) Trace >LOQ
Peas, frozen 4 4 0 0 0 0.17 <LOD <LOD
Pizza, frozen from supermarket 4 4 0 0 0 0.17 <LOD <LOD
Potato crisps, flavoured and unflavoured 4 3 1 0 0.068 0.20 <LOD Trace
Ready to eat meal, frozen from supermarket 4 4 0 0 0 0.17 <LOD <LOD
Rice, single grain, uncooked 4 4 0 0 0 0.17 <LOD <LOD
Sausages, beef 4 4 0 0 0 0.17 <LOD <LOD
Shelf-stable peaches 4 4 0 0 0 0.17 <LOD <LOD
Soft drink 4 4 0 0 0 0.17 <LOD <LOD
Soup 4 4 0 0 0 0.17 <LOD <LOD
Spreads, full fat, including butter and vegetable spreads 4 4 0 0 0 0.17 <LOD <LOD
Spreads, reduced fat, including butter and vegetable spreads 4 4 0 0 0 0.17 <LOD <LOD
Sugar, white 4 4 0 0 0 0.17 <LOD <LOD
Sundried tomatoes 4 3 1 0 0.050 0.18 <LOD Trace
Tomato sauce 4 4 0 0 0 0.17 <LOD <LOD
Tomatoes, canned 4 4 0 0 0 0.17 <LOD <LOD
Tuna, canned 4 4 0 0 0 0.17 <LOD <LOD
Yoghurt, full fat, flavoured and unflavoured 4 4 0 0 0 0.17 <LOD <LOD
Yoghurt, low/reduced fat, flavoured and unflavoured 4 4 0 0 0 0.17 <LOD <LOD
LOD = 0.17 mg/kg, LOQ = 0.50 mg/kg
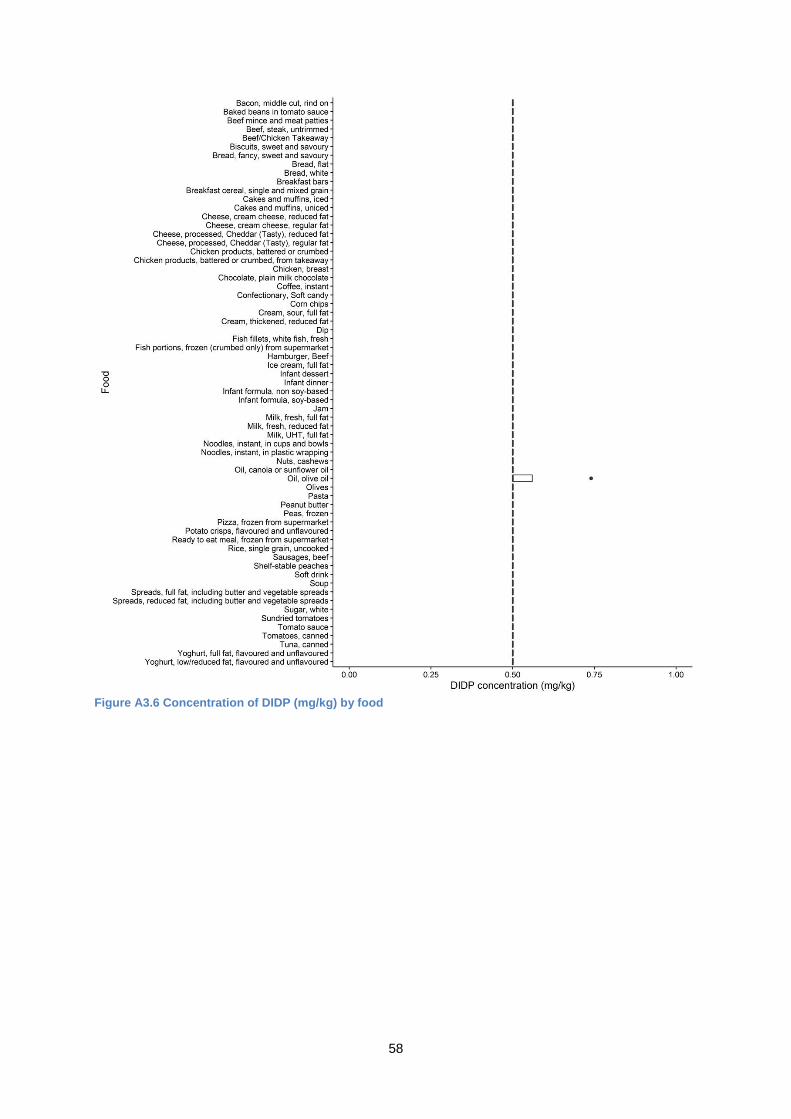
58
Figure A3.6 Concentration of DIDP (mg/kg) by food

59
Table A3 6: Analytical results for DEHA
Food
No. of samples Mean (<LOD = 0)
Mean (<LOD= LOD)
Minimum Maximum
Total ND (<LOD) Trace >LOQ
Bacon, middle cut, rind on 4 4 0 0 0 0.030 <LOD <LOD
Baked beans in tomato sauce 4 4 0 0 0 0.030 <LOD <LOD
Beef mince and meat patties 4 2 1 1 0.24 0.26 <LOD 0.92
Beef, steak, untrimmed 4 0 0 4 2.5 2.5 1.1 4.2
Beef/Chicken Takeaway 4 1 0 3 0.29 0.30 <LOD 0.79
Biscuits, sweet and savoury 4 4 0 0 0 0.030 <LOD <LOD
Bread, fancy, sweet and savoury 4 4 0 0 0 0.030 <LOD <LOD
Bread, flat 4 4 0 0 0 0.030 <LOD <LOD
Bread, white 4 4 0 0 0 0.030 <LOD <LOD
Breakfast bars 4 4 0 0 0 0.030 <LOD <LOD
Breakfast cereal, single and mixed grain 4 4 0 0 0 0.030 <LOD <LOD
Cakes and muffins, iced 4 2 1 1 0.14 0.15 <LOD 0.50
Cakes and muffins, uniced 4 2 2 0 0.025 0.040 <LOD Trace
Cheese, cream cheese, reduced fat 4 0 4 0 0.075 0.075 Trace Trace
Cheese, cream cheese, regular fat 4 0 0 4 0.18 0.18 0.16 0.19
Cheese, processed, Cheddar (Tasty), reduced fat 4 0 1 3 0.20 0.20 Trace 0.37
Cheese, processed, Cheddar (Tasty), regular fat 4 0 1 3 0.30 0.30 Trace 0.65
Chicken products, battered or crumbed 4 4 0 0 0 0.030 <LOD <LOD
Chicken products, battered or crumbed, from takeaway 3 2 0 1 0.033 0.053 <LOD 0.10
Chicken, breast 4 3 1 0 0.0075 0.030 <LOD Trace
Chocolate, plain milk chocolate 4 1 3 0 0.045 0.053 <LOD Trace
Coffee, instant 4 4 0 0 0 0.030 <LOD <LOD
Confectionary, Soft candy 4 4 0 0 0 0.030 <LOD <LOD
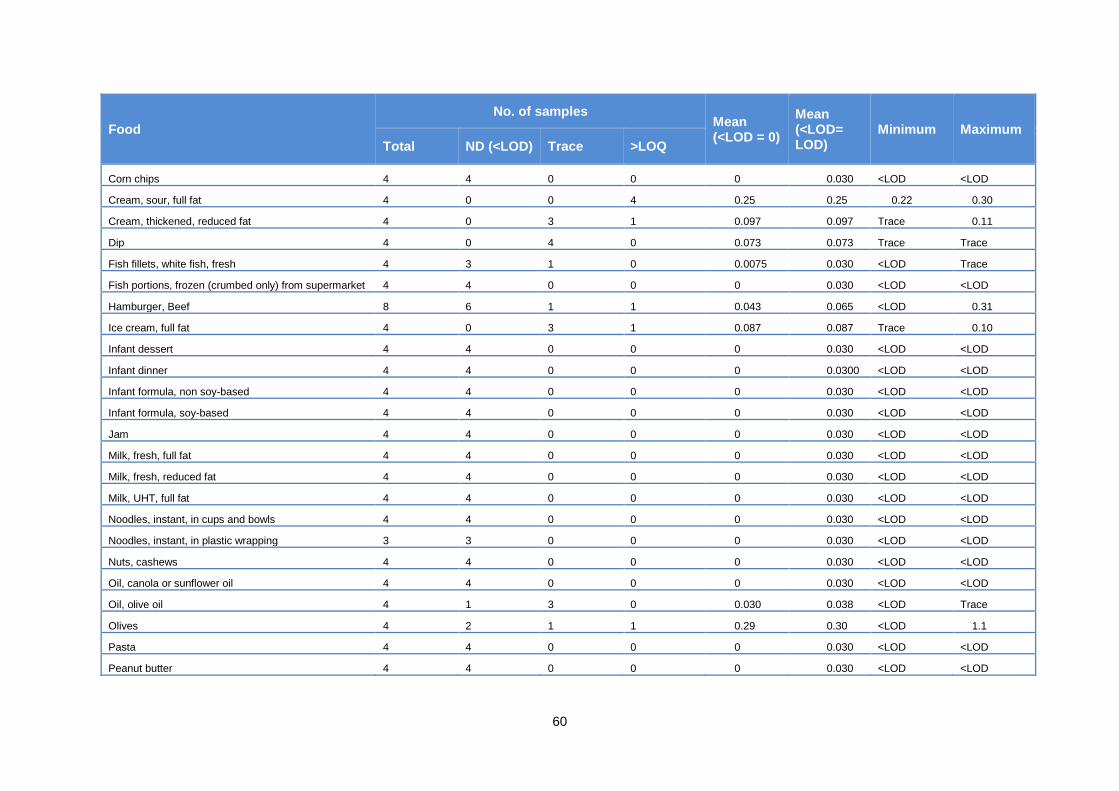
60
Food
No. of samples Mean (<LOD = 0)
Mean (<LOD= LOD)
Minimum Maximum
Total ND (<LOD) Trace >LOQ
Corn chips 4 4 0 0 0 0.030 <LOD <LOD
Cream, sour, full fat 4 0 0 4 0.25 0.25 0.22 0.30
Cream, thickened, reduced fat 4 0 3 1 0.097 0.097 Trace 0.11
Dip 4 0 4 0 0.073 0.073 Trace Trace
Fish fillets, white fish, fresh 4 3 1 0 0.0075 0.030 <LOD Trace
Fish portions, frozen (crumbed only) from supermarket 4 4 0 0 0 0.030 <LOD <LOD
Hamburger, Beef 8 6 1 1 0.043 0.065 <LOD 0.31
Ice cream, full fat 4 0 3 1 0.087 0.087 Trace 0.10
Infant dessert 4 4 0 0 0 0.030 <LOD <LOD
Infant dinner 4 4 0 0 0 0.0300 <LOD <LOD
Infant formula, non soy-based 4 4 0 0 0 0.030 <LOD <LOD
Infant formula, soy-based 4 4 0 0 0 0.030 <LOD <LOD
Jam 4 4 0 0 0 0.030 <LOD <LOD
Milk, fresh, full fat 4 4 0 0 0 0.030 <LOD <LOD
Milk, fresh, reduced fat 4 4 0 0 0 0.030 <LOD <LOD
Milk, UHT, full fat 4 4 0 0 0 0.030 <LOD <LOD
Noodles, instant, in cups and bowls 4 4 0 0 0 0.030 <LOD <LOD
Noodles, instant, in plastic wrapping 3 3 0 0 0 0.030 <LOD <LOD
Nuts, cashews 4 4 0 0 0 0.030 <LOD <LOD
Oil, canola or sunflower oil 4 4 0 0 0 0.030 <LOD <LOD
Oil, olive oil 4 1 3 0 0.030 0.038 <LOD Trace
Olives 4 2 1 1 0.29 0.30 <LOD 1.1
Pasta 4 4 0 0 0 0.030 <LOD <LOD
Peanut butter 4 4 0 0 0 0.030 <LOD <LOD
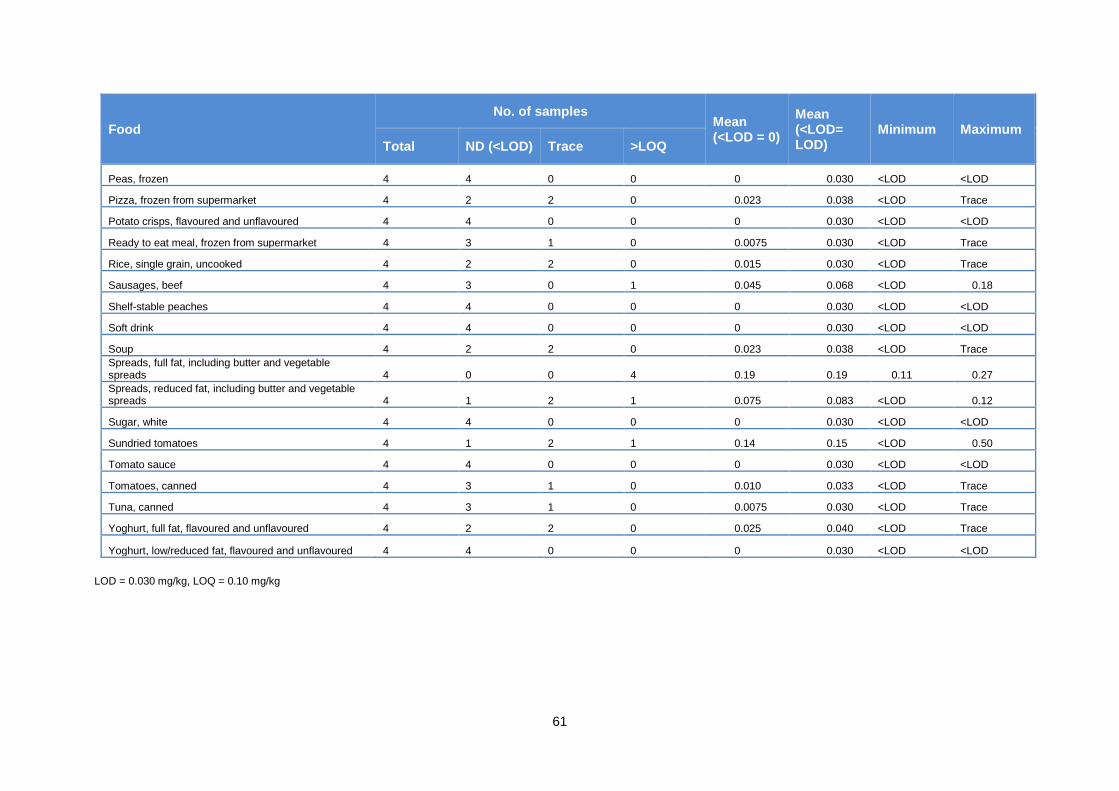
61
Food
No. of samples Mean (<LOD = 0)
Mean (<LOD= LOD)
Minimum Maximum
Total ND (<LOD) Trace >LOQ
Peas, frozen 4 4 0 0 0 0.030 <LOD <LOD
Pizza, frozen from supermarket 4 2 2 0 0.023 0.038 <LOD Trace
Potato crisps, flavoured and unflavoured 4 4 0 0 0 0.030 <LOD <LOD
Ready to eat meal, frozen from supermarket 4 3 1 0 0.0075 0.030 <LOD Trace
Rice, single grain, uncooked 4 2 2 0 0.015 0.030 <LOD Trace
Sausages, beef 4 3 0 1 0.045 0.068 <LOD 0.18
Shelf-stable peaches 4 4 0 0 0 0.030 <LOD <LOD
Soft drink 4 4 0 0 0 0.030 <LOD <LOD
Soup 4 2 2 0 0.023 0.038 <LOD Trace
Spreads, full fat, including butter and vegetable spreads 4 0 0 4 0.19 0.19 0.11 0.27
Spreads, reduced fat, including butter and vegetable spreads 4 1 2 1 0.075 0.083 <LOD 0.12
Sugar, white 4 4 0 0 0 0.030 <LOD <LOD
Sundried tomatoes 4 1 2 1 0.14 0.15 <LOD 0.50
Tomato sauce 4 4 0 0 0 0.030 <LOD <LOD
Tomatoes, canned 4 3 1 0 0.010 0.033 <LOD Trace
Tuna, canned 4 3 1 0 0.0075 0.030 <LOD Trace
Yoghurt, full fat, flavoured and unflavoured 4 2 2 0 0.025 0.040 <LOD Trace
Yoghurt, low/reduced fat, flavoured and unflavoured 4 4 0 0 0 0.030 <LOD <LOD
LOD = 0.030 mg/kg, LOQ = 0.10 mg/kg
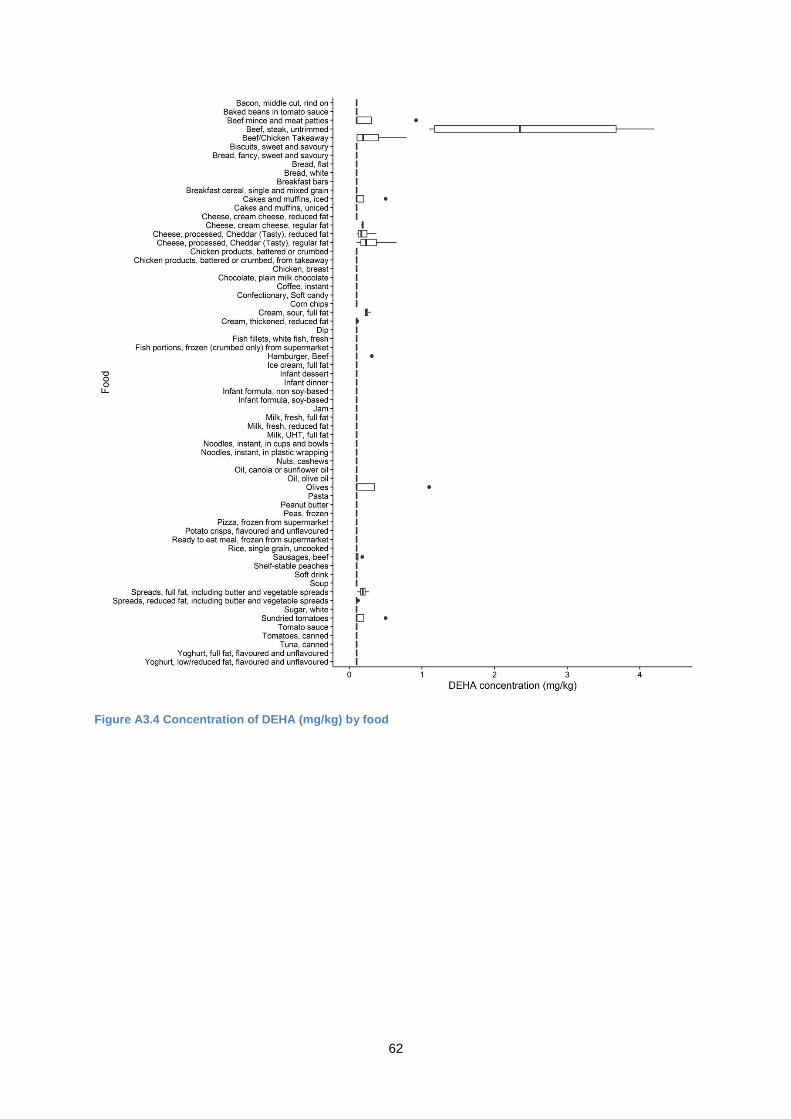
62
Figure A3.4 Concentration of DEHA (mg/kg) by food

63
Table A3 7: Analytical results for ATBC (mg/kg)
Food
No. of samples Mean (<LOD = 0)
Mean (<LOD= LOD)
Minimum Maximum
Total ND (<LOD) Trace >LOQ
Bacon, middle cut, rind on 4 2 0 2 0.22 0.24 <LOD 0.65
Baked beans in tomato sauce 4 0 3 1 0.080 0.080 Trace 0.12
Beef mince and meat patties 4 2 0 2 0.080 0.095 <LOD 0.17
Beef, steak, untrimmed 4 4 0 0 0 0.030 <LOD <LOD
Beef/Chicken Takeaway 4 3 1 0 0.013 0.035 <LOD Trace
Biscuits, sweet and savoury 4 1 1 2 0.18 0.19 <LOD 0.41
Bread, fancy, sweet and savoury 4 1 0 3 0.17 0.18 <LOD 0.26
Bread, flat 4 0 0 4 0.27 0.27 0.15 0.41
Bread, white 4 0 1 3 0.18 0.18 Trace 0.36
Breakfast bars 4 1 0 3 1.1 1.1 <LOD 2.9
Breakfast cereal, single and mixed grain 4 3 1 0 0.023 0.045 <LOD Trace
Cakes and muffins, iced 4 2 1 1 0.070 0.085 <LOD 0.21
Cakes and muffins, uniced 4 1 3 0 0.038 0.045 <LOD Trace
Cheese, cream cheese, reduced fat 4 4 0 0 0 0.030 <LOD <LOD
Cheese, cream cheese, regular fat 4 3 1 0 0.0075 0.030 <LOD Trace
Cheese, processed, Cheddar (Tasty), reduced fat 4 0 0 4 0.84 0.84 0.13 1.3
Cheese, processed, Cheddar (Tasty), regular fat 4 0 0 4 0.77 0.77 0.45 1.3
Chicken products, battered or crumbed 4 2 0 2 0.12 0.13 <LOD 0.28
Chicken products, battered or crumbed, from takeaway 3 1 2 0 0.053 0.063 <LOD Trace
Chicken, breast 4 4 0 0 0 0.030 <LOD <LOD
Chocolate, plain milk chocolate 4 3 1 0 0.0075 0.030 <LOD Trace
Coffee, instant 4 4 0 0 0 0.030 <LOD <LOD
Confectionary, Soft candy 4 2 2 0 0.023 0.038 <LOD Trace

64
Food
No. of samples Mean (<LOD = 0)
Mean (<LOD= LOD)
Minimum Maximum
Total ND (<LOD) Trace >LOQ
Corn chips 4 0 3 1 0.068 0.068 Trace 0.14
Cream, sour, full fat 4 4 0 0 0 0.030 <LOD <LOD
Cream, thickened, reduced fat 4 4 0 0 0 0.030 <LOD <LOD
Dip 4 4 0 0 0 0.030 <LOD <LOD
Fish fillets, white fish, fresh 4 1 3 0 0.057 0.064 <LOD Trace
Fish portions, frozen (crumbed only) from supermarket 4 0 3 1 0.12 0.12 Trace 0.21
Hamburger, Beef 8 7 1 0 0.0075 0.034 <LOD Trace
Ice cream, full fat 4 4 0 0 0 0.030 <LOD <LOD
Infant dessert 4 4 0 0 0 0.030 <LOD <LOD
Infant dinner 4 3 1 0 0.015 0.038 <LOD Trace
Infant formula, non soy-based 4 4 0 0 0 0.030 <LOD <LOD
Infant formula, soy-based 4 4 0 0 0 0.030 <LOD <LOD
Jam 4 4 0 0 0 0.030 <LOD <LOD
Milk, fresh, full fat 4 4 0 0 0 0.030 <LOD <LOD
Milk, fresh, reduced fat 4 3 0 1 0.030 0.053 <LOD 0.12
Milk, UHT, full fat 4 4 0 0 0 0.030 <LOD <LOD
Noodles, instant, in cups and bowls 4 4 0 0 0 0.030 <LOD <LOD
Noodles, instant, in plastic wrapping 3 3 0 0 0 0.030 <LOD <LOD
Nuts, cashews 4 2 1 1 0.14 0.15 <LOD 0.50
Oil, canola or sunflower oil 4 4 0 0 0 0.030 <LOD <LOD
Oil, olive oil 4 4 0 0 0 0.030 <LOD <LOD
Olives 4 0 0 4 8.3 8.3 6.7 9.2
Pasta 4 4 0 0 0 0.030 <LOD <LOD
Peanut butter 4 4 0 0 0 0.030 <LOD <LOD

65
Food
No. of samples Mean (<LOD = 0)
Mean (<LOD= LOD)
Minimum Maximum
Total ND (<LOD) Trace >LOQ
Peas, frozen 4 0 4 0 0.084 0.084 Trace Trace
Pizza, frozen from supermarket 4 3 1 0 0.023 0.045 <LOD Trace
Potato crisps, flavoured and unflavoured 4 0 2 2 0.12 0.12 Trace 0.25
Ready to eat meal, frozen from supermarket 4 3 1 0 0.015 0.038 <LOD Trace
Rice, single grain, uncooked 4 3 1 0 0.018 0.040 <LOD Trace
Sausages, beef 4 2 1 1 0.045 0.060 <LOD 0.11
Shelf-stable peaches 4 3 1 0 0.0075 0.030 <LOD Trace
Soft drink 4 4 0 0 0 0.030 <LOD <LOD
Soup 4 2 1 1 0.053 0.068 <LOD 0.17
Spreads, full fat, including butter and vegetable spreads
4 4 0 0 0 0.030 <LOD <LOD
Spreads, reduced fat, including butter and vegetable spreads
4 3 1 0 0.015 0.038 <LOD Trace
Sugar, white 4 0 0 4 0.41 0.41 0.15 0.74
Sundried tomatoes 4 0 0 4 14 14 7.1 30
Tomato sauce 4 4 0 0 0 0.030 <LOD <LOD
Tomatoes, canned 4 4 0 0 0 0.030 <LOD <LOD
Tuna, canned 4 0 0 4 0.36 0.36 0.18 0.47
Yoghurt, full fat, flavoured and unflavoured 4 4 0 0 0 0.030 <LOD <LOD
Yoghurt, low/reduced fat, flavoured and unflavoured 4 4 0 0 0 0.030 <LOD <LOD
LOD = 0.030 mg/kg, LOQ = 0.10 mg/kg

66
Figure A3.1 Concentration of ATBC (mg/kg) by food
67
Appendix 4: Estimating dietary exposures
What is dietary modelling?
Dietary modelling is a tool used to estimate the intake of nutrients or dietary exposure to agricultural and veterinary chemical residues, contaminants and other substances from the diet. To estimate dietary exposure12 to food chemicals, food consumption data are combined with food chemical concentration data (Error! Reference source not found.). Equation 1 - Dietary exposure calculation
International expert bodies, the Food and Agriculture Organization of the United Nations (FAO) and the WHO, have used dietary modelling techniques for many years to determine if dietary exposures to specific food chemicals pose a potential risk to public health and safety (FAO/WHO, 2009). A dietary exposure assessment is an important part of the risk analysis process in support of surveillance activities as it translates the chemical concentration data for individual foods into dietary exposure estimates that can be compared to relevant HBGVs in order to assess any risks to public health and safety. While a dietary exposure assessment is a systematic scientific method for estimating the amounts of food chemicals to which a population may be exposed, the accuracy of these estimates depends on the quality of the chemical concentration and food consumption data available for use.
How the dietary modelling was conducted
For the Survey of Plasticisers in Australian Foods, dietary modelling was conducted using FSANZ’s custom developed computer program Harvest, which was designed to automate dietary exposure calculations. Harvest multiplied the assigned chemical concentration for each food consumed in the national nutrition survey with the amount of that food that each survey respondent consumed to estimate each individual’s exposure to that chemical from each food. Once this had been completed for all foods determined as containing a particular chemical, the total amount of the chemical consumed from all foods was summed for each individual. Population statistics (e.g. mean and 90th percentile exposures) for several age groups were derived from the individuals’ ranked exposures. Where the results are expressed on a bodyweight basis, each individual’s exposure from all foods was divided by their own bodyweight before population summary statistics were derived. The use of Harvest for dietary modelling brings many benefits. Harvest enables the dietary exposure assessments to be conducted using actual diets, as recorded in national nutrition surveys, in place of the ‘average’ diets which were used prior to the 19th ATDS. The use of specific food consumption data greatly improves the reliability and accuracy of the dietary exposure estimates and takes account of the different eating patterns of consumers. Once dietary exposure to the chemical from the total diet had been estimated, this is compared to relevant HBGVs to assess the potential risk to human health.
12 By convention, the term ‘intake’ is used to refer to estimates of dietary exposure to nutrients.
Dietary Exposure = food chemical concentration x food consumption amount

68
Food consumption data
The 2011–12 NNPAS undertaken by the Australian Bureau of Statistics is the most recent food consumption data for Australia. This survey includes dietary patterns of a sample of 12,153 Australians aged from 2 years and above. There were approximately 5,740 individual foods and beverages reported as consumed in the 2011-12 NNPAS. The survey used a 24-hour recall method for all respondents, with 64% of respondents also completing a second 24-hour recall on a second, non-consecutive day. The data were collected from May 2011 to June 2012 (with no enumeration between August and September 2011 due to the Census). Day 1 and Day 2 24-hour recall data for respondents were used for this assessment. There were 7735 respondents with two days of data, and these were averaged for estimating dietary exposure for this assessment. A separate set of sample weights are used for the 7735 respondents with two days of data to ensure that when using this subset, they are representative of the Australian population. Consumption and respondent data from the survey were incorporated into the Harvest program from the Confidentialised Unit Record Files (CURF) data set (ABS, 2014).
Number of respondents in each of the population groups assessed
A range of population groups were assessed including infants, children and adults. Table A4.1 shows the number of individuals in each age group assessed.
Table A4.1: Number of respondents and mean bodyweight for each age group assessed
Age group No. of respondents (2 day average)
Mean bodyweight (kg)
9 months
8.9
2-5 years* 398 18
6-12 years* 715 36
13-16 years* 419 60
17 years & above* 6203 78
* derived using the 2011–12 Australian National Nutrition and Physical Activity Survey
Construction of the model diet for 9 month old infants
By the age of 9 months, most infants will be consuming a mixed diet and will be exposed to food chemicals from a range of foods in addition to human breast milk and/or infant formula. To enable food chemical exposures for 9 month old infants to be estimated a model diet was constructed. The model diet was based on recommended energy intakes, mean bodyweight, the proportion of milk and solid foods in the diet for a 9 month old infant and 2011-12 NNPAS data on foods consumed by a two year old child. The recommended energy intake for a 9 month old boy (FAO, 2004) at the 50th percentile weight (WHO, 2006) (2936 kJ/day) was used as the basis for the model diet. Boys’ weights were used as boys tend to be heavier than girls at the same age and therefore have higher energy and food requirements. The bodyweight of a 50th percentile 9 month old boy was 8.9 kg. It was assumed that 50% of energy intake was derived from infant formula and 50% from solids and other fluids (Hitchcock et al, 1986). The patterns of consumption of a two year old child from the 2011-12 NNPAS survey were scaled down and used to determine the 50% solid and other fluids portion of the 9 month old infant’s diet. As two year olds consume many foods that are not appropriate for infants, these foods need to be taken out of the infant diet and the energy intake from those foods attributed to the remaining foods. Certain foods such as nuts and coffee were removed from the diet since nuts are not recommended for infants
69
because of choking risk (NHMRC, 2003) and coffee is unsuitable for infant consumption (ACT Community Care, 2000). Bran is not recommended in the diet of infants due to the potential interference with the absorption of minerals (The Children's Hospital at Westmead, 2008) and to the immaturity of the infant gut (H.J Heinz, 2010a). For this reason, consumption of breakfast cereals is usually assumed to be in the form of either infant cereal or single grain breakfast cereals. As no infant specific cereal was sampled for this survey, consumption of mixed grain cereals could not be substituted to it. Furthermore, as the packing type was similar and the survey’s focus was on migrating chemicals from packaging, mixed grain breakfast cereals were not excluded from the model infant diet. Since cow’s milk is not recommended as the main milk source for children aged less than 12 months of age (NHMRC, 2003; H.J Heinz, 2010b), all milk consumption was assumed to be in the form of infant formula. As the model diet is based on mean food consumption amounts only for all nutrition survey respondents, a distribution of food consumption was not available and hence, a distribution of food chemical exposures was not able to be produced. Therefore, the 90th percentile dietary exposures were estimated using the calculation shown in Equation A4 1 below. Exposures were then compared to the relevant HBGVs. Equation A4 1: 90th percentile dietary exposure calculation for the 9 month old infant model diet
* (WHO, 1985)
Respondents versus consumers
Estimates of dietary exposure can be calculated for all survey respondents or only for those who reported consuming a food containing the chemical on the day of the survey (‘consumers’). This study reports exposure estimates for ‘consumers’. The plasticisers investigated in this study are distributed across a wide range of foods and are frequently consumed by all members of the population. The number and proportion of consumers in each age group is provided in Table A5.1.
Use of median food chemical concentration values
The median concentration is typically used for estimating dietary exposure to ubiquitous environmental contaminants, such as phthalates, which may be consistently present in foods at low levels. In these cases, the median generally represents the most likely concentration in a given food and avoids an over-estimation of exposure. This is because median concentrations are less likely to be affected by a small number of high detections or ‘outliers’ above the normally expected range. Using the median concentration also removes much uncertainty about dealing with results below the LOR as it typically reflects an actual analysed value. The median is most effective when the majority of foods have 50% or more positive detections (above the LOR). However, in cases where less than 50% of results are above the LOR for a given food, the median concentration for modelling purposes is a non-detect, whereas the mean concentration may have a numerical value. The median concentration in an analysed food was also carried over to all of the mixed foods in which it was used as an ingredient based on FSANZs recipe dataset for mixed foods.
90th percentile exposure = mean exposure x 2*

70
Food mapping
Mapping is the process of matching the foods analysed in the Plasticisers survey to the foods consumed in the national nutrition survey. Given that the Plasticisers survey could not capture all foods consumed in the national nutrition survey, mapping is a major step in the dietary exposure assessment process. Mapping can be based on the composition or likely contamination of a food. Due to the relatively high potential of processed foods to be exposed to plasticisers in food packaging materials and processing equipment, mapping was based on the Food Additive classification system. This classification system is used by FSANZ for other food additive dietary exposure assessments. Since food additives are specifically added to foods during processing and are therefore usually in a restricted range of processed foods and beverages, and the foods analysed matched closely with the food groups in this classification system, using the food additive classifications was deemed the most appropriate for estimating plasticiser dietary exposures. Due to the lack of data on packaging type in the 2011-12 NNPAS, Plasticiser survey foods which were sampled in two different packing types, (i.e. instant noodles and hamburgers), were unable to be differentiated in the mapping process so were included in the same food group for the dietary exposure assessment. The mapping process is explained in detail below. Dietary exposure results have been presented in terms of the group of foods that the survey food represents, rather than as the individual survey food itself (e.g. the Plasticiser survey food ‘Bacon, middle cut, rind on’ is referred to as ‘Cured or fermented deli meats (excluded canned meats) in the plasticiser dietary exposure assessment results). There were three types of mapping used for plasticiser dietary exposure estimates:
1. Direct mapping – where the Plasticiser survey foods were directly matched to a corresponding Food Additive Classification which contained the analysed food and comparable foods with similar packaging type, from the 2011-12 NNPAS (e.g. the Plasticiser survey food ‘Bacon, middle cut, rind on’, was mapped to ‘Cured meat’ and ‘Fermented, uncooked, processed comminute meat products’ using the assumption that any migrating chemicals from packaging present in bacon are the same in all cured and fermented meats with similar packaging).
2. Mapping using custom classifications – where a Plasticiser survey food could not be directly mapped to a suitable Food Additive Classification, a customised classification group was developed and the appropriate 2011-12 NNPAS foods assigned to the classification (e.g. the classification ‘Canned legumes’ was created and all the 2011-12 NNPAS canned legumes such as ‘Bean, cannellini, canned, drained’ and ‘Chickpea, canned, drained’ were allocated to this new classification group).
3. Recipes – used where a food consumed in the 2011-12 NNPAS was composed of more than one analysed survey food (e.g. the 2011-12 NNPAS food ‘Curry, commercial, beef, tomato based sauce’ is made up of the survey foods ‘Beef, steak, untrimmed’, ‘tomatoes, canned’ and ‘Oil, Canola oil or sunflower oil’). These mixed foods were not mapped directly but a recipe is used to disaggregate the consumption to the relevant components.
Details of the Plasticiser survey foods and the 2011-12 NNPAS foods that they represent, and the group name used for reporting purposes are provided in Appendix 8: Mapping.

71
Food contribution calculations
Throughout the report, information regarding the major food contributors to the dietary exposure to plasticisers has been presented. To obtain an indication of the contribution each food group made to total estimated exposures, the sum of all individuals’ two day average exposures from one food group was divided by the sum of all individuals’ two day average exposures from all foods containing the plasticisers assessed, and multiplied by 100. All contributors are calculated using the lower bound ND=0 scenario. In this scenario, for individual foods where more than 50% results were non-detects, a median concentration of zero was assigned so the food would not be listed as a contributor to estimated total dietary exposure. There is no direct association between the analytical concentration of a phthalate, adipate or citrate in an analysed food and its identification as a major contributor to dietary exposure. Even if a food contains a relatively high concentration of a particular plasticiser, the amount of the food consumed, the mapping process and the number of individuals that were exposed to the plasticiser, will determine its level of contribution.

72
Appendix 5: Median Plasticiser concentrations (mg/kg) in foods for dietary exposure assessment
Table A5.1 – Median plasticiser concentrations (mg/kg) in analysed survey foods
Food DEHP DINP BBP DBP DIDP DEHA ATBC
LB UB LB UB LB UB LB UB LB UB LB UB LB UB
Bacon, middle cut, rind on
0.048 0.064 0.45 0.45 0 0.03 0 0.03 0 0.17 0 0.03 0.12 0.14
Baked beans in tomato sauce
0 0.03 0 0.17 0 0.03 0 0.03 0 0.17 0 0.03 0.08 0.08
Beef mince and meat patties
0 0.03 0 0.17 0 0.03 0 0.03 0 0.17 0.02 0.035 0.075 0.09
Beef, steak, untrimmed 0 0.03 0 0.17 0 0.03 0 0.03 0 0.17 2.4 2.4 0 0.03
Beef/Chicken Takeaway 0.015 0.03 0.12 0.20 0 0.03 0 0.03 0 0.17 0.19 0.19 0 0.03
Biscuits, sweet and savoury
0.075 0.075 0 0.17 0 0.03 0 0.03 0 0.17 0 0.03 0.16 0.16
Bread, fancy, sweet and savoury
0.06 0.06 0 0.17 0 0.03 0 0.03 0 0.17 0 0.03 0.21 0.21
Bread, flat 0.045 0.06 0 0.17 0 0.03 0 0.03 0 0.17 0 0.03 0.25 0.25
Bread, white 0 0.03 0 0.17 0 0.03 0 0.03 0 0.17 0 0.03 0.15 0.15
Breakfast bars 0.075 0.075 0 0.17 0 0.03 0 0.03 0 0.17 0 0.03 0.74 0.74
Breakfast cereal, single and mixed grain
0.04 0.04 0 0.17 0 0.03 0.05 0.05 0 0.17 0 0.03 0 0.03
Cakes and muffins, iced 0.075 0.075 0.28 0.28 0 0.03 0 0.03 0 0.17 0.02 0.035 0.035 0.05
Cakes and muffins, uniced
0.12 0.12 0.12 0.20 0 0.03 0 0.03 0 0.17 0.02 0.035 0.045 0.045
Cheese, cream cheese, reduced fat
0 0.03 0 0.17 0 0.03 0 0.03 0 0.17 0.08 0.08 0 0.03
Cheese, cream cheese, regular fat
0.015 0.03 0 0.17 0 0.03 0 0.03 0 0.17 0.18 0.18 0 0.03
Cheese, processed, Cheddar (Tasty), reduced fat
0.055 0.055 0 0.17 0 0.03 0 0.03 0 0.17 0.16 0.16 0.97 0.97
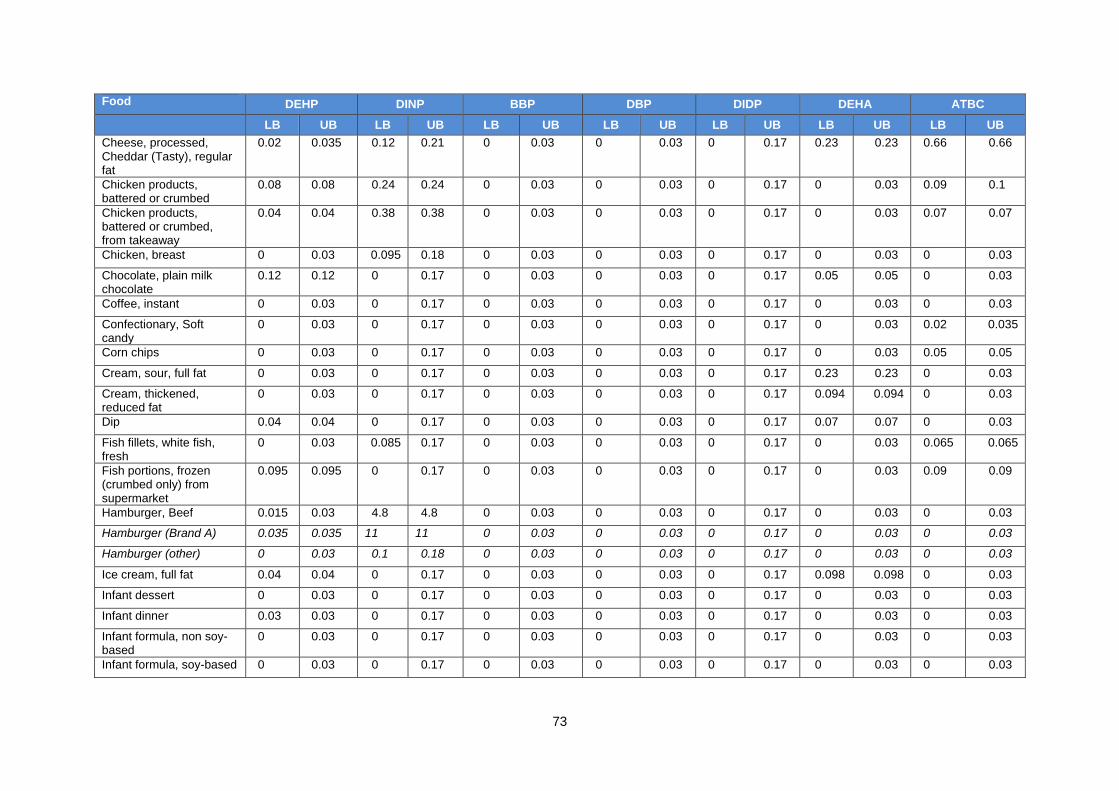
73
Food DEHP DINP BBP DBP DIDP DEHA ATBC
LB UB LB UB LB UB LB UB LB UB LB UB LB UB
Cheese, processed, Cheddar (Tasty), regular fat
0.02 0.035 0.12 0.21 0 0.03 0 0.03 0 0.17 0.23 0.23 0.66 0.66
Chicken products, battered or crumbed
0.08 0.08 0.24 0.24 0 0.03 0 0.03 0 0.17 0 0.03 0.09 0.1
Chicken products, battered or crumbed, from takeaway
0.04 0.04 0.38 0.38 0 0.03 0 0.03 0 0.17 0 0.03 0.07 0.07
Chicken, breast 0 0.03 0.095 0.18 0 0.03 0 0.03 0 0.17 0 0.03 0 0.03
Chocolate, plain milk chocolate
0.12 0.12 0 0.17 0 0.03 0 0.03 0 0.17 0.05 0.05 0 0.03
Coffee, instant 0 0.03 0 0.17 0 0.03 0 0.03 0 0.17 0 0.03 0 0.03
Confectionary, Soft candy
0 0.03 0 0.17 0 0.03 0 0.03 0 0.17 0 0.03 0.02 0.035
Corn chips 0 0.03 0 0.17 0 0.03 0 0.03 0 0.17 0 0.03 0.05 0.05
Cream, sour, full fat 0 0.03 0 0.17 0 0.03 0 0.03 0 0.17 0.23 0.23 0 0.03
Cream, thickened, reduced fat
0 0.03 0 0.17 0 0.03 0 0.03 0 0.17 0.094 0.094 0 0.03
Dip 0.04 0.04 0 0.17 0 0.03 0 0.03 0 0.17 0.07 0.07 0 0.03
Fish fillets, white fish, fresh
0 0.03 0.085 0.17 0 0.03 0 0.03 0 0.17 0 0.03 0.065 0.065
Fish portions, frozen (crumbed only) from supermarket
0.095 0.095 0 0.17 0 0.03 0 0.03 0 0.17 0 0.03 0.09 0.09
Hamburger, Beef 0.015 0.03 4.8 4.8 0 0.03 0 0.03 0 0.17 0 0.03 0 0.03
Hamburger (Brand A) 0.035 0.035 11 11 0 0.03 0 0.03 0 0.17 0 0.03 0 0.03
Hamburger (other) 0 0.03 0.1 0.18 0 0.03 0 0.03 0 0.17 0 0.03 0 0.03
Ice cream, full fat 0.04 0.04 0 0.17 0 0.03 0 0.03 0 0.17 0.098 0.098 0 0.03
Infant dessert 0 0.03 0 0.17 0 0.03 0 0.03 0 0.17 0 0.03 0 0.03
Infant dinner 0.03 0.03 0 0.17 0 0.03 0 0.03 0 0.17 0 0.03 0 0.03
Infant formula, non soy-based
0 0.03 0 0.17 0 0.03 0 0.03 0 0.17 0 0.03 0 0.03
Infant formula, soy-based 0 0.03 0 0.17 0 0.03 0 0.03 0 0.17 0 0.03 0 0.03

74
Food DEHP DINP BBP DBP DIDP DEHA ATBC
LB UB LB UB LB UB LB UB LB UB LB UB LB UB
Jam 0 0.03 0 0.17 0 0.03 0 0.03 0 0.17 0 0.03 0 0.03
Milk, fresh, full fat 0 0.03 0 0.17 0 0.03 0 0.03 0 0.17 0 0.03 0 0.03
Milk, fresh, reduced fat 0 0.03 0 0.17 0 0.03 0 0.03 0 0.17 0 0.03 0 0.03
Milk, UHT, full fat 0 0.03 0 0.17 0 0.03 0 0.03 0 0.17 0 0.03 0 0.03
Noodles, instant 0 0.03 0 0.17 0 0.03 0 0.03 0 0.17 0 0.03 0 0.03
Nuts, cashews 0.52 0.52 0 0.17 0 0.03 0 0.03 0 0.17 0 0.03 0.025 0.04
Oil, canola or sunflower oil
0.11 0.11 0.32 0.32 0 0.03 0 0.03 0 0.17 0 0.03 0 0.03
Oil, olive oil 1.4 1.4 1.2 1.2 0.025 0.04 0 0.03 0.21 0.30 0.04 0.04 0 0.03
Olives 0.11 0.11 0.38 0.38 0 0.03 0 0.03 0 0.17 0.02 0.035 8.7 8.7
Pasta 0 0.03 0 0.17 0 0.03 0 0.03 0 0.17 0 0.03 0 0.03
Peanut butter 0.28 0.28 0 0.17 0.02 0.035 0 0.03 0 0.17 0 0.03 0 0.03
Peas, frozen 0.08 0.08 0 0.17 0 0.03 0 0.03 0 0.17 0 0.03 0.085 0.085
Pizza, frozen from supermarket
0.14 0.14 0.8 0.8 0 0.03 0 0.03 0 0.17 0.015 0.03 0 0.03
Potato crisps, flavoured and unflavoured
0 0.03 0 0.17 0 0.03 0 0.03 0 0.17 0 0.03 0.09 0.09
Ready to eat meal, frozen from supermarket
0.045 0.045 0 0.17 0 0.03 0 0.03 0 0.17 0 0.03 0 0.03
Rice, single grain, uncooked
0.09 0.09 0 0.17 0 0.03 0 0.03 0 0.17 0.015 0.03 0 0.03
Sausages, beef 0.075 0.09 0 0.17 0 0.03 0 0.03 0 0.17 0 0.03 0.035 0.05
Shelf-stable peaches 0 0.03 0 0.17 0 0.03 0 0.03 0 0.17 0 0.03 0 0.03
Soft drink 0 0.03 0 0.17 0 0.03 0 0.03 0 0.17 0 0.03 0 0.03
Soup 0.07 0.085 0 0.17 0 0.03 0 0.03 0 0.17 0.02 0.035 0.02 0.035
Spreads, full fat, including butter and vegetable spreads
0.14 0.14 0.1 0.19 0 0.03 0 0.03 0 0.17 0.18 0.18 0 0.03
Spreads, reduced fat, including butter and vegetable spreads
0.035 0.035 0.085 0.17 0 0.03 0 0.03 0 0.17 0.09 0.09 0 0.03
Sugar, white 0.02 0.035 0 0.17 0 0.03 0 0.03 0 0.17 0 0.03 0.38 0.38
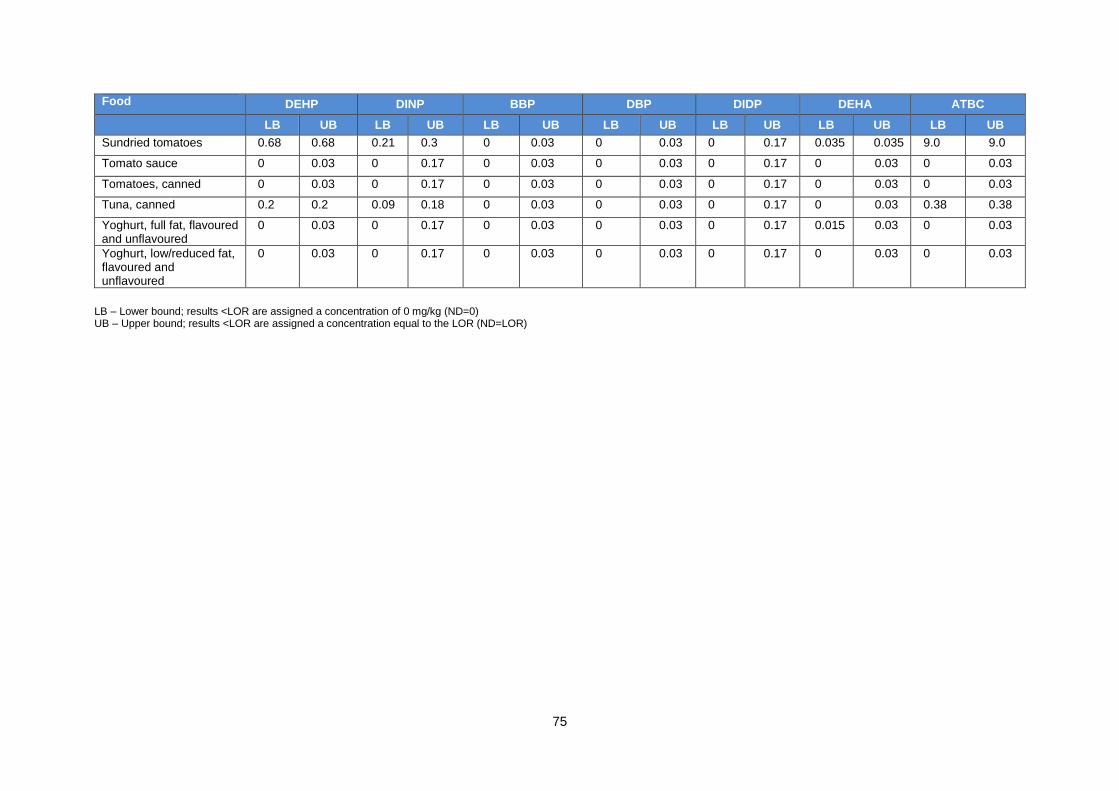
75
Food DEHP DINP BBP DBP DIDP DEHA ATBC
LB UB LB UB LB UB LB UB LB UB LB UB LB UB
Sundried tomatoes 0.68 0.68 0.21 0.3 0 0.03 0 0.03 0 0.17 0.035 0.035 9.0 9.0
Tomato sauce 0 0.03 0 0.17 0 0.03 0 0.03 0 0.17 0 0.03 0 0.03
Tomatoes, canned 0 0.03 0 0.17 0 0.03 0 0.03 0 0.17 0 0.03 0 0.03
Tuna, canned 0.2 0.2 0.09 0.18 0 0.03 0 0.03 0 0.17 0 0.03 0.38 0.38
Yoghurt, full fat, flavoured and unflavoured
0 0.03 0 0.17 0 0.03 0 0.03 0 0.17 0.015 0.03 0 0.03
Yoghurt, low/reduced fat, flavoured and unflavoured
0 0.03 0 0.17 0 0.03 0 0.03 0 0.17 0 0.03 0 0.03
LB – Lower bound; results <LOR are assigned a concentration of 0 mg/kg (ND=0) UB – Upper bound; results <LOR are assigned a concentration equal to the LOR (ND=LOR)

76
Appendix 6: Estimated dietary exposures to plasticisers
Table A6.1 – Estimated dietary exposures to plasticisers at the mean and 90th percentile, derived using median concentrations
Plasticiser Age Group Number of consumers†*
% consum.
to respond.*
Estimated dietary exposures to plasticisers ᶲ ѱ
Mean 90th percentile
µg/day µg/kg bw/day % of TDI µg/day µg/kg bw/day % of TDI
nd=0 nd=LOD nd=0 nd=LO
D nd=0
nd=LOD
nd=0 nd=LOD nd=0 nd=LO
D nd=0 nd=LOD
DEHP
9 monthsᶷ 5 24 <1 2.7 1 5 10 49 1.1 5.5 2 10
2-5 yearsˆ 398 100.0 17 36 1.0 2.1 2 4 31 53 1.8 3.2 4 6
6-12 yearsˆ 715 100.0 25 47 <1 1.4 2 3 41 67 1.3 2.3 3 5
13-16 yearsˆ 419 100.0 26 53 <1 <1 <1 2 47 84 <1 1.4 2 3
17 years & aboveˆ
6201 100.0 29 60 <1 <1 <1 2 53 93 <1 1.3 1 3
DINP
9 monthsᶷ 17 134 1.9 15.0 1 10 33 267 3.8 30.1 3 20
2-5 yrsˆ 396 99.7 55 180 3.2 10.6 2 7 88 257 4.5 16.3 3 10
6-12 yrsˆ 715 100.0 89 242 2.7 7.3 2 5 215 424 6.8 12.7 5 8
13-16 yrsˆ 419 100.0 118 299 2.0 5.2 1 3 464 629 7.7 11.3 5 8
17 yrs & aboveˆ 6174 99.5 99 305 1.3 4.1 <1 3 227 531 2.9 7.1 2 5
BBP
9 monthsᶷ 0.02 22 0.002 2.4 <1 <1 0.04 43 0.004 4.8 <1 1
2-5 yrsˆ 135 33.9 0.11 26 0.006 1.5 <1 <1 0.21 37 0.013 2.3 <1 <1
6-12 yrsˆ 227 31.7 0.16 31 0.005 <1 <1 <1 0.34 47 0.011 1.6 <1 <1
13-16 yrsˆ 116 27.5 0.16 37 0.003 <1 <1 <1 0.50 56 0.008 1.0 <1 <1
17 yrs & aboveˆ 2000 32.2 0.16 41 0.002 <1 <1 <1 0.35 64 0.005 <1 <1 <1
DBP
9 monthsᶷ 0.56 22 <1 2.4 <1 25 1.1 44 <1 4.9 1 50
2-5 yearsˆ 310 77.9 2.0 26 <1 1.5 1 15 4.3 38 <1 2.3 3 25
6-12 yrsˆ 502 70.2 2.7 32 <1 <1 <1 10 4.9 48 <1 1.6 2 15
13-16 yrsˆ 228 54.4 3.3 38 <1 <1 <1 7 7.9 58 <1 1.0 1 10
17 yrs & aboveˆ 3479 56.1 4.5 42 <1 <1 <1 6 12 65 <1 <1 1 9
DIDP 9 monthsᶷ 0.03 122 0.004 13.7 <1 9 0.06 244 0.007 27.4 <1 20
2-5 yrsˆ 95 23.8 0.79 145 0.044 8.5 <1 6 1.28 209 0.067 12.9 <1 9
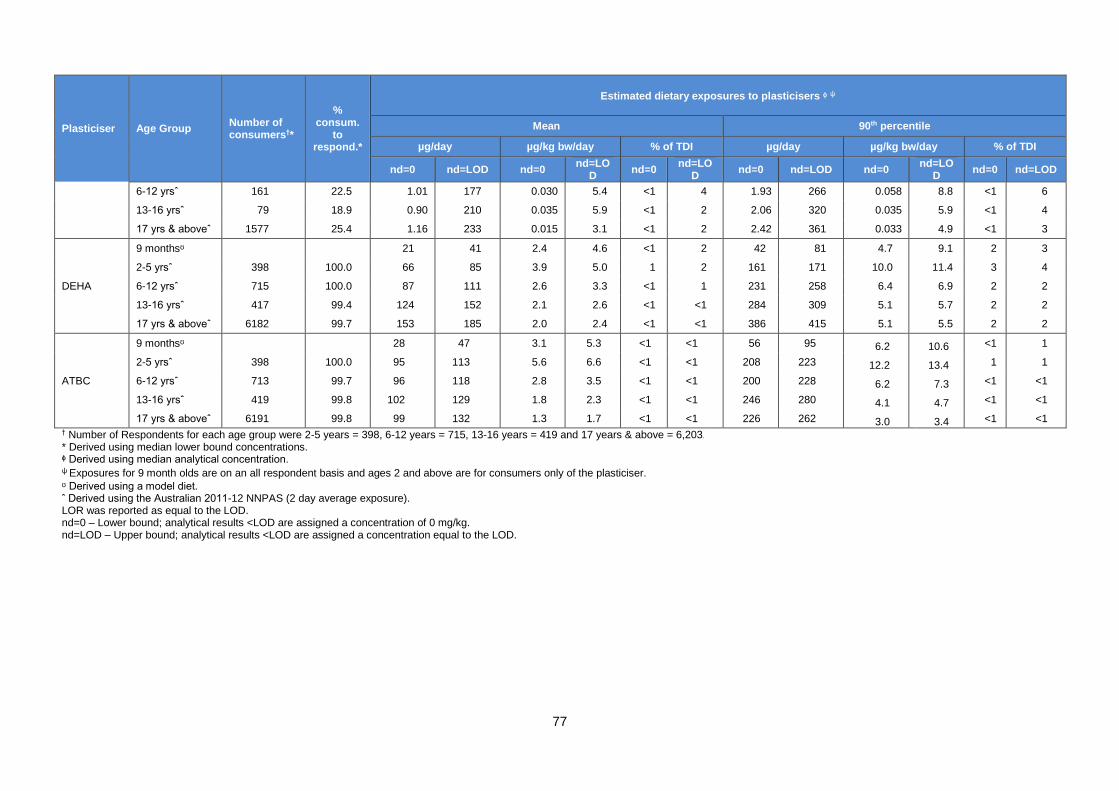
77
Plasticiser Age Group Number of consumers†*
% consum.
to respond.*
Estimated dietary exposures to plasticisers ᶲ ѱ
Mean 90th percentile
µg/day µg/kg bw/day % of TDI µg/day µg/kg bw/day % of TDI
nd=0 nd=LOD nd=0 nd=LO
D nd=0
nd=LOD
nd=0 nd=LOD nd=0 nd=LO
D nd=0 nd=LOD
6-12 yrsˆ 161 22.5 1.01 177 0.030 5.4 <1 4 1.93 266 0.058 8.8 <1 6
13-16 yrsˆ 79 18.9 0.90 210 0.035 5.9 <1 2 2.06 320 0.035 5.9 <1 4
17 yrs & aboveˆ 1577 25.4 1.16 233 0.015 3.1 <1 2 2.42 361 0.033 4.9 <1 3
DEHA
9 monthsᶷ 21 41 2.4 4.6 <1 2 42 81 4.7 9.1 2 3
2-5 yrsˆ 398 100.0 66 85 3.9 5.0 1 2 161 171 10.0 11.4 3 4
6-12 yrsˆ 715 100.0 87 111 2.6 3.3 <1 1 231 258 6.4 6.9 2 2
13-16 yrsˆ 417 99.4 124 152 2.1 2.6 <1 <1 284 309 5.1 5.7 2 2
17 yrs & aboveˆ 6182 99.7 153 185 2.0 2.4 <1 <1 386 415 5.1 5.5 2 2
ATBC
9 monthsᶷ 28 47 3.1 5.3 <1 <1 56 95 6.2 10.6 <1 1
2-5 yrsˆ 398 100.0 95 113 5.6 6.6 <1 <1 208 223 12.2 13.4 1 1
6-12 yrsˆ 713 99.7 96 118 2.8 3.5 <1 <1 200 228 6.2 7.3 <1 <1
13-16 yrsˆ 419 99.8 102 129 1.8 2.3 <1 <1 246 280 4.1 4.7 <1 <1
17 yrs & aboveˆ 6191 99.8 99 132 1.3 1.7 <1 <1 226 262 3.0 3.4 <1 <1 † Number of Respondents for each age group were 2-5 years = 398, 6-12 years = 715, 13-16 years = 419 and 17 years & above = 6,203. * Derived using median lower bound concentrations. ᶲ Derived using median analytical concentration. ѱ Exposures for 9 month olds are on an all respondent basis and ages 2 and above are for consumers only of the plasticiser.
ᶷ Derived using a model diet. ˆ Derived using the Australian 2011-12 NNPAS (2 day average exposure). LOR was reported as equal to the LOD. nd=0 – Lower bound; analytical results <LOD are assigned a concentration of 0 mg/kg. nd=LOD – Upper bound; analytical results <LOD are assigned a concentration equal to the LOD.

78
Table A6.2 – Estimated dietary exposures to DINP at the mean and 90th percentile for Brand-Loyal Hamburger Scenario, derived using median DINP concentration for Brand A Hamburgers
Age Group Number of
consumers†* % consum. to
respond.*
Estimated dietary exposures to DINP ᶲ
Mean 90th percentile
µg/day µg/kg bw/day % of TDI µg/day µg/kg bw/day % of TDI
nd=0 nd=LOD nd=0 nd=LOD nd=0 nd=LOD nd=0 nd=LOD nd=0 nd=LOD nd=0 nd=LOD
9 monthsᶷ 28 145 3.1 16.3 2 10 56 290 6.2 32.5 4 20
2-5 yearsˆ 396 99.7 86 211 5.0 12.4 3 8 88 278 4.8 16.9 3 10
6-12 yreasˆ 715 100.0 149 302 4.5 9.1 3 6 215 614 7.1 15.8 5 10
13-16 yearsˆ 419 100.0 209 390 3.6 6.8 2 5 978 1,197 16.9 19.5 10 15
17 years & aboveˆ
6174 99.5 172 377 2.3 5.0 2 3 238 592 3.1 8.3 2 6
† Number of respondents for each age group were 2-5 years = 398, 6-12 years = 715, 13-16 years = 419 and 17 years & above = 6,203.
* Derived using medium lower bound concentrations.
ᶲ Derived using median analytical concentration.
ᶷ Derived using a model diet.
ˆ Derived using the Australian 2011-12 NNPAS (2 day average exposure).
Brand Loyal Hamburger Scenario based on Brand A Hamburgers median analytical concentration value of 11 mg/kg for DINP.
LOR was reported as equal to the LOD. nd=0 – Lower bound; analytical results <LOD are assigned a concentration of 0 mg/kg. nd=LOD – Upper bound; analytical results <LOD are assigned a concentration equal to the LOD.
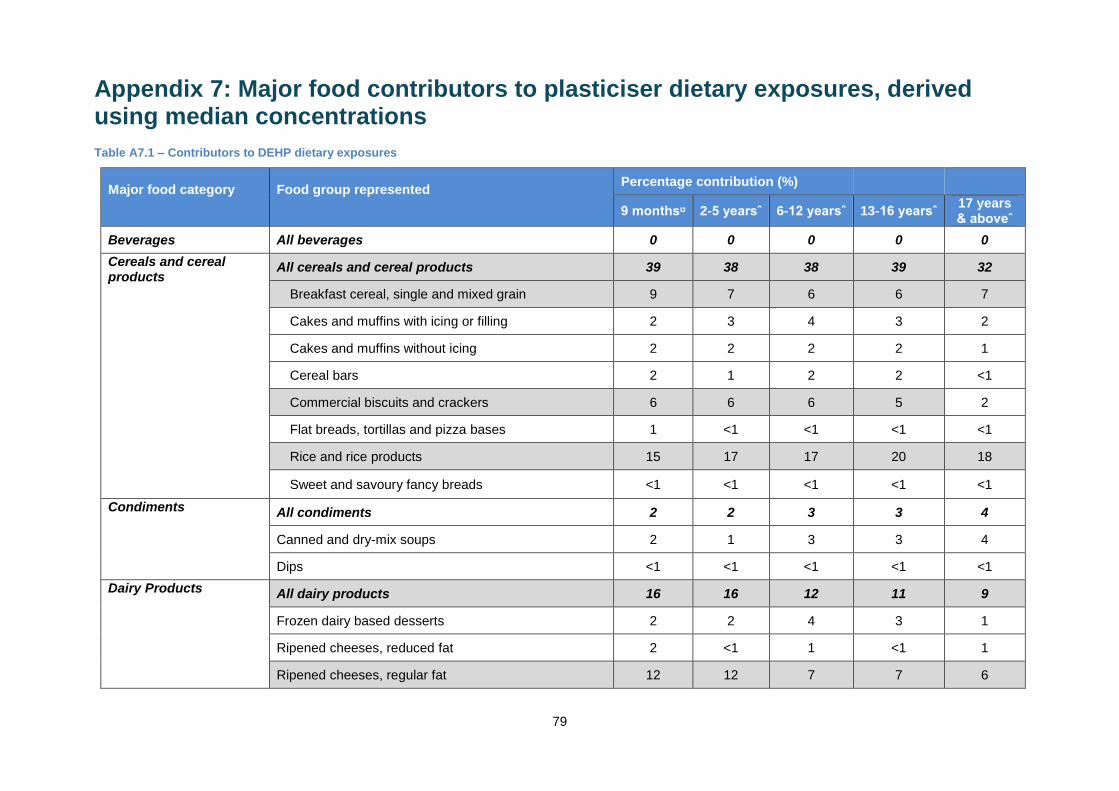
79
Appendix 7: Major food contributors to plasticiser dietary exposures, derived using median concentrations
Table A7.1 – Contributors to DEHP dietary exposures
Major food category
Food group represented
Percentage contribution (%)
9 monthsᶷ 2-5 yearsˆ 6-12 yearsˆ 13-16 yearsˆ 17 years & aboveˆ
Beverages All beverages 0 0 0 0 0
Cereals and cereal products Breakfast cereal, single and mixed grain Cakes and muffins with icing or filling Cakes and muffins without icing Cereal bars Commercial biscuits and crackers Flat breads, tortillas and pizza bases Rice and rice products Sweet and savoury fancy breads
All cereals and cereal products 39 38 38 39 32
Breakfast cereal, single and mixed grain 9 7 6 6 7
Cakes and muffins with icing or filling 2 3 4 3 2
Cakes and muffins without icing 2 2 2 2 1
Cereal bars 2 1 2 2 <1
Commercial biscuits and crackers 6 6 6 5 2
Flat breads, tortillas and pizza bases 1 <1 <1 <1 <1
Rice and rice products 15 17 17 20 18
Sweet and savoury fancy breads <1 <1 <1 <1 <1
Condiments Canned and dry-mix soups Dips
All condiments 2 2 3 3 4
Canned and dry-mix soups 2 1 3 3 4
Dips <1 <1 <1 <1 <1
Dairy Products All dairy products 16 16 12 11 9
Frozen dairy based desserts 2 2 4 3 1
Ripened cheeses, reduced fat 2 <1 1 <1 1
Ripened cheeses, regular fat 12 12 7 7 6
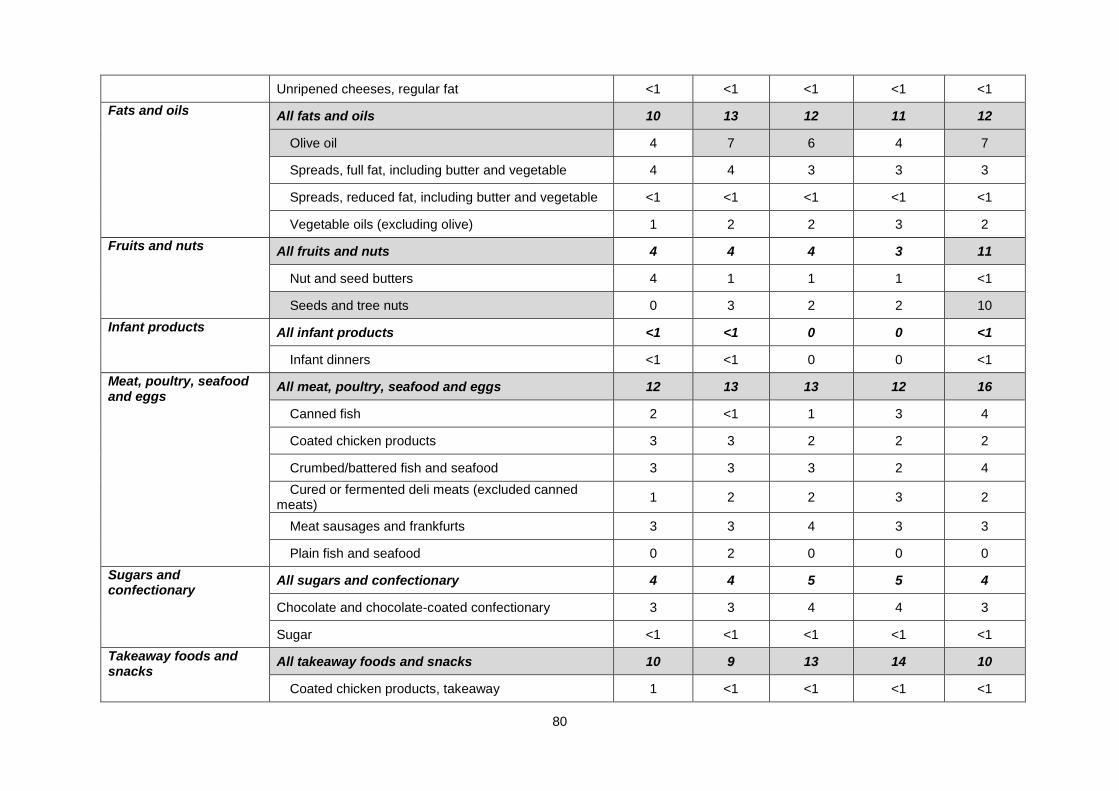
80
Unripened cheeses, regular fat <1 <1 <1 <1 <1
Fats and oils Olive oil
All fats and oils 10 13 12 11 12
Olive oil 4 7 6 4 7
Spreads, full fat, including butter and vegetable 4 4 3 3 3
Spreads, reduced fat, including butter and vegetable <1 <1 <1 <1 <1
Vegetable oils (excluding olive) 1 2 2 3 2
Fruits and nuts Nut and seed butters Seeds and tree nuts
All fruits and nuts 4 4 4 3 11
Nut and seed butters 4 1 1 1 <1
Seeds and tree nuts 0 3 2 2 10
Infant products Infant dinners
All infant products <1 <1 0 0 <1
Infant dinners <1 <1 0 0 <1
Meat, poultry, seafood and eggs
All meat, poultry, seafood and eggs 12 13 13 12 16
Canned fish 2 <1 1 3 4
Coated chicken products 3 3 2 2 2
Crumbed/battered fish and seafood 3 3 3 2 4
Cured or fermented deli meats (excluded canned meats)
1 2 2 3 2
Meat sausages and frankfurts 3 3 4 3 3
Plain fish and seafood 0 2 0 0 0
Sugars and confectionary Chocolate and chocolate-coated confectionary Sugar
All sugars and confectionary 4 4 5 5 4
Chocolate and chocolate-coated confectionary 3 3 4 4 3
Sugar <1 <1 <1 <1 <1
Takeaway foods and snacks
All takeaway foods and snacks 10 9 13 14 10
Coated chicken products, takeaway 1 <1 <1 <1 <1
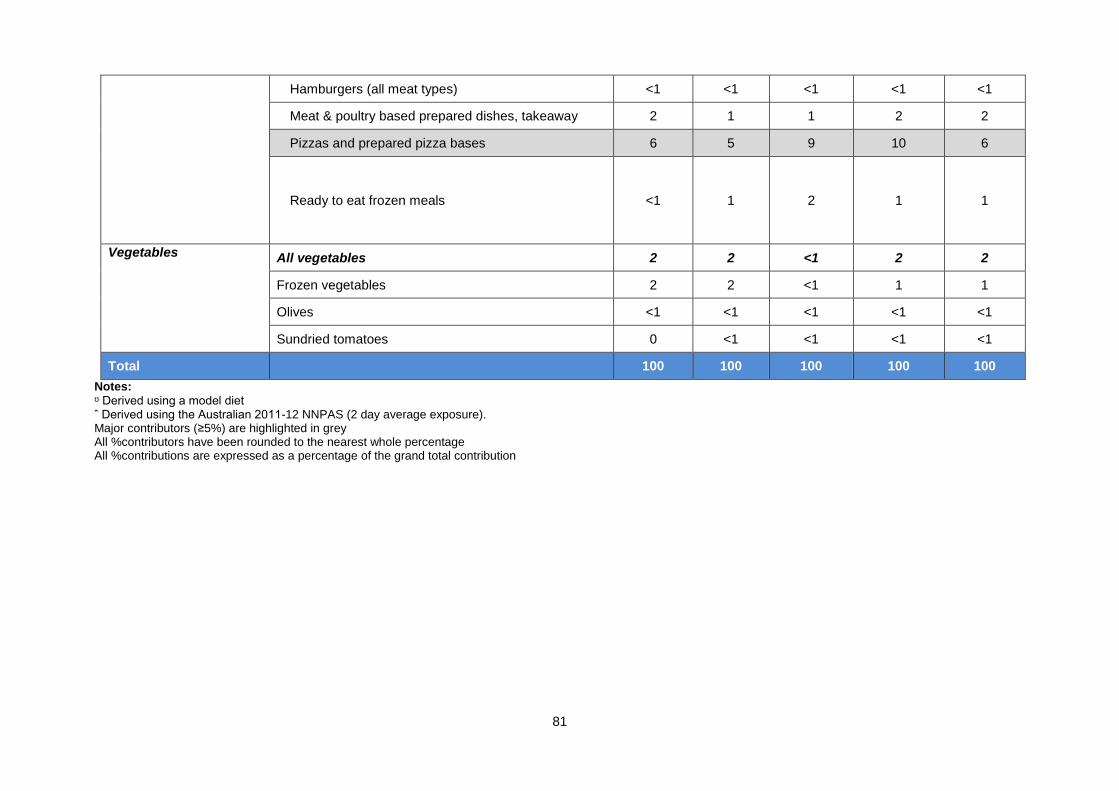
81
Coated chicken products, takeaway Hamburgers (all meat types) Meat & poultry based prepared dishes, takeaway Pizzas and prepared pizza bases Ready to eat frozen meals
Hamburgers (all meat types) <1 <1 <1 <1 <1
Meat & poultry based prepared dishes, takeaway 2 1 1 2 2
Pizzas and prepared pizza bases 6 5 9 10 6
Ready to eat frozen meals <1 1 2 1 1
Vegetables
All vegetables 2 2 <1 2 2
Frozen vegetables 2 2 <1 1 1
Olives <1 <1 <1 <1 <1
Sundried tomatoes 0 <1 <1 <1 <1
Total 100 100 100 100 100
Notes:
ᶷ Derived using a model diet ˆ Derived using the Australian 2011-12 NNPAS (2 day average exposure). Major contributors (≥5%) are highlighted in grey All %contributors have been rounded to the nearest whole percentage All %contributions are expressed as a percentage of the grand total contribution
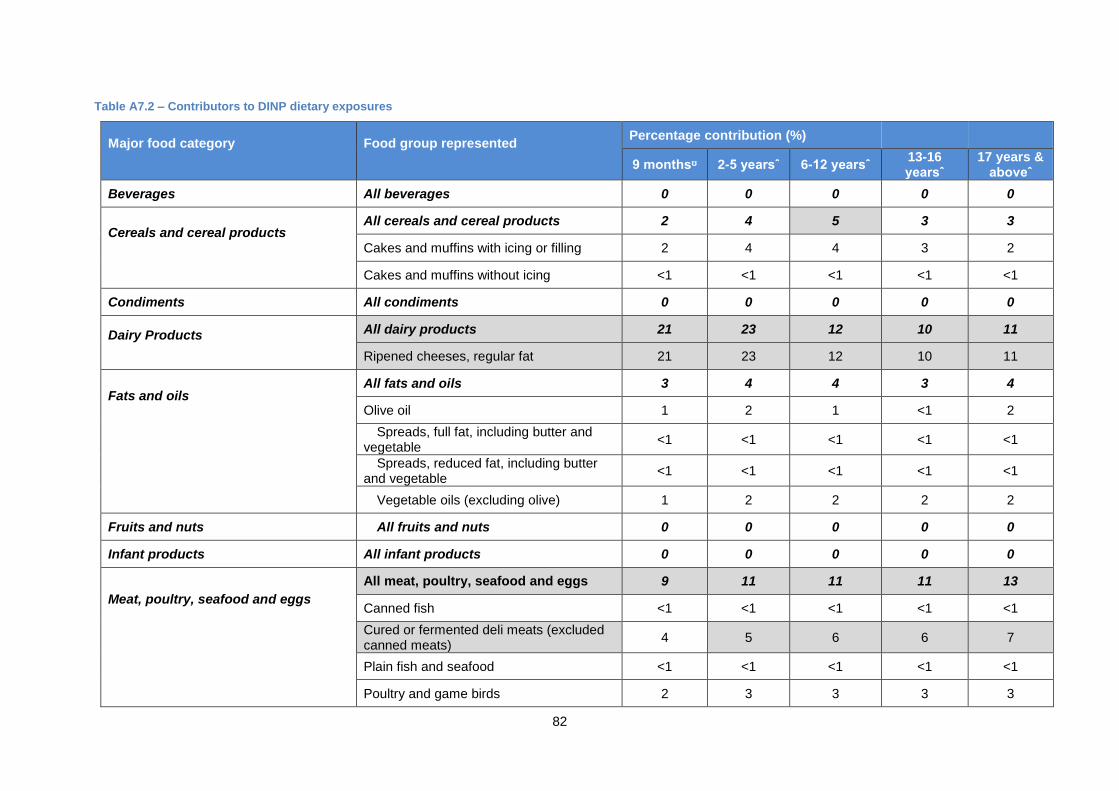
82
Table A7.2 – Contributors to DINP dietary exposures
Major food category
Food group represented
Percentage contribution (%)
9 monthsᶷ 2-5 yearsˆ 6-12 yearsˆ 13-16 yearsˆ
17 years & aboveˆ
Beverages All beverages 0 0 0 0 0
Cereals and cereal products Cakes and muffins with icing or filling Cakes and muffins without icing
All cereals and cereal products 2 4 5 3 3
Cakes and muffins with icing or filling 2 4 4 3 2
Cakes and muffins without icing <1 <1 <1 <1 <1
Condiments All condiments 0 0 0 0 0
Dairy Products Ripened cheeses, regular fat
All dairy products 21 23 12 10 11
Ripened cheeses, regular fat 21 23 12 10 11
Fats and oils Olive oil Spreads, full fat, including butter and vegetable Spreads, reduced fat, including butter and vegetable Vegetable oils (excluding olive)
All fats and oils 3 4 4 3 4
Olive oil 1 2 1 <1 2
Spreads, full fat, including butter and vegetable
<1 <1 <1 <1 <1
Spreads, reduced fat, including butter and vegetable
<1 <1 <1 <1 <1
Vegetable oils (excluding olive) 1 2 2 2 2
Fruits and nuts All fruits and nuts 0 0 0 0 0
Infant products All infant products 0 0 0 0 0
Meat, poultry, seafood and eggs Canned fish Cured or fermented deli meats (excluded canned meats) Plain fish and seafood Poultry and game birds
All meat, poultry, seafood and eggs 9 11 11 11 13
Canned fish <1 <1 <1 <1 <1
Cured or fermented deli meats (excluded canned meats)
4 5 6 6 7
Plain fish and seafood <1 <1 <1 <1 <1
Poultry and game birds 2 3 3 3 3

83
Sugars and confectionary All sugars and confectionary 0 0 0 0 0
Takeaway foods and snacks Coated chicken products, takeaway Hamburgers (all meat types) Meat & poultry based prepared dishes, takeaway Pizzas and prepared pizza bases
All takeaway foods and snacks 64 56 68 72 69
Coated chicken products, takeaway 3 3 2 <1 1
Hamburgers (all meat types) 48 42 50 57 54
Meat & poultry based prepared dishes, takeaway
4 3 3 3 4
Pizzas and prepared pizza bases 10 9 14 12 10
Vegetables Olives Sundried tomatoes
All vegetables <1 <1 <1 <1 <1
Olives <1 <1 <1 <1 <1
Sundried tomatoes 0 <1 <1 <1 <1
Grand Total 100 100 100 100 100
Notes:
ᶷ Derived using a model diet ˆ Derived using the Australian 2011-12 NNPAS (2 day average exposure). Major contributors (≥5%) are highlighted in grey All %contributors have been rounded to the nearest whole percentage All %contributions are expressed as a percentage of the grand total contribution
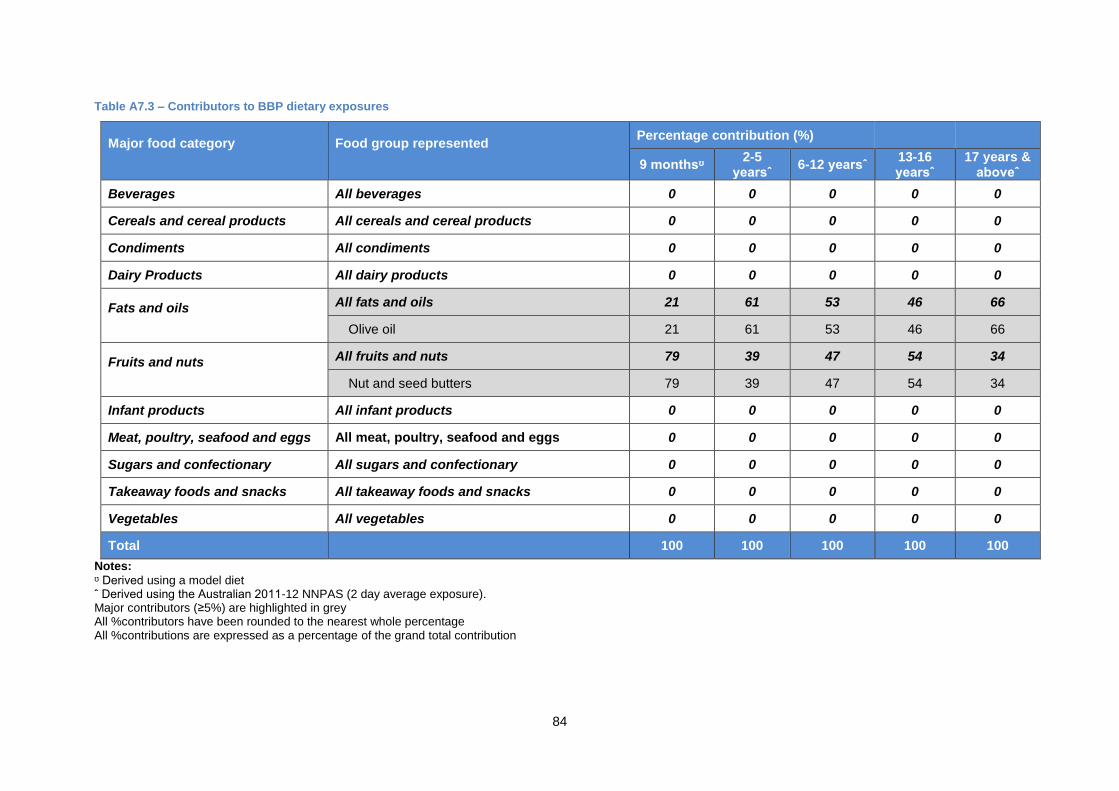
84
Table A7.3 – Contributors to BBP dietary exposures
Major food category
Food group represented
Percentage contribution (%)
9 monthsᶷ 2-5
yearsˆ 6-12 yearsˆ
13-16 yearsˆ
17 years & aboveˆ
Beverages All beverages 0 0 0 0 0
Cereals and cereal products All cereals and cereal products 0 0 0 0 0
Condiments All condiments 0 0 0 0 0
Dairy Products All dairy products 0 0 0 0 0
Fats and oils Olive oil
All fats and oils 21 61 53 46 66
Olive oil 21 61 53 46 66
Fruits and nuts Nut and seed butters
All fruits and nuts 79 39 47 54 34
Nut and seed butters 79 39 47 54 34
Infant products All infant products 0 0 0 0 0
Meat, poultry, seafood and eggs All meat, poultry, seafood and eggs 0 0 0 0 0
Sugars and confectionary All sugars and confectionary 0 0 0 0 0
Takeaway foods and snacks All takeaway foods and snacks 0 0 0 0 0
Vegetables All vegetables 0 0 0 0 0
Total 100 100 100 100 100
Notes:
ᶷ Derived using a model diet ˆ Derived using the Australian 2011-12 NNPAS (2 day average exposure). Major contributors (≥5%) are highlighted in grey All %contributors have been rounded to the nearest whole percentage All %contributions are expressed as a percentage of the grand total contribution
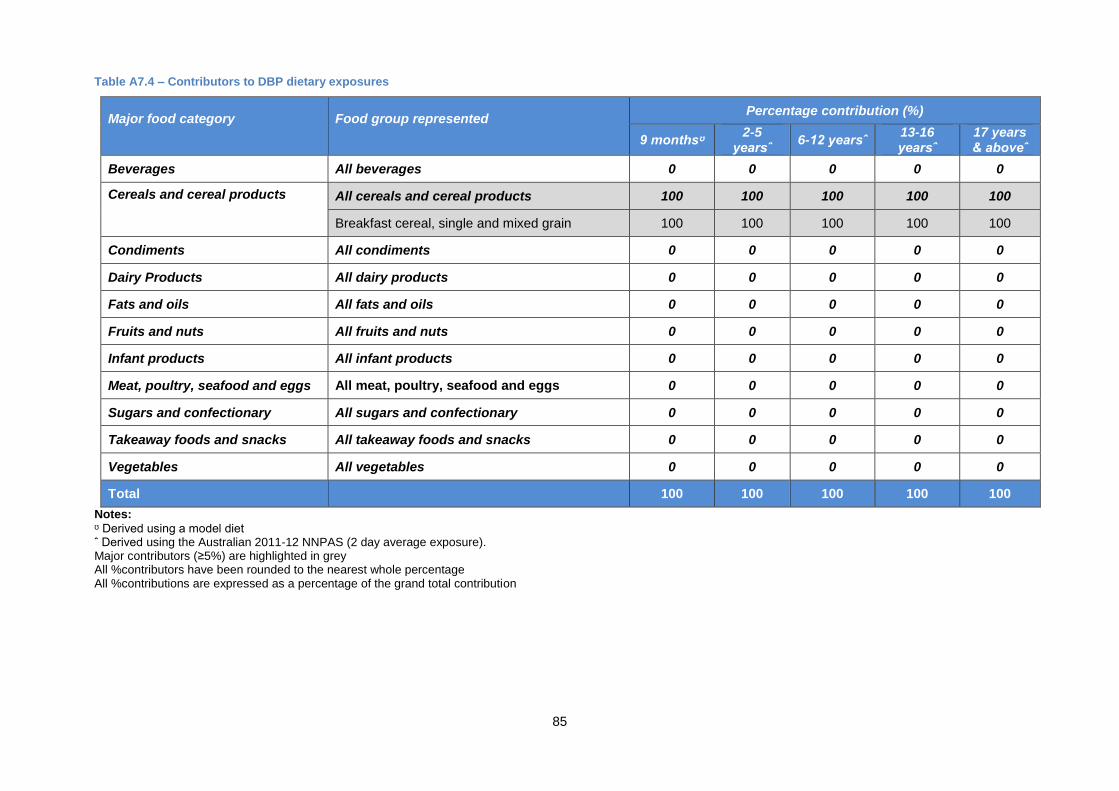
85
Table A7.4 – Contributors to DBP dietary exposures
Major food category
Food group represented
Percentage contribution (%)
9 monthsᶷ 2-5
yearsˆ 6-12 yearsˆ
13-16 yearsˆ
17 years & aboveˆ
Beverages All beverages 0 0 0 0 0
Cereals and cereal products Breakfast cereal, single and mixed grain
All cereals and cereal products 100 100 100 100 100
Breakfast cereal, single and mixed grain 100 100 100 100 100
Condiments All condiments 0 0 0 0 0
Dairy Products All dairy products 0 0 0 0 0
Fats and oils All fats and oils 0 0 0 0 0
Fruits and nuts All fruits and nuts 0 0 0 0 0
Infant products All infant products 0 0 0 0 0
Meat, poultry, seafood and eggs All meat, poultry, seafood and eggs 0 0 0 0 0
Sugars and confectionary All sugars and confectionary 0 0 0 0 0
Takeaway foods and snacks All takeaway foods and snacks 0 0 0 0 0
Vegetables All vegetables 0 0 0 0 0
Total 100 100 100 100 100
Notes:
ᶷ Derived using a model diet ˆ Derived using the Australian 2011-12 NNPAS (2 day average exposure). Major contributors (≥5%) are highlighted in grey All %contributors have been rounded to the nearest whole percentage All %contributions are expressed as a percentage of the grand total contribution
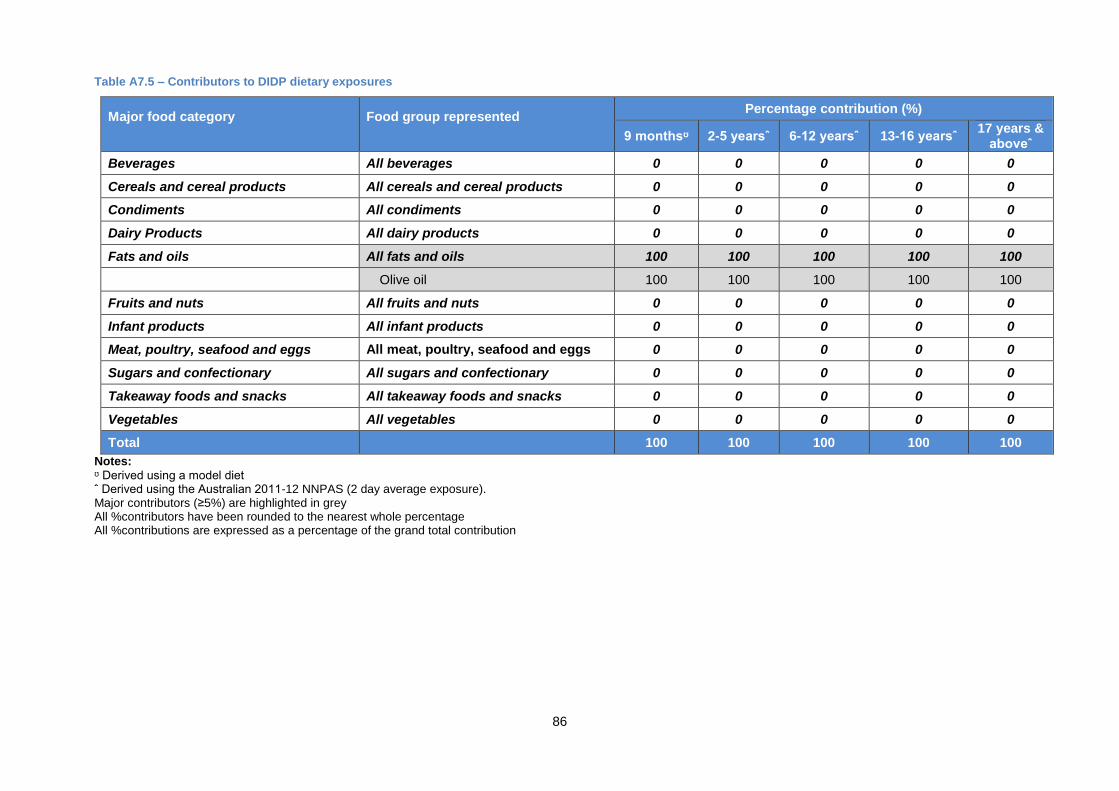
86
Table A7.5 – Contributors to DIDP dietary exposures
Major food category
Food group represented
Percentage contribution (%)
9 monthsᶷ 2-5 yearsˆ 6-12 yearsˆ 13-16 yearsˆ 17 years &
aboveˆ
Beverages All beverages 0 0 0 0 0
Cereals and cereal products All cereals and cereal products 0 0 0 0 0
Condiments All condiments 0 0 0 0 0
Dairy Products All dairy products 0 0 0 0 0
Fats and oils All fats and oils 100 100 100 100 100
Olive oil Olive oil 100 100 100 100 100
Fruits and nuts All fruits and nuts 0 0 0 0 0
Infant products All infant products 0 0 0 0 0
Meat, poultry, seafood and eggs All meat, poultry, seafood and eggs 0 0 0 0 0
Sugars and confectionary All sugars and confectionary 0 0 0 0 0
Takeaway foods and snacks All takeaway foods and snacks 0 0 0 0 0
Vegetables All vegetables 0 0 0 0 0
Total 100 100 100 100 100
Notes:
ᶷ Derived using a model diet ˆ Derived using the Australian 2011-12 NNPAS (2 day average exposure). Major contributors (≥5%) are highlighted in grey All %contributors have been rounded to the nearest whole percentage All %contributions are expressed as a percentage of the grand total contribution

87
Table A7.6 – Contributors to DEHA dietary exposures
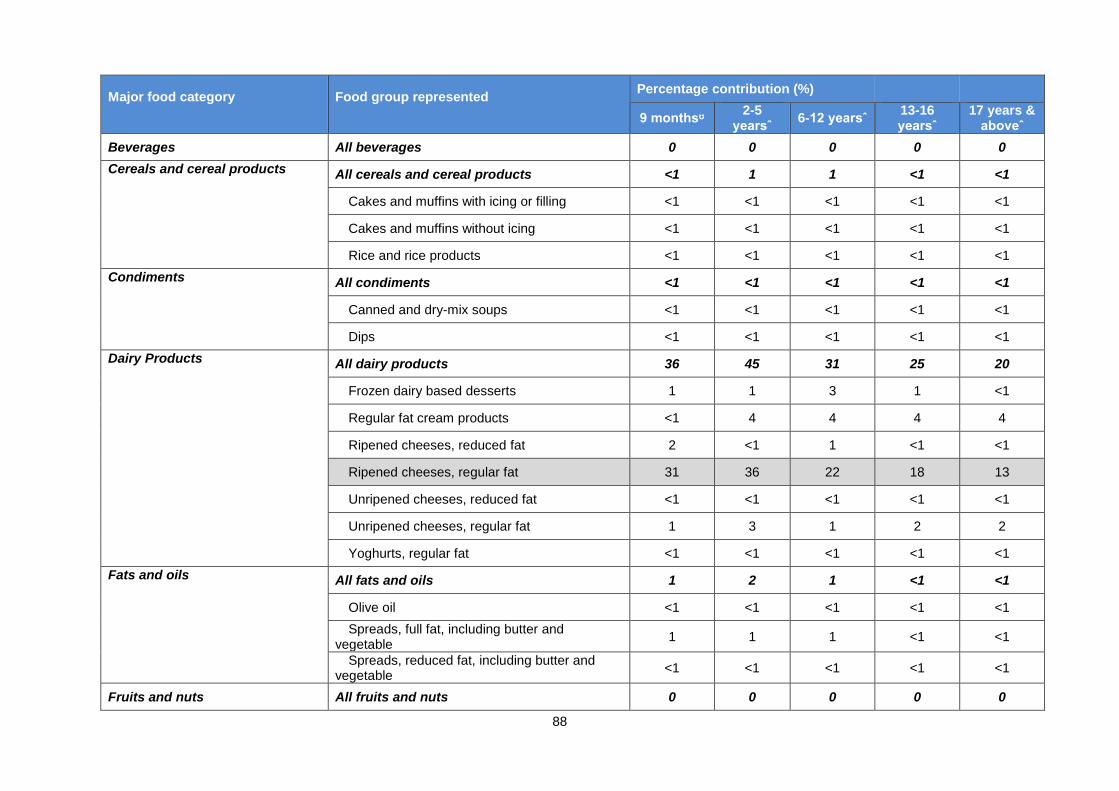
88
Major food category
Food group represented
Percentage contribution (%)
9 monthsᶷ 2-5
yearsˆ 6-12 yearsˆ
13-16 yearsˆ
17 years & aboveˆ
Beverages All beverages 0 0 0 0 0
Cereals and cereal products
All cereals and cereal products <1 1 1 <1 <1
Cakes and muffins with icing or filling <1 <1 <1 <1 <1
Cakes and muffins without icing <1 <1 <1 <1 <1
Rice and rice products <1 <1 <1 <1 <1
Condiments
All condiments <1 <1 <1 <1 <1
Canned and dry-mix soups <1 <1 <1 <1 <1
Dips <1 <1 <1 <1 <1
Dairy Products
All dairy products 36 45 31 25 20
Frozen dairy based desserts 1 1 3 1 <1
Regular fat cream products <1 4 4 4 4
Ripened cheeses, reduced fat 2 <1 1 <1 <1
Ripened cheeses, regular fat 31 36 22 18 13
Unripened cheeses, reduced fat <1 <1 <1 <1 <1
Unripened cheeses, regular fat 1 3 1 2 2
Yoghurts, regular fat <1 <1 <1 <1 <1
Fats and oils All fats and oils 1 2 1 <1 <1
Olive oil <1 <1 <1 <1 <1
Spreads, full fat, including butter and vegetable
1 1 1 <1 <1
Spreads, reduced fat, including butter and vegetable
<1 <1 <1 <1 <1
Fruits and nuts All fruits and nuts 0 0 0 0 0

89
Infant products All infant products 0 0 0 0 0
Meat, poultry, seafood and eggs Beef, veal, lamb, game and offal meats (not poultry) Beef, veal, lamb, game and poultry mince
All meat, poultry, seafood and eggs 56 48 60 67 73
Beef, veal, lamb, game and offal meats (not poultry)
56 48 59 67 73
Beef, veal, lamb, game and poultry mince <1 <1 <1 <1 <1
Sugars and confectionary Chocolate and chocolate-coated confectionary
All sugars and confectionary <1 <1 <1 <1 <1
Chocolate and chocolate-coated confectionary <1 <1 <1 <1 <1
Takeaway foods and snacks Meat & poultry based prepared dishes, takeaway Pizzas and prepared pizza bases
All takeaway foods and snacks 5 4 6 5 5
Meat & poultry based prepared dishes, takeaway
5 4 5 5 4
Pizzas and prepared pizza bases <1 <1 <1 <1 <1
Vegetables Olives
Sundried tomatoes
All vegetables <1 <1 <1 <1 <1
Olives <1 <1 <1 <1 <1
Sundried tomatoes 0 <1 <1 <1 <1
Total 100 100 100 100 100
Notes:
ᶷ Derived using a model diet ˆ Derived using the Australian 2011-12 NNPAS (2 day average exposure). Major contributors (≥5%) are highlighted in grey All %contributors have been rounded to the nearest whole percentage All %contributions are expressed as a percentage of the grand total contribution

90
Table A7.7 – Contributors to ATBC dietary exposures

91
Major food category
Food group
Percentage contribution (%)
9 monthsᶷ 2-5
yearsˆ 6-12 yearsˆ
13-16 yearsˆ
17 years & aboveˆ
Beverages All beverages 0 0 0 0 0
Cereals and cereal products All cereals and cereal products 16 16 22 22 16
Cakes and muffins with icing or filling <1 <1 <1 <1 <1
Cakes and muffins without icing <1 <1 <1 <1 <1
Cereal bars 3 3 4 5 2
Commercial biscuits and crackers 2 2 3 3 1
Commercial breads (white, multigrain, wholemeal, spelt & rye)
9 10 12 13 11
Flat breads, tortillas and pizza bases 1 <1 <1 <1 <1
Sweet and savoury fancy breads <1 <1 <1 <1 <1
Condiments All condiments <1 <1 <1 <1 <1
Canned and dry-mix soups <1 <1 <1 <1 <1
Dairy Products All dairy products 73 73 64 64 63
Ripened cheeses, reduced fat 7 3 7 2 5
Ripened cheeses, regular fat 66 70 57 62 57
Fats and oils All fats and oils 0 0 0 0 0
Fruits and nuts All fruits and nuts 0 <1 <1 <1 <1
Seeds and tree nuts 0 <1 <1 <1 <1
Infant products All infant products 0 0 0 0 0
Meat, poultry, seafood and eggs All meat, poultry, seafood and eggs 3 4 5 6 8
Beef, veal, lamb, game and poultry mince <1 <1 <1 1 1
Canned fish <1 <1 <1 1 3

92
Coated chicken products <1 <1 <1 <1 <1
Crumbed/battered fish and seafood <1 <1 <1 <1 1
Cured or fermented deli meats (excluded canned meats)
<1 <1 1 2 2
Meat sausages and frankfurts <1 <1 <1 <1 <1
Plain fish and seafood <1 <1 <1 <1 <1
Sugars and confectionary All sugars and confectionary 1 2 4 3 4
Confectionery <1 <1 <1 <1 <1
Sugar 1 2 4 3 4
Takeaway foods and snacks All takeaway foods and snacks <1 <1 1 1 <1
Coated chicken products, takeaway <1 <1 <1 <1 <1
Corn chips and taco shells <1 <1 <1 <1 <1
Crisps (chips) and savoury snacks <1 <1 <1 <1 <1
Vegetables All vegetables 6 3 4 4 8
Canned legumes <1 <1 <1 <1 1
Frozen vegetables <1 <1 <1 <1 <1
Olives 5 2 4 3 6
Sundried tomatoes 0 <1 <1 <1 <1
Total 100 100 100 100 100
Notes:
ᶷ Derived using a model diet ˆ Derived using the Australian 2011-12 NNPAS (2 day average exposure). Major contributors (≥5%) are highlighted in grey All %contributors have been rounded to the nearest whole percentage All %contributions are expressed as a percentage of the grand total contribution
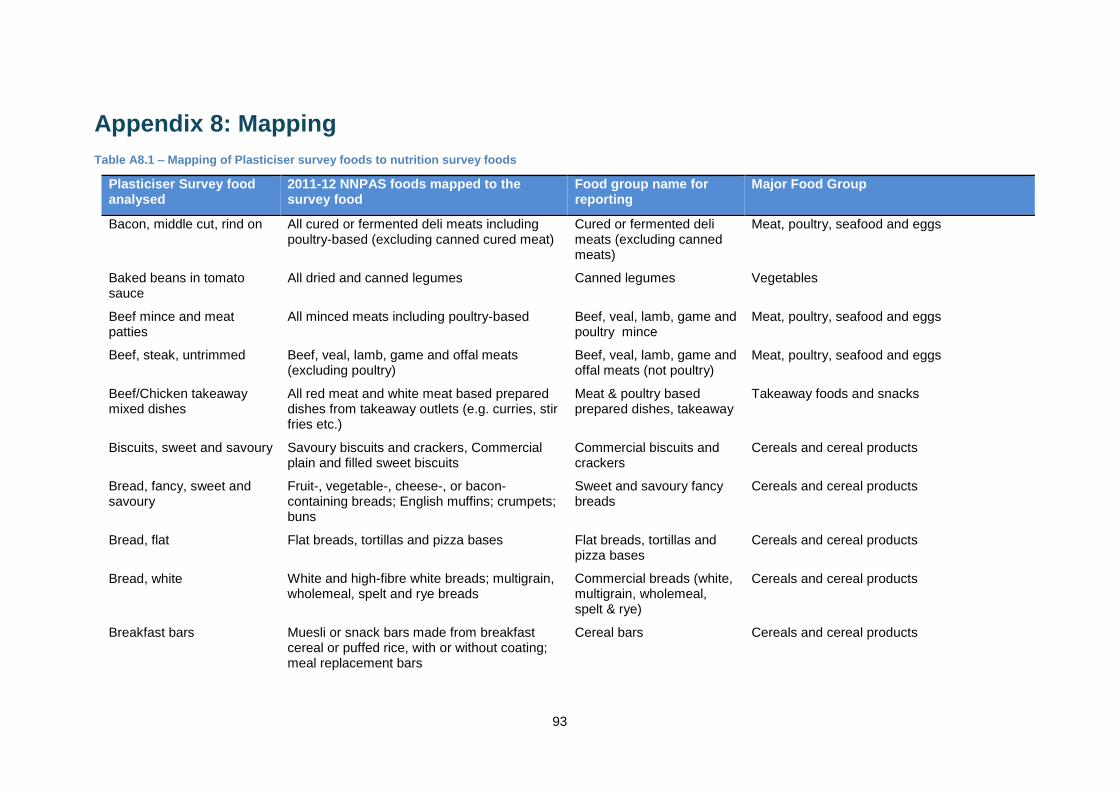
93
Appendix 8: Mapping
Table A8.1 – Mapping of Plasticiser survey foods to nutrition survey foods
Plasticiser Survey food analysed
2011-12 NNPAS foods mapped to the survey food
Food group name for reporting
Major Food Group
Bacon, middle cut, rind on All cured or fermented deli meats including poultry-based (excluding canned cured meat)
Cured or fermented deli meats (excluding canned meats)
Meat, poultry, seafood and eggs
Baked beans in tomato sauce
All dried and canned legumes Canned legumes Vegetables
Beef mince and meat patties
All minced meats including poultry-based Beef, veal, lamb, game and poultry mince
Meat, poultry, seafood and eggs
Beef, steak, untrimmed Beef, veal, lamb, game and offal meats (excluding poultry)
Beef, veal, lamb, game and offal meats (not poultry)
Meat, poultry, seafood and eggs
Beef/Chicken takeaway mixed dishes
All red meat and white meat based prepared dishes from takeaway outlets (e.g. curries, stir fries etc.)
Meat & poultry based prepared dishes, takeaway
Takeaway foods and snacks
Biscuits, sweet and savoury Savoury biscuits and crackers, Commercial plain and filled sweet biscuits
Commercial biscuits and crackers
Cereals and cereal products
Bread, fancy, sweet and savoury
Fruit-, vegetable-, cheese-, or bacon-containing breads; English muffins; crumpets; buns
Sweet and savoury fancy breads
Cereals and cereal products
Bread, flat Flat breads, tortillas and pizza bases Flat breads, tortillas and pizza bases
Cereals and cereal products
Bread, white White and high-fibre white breads; multigrain, wholemeal, spelt and rye breads
Commercial breads (white, multigrain, wholemeal, spelt & rye)
Cereals and cereal products
Breakfast bars Muesli or snack bars made from breakfast cereal or puffed rice, with or without coating; meal replacement bars
Cereal bars Cereals and cereal products
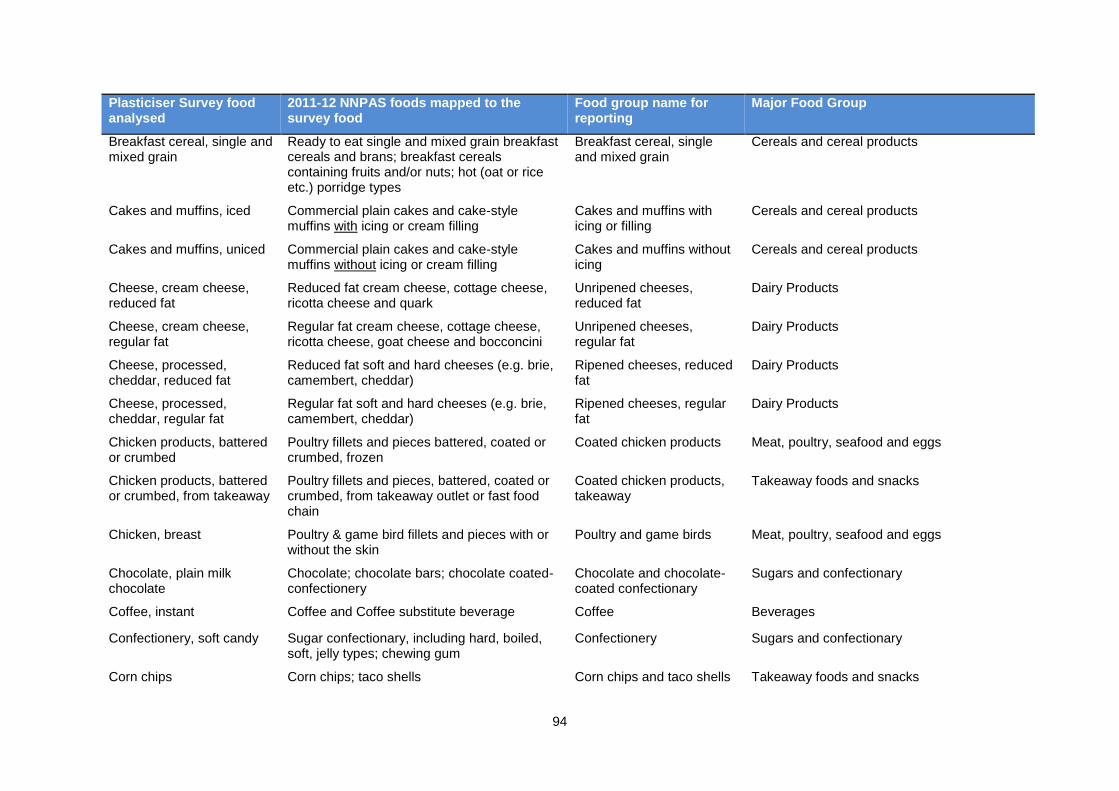
94
Plasticiser Survey food analysed
2011-12 NNPAS foods mapped to the survey food
Food group name for reporting
Major Food Group
Breakfast cereal, single and mixed grain
Ready to eat single and mixed grain breakfast cereals and brans; breakfast cereals containing fruits and/or nuts; hot (oat or rice etc.) porridge types
Breakfast cereal, single and mixed grain
Cereals and cereal products
Cakes and muffins, iced Commercial plain cakes and cake-style muffins with icing or cream filling
Cakes and muffins with icing or filling
Cereals and cereal products
Cakes and muffins, uniced Commercial plain cakes and cake-style muffins without icing or cream filling
Cakes and muffins without icing
Cereals and cereal products
Cheese, cream cheese, reduced fat
Reduced fat cream cheese, cottage cheese, ricotta cheese and quark
Unripened cheeses, reduced fat
Dairy Products
Cheese, cream cheese, regular fat
Regular fat cream cheese, cottage cheese, ricotta cheese, goat cheese and bocconcini
Unripened cheeses, regular fat
Dairy Products
Cheese, processed, cheddar, reduced fat
Reduced fat soft and hard cheeses (e.g. brie, camembert, cheddar)
Ripened cheeses, reduced fat
Dairy Products
Cheese, processed, cheddar, regular fat
Regular fat soft and hard cheeses (e.g. brie, camembert, cheddar)
Ripened cheeses, regular fat
Dairy Products
Chicken products, battered or crumbed
Poultry fillets and pieces battered, coated or crumbed, frozen
Coated chicken products Meat, poultry, seafood and eggs
Chicken products, battered or crumbed, from takeaway
Poultry fillets and pieces, battered, coated or crumbed, from takeaway outlet or fast food chain
Coated chicken products, takeaway
Takeaway foods and snacks
Chicken, breast Poultry & game bird fillets and pieces with or without the skin
Poultry and game birds Meat, poultry, seafood and eggs
Chocolate, plain milk chocolate
Chocolate; chocolate bars; chocolate coated-confectionery
Chocolate and chocolate-coated confectionary
Sugars and confectionary
Coffee, instant Coffee and Coffee substitute beverage Coffee Beverages
Confectionery, soft candy Sugar confectionary, including hard, boiled, soft, jelly types; chewing gum
Confectionery Sugars and confectionary
Corn chips Corn chips; taco shells Corn chips and taco shells Takeaway foods and snacks

95
Plasticiser Survey food analysed
2011-12 NNPAS foods mapped to the survey food
Food group name for reporting
Major Food Group
Cream, sour, full fat Regular fat sour cream and thickened cream Regular fat cream products Dairy Products
Cream, thickened, reduced fat
Reduced fat sour cream and thickened cream Reduced fat cream products
Dairy Products
Dip Dips, dairy or fat based Dips Condiments
Fish fillets, white fish, fresh Unprocessed fish and fish fillets; Crustacea Plain fish and seafood Meat, poultry, seafood and eggs
Fish portions, frozen from supermarket (crumbed only)
Crumbed and battered fish and other seafood Crumbed/battered fish and seafood
Meat, poultry, seafood and eggs
Hamburger, beef (combined Hungry Jacks and other fast food outlet burgers)
Hamburgers; chicken burgers; fish burgers Hamburgers (all meat types)
Takeaway foods and snacks
Ice cream, full fat Ice creams; frozen yoghurt; milk-based ice confections
Frozen dairy based desserts
Dairy Products
Infant dessert Infant custards and yoghurts Infant custards and yoghurts
Infant products
Infant dinner Infant dinners, meat and/or vegetable and/or pasta based
Infant dinners Infant products
Infant formula (non-soy) Cow's milk infant formula Infant formulas, non-soy based
Infant products
Infant formula, soy- based Soy based infant formula Infant formulas, soy-based Infant products
Jams Fruit and vegetable jams and spreads, pickles, chutneys and pastes
Jams, chutneys and pastes Condiments
Milk, fresh, full fat All regular fat flavoured & unflavoured dairy milks
Milks, flavoured & unflavoured, regular fat
Dairy Products
Milk, fresh, reduced fat All reduced fat flavoured & unflavoured dairy milks
Milks, flavoured & unflavoured, reduced fat
Dairy Products
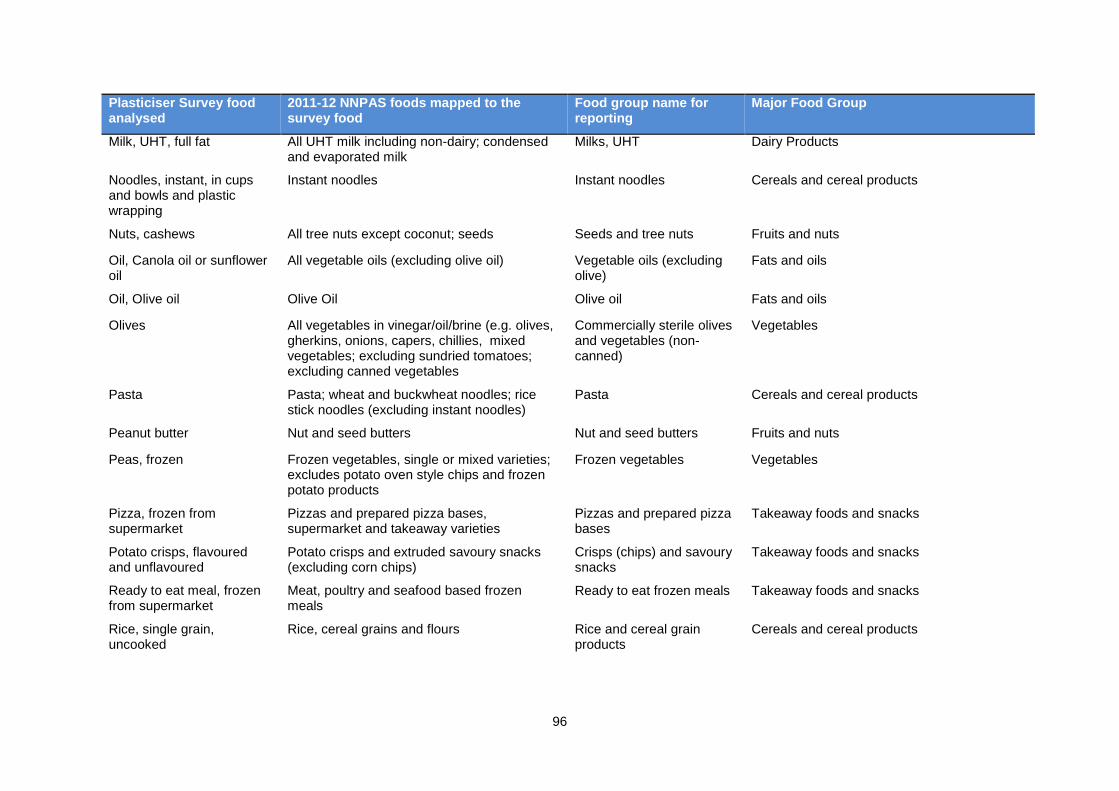
96
Plasticiser Survey food analysed
2011-12 NNPAS foods mapped to the survey food
Food group name for reporting
Major Food Group
Milk, UHT, full fat All UHT milk including non-dairy; condensed and evaporated milk
Milks, UHT Dairy Products
Noodles, instant, in cups and bowls and plastic wrapping
Instant noodles Instant noodles
Cereals and cereal products
Nuts, cashews All tree nuts except coconut; seeds Seeds and tree nuts Fruits and nuts
Oil, Canola oil or sunflower oil
All vegetable oils (excluding olive oil) Vegetable oils (excluding olive)
Fats and oils
Oil, Olive oil Olive Oil Olive oil Fats and oils
Olives All vegetables in vinegar/oil/brine (e.g. olives, gherkins, onions, capers, chillies, mixed vegetables; excluding sundried tomatoes; excluding canned vegetables
Commercially sterile olives and vegetables (non-canned)
Vegetables
Pasta Pasta; wheat and buckwheat noodles; rice stick noodles (excluding instant noodles)
Pasta Cereals and cereal products
Peanut butter Nut and seed butters Nut and seed butters Fruits and nuts
Peas, frozen Frozen vegetables, single or mixed varieties; excludes potato oven style chips and frozen potato products
Frozen vegetables Vegetables
Pizza, frozen from supermarket
Pizzas and prepared pizza bases, supermarket and takeaway varieties
Pizzas and prepared pizza bases
Takeaway foods and snacks
Potato crisps, flavoured and unflavoured
Potato crisps and extruded savoury snacks (excluding corn chips)
Crisps (chips) and savoury snacks
Takeaway foods and snacks
Ready to eat meal, frozen from supermarket
Meat, poultry and seafood based frozen meals
Ready to eat frozen meals Takeaway foods and snacks
Rice, single grain, uncooked
Rice, cereal grains and flours Rice and cereal grain products
Cereals and cereal products

97
Plasticiser Survey food analysed
2011-12 NNPAS foods mapped to the survey food
Food group name for reporting
Major Food Group
Sausages, beef All sausages; frankfurts Meat sausages and frankfurts
Meat, poultry, seafood and eggs
Shelf-stable peaches All shelf-stable canned and packaged fruits Commercially sterile fruits Fruits and nuts
Soft drink Soft drinks; flavoured mineral waters; tonic water; fruit-flavoured drinks; sports drinks; energy drinks
Soft drinks, energy drinks and mineral waters
Beverages
Soup Canned and dry-mix soups Canned and dry-mix soups Condiments
Spreads, full fat, including butter and vegetable
Regular fat margarines and margarine spreads; not further specified spreads/fats; butter; vegetable based hard fats
Spreads, full fat, including butter and vegetable
Fats and oils
Spreads, reduced fat, including butter and vegetable
reduced fat margarines and margarine spreads; not further specified spreads/fats; butter; vegetable based hard fats
Spreads, reduced fat, including butter and vegetable
Fats and oils
Sugar, white White sugar, brown sugar, raw sugar, icing sugar, maltodextrin; excludes sugar syrups (e.g. maple, glucose)
Sugar Sugars and confectionary
Sundried tomatoes Sundried and semi-sundried tomatoes Sundried tomatoes Vegetables
Tomato sauce Sauces; gravy; condiments (e.g. barbeque, honey soy, HP, fish and soy sauces; pasta or simmer sauces; tomato salsa; marinades)
Gravy, sauces & condiments
Condiments
Tomatoes, canned All canned vegetables Canned vegetables Vegetables
Tuna, canned All canned fish products Canned fish Meat, poultry, seafood and eggs
Yoghurt, full fat, flavoured and unflavoured
All regular fat yoghurts (excluding frozen) Yoghurts, regular fat Dairy Products
Yoghurt, low/reduced fat, flavoured and unflavoured
All reduced fat yoghurts (excluding frozen) Yoghurts, reduced fat Dairy Products