Survey of groundwater use in the central part of the Nile...
50
2015 Survey of groundwater use in the central part of the Nile Delta Doaa Ezzat Al-Agha, Alvar Closas, François Molle Water and salt management in the Nile Delta: Report No. 6
Transcript of Survey of groundwater use in the central part of the Nile...

2015
Survey of groundwater use in the central part of the Nile Delta
Doaa Ezzat Al-Agha, Alvar Closas, François Molle
Water and salt management in the Nile Delta: Report No. 6

2
3
Survey of groundwater use in the central part of the Nile
Delta
Doaa Ezzat Al-Agha, Alvar Closas, François Molle
April 2015

4
Summary
1 Introduction ............................................................................................................................... 7
2 Nile Delta aquifer description ..................................................................................................... 7
2.1 Nile Delta aquifer characteristics ...................................................................................... 8
2.2 Recharge and discharge of the Nile Delta aquifer .......................................................... 11
3 Groundwater management of the Nile Delta aquifer ................................................................ 13
4 Water quality of the Nile Delta aquifer ..................................................................................... 15
4.1 Salt water intrusion of the Nile Delta aquifer ................................................................. 15
4.2 Hydrochemistry of the Nile Delta aquifer ....................................................................... 19
5 Current groundwater use in the Nile Delta ................................................................................ 22
6 Dynamics of groundwater use in the Nile Delta ........................................................................ 24
6.1 General specifications of the surveyed wells .................................................................. 25
6.1.1 Investment decisions and access to water .......................................................................... 25
6.1.2 Well characteristics and operation ..................................................................................... 27
6.2 Social arrangements for installing and operating wells .................................................. 29
6.2.1 Single owner, several users ................................................................................................. 29
6.2.2 Collective wells .................................................................................................................... 30
6.3 Groundwater quality of surveyed wells .......................................................................... 32
6.4 Irrigation practices .......................................................................................................... 34
6.5 Economic aspects of groundwater abstraction .............................................................. 35
6.6 Drivers of groundwater-supplemented irrigation in the Delta ....................................... 36
7 Conclusions .............................................................................................................................. 40
8 References ............................................................................................................................... 42
9 Appendix ................................................................................................................................. 46
9.1 Standards for drinking and irrigation water in (mg/L). ................................................... 46
9.2 Locations of the Surveyed Wells in the Central Part of the Nile Delta ........................... 48
9.3 Drilling of wells ................................................................................................................ 49

5
Figures
Figure 1. Groundwater Aquifers in Egypt (RIGW, 2003) .................................................................. 7
Figure 2. The Nile Delta governorates .............................................................................................. 8
Figure 3. Vertical Cross Section at the Middle of Nile Delta (after Sherif, 2003) ............................. 9
Figure 4. Depth to groundwater of the Nile Delta region in 2008 (Morsy, 2009) ......................... 10
Figure 5. Piezometric head of the Nile Delta region in 2008 (Morsy, 2009) .................................. 10
Figure 6. Groundwater hydrographs before and after the High Aswan Dam (Shahin, 1991) ....... 11
Figure 7. Groundwater Iso-salinity Map of the Nile Delta (RIGW and Farid 1980) ........................ 16
Figure 8. Schematic presentation of a cross section in the middle Nile Delta aquifer (Farid, 1985) ................................................................................................................................................ 16
Figure 9. Comparison of Iso-Salinity line 1,000 ppm location for years 1960, 1980, 1992 and 2008 (after Morsy, 2009) ................................................................................................................. 17
Figure 10. TDS distribution in the Nile Delta in year 2012 (FAO, 2013) ......................................... 18
Figure 11. TDS ―salinity of groundwater in the Nile Delta years 1975, 1980, 1990 and 2000 (FAO, 2013) ....................................................................................................................................... 18
Figure 12. Irrigated area with groundwater in the Nile Delta governorates ................................. 22
Figure 13. Irrigated area with groundwater in the Nile Delta governorates year 2012 (source: MWRI) ..................................................................................................................................... 23
Figure 14. Percentage of the Nile Delta governorate use of groundwater (El-Nahal, 2007; FAO, 2013) ....................................................................................................................................... 23
Figure 15. Locations of the survey ................................................................................................. 25
Figure 16. Locations of well surveyed ............................................................................................ 26
Figure 17. Illustrations of different well locations ......................................................................... 26
Figure 18. Pump and engine configurations .................................................................................. 28
Figure 19. Wells and sources of energy in the Central Delta ......................................................... 29
Figure 20. Schematic of well location and pumping arrangements along a mesqa ...................... 32
Figure 21. Spatial distribution of ground water salinity ................................................................. 33
Figure 22. Evolution of the cost of drilling wells per unit depth from 1994 to 2015 ..................... 35
Figure 23. Main reasons for water shortages, as perceived by farmers ........................................ 37
Figure 24. Farmers responses to the date they felt the water shortage ....................................... 38
6
List of Abbreviations
ICARDA International Center for Agricultural Research in the Dry Areas
ARC Agricultural Research Center
NWRC National Water Research Center
IIP Irrigation Improvement Project
IIIMP Integrated Irrigation Improvement and Management Project
PIM Participatory Irrigation Management
IMT Irrigation Management Transfer
WUA Water User Association
CPR Common Property Resource
BC Branch Canal
IP Individual Pump
Feddan Unit of land (0.42 hectares)
Kerat unit of land ( one feddan = 24 kerat)
Saqia Persian Water Wheel
Mesqa Tertiary Canal
Marwa Quaternary Canal
Tatweer Development – Used to refer to irrigation development projects
Islah Land reform
Milk Owners
RIGW Research Institute for Ground Water
MWRI Ministry of Water Resources and Irrigation
DRI Drainage Research Institute

7
1 Introduction
As the demand on fresh water increases, attention to non-conventional water resources consequently increases worldwide. Nowadays, groundwater plays an important role in water supply all over the world. Of Egypt’s six groundwater aquifers (Figure 1), the Nile aquifer is considered an important source of groundwater abstraction as it represents 87% of the total groundwater abstraction in the country (MWRI, 2005). The main source of the Nile aquifer recharge is the seepage from the surface water irrigation/drainage systems and infiltration from the cultivated land. The conjunctive use of groundwater and surface water plays an important role during the period of peak irrigation demand. The amount of water abstraction from the Nile Aquifer (Delta and Valley) was estimated in 2010 at 6.2 Bm3, which is under the safe yield (8.4 Bm3) estimated by MWRI (2012).
The Nile Delta aquifer is one of the largest aquifers in Egypt with a total capacity of 500 Bm3
(Sherif, 1999), roughly fifteen times the amount of water that enters the Delta annually through the river flow itself. MWRI (2005) indicated that the abstraction from the sole Nile Delta aquifer already exceeds its safe yield. Therefore they recommended that any plans for increasing groundwater abstraction from the Nile Delta aquifer should be reviewed carefully to avoid lowering of groundwater table and induce seawater intrusion.
In this Activity Report we first give a brief description of the Nile delta aquifer and review previous studies on groundwater. Thereafter we review the results of a survey of 57 wells that was conducted to answer key questions regarding the current and future management of the Nile Delta Aquifer, its sustainability and its role in irrigation.
Figure 1. Groundwater Aquifers in Egypt (RIGW, 2003)
2 Nile Delta aquifer description
The Nile Delta is among the most populated agricultural areas in the world, with 1,080 inhabitants per km2 (Aquastat, 2013), covering nine governorates (see Figure 2) with about 43% of Egypt population (35,943,293 inhabitants)1. There are industrial areas located in different
1 Source: CAPMAS (Central Agency for Public Mobilisation and Statistics), Egypt.

8
parts of the Nile Delta area, for instance Abu Zaabal and Rawash near Cairo, Sadat City in the Western Nile Delta, Tenth of Ramadan city in the Eastern Nile Delta and Mobarak in the Middle Delta, in addition to main cities themselves (Alexandria, Kafr el Zayat, Mahala and Tanta). The source of the recharge of the Nile Delta aquifer is the direct seepage of the Nile water from canals, drains and the irrigated plots themselves (Sefelnasr and Sherif, 2013). The cultivated lands are divided into 'old lands' in the delta proper and 'new lands', mostly reclaimed desert highlands in the east and the west of the Nile Delta (but also some recently reclaimed saline soils in the delta). The Northern part of the Nile Delta includes coastal lagoons (Lake Manzala, Lake Burullus, Lake Edku and Lake Mariut), salt marshes and sabkhas2.
Figure 2. The Nile Delta governorates
2.1 Nile Delta aquifer characteristics
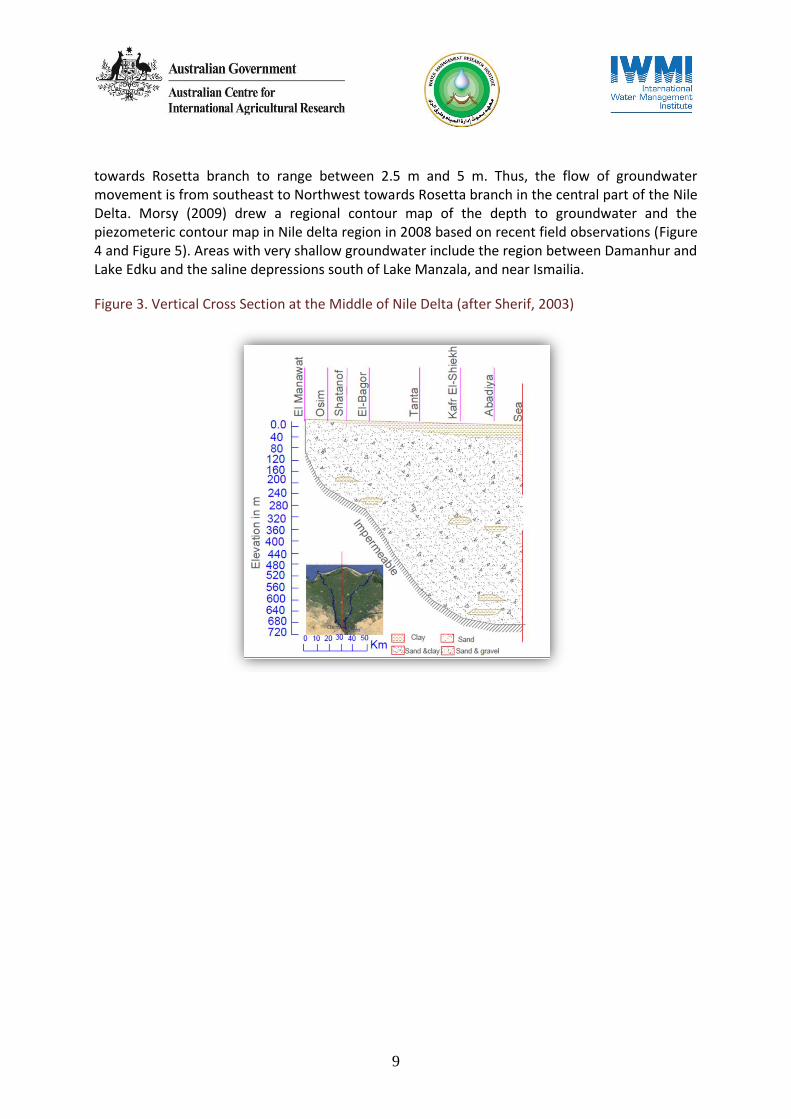
The characteristics of the Nile Delta aquifer have been identified by numerous studies over the last six decades (e.g. Ball, 1939; Wilson et al., 1979; Farid 1980; Zaghloul 1985; Amer et al., 1996; Diab et al., 1997; Kashef, 1981). The Nile Delta aquifer is formed by quaternary deposits and is considered a semi-confined aquifer. The top of the aquifer is covered by a thin clay layer, which varies in thickness and disappears in some places. In such places, the aquifer is considered to be phreatic since its free water surface is subjected to atmospheric pressure. The thin clay layer varies from 5 m in the south to 20 m in the middle and reaches 50 m in the North of the Nile Delta (Figure 3). The thickness and lithological differences of the clay layer have a great effect on the degree of hydraulic connection between the ground and surface water (Saleh, 1980). The saturated thickness of the aquifer varies from 200 m in the southern parts to about 1000 m in the northern parts (RIGW, 1992).
The depth to the groundwater table in the Nile Delta ranges between 1–2 m in the North, 3–4 m in the Middle and 5 m in the South (Mabrouk et al., 2013). Fattah (2014) studied the southern part of the middle of Nile Delta (central part) and concluded that the depth to water decreases
2 They are generally a low surface of deflation formed by the removal of dry and loose material down to the level of ground
water or the zone of capillary water (Ibrahem, 2002).
9
towards Rosetta branch to range between 2.5 m and 5 m. Thus, the flow of groundwater movement is from southeast to Northwest towards Rosetta branch in the central part of the Nile Delta. Morsy (2009) drew a regional contour map of the depth to groundwater and the piezometeric contour map in Nile delta region in 2008 based on recent field observations (Figure 4 and Figure 5). Areas with very shallow groundwater include the region between Damanhur and Lake Edku and the saline depressions south of Lake Manzala, and near Ismailia.
Figure 3. Vertical Cross Section at the Middle of Nile Delta (after Sherif, 2003)

10
Figure 4. Depth to groundwater of the Nile Delta region in 2008 (Morsy, 2009)
Figure 5. Piezometric head of the Nile Delta region in 2008 (Morsy, 2009)
The ground elevation ranges between about 18 m above mean sea level (AMSL) in the south at Qanater El-Khairia to about 5 m (AMSL) near Tanta sloping down very gently in a northward direction by an average value of 1 m/10 Km (Saleh, 1980). Furthermore, the Nile Delta slopes from east to west making the Damietta branch 2 meters higher than the Rosetta branch (Abu Al-Izz, 1971).
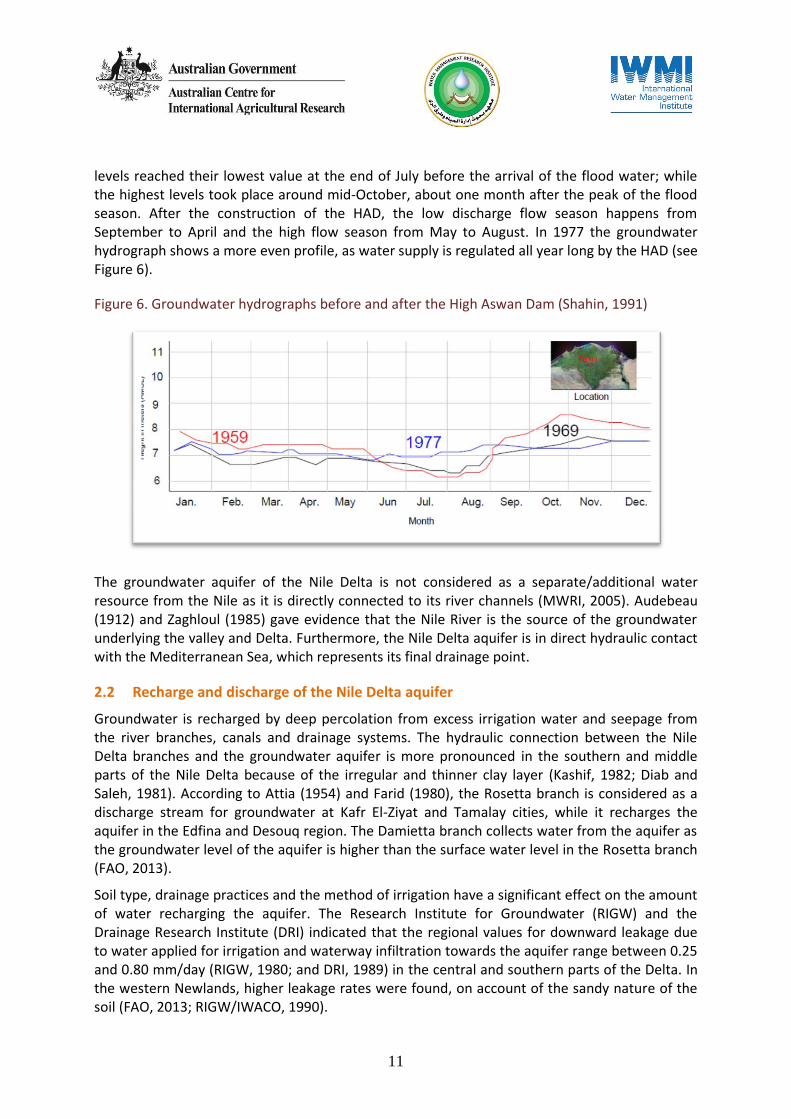
The effect of seasonality of the Nile discharge on groundwater levels in the Nile Delta aquifer has been observed by Shahin (1991). He divided his observations into two periods, before and after the construction of the High Aswan Dam (HAD) in 1964. During the pre-dam era, groundwater
11
levels reached their lowest value at the end of July before the arrival of the flood water; while the highest levels took place around mid-October, about one month after the peak of the flood season. After the construction of the HAD, the low discharge flow season happens from September to April and the high flow season from May to August. In 1977 the groundwater hydrograph shows a more even profile, as water supply is regulated all year long by the HAD (see Figure 6).
Figure 6. Groundwater hydrographs before and after the High Aswan Dam (Shahin, 1991)
The groundwater aquifer of the Nile Delta is not considered as a separate/additional water resource from the Nile as it is directly connected to its river channels (MWRI, 2005). Audebeau (1912) and Zaghloul (1985) gave evidence that the Nile River is the source of the groundwater underlying the valley and Delta. Furthermore, the Nile Delta aquifer is in direct hydraulic contact with the Mediterranean Sea, which represents its final drainage point.
2.2 Recharge and discharge of the Nile Delta aquifer
Groundwater is recharged by deep percolation from excess irrigation water and seepage from the river branches, canals and drainage systems. The hydraulic connection between the Nile Delta branches and the groundwater aquifer is more pronounced in the southern and middle parts of the Nile Delta because of the irregular and thinner clay layer (Kashif, 1982; Diab and Saleh, 1981). According to Attia (1954) and Farid (1980), the Rosetta branch is considered as a discharge stream for groundwater at Kafr El-Ziyat and Tamalay cities, while it recharges the aquifer in the Edfina and Desouq region. The Damietta branch collects water from the aquifer as the groundwater level of the aquifer is higher than the surface water level in the Rosetta branch (FAO, 2013).
Soil type, drainage practices and the method of irrigation have a significant effect on the amount of water recharging the aquifer. The Research Institute for Groundwater (RIGW) and the Drainage Research Institute (DRI) indicated that the regional values for downward leakage due to water applied for irrigation and waterway infiltration towards the aquifer range between 0.25 and 0.80 mm/day (RIGW, 1980; and DRI, 1989) in the central and southern parts of the Delta. In the western Newlands, higher leakage rates were found, on account of the sandy nature of the soil (FAO, 2013; RIGW/IWACO, 1990).

12
Average rainfall changes from 25 mm/year in the south and central part of the Delta to 200 mm/year in the North Western part (RIGW, 1992). In the northern part of the Nile Delta, the excess rainfall is largely intercepted by the drainage system and cannot reach the aquifer (Morsy 2009). Mabrouk et al. (2013) indicated that all groundwater modelling studies neglect the recharge from rainfall in the Nile Delta as it is very small compared to the recharge from the irrigation network.
The Delta aquifer annual recharge was estimated using the water budget of the Nile Delta by Kashef (1983) at 6.4 Bm3 , by Shahin (1983) at 3.8 Bm3, at 6.7 Bm3 by Mikhailova (2001) and 5.4 Bm3 Morsy (2009). RIGW estimated the total net recharge to the Nile Delta aquifer system in 2006 at 6.78 Bm3 (FAO, 2013). Although these values have the same order of magnitude they illustrate the degree of uncertainty of knowledge on groundwater.
There are many techniques for estimating groundwater recharge, summarized and reviewed by Nimmo et al. (2005). In the Nile Delta most aquifer studies have estimated the recharge using the water budget method. They calculated and measured all the variables in the water budget and the recharge rate was estimated as the closing term. The accuracy of estimating the recharge depends therefore on the accuracy of measurements or the estimation of the other water budget components. Since recharge rates vary in time and space, using the average of water budget components over a long period of time (e.g. using the annual value) reduces the accuracy of estimating recharge rate. Also spatial variations of climate, topography, soil, geology and vegetation have some influence on recharge.
The discharge of the groundwater aquifer takes place through: land drainage, evaporation, evapotranspiration, inter-aquifer flow of groundwater, and groundwater abstraction. In the Northern part of the Nile Delta much groundwater is discharged into the drainage system with value ranging between 0.2 and 0.9 mm/day (DRI, 1989).
Natural discharge of groundwater by evaporation and/or evapotranspiration occurs in the low lying areas with shallow groundwater tables as well as small depressions in the eastern Nile Delta, where water can be taken up by plants or moves upwards through capillary rise. Mabrouk (2013) indicated that the total evapotranspiration rate of the Nile Delta using both the irrigation inflow and the aquifer storage is about 2,000 mm/yr.
Outflow of the Nile Delta aquifer also occurs towards the Moghra aquifer, along the fringes of the western Nile Delta. The total amount of groundwater flowing from the Nile Delta aquifer into the Moghra aquifer was estimated by RIGW/IWACO (1990) between 50 and 100 Mm3/year. However, Morsy (2009) observed that the drawdown of the groundwater levels in the Moghra aquifer was between 5m and 15 m due to the extensive groundwater exploitation. Therefore, a review of the value of inter-aquifer groundwater flow is needed as it may be increased with current irrigation development in the new lands on the western part of the Nile Delta and recent groundwater intensive exploitation.
An early estimation of the amount of groundwater used in irrigation by Abu-Zeid (1991) was about 906 Mm3/year in the Nile Delta area (326 Mm3/ year in the East Delta, 73 Mm3 /year in the Middle Delta and 506 Mm3/year in the West Delta). More recently the total annual groundwater abstraction for irrigation and drinking in the Nile Delta area was estimated by Morsy (2009) to be 4.9 Bm3 in 2008. She indicated that the beginning of the increase in abstraction rates was in 1992 (3 Bm3) (estimated by RIGW) which was due to the uncontrolled

13
land cultivation in the reclaimed lands of the western Nile Delta. Mabrouk el al. (2013) indicated that annual abstraction increased linearly by about 0.1 Bm3 per year, except from the period of 2003 till 2010, when the abstraction increased by 0.2 Bm3 per year. They demonstrated the need to control abstraction in the Nile Delta to overcome the depletion, deterioration, and salinization that might happen to the Nile Delta aquifer.
Mabrouk et al. (2013) reviewed the hydraulic parameter values of the Nile Delta aquifer used in several research studies. They reviewed the hydraulic conductivity values and found that almost all of the studies gave an average value of hydraulic conductivity for the whole delta. They stated that a regional area like the Nile Delta should be characterized with spatially varying hydraulic conductivity for different locations and layers for a more accurate representation of the study area. Also, due to a lack of data, subsequent studies used uniform values for the vertical hydraulic conductivity all over the Nile Delta, not taking into consideration that the characteristics of the clay vary spatially across the Delta. On the other hand, they reported differences in transmissivity and percolation values used. Percolation varies according to the type of irrigation system (furrow, drip or surface irrigation) and also if there is sub-surface drainage network.
An accurate estimation of groundwater recharge and discharge is extremely important for the proper management of groundwater systems, pointing to the need to conduct more field work in collecting data in different areas of the Nile Delta. Also, studying the impact of different parameters on groundwater recharge, for instance; seasonality, crop pattern, vegetation density and intensity of use are important in order to better understand the groundwater in the delta.
3 Groundwater management of the Nile Delta aquifer
Many researchers have studied the Nile Delta aquifer, using several numerical models to simulate groundwater flows and to define and analyze the hydrological and topographic characteristics of the aquifer. Different combinations of simulations and optimization models have been used to recommend a plan for the conjunctive use to optimize the benefits of using both ground and surface water (Darweesh, 2001; El-Beshri and Labadie, 1994).
Extraction of groundwater from a connected system, as is the case of the Nile Delta aquifer, may induce increased recharge rates which reduce the available surface water resources. On the other hand, diverting or reducing surface water discharges can reduce aquifer recharge. This is why Evan et al. (2014) stressed that care must be taken when allocating surface water and groundwater from one connected source to avoid double accounting and induced impacts.
Groundwater has long been considered as a potential means to offset local water shortages. Farmers having land located near the tail-end of irrigation canals have been advised to use supplemental water from wells (Kashef, 1981a; Clawson et al., 1971; Farag, 1956). El-Arabi et al. (2000) recommended the conjunctive use of surface and groundwater as it was proved to be an important tool of integrated water resources management to alleviate shortage and low efficiency of irrigation systems and drainage problems in water logged areas. They recommended tubewell fields to supplement irrigation water in some deficit areas, especially at the tail of the canals. As stressed by Morsy (2009), conjunctive use exists in the Nile Delta aquifer with the objective of mitigating the effect of water shortage in canal water supplies, often

14
subject to flow variations during different periods through the year. The Ministry of Water Resources and Irrigation increases canal water supplies by pumping groundwater through deep tube wells along the canal system (mostly at the tail end of canals) in some deficit areas.
RIGW carried out studies in 1990 to evaluate the potential of groundwater in the Western Nile Delta's New Lands. They proposed a plan for groundwater development to increase groundwater abstraction from 0.5 to 2.5 Bm3 for the period from 1990 to 2000 (Morsy, 2009). A dramatic change in the groundwater level and salinity has been indicated by several researchers due to the rapid development of the land reclamation in the Western Nile Delta region.
A whole set of studies testing several development scenarios has been undertaken by different researchers (e.g. Mohammed, 2002; Khater et al., 2002; RIGW, 2003; Abd el-Salam, 2004; El Fakharany, 2002). Using a groundwater finite element flow model (Triwaco package -finite element), they studied the impact of surface water on groundwater in Western Nile Delta region by testing different policies and development plans to prevent aquifer depletion.
Mohammed (2002) used satellite images to assess the increase in the area under cultivation from 1987 to 1998, and the area developed with groundwater in the Western Nile Delta between 1990 and 2000. They found an increase in the cultivated area exceeding that of the development plan of 1990, predicting that critical areas will face severe groundwater drawdown.
Khater et al. (2002) studied the groundwater levels in Sadat City (one of the new urban areas in the western Nile Delta region). The city depends on groundwater as the main source for irrigation. They indicated that continuous groundwater extraction exceeded the planned level, causing some hazards on the groundwater potentiality.
Morsy (2009) studied the impact of groundwater development plan from the year 1992 to 2008 on the water table and highlighted water logging problems in both western and eastern fringes of the Nile Delta. She noted a drawdown of groundwater levels in the southern part of the western fringes of the Nile Delta (between 5 to 15 m) due to extensive exploitation of groundwater and lack of recharge.
Mohamed and Hua (2010) developed a model to simulate the water resources in the Western Nile Delta. An unsustainable use of groundwater was indicated as the total amount of groundwater abstraction for irrigation (1.9 Bm3) was larger than groundwater recharge (1.54 Bm3). They commented that this situation in the long term will undermine the capacity and sustainability of the aquifer, and will lead to salt water intrusion into this aquifer. They recommended reducing groundwater abstraction by 20% in order to reach a sustainable situation.
Dawoud et al. (2005) developed a GIS-based model for the aquifer system of the Western Nile Delta to evaluate groundwater potentiality and to test two alternative management scenarios for conserving the aquifer system in Western Nile Delta. In the first scenario, they proposed reducing the surface water inflow while increasing the annual abstraction of groundwater by about 450 Mm3. Alternatively, they recommended constructing a new canal to increase the annual aquifer storage potential by about 23%.
Likewise, El Moll et al. (2005) studied different management scenarios for the western Nile Delta aquifer to satisfy the need for 460,000 feddan of new land reclamation. These scenarios studied alternative conjunctive uses for available water resources in Western Nile delta (surface water,

15
groundwater, drainage water reuse) to prevent aquifer depletion. They also recommended constructing a new canal with 2.1 Bm3 of surface water and the increase of groundwater abstraction must not exceed 1.0 Bm3/year to avoid aquifer exploitation.
El-Fakharany (2002) tested three strategies for reducing irrigation water supply from canals to El-Saidiya area (East Nile Delta) and substituting the reduction with groundwater. She examined the effect of different pumping rates in the long term, seasonal and inter-annual strategies and recommended to satisfy 25 % of the study area irrigation requirements with groundwater. Also, Samak (2007) simulated the groundwater flow at Abu-Kabir district in El-Sharqia governorate (East Nile Delta) using a numerical model (MODFLOW) to show the effect of the utilization of both groundwater and surface water to overcome irrigation water shortages. Ten scenarios of groundwater management were evaluated to determine the optimal conjunctive ground and surface water and the impact of continuous extraction of groundwater. The best and safest scenario recommended for water management in the studied area was able to satisfy 30% of agricultural demand from groundwater for a period of twenty years. She added that the random use of groundwater by farmers can sometimes cause well discharge reduction and wells impacting each other. She recommended that any well should be at a distance of at least 300 m from any adjacent well, and also should be away from any nearby canal by 1 km, and at a range from 500 m to 1 km from the intake of any canal.
4 Water quality of the Nile Delta aquifer
As explained earlier, groundwater in the Nile Delta aquifer is in hydraulic connection with surface water from Nile River branches, irrigation canals and drainage network. Therefore maintaining groundwater quality requires an integrated approach for both ground and surface water. Many factors contribute to the deterioration of groundwater quality in the Nile Delta aquifer including: leaching of chemicals and pesticides from agriculture areas; disposal of industrial waste; over-pumping of groundwater to meet increasing demand; and saline groundwater up-coning and seawater intrusion.
4.1 Salt water intrusion of the Nile Delta aquifer
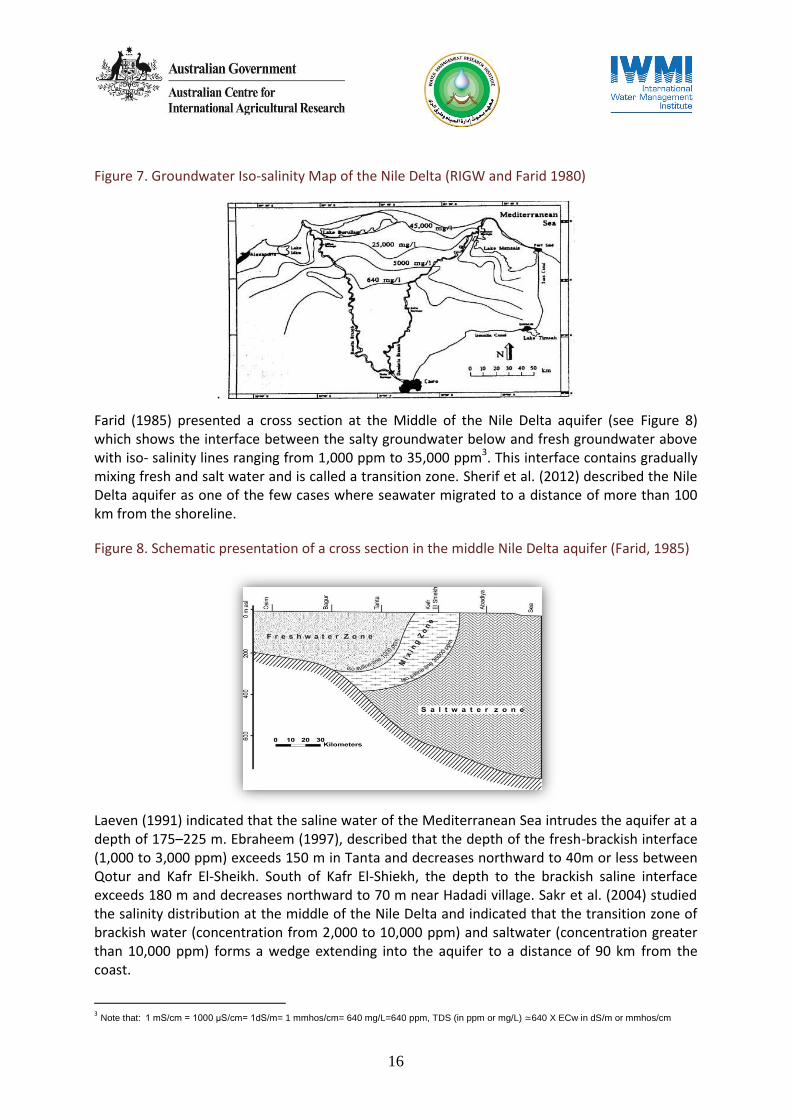
The most common pollutant of fresh groundwater is saline water. Intrusion of saline water occurs where saline water displaces or mixes with fresh water (Mays, 2005). Mathematical and numerical models have been used to predict salinity distribution within the Nile Delta aquifer. Atta (1979) analyzed the groundwater salinity and found that the range of groundwater salinity is between 227 and 15,264 mg/l (or ppm). Farid (1980) indicated that the northern zone is highly saline due to seawater intrusion and presented a map of salinity distribution in the Delta where iso-salinity lines range from 640 to 45,000 mg/l (see Figure 7).
16
Figure 7. Groundwater Iso-salinity Map of the Nile Delta (RIGW and Farid 1980)
.
Farid (1985) presented a cross section at the Middle of the Nile Delta aquifer (see Figure 8) which shows the interface between the salty groundwater below and fresh groundwater above with iso- salinity lines ranging from 1,000 ppm to 35,000 ppm3. This interface contains gradually mixing fresh and salt water and is called a transition zone. Sherif et al. (2012) described the Nile Delta aquifer as one of the few cases where seawater migrated to a distance of more than 100 km from the shoreline.
Figure 8. Schematic presentation of a cross section in the middle Nile Delta aquifer (Farid, 1985)
Laeven (1991) indicated that the saline water of the Mediterranean Sea intrudes the aquifer at a depth of 175–225 m. Ebraheem (1997), described that the depth of the fresh-brackish interface (1,000 to 3,000 ppm) exceeds 150 m in Tanta and decreases northward to 40m or less between Qotur and Kafr El-Sheikh. South of Kafr El-Shiekh, the depth to the brackish saline interface exceeds 180 m and decreases northward to 70 m near Hadadi village. Sakr et al. (2004) studied the salinity distribution at the middle of the Nile Delta and indicated that the transition zone of brackish water (concentration from 2,000 to 10,000 ppm) and saltwater (concentration greater than 10,000 ppm) forms a wedge extending into the aquifer to a distance of 90 km from the coast.
3 Note that: 1 mS/cm = 1000 μS/cm= 1dS/m= 1 mmhos/cm= 640 mg/L=640 ppm, TDS (in ppm or mg/L) ≃640 X ECw in dS/m or mmhos/cm

17
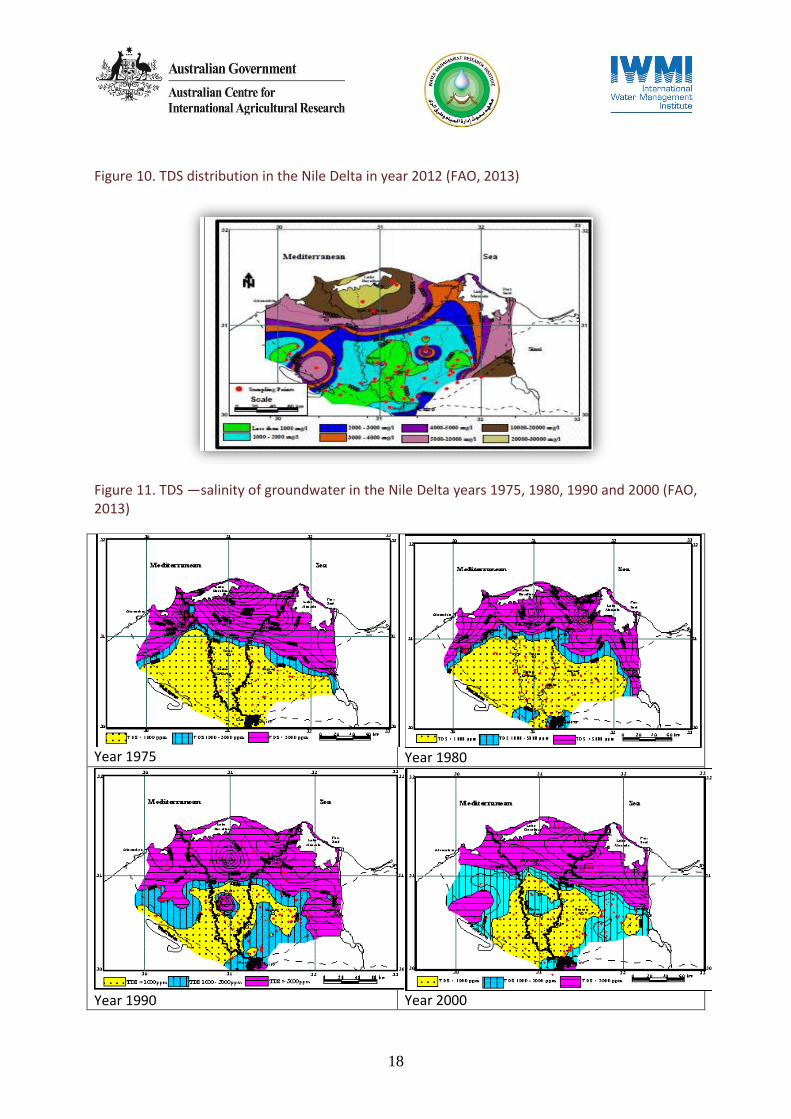
Temporal and spatial variations of the salinity distribution of the Nile Delta Aquifer were addressed by several studies (e.g. Sakr et al., 2004; Morsy, 2009 and FAO, 2013), which analyzed historical salinity records from 1960 to 2012. Sakr et al. (2004) analyzed the water quality between 1960 and 1984 and indicated that groundwater salinity improved with time when freshwater pushed the saline water seaward. In 1985, groundwater salinity increased in some shallow wells as a result of the reduction in Nile water flow during the drought of the 1980s. In 1990, groundwater salinity decreased when the Nile flow was back to normal and due to excessive irrigation, especially in the fringes of the delta. In 2000, groundwater salinity increased again in the eastern and western fringes due to over pumping. Morsy (2009) found similar results by analyzing groundwater salinity from 1992 to 2008 which indicated that fresh groundwater pushed the saline groundwater northward. The salinity contour line of 1,000 ppm moved further north in the middle Delta (see Figure 9).
Figure 9. Comparison of Iso-Salinity line 1,000 ppm location for years 1960, 1980, 1992 and 2008 (after Morsy, 2009)
FAO (2013) compared the values of total dissolved solids (TDS) in the groundwater observation wells of RIGW for the years 1975, 1980, 1990, 2000, and 2012. They produced groundwater salinity contour maps for these years (see Figure 10 and Figure 11) that show a noticeable increase in groundwater salinity all over the Nile delta and especially in the middle of the Nile delta (around Tala city) which has TDS values up to 3,000 ppm in 1990 (this phenomenon is called up-coning and happened due to the over extraction of groundwater and mobilization of deeper layers of the aquifer), decreasing after 2000 and reaching less than 1,000 ppm in 2012. Groundwater abstraction in that area was prevented by the MWRI for more than 20 years. It must be noted that the computer-generated isolines are based on a limited number of observation wells (visible in Figure 11) and don’t represent well variations at the micro-regional scale.
18
Figure 10. TDS distribution in the Nile Delta in year 2012 (FAO, 2013)
Figure 11. TDS ―salinity of groundwater in the Nile Delta years 1975, 1980, 1990 and 2000 (FAO, 2013)
Year 1975 Year 1980
Year 1990 Year 2000

19
These evolutions of groundwater salinity in the delta indicate:
1. The paramount importance of the amount of surface water entering the delta and its
impact on the dynamics of salinity isolines.
2. The maximum depth of fresh water also varies accordingly.
3. More recent data are needed to assess the impact of the explosion of well drilling during
the last 15 years (a seasonal approach is needed as the peak of use for these wells is
during the summer season).
4. Very concentrated pumping (in areas such as around Tala) has the potential to create
some up-coning and localized higher salinity.
El Didy and Darwish (2001) indicated that the storage of freshwater in the lakes El-Burullus and El- Manzala can minimize the intrusion around them. To that effect, Abdelaty et al. (2014) and Nofal et al. (2014) studied the impact of sea level rise using a 3-D model (SEAWAT) and predicted an increase of groundwater salinity and saltwater intrusion.
4.2 Hydrochemistry of the Nile Delta aquifer
Groundwater contains a variety of chemical constituents at different concentrations. The chemical nature of groundwater is influenced by several factors especially when the aquifer is connected with surface water like in the Nile Delta aquifer. Hydrochemical studies test the suitability of water to different purposes such as drinking, livestock, irrigation, and industrial purposes, but "the use of hydrochemical analyzes can serve to understand groundwater chemistry and help establish the source of water, climate, and geology of the region" (Pradhan and Piraste 2011: 51).
Agriculture, domestic and industrial effluent are the main sources of contamination of the Nile Delta aquifer. Higher concentrations of major ions such as Nitrate (No3), Sulfate (So24-), Potassium (K+) and Phosphate (PO3-4) can be caused by the extensive use of chemical fertilizers in agriculture. Also high concentrations of trace elements like Manganese, Iron, and Aluminum were found in the old lands of the Nile delta aquifer due to the dumping of industrial effluents into the drainage system. Moreover, due to the prevalence of septic tanks and the lack of sewage systems in most rural areas in the Nile Delta, the domestic sewage is being disposed of directly into irrigation canals and drains, which increases Ammonium and BOD concentration.
The water quality of the Nile Delta aquifer has been assessed through testing a number of groundwater samples, surface canal water, and drainage water. All the studies showed that the concentration of most water quality parameters and heavy metals exceeded the WHO standards for drinking water, and some studies indicated the areas where the groundwater is not suitable for irrigation either.
Morsy (2009) studied the quality of the Nile Delta aquifer through 50 groundwater samples and 79 samples of surface water from drains. The collected samples from wells were taken from the top portion of the aquifer system at depths 30-135 m from the surface. Screens of sampled wells were located generally in the upper part of the water-bearing zone, usually no deeper than 150 m below the ground surface. She noticed that concentrations of Iron and Manganese were higher in the old lands due to the general natural characteristics of the Nile Delta aquifer and more pronounced in the areas having a clay cap. She added that this situation can be resolved

20
through aeration of the extracted groundwater. More than 50 % of her samples showed high concentrations of Aluminum. She indicated that local contamination from industrial areas also led to high concentrations of Lead (Pb) in the city of Tenth Ramadan (Eastern Nile Delta) and Sadat city (Western Nile Delta). Also high concentrations of Cadmium (Cd) were found in Mobarak city (Middle of the Nile Delta).
Water quality of the groundwater in the western, middle, and eastern parts of the Nile Delta was investigated by several researchers:
4.2.1.1 Western part of the Nile Delta (Newlands)
For the western fringe of the Nile delta, Sharaky et al. (2007) examined 108 groundwater samples from depths between 27.5 to 120 m. The results indicated that the concentrations of major ions were higher than the maximum standard limits according to the World Health Organization (WHO, 1996). The nutrient content in phosphates was also higher than the maximum standard values, while nitrate levels were critical. They recorded maximum concentrations of nutrients in the old cultivated lands and indicated contamination from irrigation water. They also reported that the concentrations of trace elements were lower than the standard limits, except for iron, manganese and nickel. They concluded that groundwater in the studied area had good quality and was suitable for irrigation for all types of soils but not suitable for drinking purposes.
Masoud (2014) examined 451 shallow groundwater samples for the same area. Most hydrochemical parameters showed very wide ranges. Concentrations of TDS (201–24,400 mg/l), pH (6.72–8.65), Na+ (28.30–7774 mg/l), and Cl- (7–12,186 mg/l) suggest complex hydrochemical processes of multiple sources. He explained that the high concentrations of Fe2+, Mn2+, Zn2+, Cu2+, Ni2+, were mostly related to their natural presence in water-bearing sediments and/or to contamination from industrial leakage. Also, he reported very high nitrate concentrations exceeding the permissible limit (50 mg/l) due to wastewater leakage. He concluded that groundwater was unsuitable to irrigate regular crops due to high salinity in most areas close to the sea (Abis, North-Tahrir, Mariot) and west of the Cairo-Alexandria road (with only the track of land between this road and the Nubaria canal having access to reasonably good groundwater).
Morsy (2009) noted that salinity increased by 50 to 650 ppm from year 1992 to 2008 in areas suffering from lowering groundwater levels, such as Khatatba road, Wadi el Faregh, and Dina farm in the west of the Nile Delta, where groundwater is the only water source. Increasing levels of groundwater salinity were also found in the water logging areas in El Nubaria (west of Delta), and Mullak, Wadi Tumelate, Salhyia (east of the Delta) within a range of 500-1200 ppm.
4.2.1.2 Middle part of the Nile Delta
Fattah (2014) conducted a study on groundwater in the southern part of the Nile Delta by testing the chemical properties of 80 samples. Salinity had values ranging from 296 mg/l to 810 mg/l. Diab (1982) and Dahab (2003) explained that the increase in salinity is due to the effect of vertical downward seepage of sanitary and agricultural waste water as well as the dissolution of salts from the sediments of the aquifer itself. A salinity diagram was used by Fattah (2014) to test the suitability of water for drinking and irrigation. The result reflected the suitability of groundwater for irrigation purposes under normal conditions, while he recommended a set of

21
mitigations for the safe use of groundwater for drinking, and also highlighted the need for treatment of wastewater before discharge into the Rosetta branch.
Ghoraba et al. (2013) investigated groundwater quality in the central part of the Middle Nile Delta (El-Gharbiya Governorate) through the hydrochemical analysis of 34 groundwater samples (with depths ranging between 13 m and 60 m) plus 10 samples from canals and 14 samples from drains. They concluded that the Quaternary aquifer in the studied area is quite vulnerable to pollution. The deterioration of groundwater quality clearly indicated that human activities caused serious pollution problems, including high nitrate concentrations within the area (except in the north eastern part). They indicated high concentration of Ammonium in a village located in the central part of El-Gharbia governorate (Birma village). The values of Ammonium concentration reached 3.3 mg/l which exceeded by far the drinking water standards (0.5 mg/L). Also, nitrogen pollution was noticed due to the use of effluents from a sewage treatment plant for irrigation, sludge and animal manure, septic tanks, soil nitrogen and chemical fertilizers. They suggested a management scenario to reduce the contamination in the study area by drilling eight extraction wells to pump the contaminated groundwater out of the aquifer for treatment.
One of the main problems related to groundwater in the Delta is the reddish color caused by the presence of ferrous compounds and Manganese. Salem et al. (2012) investigated the water quality parameters Iron and Manganese of the central part of the Middle Nile Delta in El-Gharbia Governorate from 34 well samples. The results indicated concentrations of Iron (0.1 - 1.33 mg/l) and Manganese (0.5 - 1.45 mg/l) in most samples higher than World Health Organization and Egyptian Standard (see annex). They concluded that the main polluting sources were from chemicals and fertilizers used in fruit farms, as well as from petrochemical and industrial activities.
4.2.1.3 Eastern part of the Nile delta
Hussein (2007) assessed the impact of industrial activities in the eastern part of the middle of the Nile Delta. He tested 75 samples from drinking water wells, industrial production wells, sewage water and drains of the industrial area (Quesna). He analyzed the major cations and anions and also the Ammonium (NH4+), Nitrite (N02-), Phosphate (P043-), Boron (B+) and trace elements. The results showed a general deterioration in the groundwater quality in all production wells located inside or close to the industrial area due to increasing levels of TDS, Fe, and Al concentrations. He explained that this deterioration of groundwater quality could be related to the following causes: factories illegal sewage disposal; dump disposal sites; leakage from transportation sewage pipes; leakage from sewage storage tanks; and leakage from El Khadrawya Drain which receives the Mobarak Industrial area wastewater. Also, Morsy (2009) indicated that the water samples showed contamination with reuse of agricultural drainage water in Sharqiya Governorate (Bahr el Bakar, Belbeis and Qalyubeya drain).
In conclusion, researchers have tested different groundwater quality variables in different areas of the Nile Delta aquifer but few studies have been conducted across the whole Nile Delta, leading to a lack of consistency or comparability in the data. Observation wells of the RIGW have well screens at depths between 20 and 75 m, whereas production wells tap groundwater at depths between 20 m to 150 m (Morsy, 2009). Also, each study tested a different number of samples and at different depths, making it difficult to compare them, or to show temporal

22
variations. All in all, however, chemical analyses show a clear trend towards degradation, with many areas where water is not suitable for drinking, or even irrigation, purposes.
5 Current groundwater use in the Nile Delta
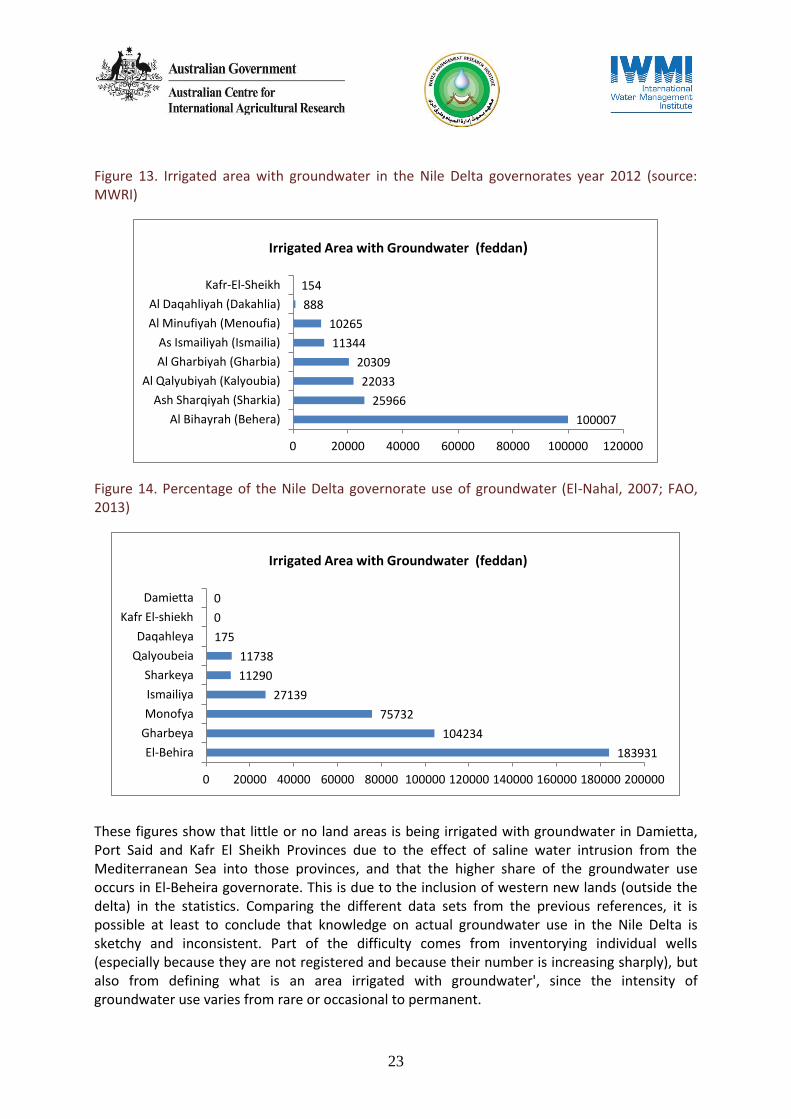
Data about current groundwater abstraction levels in the Nile Delta is lacking and contradictions regarding the total irrigated area with groundwater can be noticed in the published data. As indicated earlier, the Nile Delta aquifer serves nine governorates, and according to the FAO (Aquastat, 2013) the total irrigated area using groundwater is 113,532 feddan (Figure 12). However, at the same time official records from the MWRI indicate that the total area using groundwater in the Nile Delta is 190,966 feddan (see Figure 13), whereas, according to a recent report by FAO (2013) the total irrigated area by groundwater in the Nile delta would amount to 414,240 feddan.
Figure 12. Irrigated area with groundwater in the Nile Delta governorates
(source: Aquastat, FAO, http://www.FAO.org/nr/water/aquastat/irrigationmap/egy/index)
35316
18893
15186
15043
9356
7623
4979
4528
2608
0 5000 10000 15000 20000 25000 30000 35000 40000
Al Bihayrah (Behera)
Al Daqahliyah (Dakahlia)
Al Gharbiyah (Gharbia)
Al Minufiyah (Menoufia)
Al Qalyubiyah (Kalyoubia)
As Ismailiyah (Ismailia)
Ash Sharqiyah (Sharkia)
Dumyat (Damietta)
Kafr-El-Sheikh
Irrigated Area with Groundwater (feddan)
23
Figure 13. Irrigated area with groundwater in the Nile Delta governorates year 2012 (source: MWRI)
Figure 14. Percentage of the Nile Delta governorate use of groundwater (El-Nahal, 2007; FAO, 2013)
These figures show that little or no land areas is being irrigated with groundwater in Damietta, Port Said and Kafr El Sheikh Provinces due to the effect of saline water intrusion from the Mediterranean Sea into those provinces, and that the higher share of the groundwater use occurs in El-Beheira governorate. This is due to the inclusion of western new lands (outside the delta) in the statistics. Comparing the different data sets from the previous references, it is possible at least to conclude that knowledge on actual groundwater use in the Nile Delta is sketchy and inconsistent. Part of the difficulty comes from inventorying individual wells (especially because they are not registered and because their number is increasing sharply), but also from defining what is an area irrigated with groundwater', since the intensity of groundwater use varies from rare or occasional to permanent.
100007
25966
22033
20309
11344
10265
888
154
0 20000 40000 60000 80000 100000 120000
Al Bihayrah (Behera)
Ash Sharqiyah (Sharkia)
Al Qalyubiyah (Kalyoubia)
Al Gharbiyah (Gharbia)
As Ismailiyah (Ismailia)
Al Minufiyah (Menoufia)
Al Daqahliyah (Dakahlia)
Kafr-El-Sheikh
Irrigated Area with Groundwater (feddan)
183931
104234
75732
27139
11290
11738
175
0
0
0 20000 40000 60000 80000 100000 120000 140000 160000 180000 200000
El-Behira
Gharbeya
Monofya
Ismailiya
Sharkeya
Qalyoubeia
Daqahleya
Kafr El-shiekh
Damietta
Irrigated Area with Groundwater (feddan)

24
Data by Hefny and Sahta (2004) for 2004 provide a detail on the number of wells used for irrigation and for drinking water.
Table 1. Number shallow wells and their uses in the governorates of the Nile Delta
Governorate
Use for irrigation Use for drinking Total
Usage1000 m
3/year
No. of wells
Usage1000 m
3/year
No. of wells
Usage1000 m
3/year
Alexandria 654 9 0 0 654
Beheira 613100 2446 32100 150 645200
Great Cairo 700 16 1126800 99 127500
Dakahlia 78882 449 26284 62 105166
Gharbia 135000 716 100200 263 235200
Ismailia 137000 1073 7800 12 144800
Kafer El-Sheikh 0 3 0 0 0
Menufia 529000 1992 124700 155 653700
Qaliubia 2179000 1725 56200 245 274100
Sharkia 506000 3455 76600 203 582600
Total 2218236 11884 550684 1133 2768920
Source: Hefny and Sahta (2004)
6 Dynamics of groundwater use in the Nile Delta
Like many irrigation systems in the world, the Nile Delta irrigation system is experiencing several problems. Throughout the ages, the irrigation network has become very complex and its management a real challenge. Water access problems are no longer confined to land located at the tail end of canals and water shortages can be noticed in mesqas located at the head of the canal. This situation of water scarcity increased since 2010 (according to our interviews with farmers and fieldwork). Therefore, farmers in the Nile Delta area have increasingly turned to groundwater and wells in order to secure water for their crops. As part of this research project, a survey was carried out in the central part of the Delta – between Tanta and Qotur, in order to assess the current expansion of the use of groundwater. Fieldwork consisted in an exploratory survey over different parts of the central Delta to understand the situation, and characteristics of drilled wells (see Figure 15). Accordingly, fifty seven structured questionnaires were conducted to study the history, trends, motivations, well operation, social arrangements, and economic aspects of groundwater abstraction in the Nile Delta. The water quality of surveyed wells was also measured (whenever possible) to assess the variability of groundwater salinity in the monitored area (measured by the electro-conductivity of the water).

25
Figure 15. Locations of the survey
6.1 General specifications of the surveyed wells
6.1.1 Investment decisions and access to water
The decision to invest in drilling a well can be individual as well as collective. Three main patterns were observed during the survey.
Some of the wells observed had been drilled over the past 25 years. Initially, a few big land owners drilled them in one plot, or next to several of their plots in order to secure access to irrigation water. Use of the well by other farmers is in general possible, with several arrangements described in the next section.
Another type of well investment found in the surveyed area is the collective or community-shared well. Farmers irrigating from the same marwa, located near to each other, or family members would share a well. Our field observations showed that since around 2010, farmers have started to drill and abstract water from collective wells, sharing the capital costs together and operating the well collectively and/or individually (see next section).
The third type of well found in the Nile Delta is the individual well with privative access. In this case, farmers preferred to drill their own well and keep their independence with regard to supply and access to groundwater. This may either be due to a high level of reliance on the well, as observed sometimes near the tail-end of canals where surface water is scarcer (which makes it cumbersome to deal with multiple request), or reflect local social relations (for example someone drilling a well because of conflicts with other farmers with regard to the distribution of water within the mesqa).
Recently, given the increase and widespread use of wells during summer, farmers tend to drill individual wells, in some cases for only 1 feddan. According to the surveyed wells we found that both individual and collective wells irrigate an area between 2 to 40 feddan.
Most surveyed wells were located along mesqas, canals or drains as shown in Figure 16. The location for community-shared wells is usually the place of the old saqia, from where the different marwas would split and feed the different land plots, or at a shared place between the

26
land plots of the group of farmers sharing the well. It is interesting to observe that some small distribution basins are used to receive water pumped from both the mesqa and the well, from which they are distributed through either earthen marwas or concrete/brick small canals. A larger sample of observed wells also shows examples of wells located in the middle of specific plots, or bordering secondary or main drains (see Figure 17).
Figure 16. Locations of well surveyed
Figure 17. Illustrations of different well locations
Along a main drain
Along a secondary drain
Not available but observed
In the middle of a field
Along a mesqa (direct to plot)
Along a mesqa (into marwas)
Along a mesqa (with concrete marwa)
6 wells 3 wells
48 wells
along canal along Drain along mesqa
0
10
20
30
40
50
60

27
6.1.2 Well characteristics and operation
The depth of the surveyed wells varied between 55 to 92 meters, with water being found between 4 and 15 meters from the ground surface. Even though the diameter of wells varied between 6 to 12 inches, most were 8 inches in diameter. Wells are drilled at an average cost of 11,180 LE (see more information on economic aspects in section 6.5). Table 2 presents some of the main well characteristics.
Table 2. Main characteristics of the wells surveyed
Characteristics Range
depth (m) 40-95 m
surface irrigated (fed)* 1-40 feddan
cost of drilling + casing (LE) 6,000-20,000 LE
cost of pump (if new) 3,000-11,000 LE
consumption (of diesel per hour) 1.5-2.5 l/h
*This is for all wells (including shared and individual wells).
The life duration of wells may not be as long as one often believes. A common cause for the abandonment of wells is the blockage of pipes (especially those made of steel or metal). The farmer owning Well No. 10 referred to maintenance problems with the first set of (iron) pipes installed in the well, which had to be changed for plastic ones 5 years ago as they were clogged up. A few farmers re-drilled their wells after about 8 to 10 years (in a new location, but generally close to the first one). Newer wells would all have plastic pipes installed from the beginning.
Farmers operate the wells using three main types of energy source (Figure 19 suggests that the use of movable pump sets is now dominant. The use of tractor used to be more common in the past, probably on account of the larger proportion of large landowners drilling wells initially. Water from the well can also be combined with surface water from the mesqa, pumped alternatively from the well or the canal, either directly into the field or into the pump basin first and then to the field through the marwa.
Figure 18): 1) Movable suction diesel pumps; 2) electric pumps (although they are very rare); 3) tractors operating the suction pump (this can be done either via axial rotation connected to the tractor engine or through a belt connected to the rotor of the tractor). Some shared wells can be used though both tractor and pump.
Figure 19 suggests that the use of movable pump sets is now dominant. The use of tractor used to be more common in the past, probably on account of the larger proportion of large landowners drilling wells initially. Water from the well can also be combined with surface water from the mesqa, pumped alternatively from the well or the canal, either directly into the field or into the pump basin first and then to the field through the marwa.

28
Figure 18. Pump and engine configurations
Well with diesel pump
Well with diesel pump
Tractor-powered pump (through a shaft)
Tractor-powered pump (through a belt)
Well with electricity-powered pump
Well with electricity-powered pump
Wells can also be used in combination with surface water pumped from the mesqa
Well from which water abstracted can be combined with water pumped from the mesqa
Well from which water abstracted can be combined with water pumped from the mesqa pit

29
Figure 19. Wells and sources of energy in the Central Delta
All surveyed wells did not have a permit from the Ministry of Irrigation (a specification required by Egypt’s Irrigation and Drainage Law from 1984). Interviewed farmers had not heard of any well with a permit and were not aware of the procedures for obtaining one. The farmer of well No. 13 stated that his well is not registered; he thinks that if he registered his well, he would not be fined for illegal rice cultivation. Meanwhile farmer No. 47 paid 1,800 LE/feddan as a fine in 2013 for cultivating illegal rice.
Farmers in Well No. 1 stated that their groundwater well needs a 10-HP pump to be operated efficiently and get a good amount of water, but it can go up to 14 HP (as mentioned by the farmer using Well No. 8, pumps used by other farmers using the same well would go up to 14 HP). Many farmers would buy new pumps with capacities ranging from 7 to 14 HP costing from 3,000 to 11,000 LE (average cost of the new ones is 8,000 LE) in order to operate the well. This is because extracting groundwater requires more energy than pumping directly from an open channel.
During the exploratory mission, some farmers were land renters and others land owners. Farmer sharing Well No. 7 would rent the land at 5,000 LE per season. The price for renting the land during the summer was 3,000 LE per feddan due to the fact that the cost of irrigation is higher than during the winter season.
6.2 Social arrangements for installing and operating wells
6.2.1 Single owner, several users
As mentioned above, well drilling started more than 20 years ago by a few big farmers and land owners who, with the aim to secure water for their crops in view of surface water shortages, drilled the first wells. These individual wells, owned by one individual, can however be shared, as neighboring famers may be allowed to use these wells occasionally, when facing water shortages.
0
1
2
3
4
5
6
7
1987 1994 1995 1999 2000 2001 2002 2003 2004 2005 2007 2008 2009 2010 2011 2012 2013 2015
Pump tractor tractor & pump

30
In some instances, these individual wells are allegedly shared as part of a sense of religious and communal duty (Islamic tradition) from the well owner. As mentioned by Interviewee No. 54, "the owner of this well drilled it for Allah" (that means anyone can use it). However, our preliminary research also indicates that the ownership of the well and the rules of access also perform a social role as they can be extensions of other forms of social capital amongst the community. Observations show that some well owners with private wells would tend to be larger farmers and better-off, honoring in some instances traditions of free access established by their fathers in the past but also using this service as a way to secure and preserve their social status within the community. As interviewee No. 54 explained, his "grandfather drilled it 11 years ago and let anyone use it and his sons continue to do the same".
Some farmers are allowed to use their own pump and irrigate from the well without paying because the owner sees several advantages to that. Interviewee No. 24, for example, said that "any farmer can bring his own pump and irrigate from the well because running the well prevent the blocking of the pipes". Interviewee No. 27 shared the perception that "the more the well is being used the greater the amount of water discharged from it".
Land owners drilling their own wells are usually the ones depending mostly on groundwater for irrigation. Farmer No. 21 who own 2 feddan of citrus has his own well. Other farmers can use the well from a neighbor but in most cases they then have to pump water twice, first into the mesqa and then from the mesqa to their respective land plots.
A special case was found in well No. 4, which was shared between the owner and his tenant. The tenant was renting the land but did not participate in the initial cost of drilling the well (he was irrigating by pumping water from one of the manholes of the subsurface drainage system). During our interview the farmer said that he had an arrangement with the owners of the well by which he would get water and pay only for the operation costs. However, in order to use water from the well, he would have to pump the water into the mesqa canal and then from the mesqa canal to his land plot. In order to irrigate one feddan through this operation, it would take 5 hours.
We have also observed that some larger landowners with private wells allow their tenants to use the well, either by using their individual pumps or by paying the cost per hour of using a tractor owned by the land owner. That was the case of surveyed well Nos. 30, 51 and 56. There are other cases in which the farmers pay additional costs for using the well from a neighbor.
6.2.2 Collective wells
During our fieldwork we found 32 communal wells shared by a total of 366 farmers (in some cases up to 30 farmers would share one well), that is, about 70% of survey wells were shared between farmers while 30% were individual ones.
The observed associations of groundwater users in the Delta are merely associations for the joint use of groundwater, that seek to finance the investment of a well (and sometimes of the corresponding pump). Joint investment is justified by the fact that farmers often only need the well to secure their crops in case of surface water shortage, but these shortages are often not frequent enough to justify an individual investment. Several types of arrangements regarding pumping have been identified (see also Table 3).

31
1) Individual pumps. Well No. 3 serves 40 feddan of land, and was shared between 30 farmers. Farmers shared the initial cost of drilling and the part of land needed to drill the well. A farmer at Well No. 13 said that farmers do not like to share pumps as some of the farmers do the maintenance regularly and others do not. Therefore, most farmers share only the initial cost of the well (drilling and casing) and operate individually, as each one has his own pump to use for irrigation. Farmers will connect the same pump used in the surface water canals to the well. This is the most common situation.
2) Individual new pumps. Farmers use their own pump but may buy a new one with higher capacity, over 7 HP, to be able to use the well more conveniently. Pumping from groundwater requires a higher capacity than for pumping from the mesqa. The old motor is either sold or kept for other pumping operations.
3) Hiring or sharing a tractor. Farmers can also hire tractors from other users to operate the pumps. The farmer interviewed at Well No. 3 would pay 40 LE per hour to use a tractor to run the pump. Farmers pumping water from Well No. 6 shared a tractor. In some of these cases, depending on the type of pump installed in the well – pump fitted with a rotor to be linked to a tractor-, farmers wanting to use the well would have no choice but to rent the services of the tractor from the owner of the well if they wanted to use the well. The costs for sharing the tractor have however increased due to the increase in diesel prices. Before the increase hiring the tractor would cost them 25 LE per hour, after the increase 40 LE per hour.
4) Collective pumpset. Interviewee No. 22 explained how 10 farmers participated in the initial investments for drilling a well, but also purchased a (fixed) pumpset (14 HP). This group of farmers hired one of them as operator to collect the operation costs from the members.
5) Allowing outsiders to use the well. A farmer not part of the group (of investors), may be allowed to use the well but would have to pay the operation costs, plus -for the case of well 22- an additional cost of 5 to 10 LE/hr. The group would then save the money in order to pay for the future maintenance of the pump. Like for individual owners, access to the well can also be free, depending on the frequency of the use, the relationships with the group, the situation of the farmer himself, etc.
Interviewee No. 45 described how a farmer wanting to use the well pays "from 30 to 40 LE/hr or he can bring his own tractor." Regarding such arrangements, interviewee No. 34 explained how anyone who wants "to use the well can use it, but he will pay 5 LE/hrs and bring his own pump (…), we use the money collected for the maintenance of the well". The costs for sharing the tractor have however increased due to the increase of diesel prices, going from 25 LE/hr to 40 LE/hr.
6) Double pumping. In many instances the group of farmers corresponds to a former saqia ring, or to the group sharing one marwa (field irrigation ditch). As a result outsiders occasionally requesting to use the well are often not hydraulically connected to the group. They therefore use the mesqa as a conveyor to bring the well water to their field: they first connect their individual pumps to the well head and pump groundwater into the mesqa. At a second stage, water is re-pumped from the mesqa into their lands (Figure 20). This process however doubles the cost of irrigation as water is pumped twice in order to reach the field. In general this means that groundwater is used only as an 'emergency resource', when a real surface water shortage happens.

32
7) Irrigation turn. Despite the diversity of these arrangements, we did not observe collective distribution rules for the allocation of groundwater during our fieldwork. The irrigation turn would be established on a first-come first-served basis. This lack of more complex water sharing rules suggests that there is still no substantial pressure on the resource and users have not been faced with the necessity to further regulate and allocate irrigation turns amongst them (for example allocating the well based on a specific duration per feddan).
Figure 20. Schematic of well location and pumping arrangements along a mesqa
Mesqa
Farmers sharing well 1 and also individually pumping from the mesqa. The last farmer at the tail end does not have enough surface water and only uses the well
Well 2 Well 1Pumping directly from the mesqa
Farmer has an individual well and also pumps from the mesqa
Farmer pumps directly from mesqa
Farmer pumps directly from mesqaand also uses shared well 2, pumping water twice
6.3 Groundwater quality of surveyed wells
Water quality parameters were measured when possible (i.e. the pump being operated during the time of the interview) to assess salinity variations across the area. Ranges for electrical conductivity (EC) varied substantially, from 596 to 2,351 μmhos, even within a rather limited distance between wells (Figure 21). This suggests that groundwater salinity is affected by a number of local variables such as, potentially, soil type and infiltration of sewage or pollutants. Farmer from well No. 1 had noticed salt deposits in the field during winter. When that happened he stopped irrigation from the well and started irrigating from the canal to leach the soil.
Most farmers indicated that they don’t prefer irrigating from wells as they perceive that groundwater lacks the nutrients necessary for their lands. They also mentioned that with groundwater the "soil dries faster". Whenever possible, they mentioned that they prefer to mix canal water with groundwater. Interviewee No. 37 who owns 10 feddan was pumping from both the canal and the well at the same time. On the other hand interviewee No. 43 who shares a well with 5 other farmers mentioned that the productivity of his land improved after irrigating from the well water (from 3 tons to 4 tons of rice in 2014). Also interviewee No. 1 believes that the well water has minerals that benefit the crops.

33
Table 3. Investment, access and water distribution rules
Well type Investment
decision
Access and distribution
Members Non-members
Shared well
Shared
Members share drilling costs as well as O&M. All members connect their own pumps to the well, unless a collective pumpset is purchased.
Non-members may be allowed to access water by connecting their own pumps to the well head (on a paid-for or free access arrangement).
Individual well
Shared
Neighboring farmers are allowed by the well owner to connect their pumps to the well and pump either to their nearby fields or into the mesqa, so that water can be re-pumped back into their fields. Some owners will ask farmers to pay a fee or to use the tractor of the well owner to lift the water having to pay a fee. Others will let the outsider using the well for free.
Individual
Well owner drills well to supplement surface water irrigation or to depend on groundwater solely
Privative access
Figure 21. Spatial distribution of ground water salinity

34
6.4 Irrigation practices
We tried to assess the frequency and duration of the use of wells by farmers, but realized that answers were very much influenced by their fear to be fined (given that their well is undeclared and illegal). They, in general, tried to minimize the use of their wells or gave contradictory statements during the interview. This poses a challenge to the overall assessment of how much groundwater is effectively abstracted through wells in the Nile Delta; consequently the following results must be taken with caution.
Predictably, wells and are mostly operated in summer. Out of 43 respondents, we found that 63 % of farmers use the well in summer between 80 and 100 % of the time, when the probability of water shortages is higher. In winter, out of 40 respondents, we found that only 32 % of farmers use the well between 80 and 100 % of the time (with 47.5 % of farmers using groundwater in winter between 0 and 50 % of the time).
All farmers interviewed practice surface irrigation and the crops observed were onion, berseem (alfalfa), wheat and sugar beet in winter, while in summer they cultivate rice (most of the time), maize, and pumpkin seeds. A farmer using Well No. 9 however said he does not like to cultivate onion because it is costly. Instead they would cultivate wheat, sugar beet, and berseem in winter and rice in summer. Onion is a very popular crop in the area but not all the land is suitable for cultivating it. Farmers using Well No. 6 mentioned that after 2 to 3 years of cultivating onion they must switch to another crop for one year. As a cash crop, onion needs to have a secure supply of water, which encourages the drilling of well and conjunctive use. Interviewee No. 48 indicated that they cultivate berseem in winter and maize in the summer (used for animal feeding) because the area (Qotor district) is famous for livestock.
Most of the farmers indicated that the time used to irrigate their fields using the wells is longer than the time spent to irrigate using surface water from the canal, especially during the summer as all the wells are operated at the same time (potentially causing interferences between wells, as some of them are very close to each other). A farmer interviewed at well No. 50 said that the water table depth would drop to 10 m in June and July and as a result irrigation time increases from 5hr/feddan to 7 hr/feddan. Also, Farmers in Wells No. 10 and No. 11 described that one feddan of rice can take up to 3 hours to be irrigated using the wells while it would take 1.5 hr if irrigated from the canal. Interviewee no. 15 said "I used the well for preparing the land for cultivating 40 kerat of rice and it took me the whole day". The farmer interviewed using water from Well No. 10 said that land preparation would take 5 hours using groundwater from the well compared to 3 hours using water from the canal.
Even though farmers complain about the 'lightness' of groundwater (carrying less sediments), compared to the 'heavier' and richer-in-sediments surface water from the canal, they have no choice but to supplement the 'richer' surface water with 'poorer' groundwater in times of need (e.g. peak irrigation times in the summer for rice). In one instance however, one farmer however noticed that on the contrary he preferred to use water from the well as, according to his perception, it had 'more minerals' than surface water.
Another important issue is whether the relatively high density of wells in some areas may result in severe drops of the water table when farmers pump at the same time. This not only increases pumping costs for all users but also may result in dewatering of the well, and damage to the

35
pump. The farmer at Well No. 7, shared between 15 farmers, said that if they all operated the wells at the same time, the amount of water coming from the well would decrease. It seems however that even in time of intensive use, suction pumps are still able to function.
6.5 Economic aspects of groundwater abstraction
As seen above, wells are either owned by a group of farmers or by one individual. The cost of drilling can also be shared between groups of farmers as described earlier or the farmer invests individually according to the area of his land and to what extend he uses the well. The cost differs according to the depth and the year it was drilled. The cost of drilling/casing the well in the area surveyed varied from 4,500 to 20,000 LE, with average drilling costs of the wells surveyed at around 11,000 LE (that is, an average cost of 161 LE per meter drilled). Farmers from Well No. 6 however mentioned that the cost of drilling a well 10 years ago, 8,000 LE, would now be 16,000 LE. Figure 22 shows the increase of the cost of drilling wells per unit of depth (m). Taking inflation into consideration it can be seen that drilling costs have remained more or less stable in the past 20 years.
Farmers started to drill wells with steel pipes at the beginning but due to blockages these pipes were later replaced with plastic ones. Farmer No. 11 who is irrigating 30 feddan from the well said "I drilled a well 10 years ago with iron pipes at 70 m depth and the diameter was 8 inches; that cost me 40,000 LE. Five years ago and I dug another one with plastic pipes because the old one was blocked."
Figure 22. Evolution of the cost of drilling wells per unit depth from 1994 to 2015
During the survey we also met a number of well drillers (contractors), coming from different areas in the Delta (e.g. El-Giza, Menofiya). They indicated that a lot of farmers request their services, with one contractor interviewed saying that they are digging a well every week. A farmer using Well No. 48 (contractors drilled the well two weeks ago) said "the contractors have
0
50
100
150
200
250
1994 1995 2000 2002 2003 2004 2005 2007 2008 2010 2011 2012 2013 2014 2015
LE/m
36
many requests for digging wells in the area until the end of the year". The driller stated that the cost of drilling a well is around 70 LE per meter, a value that is lower than those reported by farmers, presumably because it does not include casing.
Groundwater abstraction in the Delta is not cheaper than surface water irrigation, on the contrary. Pumps have to run longer, implying additional diesel consumption. Wells in the Delta have high capital costs and higher running costs than surface water irrigation with mobile diesel pumps. Pumps connected to wells have to lift water from a deeper depth, and from a reservoir with lower transmissivity, and therefore consume more diesel than when pumping water directly from an open mesqa (between 2 and 3 times longer, and more energy per unit of time). The amount of diesel used for wells varies accordingly. Farmers from Well No. 1 noticed that the operation of the pump for the well would consume around 1.5 liters of diesel ('solar'), whereas one hour operating the pump from the canal would consume 1 liter. Many farmers such as the one interviewed at Well No. 2 referred to a difference of 2 to 3 times more in terms of diesel consumption used to irrigate one feddan with the well compared to the surface canal. The pump from the canal would typically use 5 to 6 liters of diesel to irrigate one feddan, whereas the pump connected to the well would use 12 liters. Farmers sharing Well No. 5 had to pay 2 liters of diesel for one hour of operation, as opposed to 1 liter of per hour for pumping from the mesqa.
Increases in diesel prices in Egypt have affected the groundwater economy in the area studied. As noted earlier, the price for hiring the tractor went from 25-30 LE to 40 LE per hour since July 2014 due to the government decrease in subsidies for fuel. It is to be expected that if further reductions in energy subsidies happen, farming costs will increase and put additional pressure on farmers’ livelihoods.
The farmer of well No. 5 mentioned that the maintenance of the pump they are using for operating the well cost from 500 L.E to 600 L.E every year. This includes changing the oil of the motor every 50-60-70 hrs of operation, as mentioned by interviewees Nos. 47, 50 and 43 respectively. Diesel pumps have much higher maintenance costs when pumping under conditions of higher head.
6.6 Drivers of groundwater-supplemented irrigation in the Delta
One of the main objectives of the survey was to assess the drivers for the expansion of groundwater use in the Middle Delta by farmers over the last 20 years. We asked farmers why they used the wells despite the fact that it is more costly than using canal water. Most interviewees indicated that water shortage is the main reason for drilling the well. The reasons of the water shortage affecting farmers in the research area are summarized in Figure 23.

37
Figure 23. Main reasons for water shortages, as perceived by farmers
Irrigation increasingly depends on the conjunctive use of surface water and groundwater. This is mostly due to the fact that water is sometimes not available from the irrigation canals, especially in summer. Farmers from Well No. 7 stated that if water would reach them through the surface water canals they would not have to use their well. In their case, they used groundwater from the well around 80 to 90 % of the summer season. The farmer interviewed at well No. 13 said that they only use the wells in case of emergency, when water from the canal is not available. Farmers sharing Well No. 1 also irrigate from the well when there is shortage of canal water. During the 2014 summer season, they had to use the well twice during the preparation of the land for the summer crops. The main irrigation campaign for the summer however was carried out with surface water from the canal. Farmer abstracting water from Well No. 3 also mentioned that since he did not receive water from the mesqa canal during the summer season, he had to use the well. In conclusion, the intensity of well utilization is extremely varied and often difficult to quantify as it depends on specific canal conditions and supply of surface water.
Around 84% of the surveyed wells are located at the mesqas level, with fewer wells located in land plots near the main canals. About 37% of interviewees indicated that the amount of water being released by the Ministry of Water Resources at the main and branch canals is now less than before. They indicated different dates when they started to feel the reduction in water supply; most of them pointing to 2010 as the date of water supply reduction by the Ministry (see Figure 24).
Maintenance (canal)
6%
Maintenance (mesqa)
22%
more rice culivation
3% pipe part of
mesqa or canal 25%
Source Reduction
41%
villages disposals
3%

38
Figure 24. Farmers responses to the date they felt the water shortage
In canals facing water supply problems, (especially in tail end sections like the Smella and Damat canals), farmers have no choice but to drill wells. The farmer from Well No. 5 mentioned that if there were no wells he would not be able to cultivate his land plot. The farmer stated that he was only able to irrigate his land (rice field) from the mesqa 6 times and the rest of the season he had to use the well.
Piping part of the mesqa or canal
Many mesqas have parts that are piped when they cross a drain, road, railway and/or villages. Farmers also referred to the maintenance of these pipes (e.g. clogging with rubbish) as another reason for the water shortage experienced by farmers downstream from these areas. As interviewee No. 49 said "20 years ago the water level at the mesqa was good, but now the mesqa passes through many villages and some covering pipes are hindering the flow". Interviewee No. 43 also indicated that "the pipe that brings the water from Smella branch canal across the drain lowered and also broke and the water of Seberbay drain enters the pipe and return to the mesqa". Our fieldwork also found cases where the pipe of the aqueduct is broken and water leaking from it and the water can’t reach the end of the mesqa, like the case of interviewee No. 23.
Farmer No. 35 said "the water access was good 15 years ago, but after covering the canal at El-Shabrawey village and also the construction of a bridge upstream at the first reach of the canal, these structures impeded the water from reaching the next two reaches of the canal." Farmer No. 37 who irrigates from Smella branch canal reported that "10 years ago we were irrigating from the canal under gravity without pumping, the water level in the canal was higher than nowadays. The canal runs through villages and the Ministry of water resources covered the canal passing through the village and that affected the flow of water here".
Lack of mesqa maintenance
The agriculture cooperatives are responsible for the mesqa maintenance and they collect annual fees from farmers and hire a machine to do the maintenance. Many farmers complained that the cooperative no longer does the maintenance of the mesqas properly. In well No. 41 the mesqa was fully deteriorated and the farmers had been depending mainly on groundwater from wells
0
1
2
3
4
5
6
7
8
1995 2000 2002 2004 2006 2008 2009 2010 2011

39
for irrigation for the last 15 years. Also farmer No. 44 stated that "the mesqa pass over the drain by a pipe and the terminal section after the drain deteriorated, the cooperative no longer maintains the mesqa after the drain, they do it only at the beginning of the mesqa."
Lack of canal maintenance
The maintenance of the main and branch canals is done by contactors under the supervision of the Ministry of Water Resources and Irrigation. Farmer No. 15 and farmer No. 54 on the branch canal complained about the quality of maintenance of their canals. Moreover, the maintenance of El-Qassed main canal at the head is a challenge as it was mentioned by the district engineer in Tanta. She said that for more than 10 years ago no contractor could be able to maintain this part of the canal because of the (illegal) establishment of fishermen there. They are cultivating specific plants (called Nessella) to attract the fish (as the fish would feed from their roots), but these plants reduce the flow of water in the canal.
Village waste disposal both in mesqas and canals
Due to the increasing of population in the Delta, most of the mesqas pass now through villages, which have caused a deterioration of quality of water at the mesqa, also impacting negatively the flow at the end of mesqas. Farmer No. 2 showed us his mesqa full of sewage water coming from the village and farmer No. 44 reported that "the villages dump their sewage and their waste in the mesqa".
Increasing rice cultivation
One farmer (No. 9) reported that the reason for the increase in shortages of surface water is the expansion of rice cultivation. This was also mentioned by the water distribution engineer of El-Garbeya directorate as she insisted that the main reason of the water shortage is the illegal cultivation of rice. She indicated that the allowable percent of rice cultivation is 10 % in the canal command area but that farmers can actually cultivate with rice up to 100 % of the canal command area.
The use of wells mostly happens during the summer season, the period when rice is cultivated. As seen through our research, 63 % of farmers use the well in summer between 80 and 100 % of the time. Farmers also noted that water shortages happen usually at the time of transplanting rice from the nursery to the field. Interviewee No. 42, (a woman renting less than 0.5 feddan) said "We stay on the mesqa day and night during the three months of summer (June, July and August) at the time of rice, and when we find any water in the canal we pump it, otherwise we use the well; but in winter water is available."
Some farmers secure their crops by drilling a well, especially when planting fruit trees and onions. Farmers cultivate onion during the winter season (planting it in December and harvesting it in May). Groundwater is used to irrigate onions in order to ensure a constant supply of water due to the fact that this crop is costly to produce and very sensitive to water shortages and drought.
Farmers from Well No. 9 and No. 10, with land plots located along Drain 7, mentioned that the drain’s water quality is bad so they had to use groundwater, especially in the summer season, to be able to cultivate rice.
40
7 Conclusions
Groundwater use in the Nile Delta is a poorly studied phenomenon. The use of groundwater for villages and cities as well as industries is often believed to make up the bulk of groundwater abstractions, with groundwater use for agriculture considered as marginal (except in the western New Lands). This study however sheds light on the dynamics of well development and groundwater abstraction during the past 15 years in the Nile Delta, and analyses some of its causes and consequences.
The analysis of the hydrogeological features of the Nile Delta starts from the recognition that surface and groundwater are tightly intertwined. The Nile Delta branches (Rosetta and Damietta) gain water from the aquifer in some reaches and loose water to the aquifer in other reaches. The flow directions between groundwater and surface water can change seasonally with variations of the water table level with respect to the level in nearby waterways. Any reduction of stream flow results in a reduction of seepage to groundwater, while an increase in groundwater pumping tends to reduce surface flows (by increasing seepage). But the major macro-level water/salt balance issue is maintaining the equilibrium between groundwater recharge and seawater intrusion: in the Nile Delta, increasing net groundwater abstraction reduces the hydraulic head of the aquifer towards the sea and therefore provokes a shift inland of the brackish transition zone. Available data on the evolution of the salinity of groundwater in the Delta indicate that the construction of the High Aswan dam resulted in a shift of salinity isolines towards the seashore (because of a constant supply of water year round), and that current pumping rates have not yet critically affected this balance (but more recent data are needed to analyze the evolution in the past ten years). Possible localized over-pumping, however, results in 'up-coning' of salinity from deeper layers, as observed around Tala city.
A debate on the use of the water balance equation to determine the groundwater abstraction safe yield emerged several years ago. The concept of aquifer safe yield was defined by Todd (1959) as the amount of water that can be withdrawn from an aquifer without producing an undesired effect. Many authors pointed out the flawed and misconception of the concept of safe yield (e.g. Sophocleous 2000; Ponce 2007; Zhou 2009; Molle 2011; Davidson 2012). According to Sophocleous (2000) the concept of safe yield ignores the natural or equilibrium conditions, as natural recharge is balanced by discharge from the aquifer by evapotranspiration or into streams, springs, wetlands or the sea. Researchers and policy makers often mistakenly consider the safe yield as the amount of water that can be withdrawn from the aquifer and not exceed the recharge rate. In the Nile Delta, where the natural terminus of the groundwater flow is the sea, it is yet not fully clear what the safe yield is: high uncertainties on both the seepage (recharge) to the aquifer and actual use make it difficult to quantify what the 'safe' level of abstraction is.
This initial review on groundwater in the Nile Delta has also shown that contamination of groundwater by agriculture and more prominently by seepage from domestic and industrial effluents had already attained worrying levels. This may jeopardize the quality of the Nile Delta aquifer in the long run and needs more research and attention. The EC of water was measured whenever possible (i.e. when the pump was operated at the time of the interview) to assess salinity variations across the area. Range for EC was 596–2351 μmhos, somewhat surprisingly,
41
showed a substantial variability even within a reduced area, contradicting the maps that depict well delineated isolines.
It was observed that no studies concerned with the socioeconomic impact of using groundwater in the old lands of the Nile Delta have been conducted. Despite a wealth of studies on the physical characteristics of the Nile Delta Aquifer, the models established to study groundwater management in the Nile Delta are consistently set up "purely on hydrological theory and data, with no concern for the users of the information, or practical local development procedures" (Vincent and Dempsey 1991: 32). This statement also holds true for groundwater studies in the Nile Delta, as these models have difficulties taking into account local scale dynamics, or modeling the behavior of well owners (due to the lack of data and research). These models and studies simplify the reality about groundwater management in the Delta and are set up to answer macro-questions related to the delta’s groundwater such as its balance, but omit the importance of local practices and their variability across scales.
This report introduced a preliminary investigation of groundwater use in the central part of the Nile Delta. The intensity of use, current trends and their main causes, drilling and operation costs were addressed to document the current status of this phenomenon. The social arrangements set up by farmers to drill and operate the wells collectively or/and individually were also described. Social informal arrangements between farmers (those with wells and those without) ensure that most farmers can access groundwater. Most of the wells are shared between various farmers: this shows that individual needs are still limited and seldom justify individual investment in a well (although this latter case is growing). The possibility of a shared investment brings obvious economies of scale and allows for the dissemination of wells. With an average investment cost of LE 11,000, a group of –say- over 11 farmers will have individual costs under LE 1000 per person, which is seen as a worthwhile investment if this allows securing water supply to crops.
But pumping from a well requires more energy than pumping from waterways, and costs on average 2 to 3 times more than pumping from the canal, with irrigation durations around twice as long too. Those who have to hire a tractor have to face prices which increased recently from 25-30 LE to 40 LE per hour, mostly due to the reduction of energy subsidies in Egypt in the summer of 2014. If this trend continues the financial burden on farmers’ livelihoods could increase. This is why farmers in general only use their wells when canal water is not available. The survey also found that many wells had life duration of around 10 years only, due to clogging up. In this case farmers usually drill another well close to the former one.
As seen in this preliminary study, groundwater abstraction in the Middle Delta is strongly linked to inadequate and/or untimely availability of surface water in the canals (with different factors causing this). Users with poor access to canals depend on groundwater as a complement, increasing their water security, especially during peak irrigation times (in summer). This initial study has shown that inadequately maintained mesqas is also a major driver of the development of groundwater abstraction in the Nile Delta, as well as reduction in water supply (especially for tail-end users in the canal system), and cases of conflicts (with farmers seeking independence from fellow farmers on the same mesqa).

42
The Nile delta is a highly productive area and ensuring the sustainability of the irrigation system against inadequate supply and climate changes hazards is a high priority. The conjunctive use of water has developed as the main response, with farmers pumping water from all waterways, including drains, but also - and increasingly so- from groundwater, except in the northern part of the Delta where high salinity makes groundwater unfit for use in irrigation. Although well densities can locally be as high as one well per 2.5 hectare, according to our estimations, groundwater abstraction in times of crisis is still sustainable, despite drops in the level of water and higher pumping costs. Water levels, however, are sometimes close to 8-10 meters, a depth where the use of conventional suction pumps becomes impossible. More intensive use of groundwater might therefore result, in the future, in further investment needs (lowering the pump body, or using submerged pumps).
Studies on the implications of the use of groundwater should be part of the scope of any proposed management scenario for the Delta given the spread of conjunctive use of ground and surface water. As quoted by Kumar (2012), "to assess the consequences of future changes in groundwater recharge resulting from both climate and socio-economic change, hydro-geologists must increasingly work with researchers from other disciplines, such as socio-economists, agricultural modelers and soil scientists". This exploratory study is the first step towards more in-depth investigations into the groundwater economy in the Nile Delta. Further research is being carried out by IWMI and WMRI in the central part of the delta to better understand the impact of well development on irrigation management as a whole, estimate the variability of well density over a larger area, extend sampling of groundwater salinity, and discuss legal issues.
8 References
Abdel-Wahab, M.A. (1995) Water management options: conjunctive use of surface and groundwater, Advanced short course on water saving, (National Water Research Center) NWRC Library, Cairo, Egypt.
Abu Al-Izz, M.S. (1971) Land Forms of Egypt. The American University in Cairo press, Dar Al Maaref, Cairo, Egypt
Abdulaziz, A.M. (2007) Applications of remote sensing, GIS, and groundwater flow modeling in evaluating groundwater resources; two case studies: East Nile Delta, Egypt and Gold Valley, California, USA.
Abdelaty I.M., Abd-Elhamid H.F., Fahmy M.R. and Abdelaal G.M. (2014) Investigation of Some Potential Parameters and Its Impacts on Saltwater Intrusion in the Nile Delta Aquifer, June.
Alaa A. Masoud (2014) Groundwater quality assessment of the shallow aquifers west of the Nile Delta (Egypt) using multivariate statistical and geostatistical techniques, Journal of African Earth Sciences.
Atta, S.A. (1979) Studies on the Groundwater Properties of the Nile Delta, Egypt. M.Sc., Faculty of Science, Cairo University, Cairo.
Attia, M.I. (1954) Deposits in the Nile Valley and the Delta Mines and Quarrie, Dep. Geological Survey, Egypt, Cairo, pp. 356.
Attia, B. and Ezzat, M.L. (1999) Towards Integrated Water Management in Egypt, Ministry of Public Works and Water Resources, Planning Sector, Cairo, Egypt.
Audebeau, C. (1912) Observations faites en 1912 dans le centre du Delta. Institute d’Egypte.
Abul-Atta, A. (1975) The water policy of Egypt. Ministry of Irrigation, Cairo, Egypt.
Abu-Zied M. (1991) Water Resources Assessment of Egypt, water research center, MWRI, Cairo, Egypt.

43
Abu-Zied, M., and Abdel-Dayem, G. (1991) Sail load in irrigation and drainage water in the Nile Delta, In: African Regional Symposium on Techniques for environmentally sound water resources Development.
Anon (1980) Investigation Project of Sustained Yield of Aquifers, Part 1. (In Arabic). Groundwater Research Institute, Cairo.
Abdel Meged, M.S.H. (1994) Water Logging Phenomena in the North of the Delta Region, master Thesis, Faculty of Science, Cairo University.
Abd el Salam, M. (2004) Remedial Solutions for the Impacts of the Existing Groundwater Development Plan in Western Nile Delta, Second Regional Conference on Arab Water, Action Plans for Integrated Development.
Abdelaty I.M., Abd-Elhamid H.F., Fahmy M.R. and Abdelaal G.M. (2014) Investigation of Some Potential Parameters and Its Impacts On Saltwater Intrusion In Nile Delta Aquifer, Journal of Engineering Sciences Assiut University, Faculty of Engineering, 42(4), July, 931-955.
Amer, A. and Sherif, M. (1996) An Integrated Study for Seawater Intrusion in the Nile Delta Aquifer, WRSR Publication Series No. 14, NWRC, MWRI, Egypt.
Ball, J. (1939) Contribution to the Geography of Egypt, Survey, Cairo, Egypt. Book, 23–84.
Barrocu, G., Dahab, K. (2010) Changing climate and saltwater intrusion in the Nile Delta, Egypt, Book Groundwater response to changing climate, pp. 11-25.
Clawson, M., Landsberg H.H., and Alexander L.T. (1971) The Agricultural Potential of the Middle East. American Elsevier, New York, N.Y.
Darwish, M.M. (1994) Effect of probable hydrological changes on the Nile Delta aquifer system, Ph.D. thesis, Cairo University.
Darweesh, W.M.K (2001) Optimal management of underground water in west delta Zone, Ph.D. thesis, Faculty of Engineering, Ain Shams University.
Dahab, K.A. (2003) Influence of hydrogeologic flow pattern and aquifer material on water quality and mineral contents: Case Study, Nile Delta Egypt. Sci. J. of Fac. Sci. Menoufia Univ. XVII (2003: 65 -86).
Diab M.SH. (1982) Groundwater pollution in quaternary aquifer under the Nile Delta, Egypt. J of Geol., special Volume part 2, 135-144.
DRI (1989) Drainage Research Institute, Cairo, Egypt: Land Drainage in Egypt, edited by: Amer, M. H. and de Ridder, N. A., Drainage Research Institute, Cairo, Egypt.
DRI (2007) Salinity of groundwater and drainage water in the Nile delta, national water report center report, Cairo.
Dawoud, M., Darwish, M., and El-Kady, M. (2005) GIS-Based Groundwater Management Model for Western Nile Delta. Water Resources Management, 19, 585-604.
Diab, M.S., Dahab, K., and El Fakharany, M. (1997) Impacts of the paleohydrological conditions on the groundwater quality in the northern part of Nile Delta, The geological society of Egypt, J.Geol., 4112B, Cairo, 779–795.
El-Arabi, N.E., Khalil, J., and Dawoud, M.A. (2000) Conjunctive use as a tool for integrated water resources management in Egypt, International Conference on Wadi Hydrology, Sharm El Sheikh, Egypt.
El-Beshri, M.Z. and Labadie, J.W. (1994) Optimal conjunctive use of surface and ground water resources in Egypt, International water Resources Association VIII IWRA World Congress on Water Resources, Cairo, Egypt.
Ebraheem A.M., Senosy M.M. and Dahab K.A. (1997) Geoelectrical and Hydrogeochemical Studies for Delineating Ground-Water Contamination Due to Salt-Water Intrusion in the Northern Part of the Nile Delta, Egypt, 35(2), 216–222.

44
El Didy, S.M. and Darwish, M.M. (2001) Studying the effect of desalination of Manzala and Burullus Lakes on salt water intrusion in the Nile Delta, Water science, National Water Research Center.
Evans W.R. and Evans R. (2014) Conjunctive Use and Management of Groundwater And Surface Water, Thematic Paper 2, Groundwater Governance: A Global Framework for Country Action GEF ID 3726.
El Fakharany, Z.M.A. (2002) Management of Conjunctive Use of Surface Water and Groundwater, Msc Thesis, Helwan Univerisity Faculty of Engineering, Mataria, Egypt.
Eman R. Nofal, Akram M. Fekry and Sherif M. El-Didy (2014) Adaptation to the Impact of Sea Level Rise in the Nile Delta Coastal zone, Egypt, Journal of American Science, 10(9), http://www.jofamericanscience.org
Ebraheem A.M., Senosy M.M. and Dahab K.A. (1997) Geoelectrical and Hydrogeochemical Studies for Delineating Ground-Water Contamination Due to Salt-Water Intrusion in the Northern Part of the Nile Delta, Egypt, 35(2), 216–222.
Farag, A.A. (1956) Projects of Groundwater Development to Supplement Irrigation Water, Cairo (in Arabic).
FAO (2013) Monitoring of Climate Change Risk Impacts of Sea Level Rise on Groundwater and Agriculture in the Nile Delta.
Farid, M.S.M. (1980) Nile Delta Groundwater Study, M.Sc. Thesis, Cairo University.
Farid, M.S. (1985) Management of groundwater systems in the Nile Delta. PhD Thesis, Cairo Univ., Giza, Egypt.
Farid, M.S. and Tuinhof A. (1991) Groundwater Management in the Nile Delta aquifer, Round table meeting report, RIGW, Egypt.
Ghoraba S.M., Zyedan B.A., Rashwan I.M.H. (2013) Solute Transport Modeling Of The Groundwater for Quaternary Aquifer Quality Management in Middle Delta, Egypt; Alexandria Engineering Journal, 52, 197–207.
Griffiths J.G. (1966) Hecataeus and Herodotus on "A Gift of the River" Journal of Near Eastern Studies, 25(1), 57-61.
Hashish H. A., Hamdy El-Ghandour A., and. El-Nimr A. A. (2014) Simulating The Effects of Spatial Layout and Pumping/Recharging Rates of Wells on Saltwater Intrusion, International Water Technology Journal, 4(3).
Hefny, K. and Sahta, A. (2004). Underground water in Egypt. Ministry of Water Supplies and Irrigation, Egypt. Annual Meeting, Egypt, Commission on Mineral and Thermal Waters, Handouts, 25, Cairo, pp11-23.
Hussien, M.M. (2007) Environmental Impacts of new settlements on the ground water in a region in Delta, Msc. thesis, Zagazig University, Faculty of Engineering, Egypt.
Idris Y.A. (2013) A GIS-Based Spatial Classification Technique to Identify the Groundwater Quality and Type Classes, Journal of American Science 2013; 9(12).
Kashef, A.I. (1982) Harmonizing Ghyben-Herzberg interface with rigorous solutions. Ground Water, 21(1).
Kashef, A.I. (1981) The Nile-one river and nine countries. J. of Hydrology, Elsevier Pub. Co.
Kashef, A.I. (1983) Salt water intrusion in the Nile Delta. J. Groundwater, 2, 160-167.
Khater, A., A. Fadlelmawla, and A.Fekry (2002) Assessment of Groundwater Quality in El Sadat City and Proposed Action for Groundwater Protection, Proceedings of the III International Symposium on Environmental Hydrology. American Society of Civil Engineering & Egyptian Society of Irrigation Engineering, Cairo, Egypt.
Kumar C.P. (2012) Climate Change and Its Impact on Groundwater Resources, International Journal of Engineering and Science, 1(5), 43-60.
Leaven, M.T. (1991) Hydrogeological study of the Nile Delta and adjacent desert areas, Egypt, with emphasis on hydrochemistry and isotope hydrology", M.Sc. thesis, Free University, Amsterdam. Also published by RIGW/IWACO as Technical Note TN 77.01300-91-01.

45
Mikhailova, M.V. (2001) Hydrological regime of the Nile Delta and dynamics of its coastline, Water Resources, 28(5), 477–490.
MWRI (2005), National Water Resources Plan for Egypt 2017, Ministry of Water Resources and Irrigation.
MWRI (2012), Strategy of Water Resources of Egypt till 2050, Ministry of Water Resources and Irrigation.
Masoud A.A. (2014) Groundwater quality assessment of the shallow aquifers west of the Nile Delta (Egypt) using multivariate statistical and geostatistical techniques, Journal of African Earth Sciences, 95, 123–137.
Mabrouk M. B., Jonoski A., Solomatine D. and Uhlenbrook S. (2013) A review of seawater intrusion in the Nile Delta groundwater system – the basis for assessing impacts due to climate changes and water resources development.
Morsy, W. S. (2009) Environmental management to groundwater resources for Nile Delta region, PhD thesis, Faculty of Engineering, Cairo University, Egypt.
Mohamed, M.A.E. (2002) Study of Groundwater Development in the Western Delta By Using The Remote Sensing And GIS, Msc. Thesis, Faculty of Engineering, Ain Shams University, Egypt.
Nofal E. R., Fekry A. M. And El-Didy S. M. (2014) Adaptation to the Impact of Sea Level Rise in the Nile Delta Coastal zone, Egypt, Journal of American Science, 10(9).
Nimmo, J.R., Healy, R.W., and Stonestrom, D.A. (2005) Aquifer Recharge, in Anderson, M.G., and Bear, J., eds., Encyclopedia of Hydrological Science: Part 13. Groundwater: Chichester, UK, Wiley, v. 4, p. 2229-2246, doi:10.1002/0470848944.hsa161a, http://www.mrw.interscience.wiley.com/ehs/articles/hsa161a/frame.html.
Pradhan B. and Pirasteh S. (2011) Hydro-Chemical Analysis of the Ground Water of the Basaltic Catchments: Upper Bhatsai Region, Maharastra, The Open Hydrology Journal, 5, 51-57.
RIGW (2002) Nile Delta groundwater modeling report. Research Inst. for Groundwater, Kanater El- Khairia, Egypt.
RIGW (1980) Project of Safe Yield Study for groundwater Aquifers in the Nile Delta and Upper Egypt, Part 1, Ministry of Irrigation, Academy of Scientific Research and Technology, and Organization of Atomic Energy, Egypt, (in Arabic).
RIGW (2003) Impacts of Future Surface Water Development on Groundwater Aquifer System in the West Nile Delta Region, Cairo.
RIGW (1992) Groundwater Resources and Projection of Groundwater development, Water security project, (WSP), Cairo.
RIGW/IWACO (1999) Environmental management of groundwater resources (EMGR), Final Technical Report TN/70.0067/WQM/97/20, Research. Institute for Groundwater (RIGW), El Kanater El-Khairia, Egypt.
RIGW/IWACO (1992) Hydrogeological map of the Nile Delta scale 1: 500,000, Cairo.
RIGW/IWACO (1990) Hydrogeological inventory and groundwater development plan western Nile Delta region, TN 77.01300-9-02. 59.
Sakr, S. A., Attia, F. A., and Millette, J. A. (2004) Vulnerability of the Nile Delta aquifer of Egypt to seawater intrusion, International conference on water resources of arid and semi-arid regions of Africa, Issues and challenges, Gaborone, Botswana.
Salem M. G., El-Awady M. H. and Amin E. (2012) Enhanced Removal of Dissolved Iron and Manganese from Nonconventional Water Resources in Delta District, Egypt Energy Procedia, 18, 983 – 993.
Samak, S.A. M.A. (2007) Groundwater Management in Delta, Msc. Thesis, Faculty of Engineering, Zagazig University, Egypt.

46
Sharaky M., Atta S.A., El Hassanein A. S. and Khallaf K. M. A. (2007) Hydrogeochemistry Of Groundwater In The Western Nile Delta Aquifers, Egypt, 2nd International Conference on the Geology of Tethys, 19-21 March, 2007, Cairo University.
Shahin, M. (1983) Groundwater in the Nile Delta and Valley. Tech. Report on TOKTEN Assignment, Ministry of Irrigation, Acad., of Sci. and UNDP, Cairo, Egypt.
Shahin, M. (1987) Groundwater resources in Egypt: potentials and limitations, Water for the Future: Hydrology in Perspective (Proceedings of the Rome Symposium, April 1987). IAHS Publ. no. 164, 1987.
Shahin, M. (1991) Assessment of Groundwater Resources in Egypt, IHE, Delft, Netherland.
Sherif, M. (1999) The Nile Delta Aquifer in Egypt, Chapter 17 in Seawater Intrusion in Coastal Aquifers, concepts methods and practices, edited by: Bear, J., Cheng, A., Sorek, S., Ouazar, D., and Herrera, A., Theory and Application of Transport in Porous Media, Kluwer academic publishers, the Netherlands, 14, 559–590.
Sherif M., Sefelnasr A., Javadi A. (2012) Incorporating the concept of equivalent freshwater head in successive horizontal simulations of seawater intrusion in the Nile Delta aquifer, Egypt.
Sefelnasr A., Sherif M. (2013) Impacts of Seawater Intrusion in the Nile Delta Aquifer, Egypt, National Groundwater Association, 52(2), 264–276.
Saleh M.F. (1980) Some Hydrogeological and Hydrochemical Studies on the Nile Delta, M.Sc. Thesis, Faculty of Science, Ain Shams University.
Sophocleous M. (2000) From safe yield to sustainable development of water resources the Kansas experience. Journal of hydrology, 235, 27-43.
Todd, D. K. (1959) Ground Water Hydrology. John Wiley and Sons.
Vincent, L., and P. Dempsey (1991) Conjunctive water use for irrigation: good theory, poor practice, Network Paper 4, Irrigation Management Network, ODI (Overseas Development Institute).
Warner, J., T.K. Gates, and F.A. Attia (1991) Hydraulic Conductivity and Vertical Leakage in the Clay Silty of the Nile Alluvium in Egypt, Egypt, Water Use and Management Project Technical Report NO, 60, PP 81.
Whittington, D. and Guariso, G. (1983) Water management models in practice, a case study of the Aswan High Dam, Developments in Environmental Modelling 2, Elsevier SC. Publication co., Amsterdam. Oxford. New York.
Wilson, J., Townley, L. R., and Sa Da Costa, A. (1979) Mathematical Development and Verification of a Finite Element Aquifer Flow Model AQUIFEM-1, Technology Adaptation Program, Report No. 79–2, M.I.T., Cambridge, Massachusetts.
Zaghloul, M. G. (1985) Flow distribution through groundwater aquifer of the Nile Delta, M.Sc. Thesis, Faculty of Engineering, Alexandria University, Egypt.
9 Appendix
9.1 Standards for drinking and irrigation water in (mg/L).
Inorganic
chemical
WHO
Drinking water (1993)
Ministry of Health
Drinking water
(1985)
FAO
Irrigation water
(1985)
Aluminum - 0.2 -

47
Antimony 0.005 - -
Arsenic 0.01 0.05 -
Barium 0.7 0.7 -
Bicarbonate - - 520
Boron 0.3 - 2
Cadmium 0.003 0.003 -
Calcium - 300 -
Chloride - 500 350
Chromium 0.05 0.05 -
Copper 2 2 -
Fluoride 1.5 0.8 -
Iron - 0.3 -
Lead 0.01 0.03 0.05
Magnesium - 150 -
Manganese 0.5 0.1 -
Mercury 0.001 0.001 -
Nitrate 50 10 135
SAR - - 3
Selenium 0.01 0.01 -
Sodium - 200 -
Sulphate - 400 -
TDS 1000 1000 2000
Zinc - 3 -

48
9.2 Locations of the Surveyed Wells in the Central Part of the Nile Delta
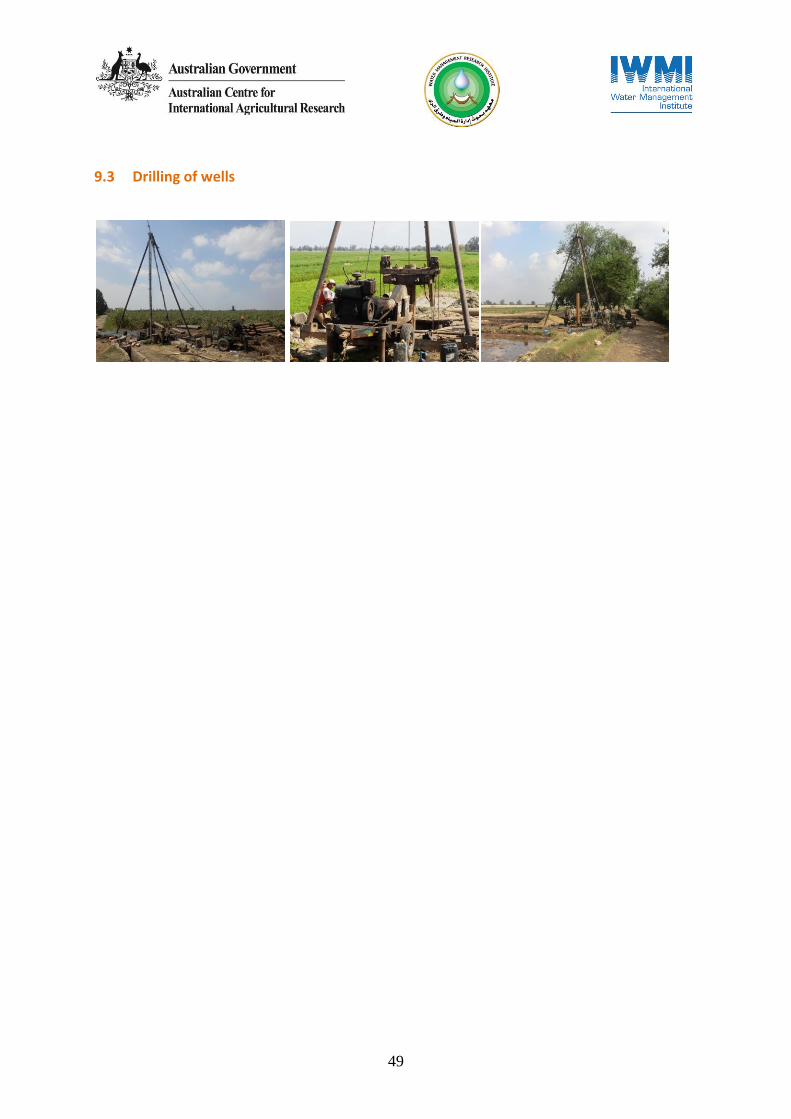
49
9.3 Drilling of wells

50
REPORTS by IWMI/WMRI
1. IWMI and WMRI. 2013. An exploratory survey of water management in the Meet Yazid Canal command area of the Nile Delta. Water and Salt Management in the Nile delta Project Report No. 1. IWMI, WMRI: Cairo, 2013.
2. Duttra, S. 2013. Understanding mesqa and marwa water management practices in IIP areas of the Nile Delta. Water and Salt Management in the Nile delta Project Report No. 2. IWMI, WMRI: Cairo, 2013.
3. Molle, F. and Rap, E. 2014. Brief Retrospective on Water User Organizations in Egypt. Water and Salt Management in the Nile delta Project Report No. 3. IWMI, WMRI: Cairo, 2014.
4. Molle, F.; Rap, E.; Al-Agha, D.E.; Ismail, A.; Abou El Hassan, W. and Freeg, M. 2015. Irrigation Improvement Projects in the Nile Delta: promises, challenges, surprises. Water and Salt Management in the Nile delta Project Report No. 4. IWMI, WMRI: Cairo, 2015.
5. Molle, F.; Abou El Hassan, W.; Salama, S.; Al-Agha, D.E. and Rap, E. 2015. Water and salt dynamics at the meso-level in IIIMP areas, Mares El Gamal canal. Water and Salt Management in the Nile delta Project Report No. 5. IWMI, WMRI: Cairo, 2015.
6. Al-Agha, D.E.; Closas, A. and Molle, F. 2015. Survey of groundwater use in the central part of the Nile Delta. Water and Salt Management in the Nile delta Project Report No. 6. IWMI, WMRI: Cairo, 2015.
7. Al-Agha, D.E.; Molle, F.; El Baily, M.; El Desouqy, E.; Abou El-Hassan, W. 2015. Spatial and temporal variability of water quality in the Nile Delta. Water and Salt Management in the Nile delta Project Report No. 7. IWMI, WMRI: Cairo, 2015.
8. Rap, E.; Molle, F.; Al-Agha, D.E.; Ismail, A. 2015. Branch Canal Water User Associations in the central Nile Delta. Water and Salt Management in the Nile delta Project Report No. 8. IWMI, WMRI: Cairo, 2015.
9. Molle, F.; Gaafar, I., Al-Agha, D.E. and Rap, E. 2016. Irrigation efficiency and the Nile Delta water balance. Water and Salt Management in the Nile delta Project Report No. 9. IWMI, WMRI: Cairo, 2016.
10. Gaafar, I.; Abou El-Hassan, W.; El Tahan, N. and Mustafa. 2015. Fishpond water management in the Lake Burullus area. Water and Salt Management in the Nile delta Project Report No. 10. IWMI, WMRI: Cairo, 2015.