Survey Experiment Modalities
35
Survey Experiment Modalities Some Pros and Cons of Differing Sampling Sources and Methods Matthew A. Baum Harvard University & Leonie Huddy Stonybrook University
-
Upload
kasimir-sullivan -
Category
Documents
-
view
29 -
download
0
description
Survey Experiment Modalities. Some Pros and Cons of Differing Sampling Sources and Methods. Matthew A. Baum Harvard University & Leonie Huddy Stonybrook University. Outline. Review of prominent Internet players Amazon Mechanical Turk Knowledge Networks Yougov / Polimetrix - PowerPoint PPT Presentation
Transcript of Survey Experiment Modalities
Survey Experiment Modalities
Some Pros and Cons of Differing Sampling Sources and Methods
Matthew A. BaumHarvard University
&Leonie Huddy
Stonybrook University
OutlineReview of prominent Internet players
Amazon Mechanical TurkKnowledge NetworksYougov/PolimetrixSurveyMonkey Audience
Comparing survey modalities
USA vs. Swedish Phone/Internet Usage Statistics
Conclusions

Amazon Mechanical Turk (AMT)
OverviewBegan in 2005
“Workers” sign up to participate in tasks for pay (called “Human Intelligence Tasks”, or “HITs”)
Global workforce (~100,000 workers)
Salary: ~$3-$8/hour (maybe $10/hr for high-experience workers)
“Requestors recruit “workers” on internal message board describing task
Can specify “qualifications” for workers (e.g., experience, quality ratings, nationality, etc.)
10% fee to Amazon
AMT provides survey building tools, or Requestors can include links to external surveys
HITs range from 1-second marketing surveys (“Rate appeal of this photo on 1-10 scale”) to elaborate 30+ minute experimental surveys

Compensation Amount
Short survey(5 min)
Medium survey (10
min)
Long survey(30 min)
$.02 5.6 5.6 5.3
$.10 25.0 14.3 6.3
$.50 40.5 31.6 16.7
Effects of Compensation Amount and Task Length on Participation Rates(Submitted Surveys per Hour of Posting Time)
Source: Buhrmester, Kwang, and Gosling (2011)
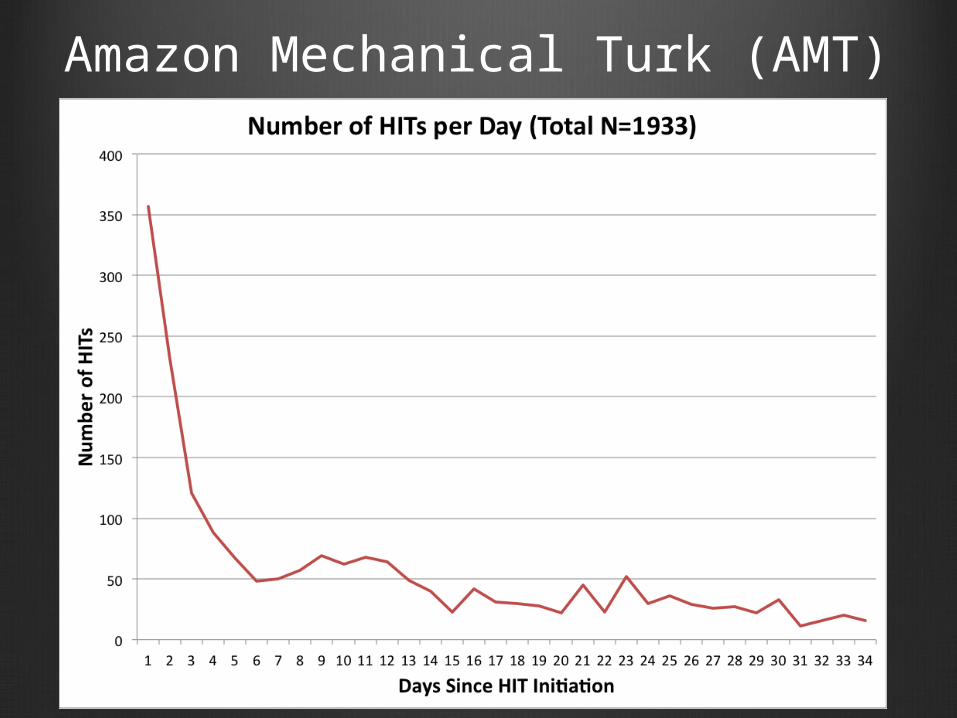
My AMT Experience:• paid $1.00 per completed HIT for ~22 minute survey• Listed as “News and Politics Survey”• Received 1933 completed surveys in ~one month• rapidly diminishing returns• 1825 valid responses
Amazon Mechanical Turk (AMT)

% Female % Non-White
% Non-American
Age
AMT 55 36 31 32.8
Internet 57 Fewer (?) ~31 24.3
Buhrmester, Kwang, and Gosling (2011)
Amazon Mechanical Turk (AMT)Demographics
Paolacci, Chandler, and Ipeirotis (2010)
Category (N=1000 AMT workers)
% Female 64.9
Average Age 36
% Earning below $60k/year
66.7
Education “higher than general pop.”
% Non-American 53
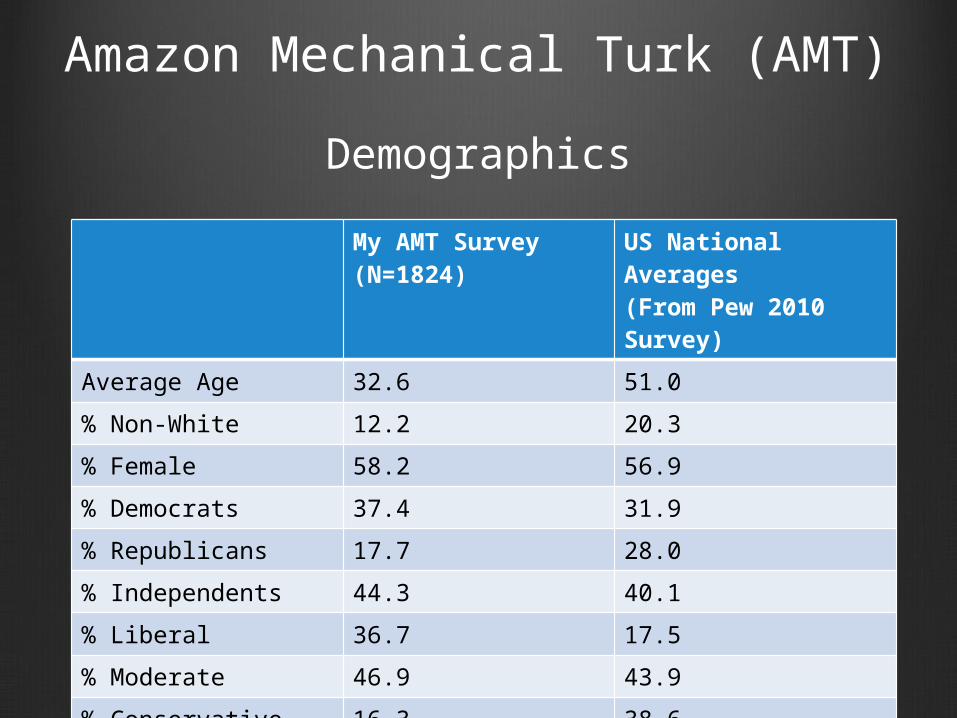
Amazon Mechanical Turk (AMT)
My AMT Survey (N=1824)
US National Averages (From Pew 2010 Survey)
Average Age 32.6 51.0
% Non-White 12.2 20.3
% Female 58.2 56.9
% Democrats 37.4 31.9
% Republicans 17.7 28.0
% Independents 44.3 40.1
% Liberal 36.7 17.5
% Moderate 46.9 43.9
% Conservative 16.3 38.6
Demographics
Amazon Mechanical Turk (AMT)
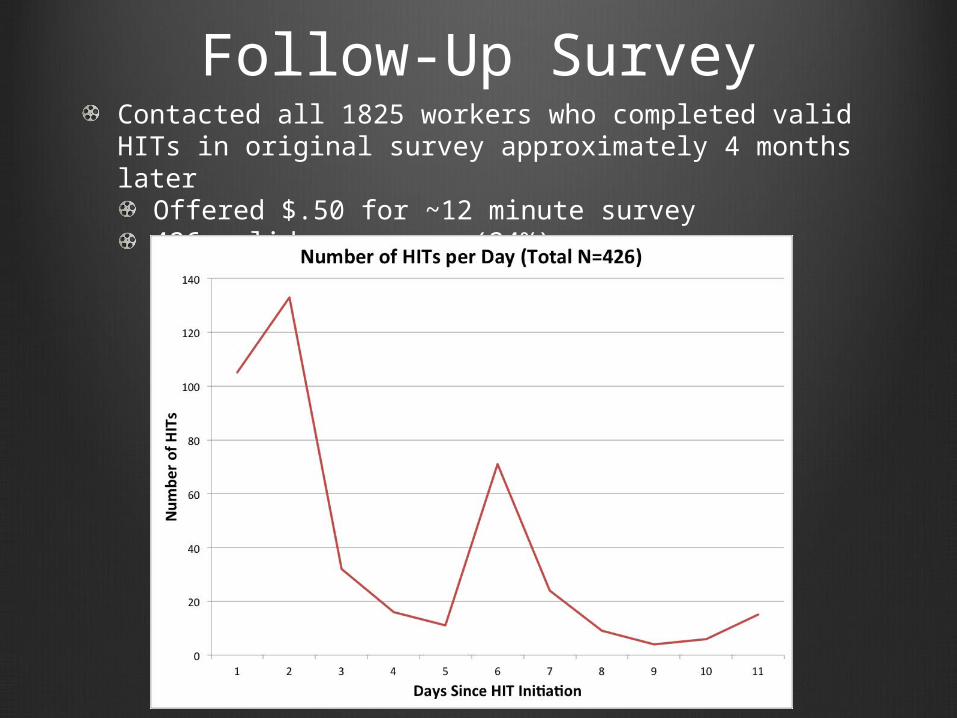
Follow-Up SurveyContacted all 1825 workers who completed valid HITs in original survey approximately 4 months later
Offered $.50 for ~12 minute survey426 valid responses (24%)
2nd batch of invites
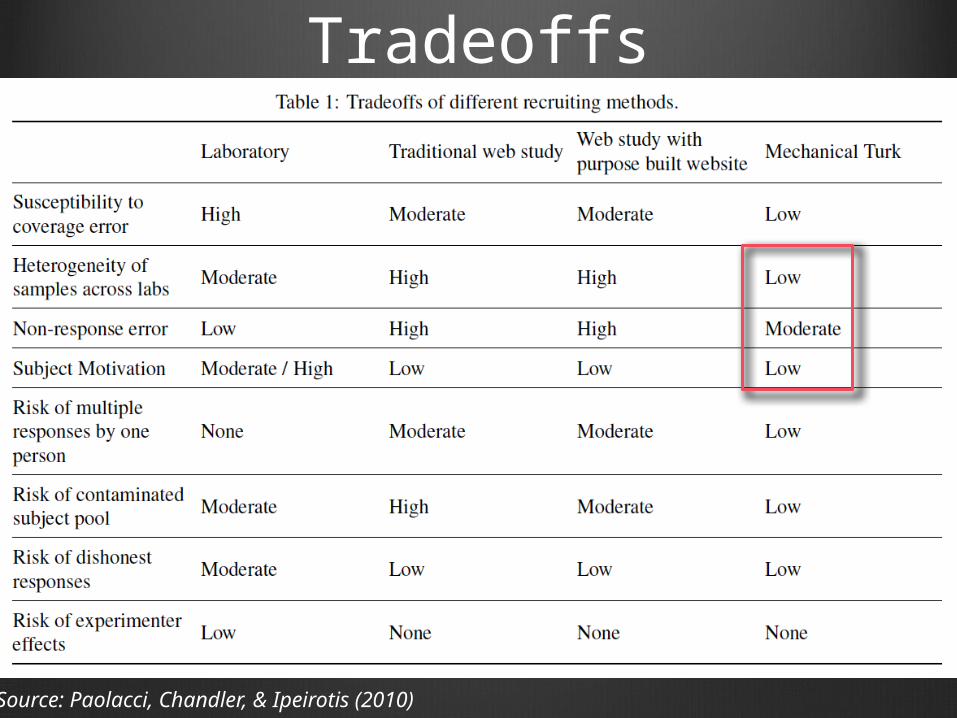
Tradeoffs
Source: Paolacci, Chandler, & Ipeirotis (2010)
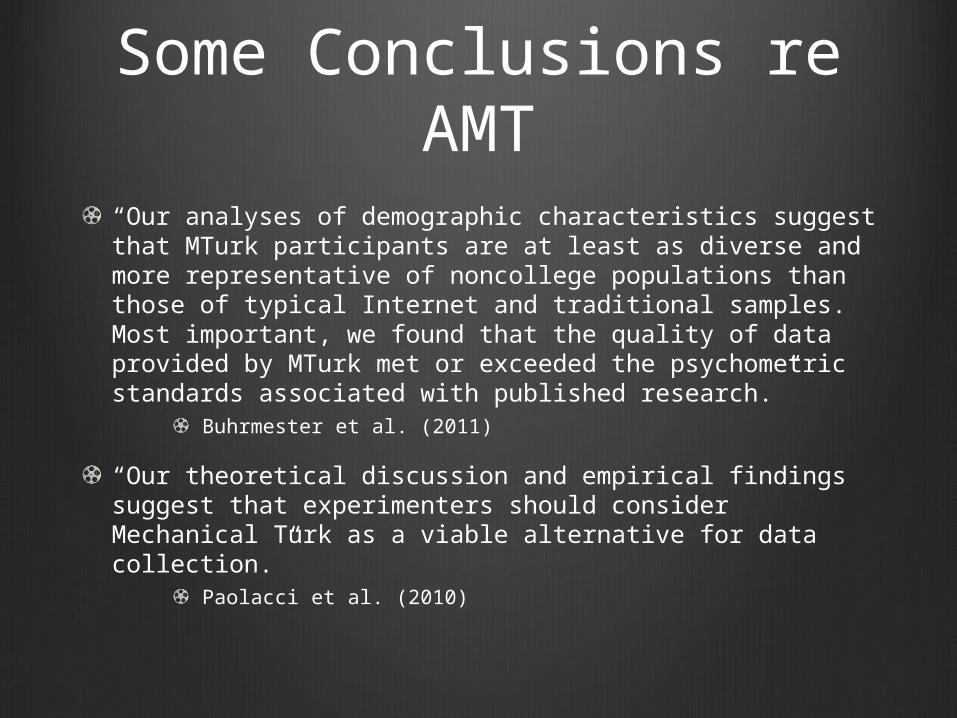
Some Conclusions re AMT
“Our analyses of demographic characteristics suggest that MTurk participants are at least as diverse and more representative of noncollege populations than those of typical Internet and traditional samples. Most important, we found that the quality of data provided by MTurk met or exceeded the psychometric standards associated with published research.”
Buhrmester et al. (2011)
“Our theoretical discussion and empirical findings suggest that experimenters should consider Mechanical Turk as a viable alternative for data collection.”
Paolacci et al. (2010)
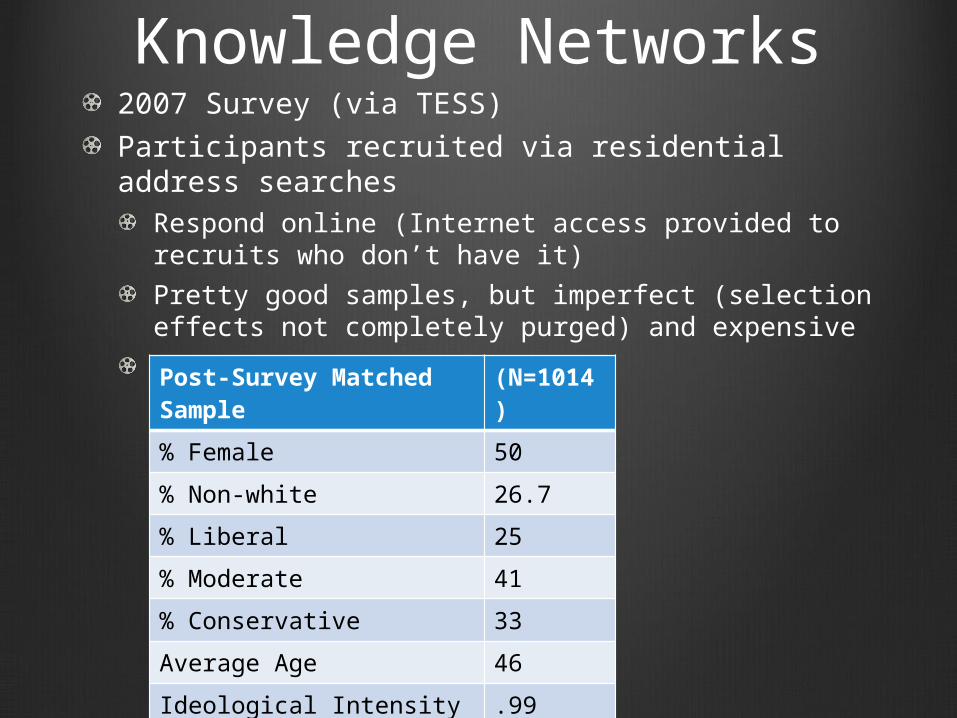
Knowledge Networks2007 Survey (via TESS)
Participants recruited via residential address searches
Respond online (Internet access provided to recruits who don’t have it)
Pretty good samples, but imperfect (selection effects not completely purged) and expensive
DemographicsPost-Survey Matched Sample
(N=1014)
% Female 50
% Non-white 26.7
% Liberal 25
% Moderate 41
% Conservative 33
Average Age 46
Ideological Intensity (0-3 scale)
.99
Political Knowledge (0-1 scale)
.487
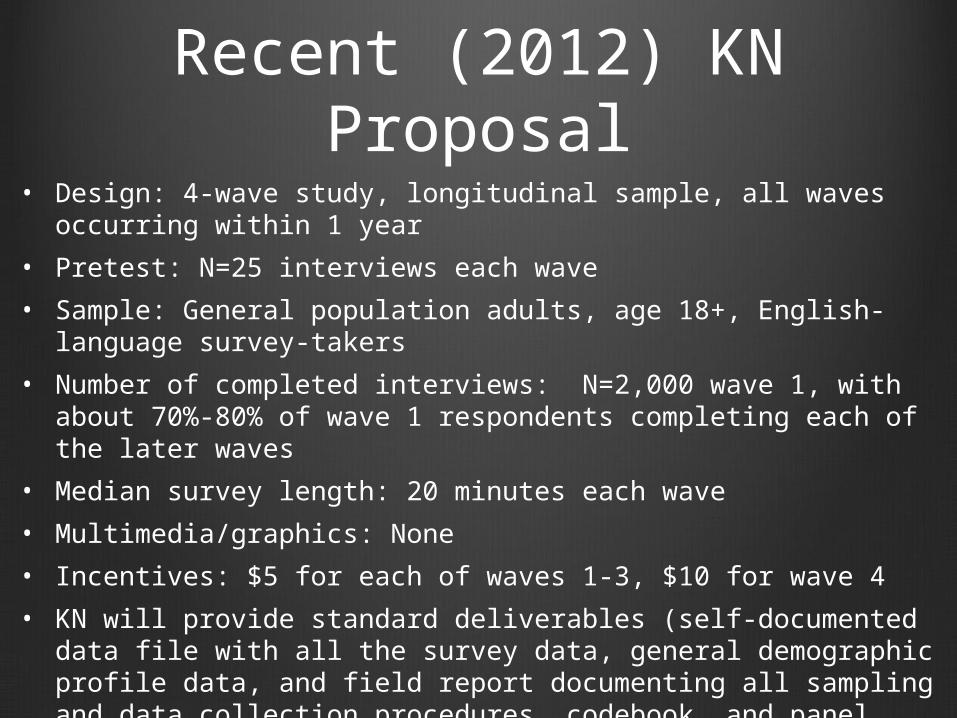
Recent (2012) KN Proposal
• Design: 4-wave study, longitudinal sample, all waves occurring within 1 year
• Pretest: N=25 interviews each wave
• Sample: General population adults, age 18+, English-language survey-takers
• Number of completed interviews: N=2,000 wave 1, with about 70%-80% of wave 1 respondents completing each of the later waves
• Median survey length: 20 minutes each wave
• Multimedia/graphics: None
• Incentives: $5 for each of waves 1-3, $10 for wave 4
• KN will provide standard deliverables (self-documented data file with all the survey data, general demographic profile data, and field report documenting all sampling and data collection procedures, codebook, and panel recruitment methodology)
• Price: $255,550 (No, that’s not a typo!)
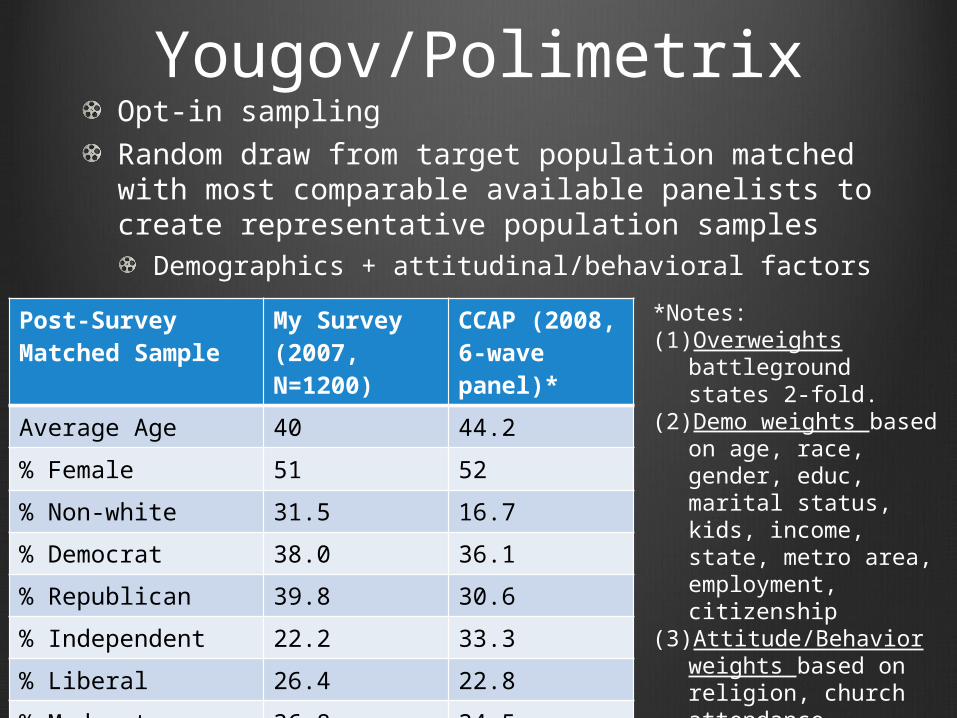
Yougov/PolimetrixOpt-in sampling
Random draw from target population matched with most comparable available panelists to create representative population samples
Demographics + attitudinal/behavioral factors
Post-Survey Matched Sample
My Survey (2007, N=1200)
CCAP (2008, 6-wave panel)*
Average Age 40 44.2
% Female 51 52
% Non-white 31.5 16.7
% Democrat 38.0 36.1
% Republican 39.8 30.6
% Independent 22.2 33.3
% Liberal 26.4 22.8
% Moderate 36.8 34.5
% Conservative 36.8 35.3
*Notes:(1) Overweights
battleground states 2-fold.
(2) Demo weights based on age, race, gender, educ, marital status, kids, income, state, metro area, employment, citizenship
(3) Attitude/Behavior weights based on religion, church attendance, evangelical status, news interest, PID, ideology.
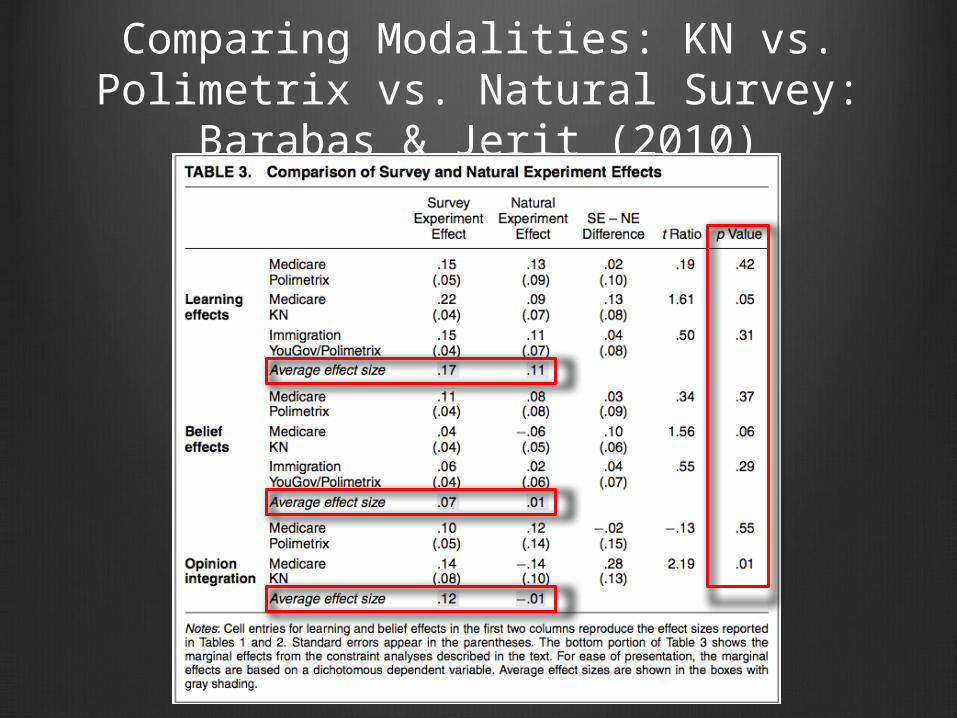
Comparing Modalities: KN vs. Polimetrix vs. Natural Survey:
Barabas & Jerit (2010)
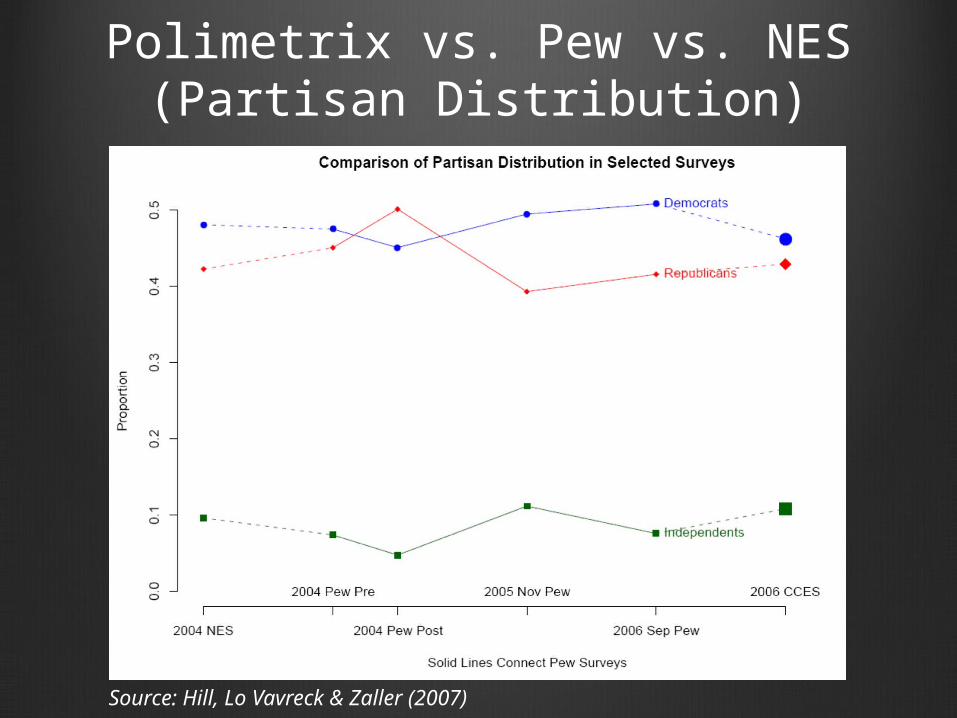
Polimetrix vs. Pew vs. NES (Partisan Distribution)
Source: Hill, Lo Vavreck & Zaller (2007)

Polimetrix vs. Pew vs. NES (Ideologial Distribution)
Source: Hill, Lo Vavreck & Zaller (2007)
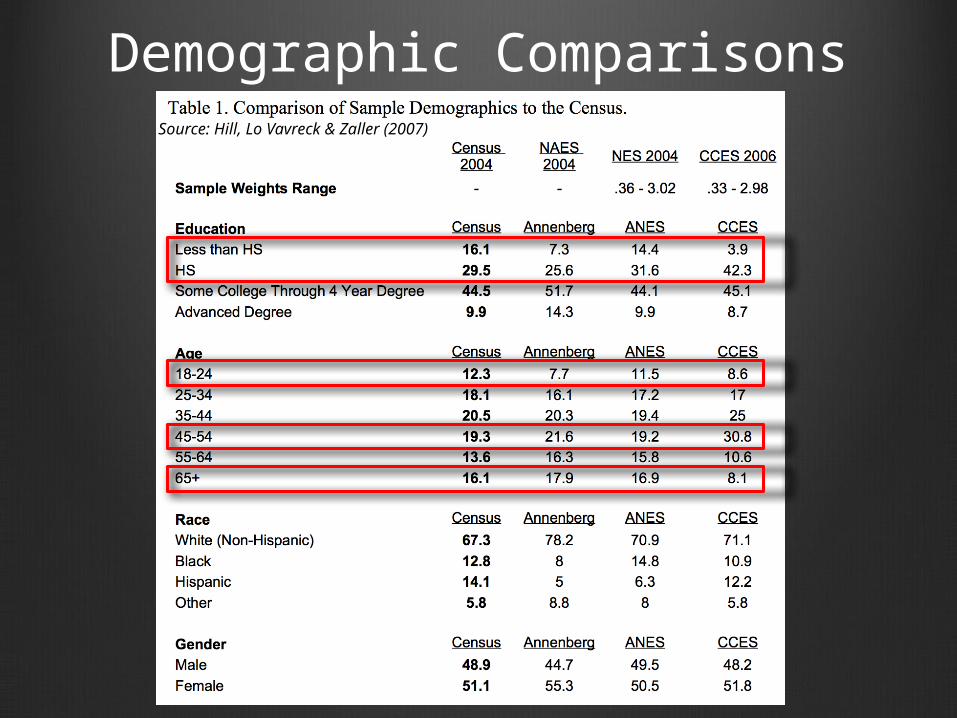
Demographic ComparisonsSource: Hill, Lo Vavreck & Zaller (2007)
Comparing Modalities: KN vs. Polimetrix vs. Natural Survey:
Barabas & Jerit (2010)
Conclusions:“The results presented here should be encouraging to anyone devoted to the scientific study of politics because they suggest that what occurs in survey experiments resembles what takes place in the real world.”
“Although there was a discrepancy between the size of survey treatment effects and the general population in our natural experiment, we observed correspondence exactly where one would expect to find it—among those who were most likely to be exposed to media messages about the two government announcements.”
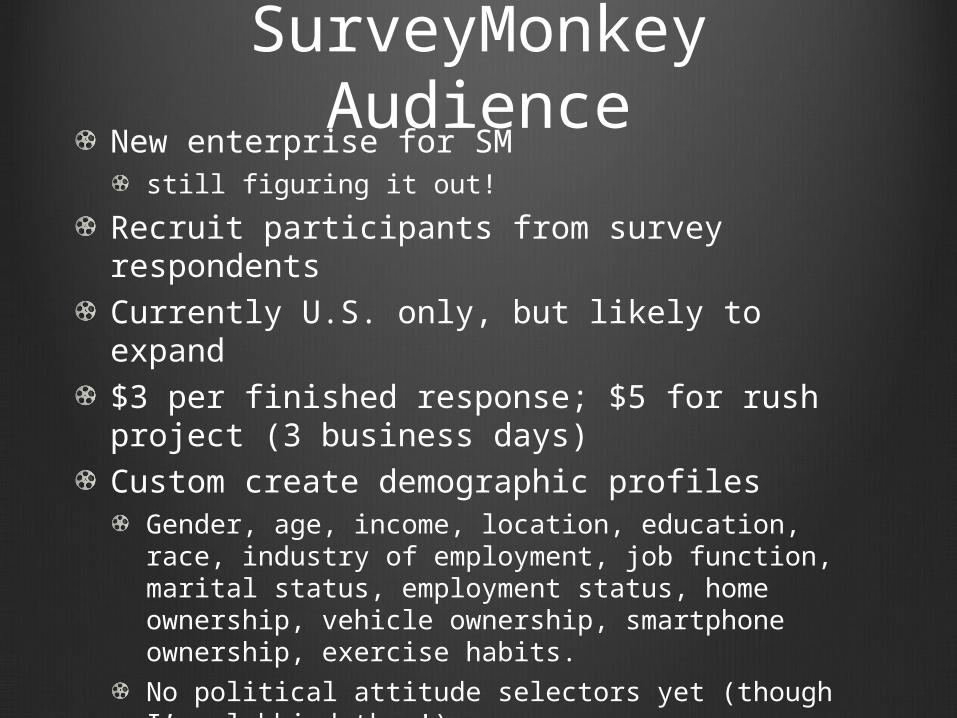
SurveyMonkey AudienceNew enterprise for SM
still figuring it out!
Recruit participants from survey respondentsCurrently U.S. only, but likely to expand$3 per finished response; $5 for rush project (3 business days)Custom create demographic profiles
Gender, age, income, location, education, race, industry of employment, job function, marital status, employment status, home ownership, vehicle ownership, smartphone ownership, exercise habits.
No political attitude selectors yet (though I’ve lobbied them!)
Similar to Polimetrix, except don’t start with random draw from population
Much less expensive!

AAPOR 2010 Task Force on Online Panels
Focus on nonprobability samples
Informative, but inconclusive…
ConclusionsIf research objective includes accurate estimate of population values, avoid nonprobability online panels.
Results differ significantly from probability-based methods (like RDD telephone) on range of behaviors and attitudes, with latter being more accurate.
Nonprobability online panels sometimes appropriate, when precise estimates of population values not critical
More research needed on evaluating and testing techniques used across disciplines to make population inferences from nonprobability samples.
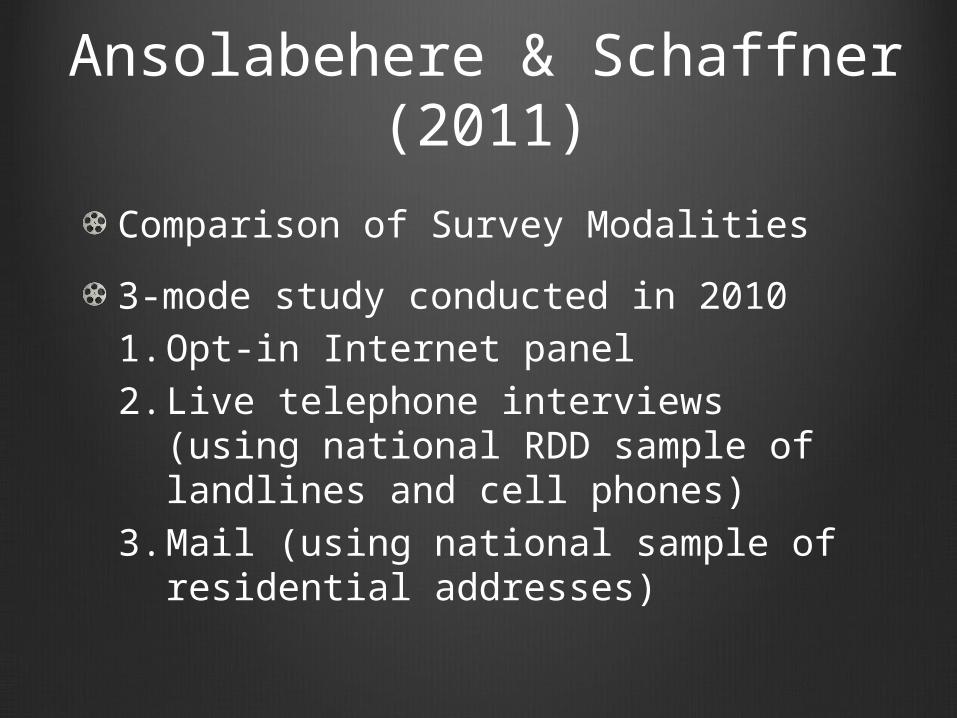
Ansolabehere & Schaffner (2011)
Comparison of Survey Modalities
3-mode study conducted in 20101. Opt-in Internet panel2. Live telephone interviews (using
national RDD sample of landlines and cell phones)
3. Mail (using national sample of residential addresses)
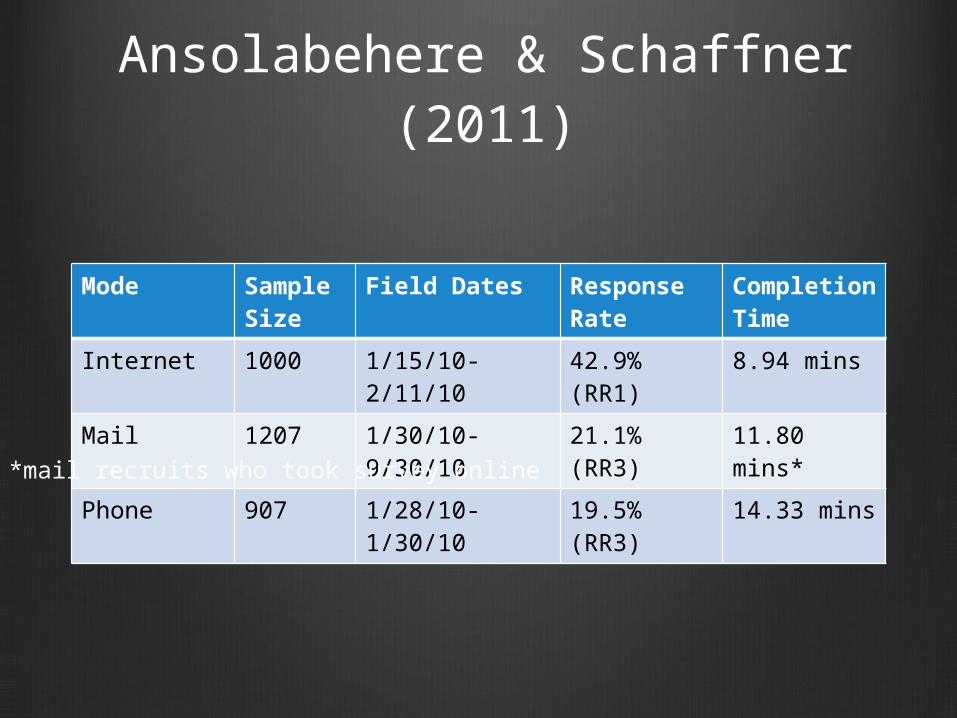
Mode Sample Size
Field Dates Response Rate
Completion Time
Internet 1000 1/15/10-2/11/10
42.9% (RR1)
8.94 mins
Mail 1207 1/30/10-9/30/10
21.1% (RR3)
11.80 mins*
Phone 907 1/28/10-1/30/10
19.5% (RR3)
14.33 mins
Ansolabehere & Schaffner (2011)
*mail recruits who took survey online
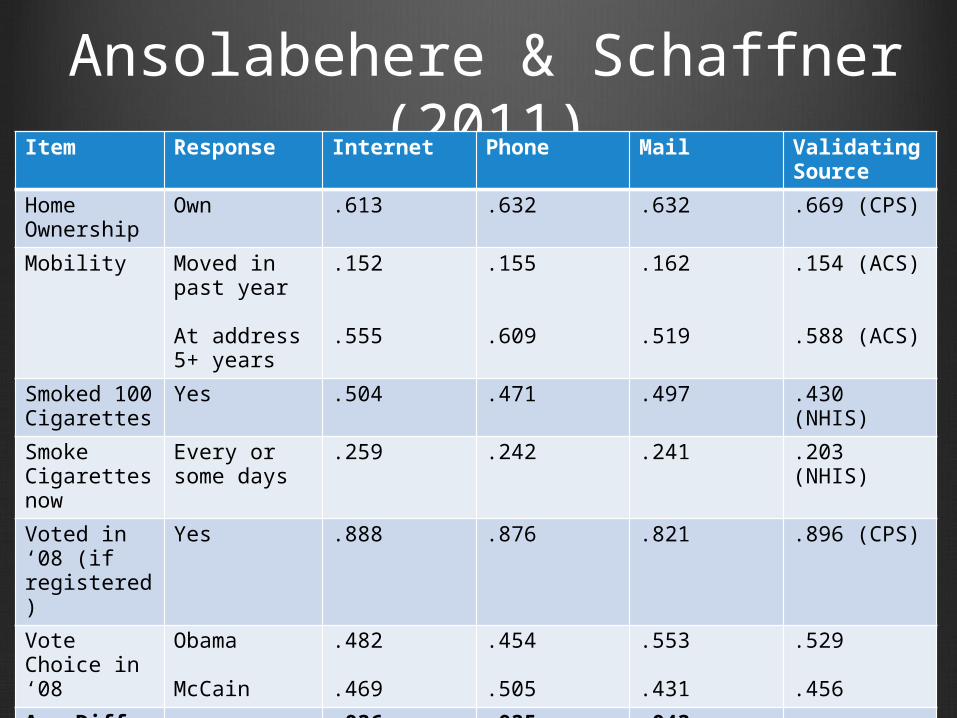
Ansolabehere & Schaffner (2011)Item Response Internet Phone Mail Validating
Source
Home Ownership
Own .613 .632 .632 .669 (CPS)
Mobility Moved in past year
At address 5+ years
.152
.555
.155
.609
.162
.519
.154 (ACS)
.588 (ACS)
Smoked 100 Cigarettes
Yes .504 .471 .497 .430 (NHIS)
Smoke Cigarettes now
Every or some days
.259 .242 .241 .203 (NHIS)
Voted in ‘08 (if registered)
Yes .888 .876 .821 .896 (CPS)
Vote Choice in ‘08
Obama
McCain
.482
.469
.454
.505
.553
.431
.529
.456
Avg Diff. .036 .035 .043
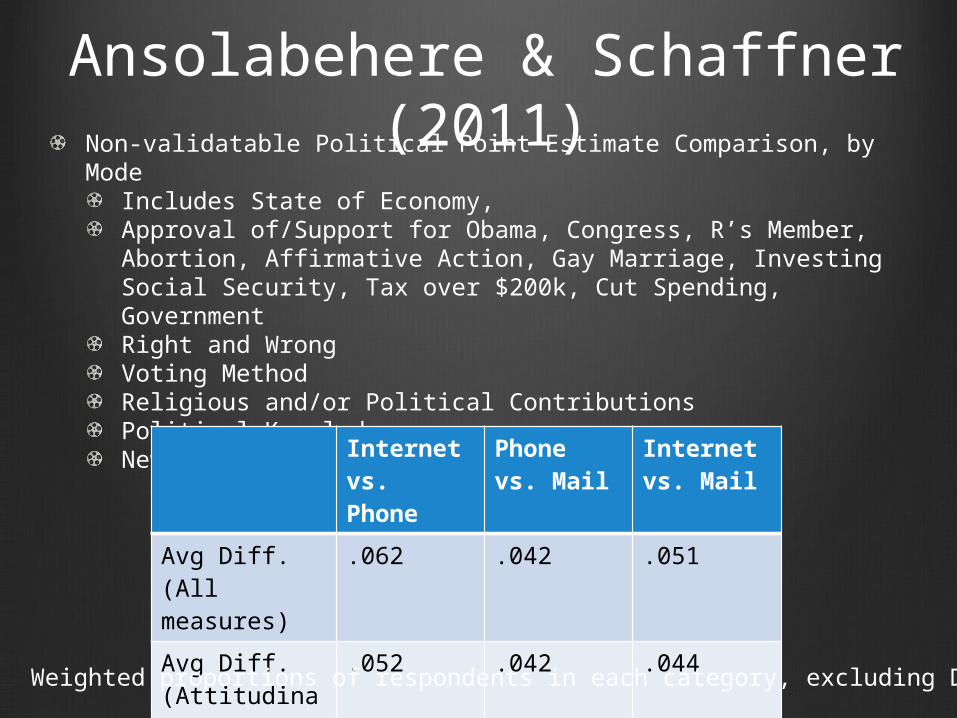
Non-validatable Political Point Estimate Comparison, by ModeIncludes State of Economy, Approval of/Support for Obama, Congress, R’s Member, Abortion, Affirmative Action, Gay Marriage, Investing Social Security, Tax over $200k, Cut Spending, GovernmentRight and WrongVoting MethodReligious and/or Political ContributionsPolitical KnowledgeNews Source
Ansolabehere & Schaffner (2011)
Internet vs. Phone
Phone vs. Mail
Internet vs. Mail
Avg Diff. (All measures)
.062 .042 .051
Avg Diff. (Attitudinal measures only)
.052 .042 .044
Weighted proportions of respondents in each category, excluding DK.
Small (“negligible”) differences across modesExcept…Internet respondents more politically knowledgeable & made more political contributionsMail costs 5 times more than Internet & twice as much as phoneInternet half as costly as phone and faster turnaroundDifferences from other studies that found Internet samples less valid than phone samples attributed to (1) more Internet users than 5+ years ago when prior data samples collected, and (2) advances in “science of constructing, matching and weighting opt-in Internet panels”Conclusion: “...an opt-in Internet survey produced by a respected firm can produce results that are as accurate as those generated by a quality telephone poll and that these modes will produce few, if any, differences in the types of conclusions researchers and practitioners will draw in the realm of American public opinion.”
Ansolabehere & Schaffner (2011)
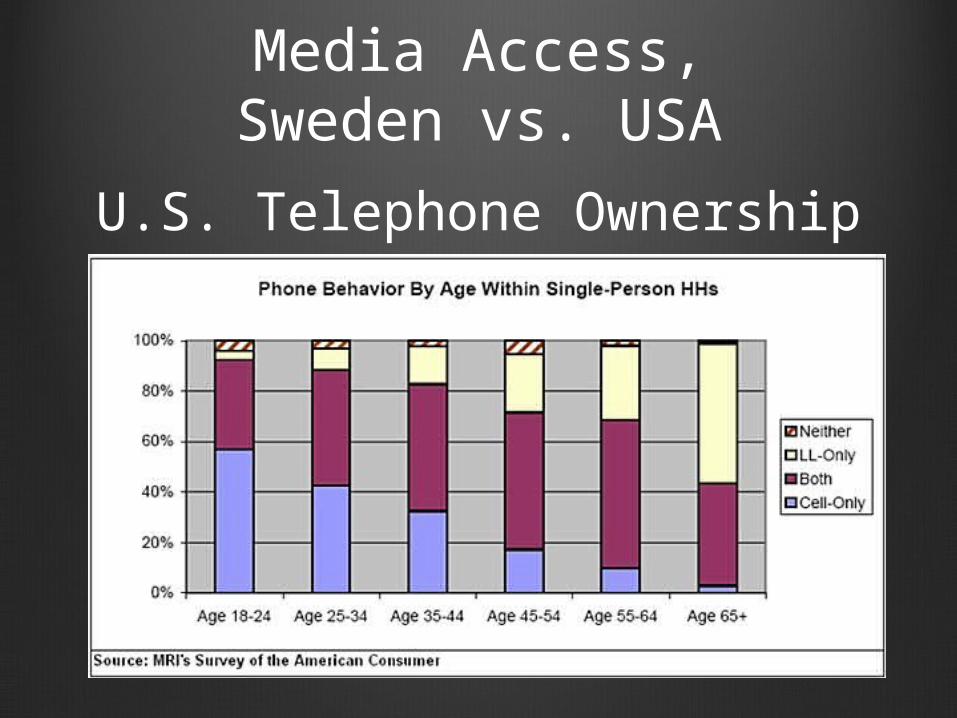
U.S. Telephone Ownership
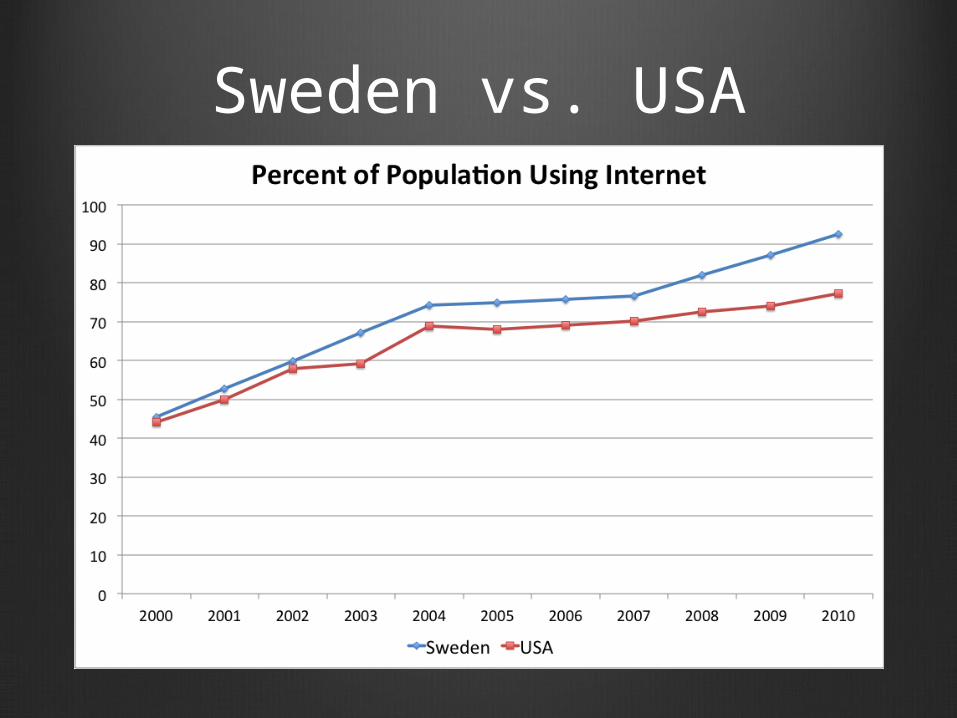
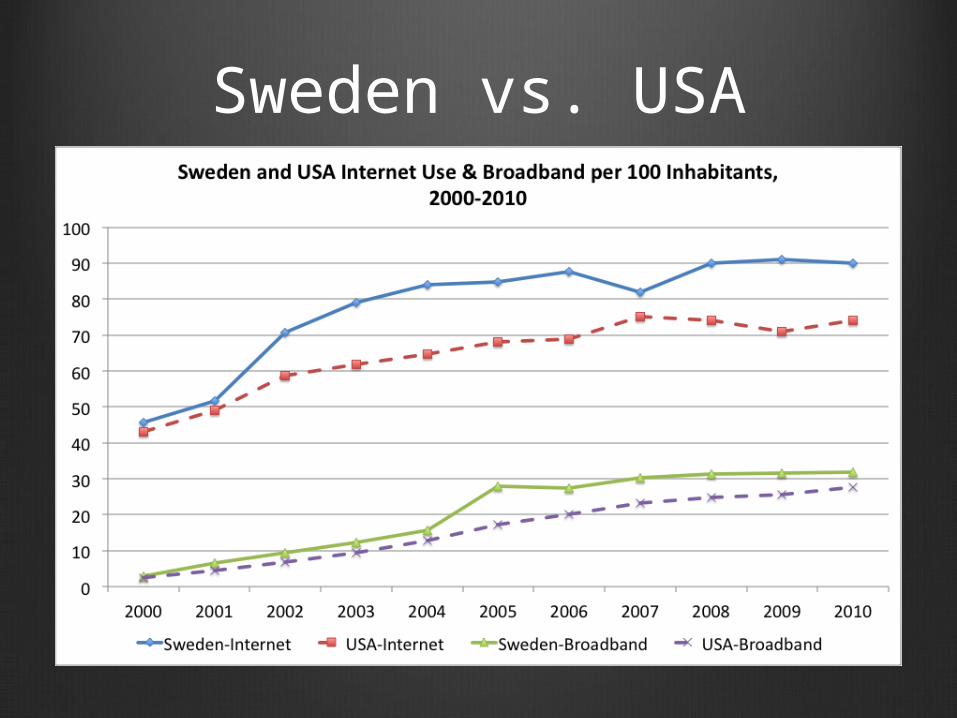
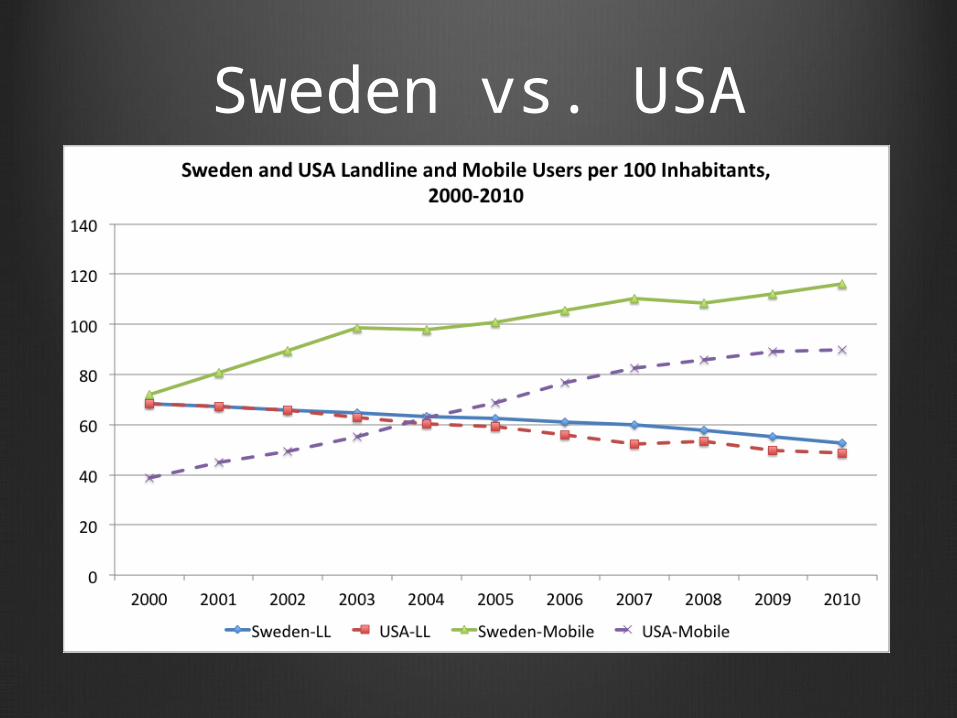
Media Access,Sweden vs. USA
Sweden vs. USA
Sweden vs. USA
Sweden vs. USA
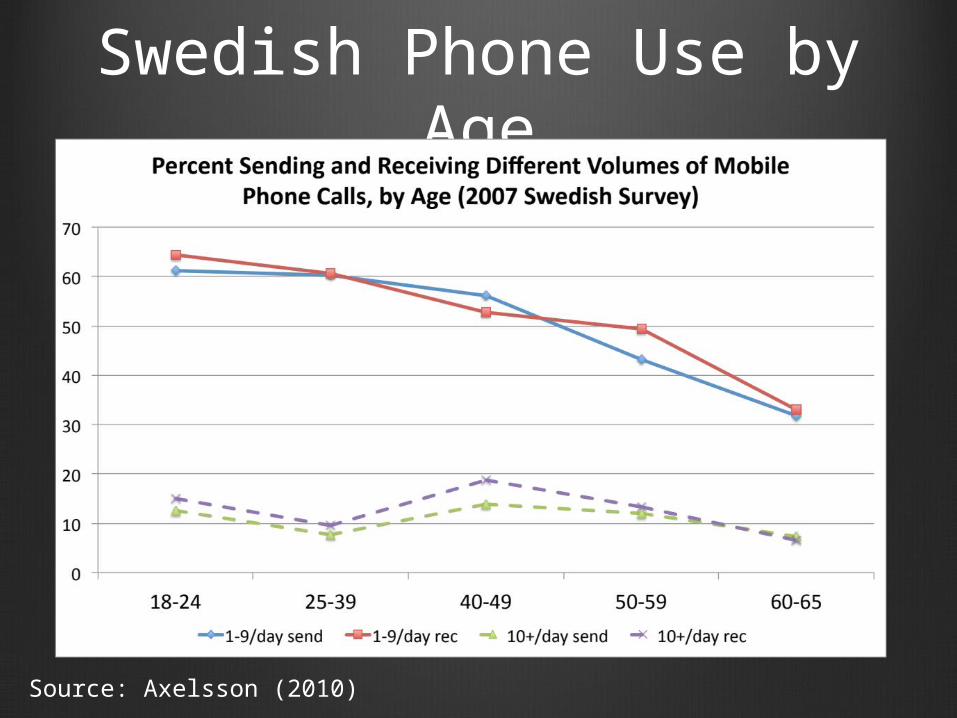
Swedish Phone Use by Age
Source: Axelsson (2010)
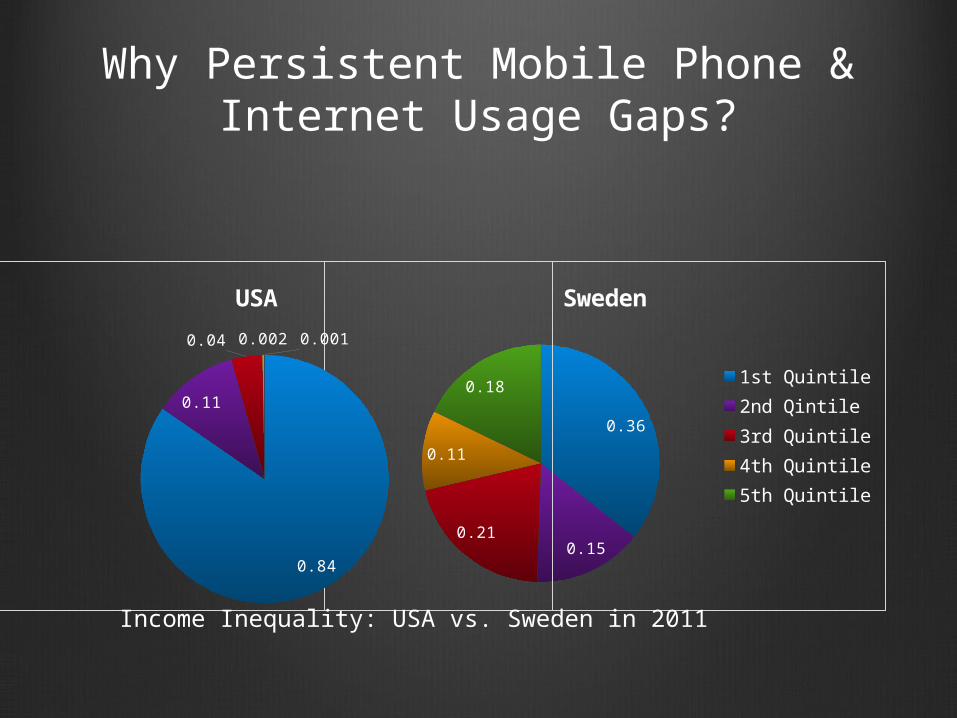
Why Persistent Mobile Phone & Internet Usage Gaps?
0.36
0.150.21
0.11
0.18
Sweden
1st Quintile2nd Qintile3rd Quintile4th Quintile5th Quintile
0.84
0.11
0.04 0.002 0.001
USA
Income Inequality: USA vs. Sweden in 2011
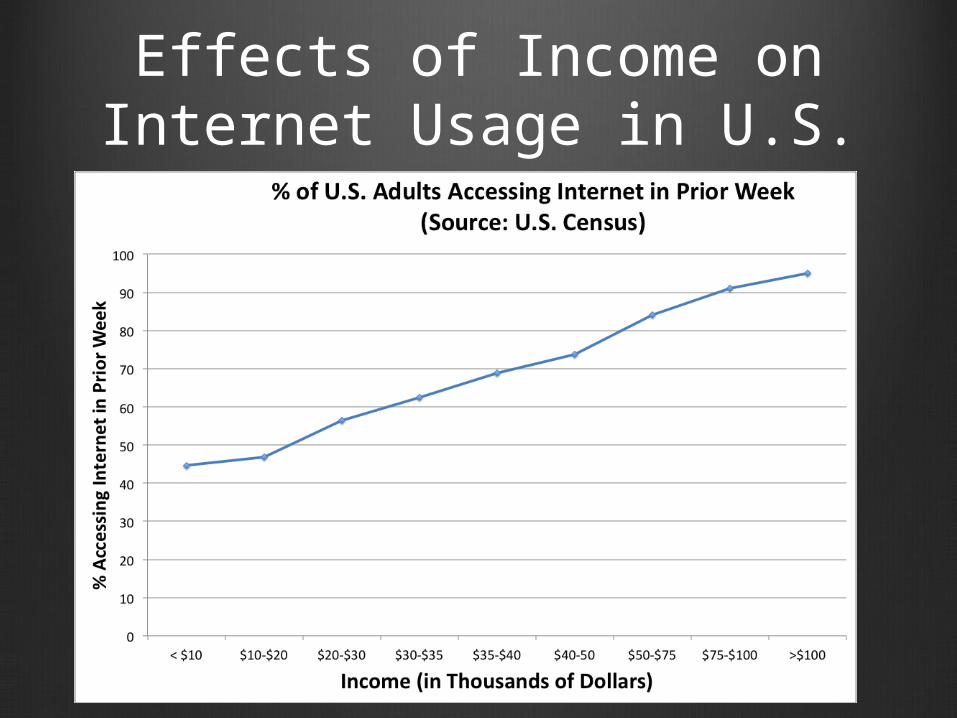
Effects of Income on Internet Usage in U.S.
U.S. has more of these folks

What Do Data Tell Us?Swedes more likely to be online in 2010 (by ~14 percentage points), and make greater use of Internet
But, similar in fixed broadband and landline usage
More likely to use mobile phones
But similar in volume of mobile calls sent and received
Moral of story? Infrastructure looks, if anything, LESS hospitable to probability sampling in Sweden than in USA
So, if RDD today works better in Sweden for generating probability samples, reason seems likely to have more to do with attitudes toward surveys than infrastructure

ConclusionsOpt-in Internet samples here to stay
Cheaper (by a lot!)Faster (by a fair amount…)Primary competitor (RDD phone surveys) increasingly difficult
14% of adults “unreachable” in Sweden?
Estimated 25% of U.S. households cell only in 2010.
“Unreachable”: ~13% (AAPOR 2010); others say more
Open up new possibilitiesE.g., cross-national samples/panels
Most current evidence suggests that with current matching and weighting techniques, Opt-in Internet samples can be representative of target populations