
Surprise! Out-of-Network Billing for Emergency Care …...5 entry of TeamHealth is not associated...
101
1 Surprise! Out-of-Network Billing for Emergency Care in the United States March 2018 Zack Cooper, Yale University Fiona Scott Morton, Yale University and NBER Nathan Shekita, Yale University Abstract: Hospitals and physicians independently negotiate contracts with insurers. As a result, a privately insured individual can attend an in-network hospital, but receive care from an out-of- network physician. Because patients do not choose their emergency physician, emergency physicians can remain out-of-network and charge high prices without losing volume. This strong outside option improves their bargaining power with insurers. We show that emergency physician outsourcing firms take advantage of this strong outside option by either remaining out- of-network or by using it to negotiate higher in-network rates. We propose a policy that would restore competition to the ED physician market and protect consumers. Zack Cooper ([email protected]) Fiona Scott Morton ([email protected]) Nathan Shekita ([email protected]) JEL codes: I11, I13, I18, L14 Acknowledgements: This project received financial support from the National Institute for Health Care Management Foundation. We received helpful comments from Amanda Starc, Stuart Craig, Chima Ndumele, Kate Ho, and Leemore Dafny. We appreciate the excellent research assistance provided by Eugene Larsen-Hallock and Charles Gray. All mistakes are our own.
Transcript of Surprise! Out-of-Network Billing for Emergency Care …...5 entry of TeamHealth is not associated...

1
Surprise! Out-of-Network Billing for Emergency Care in the United States
March 2018
Zack Cooper, Yale University
Fiona Scott Morton, Yale University and NBER
Nathan Shekita, Yale University
Abstract: Hospitals and physicians independently negotiate contracts with insurers. As a result,
a privately insured individual can attend an in-network hospital, but receive care from an out-of-
network physician. Because patients do not choose their emergency physician, emergency
physicians can remain out-of-network and charge high prices without losing volume. This strong
outside option improves their bargaining power with insurers. We show that emergency
physician outsourcing firms take advantage of this strong outside option by either remaining out-
of-network or by using it to negotiate higher in-network rates. We propose a policy that would
restore competition to the ED physician market and protect consumers.
Zack Cooper ([email protected])
Fiona Scott Morton ([email protected])
Nathan Shekita ([email protected])
JEL codes: I11, I13, I18, L14
Acknowledgements: This project received financial support from the National Institute for
Health Care Management Foundation. We received helpful comments from Amanda Starc,
Stuart Craig, Chima Ndumele, Kate Ho, and Leemore Dafny. We appreciate the excellent
research assistance provided by Eugene Larsen-Hallock and Charles Gray. All mistakes are our
own.
2
1. Introduction
Each year, there are 41.9 emergency department (ED) visits per 100 people in the United
States (US) (Rui et al. 2013). When patients access EDs, they are consuming a package of care
that includes hospital and physician services. However, what most privately insured patients do
not realize is that hospitals and physicians independently negotiate contracts with insurers. While
patients generally have a choice over which hospital they attend (only 14.5 percent of ED
patients arrive via ambulance), once they enter a hospital ED, they have little or no discretion
over the ED physician who treats them (Rui et al. 2013). As a result, it is possible for a patient to
choose a hospital ED that is in-network with his insurer, but receive care and a subsequent bill
from a physician working in that ED who is out-of-network with his insurer. When a physician is
out-of-network, she bills for her “charges,” which we show in our data are more than double the
standard, in-network, payments made to most ED physicians. As we describe in this paper, a
fundamental problem in emergency medicine in the US is that ED physicians face completely
inelastic demand when they are practicing inside in-network hospital EDs. As a result, they need
not set their prices in response to market forces. Ultimately, the practice of out-of-network
billing from inside in-network hospitals undercuts the functioning of health care labor markets,
exposes patients to significant financial risk, and reduces social welfare.
The financial harm patients face if they are treated by an out-of-network physician can be
substantial. In many instances, when a patient is treated by an out-of-network physician, insurers
will only pay physicians a portion of their out-of-network charges. This leaves the physician to
attempt to collect the difference between her charges and the insurer’s payment (the balance)
from the patient (so-called balanced or surprise billing). These balanced bills can be hundreds or
thousands of dollars (Rosenthal 2014a, 2014b, Sanger-Katz and Abelson 2016). They are also
unexpected by patients who reasonably assume that because they chose in-network hospitals for
care, they would also be treated by in-network emergency physicians. Moreover, even when an
insurer pays the entirety of a physician’s out-of-network charges, those higher costs will be
passed onto consumers via an increase in premiums and higher cost sharing (since patients will
pay a fixed percentage of the physician’s charges, rather than a fixed percentage of in-network
rates).
More generally, the ability to successfully execute an out-of-network strategy creates a
powerful outside option for ED physicians in their negotiations with insurers. If an insurer fails

3
to offer a high enough in-network rate, ED physicians working inside in-network hospitals can
refuse to contract with the insurer, treat patients out-of-network, and bill patients for their
charges. Because patients cannot avoid out-of-network physicians in their chosen hospital, ED
physicians who go out-of-network will not face any reduction in the number of patients they
treat. This stands in contrast to other healthcare providers, such as primary care physicians, who
will see a reduction in their patient volume if they do not join insurers’ networks. Theory
predicts that the availability of a lucrative outside option will give ED physicians bargaining
leverage that will allow them to raise their in-network payment rates.1 These higher payment
rates, caused not by supply or demand, but rather by the ability to “ambush” the patient,
represent a transfer from consumers to physicians and raise the cost of health care.
In this paper, we analyze data from a large insurer that covers tens of millions of lives
annually to study where and why out-of-network ED billing occurs, to examine how it impacts
in-network payment rates, and to test policy solutions designed to protect consumers. Our data
cover nearly $28 billion in emergency spending on 8.9 million ED episodes from 2011 through
2015. We find that out-of-network physicians charge, on average, 637 percent of what the
Medicare program would pay for identical services, which is 2.4 times higher than in-network
payment rates. Consistent with the benefits of having a stronger outside option, we find that ED
physicians in our data are paid in-network rates of 266 percent of Medicare payments, which is
higher than what most other specialists are paid (for reference, in our data, in-network orthopedic
surgeons are paid 178 percent of Medicare rates to perform hip replacements).
In previous research, Cooper and Scott Morton (2016) found that 22 percent of privately
insured patients treated at in-network hospital EDs were treated by out-of-network ED
physicians. In this paper, we show that focusing on the average frequency of out-of-network
billing nationally masks important heterogeneity in out-of-network rates across hospitals. Out-of-
network billing is concentrated in a small number of hospitals. We find that 50 percent of
hospitals have out-of-network billing rates below two percent while 15 percent of hospitals have
out-of-network billing rates above 80 percent. This paper explores the reasons for this
heterogeneity and discusses the policy response that it requires.
Approximately two-thirds of hospitals in the US outsource the staffing of their EDs to
physician management firms that hire and manage physicians, manage ED operations, and take
1 For a description of this result, see Osborne, Martin and Ariel Rubinstein (1990).
4
care of billing (Deutsche Bank 2013). We analyze the behavior of the two largest ED
outsourcing firms in the US: TeamHealth and EmCare. We find that the firms employ very
different out-of-network strategies. However, we ultimately observe that both firms profit from
the fact that out-of-network physicians working in in-network hospitals cannot be avoided by
patients. The differences in how EmCare and TeamHealth use out-of-network billing to raise
revenue are interesting in their own right. In addition, they offer insight into the economics of
bargaining between physicians and insurers.
Across our-sample, EmCare-managed hospitals have an average out-of-network ED
physician billing rate of 62 percent. Looking at data from 2011 to 2015, we find that after
EmCare took over the management of emergency services at hospitals with previously low out-
of-network rates, they raised out-of-network rates by over 81 percentage points. In addition, the
firm raised its charges by 96 percent relative to the charges billed by the physician groups they
succeeded. Some of this increase in physician charges is the result of a 43 percent increase in the
rate the company coded for physician services using the highest acuity (highest paying) service
code. Ultimately, we observe that the total payments made to EmCare by the insurer who
contributed our data increased by 122 percent after EmCare entered a hospital. We also observe
that patients faced an 83 percent increase in their cost sharing after the firm entered a hospital.
Consistent with predictions from the model we present, we also find evidence that the firm
compensated hospitals for allowing them to engage in an out-of-network strategy from inside
their facilities. This transfer took the form of an 11 percent increase in facility payments after
EmCare entered a hospital, which was driven by increases in the rates patients received imaging
studies and were admitted to the hospital by EmCare physicians.
Interestingly, TeamHealth, which has an average out-of-network billing rate of 13
percent, uses the threat of out-of-network billing to secure higher in-network payments. On
average, we observe that after TeamHealth entered a hospital, out-of-network rates increased by
33 percentage points. However, in most instances, several months after going out-of-network,
TeamHealth physicians rejoined the network and received in-network payment rates that were 68
percent higher than previous in-network rates. This is an example of the firm using a now-
credible threat of out-of-network billing to gain bargaining leverage in their negotiations over in-
network payments. Consistent with theory and our model, the TeamHealth in-network price is
lower than the EmCare out-of-network price. In contrast to what we observed for EmCare, the
5
entry of TeamHealth is not associated with an increase in the rate imaging studies are performed,
the rate patients are admitted to the hospital, or the rate that physicians bill using the highest
paying billing code for emergency care. Instead, we find that the entry of TeamHealth led to a 30
percent increase in the number of cases treated per year in entry hospitals’ EDs.
What hospitals would allow physician groups working inside their facilities to engage in
and out-of-network billing strategy given that it exposes patients to financial risk? Newhouse
(1970) posited that hospitals trade off patient and community benefit with profits. Theory
predicts that hospitals that place a lower weight on patient welfare relative to profits will have
more out-of-network billing. While there is ambiguity about the objective function of non-profit
hospitals, we would expect for-profit firms to be, ceteris paribus, more willing to prioritize
profits ahead of community benefit and contract with firms that deliberately go out-of-network.
Consistent with these predictions, we find that for-profit hospitals have higher out-of-network
billing rates. In addition, whereas 19 percent of hospitals in our sample are for-profit, 56 percent
of the hospitals that contract with EmCare are for-profit ventures.
Finally, we use our data to study the impact of a 2014 New York law that was designed
to protect fully-insured patients from surprise out-of-network bills. The law requires that patients
pay no more than their standard in-network cost sharing rates during an emergency, even if they
are treated by an out-of-network provider. The law also prohibits balanced billing. In order to
determine the rate that insurers pay physicians for out-of-network ED services, the law created a
binding, “baseball rules” arbitration process to settle payment disputes that could not be resolved
by the insurers and physicians directly. We find that the New York law lowered the incidence of
out-of-network billing by 34 percent. Unfortunately, because states cannot regulate
administrative services only (ASO) plans, the New York law applies only to the 40 percent of the
privately insured population that is covered by a fully-insured health insurance product.
However, the “baseball rules” effectively protect ASO patients, as we show below. Importantly,
the law does not fix the underlying problem of ED physicians being shielded from competition.
We close the paper by outlining a broader policy solution that would apply to all forms of
insurance (fully-insured and administrative-services only products). We propose that either states
or the federal government require hospitals to sell and insurers to purchase an “ED package” of
emergency medical care that includes both hospital and physician services. This change in
contract structure would generate competition in insurance, hospital, and physician markets,

6
eliminate out-of-network billing, and protect consumers
This paper is structured as follows. Section 2 gives background on ED care in the US and
describes the impact of surprise out-of-network billing on patients. In Section 3, we describe our
data and approach to identifying hospitals that contracted with EmCare and TeamHealth. In
Section 4, we model the incentives of physicians and hospitals to engage in out-of-network
billing. In Section 5, we identify the factors associated with out-of-network billing and analyze
the impact of the entry of EmCare and TeamHealth on out-of-network billing, out-of-pocket
costs, and hospital behavior. Section 6 analyzes the impact of a New York State law designed to
end out-of-network billing. In Section 7, we propose our own policy to address the issue. We
conclude in Section 8.
2. Background
2.1 The Evolution of Emergency Medicine in the United States
From the 1970s through the 1990s, care in hospital-based EDs shifted from being provided on an
ad hoc basis by community physicians to being delivered, round-the-clock, by doctors who often
completed residencies in the specialty of emergency medicine and who obtained board-
certification in the specialty (Institute of Medicine 2006).2 At present, there are more than 4,500
EDs in the US and approximately 40,000 physicians who staff them nationwide (Hsia et al.
2011; Morganti et al. 2013). The use of EDs has risen dramatically over time. From 1993 to
2003, the U.S. population grew by 12 percent, hospitalizations increased by 12 percent, and ED
visits increased by 26 percent (Institute of Medicine 2006). From 2001 through 2008, the use of
EDs increased 1.9 percent each year—60 percent faster than concurrent population growth (Hsia
et al. 2011).
Over the last several decades, EDs have become one of the main pathways through which
patients are admitted to the hospital (Morganti et al. 2013). From 1993 to 2006, the share of all
inpatient stays in which patients were admitted to the hospital via an ED increased from 33.5
percent to 48.3 percent (Schuur and Venkatesh 2012). Over time, as the use of EDs has gone up,
waiting times to be treated in EDs have also increased (Hing and Bhuiya 2012). In response to
rising waiting times, EDs increasingly are competing on the length of time patients have to wait
2 Many EDs are not staffed by board-certified ED physicians. Approximately a third of emergency care is provided
by family physicians. In rural states, the share of family physicians delivering emergency care is higher than 50%
(Wadman et al. 2005; Groth et al. 2013; McGirr et al. 1998).

7
before they are treated (Esposito 2015, Rice 2016). Because EDs have become a major source of
patients, hospitals now want to keep their EDs open at all hours and run them efficiently
(Institute of Medicine 2006, Morganti et al. 2013). As a result, there has been a marked increase
in the outsourcing of management of hospital EDs. ED outsourcing companies hire and manage
physicians, manage ED operations, and take care of billing. At present, roughly 65 percent of the
physician market is outsourced (Deutsche Bank 2013). Among the hospitals that outsource their
services, approximately a third contract with a large, national outsourcing chain and the
remainder are outsourced to smaller, local firms (Dalavagas 2014). Two leading national
outsourcing firms—EmCare and TeamHealth—collectively capture approximately 30 percent of
the physician outsourcing market (Deutsche Bank 2013).
In the aggregate, ED care is profitable for hospitals. Wilson and Cutler (2014) estimated
that average ED profit margins are approximately 7.8 percent per patient. However, the profit
margins that hospitals face for ED care vary significantly depending on how a patient’s care is
funded and based on whether a patient is admitted to the hospital. Wilson and Cutler (2014)
found that hospitals had profit margins of 39.6 percent for privately insured patients treated in
EDs, whereas the profit margin for patients covered by Medicare and Medicaid and those
uninsured was –15.6 percent, –35.9 percent, and –54.4 percent, respectively. They also found
that patients who were admitted to the hospital were significantly more profitable than those who
were not. For Medicare patients, the profit margin on ED care for patients who were discharged
from the ED was –53.6 percent whereas the profit margin for patients who were admitted to the
hospital was 18.4 percent (Wilson and Cutler 2014).
2.2 Out-of-Network Surprise Billing
There has been significant coverage of out-of-network billing in the popular press (Rosenthal,
2014a, 2014b, Sanger-Katz and Abelson 2016). However, until recently, there has been no
systematic evidence on the frequency that out-of-network billing occurs. Recent survey work
suggests that it is fairly common for privately insured patients to be treated by out-of-network
physicians. A Consumers Union (2015) survey found that 30 percent of privately insured
individuals reported receiving a surprise medical bill within the previous year, and Kyanko et al.
(2013) found that most instances in which privately insured individuals involuntarily saw out-of-
network providers occurred during medical emergencies. In many instances, when patients

8
receive a surprise bill, they simply pay the balance in full (Consumers Union 2015). Likewise,
among those who had trouble paying a medical bill, 32 percent reported that their financial
troubles stemmed from a bill from an out-of-network provider for services that were not covered
or were only partially covered by their insurer (Hamel et al. 2016). In this Hamel et al. (2016)
survey, the authors found that bills from ED physicians made up the largest share of medical
debt that patients reported having problems paying.
The results of these surveys have been confirmed by recent empirical evidence. A 2014
report found that among the three largest insurers in Texas, 45 percent, 56 percent, and 21
percent of their in-network hospitals had zero in-network ED physicians (Pogue and Randall
2014). Likewise, in the first national study of out-of-network billing, Cooper and Scott Morton
(2016) analyzed data from a large commercial insurer and found that 22 percent of in-network
ED hospital visits included a primary physician claim from an out-of-network doctor. Using
completely different data, Garmon and Chartock (2017) found that 20 percent of ED cases in
which care was delivered to privately insured patients at in-network hospitals involved care form
an out-of-network physician. As we will show below, knowing the average propensity of
receiving an out-of-network bill does not help diagnose the policy problem, which lies in the tail
of the distribution of out-of-network billing rates across hospitals.
It is clear that most patients face higher co-insurance rates when they see out-of-network
physicians, can be balanced billed, and, in some instances, may be wholly responsible for the
cost of their visit. As we show later from our data, these physician bills can be extremely large.
Unfortunately, there is no systemic evidence on the frequency that patients are balance billed or
exposed to the full costs of an episode of care. However, reports from regulators in Colorado and
New York indicate that this practice does occur and can expose patients to significant financial
risk (Department of Financial Services 2012, Department of Regulatory Agencies 2010).
Likewise, data from the Texas Department of Insurance showed that balance-billing complaints
in the state increased 1,000 percent from 2012 to 2015 (Gooch 2016).
3. Data and Descriptive Statistics on Out-of-Network Billing
3.1 Data
Our claims data come from a large commercial insurer that covers tens of millions of lives
annually. The data run from January 1, 2011, through December 31, 2015. The data are

9
structured at the service-line level and include detailed patient characteristics, a provider
identifier, and the ability to link to a range of third-party datasets. We define ED episodes as
those with a physician service line that includes a Current Procedural Terminology (CPT) code
for emergency services and a hospital revenue code associated with an emergency visit.3 We
limit our analysis to episodes that occurred at hospitals registered with the American Hospital
Association (AHA). Therefore, we do not include, for example, treatment that was delivered at
urgent care clinics.
At baseline, our data include 13,444,445 episodes. We introduce several sample
restrictions to our data to produce an analytic dataset. First, we exclude episodes that were
missing an AHA hospital ID or did not come from an AHA-identified hospital. Thus, the
analysis is focused only on hospital-based ED care. This restriction eliminates 1,908,710
episodes. Second, we exclude episodes for which the same physician billed as in-network and
out-of-network on separate service lines on the same claim form. This restriction eliminates
264,636 episodes. Third, we exclude episodes with duplicative insurer payments, episodes with
insurer payments that were negative, and episodes for which the insurer paid $0 because the
claims were denied. This restriction removes 217,267 episodes. Fourth, we exclude episodes for
which the start date of the episode occurs after the end date of the episode. This restriction
excludes 79 episodes. Fifth, we limit our analysis to hospitals that delivered 10 or more episodes
per year and appear in all five years of the data. This restriction excludes 330,312 episodes.
Sixth, we limit our analysis to individuals who had six months of continuous enrollment before
their emergency episode.4 Having six-months of historical data is necessary to create our
Charlson comorbidity scores. This restriction excludes 1,810,245 episodes from our analysis.
Finally, we winsorize the top and bottom 1 percent of the prices in our data.5 We do this to limit
the influence of idiosyncratically high- and low-priced episodes.
In our data, we observe the amount the ED physician and hospital submitted as a charge,
the amount that the insurer paid, and patients’ co-insurance payments, co-payments, and
spending under their deductibles. We define the total amount an ED physician was paid as the
3 We identify ED claims for physicians as those that include a CPT code of 99281, 99282, 99283, 99284, 99285, or
99291 and a hospital service line as those with a revenue code of 0450, 0451, 0452, 0453, 0454, 0455, 0456, 0457,
0458, or 0459. We require episodes in our analysis to have a physician service line with an ED code and a facility
service line with an ED code. 4 We did so because we wanted to have the ability to control for patients’ historical spending and comorbidity. 5 Our results are robust to not winsorizing prices, but there are extremely large hospital and physician charges and
payments.

10
sum of the insurer payment, the patient co-insurance payment, the patient co-payment, and the
patient deductible on physician service lines that have a CPT code for emergency services.6 We
calculate facility payments as the sum of the insurer payment, patient co-insurance, patient co-
payment, and patient spending under her deductible summed across all facilities claims. All
prices are put in 2015 dollars using the U.S. Bureau of Labor Statistics Consumer Price Index.
Unfortunately, we do not observe whether patients were balanced billed by physicians.
Therefore, it is possible that the physician collects more in total than we can measure. To our
knowledge, there are no datasets with information on the balance billing of patients. However,
we construct a potential balanced bill measure that is the difference between what the physician
charged and the sum of what the physician was paid by patients (in the form of cost-sharing) and
by the insurer. We also create a measure of patients’ potential total cost exposure, which we
calculate as the sum of the potential balanced bill and their out-of-pocket costs.
In addition, we construct an indicator for whether or not imaging occurred during an
episode based on whether or not there are facility claims with revenue codes associated with
imaging studies.7 Likewise, we identify episodes as involving an admission to the hospital if the
facility claim for the episode includes a revenue code for room and board fees.8
For each episode, we also observe the patient’s sex, age (measured in 10-year age bins),
and race (white, black, Hispanic, and other). We also use our claims data to measure historical
patient spending for six- and 12-month periods preceding an episode. Because we do not want
the emergency episodes we are analyzing to feed into the historical spending measures, we
measure spending from two weeks before the admission date for an episode back six and 12
months. In addition, we used six and 12 months of claims data to calculate Charlson measures of
comorbidity (Charlson et al. 1987).9
3.2 Identifying Where EmCare and TeamHealth Have Contracts
The national market for physician outsourcing is dominated by two firms that collectively
account for approximately 30 percent of the outsourced physician market. EmCare is publicly
6 These are service lines with a CPT code of 99281, 99282, 99283, 99284, 99285, or 99291. 7 We identified episodes that included imaging studies based on whether or not the facility claims had a service line
with the revenue codes 350–352, 610–619, 400–404, or 409. 8 We identified room and board fees based on the following revenue codes on facility claims: 100, 101, 103, 110–
160, 164, 167, 169–176, 179, 190–194, 199–204, 206–214, 219, 658, or 1000–1005. 9 We pooled individuals with a Charlson score of 6 and higher.

11
traded, operates in 45 states, has 23,100 affiliated or employed physicians and health care
professionals, and according to their 2016 Form 10-K, delivers more than 18 million emergency
episodes per year. More recently, EmCare has partnered with a large, for-profit hospital chain
and formed joint ventures where the firm and its hospital partners share in profits from physician
bills (Deutsche Bank 2013).
The second firm, TeamHealth, is approximately the same size. According to the firm’s
2015 Form 10-K, TeamHealth has more than 18,000 affiliated health professionals and delivers
approximately 10 million ED cases per year. TeamHealth recently acquired another physician
outsourcing company and now is likely to have the largest market share in the physician
outsourcing space. The firm was previously publicly traded but was taken private in 2016.
EmCare and TeamHealth bill using their contracted physicians’ National Provider
Identifier (NPI) numbers. As a result, our claims data do not indicate that a particular claim is
being billed by a physician employed by one of these firms. To identify the hospitals where
EmCare and TeamHealth have outsourcing contracts, we use data from the firms’ own webpages
and documents. We require two independent sources of information to classify a hospital as a
facility that outsourced its ED services to EmCare or TeamHealth.
We rely on maps with approximate firm locations to provide the first source of
information on which hospitals are affiliated with EmCare and TeamHealth. Envision, the parent
company of EmCare, posted a map on the company webpage that included the approximate
location of each location where EmCare has a contract (see Appendix Figure 1A). The map on
the Envision webpage included embedded latitudes and longitudes within the webpage’s
underlying code, which we use to identify hospitals. Likewise, we use a map from TeamHealth’s
initial public offering in 2009 that shows the locations where TeamHealth had contracts in 2009
(TeamHealth 2009) (see Appendix Figure 1B). To identify hospital locations on the TeamHealth
map, we scraped the map using mapping software from ArcGIS.10
The second source of information we use to identify hospitals that contract with EmCare
and TeamHealth came from job advertisements posted by the firms. Each firm posts job
advertisements for physicians on their respective webpages (see an example in Appendix Figure
10 To obtain the latitudes and longitudes of the hospital locations displayed on the Morgan Stanley Report map, we
utilized georeferencing within ArcMap. This technique aligns a map with a known coordinate system to the map of
interest (which has no identified coordinate system). After transforming and overlaying the two aligned maps, we
then obtain coordinate estimates of each marked hospital within a reasonable range of accuracy.
12
2). The job advertisements include the name of the hospital where physicians are being recruited
and the specialty of the physicians the hospital is looking to hire. We scraped the names of the
hospitals and the specialty of the physicians being recruited from all job postings that were
available from the firms’ webpages and webpage histories.
Ultimately, we identify a hospital as having a contract with EmCare or TeamHealth if we
are able to identify the hospital on a map of the outsourcing firms’ locations and we found a job
hiring post for the hospital. This strategy exploits the fact that, in general, these firms wholly
take over an ED and participate in exclusive contracts with hospitals (Deutsche Bank 2013).
Using this strategy, we find 194 hospitals associated with EmCare and 95 hospitals
affiliated with TeamHealth. As a result, of the 3,345 hospitals in our analysis that meet our
sample criteria, 5.8 percent outsource their ED to EmCare and 2.8 percent outsource their ED to
TeamHealth. Based on investor reports on EmCare and TeamHealth, our sample of hospitals
with contracts with EmCare and TeamHealth represents an undercount of the total population of
hospitals that have contracts with EmCare and TeamHealth.
We also use the entrance of physician management companies into hospitals to estimate
the causal effect the entry of TeamHealth and EmCare had on physician pricing and hospital
behavior. To do so, we identify hospitals where these firms entered into an outsourcing contract
from 2011 to 2015. To identify the hospitals where EmCare and TeamHealth entered into
outsourcing contracts, we searched both companies’ webpages for press releases announcing
new contracts. Likewise, we used LexusNexus and Google to search the popular press for news
stories that announced when either EmCare or TeamHealth entered into a contract with a
hospital. Using this strategy, we find evidence that during our time period (2011 through 2015),
EmCare entered into contracts with 16 hospitals that were part of nine health systems while
TeamHealth entered into contracts with 10 hospitals that were part of six systems (see Appendix
Table 1).
4. Modeling Surprise Out-of-Network Billing
For it to occur, there are three parties that have to prefer out-of-network billing to an in-network
contract: the physician group, the hospital, and the insurer. The physician group and insurer must
be unable to come to an agreement on an in-network contract. In addition, the hospital must
13
effectively allow physicians to bill out-of-network from inside their facilities.11 We discuss each
party’s incentives in turn.
4.1 Out-of-Network Prices
The physician group and the insurer bargain over the price the insurer will pay the physicians.
The revenue component of the disagreement payoff of the physician group should it end up out-
of-network is a price limited only by the laws of a state, 𝑠. Since state laws differ, this net price
will vary by state, and we could think of the price as being a function of that state’s institutional
environment, e.g. 𝑝 = 𝑓(𝑙𝑎𝑤𝑠).12 However, the model below will focus on agents all in one state
and describe the average out-of-network price the group can collect, 𝑝𝐿, as coming from the legal
environment, not the market environment in that state. A crucial feature of emergency medicine
(that our model exploits) is that the quantity of patients seen by the emergency physician group is
invariant to its network status.13
4.2 Insurers
We denote the equilibrium negotiated price as 𝑝∗. We abstract from all other revenue and costs
of the insurer and simply define 𝑟 to be the insurer’s net revenue per patient without any ED
physician cost. Thus, the net benefit of a representative enrollee to the plan is 𝑟 less the cost of
the ED physician. If the physician group and the insurer agree to a contract at 𝑝∗, the insurer
gets:
(1) 𝑈𝑖,𝐼𝑁 = 𝑟 − 𝑝∗.
If the two parties do not agree, then the physician group begins billing its charges, which are
higher than negotiated network rates. The insurer may take advantage of any state law to reduce
those physician charges, but the laws result in an effective price received by the physicians of 𝑝𝐿.
11 The hospital may not have legal authority to prevent a physician (or physician group) from practicing in the ED
just because that physician has failed to come to an agreement with any given insurer or insurers. However, we
assume there are so many interactions between the hospital and an ED physician group that if the hospital
disapproved of the group’s overall strategy, it could make the relationship sufficiently onerous such that the
physicians would move in-network. 12 In Maryland and California, for example, out-of-network physicians cannot bill more than the greatest of either
their in-network payments, a fixed percentage of Medicare payments, or physicians’ usual and customary charges. 13 When patients attend a hospital ED, they have no choice over the physician that treats them. As a result, once a
patient decides to attend a hospital ED, the patient cannot avoid out-of-network physicians working in that ED.
Previous researchers have used this feature of emergency medicine as a source of random variation in physician
assignment (see: Barnett, Olenski, and Jena 2017, Chan 2015).
14
We assume that the insurer ends up paying some fraction 𝛾, less than one of the new out-of-
network price 𝑝𝐿. We will treat 𝛾 as exogenous in our model.14 The net insurer payoff under
disagreement is thus:
(2) 𝑈𝑖,𝑂𝑈𝑇 = 𝑟 − 𝛾𝑝𝐿.
A second difference under disagreement is that now the physicians also collect the balance of the
payment from the patient, who earns a disutility payoff 𝑊((1 − 𝛾)𝑝𝐿) < 0. The patient blames
the hospital for the balance bill so the hospital suffers harm to its reputation of 𝑘ℎ. Throughout
the model, when we use the term “out-of-network billing” we are referring to physicians using
the deliberate strategy of raising charges by a significant amount in order to earn higher
payments. It is perfectly possible for an ED physician group to not have a contract with a
patient’s insurer (perhaps due to transaction costs) and to charge that patient a typical in-network
price. We assume, as is the case in our data, that in this situation the patient and the insurer will
share costs in the usual way and there are no disputes. We further assume that in that case there
is no reputational cost to the hospital. While this setting is technically also “out-of-network
billing,” we exclude it from the definition in our discussion below in order to focus on the
deliberate strategy of raising prices.
4.3 Hospitals
We assume that hospitals understand when their outsourcing firm will be taking advantage of
patients and insurers with an out-of-network billing strategy. Hospitals appreciate that the
management company cannot carry out its strategy without access to the ED, and therefore the
hospital will be able to bargain to keep a share of the increased profits generated by the
outsourcing firm. These profits could take the form of physicians allowing the hospitals to share
in the physicians’ profits (e.g., with a joint venture), through a reduction in any management fees
that a hospital would have to pay a firm to staff their ED. The payment could alternatively be
generated by increases in facility fees that result from increased testing rates, imaging rates, or
admissions to the hospital. Recall that, ultimately, physicians control patient utilization and what
gets billed by the hospitals. As a result, ED physicians have significant influence over hospitals’
revenue.
14 It could be that 𝛾 is determined by state laws and norms as well as by competition in the insurer market. We
assume that frictions in the physician ED market are too small to create any feedback to insurance competition.
15
Because the hospital can block an out-of-network billing strategy, it must be
compensated for the reputational loss it incurs from having this practice occur inside its facility.
We assume that an outsourcing firm can pay a fixed amount 𝑐 > 𝑘ℎ to satisfy the hospital.15
Physicians also have the ability to generate payment c to the hospital without it coming from the
physician’s own pocket. This could occur via potentially unnecessary activities 𝐴 such as
ordering additional lab testing, imaging studies, or raising the rates that patients are admitted to
the hospital. Increasing these activities does not generate revenue for the physician, but it does
generate revenues to the hospital. Engaging in activity 𝐴 carries with it some legal risk indicated
by 𝑅(𝐴), (with 𝑅′(𝐴) > 0, 𝑅(0) = 0), since it potentially involves giving care to patients who
don’t need it which could be found to violate laws or regulations. A more complex model could
make 𝑐 endogenous and allow outsourcing firms to compete by increasing it, but we do not take
on that topic in this paper.
We also assume the hospital does not face any cost of higher-priced in-network billing.
We think this is a reasonable assumption because it is hard for patients to observe counterfactual
prices and patients perceive they are ‘covered’ in these circumstances. That is, the level of 𝑝∗
paid to ED physicians when they participate in an insurer’s network does not affect the hospital’s
payoff. Hospitals value consumer welfare and also profits with weight 𝛼ℎ. If a hospital hires an
out-of-network group to staff its ED, hospital utility changes by:
(3) Δ𝑈ℎ = (𝑐 − 𝑘ℎ) + 𝛼ℎ𝑊((1 − 𝛾)𝑝𝐿),
which represents its incremental financial earnings less the dollar value of the disutility of
patients. The hospital will only agree to out-of-network billing if its weight 𝛼ℎ on patients is
sufficiently low. Recall that 𝑊 < 0 and 𝑐 > 𝑘ℎ, so 𝛼ℎ will be positive but smaller, all else equal,
for hospital willing to engage in out-of-network billing:
(4) 𝛼ℎ < (𝑐 − 𝑘ℎ)/(−𝑊((1 − 𝛾)𝑝𝐿)).
If a hospital experiences a very high reputational or other cost to hosting a physician
group engaged in an out-of-network billing strategy, physician groups will find it expensive to
locate their strategy in that hospital and will tend to locate elsewhere. In the empirical section of
15 We recognize a possible role for asymmetric information. A hospital may not realize the strategy of the
outsourcing firm ex ante. An uniformed hospital may sign a contract that is later terminated when the hospital
realizes its patients are receiving balance bills and the reputational cost is high. For example, the Los Alamos
Medical Center began contracting with EmCare in 2012 (DeRoma 2012). Several years later, the hospital ended
their contract with the hospital over concerns about out-of-network billing and coding practices.

16
the paper we will identify the characteristics of hospitals that have high out-of-network rates and
contract with firms that engage in an out-of-network billing strategy.
4.4 Physicians
A physician group faces a tradeoff between exercising its threat of going out-of-network and
collecting 𝑝𝐿 while compensating the hospital 𝑐 (or engaging in 𝐴) and having a disutility from
financially harming patients, or joining the network for 𝑝∗. Consumer welfare, 𝑊, is constant at
zero across in-network prices because we assume the impact of out-of-network billing on
premiums takes place slowly over time and is not perceived by consumers within our game. Out-
of-network billing from a patient’s doctor results in disutility to that patient of 𝑊((1 − 𝛾)𝑝𝐿)
which the physicians also take into account with a weight αp.
Physicians value profits, consumer welfare, and legal risk with weights as noted below.
Profit is the negotiated price times a fixed quantity of patients less any financial costs due to the
physician group’s choice. If out-of-network status is chosen, the group must either pay the
hospital the financial cost 𝑐 or bear risk 𝑅(𝐴), which is a decrement to the physicians’ utility
weighted by 𝛽𝑝. Physician per patient utility (the number of patients is fixed) when bargaining
fails is:
(5) 𝑈𝑝,𝑂𝑈𝑇(𝜋, 𝑊, 𝐴) = 𝑝𝐿 + 𝛼𝑝𝑊((1 − 𝛾)𝑝𝐿) − min {𝑐, 𝛽𝑝𝑅(𝐴)}.
We assume that everywhere physicians’ gain from an additional dollar increase in 𝑝𝐿 is larger
than their utility loss from the harm to consumers. Physicians’ increased utility from income can
be offset by harm to consumers, but not reversed. This is particularly plausible when 𝛾 is large,
which is the case in our setting.16 We therefore assume |𝛼𝑝𝑊′| < 1.
When bargaining succeeds and the physician group is in-network at the hospital, its
utility is:
(6) 𝑈𝑝,𝐼𝑁(𝜋, 𝑊, 𝐴) = 𝑝∗.
We assume equal bargaining power for the two parties. The Nash bargaining expression is
therefore the product of the gains from agreement for both parties:
(7) [𝑈𝑝,𝑂𝑈𝑇 − 𝑈𝑝,𝐼𝑁] ∗ [𝑈𝑖,𝐼𝑁 − 𝑈𝑖,𝑂𝑈𝑇].
16 Few consumers have savings to pay a large medical bill and therefore the fraction of it that can be actually
collected by physicians is relatively small.

17
Which can equivalently be written:
(8) [𝑝∗ − 𝑝𝐿 + 𝛼𝑝𝑊((1 − 𝛾)𝑝𝐿) − min{𝑐, 𝛽𝑝𝑅(𝐴)}] ∗ [𝛾𝑝𝐿 − 𝑝∗].
We assume bargaining strengths are equal and therefore 𝑝∗ will split any difference between the
two outside options. If the following holds:
(9) 𝑈𝑝,𝑂𝑈𝑇(𝜋, 𝑊, 𝐴) = 𝑝𝐿 + 𝛼𝑝𝑊((1 − 𝛾)𝑝𝐿) − min{𝑐, 𝛽𝑝𝑅(𝐴)} ≥ 𝛾𝑝𝐿,
then there are no gains from a contract and the physician group will stay out-of-network. On the
other hand, if:
(10) 𝑈𝑝,𝑂𝑈𝑇(𝜋, 𝑊, 𝐴) = 𝑝𝐿 + 𝛼𝑝𝑊((1 − 𝛾)𝑝𝐿) − min{𝑐, 𝛽𝑝𝑅(𝐴)} < 𝛾𝑝𝐿,
then we expect an equilibrium 𝑝∗:
(11) 𝑝∗ = [𝑝𝐿 + 𝛼𝑝𝑊((1 − 𝛾)𝑝𝐿) − min{𝑐, 𝛽𝑝𝑅(𝐴)} − 𝛾𝑝𝐿]/2
The intuition for the case where an in-network price is possible is graphed below. The
key is that the physician’s net utility for being out-of-network is low, either because of concern
for patient welfare or because the hospital’s reputational cost, and therefore transfer, is high.
Alternatively, if 𝑈𝑝,𝑂𝑈𝑇 (measured in dollars) lies above 𝛾𝑝𝐿 on the line below, either because
physicians are not concerned about putting patients in a bad situation or hospital reputation costs
are low, then there is no scope for agreement.
𝑈𝑝,𝑂𝑈𝑇 𝑝∗ 𝛾𝑝𝐿 𝑝𝐿
The insurer’s outside option (𝛾𝑝𝐿) is not specific to an insurer but is constant across all insurers
due to state law. Equilibrium 𝑝∗ will fall in between the two outside options when 𝑈𝑝,𝑂𝑈𝑇 is low
enough. In the case when there is possibility of an agreement, if the law or other forces raise the
insurer’s out-of-network payment, the equilibrium negotiated price will increase. We can check
if an increase in 𝑝𝐿 will raise the equilibrium negotiated rate by taking the derivative of the
expression for 𝑝∗ with respect to 𝑝𝐿 and asking if it is positive.
(12) 1 − 𝛾 + (1 − 𝛾)𝛼𝑝𝑊′ > 0
We know 𝑊′ is negative (a higher payment paid by consumers makes their utility more
negative) and we also know |𝛼𝑝𝑊′| < 1 by our assumption above. Since (1 − 𝛾) is positive, the
derivative is therefore positive.
Take the case where physicians put no weight on legal risk or patient disutility. In that
case the physician payoff is 𝑝𝐿 (they choose activity 𝐴 and do not pay 𝑐) and there is nothing the
18
insurer can offer as an in-network price that will be attractive. The physicians will stay out of the
network, insurers will pay 𝛾𝑝𝐿 and patients will pay the balance. As physicians’ disutility for
risk, 𝑐, and weight on patients all rise, the outside option for the physician group becomes worse
and eventually will fall below 𝛾𝑝𝐿 whereupon there is scope for an in-network rate that benefits
both sides.
Out-of-network physician groups will choose between paying 𝑐 or engaging in activity 𝐴
according to whichever is cheaper, which will depend on their risk tolerance 𝛽𝑝. Physician
groups with low 𝛼𝑝 and high 𝛽𝑝 want to choose the out-of-network strategy but do not want the
risk of activity 𝐴 and therefore must pay the hospital directly. Physician groups with low 𝛼𝑝 and
low will 𝛽𝑝 choose the out-of-network billing strategy for the additional profit, and pay the
hospital through activity 𝐴 which they find relatively cheap compared to giving up profit.
Much of the empirical analysis in our paper concerns the change when the outsourcing
firm takes over the ED group. This can be incorporated into the model in two ways. First, we
could think of the management company causing an increase in the effective bargaining power of
the physician group. Instead of each having 0.5 weight, we could model the company as making
take-it-or-leave it offers to the insurer. Alternatively, the outsourcing company could improve the
information of the physicians by, for example, providing data on how large out-of-network bills
can be under the law. Out-of-network billing was always an option in this scenario, but the prior
physician group may not have been aware of its profitability. This might be because before the
outsourcing firm arrived, the physician group lacked professional management, felt excessive
concern that the group could be easily replaced by the hospital, had a lack of knowledge of the
cost of collecting and litigating large bills, lack of knowledge of state law and regulation, and so
forth. We can think of the outsourcing firm as bringing to bear its knowledge of “best practices”
in terms of out-of-network billing, its costs, collection procedures, relevant state law, etc. This
kind of change in information would raise the 𝑝𝐿 perceived by the physician group and change
the game that way.
We take the model above to the data as follows. We expect to see that for-profit hospitals
have a higher level of out-of-network billing and a higher propensity to contract with EmCare
than non-profit hospitals because their weight on patient welfare is lower. We also expect that in-
network prices for ED physicians will be higher relative to in-network rates in other specialties
where out-of-network billing is not an option. And further, we expect that in-network prices will

19
be higher when the threat of moving out-of-network is credible, which occurs when the ED
physicians are managed by an outsourcing company. Lastly, the out-of-network payment to ED
physicians who remain out-of-network will be higher than all types of in-network prices.
5. Out-of-Network Billing, Physician Prices, and Hospital Outsourcing
5.1 Descriptive statistics on ED Physician Payments and Out-of-Network Billing Rates
Our final dataset is composed of 8,913,196 ED episodes delivered between January 1, 2011 and
December 31, 2015 (see Table 1).17 This represents nearly $28 billion in emergency spending.
Over 99 percent of ED cases in our data occurred at an in-network hospital. As we illustrate in
Table 1, the average in-network ED physician payment across our sample period was $325.91
(266 percent of what the Medicare paid for the same services). The amount ED physicians were
paid increased as a percentage of Medicare over our time period. During this period patient out-
of-pocket costs for emergency care also steadily increased and the average total out-of-pocket
cost for an emergency episode (combining the physician and facility component) was $467.75.
Appendix Table 2 includes descriptive statistics for our analytic sample of ED episodes.
At the average in-network hospital in our data, 25.8 percent of patients treaded in the ED
were treated by an out-of-network ED physician (Table 1). The frequency that patients at in-
network hospitals were treated by out-of-network ED physicians has declined over time from
28.6 percent in 2011 to 21.9 percent in 2015. However, this average masks significant
heterogeneity in out-of-network billing rates across hospitals and is somewhat misleading. Figure
1 shows the distribution of out-of-network billing rates across hospitals in our data in 2015 and
summary statistics for that year. It illustrates that out-of-network billing is highly concentrated in
a small group of hospitals. As we illustrate, 50 percent of hospitals have out-of-network billing
rates below two percent. In contrast, the out-of-network billing rate for hospitals in the 75th
percentile of the distribution of out-of-network billing rates was 28 percent and 15 percent of
hospitals have out-of-network rates of higher than 80 percent. This skewed distribution is evident
in 2011, 2013, and 2015 (see Appendix Figure 3).
5.2 Cross-Sectional Analysis of Hospitals’ Out-of-Network Billing Rates
17 Seventy-seven percent of individuals with an ED episode had insurance from an administrative services only
(ASO) insurance product and the balance had coverage from fully insured plans.

20
To assess the factors associated with the variation in hospitals’ out-of-network billing
rates, we follow the approach of Finkelstein et al. (2016) and run a least absolute shrinkage and
selection operator (Lasso) regression on a range of hospital, local area, physician market, and
hospital market characteristics (a complete list and descriptions of the variables that we include
in our first-stage Lasso are available in Appendix 1). We also include indicator variables for
whether or not EmCare and TeamHealth had contracts with hospitals. The Lasso method applies
a penalizing parameter to the coefficient of the explanatory variables included in the regression.
We use 10-fold cross-validation to choose the penalizing parameter that minimizes the mean
squared error. We use this Lasso procedure to select a set of variables that we include in a second
stage where we determine their correlation with hospital out-of-network billing rates.
Figure 2 presents our conditional correlations between the variables selected using the
Lasso regression and the share of patients per hospital that saw out-of-network physicians
between 2011 and 2015 during an emergency. We also included several variables, which were
not selected by the Lasso regression, but which our model indicates should be relevant. These
variables include a measure of physicians per capita, and hospital, physician, and insurer HHIs.18
The results in Figure 2 are correlates of hospital-level out-of-network billing rates and should not
be interpreted causally. However, several of the correlations are consistent with the equilibrium
described by our model.
As Figure 2 shows, the presence of EmCare at a hospital is positively correlated with the
hospital’s out-of-network billing rate. In contrast, outsourcing a hospital’s ED to TeamHealth is
negatively correlated with the hospital’s out-of-network billing rate. In addition, we find that
non-profit hospitals, teaching hospitals, and government-owned hospitals have lower rates of
out-of-network billing; for-profit hospitals have higher out-of-network billing rates. Larger
hospitals and hospitals with better technology have lower rates of out-of-network billing. The
share of total discharges funded by Medicare is positively correlated with out-of-network billing
18 We created a hospital HHI for each hospital registered with the AHA. For each hospital, we drew a circle with a
radius of 15 miles around the hospital. We calculated an HHI within that circular area where the total market was the
total number of hospital beds within that area and a firm’s market share was the firm’s share of total beds in that
area. We constructed insurer HHIs for each county using data from the HealthLeaders Insurance data. We defined
the total market as the covered lives in the small and large group markets. A firm’s market share was its share of the
total lives in that county in the small and large group markets. We used physician HHIs measured at the county
level, which we were graciously given by Loren Baker. The methods used to build these measures are described in
Baker et al. (2014). We construct measures of physician per capita using physician information from the SK&A
database and population data from the U.S. Census Bureau.
21
rates. Finally, we find that areas with a higher fraction of married adults and low inequality have
low out-of-network rates.
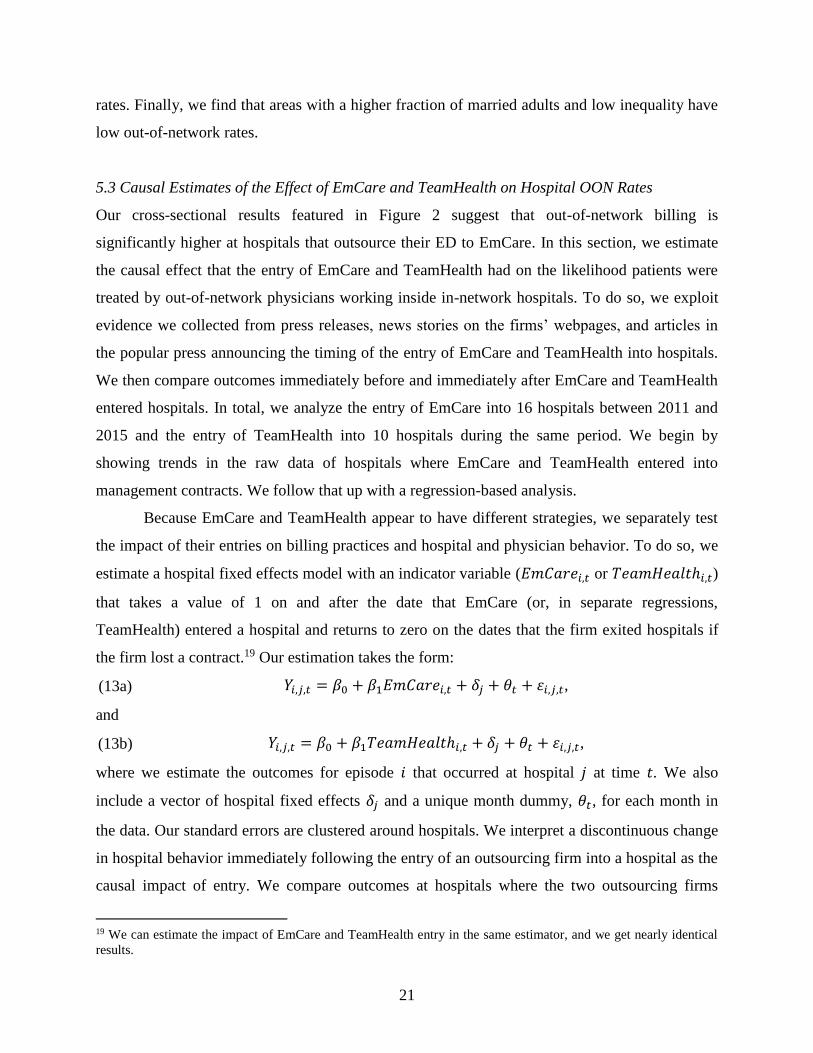
5.3 Causal Estimates of the Effect of EmCare and TeamHealth on Hospital OON Rates
Our cross-sectional results featured in Figure 2 suggest that out-of-network billing is
significantly higher at hospitals that outsource their ED to EmCare. In this section, we estimate
the causal effect that the entry of EmCare and TeamHealth had on the likelihood patients were
treated by out-of-network physicians working inside in-network hospitals. To do so, we exploit
evidence we collected from press releases, news stories on the firms’ webpages, and articles in
the popular press announcing the timing of the entry of EmCare and TeamHealth into hospitals.
We then compare outcomes immediately before and immediately after EmCare and TeamHealth
entered hospitals. In total, we analyze the entry of EmCare into 16 hospitals between 2011 and
2015 and the entry of TeamHealth into 10 hospitals during the same period. We begin by
showing trends in the raw data of hospitals where EmCare and TeamHealth entered into
management contracts. We follow that up with a regression-based analysis.
Because EmCare and TeamHealth appear to have different strategies, we separately test
the impact of their entries on billing practices and hospital and physician behavior. To do so, we
estimate a hospital fixed effects model with an indicator variable (𝐸𝑚𝐶𝑎𝑟𝑒𝑖,𝑡 or 𝑇𝑒𝑎𝑚𝐻𝑒𝑎𝑙𝑡ℎ𝑖,𝑡)
that takes a value of 1 on and after the date that EmCare (or, in separate regressions,
TeamHealth) entered a hospital and returns to zero on the dates that the firm exited hospitals if
the firm lost a contract.19 Our estimation takes the form:
(13a) 𝑌𝑖,𝑗,𝑡 = 𝛽0 + 𝛽1𝐸𝑚𝐶𝑎𝑟𝑒𝑖,𝑡 + 𝛿𝑗 + 𝜃𝑡 + 휀𝑖,𝑗,𝑡,
and
(13b) 𝑌𝑖,𝑗,𝑡 = 𝛽0 + 𝛽1𝑇𝑒𝑎𝑚𝐻𝑒𝑎𝑙𝑡ℎ𝑖,𝑡 + 𝛿𝑗 + 𝜃𝑡 + 휀𝑖,𝑗,𝑡,
where we estimate the outcomes for episode 𝑖 that occurred at hospital 𝑗 at time 𝑡. We also
include a vector of hospital fixed effects 𝛿𝑗 and a unique month dummy, 𝜃𝑡, for each month in
the data. Our standard errors are clustered around hospitals. We interpret a discontinuous change
in hospital behavior immediately following the entry of an outsourcing firm into a hospital as the
causal impact of entry. We compare outcomes at hospitals where the two outsourcing firms
19 We can estimate the impact of EmCare and TeamHealth entry in the same estimator, and we get nearly identical
results.

22
entered to outcomes at three sets of control hospitals: 1) all hospitals nationally that did not have
EDs managed by EmCare or TeamHealth, 2) hospitals drawn from the same states where the
hospitals that experienced entry were located but did not outsource their ED services to EmCare
or TeamHealth, and 3) hospitals that were not managed by EmCare or TeamHealth that we
matched to entry hospitals using propensity scores.20 One obvious concern with our
identification strategy is that treated and untreated hospitals may have differences in their trends
in out-of-network billing rates, physician pricing, or hospital behavior prior to the entry of
EmCare or TeamHealth. However, as we illustrate, when we plot the raw data from our treated
hospitals, there do not appear to be any changes in behavior prior to the entry of those firms.
EmCare enters two types of hospitals (Appendix Figure 4A). The first group of hospitals
has out-of-network rates over 97 percent. The second group has out-of-network rates below 10.1
percent. In Figure 3, we present a smoothed average using a local polynomial regression of the
monthly hospital-level out-of-network ED physician billing rates from one year before EmCare
(Panel A) and TeamHealth (Panel B) entered a hospital until one year after entry. In Panel A of
Figure 3, the raw data show a clear increase in out-of-network billing rates at hospitals
immediately after EmCare entered. For interested readers we present the raw, quarterly average
out-of-network rates by hospital at each of the 16 hospitals that EmCare entered in Appendix
Figure 5.21 None of these graphs show marked changes in out-of-network billing rates before
EmCare entered a hospital.
We repeat this analysis using regression analysis Equation (13a) and report the results in
Table 2. The indicator variable on entry identifies the causal impact that the entry of EmCare had
on the prevalence of out-of-network billing. In Column (1) of Table 2, we focus on changes in
out-of-network billing rates at hospitals that EmCare entered that previously had high out-of-
network billing rates. After EmCare entered, there is no statistically significant change in the
20 To calculate propensity scores, we ran a logistic regression separately for EmCare and TeamHealth where the
dependent variable was an indicator variable that took a value of 1 if one of the national ED staffing companies took
over management of the hospital’s ED. We regressed that against hospital beds, technology, the square and cubic
forms of beds and technology, and non-profit/for-profit status. The predicted values from this regression produce a
propensity score for a hospital. We then use a propensity score match to determine hospitals most similar to those
with entry, with the condition that matching hospitals must be in the same state. 21 For nearly all hospitals that had previously high out-of-network billing rates (Panels I, J, K, L, M, N, O, and P of
Appendix Figure 5), when EmCare entered, out-of-network billing rates remained high. In contrast, after EmCare
entered hospitals that previously had low out-of-network billing rates, the likelihood a patient was treated by an out-
of-network physician increased to nearly 100% immediately after EmCare entered the hospital (Panels A, B, C, D,
E, F, G, H, of Appendix Figure 5).

23
likelihood a patient was treated by an out-of-network physician. In Column (2), we estimate the
impact of the entry of EmCare into hospitals with previously low out-of-network rates (the half
of hospitals where the firm entered with OON rates below 10.1 percent). These results mirror
what we observe in the raw data. We observe that the entry of EmCare into these hospitals raised
out-of-network rates by 81.5 percentage points.22 In Appendix Table 3, we show that these
results are robust to using alternative control groups.
TeamHealth appears to pursue a different out-of-network strategy. The raw data from
Panel B of Figure 3 shows that out-of-network billing rates increased immediately after the firm
took over management of hospital EDs. However, four months after entry and the spike in out-
of-network billing, there was a noticeable drop in out-of-network billing rates. These changes are
visible in the raw data, presented hospital by hospital in Appendix Figure 6. In Column (3) of
Table 2, we again use an entry regression to identify the effect of TeamHealth entry on hospitals’
out-of-network billing. We find that after TeamHealth entered a hospital, there was an increase
in out-of-network billing of 32.6 percentage points. This is a qualitatively large increase,
although it is still approximately half the size of the out-of-network entry effect that we observed
for EmCare. As we illustrate in Appendix Table 3, this estimate is robust to using alternative
control groups.
5.4. The Impact of Out-of-Network Strategies on Payment Rates
These results suggest that EmCare does not negotiate with insurers and instead utilizes its outside
option and bills its charges. In Panel A of Figure 4, we show that immediately after entry,
EmCare raised its charges significantly. In Column (1) of Table 3, we quantify these changes and
show that after EmCare entered, it increased its physician charges, on average, by $556.84 (96
percent). This increase in charges was driven, in part, by a 14.8 percentage point (43 percent)
increase in the rate that physicians working for the firm billed patients for ED services using the
highest-intensity CPT code (Column (7) in Table 3). This increase in the use of high severity
coding occurred immediately after the firm entered (Panel G of Figure 4). It is unlikely that
hospitals would have experienced a sharp and immediate change in their mix of patients
immediately after EmCare entered that would have precipitated such a large change in coding
22 This result is robust to estimating Equation (13a) using logistic regression.

24
practice.23 Indeed, as we discuss and illustrate in Panels A and B of Appendix Figure 7, there
were no immediate and observable changes in the case mix of patients at hospitals after EmCare
entered. We have further discussion of the impact of the entry of physician management
companies on hospitals’ casemix in Section 5.7
As we predicted in Section 4.4, this increase in out-of-network billing and physician
charges generated large increases in revenue for EmCare physicians. Likewise, it also exposed
patients to increased cost sharing and financial risk. Our data contributor paid most of
physicians’ out-of-network bills. As a result, after EmCare entered, we observe that the insurer
payments to ED physicians increased by $402.67 (122 percent). Because patients typically have
out-of-pocket costs that are set via co-insurance that pays a fixed percentage of the total cost of
care, patient payments (e.g. cost-sharing payments) to ED physicians increased by $45.23 (83
percent). Collectively, we observe that the total payments to ED physicians increased by $447.90
after EmCare entered a hospital. This is a 117 percent increase in ED physician payments.
Notably, these changes occurred immediately after EmCare entered a hospital (Figure 4).
While our data contributor covered most of physicians’ out-of-network charges, we still
observe a difference between EmCare physicians’ charges and the total payments the firm
received from the insurer and patients. We classify the difference between physician charges and
their total payments as the potential balanced bill patients could face. In our data, we observe that
patients’ potential balanced bills were, on average, $195.30. We estimate that after EmCare
entered a hospital, the potential balanced bill patients faced increased by $108.94 (56 percent).
Note that these are lower-bound estimates of the impact of EmCare entry on patients’ out-of-
pocket costs. In many instances, patients who are treated by out-of-network physicians are liable
for the entirety of their physicians’ charges, since insurers will not cover out-of-network care.
We show in Table 3 that average physician charges were $578.95 across our sample and they
nearly doubled, increasing by $556.84 after EmCare entered a hospital. As a result, a patient
whose insurer did not cover out-of-network physician care would face a bill from EmCare
physicians of, on average, $1,135.79 (= $556.84 + $578.95). Given that nearly half of individuals
in the US do not have the liquidity to pay an unexpected $400.00 expense without taking on
debt, bills of this magnitude can be financially devastating to a large share of the population
(Board of the Governors of the Federal Reserve System 2016).
23 As we illustrate in Appendix Table 4 and 5, these results are robust when we use alternative control groups.

25
That TeamHealth exits networks and then rejoins them suggests that the firm exercises
the threat of exit to credibly negotiate higher in-network payment rates. Consistent with theory,
in Panels B and C of Figure 5, we observe an increase in the in-network and out-of-network
payments to TeamHealth from insurers after the firm enters a hospital. In Column (1) of Table 4,
we do not observe a precisely estimated increase in charges by physicians after TeamHealth
entered a hospital. However, we observe that insurer payments for in-network physician care
increased by $236.56 (90 percent) after the firm entered. We also observe a $21.85 (39 percent)
increase in patient cost-sharing paid to physicians after TeamHealth entered. While this is a large
increase in physician payments, the increase is approximately 60 percent of the size of the gain
in physician payments experienced by physicians after EmCare entered a hospital.24
In Section 4.4, we posited that having the ability to go out-of-network without seeing a
reduction in the number of patients they treat gave ED physicians a stronger outside option in
negotiations with insurers. We argued that this stronger outside option would allow them to
negotiate higher in-network payments. In Table 5, we show the average in-network payments in
our data made to internists for performing standard office visits and orthopedists for performing
hip replacement. We observe that, on average, internists are paid 158 percent of Medicare rates
(Column (2)) and orthopedists are paid 178 percent of Medicare rates (Column (1)). In contrast,
the average in-network ED physician in our data is paid 266 percent of Medicare rates (Column
(3)). We posited that firms that credibly threaten to go out-of-network could negotiate higher
payments. Indeed, we observe that TeamHealth, who appears to go out-of-network and then
rejoin the insurer’s network, earn on average, 364 percent of Medicare rates (Column (4)).
Likewise, we observe that the average payment in our data to EmCare ED physicians (who, for
the most part, do not participate in networks) is 536 percent of Medicare rates (Column (5)).25
5.5 Transfers to Hospitals To Permit Out-of-Network Billing
We posited that when physicians bill out-of-network, it creates costs for the hospital where they
work. In Section 4.3, we hypothesized that physician management firms that used out-of-
network billing as a strategy would have to offer transfers to hospitals to offset these costs. These
costs could take the form of direct payments or reductions in subsidies (which we cannot
24 As we illustrate in Appendix Tables 6 and 7, these results are robust to using other control groups. 25 Appendix Table 8 provides detailed summary statistics of ED physicians’ prices and charges.
26
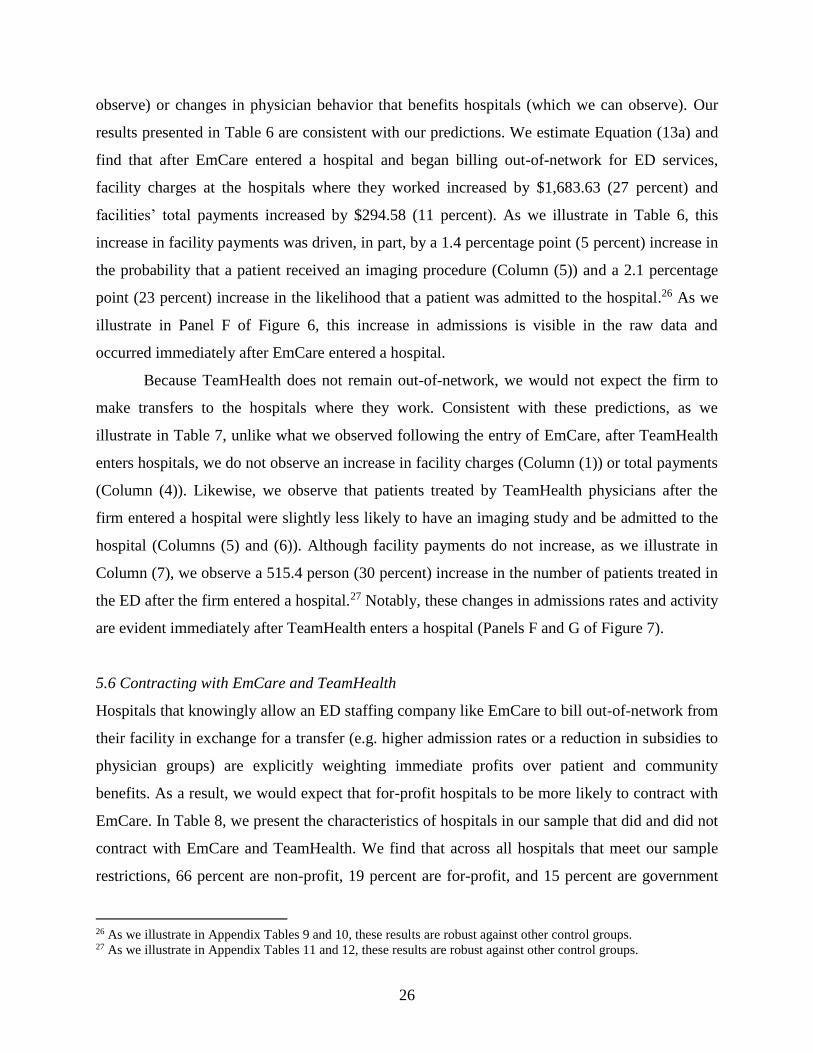
observe) or changes in physician behavior that benefits hospitals (which we can observe). Our
results presented in Table 6 are consistent with our predictions. We estimate Equation (13a) and
find that after EmCare entered a hospital and began billing out-of-network for ED services,
facility charges at the hospitals where they worked increased by $1,683.63 (27 percent) and
facilities’ total payments increased by $294.58 (11 percent). As we illustrate in Table 6, this
increase in facility payments was driven, in part, by a 1.4 percentage point (5 percent) increase in
the probability that a patient received an imaging procedure (Column (5)) and a 2.1 percentage
point (23 percent) increase in the likelihood that a patient was admitted to the hospital.26 As we
illustrate in Panel F of Figure 6, this increase in admissions is visible in the raw data and
occurred immediately after EmCare entered a hospital.
Because TeamHealth does not remain out-of-network, we would not expect the firm to
make transfers to the hospitals where they work. Consistent with these predictions, as we
illustrate in Table 7, unlike what we observed following the entry of EmCare, after TeamHealth
enters hospitals, we do not observe an increase in facility charges (Column (1)) or total payments
(Column (4)). Likewise, we observe that patients treated by TeamHealth physicians after the
firm entered a hospital were slightly less likely to have an imaging study and be admitted to the
hospital (Columns (5) and (6)). Although facility payments do not increase, as we illustrate in
Column (7), we observe a 515.4 person (30 percent) increase in the number of patients treated in
the ED after the firm entered a hospital.27 Notably, these changes in admissions rates and activity
are evident immediately after TeamHealth enters a hospital (Panels F and G of Figure 7).
5.6 Contracting with EmCare and TeamHealth
Hospitals that knowingly allow an ED staffing company like EmCare to bill out-of-network from
their facility in exchange for a transfer (e.g. higher admission rates or a reduction in subsidies to
physician groups) are explicitly weighting immediate profits over patient and community
benefits. As a result, we would expect that for-profit hospitals to be more likely to contract with
EmCare. In Table 8, we present the characteristics of hospitals in our sample that did and did not
contract with EmCare and TeamHealth. We find that across all hospitals that meet our sample
restrictions, 66 percent are non-profit, 19 percent are for-profit, and 15 percent are government
26 As we illustrate in Appendix Tables 9 and 10, these results are robust against other control groups. 27 As we illustrate in Appendix Tables 11 and 12, these results are robust against other control groups.

27
owned. Consistent with our predictions, 56 percent of hospitals where EmCare has a contract are
for-profit. Hospitals in areas with lower numbers of physicians per capita are also more likely to
contract with EmCare. In contrast, whereas TeamHealth has a higher share of for-profit hospitals
than we observe across the universe of hospitals in our data, the majority of TeamHealth
contracts occur at non-profit hospitals.28
5.7 Robustness Checks
It is possible that the entry of EmCare and TeamHealth led to subsequent changes in the case
mix of patients that the hospitals treat. Indeed, both EmCare and TeamHealth advertise that a
benefit of their service is to shorten ED waiting times (Cantlupe 2013). With shorter waiting
times, hospitals could potentially attract healthier patients who would have otherwise received
treatment at urgent care centers. Likewise, on EmCare’s webpage, EmCare has highlighted its
excellence in improving the treatment of complex cases, such as stroke care (EmCare 2014). To
the extent that this improves a hospital’s reputation, advertising and improvements in quality
could allow that hospital to attract more complex patients. Any changes in the case mix of
hospitals EmCare entered could explain why, after the firm entered hospitals, the rates of
hospital admissions, the rates of imaging tests, and the rates at which physicians coded for the
most intensive services increased.
In Appendix Table 15, we analyze the impact that the entry of EmCare and TeamHealth
had on the case mix of patients that hospitals treat. We find evidence that after EmCare entered a
hospital, the hospital attracted a sicker mix of patients. In Columns 1 and 2, we show that after
EmCare entered a hospital, the six-month historical spending of the hospital’s patients increased
by $916.02 (15 percent) and the 12-month historical spending increased by $1,306.16 (11
percent). We also find that after the entry of EmCare into a hospital, the patients who attend the
ED were 3.3 percentage points more likely to have a non-zero Charlson comorbidity score
measured using six months of patient history and 3.6 percent more likely to have a non-zero
Charlson comorbidity score measured using 12 months of patient history. In contrast, following
the entry of TeamHealth, hospitals attracted seemingly healthier patients who spent $336.35 (5.4
28 In Appendix Table 13, we present conditional correlates of whether a hospital is managed by either EmCare or
TeamHealth using logistic regression. These results are qualitatively similar to the above. As we show in Appendix
Table 14, hospitals that contract with EmCare or TeamHealth before 2011 have similar characteristics to hospitals
where we observe the entry of EmCare or TeamHealth between 2011 and 2014.

28
percent) less in the six months preceding an episode and $783.08 (6.8 percent) less in the 12
months preceding an episode. In Appendix Figure 7, we show the average Charlson co-morbidity
score and six-month historical spending levels of patients, by month, at hospitals where EmCare
and TeamHealth entered. There is no evidence of immediate changes in these outcomes after a
change in management.
Crucially, however, we find the same discrete changes in hospital and physician activity
appearing across all health severity groups of patients, including patients in the least severe
group. In Appendix Table 16, we estimate Equation (13a) using several different sample
restrictions and sets of controls for the health of the patients. We focus on the impact that the
entry of EmCare had on the frequency that physicians code using the CPT code for the most
intensive emergency. We find that even among patients with low historical spending and no
comorbidities, there was a substantial increase in the rate they had episodes that included
physician claims coded using the highest intensity CPT code. In Column 1, we estimate Equation
(13a) with no patient controls; in Column 2, we re-estimate Equation (13a) controlling for
patients’ age, sex, and race; and in Column 3, we control for patients’ age, sex, race, and their
Charlson comorbidity score. Across all three estimates, the point estimate on the impact of entry
on the rate of using the highest-intensity CPT code for emergency physician visits is consistent
and ranges from 0.148 to 0.151. In Column 4, we estimate Equation (13a) and limit our analysis
to patients throughout our sample who have a Charlson comorbidity score of 0 (e.g., patients
who have no comorbidities). In Column 5, we estimate Equation (13a) and limit our analysis to
patients throughout our data who have a non-zero Charlson score. The point estimates in
Columns 4 and 5 illustrate that whether or not they had comorbidities, patients were almost
equally more likely to have physician visits coded using the CPT code for the most intensive
emergency after EmCare entered a hospital. Likewise, in Columns 6, 7, and 8, we estimate
Equation (13a) on the samples of patients in the lower third ($0 to $279.67), the middle-third
($279.68 to $2,033.59), and the top-third ($2,033.60 to $115,499.30) of the distribution of
historical six-month patient health spending. Across all three sub-samples, the entry of EmCare
led to an increase in the rate patients had physician claims coded using the CPT code for the
most severe emergency.
In Appendix Table 17, we repeat this analysis and examine the impact of the entry of
EmCare on facility spending across different samples of the data. We see that there was

29
increased facility spending across patients with and without comorbidities and with high and low
historical spending. Likewise, controlling for patients’ comorbidities does little to alter the
impact of the entry of EmCare on facility spending. In Appendix Table 18, we see similarly
robust findings for imaging studies. After the entry of EmCare into a hospital, patients with no
comorbidities are 4.9 percent more likely to receive an imaging study.
Finally, in Appendix Table 19, we analyze whether we observe higher hospital admission
rates for patients with low historical spending and no comorbidities following the entry of
EmCare. In Column 4, we find that after EmCare entered a hospital, patients with no
comorbidities were 20 percent more likely to be admitted to the hospital. In Column 6, we find
patients with low historical spending (e.g., less than $279.67 in the previous six months) were 17
percent more likely to be admitted to the hospital after EmCare took over the management of the
hospital ED.
5.8 Generalizability of Our Data
Our data come from a single insurer that operates across all fifty states. Our data capture nearly
$28 billion in economic activity, so it constitutes an interesting sample to study regardless of
generalizability. However, to gauge the generalizability of our results, we compare the mean out-
of-network rates we observe to the mean out-of-network rates presented in Garmon and Chartock
(2017) (the only other study that examines out-of-network rates nationally).29 Garmon and
Chartock (2017) use 2007 to 2014 data from the Truven Health MarketScan database. They
focus on whether patients at in-network hospitals saw any out-of-network physicians. This is
slightly different from our measure; we focus on the network participation of the primary
physician on ED cases at in-network hospitals. Garmon and Chartock (2017) find that emergency
cases that had an admission had out-of-network bills in one in five cases; outpatient emergency
cases had out-of-network bills in 14 percent of cases. These results are fairly similar to our
descriptive finding concerning the average prevalence of out-of-network billing. Likewise,
Garmon and Chartock (2017) present a map of the variation in out-of-network billing rates
across states. Their results are similar to the national variation Cooper and Scott Morton (2016)
observed using a sample of the data used in this analysis.
29 Cooper and Scott Morton (2016) is a national study, but it uses the same data used in this analysis.
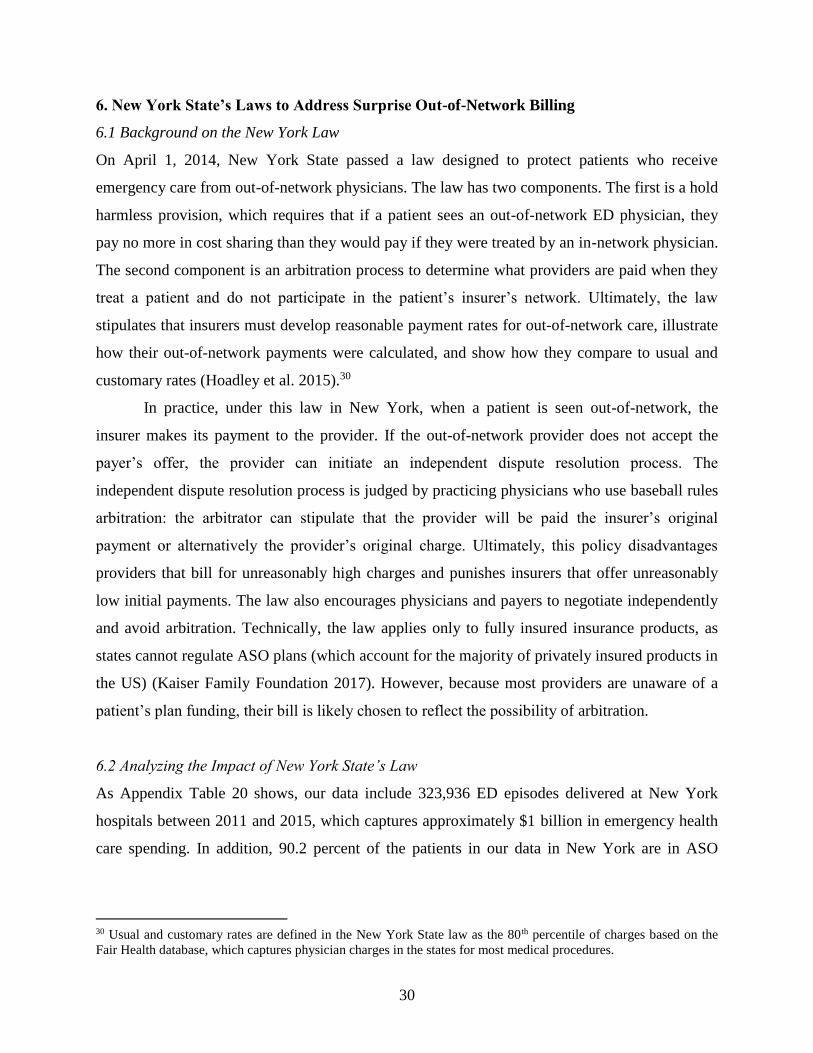
30
6. New York State’s Laws to Address Surprise Out-of-Network Billing
6.1 Background on the New York Law
On April 1, 2014, New York State passed a law designed to protect patients who receive
emergency care from out-of-network physicians. The law has two components. The first is a hold
harmless provision, which requires that if a patient sees an out-of-network ED physician, they
pay no more in cost sharing than they would pay if they were treated by an in-network physician.
The second component is an arbitration process to determine what providers are paid when they
treat a patient and do not participate in the patient’s insurer’s network. Ultimately, the law
stipulates that insurers must develop reasonable payment rates for out-of-network care, illustrate
how their out-of-network payments were calculated, and show how they compare to usual and
customary rates (Hoadley et al. 2015).30
In practice, under this law in New York, when a patient is seen out-of-network, the
insurer makes its payment to the provider. If the out-of-network provider does not accept the
payer’s offer, the provider can initiate an independent dispute resolution process. The
independent dispute resolution process is judged by practicing physicians who use baseball rules
arbitration: the arbitrator can stipulate that the provider will be paid the insurer’s original
payment or alternatively the provider’s original charge. Ultimately, this policy disadvantages
providers that bill for unreasonably high charges and punishes insurers that offer unreasonably
low initial payments. The law also encourages physicians and payers to negotiate independently
and avoid arbitration. Technically, the law applies only to fully insured insurance products, as
states cannot regulate ASO plans (which account for the majority of privately insured products in
the US) (Kaiser Family Foundation 2017). However, because most providers are unaware of a
patient’s plan funding, their bill is likely chosen to reflect the possibility of arbitration.
6.2 Analyzing the Impact of New York State’s Law
As Appendix Table 20 shows, our data include 323,936 ED episodes delivered at New York
hospitals between 2011 and 2015, which captures approximately $1 billion in emergency health
care spending. In addition, 90.2 percent of the patients in our data in New York are in ASO
30 Usual and customary rates are defined in the New York State law as the 80th percentile of charges based on the
Fair Health database, which captures physician charges in the states for most medical procedures.
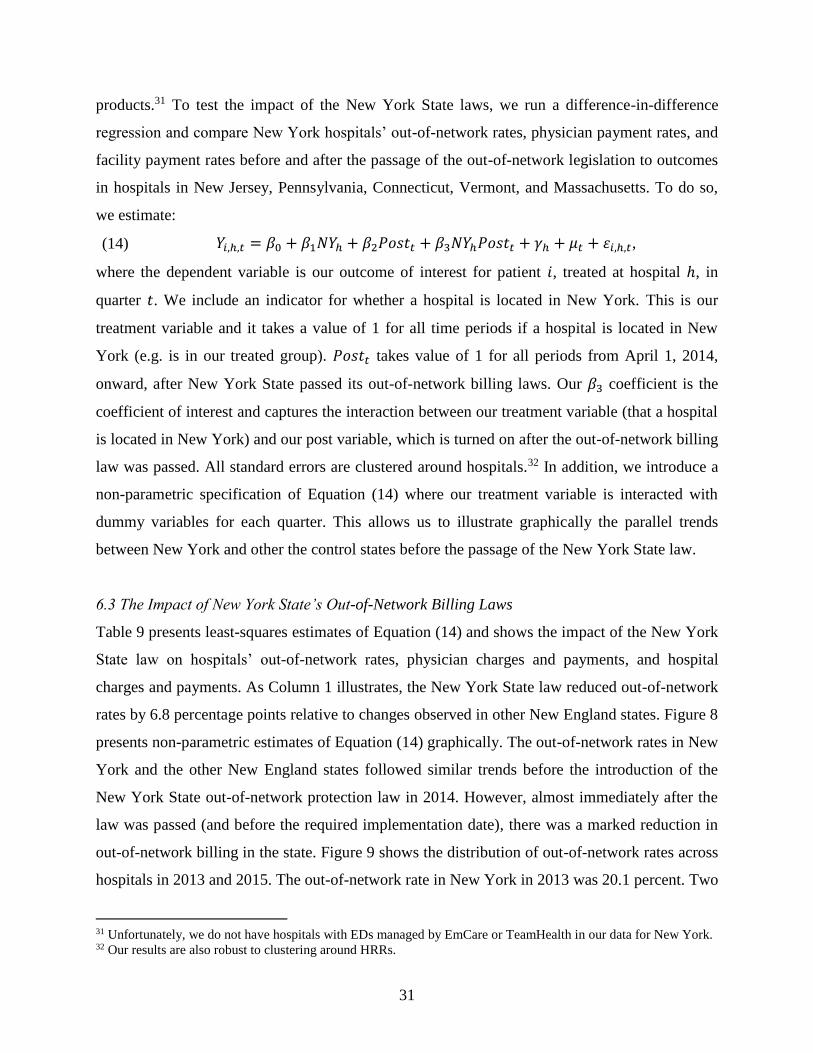
31
products.31 To test the impact of the New York State laws, we run a difference-in-difference
regression and compare New York hospitals’ out-of-network rates, physician payment rates, and
facility payment rates before and after the passage of the out-of-network legislation to outcomes
in hospitals in New Jersey, Pennsylvania, Connecticut, Vermont, and Massachusetts. To do so,
we estimate:
(14) 𝑌𝑖,ℎ,𝑡 = 𝛽0 + 𝛽1𝑁𝑌ℎ + 𝛽2𝑃𝑜𝑠𝑡𝑡 + 𝛽3𝑁𝑌ℎ𝑃𝑜𝑠𝑡𝑡 + 𝛾ℎ + 𝜇𝑡 + 휀𝑖,ℎ,𝑡,
where the dependent variable is our outcome of interest for patient 𝑖, treated at hospital ℎ, in
quarter 𝑡. We include an indicator for whether a hospital is located in New York. This is our
treatment variable and it takes a value of 1 for all time periods if a hospital is located in New
York (e.g. is in our treated group). 𝑃𝑜𝑠𝑡𝑡 takes value of 1 for all periods from April 1, 2014,
onward, after New York State passed its out-of-network billing laws. Our 𝛽3 coefficient is the
coefficient of interest and captures the interaction between our treatment variable (that a hospital
is located in New York) and our post variable, which is turned on after the out-of-network billing
law was passed. All standard errors are clustered around hospitals.32 In addition, we introduce a
non-parametric specification of Equation (14) where our treatment variable is interacted with
dummy variables for each quarter. This allows us to illustrate graphically the parallel trends
between New York and other the control states before the passage of the New York State law.
6.3 The Impact of New York State’s Out-of-Network Billing Laws
Table 9 presents least-squares estimates of Equation (14) and shows the impact of the New York
State law on hospitals’ out-of-network rates, physician charges and payments, and hospital
charges and payments. As Column 1 illustrates, the New York State law reduced out-of-network
rates by 6.8 percentage points relative to changes observed in other New England states. Figure 8
presents non-parametric estimates of Equation (14) graphically. The out-of-network rates in New
York and the other New England states followed similar trends before the introduction of the
New York State out-of-network protection law in 2014. However, almost immediately after the
law was passed (and before the required implementation date), there was a marked reduction in
out-of-network billing in the state. Figure 9 shows the distribution of out-of-network rates across
hospitals in 2013 and 2015. The out-of-network rate in New York in 2013 was 20.1 percent. Two
31 Unfortunately, we do not have hospitals with EDs managed by EmCare or TeamHealth in our data for New York. 32 Our results are also robust to clustering around HRRs.

32
years later, the rate was 6.4 percent, and the reduction in out-of-network rates was driven by
reductions in out-of-network rates across nearly all hospitals, including those that previously had
high rates of out-of-network billing.
Columns 6 and 7 in Table 9 show that although the law applied only to fully insured
insurance products, the reduction in out-of-network rates occurred for patients with fully insured
insurance plans and those covered by ASO policies. If physicians cannot infer whether a patient
has an ASO or fully insured insurance product before sending a bill, they will want to charge a
moderate amount in order to win in any arbitration. Columns 2 through 5 in Table 9 illustrate the
impact of the law on physician charges and payments and facility charges and payments. As we
illustrate in Column 3, the law lowered average physician payments by $43.74 (13 percent). We
do not find that the law had a precisely estimated impact on facility payments.
7. A Policy to Address Out-of-Network Billing: Regulating Hospital/Insurer Contracts
Out-of-network ED bills arise from a very specific market failure. Unlike most doctors, ED
physicians are not chosen and cannot be avoided by patients. As a result, ED physicians can
move out-of-network without reducing the quantity of patients they treat. This, in turn,
significantly reduces the pressure ED physicians face to negotiate prices with insurers. Without a
negotiated reimbursement rate in a contract between insurers and physicians, physicians bill their
charges which has the harmful effects documented above. In addition, having the ability to go
out-of-network raises the disagreement payoff of the physicians which allows them to raise their
negotiated in-network rates.
At present, about a quarter of states have laws aimed at addressing out-of-network
billing. Most states’ surprise billing laws include a hold harmless provision to protect patients
from financial risks (e.g., these laws stipulate that patients cannot be charged more than their
usual in-network cost sharing during emergencies). The harder problem for the state is choosing
the “missing” price when there is no contract between physicians and insurers. To do this, most
states’ laws set out-of-network provider payment rates via regulation as the greatest of either a
fixed percentage of Medicare payment rates or usual and customary payment rates, which are
themselves set as a fixed percentage of average charges. However, it is extremely unlikely that a
regulated price of this sort will match the market price for any given insurer–physician pair in a
particular year. As soon as the regulated price set by states differs from the market price, either
33
the insurer or the physician will take advantage of a regulated price that favors them (e.g.,
insurers will cease to build networks or physicians will cease to join networks).
Alternatively, states could require arbitration between physicians and insurers to settle
out-of-network bills as New York does. New York State’s laws are the most ambitious in the
nation to date, and our results suggest the law has been effective at lowering out-of-network
rates. However, the New York State law is administratively complex and potentially costly. If
patients receive a surprise out-of-network bill and are charged out-of-network rates, they must be
aware that the protections exist and fill out the form included in Appendix 2. Likewise, the state
has to fund and administer the arbitration process in perpetuity. Moreover, because states cannot
regulate ASO products, the New York protections only offer formal protection to individuals
covered by fully insured insurance products.
Going forward, policy-makers should have two objectives when they seek to address out-
of-network ED billing. The first is to protect consumers from large, unexpected bills. The second
is to establish an environment in which the price that insurers pay out-of-network physicians for
their services generates a price that is either competitively set or is as close to the competitively
set price as possible.
One might imagine the solution is to require physicians to participate in the same
insurance networks as the hospitals where they work. Although this strategy would protect
consumers from surprise bills by eliminating the possibility of attending an in-network hospital
and being treated by an out-of-network physician, it would give significant bargaining leverage
to insurers in their negotiations with physicians. Insurers would be aware that physicians would
be required by law to enter into a contract with them in order to be able to practice in a hospital;
this could allow insurers to drive down payment rates below what would occur in a competitive
equilibrium.
In our view, the best option for addressing out-of-network billing is not for the state to try
to regulate the missing price, but instead to regulate the form of the contract, so that the resulting
physician payment is generated by market forces. When patients choose an ED, they are
choosing a package of emergency services that includes the services of the hospital and
physicians. Under our preferred policy, states could require hospitals to sell, and insurers to
contract, for an ED service package that includes physician and facility services. Hospitals would
purchase the inputs for ED services the way they purchase other labor inputs, such as nursing

34
care and non-labor inputs, such as bandages and needles. All care provided in the ED would be
included when the hospital contracted to be “in-network” with an insurer. This type of policy
would require the hospital to buy ED physician services in a local labor market, which would
expose hospitals and physicians to competitive forces and produce a market price for ED
physician services. Hospitals would then submit a single bill to insurers.
With this type of policy in place, patients consuming emergency services would be
protected from surprise bills as long as the patients chose in-network facilities. More subtly, this
policy is also likely to lower the equilibrium prices for in-network ED physicians. At present, ED
physicians can opt to exit insurer networks without a loss of revenue – indeed, they likely see an
increase in revenue when they do so. This is a very strong outside option that increases
physicians’ bargaining leverage when they negotiate in-network payments. Thus, absent
intervention, in-network payments will tend to display the effects of out-of-network billing and
are likely to be above competitive levels.
This policy also solves the inability of states to regulate ASO products. Rather than
regulating insurance, this would be a form of hospital regulation. As a result, it would apply to
all patients in a state regardless of the type of insurance they have. Further, the law could be
implemented by a state or at the federal level. For example, the federal government could require
these combined physician/facility ED payments be a requirement for a hospital receiving
Medicare payments.
In what follows, we produce back-of-the-envelope calculations of the savings from our
policy. To do so, we compare ED physician payment rates to payment rates for orthopedic
surgeons. Orthopedic surgeons form an interesting comparison group because, according to a
recent survey, they have the highest salaries among physicians in the US (Grisham 2017).
However, whereas the average in-network ED physician payment was 266 percent of the
Medicare payment rates (and the average out-of-network payment was 637 percent of the
Medicare payment rates), within our data, the average in-network payments to orthopedic
surgeons for performing knee replacements during our sample period was 178 percent of the
Medicare payment rates. If we assumed our policy proposal would generate competition that
lowered ED physicians’ payment levels to approximate the payment rate of orthopedic surgeons
in our data (178 percent of the Medicare payment rates), this would lower total ED physician
spending by 46 percent. If we assume that private spending is one-third of total health spending

35
in the US and ED physicians are about 1 percent of total private spending, a reasonable back of
the envelope calculation would suggest that addressing this issue would produce savings in the
range of $5 billion annually.33
8. Conclusions
Each year, one in five people in the US visits an ED for medical care (Morganti et al., 2013).
What most patients with private health insurance do not realize is that the physicians working in
a hospital may not participate in the same insurance networks as the hospital itself. As a result, it
is possible for a privately insured patient to attend an in-network hospital but receive care from
an out-of-network physician. These out-of-network bills can expose patients to significant
financial risk. Moreover, when physicians and physician groups can bill out-of-network without
seeing a reduction in the number of patients they treat, it undercuts the functioning of health care
markets by changing the outside option physicians face when negotiating with insurers over their
prices.
In this paper, we find that approximately 15 percent of U.S. hospitals have extremely
high out-of-network billing rates. Moreover, we observe that two leading ED physician
outsourcing firms – EmCare and TeamHealth - use out-of-network billing to significantly raise
the amounts they are paid, although each utilize a distinct strategy. These two examples are
instructive in their differences and provide a nice illustration of the economics of bargaining.
We find that after EmCare takes over the management of ED services at a hospital, it
raises out-of-network billing rates by over 80 percentage points. This allows the firm to collect
higher payments from insurers and from patients. We calculate that the payments they received
from insurers increased by 122 percent and patient cost sharing increased by 83 percent.
Crucially, this increase in patient costs represents a lower bound of the cost exposure patients
could face when they are treated by an out-of-network ED physician. The insurer supplying our
data, in most instances, pays out-of-network physicians their charges. However, in practice,
many insurers either do not pay out-of-network physicians anything (leaving the patient to pay
their physicians themselves) or they only pay standard in-network rates (leaving patients to pay
the difference between the physician’s charges and the insurer’s payments).
33 These numbers are from Morganti et al. (2013) and Hartman et al. (2017).

36
When ED physicians bill out-of-network, it likely creates reputational harm for the in-
network hospitals where they work. We find evidence that EmCare offsets the costs of harm for
hospitals by providing transfers. Such transfers takes the form of EmCare-affiliated physicians
engaging in clinical behavior leading to increased hospital billing, such as increasing imaging
rates and rates patients are admitted to the hospital, which generate additional revenue for the
hospitals.
TeamHealth pursues a different strategy. When TeamHealth enters a hospital, they also
increase out-of-network rates significantly. However, after several months, TeamHealth returns
in-network. Notably, when TeamHealth goes back in-network, their in-network payment
amounts are 68 percent higher than they were before the firm entered the hospital. We posit that
TeamHealth uses its stronger outside option to negotiate higher in-network payments.
Interestingly, the number of patients seen in the TeamHealth ED increases, which may be a sign
of efficiencies.
Ultimately, this paper shows that outsourcing in emergency medicine per se is not the
problem. The problem is that emergency physicians working inside in-network hospitals face
inelastic demand. There are many healthcare markets that have pockets of inelastic demand,
which can be exploited by providers (for example, the demand for air ambulances in
emergencies or the demand for neonatologists following a premature baby delivery). Our
analysis shows that providers with less concern for patient welfare can take advantage of that
inelasticity and dramatically increase their prices.
What is the appropriate policy response to surprise out-of-network billing? A variety of
states have implemented different policies to protect consumers. One of the most innovative
policies was introduced in New York. In 2014, the state passed a law that banned balanced
billing and required insurers and physicians to enter into binding arbitration to settle disputed
bills. We assessed the impact of this law and found that it reduced out-of-network billing.
However, the law still bases out-of-network ED payments on physicians’ charges, which are not
competitively set, and its arbitration provision has high transaction costs. Additionally, the law
cannot formally protect individuals enrolled in ASO insurance products, who account for
approximately half of individuals with private insurance in the US.
The limits of the New York law have helped motivate our policy proposal to require
hospitals to sell an “ED package” to insurers that includes both physician and hospital services.

37
Thus far, most states have tried to address out-of-network billing by regulating the missing price
for emergency physician services. Ultimately, a regulated price will, in general, not be equal to a
market-determined price. We argue that mandating the right contract structure will generate
competitive prices, and thus generate higher welfare relative to regulated prices.
References:
Baker, Laurence C.; M. Kate Bundorf; Anne B. Royalty and Zachary Levin. 2014. "Physician
Practice Competition and Prices Paid by Private Insurers for Office Visits." JAMA,
312(16), 1653-62.
Barnett, Michael L.; Andrew R. Olenski and Anupam B. Jena. 2017. "Opioid-Prescribing
Patterns of Emergency Physicians and Risk of Long-Term Use." New England Journal of
Medicine, 376(7), 663-73.
Board of the Governors of the Federal Reserve System. 2016. "Report on the Economic Well-
Being of U.S. Households in 2015," Washington, DC: Federal Reserve Board, May 5.
https://www.federalreserve.gov/2015-report-economic-well-being-us-households-
201605.pdf, accessed February 2018.
Cantlupe, Joe. 2013. "Keys to Better Flow, Better Care in EDs." HealthLeaders. June 8.
http://www.healthleadersmedia.com/community-rural/4-keys-better-emergency-
department, accessed February 2018.
Chan, David C., Jr. 2015. "The Efficiency of Slacking Off: Evidence from the Emergency
Department." National Bureau of Economic Research Working Paper Series, No. 21002.
Charlson, Mary E.; Peter Pompei; Kathy L. Ales and C. Ronald MacKenzie. 1987. "A New
Method of Classifying Prognostic Comorbidity in Longitudinal Studies: Development
and Validation." Journal of Chronic Diseases, 40(5), 373-83.
Consumers Union. 2015. "Surprise Medical Bills Survey: 2015 Nationally-Representative Online
Survey," Washington, DC: Consumer Reports National Research Center, May 5.
http://consumersunion.org/wp-content/uploads/2015/05/CY-2015-SURPRISE-
MEDICAL-BILLS-SURVEY-REPORT-PUBLIC.pdf, accessed February 2018.
Cooper, Zack and Fiona Scott Morton. 2016. "Out-of-Network Emergency-Physician Bills—An
Unwelcome Surprise." New England Journal of Medicine, 375(20), 1915-8.
Dalavagas, Jason. 2014. "Coverage Initiation: Envision Healthcare Holdings." Educational
Articles.
http://www.valueline.com/Stocks/Highlights/Coverage_Initiation__Envision_Healthcare
_Holdings.aspx#.WRyVe_nyuUk, accessed February 2018.
Department of Financial Services. 2012. "An Unwelcome Surprise: How New Yorkers Are
Getting Stuck with Unexpected Medical Bills from Out-of-Network Providers," New
York, NY: New York State Department of Financial Services,
http://www.statecoverage.org/files/NY-Unexpected_Medical_Bills-march_7_2012.pdf,
accessed February 2018.
Department of Regulatory Agencies. 2010. "Report of the Commissioner of Insurance to the
Colorado General Assembly on §10-17-704(3), C.R.S. Consumer Protections Against
Balance Billing," Denver, CO: Colorado Department of Regulatory Agencies, January

38
21.
http://hermes.cde.state.co.us/drupal/islandora/object/co%3A8599/datastream/OBJ/view,
accessed February 2018.
DeRoma, Tris. 2012. "ER Transition Expected to be Smooth at LAMC." The Los Alamos
Monitor. July 26. http://www.lamonitor.com/content/er-transition-expected-be-smooth-
lamc, accessed February 2018.
Deutsche Bank. 2013. "Markets Research - Envision Healthcare."
EmCare. 2014. "Cross-Departmental Initiative Leads to Nationally Recognized Stroke Treatment
Program." https://www.emcare.com/resources/case-
studies/pdf/emcare6_casestudyholyoke.pdf, accessed February 2018.
Esposito, Lisa. 2015. "Enduring Really Long Waits at the Emergency Room: What Can You Do
When You're Last on the List?" U.S. News and World Report. May 8.
https://health.usnews.com/health-news/patient-advice/articles/2015/05/08/enduring-
really-long-waits-at-the-emergency-room, accessed February 2018.
Finkelstein, Amy; Matthew Gentzkow and Heidi Williams. 2016. "Sources of Geographic
Variation in Health Care: Evidence from Patient Migration." Quarterly Journal of
Economics, 131(4), 1681-726.
Garmon, Christopher and Benjamin Chartock. 2017. "One In Five Inpatient Emergency
Department Cases May Lead To Surprise Bills." Health Affairs, 36(1), 177-81.
Gooch, Kelly. 2016. "Texas Sees Dramatic Rise in Balanced Billing Complaints: 3 Things to
Know." Becker's Hospital Review. February 12.
https://www.beckershospitalreview.com/finance/texas-sees-dramatic-rise-in-balanced-
billing-complaints-3-things-to-know.html, accessed February 2018.
Grisham, Sarah. 2017. "Medscape Physician Compensation Report." Medscape Medical News.
April 5. https://www.medscape.com/slideshow/compensation-2017-overview-
6008547#4, accessed February 2018.
Groth, Heather; Hans House; Rachel Overton and Eric DeRoo. 2013. "Board-Certified
Emergency Physicians Comprise a Minority of the Emergency Department Workforce in
Iowa." Western Journal of Emergency Medicine, 14(2), 186-90.
Hamel, Liz; Mira Norton; Karen Pollitz; Larry Levitt; Gary Claxton and Mollyann Brodie. 2016.
"The Burden of Medical Debt: Results from the Kaiser Family Foundation/New York
Times Medical Bills Survey," The Henry J. Kaiser Family Foundation, January 5.
https://kaiserfamilyfoundation.files.wordpress.com/2016/01/8806-the-burden-of-medical-
debt-results-from-the-kaiser-family-foundation-new-york-times-medical-bills-survey.pdf,
accessed February 2018.
Hartman, Micah; Anne B. Martin; Nathan Espinosa; Aaron Catlin and Team The National
Health Expenditure Accounts. 2017. "National Health Care Spending In 2016: Spending
And Enrollment Growth Slow After Initial Coverage Expansions." Health Affairs, 37(1),
150-60.
Hing, Esther and Farida Bhuiya. 2012. "Wait Time for Treatment in Hospital Emergency
Departments: 2009," Hyattsville, MD: National Center for Health Statistics, August 1.
https://www.cdc.gov/nchs/data/databriefs/db102.pdf, accessed February 2018.
Hoadley, Jack; Sandy Ahn and Kevin Lucia. 2015. "Balance Billing: How Are States Protecting
Consumers from Unexpected Charges?," Washington, DC: The Center on Health
Insurance Reforms. Georgetown University Health Policy Institute, June 15.
39
https://www.rwjf.org/content/dam/farm/reports/issue_briefs/2015/rwjf420966, accessed
February 2018.
Hsia, Renee Y.; Arthur L. Kellermann and Yu-Chu Shen. 2011. "Factors Associated with
Closures of Emergency Departments in the United States." JAMA, 305(19), 1978-85.
Institute of Medicine. 2006. Hospital-Based Emergency Care: At the Breaking Point.
Washington, DC: The National Academies Press.
Kaiser Family Foundation. 2017. "Employer Health Benefits Annual Survey: 2017," Menlo
Park, CA: The Henry J. Kaiser Family Foundation. September 19.
http://files.kff.org/attachment/Report-Employer-Health-Benefits-Annual-Survey-2017,
accessed February 2018.
Kyanko, Kelly A.; Leslie A. Curry and Susan H. Busch. 2013. "Out-of-Network Physicians:
How Prevalent Are Involuntary Use and Cost Transparency?" Health Services Research,
48(3), 1154-72.
McGirr, Joseph; Janet M. Williams and John E. Prescott. 1998. "Physicians in Rural West
Virginia Emergency Departments: Residency Training and Board Certification Status."
Academic Emergency Medicine, 5(4), 333-6.
Morganti, Kristy G.; Sebastian Bauhoff; Janice C. Blanchard; Mahshid Abir; Neema Iyer;
Alexandria C. Smith; Joseph V. Vesely; Edward N. Okeke and Arthur L. Kellermann.
2013. "The Evolving Role of Emergency Departments in the United States," Santa
Monica, CA: RAND Health. RAND Corporation, June 16.
https://www.rand.org/pubs/research_reports/RR280.html, accessed February 2018.
Newhouse, Joseph P. 1970. "Toward a Theory of Nonprofit Institutions: An Economic Model of
a Hospital." American Economic Review, 60(1), 64-74.
Osborne, Martin J and Ariel Rubinstein. 1990. Bargaining and Markets. San Diego, CA:
Emerald Group Publishing Limited.
Pogue, Stacey and Megan Randall. 2014. "Surprise Medical Bills Take Advantage of Texans,"
Austin, TX: Center for Public Policy Priorities. September 15.
https://forabettertexas.org/images/HC_2014_09_PP_BalanceBilling.pdf, accessed
February 2018.
Rice, Sabriya. 2016. "Cutting Emergency Department Wait Times as Patient Volumes Rise."
Modern Healthcare. February 13.
http://www.modernhealthcare.com/article/20160213/MAGAZINE/302139996, accessed
February 2018.
Rosenthal, Elisabeth. 2014a. "After Surgery, $117,000 Bill For Doctor He Didn't Know." The
New York Times, September 21. https://www.nytimes.com/2014/09/21/us/drive-by-
doctoring-surprise-medical-bills.html, accessed February 2018.
____. 2014b. "Costs Can Go Up Fast When E.R. Is in Network But the Doctors Are Not." The
New York Times, September 29. https://www.nytimes.com/2014/09/29/us/costs-can-go-
up-fast-when-er-is-in-network-but-the-doctors-are-not.html, accessed February 2018.
Rui, P.; K. Kang and M. Albert. 2013. "National Hospital Ambulatory Medical Care Survey:
2013 Emergency Department Summary Tables," Washington, DC: Centers for Disease
Control and Prevention,
https://www.cdc.gov/nchs/data/ahcd/nhamcs_emergency/2013_ed_web_tables.pdf,
accessed February 2018.
Sanger-Katz, Margot and Reed Abelson. 2016. "Surprise! Insurance Paid the E.R. but Not the
Doctor." The New York Times. November 16.

40
https://www.nytimes.com/2016/11/17/upshot/first-comes-the-emergency-then-comes-the-
surprise-out-of-network-bill.html, accessed February 2018.
Schuur, Jeremiah and Arjun Venkatesh. 2012. "The Growing Role of Emergency Departments in
Hospital Admissions." New England Journal of Medicine, 367(5), 391-93.
TeamHealth. 2009. "TeamHealth Holdings, Inc. - Initial Public Offering."
Wadman, Michael C.; Robert L. Muelleman; David Hall; T. Paul Tran and Richard A. Walker.
2005. "Qualification Discrepancies Between Urban and Rural Emergency Department
Physicians." Journal of Emergency Medicine, 28(3), 273-6.
Wilson, Michael and David Cutler. 2014. "Emergency Department Profits Are Likely To
Continue As The Affordable Care Act Expands Coverage." Health Affairs, 33(5), 792-9.
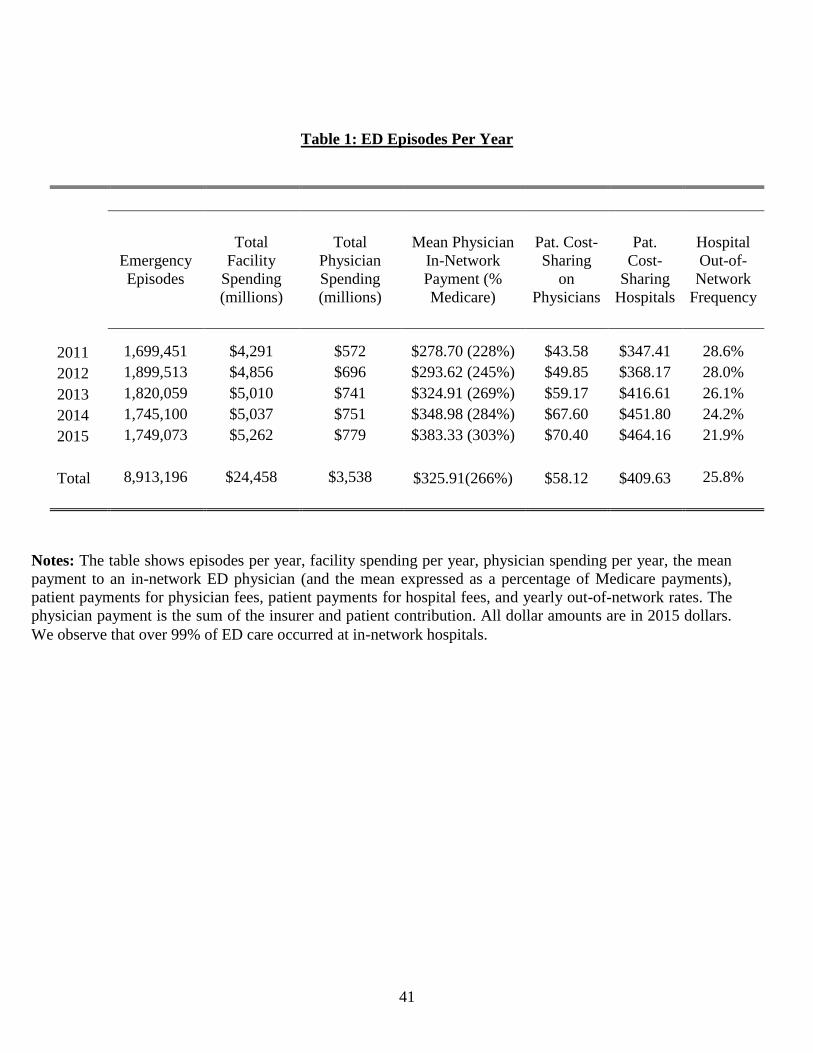
41
Table 1: ED Episodes Per Year
Emergency
Episodes
Total
Facility
Spending
(millions)
Total
Physician
Spending
(millions)
Mean Physician
In-Network
Payment (%
Medicare)
Pat. Cost-
Sharing
on
Physicians
Pat.
Cost-
Sharing
Hospitals
Hospital
Out-of-
Network
Frequency
2011 1,699,451 $4,291 $572 $278.70 (228%) $43.58 $347.41 28.6%
2012 1,899,513 $4,856 $696 $293.62 (245%) $49.85 $368.17 28.0%
2013 1,820,059 $5,010 $741 $324.91 (269%) $59.17 $416.61 26.1%
2014 1,745,100 $5,037 $751 $348.98 (284%) $67.60 $451.80 24.2%
2015 1,749,073 $5,262 $779 $383.33 (303%) $70.40 $464.16 21.9%
Total 8,913,196 $24,458 $3,538 $325.91(266%) $58.12 $409.63 25.8%
Notes: The table shows episodes per year, facility spending per year, physician spending per year, the mean
payment to an in-network ED physician (and the mean expressed as a percentage of Medicare payments),
patient payments for physician fees, patient payments for hospital fees, and yearly out-of-network rates. The
physician payment is the sum of the insurer and patient contribution. All dollar amounts are in 2015 dollars.
We observe that over 99% of ED care occurred at in-network hospitals.

42
Table 2: The Impact of EmCare and TeamHealth Entry on Hospitals’ Out-of-Network Rates
(1) (2)
(3)
Hospitals with
OON Rates Above
97% Prior to Entry
Hospitals with
OON Rates Below
97% Prior to Entry
All Hospitals
EmCare Entry TeamHealth Entry
OON Indicator
OON Indicator
Management Company Entry -0.030 0.815***
0.326***
(0.044) (0.061) (0.030)
Hospital FE Yes Yes
Yes
Month FE Yes Yes
Yes
Mean 0.209 0.204
0.226
SD 0.407 0.403
0.419
Observations 8,401,884 8,351,799
8,661,796
Control All Non-Entry
Hospitals
All Non-Entry
Hospitals
All Non-Entry
Hospitals
Notes: * p<0.10, ** p<0.05, *** p<0.01. This table presents least-squares estimates of Equations
(13a) and (13b). In Column (1), we focus on hospitals that EmCare entered that had out-of-network
rates prior to entry that were above 97%. In Column (2), we focus on hospitals that had out-of-network
rates prior to entry below 97% (in practice, all hospitals with out-of-network rates below 97% had out-
of-network rates below 11%). In Column (3), we focus on the sample of all hospitals where
TeamHealth entered. The dependent variable in all regressions is a binary indicator for whether a
patient at an in-network hospital was treated by an out-of-network physician. Our analysis is run at the
patient-level. The control groups are all hospitals in the US that did not outsource their ED
management to EmCare or TeamHealth. Each regression includes controls for patient age, gender,
race, and Charlson score. Standard errors are clustered around hospitals. Mean and standard deviation
are drawn from the analytic sample population underlying the regression. In Appendix Table 3, we
show these estimates using alternative control groups.
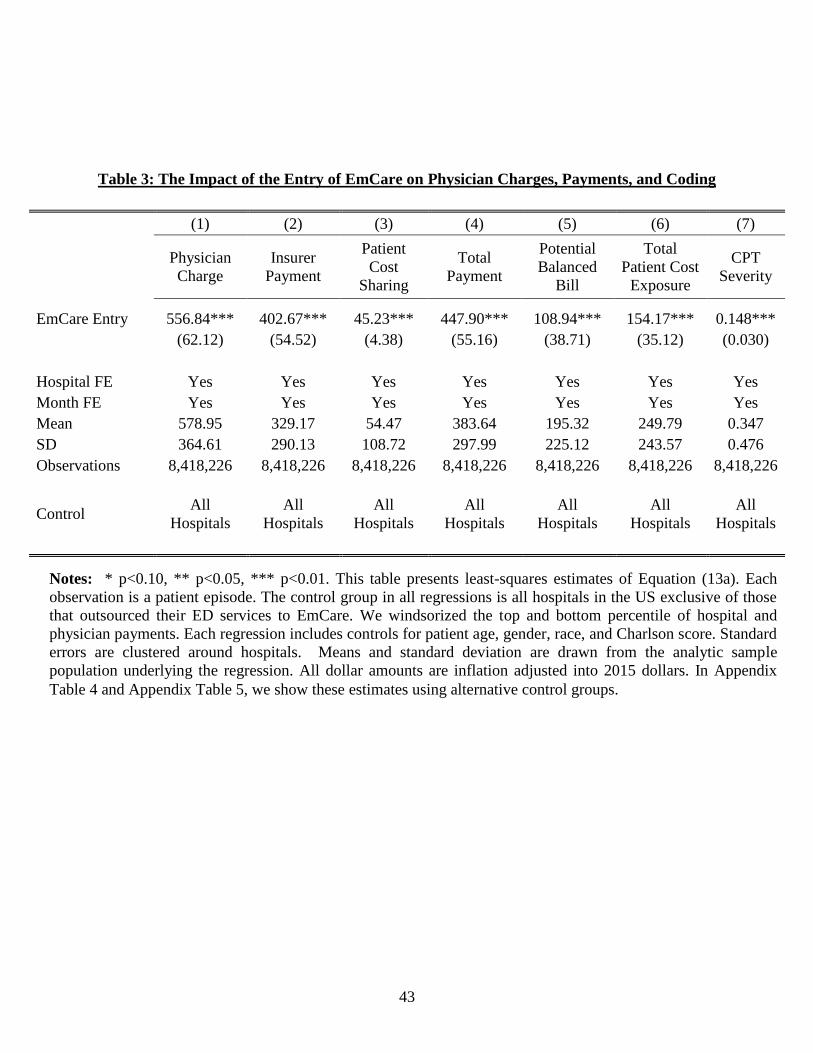
43
Table 3: The Impact of the Entry of EmCare on Physician Charges, Payments, and Coding
(1) (2) (3) (4) (5) (6) (7)
Physician
Charge
Insurer
Payment
Patient
Cost
Sharing
Total
Payment
Potential
Balanced
Bill
Total
Patient Cost
Exposure
CPT
Severity
EmCare Entry 556.84*** 402.67*** 45.23*** 447.90*** 108.94*** 154.17*** 0.148***
(62.12) (54.52) (4.38) (55.16) (38.71) (35.12) (0.030)
Hospital FE Yes Yes Yes Yes Yes Yes Yes
Month FE Yes Yes Yes Yes Yes Yes Yes
Mean 578.95 329.17 54.47 383.64 195.32 249.79 0.347
SD 364.61 290.13 108.72 297.99 225.12 243.57 0.476
Observations 8,418,226 8,418,226 8,418,226 8,418,226 8,418,226 8,418,226 8,418,226
Control
All
Hospitals
All
Hospitals
All
Hospitals
All
Hospitals
All
Hospitals
All
Hospitals
All
Hospitals
Notes: * p<0.10, ** p<0.05, *** p<0.01. This table presents least-squares estimates of Equation (13a). Each
observation is a patient episode. The control group in all regressions is all hospitals in the US exclusive of those
that outsourced their ED services to EmCare. We windsorized the top and bottom percentile of hospital and
physician payments. Each regression includes controls for patient age, gender, race, and Charlson score. Standard
errors are clustered around hospitals. Means and standard deviation are drawn from the analytic sample
population underlying the regression. All dollar amounts are inflation adjusted into 2015 dollars. In Appendix
Table 4 and Appendix Table 5, we show these estimates using alternative control groups.
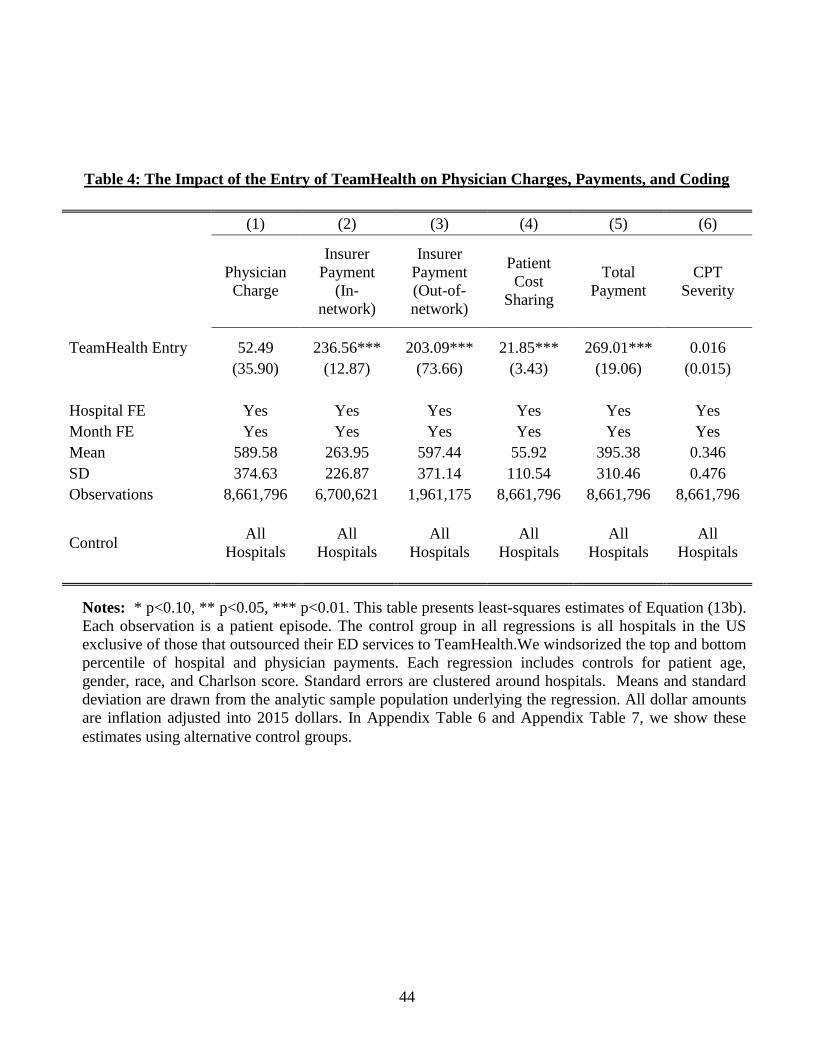
44
Table 4: The Impact of the Entry of TeamHealth on Physician Charges, Payments, and Coding
(1) (2) (3) (4) (5) (6)
Physician
Charge
Insurer
Payment
(In-
network)
Insurer
Payment
(Out-of-
network)
Patient
Cost
Sharing
Total
Payment
CPT
Severity
TeamHealth Entry 52.49 236.56*** 203.09*** 21.85*** 269.01*** 0.016
(35.90) (12.87) (73.66) (3.43) (19.06) (0.015)
Hospital FE Yes Yes Yes Yes Yes Yes
Month FE Yes Yes Yes Yes Yes Yes
Mean 589.58 263.95 597.44 55.92 395.38 0.346
SD 374.63 226.87 371.14 110.54 310.46 0.476
Observations 8,661,796 6,700,621 1,961,175 8,661,796 8,661,796 8,661,796
Control
All
Hospitals
All
Hospitals
All
Hospitals
All
Hospitals
All
Hospitals
All
Hospitals
Notes: * p<0.10, ** p<0.05, *** p<0.01. This table presents least-squares estimates of Equation (13b).
Each observation is a patient episode. The control group in all regressions is all hospitals in the US
exclusive of those that outsourced their ED services to TeamHealth.We windsorized the top and bottom
percentile of hospital and physician payments. Each regression includes controls for patient age,
gender, race, and Charlson score. Standard errors are clustered around hospitals. Means and standard
deviation are drawn from the analytic sample population underlying the regression. All dollar amounts
are inflation adjusted into 2015 dollars. In Appendix Table 6 and Appendix Table 7, we show these
estimates using alternative control groups.
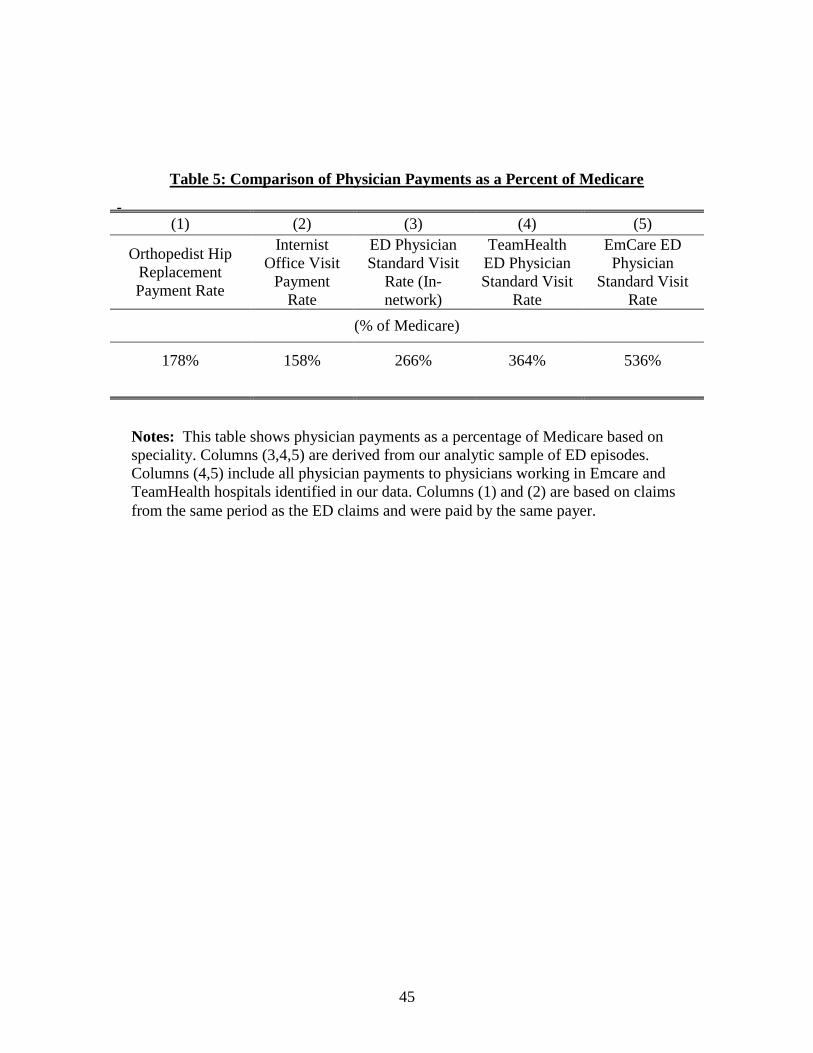
45
Table 5: Comparison of Physician Payments as a Percent of Medicare
(1) (2) (3) (4) (5)
Orthopedist Hip
Replacement
Payment Rate
Internist
Office Visit
Payment
Rate
ED Physician
Standard Visit
Rate (In-
network)
TeamHealth
ED Physician
Standard Visit
Rate
EmCare ED
Physician
Standard Visit
Rate
(% of Medicare)
178% 158% 266% 364% 536%
Notes: This table shows physician payments as a percentage of Medicare based on
speciality. Columns (3,4,5) are derived from our analytic sample of ED episodes.
Columns (4,5) include all physician payments to physicians working in Emcare and
TeamHealth hospitals identified in our data. Columns (1) and (2) are based on claims
from the same period as the ED claims and were paid by the same payer.
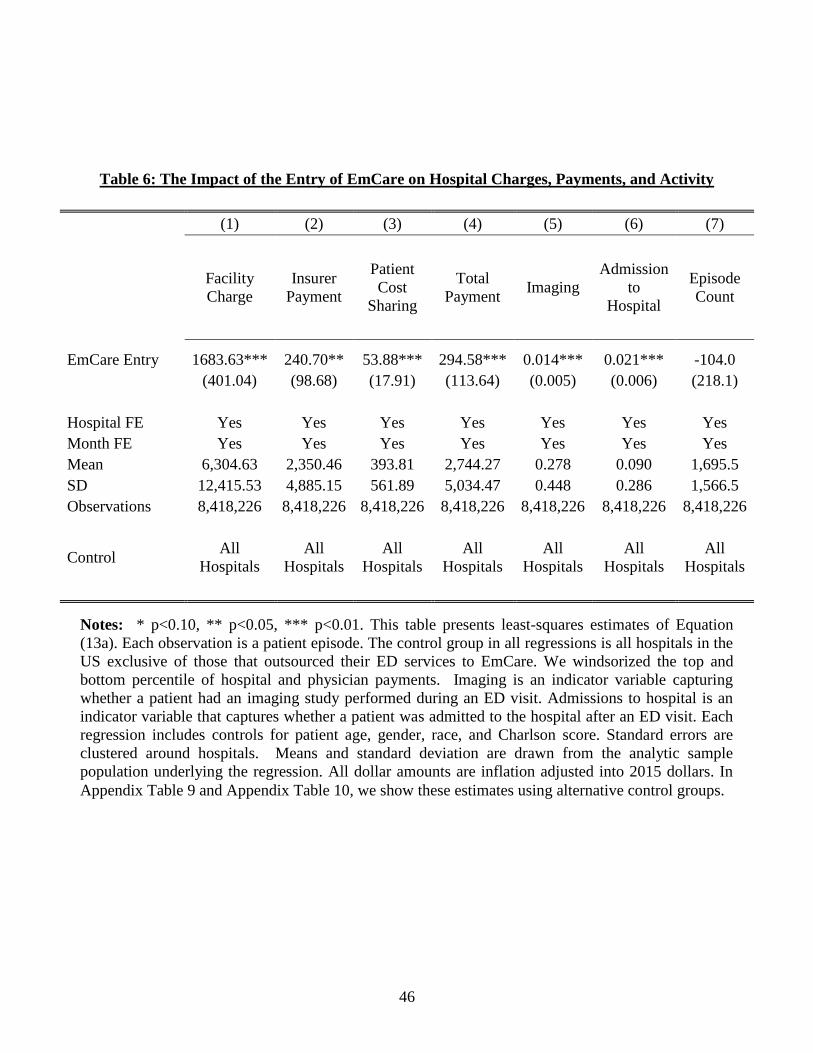
46
Table 6: The Impact of the Entry of EmCare on Hospital Charges, Payments, and Activity
(1) (2) (3) (4) (5) (6) (7)
Facility
Charge
Insurer
Payment
Patient
Cost
Sharing
Total
Payment Imaging
Admission
to
Hospital
Episode
Count
EmCare Entry 1683.63*** 240.70** 53.88*** 294.58*** 0.014*** 0.021*** -104.0
(401.04) (98.68) (17.91) (113.64) (0.005) (0.006) (218.1)
Hospital FE Yes Yes Yes Yes Yes Yes Yes
Month FE Yes Yes Yes Yes Yes Yes Yes
Mean 6,304.63 2,350.46 393.81 2,744.27 0.278 0.090 1,695.5
SD 12,415.53 4,885.15 561.89 5,034.47 0.448 0.286 1,566.5
Observations 8,418,226 8,418,226 8,418,226 8,418,226 8,418,226 8,418,226 8,418,226
Control
All
Hospitals
All
Hospitals
All
Hospitals
All
Hospitals
All
Hospitals
All
Hospitals
All
Hospitals
Notes: * p<0.10, ** p<0.05, *** p<0.01. This table presents least-squares estimates of Equation
(13a). Each observation is a patient episode. The control group in all regressions is all hospitals in the
US exclusive of those that outsourced their ED services to EmCare. We windsorized the top and
bottom percentile of hospital and physician payments. Imaging is an indicator variable capturing
whether a patient had an imaging study performed during an ED visit. Admissions to hospital is an
indicator variable that captures whether a patient was admitted to the hospital after an ED visit. Each
regression includes controls for patient age, gender, race, and Charlson score. Standard errors are
clustered around hospitals. Means and standard deviation are drawn from the analytic sample
population underlying the regression. All dollar amounts are inflation adjusted into 2015 dollars. In
Appendix Table 9 and Appendix Table 10, we show these estimates using alternative control groups.

47
Table 7: The Impact of the Entry of TeamHealth on Hospital Charges, Payments, and Activity
(1) (2) (3) (4) (5) (6) (7)
Facility
Charge
Insurer
Payment
Patient
Cost
Sharing
Total
Payment Imaging
Admission
to
Hospital
Episode
Count
TeamHealth Entry 170.17 -76.61 24.42** -52.19 -0.008** -0.006** 515.4***
(174.03) (76.82) (12.41) (82.70) (0.003) (0.002) (182.8)
Hospital FE Yes Yes Yes Yes Yes Yes Yes
Month FE Yes Yes Yes Yes Yes Yes Yes
Mean 6,400.68 2,355.70 394.19 2,749.89 0.279 0.091 1,692.1
SD 12,555.33 4,891.99 561.51 5,041.25 0.448 0.287 1,557.4
Observations 8,661,796 8,661,796 8,661,796 8,661,796 8,661,796 8,661,796 8,661,796
Control
All
Hospitals
All
Hospitals
All
Hospitals
All
Hospitals
All
Hospitals
All
Hospitals
All
Hospitals
Notes: * p<0.10, ** p<0.05, *** p<0.01. This table presents least-squares estimates of Equation
(13b). Each observation is a patient episode. The control group in all regressions is all hospitals in the
US exclusive of those that outsourced their ED services to TeamHealth. We windsorized the top and
bottom percentile of hospital and physician payments. Imaging is an indicator variable capturing
whether a patient had an imaging study performed during an ED visit. Admissions to hospital is an
indicator variable that captures whether a patient was admitted to the hospital after an ED visit. Each
regression includes controls for patient age, gender, race, and Charlson score. Standard errors are
clustered around hospitals. Means and standard deviation are drawn from the analytic sample
population underlying the regression. All dollar amounts are inflation adjusted into 2015 dollars. In
Appendix Table 11 and Appendix Table 12, we show these estimates using alternative control groups.
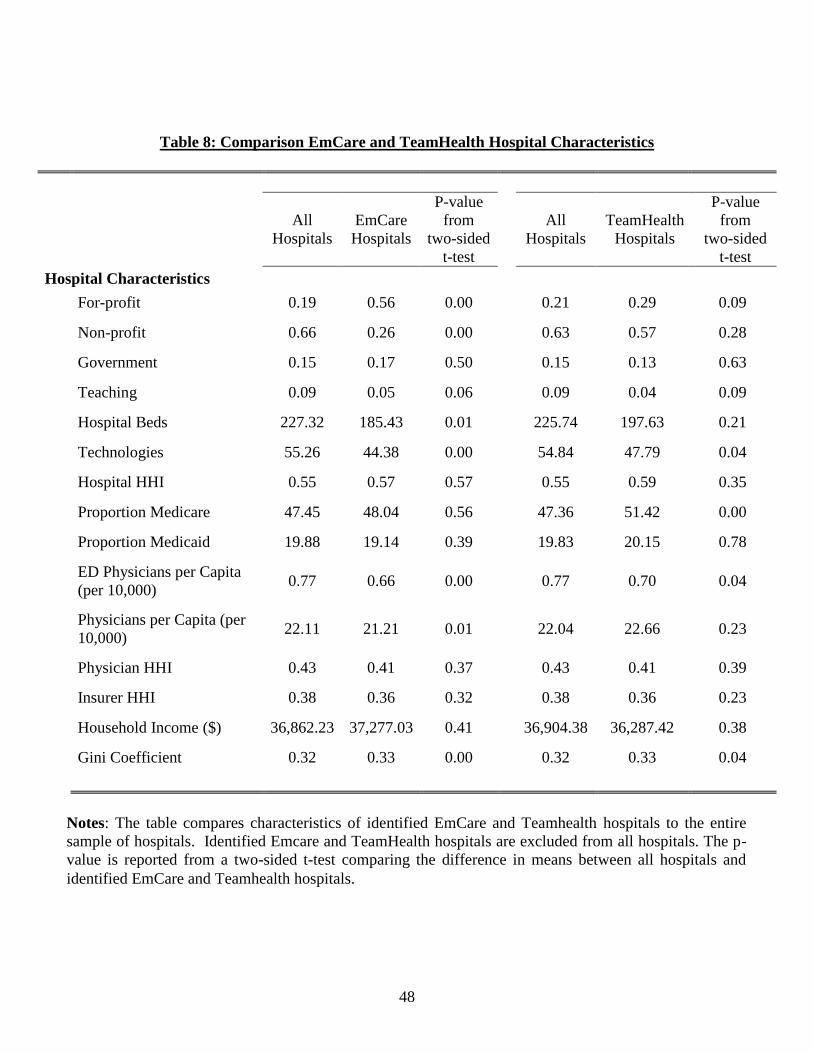
48
Table 8: Comparison EmCare and TeamHealth Hospital Characteristics
All
Hospitals
EmCare
Hospitals
P-value
from
two-sided
t-test
All
Hospitals
TeamHealth
Hospitals
P-value
from
two-sided
t-test
Hospital Characteristics
For-profit 0.19 0.56 0.00
0.21 0.29 0.09
Non-profit 0.66 0.26 0.00
0.63 0.57 0.28
Government 0.15 0.17 0.50
0.15 0.13 0.63
Teaching 0.09 0.05 0.06
0.09 0.04 0.09
Hospital Beds 227.32 185.43 0.01
225.74 197.63 0.21
Technologies 55.26 44.38 0.00
54.84 47.79 0.04
Hospital HHI 0.55 0.57 0.57
0.55 0.59 0.35
Proportion Medicare 47.45 48.04 0.56
47.36 51.42 0.00
Proportion Medicaid 19.88 19.14 0.39
19.83 20.15 0.78
ED Physicians per Capita
(per 10,000) 0.77 0.66 0.00
0.77 0.70 0.04
Physicians per Capita (per
10,000) 22.11 21.21 0.01
22.04 22.66 0.23
Physician HHI 0.43 0.41 0.37
0.43 0.41 0.39
Insurer HHI 0.38 0.36 0.32
0.38 0.36 0.23
Household Income ($) 36,862.23 37,277.03 0.41
36,904.38 36,287.42 0.38
Gini Coefficient 0.32 0.33 0.00
0.32 0.33 0.04
Notes: The table compares characteristics of identified EmCare and Teamhealth hospitals to the entire
sample of hospitals. Identified Emcare and TeamHealth hospitals are excluded from all hospitals. The p-
value is reported from a two-sided t-test comparing the difference in means between all hospitals and
identified EmCare and Teamhealth hospitals.
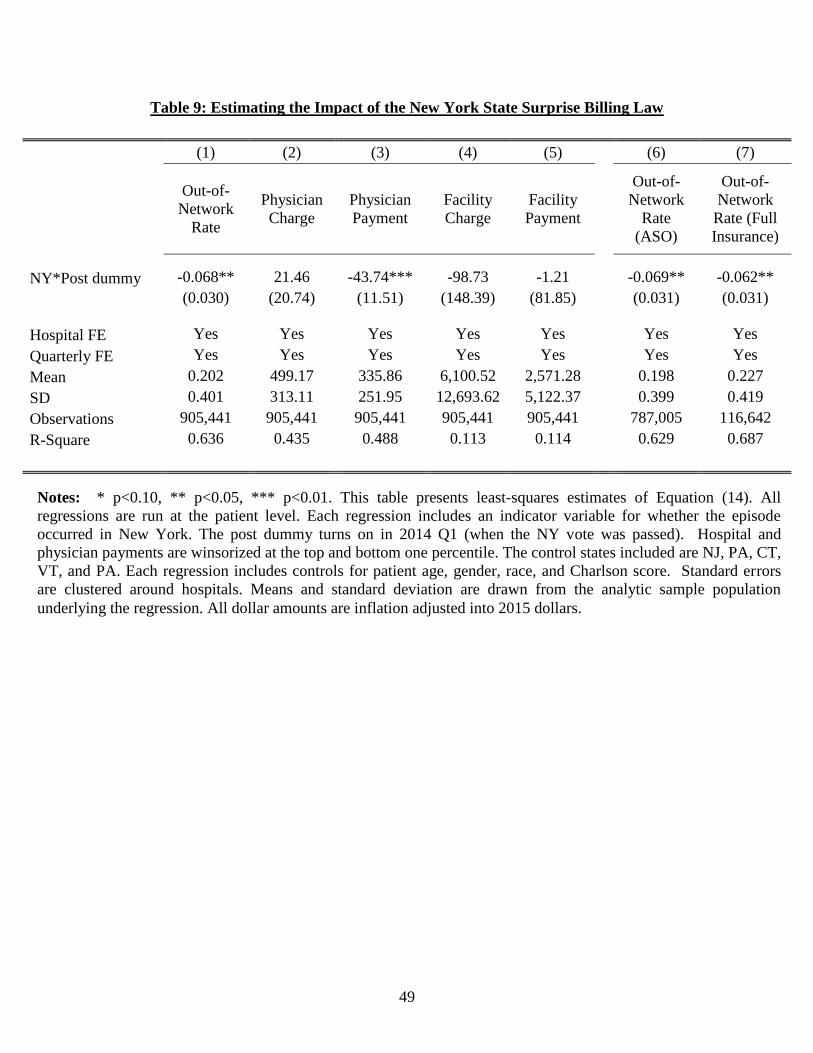
49
Table 9: Estimating the Impact of the New York State Surprise Billing Law
(1) (2) (3) (4) (5)
(6) (7)
Out-of-
Network
Rate
Physician
Charge
Physician
Payment
Facility
Charge
Facility
Payment
Out-of-
Network
Rate
(ASO)
Out-of-
Network
Rate (Full
Insurance)
NY*Post dummy -0.068** 21.46 -43.74*** -98.73 -1.21
-0.069** -0.062**
(0.030) (20.74) (11.51) (148.39) (81.85)
(0.031) (0.031)
Hospital FE Yes Yes Yes Yes Yes
Yes Yes
Quarterly FE Yes Yes Yes Yes Yes
Yes Yes
Mean 0.202 499.17 335.86 6,100.52 2,571.28
0.198 0.227
SD 0.401 313.11 251.95 12,693.62 5,122.37
0.399 0.419
Observations 905,441 905,441 905,441 905,441 905,441
787,005 116,642
R-Square 0.636 0.435 0.488 0.113 0.114
0.629 0.687
Notes: * p<0.10, ** p<0.05, *** p<0.01. This table presents least-squares estimates of Equation (14). All
regressions are run at the patient level. Each regression includes an indicator variable for whether the episode
occurred in New York. The post dummy turns on in 2014 Q1 (when the NY vote was passed). Hospital and
physician payments are winsorized at the top and bottom one percentile. The control states included are NJ, PA, CT,
VT, and PA. Each regression includes controls for patient age, gender, race, and Charlson score. Standard errors
are clustered around hospitals. Means and standard deviation are drawn from the analytic sample population
underlying the regression. All dollar amounts are inflation adjusted into 2015 dollars.

50
Figure 1: The Distribution of Hospital Out-of-Network Billing Rates in 2015
10th
Perc.
25th
Perc.
50th
Perc.
75th
Perc.
90th
Perc.
Out-of-Network Rate 0 0 0.011 0.278 0.990
Notes: The figure shows the distribution of ED physicians out-of-network rates across hospitals
in 2015.
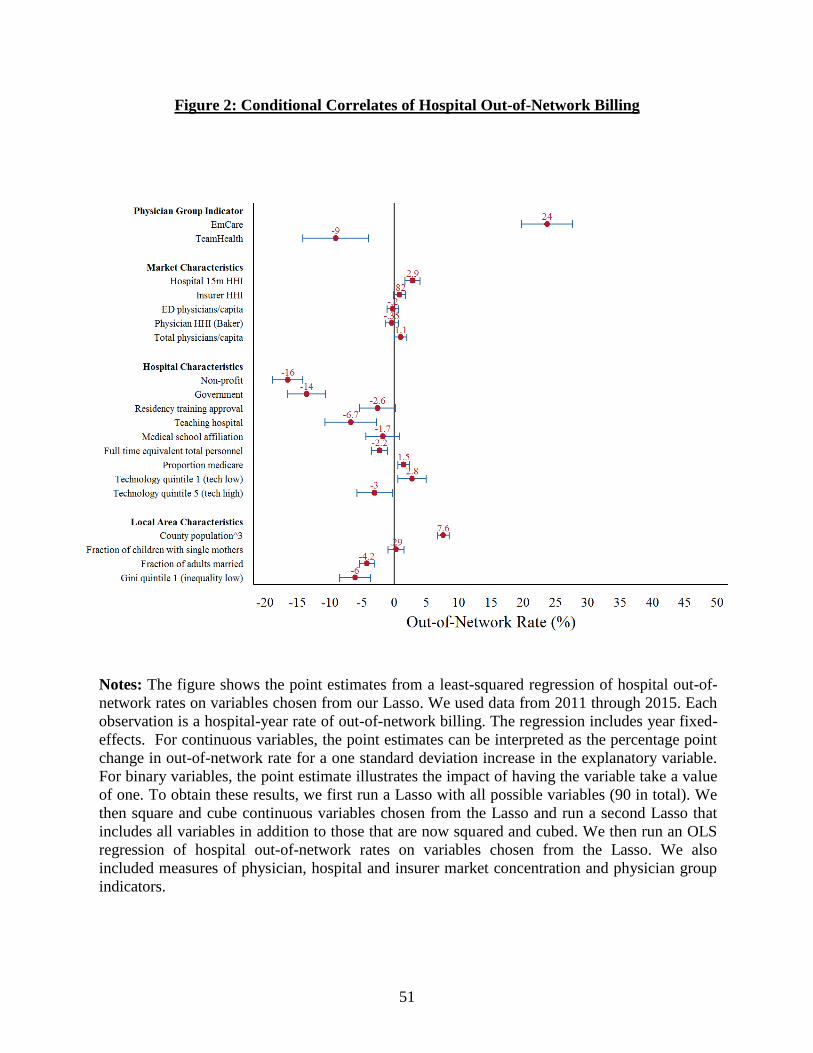
51
Figure 2: Conditional Correlates of Hospital Out-of-Network Billing
Notes: The figure shows the point estimates from a least-squared regression of hospital out-of-
network rates on variables chosen from our Lasso. We used data from 2011 through 2015. Each
observation is a hospital-year rate of out-of-network billing. The regression includes year fixed-
effects. For continuous variables, the point estimates can be interpreted as the percentage point
change in out-of-network rate for a one standard deviation increase in the explanatory variable.
For binary variables, the point estimate illustrates the impact of having the variable take a value
of one. To obtain these results, we first run a Lasso with all possible variables (90 in total). We
then square and cube continuous variables chosen from the Lasso and run a second Lasso that
includes all variables in addition to those that are now squared and cubed. We then run an OLS
regression of hospital out-of-network rates on variables chosen from the Lasso. We also
included measures of physician, hospital and insurer market concentration and physician group
indicators.

52
Figure 3: Discontinuity Analysis of Out-of-Network Rates at Hospitals Where EmCare and
TeamHealth Took Over Management of ED Services
Notes: The panels plot the monthly average by hospital from 12 months before to 12 months
after EmCare or TeamHealth entered the hospital. For Panel A, we limit our analysis to
hospitals with out-of-network rates below 97% in 2011.

53
Figure 4: Discontinuity Analysis of Physician Billing at Hospitals Where EmCare Took
Over Management of ED Services

54
Notes: The panels plot the monthly average by hospital from 12 months before to 12 months
after EmCare entered the hospital.
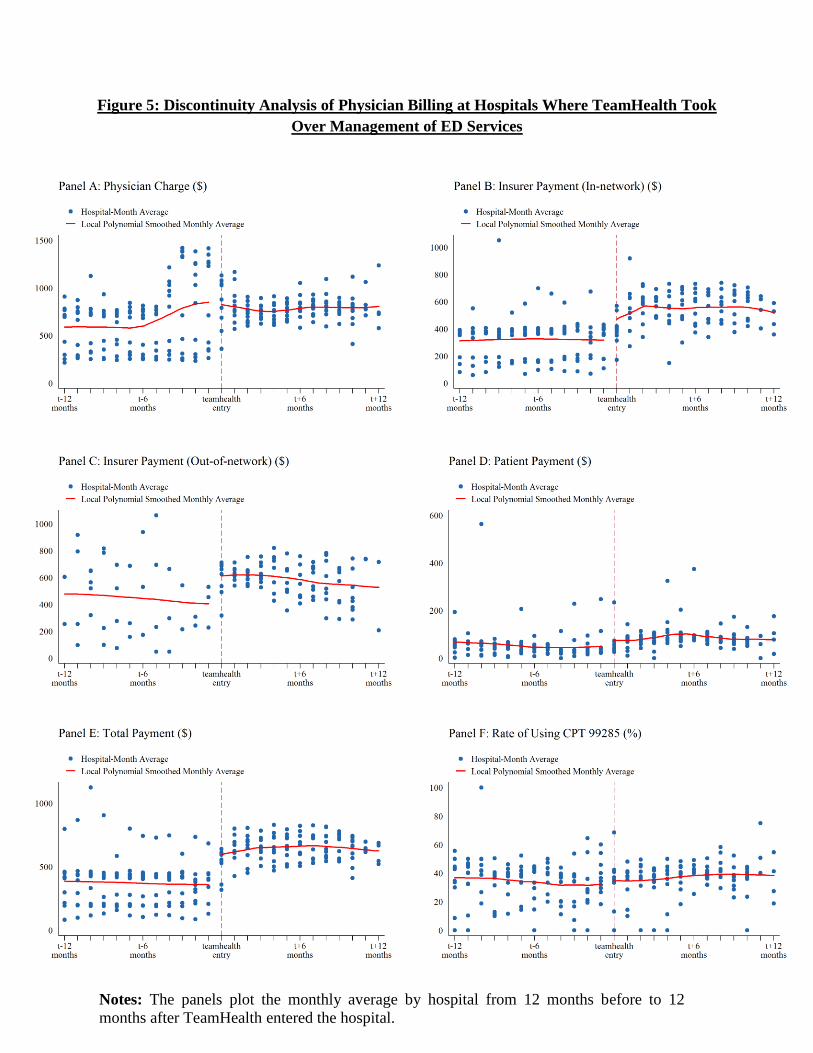
55
Figure 5: Discontinuity Analysis of Physician Billing at Hospitals Where TeamHealth Took
Over Management of ED Services
Notes: The panels plot the monthly average by hospital from 12 months before to 12
months after TeamHealth entered the hospital.

56
Figure 6: Discontinuity Analysis of Hospital Activity at Hospitals Where EmCare Took
Over Management of ED Services

57
Notes: The panels plot the monthly average by hospital from 12 months before to 12 months
after EmCare entered the hospital.
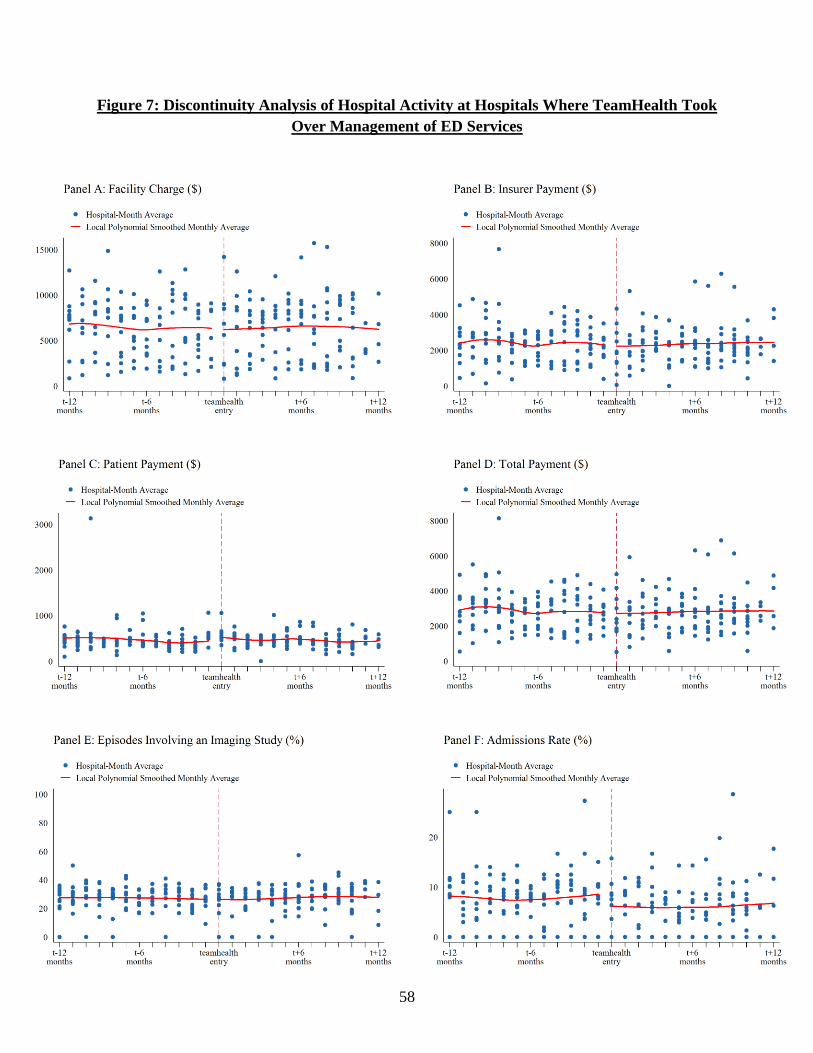
58
Figure 7: Discontinuity Analysis of Hospital Activity at Hospitals Where TeamHealth Took
Over Management of ED Services
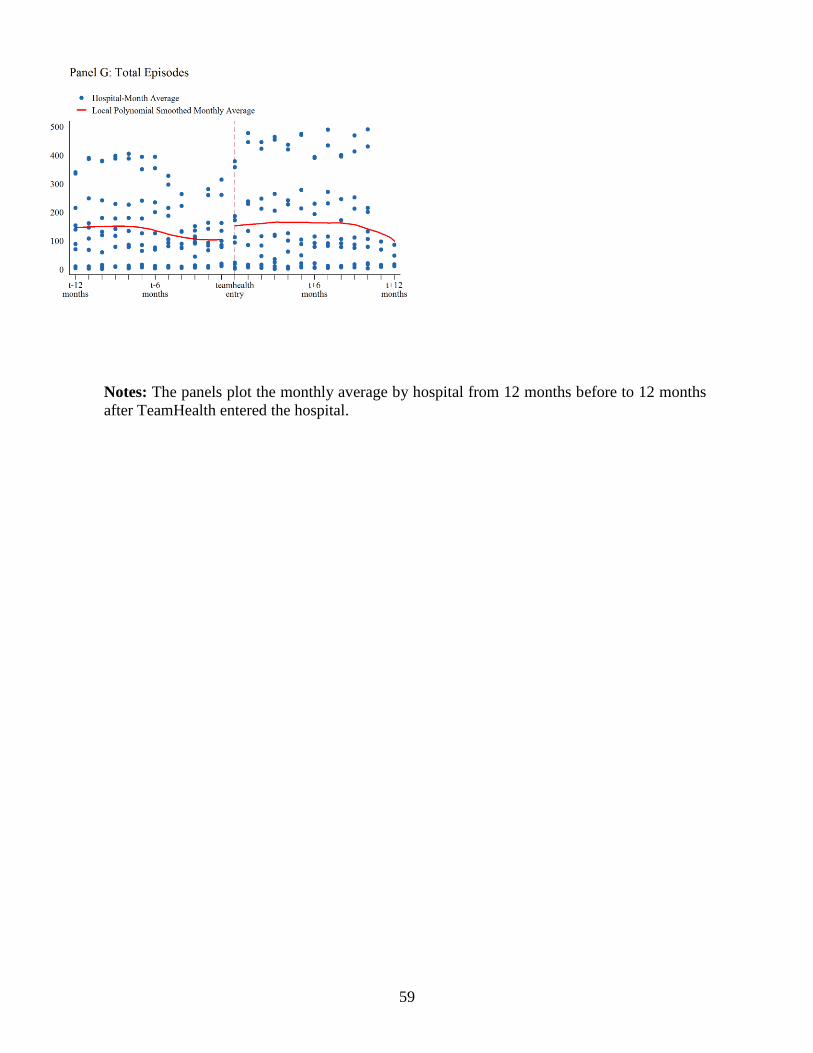
59
Notes: The panels plot the monthly average by hospital from 12 months before to 12 months
after TeamHealth entered the hospital.
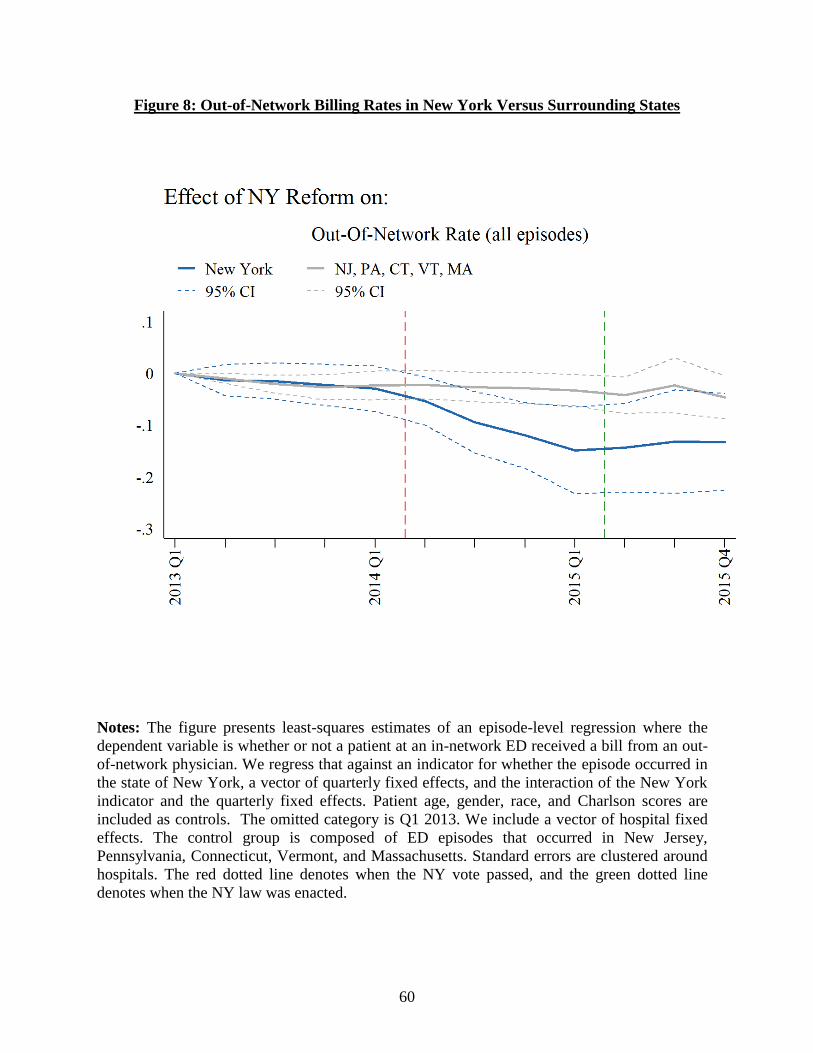
60
Figure 8: Out-of-Network Billing Rates in New York Versus Surrounding States
Notes: The figure presents least-squares estimates of an episode-level regression where the
dependent variable is whether or not a patient at an in-network ED received a bill from an out-
of-network physician. We regress that against an indicator for whether the episode occurred in
the state of New York, a vector of quarterly fixed effects, and the interaction of the New York
indicator and the quarterly fixed effects. Patient age, gender, race, and Charlson scores are
included as controls. The omitted category is Q1 2013. We include a vector of hospital fixed
effects. The control group is composed of ED episodes that occurred in New Jersey,
Pennsylvania, Connecticut, Vermont, and Massachusetts. Standard errors are clustered around
hospitals. The red dotted line denotes when the NY vote passed, and the green dotted line
denotes when the NY law was enacted.
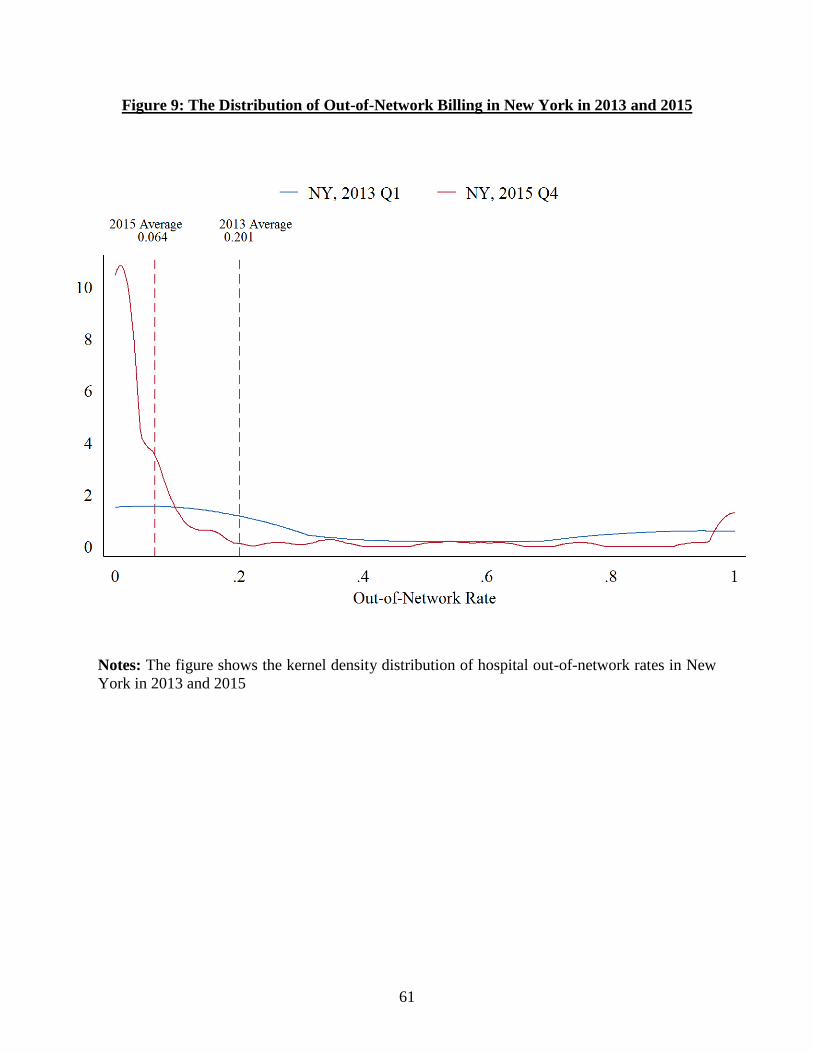
61
Figure 9: The Distribution of Out-of-Network Billing in New York in 2013 and 2015
Notes: The figure shows the kernel density distribution of hospital out-of-network rates in New
York in 2013 and 2015

1
Appendix – For Online Publication

2
Appendix 1: Variables Used in Lasso
Description Source
aha_admtot Total facility admissions AHA
aha_births Total births (excluding fetal deaths) AHA
aha_c_g Government AHA
aha_c_np Non-profit AHA
aha_fte Full-time equivalent total personnel AHA
aha_ftelpn Full-time equivalent licensed practical or
vocational nurses AHA
aha_ftemd Full-time equivalent physicians and
dentists AHA
aha_fteoth94 Full-time equivalent all other personnel AHA
aha_fteres Full-time equivalent medical and dental
residents and interns AHA
aha_ftern Full-time equivalent registered nurses AHA
aha_ftetran Full-time equivalent other trainees AHA
aha_ftettrn Full-time equivalent total trainees AHA
aha_ftlab Full-time lab techs AHA
aha_ftlpntf Full-time licensed nurses AHA
aha_ftmdtf Full-time physicians and dentists AHA
aha_ftres Full-time medical & dental residents,
interns AHA
aha_fttoth Total full-time hospital unit personnel AHA
aha_fttotlt Total full-time nursing home personnel AHA
aha_fttran84 Full-time other trainees AHA
aha_hcount_15m Hospital count 15m AHA
aha_hmocon # HMO contracts AHA
aha_hospbd Total hospital beds AHA
aha_mapp1 Accreditation by JCAHO AHA
aha_mapp10 Medicare certification AHA
aha_mapp11 Accreditation by American Osteopathic
Association AHA
aha_mapp12 Internship approved by AOA AHA
aha_mapp13 Residency approved by AOA AHA
aha_mapp16 Catholic church operated AHA
aha_mapp19 Rural Referral Center AHA

3
Description Source
aha_mapp2 Cancer program approved by ACS AHA
aha_mapp20 Sole Community Provider AHA
aha_mapp21 DNV AHA
aha_mapp3 Residency training approval AHA
aha_mapp5 Medical school affiliation AHA
aha_mapp6 Hospital-controlled professional nursing
school AHA
aha_mapp7 Accreditation by CARF AHA
aha_mapp8 Teaching hospital AHA
aha_mapp9 Blue Cross contracting or participating AHA
aha_mcddc Total facility Medicaid discharges AHA
aha_mcdipd Total facility Medicaid days AHA
aha_mcrdc Total facility Medicare discharges AHA
aha_npayben Total facility employee benefits AHA
aha_paytot Facility payroll expenses AHA
aha_prop_caid Proportion medicaid AHA
aha_prop_care Proportion medicare AHA
aha_ptlab Part-time laboratory technicians AHA
aha_ptlpntf Part-time licensed practical or vocational
nurses AHA
aha_ptmdtf Part-time physicians and dentists AHA
aha_ptphr Part-time pharmacists, licensed AHA
aha_ptpht Part-time pharmacy technicians AHA
aha_ptrad Part-time radiology technicians AHA
aha_ptres Part-time medical and dental residents and
interns AHA
aha_ptresp Part-time respiratory therapists AHA
aha_pttoth Total part-time hospital unit personnel AHA
aha_pttotlt Total part-time nursing home personnel AHA
aha_pttran84 Part-time other trainees AHA
aha_sunits Separate nursing home AHA
aha_suropip Inpatient surgical operations AHA
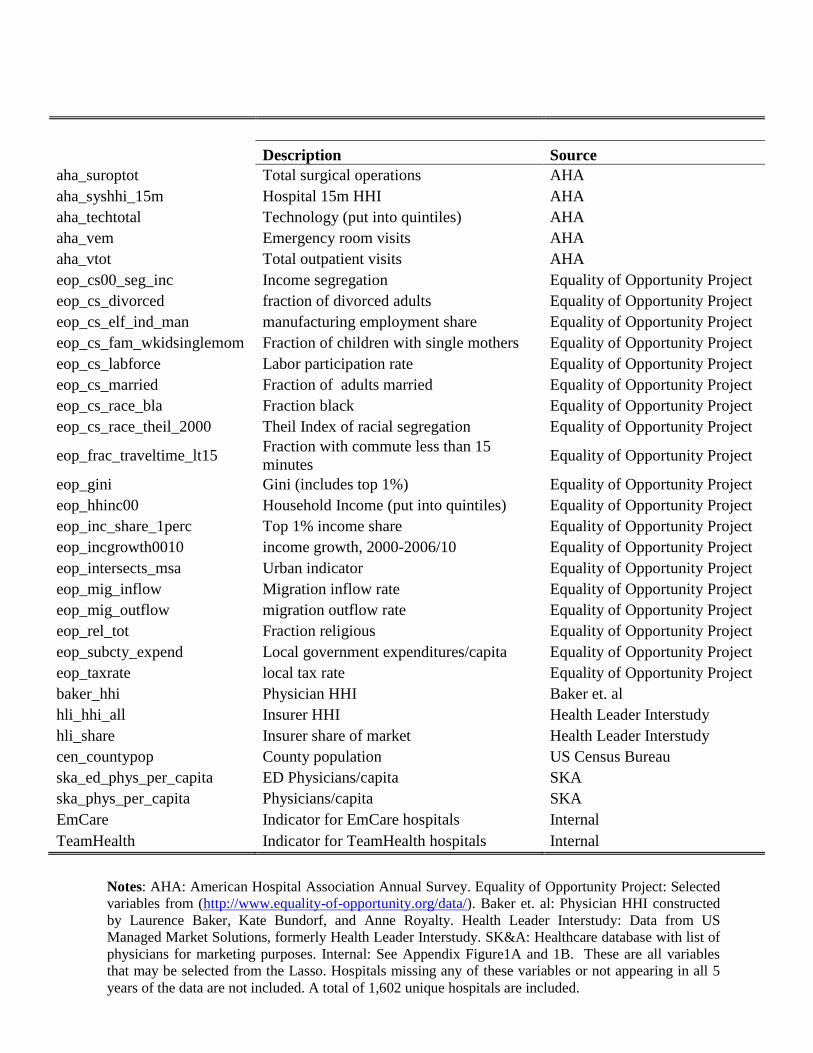
4
Description Source
aha_suroptot Total surgical operations AHA
aha_syshhi_15m Hospital 15m HHI AHA
aha_techtotal Technology (put into quintiles) AHA
aha_vem Emergency room visits AHA
aha_vtot Total outpatient visits AHA
eop_cs00_seg_inc Income segregation Equality of Opportunity Project
eop_cs_divorced fraction of divorced adults Equality of Opportunity Project
eop_cs_elf_ind_man manufacturing employment share Equality of Opportunity Project
eop_cs_fam_wkidsinglemom Fraction of children with single mothers Equality of Opportunity Project
eop_cs_labforce Labor participation rate Equality of Opportunity Project
eop_cs_married Fraction of adults married Equality of Opportunity Project
eop_cs_race_bla Fraction black Equality of Opportunity Project
eop_cs_race_theil_2000 Theil Index of racial segregation Equality of Opportunity Project
eop_frac_traveltime_lt15 Fraction with commute less than 15
minutes Equality of Opportunity Project
eop_gini Gini (includes top 1%) Equality of Opportunity Project
eop_hhinc00 Household Income (put into quintiles) Equality of Opportunity Project
eop_inc_share_1perc Top 1% income share Equality of Opportunity Project
eop_incgrowth0010 income growth, 2000-2006/10 Equality of Opportunity Project
eop_intersects_msa Urban indicator Equality of Opportunity Project
eop_mig_inflow Migration inflow rate Equality of Opportunity Project
eop_mig_outflow migration outflow rate Equality of Opportunity Project
eop_rel_tot Fraction religious Equality of Opportunity Project
eop_subcty_expend Local government expenditures/capita Equality of Opportunity Project
eop_taxrate local tax rate Equality of Opportunity Project
baker_hhi Physician HHI Baker et. al
hli_hhi_all Insurer HHI Health Leader Interstudy
hli_share Insurer share of market Health Leader Interstudy
cen_countypop County population US Census Bureau
ska_ed_phys_per_capita ED Physicians/capita SKA
ska_phys_per_capita Physicians/capita SKA
EmCare Indicator for EmCare hospitals Internal
TeamHealth Indicator for TeamHealth hospitals Internal
Appendix 2: New York Consumer Out-of-Network Form
Notes: AHA: American Hospital Association Annual Survey. Equality of Opportunity Project: Selected
variables from (http://www.equality-of-opportunity.org/data/). Baker et. al: Physician HHI constructed
by Laurence Baker, Kate Bundorf, and Anne Royalty. Health Leader Interstudy: Data from US
Managed Market Solutions, formerly Health Leader Interstudy. SK&A: Healthcare database with list of
physicians for marketing purposes. Internal: See Appendix Figure1A and 1B. These are all variables
that may be selected from the Lasso. Hospitals missing any of these variables or not appearing in all 5
years of the data are not included. A total of 1,602 unique hospitals are included.

5
Appendix 2: Surprise Billing Forms from New York State
New York State Out-of-Network Surprise Medical Bill
You may not be responsible for a surprise bill for out-of-
network services
A “Surprise Bill” is when you have insurance coverage issued in
the State of NY:
Hospital or surgical centers: You are a patient at a participating
hospital or ambulatory surgical center and you receive services for
which:
A network doctor was not available
An out-of-network doctor provided without your knowledge
Unforeseen medical circumstances arose at the time the
health care services were provided.
It will not be a surprise bill if you chose to receive services from an
out-of-network doctor instead of form an available network doctor.
Referrals: Your network doctor did not ask your consent to refer
you to an out-of-network doctor, lab or other health care provider,
and did not tell you it would result in costs not covered by your
health plan.
An independent dispute resolution entity (IDRE) can determine if
you need to pay the bill. You, the plan or your doctor may request
an independent dispute resolution (IDR) for surprise bills and
referrals. Use the form on the next page to submit your request.
You do not have to pay the bill in order to be eligible to submit the
dispute for review to an IDRE.
Dispute resolution process
1. Submit your request for independent review:
Complete the form on the next page. You can call
Customer Service if you need help completing the
form. The phone number is on you ID card. You may
mail the form to us at:
Consolidated Health Plans
2077 Roosevelt Ave.
Springfield, MA 01104
Or send the form electronically to:
2. An independent dispute resolution entity (IDRE)
approved by the State of New York will screen your
request for eligibility.
If the IDRE needs more information, it will contact the
health plan or health care provider. If the requested
information is not submitted with three business days,
or if the application is not eligible, the IDRE will reject
the application.
3. The IDRE will send a letter to the person who
initiated the request (you, the doctor, CHP)
The letter will include:
A request for the information needed to complete the review
A request for any additional information that may be available to
support the request
Where to send the information
4. You must submit any requested information within
five business days of receiving the letter
If IDRE receives a partial response or no response, the
dispute will be decided based on the available
information. You cannot ask for reconsideration by
submitting additional information after the decision is
made.
5. The IDRE will make a determination within 30 days
of receiving the request
If IDRE feels either the provider’s bill or the health
plan’s coverage policy is extreme, it may direct them to
attempt a good faith negotiation for settlement. They
will have up to ten business days for this negotiation.
A neutral and impartial reviewer with training and
experience in health care billing, reimbursement, and
usual and customary charges will review the dispute.
The IDRE will forward copies of its decision to the
health plan, the physician, superintendent, and as
applicable, the nonparticipating referred health care
provider and the patient, within two business days of
making the decision.

6
New York State Out-of-Network Surprise Medical Bill Assignment of Benefits Form
Use this form if you receive a surprise bill for health care services and want the services to be treated as in network. To use this form, you
must: (1) fill it out and sign it; (2) send a copy to your health care provider (include a copy of the bill or bills); and (3) send a copy to your
insurer (include a copy of the bill or bills). If you don’t know if it is a surprise bill, contact the Department of Financial Services at 1-
800-342-3736.
A surprise bill is when:
1. You received services from a nonparticipating physician at a participating hospital or ambulatory surgical center, where a
participating physician was not available; or a nonparticipating physician provided services without your knowledge; or unforeseen
medical circumstances arose at the time the services were provided. You did not choose to receive services from a
nonparticipating physician instead of from an available participating physician; OR
2. You were referred by a participating physician to a nonparticipating provider, but you did not sign a written consent that you
knew the services would be out-of-network and would result in costs not covered by your insurer. A referral occurs: (1) during
a visit with your participating physician, a nonparticipating provider treats you; or (2) your participating physician takes a
specimen from you in the office and sends it to a nonparticipating laboratory pathologist; or (3) for any other health care
services when referrals are required under your plan.
I assign my rights to payment to my provider and I certify to the best of my knowledge that:
I (or my dependent/s) received a surprise bill from a health care provider. I want the provider to seek payment for this bill from my
insurance company (this is an “assignment”). I want my health insurer to pay the provider for any health care services I or my dependent/s
received that are covered under my health insurance. With my assignment, the provider cannot seek payment from me, except for any
copayment, coinsurance or deductible that would be owed if I or my dependent/s used a participating provider. If my insurer paid me for
the services, I agree to send the payment to the provider.
Your Name:
Your Address:
Insurer Name:
Your Insurance ID No:
Provider Name: Provider Phone Number:
Provider Address:
Date of Service:
Any person who knowingly and with intent to defraud any insurance company or other person files and application for insurance or
statement of claim containing any materially false information, or conceals for the purpose of misleading, information concerning any fact
thereto, commits a fraudulent insurance act, which is a crime, and shall also be subject to a civil penalty not to exceed five thousand dollars
and the stated value of the claim for each such violation.
(Signature of patient) (Date of signature)
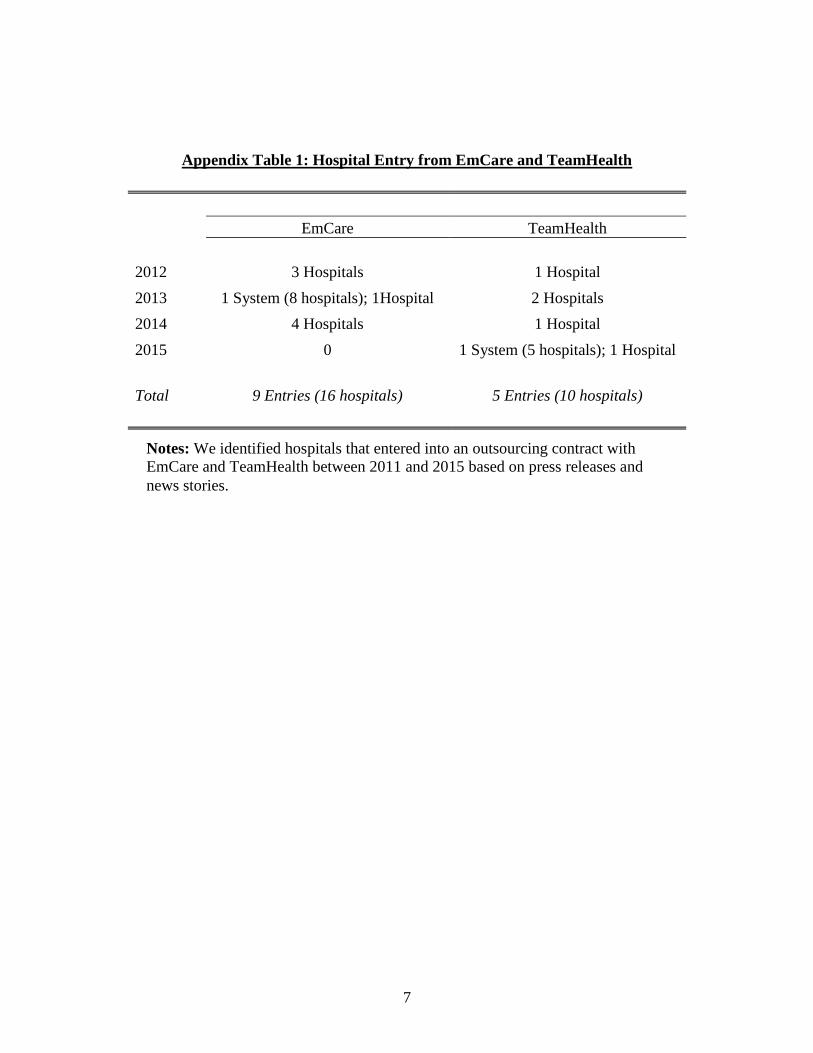
7
Appendix Table 1: Hospital Entry from EmCare and TeamHealth
EmCare TeamHealth
2012 3 Hospitals 1 Hospital
2013 1 System (8 hospitals); 1Hospital 2 Hospitals
2014 4 Hospitals 1 Hospital
2015 0 1 System (5 hospitals); 1 Hospital
Total 9 Entries (16 hospitals) 5 Entries (10 hospitals)
Notes: We identified hospitals that entered into an outsourcing contract with
EmCare and TeamHealth between 2011 and 2015 based on press releases and
news stories.

8
Appendix Table 2: ED Episode Descriptives
Mean SD Min P10 P25 P50 P75 P90 Max
Physician Payment 412.09 320.02 49.15 106.43 182.40 314.33 543.82 872.11 1,642.45
Physician Charge 614.92 385.70 107.10 224.64 332.80 519.18 787.52 1,136.10 2,146.42
Physician Insurer Payment 354.02 310.78 0.00 45.01 135.23 271.20 483.00 789.36 1,642.45
Physician Patient Payment 58.07 114.61 0.00 0.00 0.00 0.00 65.31 185.17 679.45
Potential Balance Bill 202.90 237.04 0.00 0.00 41.68 135.66 274.96 484.55 2,067.52
Patient Cost Exposure 260.94 256.20 0.00 0.00 87.40 190.90 352.26 592.98 2,146.42
Facility Payment 2,850.62 5,218.31 119.22 400.40 689.52 1,139.04 2,418.20 6,379.46 36,286.11
Facility Charge 6,642.39 13,011.33 172.38 552.70 1,065.90 2,325.69 5,802.44 15,300.48 90,184.31
Facility Insurer Payment 2,441.31 5,063.87 0.00 0.00 367.69 862.51 2,001.42 5,629.37 36,286.11
Facility Patient Payment 409.31 581.84 0.00 0.00 104.00 200.96 444.60 1,081.61 3,352.42
Admissions 0.09 0.29 0 0 0 0 0 0 1
Imaging 0.28 0.45 0 0 0 0 1 1 1
Length of Stay 0.58 1.97 0 0 0 0 0 1 30
CPT 99281 0.05 0.21 0 0 0 0 0 0 1
CPT 99282 0.13 0.34 0 0 0 0 0 1 1
CPT 99283 0.48 0.50 0 0 0 0 1 1 1
CPT 99284 0.50 0.50 0 0 0 0 1 1 1
CPT 99285 0.35 0.48 0 0 0 0 1 1 1
Hispanic 0.08 0.28 0 0 0 0 0 0 1
Black 0.10 0.30 0 0 0 0 0 1 1

9
White 0.48 0.50 0 0 0 0 1 1 1
Ages 57-65 0.17 0.38 0 0 0 0 0 1 1
Ages 47-56 0.18 0.38 0 0 0 0 0 1 1
Ages 37-46 0.17 0.37 0 0 0 0 0 1 1
Ages 27-36 0.16 0.36 0 0 0 0 0 1 1
Ages 20-26 0.13 0.33 0 0 0 0 0 1 1
Ages 0-19 0.20 0.40 0 0 0 0 0 1 1
Charlson Scores 0.34 0.99 0 0 0 0 0 1 17
6-month Spending 6,248 17,195 0 0 149 757 3,548 14,254 115,499
Episodes per hospital 2,665 3,821 60 190 442 1,177 3,279 6,964 47,599
Notes: These are the descriptive statistics for all ED episodes in our data. These are limited to episodes that occurred at in-network
hospitals. Payment and charges are winsorized at the top and bottom one percentiles. Payments and charges are also inflation adjusted
into 2015 dollars using the BLS All Consumer Price Index.

10
Appendix Table 3: The Impact of the Entry of EmCare and TeamHealth on Hospital Out-of-Network Rates
(1) (2) (3)
(4) (5) (6) (7) (8) (9)
Hospitals with Out-of-Network
Rates Above 97% Prior to Entry
Hospitals with Out-of-Network
Rates Below 97% Prior to Entry
All Hospitals Where TeamHealth
Entered
OON Indicator
OON Indicator OON Indicator
Management Company Entry -0.030 0.035 -0.032
0.815*** 0.846*** 0.896***
0.326*** 0.376*** 0.261***
(0.044) (0.048) (0.060)
(0.061) 0.073 (0.156)
(0.03) (0.034) 0.082
Hospital FE Yes Yes Yes
Yes Yes Yes
Yes Yes Yes
Month FE Yes Yes Yes
Yes Yes Yes
Yes Yes Yes
Mean 0.209 0.392 0.896
0.204 0.372 0.549
0.226 0.305 0.232
SD 0.407 0.488 0.306
0.403 0.483 0.498
0.419 0.460 0.422
Observations 8,401,884 1,704,541 85,741
8,351,799 1,654,456 34,876
8,661,796 2,118,144 132,549
Control
All Non-
Entry
Hospitals
Hospitals
in Same
State
Propensity
Score
Match
All Non-
Entry
Hospitals
Hospitals
in Same
State
Propensity
Score
Match
All Non-
Entry
Hospitals
Hospitals
in Same
State
Propensity
Score
Match
Notes: * p<0.10, ** p<0.05, *** p<0.01. This table presents least-squares estimates of Equation (13a) separately on hospitals with out-of-
network (OON) rates below 11% (Columns 1-3) and above 97% (Columns 4-6). We also estimate Equation (13b) for hospitals with
TeamHealth entry in Columns (7-9). The dependent variable in all regressions is a binary indicator for whether a patient at an in-network
hospital was treated by an out-of-network physician. Our analysis is run at the patient-level. The control groups for Columns (1,4,7) are all
hospitals in the US that did not outsource their ED management to EmCare or TeamHealth. The control groups for Columns (2,5,8) are all
hospitals in same states as the treated hospitals, excluding hospitals that outsourced their ED services to EmCare or TeamHealth The control
groups in Columns (3,6,9) are hospitals matched to treated hospitals using propensity scores calculated using entry as predicted by a treated
hospital's beds, technology, and non-profit/for-profit status. Each regression includes controls for patient age, gender, race, and Charlson score.
Standard errors are clustered around hospitals. Mean and standard deviation are drawn from the analytic sample population underlying the
regression.

11
Appendix Table 4: The Impact of the Entry of EmCare on Physician Charges, Payments, and Coding
Same-State Hospitals Control Group
(1) (2) (3) (4) (5) (6) (7)
Physician
Charge
Insurer
Payment
Patient
Cost
Sharing
Total
Payment
Potential
Balanced
Bill
Total
Patient
Cost
Exposure
CPT
Severity
EmCare Entry 548.40*** 396.98*** 46.23*** 443.22*** 105.18*** 151.42*** 0.148***
(62.97) (55.28) (4.53) (56.13) (38.86) (35.28) (0.030)
Hospital FE Yes Yes Yes Yes Yes Yes Yes
Month FE Yes Yes Yes Yes Yes Yes Yes
Mean 615.73 409.62 61.68 471.30 144.42 206.11 0.357
SD 386.33 327.27 111.05 340.41 215.56 236.11 0.479
Observations 1,720,883 1,720,883 1,720,883 1,720,883 1,720,883 1,720,883 1,720,883
Control
Hospitals
in Same
State
Hospitals
in Same
State
Hospitals
in Same
State
Hospitals
in Same
State
Hospitals
in Same
State
Hospitals
in Same
State
Hospitals
in Same
State
Notes: * p<0.10, ** p<0.05, *** p<0.01. This table presents least-squares estimates of Equation (13a). Each
observation is a patient episode. The control group includes hospitals in the same states as the treated hospitals.
We windsorized the top and bottom percentile of hospital and physician payments. Each regression includes
controls for patient age, gender, race, and Charlson score. Standard errors are clustered around hospitals. Means
and standard deviation are drawn from the analytic sample population underlying the regression. All dollars
amounts are adjusted into 2015 dollars.

12
Appendix Table 5: The Impact of the Entry of EmCare on Physician Charges, Payments, and Coding
Propensity Score Control Group
(1) (2) (3) (4) (5) (6) (7)
Physician
Charge
Insurer
Payment
Patient
Cost
Sharing
Total
Payment
Potential
Balanced
Bill
Total
Patient
Cost
Exposure
CPT
Severity
EmCare Entry 478.19*** 390.28*** 42.21*** 432.50*** 45.69 87.90** 0.144***
(77.87) (62.71) (5.51) (64.73) (38.02) (38.39) (0.034)
Hospital FE Yes Yes Yes Yes Yes Yes Yes
Month FE Yes Yes Yes Yes Yes Yes Yes
Mean 817.20 578.37 83.43 661.80 155.40 238.83 0.357
SD 485.98 427.60 130.57 452.12 313.02 325.70 0.479
Observations 130,263 130,263 130,263 130,263 130,263 130,263 130,263
Control
Propensity
Score
Match
Propensity
Score
Match
Propensity
Score
Match
Propensity
Score
Match
Propensity
Score
Match
Propensity
Score
Match
Propensity
Score
Match
Notes: * p<0.10, ** p<0.05, *** p<0.01. This table presents least-squares estimates of Equation (13a). Each
observation is a patient episode. The control groups are composed of hospitals matched to treated hospitals using
propensity scores calculated using entry as predicted by a treated hospital's beds, technology, and non-profit/for-
profit status.We windsorized the top and bottom percentile of hospital and physician payments. Each regression
includes controls for patient age, gender, race, and Charlson score. Standard errors are clustered around hospitals.
Means and standard deviation are drawn from the analytic sample population underlying the regression. All
dollars amounts are adjusted into 2015 dollars.

13
Appendix Table 6: The Impact of the Entry of TeamHealth on Physician Charges, Payments, and Coding
Same-State Hospitals Control Group
(1) (2) (3) (4) (5)
Physician
Charge
Insurer
Payment
Patient Cost
Sharing Total Payment CPT Severity
TeamHealth Entry 13.63 230.63*** 18.45*** 249.08*** 0.0225
(37.39) (17.79) (3.71) (20.91) (0.015)
Hospital FE Yes Yes Yes Yes Yes
Month FE Yes Yes Yes Yes Yes
Mean 635.76 389.46 62.21 451.66 0.362
SD 397.92 327.93 112.14 342.54 0.481
Observations 2,118,144 2,118,144 2,118,144 2,118,144 2,118,144
Control
Hospitals in
Same State
Hospitals in
Same State
Hospitals in
Same State
Hospitals in
Same State
Hospitals in
Same State
Notes: * p<0.10, ** p<0.05, *** p<0.01. This table presents least-squares estimates of Equation (13b). Each
observation is a patient episode. The control group includes hospitals in the same states as the treated hospitals.
We windsorized the top and bottom percentile of hospital and physician payments. Each regression includes
controls for patient age, gender, race, and Charlson score. Standard errors are clustered around hospitals. Means
and standard deviation are drawn from the analytic sample population underlying the regression. All dollar
amounts are inflation adjusted into 2015 dollars.

14
Appendix Table 7: The Impact of the Entry of TeamHealth on Physician Charges, Payments, and Coding
Propensity Score Control Group
(1) (2) (3) (4) (5)
Physician
Charge Insurer Payment
Patient Cost
Sharing Total Payment CPT Severity
TeamHealth Entry -28.41 215.21*** 18.82*** 234.04*** 0.0267
(44.01) (24.77) (6.53) (27.91) (0.024)
Hospital FE Yes Yes Yes Yes Yes
Month FE Yes Yes Yes Yes Yes
Mean 705.85 442.41 61.54 503.96 0.387
SD 372.52 296.61 108.89 304.59 0.487
Observations 132,549 132,549 132,549 132,549 132,549
Control
Propensity
Score Match
Propensity
Score Match
Propensity
Score Match
Propensity
Score Match
Propensity
Score Match
Notes: * p<0.10, ** p<0.05, *** p<0.01. This table presents least-squares estimates of Equation (13b). Each
observation is a patient episode. The control groups are composed of hospitals matched to treated hospitals using
propensity scores calculated using entry as predicted by a treated hospital's beds, technology, and non-profit/for-
profit status.We windsorized the top and bottom percentile of hospital and physician payments. Each regression
includes controls for patient age, gender, race, and Charlson score. Standard errors are clustered around hospitals.
Means and standard deviation are drawn from the analytic sample population underlying the regression. All
dollar amounts are inflation adjusted into 2015 dollars.

15
Appendix Table 8: Physician Payment Rates for ED Visits
Mean S.D. P25 P50 P75 Max
In-Network ED Physician
Payment $326.70 $238.99 $156.55 $267.14 $422.12 $1,642.45
(Percent Medicare) (266%)
Out-of-Network ED
Physician Charge $785.91 $443.86 $440.64 $680.34 $1,013.29 $2,146.42
(Percent Medicare) (637%)
Notes: We limit our data to hospitals with more than 10 episodes per year from 2011 to
2015. Physician charges and payments are winsorized at the top and bottom percentile.
Prices are inflation adjusted using the BLS All Consumer Price Index.

16
Appendix Table 9: The Impact of the Entry of EmCare on Hospital Charges, Payments, and
Activity
Same-State Control Group
(1) (2) (3) (4) (5) (6) (7)
Facility
Charge
Insurer
Payment
Patient
Cost
Sharing
Total
Payment Imaging
Admission
to
Hospital
Episode
Count
EmCare Entry 1522.14*** 191.94* 45.47** 237.41** 0.012*** 0.017*** -188.98
(395.07) (98.48) (17.79) (112.91) (0.005) 0.0062 (219.4)
Hospital FE Yes Yes Yes Yes Yes Yes Yes
Month FE Yes Yes Yes Yes Yes Yes Yes
Mean 6,304.63 2,350.46 393.81 2,744.271 0.278 0.090 1,695.5
SD 12,415.53 4,885.15 561.89 5,034.470 0.448 0.286 1,566.5
Observations 8,418,226 8,418,226 8,418,226 8,418,226 8,418,226 8,418,226 8,418,226
Control
Hospitals
in Same
State
Hospitals
in Same
State
Hospitals
in Same
State
Hospitals
in Same
State
Hospitals
in Same
State
Hospitals
in Same
State
Hospitals
in Same
State
Notes: * p<0.10, ** p<0.05, *** p<0.01. This table presents least-squares estimates of Equation
(13a). Each observation is a patient episode. The control group includes hospitals in the same states as
the treated hospitals. We windsorized the top and bottom percentile of hospital and physician
payments. Imaging is an indicator variable capturing whether a patient had an imaging study
performed during an ED visit. Admissions to hospital is an indicator variable that captures whether a
patient was admitted to the hospital after an ED visit. Each regression includes controls for patient
age, gender, race, and Charlson score. Standard errors are clustered around hospitals. Means and
standard deviation are drawn from the analytic sample population underlying the regression. All
dollar amounts are inflation adjusted into 2015 dollars.
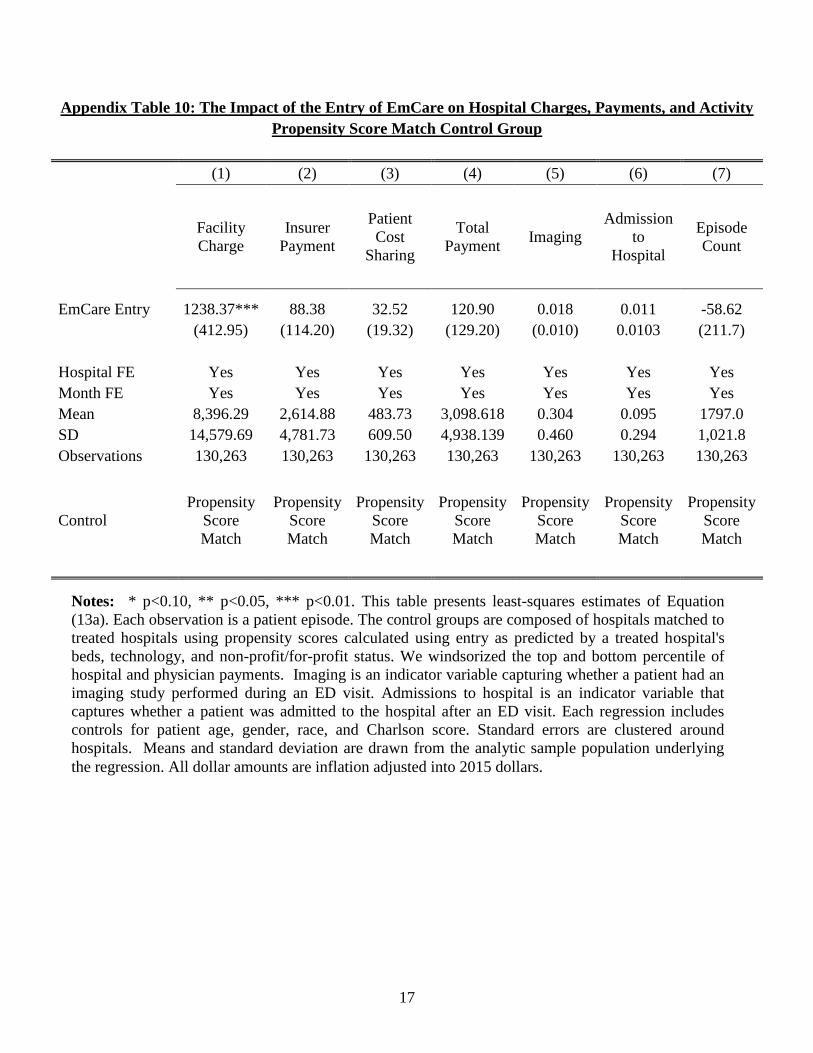
17
Appendix Table 10: The Impact of the Entry of EmCare on Hospital Charges, Payments, and Activity
Propensity Score Match Control Group
(1) (2) (3) (4) (5) (6) (7)
Facility
Charge
Insurer
Payment
Patient
Cost
Sharing
Total
Payment Imaging
Admission
to
Hospital
Episode
Count
EmCare Entry 1238.37*** 88.38 32.52 120.90 0.018 0.011 -58.62
(412.95) (114.20) (19.32) (129.20) (0.010) 0.0103 (211.7)
Hospital FE Yes Yes Yes Yes Yes Yes Yes
Month FE Yes Yes Yes Yes Yes Yes Yes
Mean 8,396.29 2,614.88 483.73 3,098.618 0.304 0.095 1797.0
SD 14,579.69 4,781.73 609.50 4,938.139 0.460 0.294 1,021.8
Observations 130,263 130,263 130,263 130,263 130,263 130,263 130,263
Control
Propensity
Score
Match
Propensity
Score
Match
Propensity
Score
Match
Propensity
Score
Match
Propensity
Score
Match
Propensity
Score
Match
Propensity
Score
Match
Notes: * p<0.10, ** p<0.05, *** p<0.01. This table presents least-squares estimates of Equation
(13a). Each observation is a patient episode. The control groups are composed of hospitals matched to
treated hospitals using propensity scores calculated using entry as predicted by a treated hospital's
beds, technology, and non-profit/for-profit status. We windsorized the top and bottom percentile of
hospital and physician payments. Imaging is an indicator variable capturing whether a patient had an
imaging study performed during an ED visit. Admissions to hospital is an indicator variable that
captures whether a patient was admitted to the hospital after an ED visit. Each regression includes
controls for patient age, gender, race, and Charlson score. Standard errors are clustered around
hospitals. Means and standard deviation are drawn from the analytic sample population underlying
the regression. All dollar amounts are inflation adjusted into 2015 dollars.
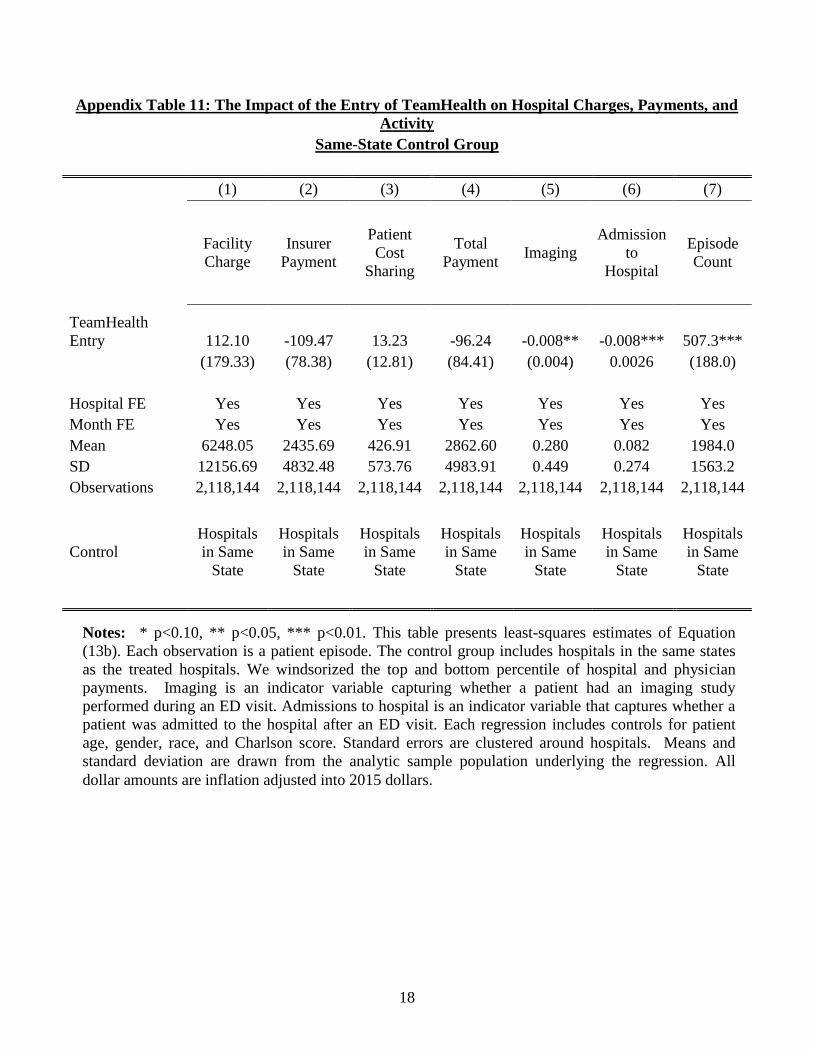
18
Appendix Table 11: The Impact of the Entry of TeamHealth on Hospital Charges, Payments, and
Activity
Same-State Control Group
(1) (2) (3) (4) (5) (6) (7)
Facility
Charge
Insurer
Payment
Patient
Cost
Sharing
Total
Payment Imaging
Admission
to
Hospital
Episode
Count
TeamHealth
Entry 112.10 -109.47 13.23 -96.24 -0.008** -0.008*** 507.3***
(179.33) (78.38) (12.81) (84.41) (0.004) 0.0026 (188.0)
Hospital FE Yes Yes Yes Yes Yes Yes Yes
Month FE Yes Yes Yes Yes Yes Yes Yes
Mean 6248.05 2435.69 426.91 2862.60 0.280 0.082 1984.0
SD 12156.69 4832.48 573.76 4983.91 0.449 0.274 1563.2
Observations 2,118,144 2,118,144 2,118,144 2,118,144 2,118,144 2,118,144 2,118,144
Control
Hospitals
in Same
State
Hospitals
in Same
State
Hospitals
in Same
State
Hospitals
in Same
State
Hospitals
in Same
State
Hospitals
in Same
State
Hospitals
in Same
State
Notes: * p<0.10, ** p<0.05, *** p<0.01. This table presents least-squares estimates of Equation
(13b). Each observation is a patient episode. The control group includes hospitals in the same states
as the treated hospitals. We windsorized the top and bottom percentile of hospital and physician
payments. Imaging is an indicator variable capturing whether a patient had an imaging study
performed during an ED visit. Admissions to hospital is an indicator variable that captures whether a
patient was admitted to the hospital after an ED visit. Each regression includes controls for patient
age, gender, race, and Charlson score. Standard errors are clustered around hospitals. Means and
standard deviation are drawn from the analytic sample population underlying the regression. All
dollar amounts are inflation adjusted into 2015 dollars.
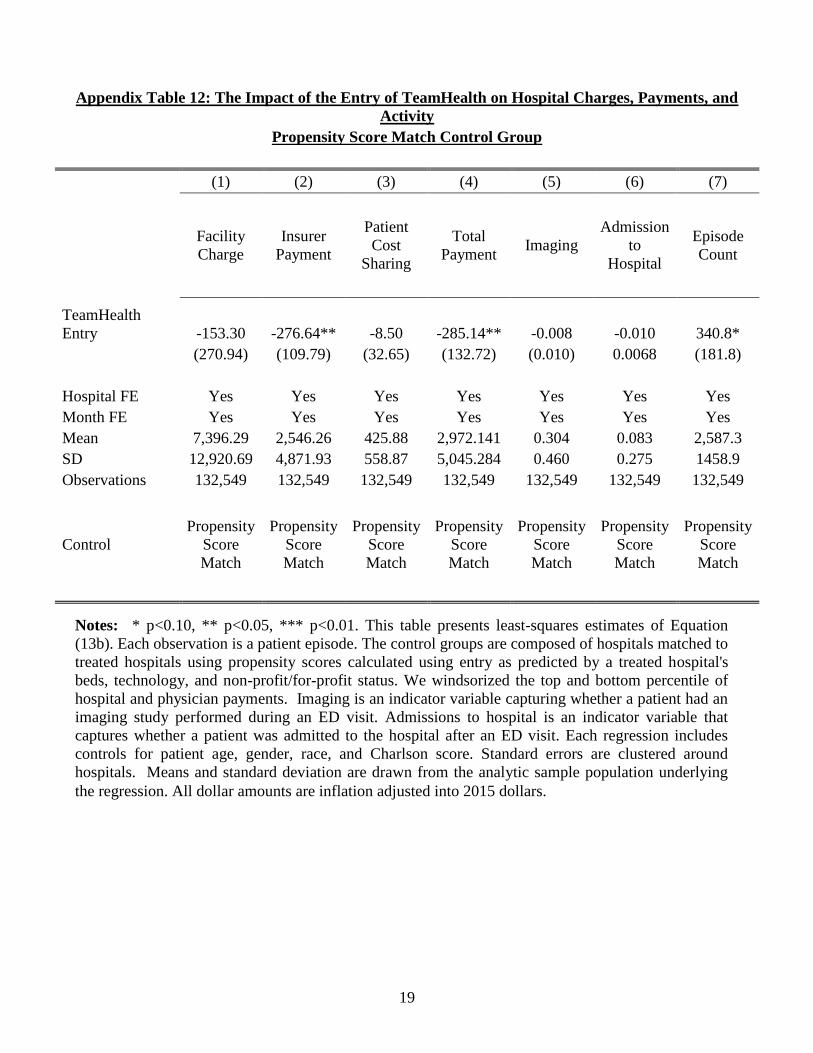
19
Appendix Table 12: The Impact of the Entry of TeamHealth on Hospital Charges, Payments, and
Activity
Propensity Score Match Control Group
(1) (2) (3) (4) (5) (6) (7)
Facility
Charge
Insurer
Payment
Patient
Cost
Sharing
Total
Payment Imaging
Admission
to
Hospital
Episode
Count
TeamHealth
Entry -153.30 -276.64** -8.50 -285.14** -0.008 -0.010 340.8*
(270.94) (109.79) (32.65) (132.72) (0.010) 0.0068 (181.8)
Hospital FE Yes Yes Yes Yes Yes Yes Yes
Month FE Yes Yes Yes Yes Yes Yes Yes
Mean 7,396.29 2,546.26 425.88 2,972.141 0.304 0.083 2,587.3
SD 12,920.69 4,871.93 558.87 5,045.284 0.460 0.275 1458.9
Observations 132,549 132,549 132,549 132,549 132,549 132,549 132,549
Control
Propensity
Score
Match
Propensity
Score
Match
Propensity
Score
Match
Propensity
Score
Match
Propensity
Score
Match
Propensity
Score
Match
Propensity
Score
Match
Notes: * p<0.10, ** p<0.05, *** p<0.01. This table presents least-squares estimates of Equation
(13b). Each observation is a patient episode. The control groups are composed of hospitals matched to
treated hospitals using propensity scores calculated using entry as predicted by a treated hospital's
beds, technology, and non-profit/for-profit status. We windsorized the top and bottom percentile of
hospital and physician payments. Imaging is an indicator variable capturing whether a patient had an
imaging study performed during an ED visit. Admissions to hospital is an indicator variable that
captures whether a patient was admitted to the hospital after an ED visit. Each regression includes
controls for patient age, gender, race, and Charlson score. Standard errors are clustered around
hospitals. Means and standard deviation are drawn from the analytic sample population underlying
the regression. All dollar amounts are inflation adjusted into 2015 dollars.

20
Appendix Table 13: Hospital Characteristics Associated with EmCare and TeamHealth
(1) (2) (3) (4)
EmCare EmCare TeamHealth TeamHealth
For-profit 0.1063*** 0.1206***
0.011 0.011
(0.013) (0.012)
(0.010) (0.009)
Government 0.0464*** 0.0440***
0.005 0.002
(0.015) (0.014)
(0.011) (0.010)
Teaching Hospital -0.007 -0.008
-0.017 -0.016
(0.019) (0.019)
(0.014) (0.014)
Hospital Beds 0.003 0.000
0.004 0.0108*
(0.009) (0.008)
(0.007) (0.006)
Technologies 0.006 -0.001
-0.008 -0.011
(0.019) (0.018)
(0.013) (0.013)
Hospital HHI 0.0187* 0.0184**
0.001 0.0138**
(0.011) (0.008)
(0.008) (0.006)
Proportion Medicare 0.014 0.001
0.014 0.0245**
(0.017) (0.016)
(0.012) (0.012)
Proportion Medicaid 0.004 -0.003
0.005 0.007
(0.008) (0.008)
(0.006) (0.006)
ED Physicians per Capita 11.510 -0.0433***
-22.9726*** -0.0197**
(9.167) (0.011)
(6.637) (0.008)
Physicians per Capita -14.979 -0.004
29.3776*** 0.0506***
(13.582) (0.023)
(9.833) (0.017)
Physician HHI 0.016 0.011
-0.008 -0.003
(0.020) (0.016)
(0.014) (0.012)
Insurer HHI 0.021 -0.008
0.002 -0.0148*
(0.019) (0.011)
(0.014) (0.008)
Household Income 0.0893** 0.0951***
0.0517* -0.025
(0.042) (0.030)
(0.030) (0.021)
Gini Coefficient -0.1182** 0.0697***
0.026 0.028
(0.052) (0.026)
(0.038) (0.019)
HRR FE Yes No
Yes No
Mean 0.0581 0.0581
0.0285 0.0285
SD 0.2340 0.2340
0.1663 0.1663
Observations 3,345 3,345
3,345 3,345
Notes: * p<0.10, ** p<0.05, *** p<0.01. Each observation is a hospital. The table presents a logit
regression of an indicator for EmCare or TeamHealth hospitals on the hospital characteristics in the
table. Means and standard deviation are drawn from the analytic sample population underlying the
regression.

21
Appendix Table 14: Comparison of Entry Hospital Characteristics
EmCare
Hospitals
EmCare Entry
Hospitals
P-value
from two-
sided t-test
TeamHealth
Hospitals
TeamHealth
Entry Hospitals
P-value
from two-
sided t-test
Hospital Characteristics
For-profit 0.55 0.57 0.87
0.29 0.30 0.96
Non-profit 0.27 0.21 0.65
0.57 0.70 0.45
Government 0.18 0.21 0.76
0.13 0.00 0.22
Teaching 0.04 0.00 0.44
0.04 0.00 0.54
Hospital Beds 173.97 266.50 0.03
197.63 227.40 0.50
Technologies 43.10 57.79 0.06
47.79 54.80 0.45
Hospital HHI 0.57 0.58 0.98
0.59 0.66 0.48
Proportion Medicare 48.31 43.58 0.12
51.42 44.43 0.03
Proportion Medicaid 18.97 24.18 0.15
20.15 18.14 0.48
ED Physicians per Capita
(per 10,000) 0.65 0.61 0.58
0.70 1.06 0.00
Physicians per Capita (per
10,000) 21.64 19.01 0.06
22.82 25.52 0.09
Physician HHI 0.41 0.59 0.02
0.41 0.65 0.13
Insurer HHI 0.36 0.35 0.75
0.35 0.40 0.31
Household Income 38,146.20 35,404.44 0.22
36,849.58 38,080.67 0.59
Gini Coefficient 0.34 0.34 0.61
0.33 0.31 0.19
Notes: The table compares characteristics of identified EmCare and TeamHealth hospitals to characteristics of hospitals
where we have entry. Hospitals with entry are excluded from identified TeamHealth and EmCare hospitals. The p-value is
reported from a two-sided t-test comparing the difference in means between hospitals and hospitals with entry.

22
Appendix Table 15: The Impact of Entry on Historical Patient Spending and Charlson Scores
EmCare
TeamHealth
(1) (2) (3) (4)
(5) (6) (7) (8)
6 month
historical
spending
12 month
historical
spending
6 month
Charlson
12 month
Charlson
6 month
historical
spending
12 month
historical
spending
6 month
Charlson
12 month
Charlson
Firm Entry 916.02*** 1306.16*** 0.033*** 0.036***
-336.35** -783.08** 0.004 0.006
(253.83) (425.64) (0.010) (0.012)
(166.74) (305.09) (0.005) (0.005)
Hospital FE Yes Yes Yes Yes
Yes Yes Yes Yes
Month FE Yes Yes Yes Yes
Yes Yes Yes Yes
Mean 6,247.15 11,476.89 0.326 0.449
6,266.03 11,512.46 0.326 0.450
SD 1,7201.02 27,910.51 0.919 1.056
17,236.61 27,971.30 0.919 1.056
Observations 8,418,226 7,056,427 8,418,226 7,056,427
8,661,796 7,256,251 8,661,796 7,256,251
Control All Hospitals All Hospitals All Hospitals All Hospitals
All Hospitals All Hospitals All Hospitals All Hospitals
Notes: * p<0.10, ** p<0.05, *** p<0.01. This table presents least-squares estimates of Equations (13a) and (13b). Each observation is a
patient episode. The control group in all regressions is all hospitals in the US exclusive of those that outsourced their ED services to EmCare
or TeamHealth. We windsorized the top percentile of 6 and 12 month historical spending. Standard errors are clustered around hospitals.
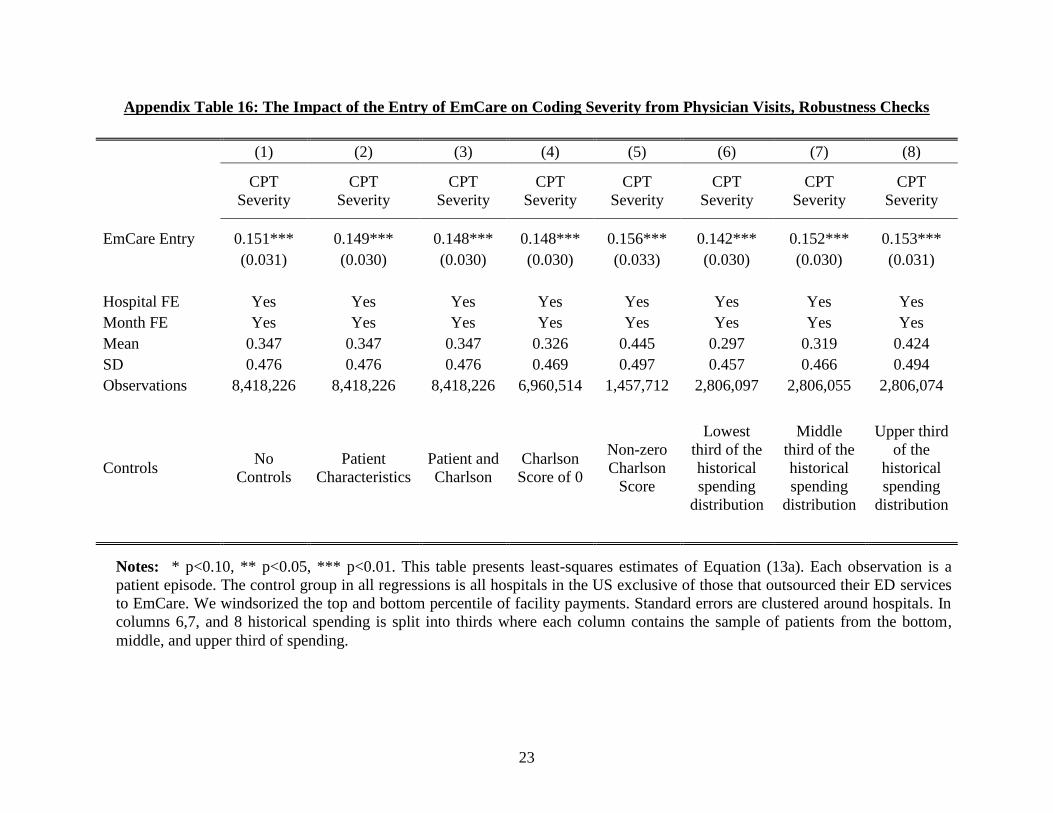
23
Appendix Table 16: The Impact of the Entry of EmCare on Coding Severity from Physician Visits, Robustness Checks
(1) (2) (3) (4) (5) (6) (7) (8)
CPT
Severity
CPT
Severity
CPT
Severity
CPT
Severity
CPT
Severity
CPT
Severity
CPT
Severity
CPT
Severity
EmCare Entry 0.151*** 0.149*** 0.148*** 0.148*** 0.156*** 0.142*** 0.152*** 0.153***
(0.031) (0.030) (0.030) (0.030) (0.033) (0.030) (0.030) (0.031)
Hospital FE Yes Yes Yes Yes Yes Yes Yes Yes
Month FE Yes Yes Yes Yes Yes Yes Yes Yes
Mean 0.347 0.347 0.347 0.326 0.445 0.297 0.319 0.424
SD 0.476 0.476 0.476 0.469 0.497 0.457 0.466 0.494
Observations 8,418,226 8,418,226 8,418,226 6,960,514 1,457,712 2,806,097 2,806,055 2,806,074
Controls No
Controls
Patient
Characteristics
Patient and
Charlson
Charlson
Score of 0
Non-zero
Charlson
Score
Lowest
third of the
historical
spending
distribution
Middle
third of the
historical
spending
distribution
Upper third
of the
historical
spending
distribution
Notes: * p<0.10, ** p<0.05, *** p<0.01. This table presents least-squares estimates of Equation (13a). Each observation is a
patient episode. The control group in all regressions is all hospitals in the US exclusive of those that outsourced their ED services
to EmCare. We windsorized the top and bottom percentile of facility payments. Standard errors are clustered around hospitals. In
columns 6,7, and 8 historical spending is split into thirds where each column contains the sample of patients from the bottom,
middle, and upper third of spending.

24
Appendix Table 17: The Impact of the Entry of EmCare on Facility Payments, Robustness Checks
(1) (2) (3) (4) (5) (6) (7) (8)
Facility
Payment
Facility
Payment
Facility
Payment
Facility
Payment
Facility
Payment
Facility
Payment
Facility
Payment
Facility
Payment
EmCare Entry 316.63** 309.57*** 294.58*** 204.95** 742.32** 215.42** 228.37** 428.78***
(124.89) (115.77) (113.64) (82.50) (356.38) (106.80) (109.11) (160.14)
Hospital FE Yes Yes Yes Yes Yes Yes Yes Yes
Month FE Yes Yes Yes Yes Yes Yes Yes Yes
Mean 2,744.27 2,744.27 2,744.27 2,417.80 4,303.16 2,353.30 2,355.26 3,524.26
SD 5,034.47 5,034.47 5,034.47 4,418.88 7,084.79 4,492.45 4,350.98 6,001.00
Observations 8,418,226 8,418,226 8,418,226 6,960,514 1,457,712 2,806,097 2,806,055 2,806,074
Controls No
Controls
Patient
Characteristics
Patient and
Charlson
Charlson
Score of 0
Non-zero
Charlson
Score
Lowest
third of the
historical
spending
distribution
Middle
third of the
historical
spending
distribution
Upper third
of the
historical
spending
distribution
Notes: * p<0.10, ** p<0.05, *** p<0.01. This table presents least-squares estimates of Equation (13a). Each observation is a
patient episode. The control group in all regressions is all hospitals in the US exclusive of those that outsourced their ED services
to EmCare. We windsorized the top and bottom percentile of facility payments. Standard errors are clustered around hospitals. In
columns 6,7, and 8 historical spending is split into thirds where each column contains the sample of patients from the bottom,
middle, and upper third of spending.
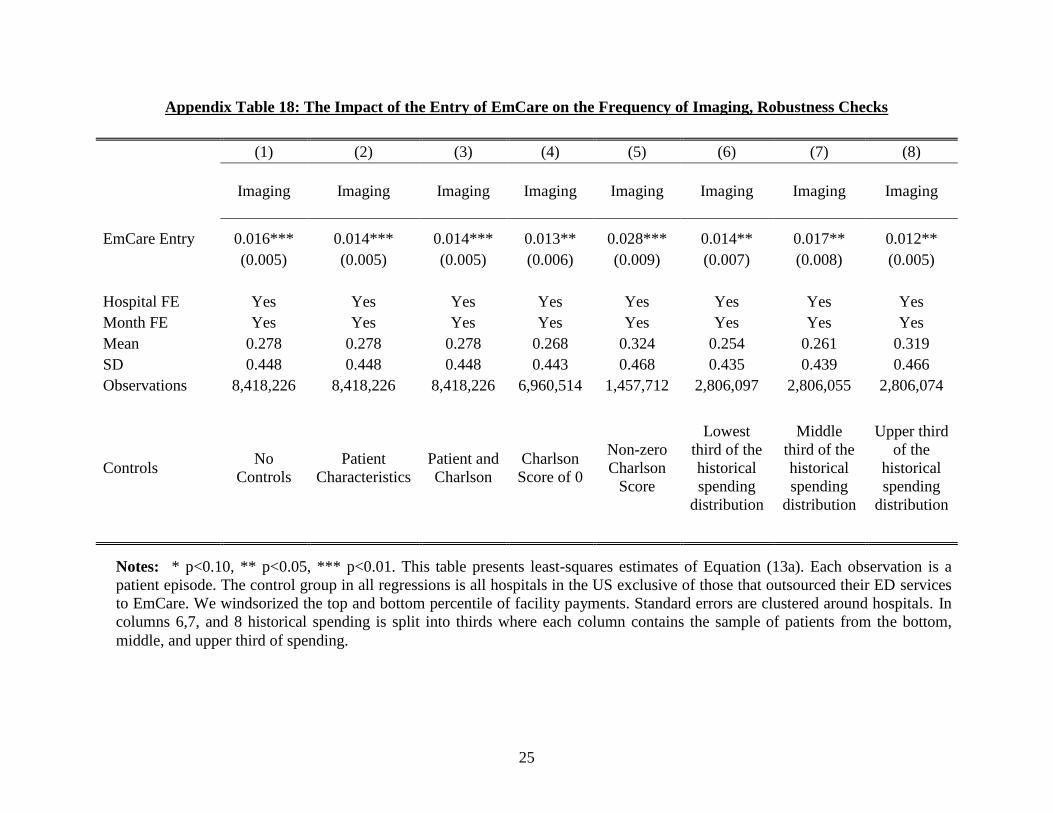
25
Appendix Table 18: The Impact of the Entry of EmCare on the Frequency of Imaging, Robustness Checks
(1) (2) (3) (4) (5) (6) (7) (8)
Imaging Imaging Imaging Imaging Imaging Imaging Imaging Imaging
EmCare Entry 0.016*** 0.014*** 0.014*** 0.013** 0.028*** 0.014** 0.017** 0.012**
(0.005) (0.005) (0.005) (0.006) (0.009) (0.007) (0.008) (0.005)
Hospital FE Yes Yes Yes Yes Yes Yes Yes Yes
Month FE Yes Yes Yes Yes Yes Yes Yes Yes
Mean 0.278 0.278 0.278 0.268 0.324 0.254 0.261 0.319
SD 0.448 0.448 0.448 0.443 0.468 0.435 0.439 0.466
Observations 8,418,226 8,418,226 8,418,226 6,960,514 1,457,712 2,806,097 2,806,055 2,806,074
Controls No
Controls
Patient
Characteristics
Patient and
Charlson
Charlson
Score of 0
Non-zero
Charlson
Score
Lowest
third of the
historical
spending
distribution
Middle
third of the
historical
spending
distribution
Upper third
of the
historical
spending
distribution
Notes: * p<0.10, ** p<0.05, *** p<0.01. This table presents least-squares estimates of Equation (13a). Each observation is a
patient episode. The control group in all regressions is all hospitals in the US exclusive of those that outsourced their ED services
to EmCare. We windsorized the top and bottom percentile of facility payments. Standard errors are clustered around hospitals. In
columns 6,7, and 8 historical spending is split into thirds where each column contains the sample of patients from the bottom,
middle, and upper third of spending.

26
Appendix Table 19: The Impact of the Entry of EmCare on the Frequency of Admissions, Robustness Checks
(1) (2) (3) (4) (5) (6) (7) (8)
Admissions Admissions Admissions Admissions Admissions Admissions Admissions Admissions
EmCare Entry 0.022*** 0.022*** 0.021*** 0.014*** 0.053*** 0.011* 0.016*** 0.035***
(0.007) (0.006) (0.006) (0.005) (0.019) (0.006) (0.005) (0.010)
Hospital FE Yes Yes Yes Yes Yes Yes Yes Yes
Month FE Yes Yes Yes Yes Yes Yes Yes Yes
Mean 0.090 0.090 0.090 0.071 0.181 0.066 0.070 0.134
SD 0.286 0.286 0.286 0.257 0.385 0.248 0.256 0.341
Observations 8,418,226 8,418,226 8,418,226 6,960,514 1,457,712 2,806,097 2,806,055 2,806,074
Controls No
Controls
Patient
Characteristics
Patient and
Charlson
Charlson
Score of 0
Non-zero
Charlson
Score
Lowest
third of the
historical
spending
distribution
Middle
third of the
historical
spending
distribution
Upper third
of the
historical
spending
distribution
Notes: * p<0.10, ** p<0.05, *** p<0.01. This table presents least-squares estimates of Equation (13a). Each observation is a
patient episode. The control group in all regressions is all hospitals in the US exclusive of those that outsourced their ED services
to EmCare. We windsorized the top and bottom percentile of facility payments. Standard errors are clustered around hospitals. In
columns 6,7, and 8 historical spending is split into thirds where each column contains the sample of patients from the bottom,
middle, and upper third of spending.
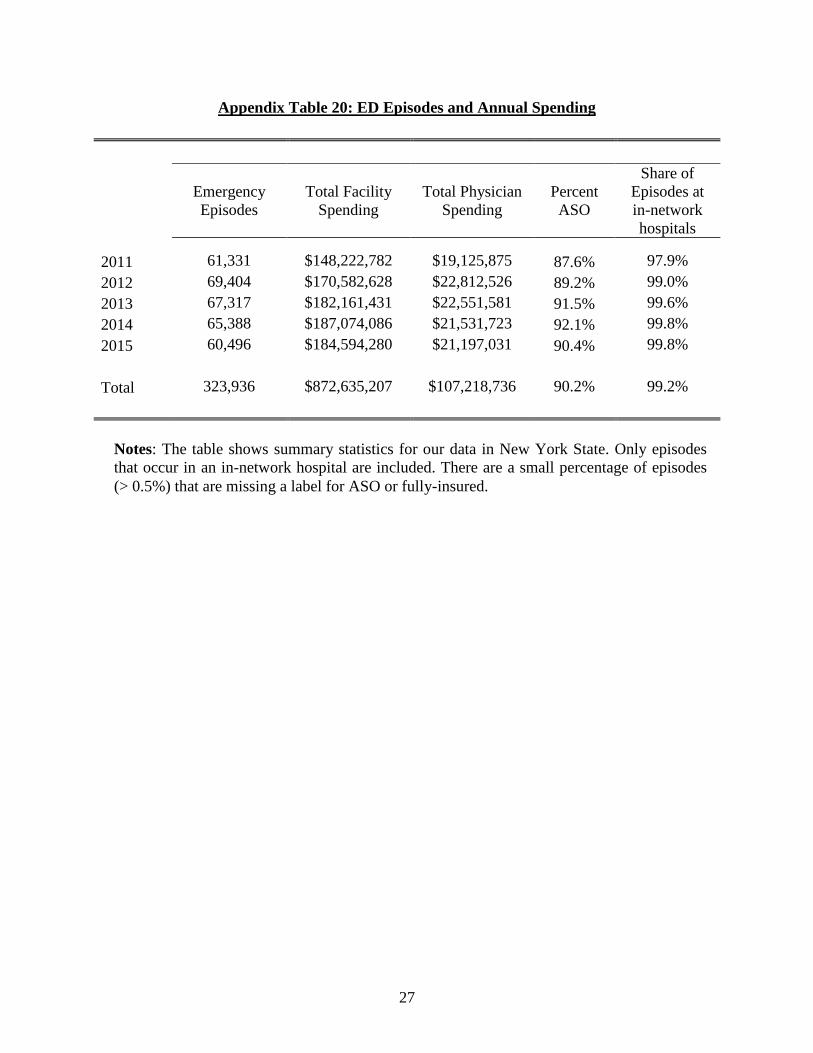
27
Appendix Table 20: ED Episodes and Annual Spending
Emergency
Episodes
Total Facility
Spending
Total Physician
Spending
Percent
ASO
Share of
Episodes at
in-network
hospitals
2011 61,331 $148,222,782 $19,125,875 87.6% 97.9%
2012 69,404 $170,582,628 $22,812,526 89.2% 99.0%
2013 67,317 $182,161,431 $22,551,581 91.5% 99.6%
2014 65,388 $187,074,086 $21,531,723 92.1% 99.8%
2015 60,496 $184,594,280 $21,197,031 90.4% 99.8%
Total 323,936 $872,635,207 $107,218,736 90.2% 99.2%
Notes: The table shows summary statistics for our data in New York State. Only episodes
that occur in an in-network hospital are included. There are a small percentage of episodes
(> 0.5%) that are missing a label for ASO or fully-insured.
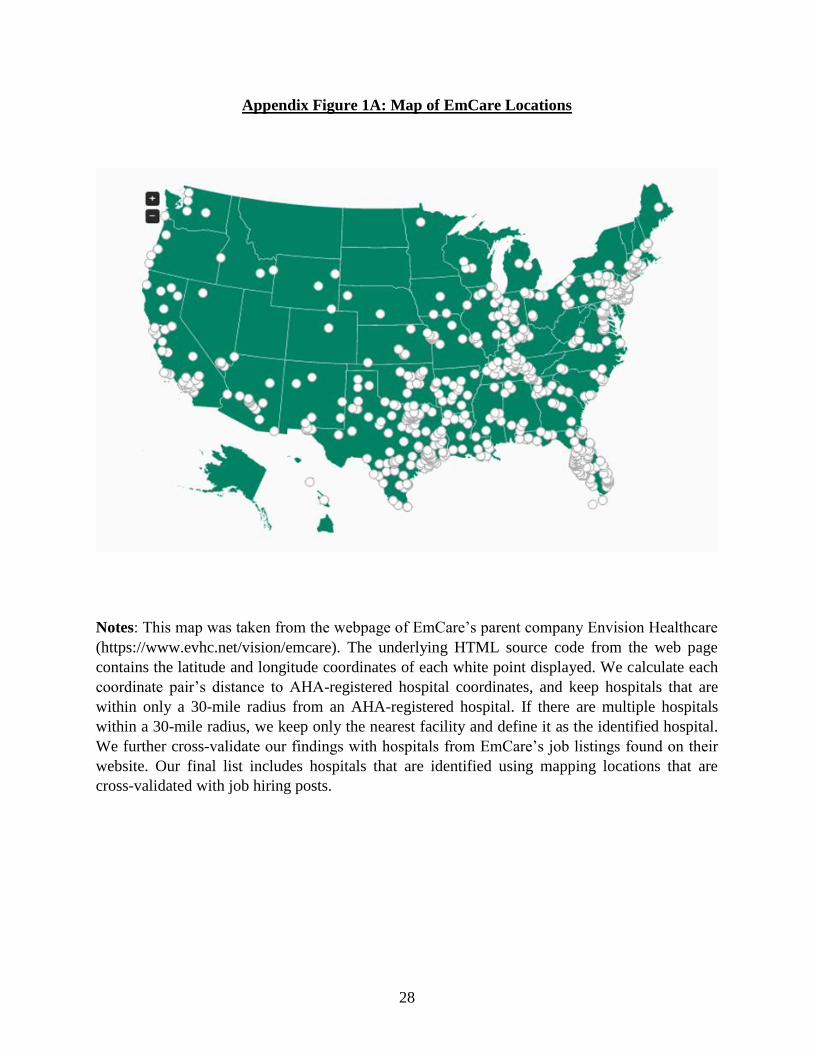
28
Appendix Figure 1A: Map of EmCare Locations
Notes: This map was taken from the webpage of EmCare’s parent company Envision Healthcare
(https://www.evhc.net/vision/emcare). The underlying HTML source code from the web page
contains the latitude and longitude coordinates of each white point displayed. We calculate each
coordinate pair’s distance to AHA-registered hospital coordinates, and keep hospitals that are
within only a 30-mile radius from an AHA-registered hospital. If there are multiple hospitals
within a 30-mile radius, we keep only the nearest facility and define it as the identified hospital.
We further cross-validate our findings with hospitals from EmCare’s job listings found on their
website. Our final list includes hospitals that are identified using mapping locations that are
cross-validated with job hiring posts.

29
Appendix Figure 1B: Map of TeamHealth Locations
Notes: This is a map from a 2009 Morgan Stanley report on TeamHealth. To determine the
hospital locations shown on this map, we used georeferencing in ArcGIS. Georeferencing takes
an image or scanned photo without spatial reference information and aligns it to a map with a
known coordinate system. In our case, we used a map of the United States (obtained here:
https://www.census.gov/geo/maps-data/data/cbf/cbf_state.html), and linked control points from
the US map to the map of TeamHealth’s locations. To link control points, the location of two
identical points on each map are identified (for example, the southern tip of Florida). With
several control points defined, the TeamHealth map is then warped and transformed to overlay
directly onto the known US map. With the map in place, we mark the center of each blue dot as a
hospital location. Because the map now has a defined coordinate system, we are able to obtain
the latitude and longitude from these markers. We subsequently calculate each coordinate pair’s
distance to AHA-identified hospital coordinates, and keep hospitals that are within only a 30-
mile radius from an AHA-identified hospital. If there are multiple hospitals within a 30-mile
radius, we keep only the nearest facility and define it as the identified hospital. We cross-
validate our mapping with hospitals from TeamHealth’s job listings page on their website. Our
final list of hospitals only includes hospitals that are both identified from the map and appear in
job listings.

30
Appendix Figure 2: Example of EmCare Job Listing
Notes: This screen grab is taken from EmCare’s job hiring page.
(https://www.emcare.com/careers/clinical-job-search).

31
Appendix Figure 3: The Distribution of Hospital Out-of-Network Rates, 2011, 2013, and
2015
Notes: The figure shows the distribution of hospital out-of-network rates in years 2011, 2013,
and 2015. There are 3,345 hospitals that appear in each year of the data.

32
Appendix Figure 4A: The Distribution of Out-of-Network Rates at Hospitals where
EmCare Enters, 2011
Notes: The figure shows a histogram of out-of-network rates for hospitals prior to EmCare
entry in 2011. There are a total of 16 EmCare entry hospitals. Each bar shows the percent of
hospitals falling into a given out-of-network rate. The red vertical line is the average of all
EmCare hospitals from 2011-2015.
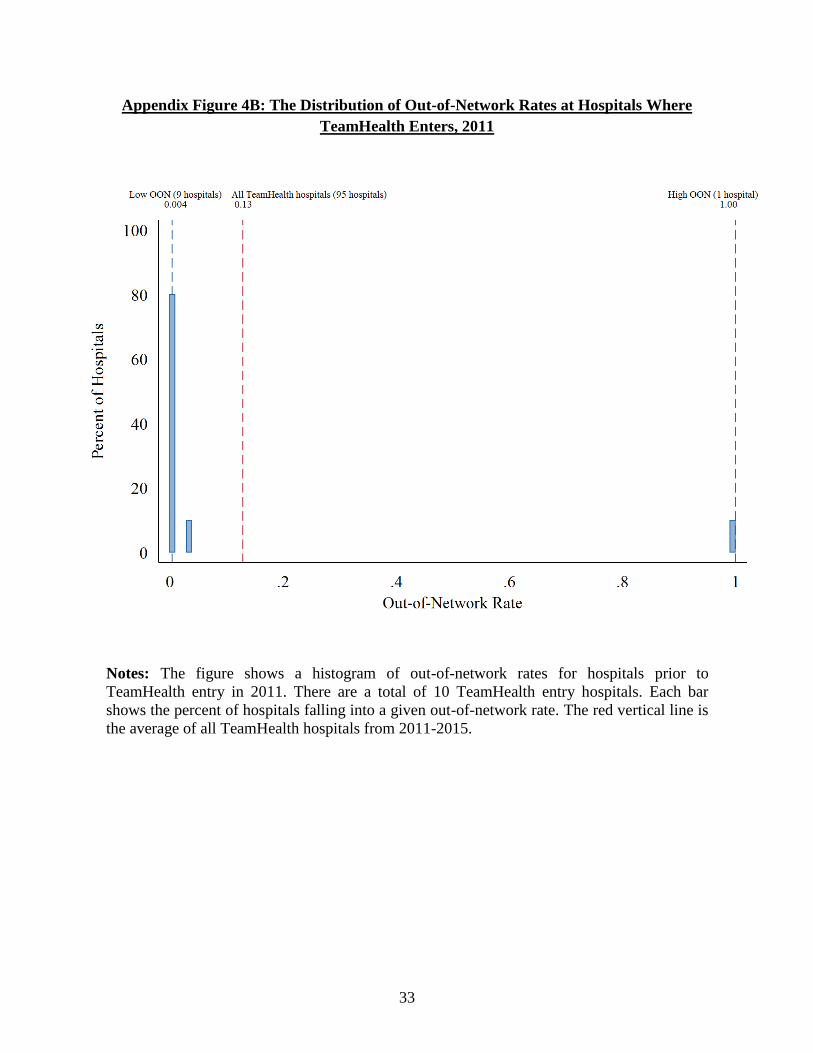
33
Appendix Figure 4B: The Distribution of Out-of-Network Rates at Hospitals Where
TeamHealth Enters, 2011
Notes: The figure shows a histogram of out-of-network rates for hospitals prior to
TeamHealth entry in 2011. There are a total of 10 TeamHealth entry hospitals. Each bar
shows the percent of hospitals falling into a given out-of-network rate. The red vertical line is
the average of all TeamHealth hospitals from 2011-2015.

34
Appendix Figure 5: Out-of-Network Rates at Hospitals Where EmCare Entered

35
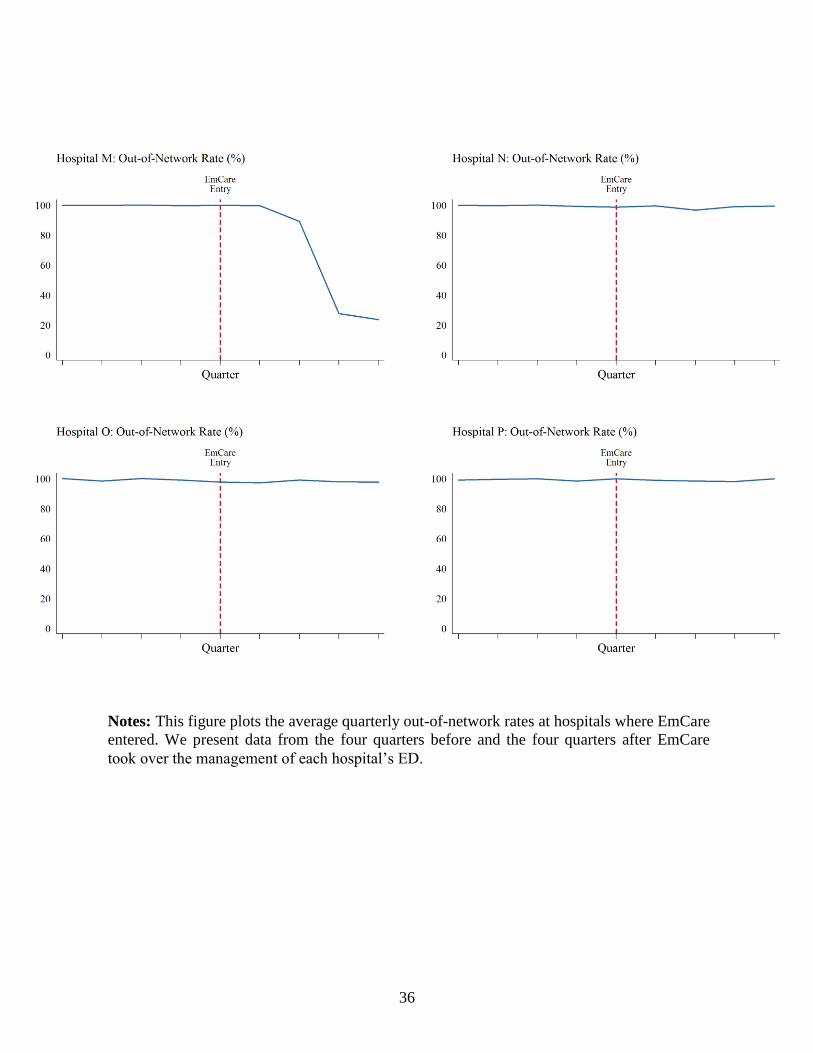
36
Notes: This figure plots the average quarterly out-of-network rates at hospitals where EmCare
entered. We present data from the four quarters before and the four quarters after EmCare
took over the management of each hospital’s ED.

37
Appendix Figure 6: Out-of-Network Rates at Hospitals Where TeamHealth Entered

38
Notes: This figure plots the average quarterly out-of-network rates at hospitals where
TeamHealth entered. We present data from the four quarters before and the four quarters after
TeamHealth took over the management of each hospital’s ED.

39
Appendix Figure 7: EmCare and TeamHealth Entry on Patient Characteristics
Panel A: EmCare Entry on Hospitals’ Averate Charlson Score of Patients
Panel B: EmCare Entry on Hospitals’ Average Patient 6-Month Spending

40
Panel C: TeamHealth Entry on Hospitals’ Average Charlson Score of Patients
Panel D: TeamHealth Entry on Hospitals’ Patients 6-Month Spending History
Notes: The panels plot the monthly average by hospital from 12 months before to 12 months
after EmCare or TeamHealth entered the hospital.