Surplus-value and aggregate concentration in the UK economy
31
1 SURPLUS-VALUE AND AGGREGATE CONCENTRATION IN THE UK ECONOMY, 1987-2009 Vitor Leone Bruce Philp 1 Abstract This paper examines the movements in the Marxian surplus-value rate using a Quantitative Marxist methodology. It examines the relationship between surplus-value and the degree of monopoly power in the UK economy using quarterly data and a proxy for aggregate concentration — the ratio of market capitalisation in FTSE100 firms to market capitalisation in FTSE All Share firms. Two other forces are considered: (i) the size of the ―reserve army‖ of the unemployed; (ii) working class militancy. Our results suggest that increases in the ―reserve army‖ influence the surplus-value rate positively, and that working class militancy is negatively related to changes in the surplus-value rate, indicating that strike action in this period is largely a defensive measure by workers. Finally, our data suggests that rising aggregate concentration (when measured by market capitalisation) exerts a profound, significant and positive effect on the rate of surplus-value. Keywords: Surplus-value, Monopoly Capital, Aggregate Concentration JEL Classifications: D33, B51, C22 Address for correspondence Dr Bruce Philp, Nottingham Business School, Nottingham Trent University, Burton Street, Nottingham, NG1 4BU. Email: [email protected].
Transcript of Surplus-value and aggregate concentration in the UK economy

1
SURPLUS-VALUE AND AGGREGATE CONCENTRATION IN
THE UK ECONOMY, 1987-2009
Vitor Leone
Bruce Philp1
Abstract
This paper examines the movements in the Marxian surplus-value rate using a Quantitative
Marxist methodology. It examines the relationship between surplus-value and the degree of
monopoly power in the UK economy using quarterly data and a proxy for aggregate
concentration — the ratio of market capitalisation in FTSE100 firms to market
capitalisation in FTSE All Share firms. Two other forces are considered: (i) the size of the
―reserve army‖ of the unemployed; (ii) working class militancy. Our results suggest that
increases in the ―reserve army‖ influence the surplus-value rate positively, and that working
class militancy is negatively related to changes in the surplus-value rate, indicating that
strike action in this period is largely a defensive measure by workers. Finally, our data
suggests that rising aggregate concentration (when measured by market capitalisation)
exerts a profound, significant and positive effect on the rate of surplus-value.
Keywords: Surplus-value, Monopoly Capital, Aggregate Concentration
JEL Classifications: D33, B51, C22
Address for correspondence
Dr Bruce Philp,
Nottingham Business School, Nottingham Trent University,
Burton Street, Nottingham, NG1 4BU.
Email: [email protected].

2
1. Introduction
According to Mandel: ‗Marx … considered the discovery of the concept of surplus-
value, representing the sum total of profits, interests and rents of all parts of the
bourgeois class, as his main theoretical discovery‘ (1976, p.51). Its role was important
for two primary reasons: (i) positively, surplus-value and the level of the organic
composition of capital (OCC) define Marx‘s rate of profit; ceteris paribus, a rising
OCC generates a tendency for the rate of profit to fall, ultimately leading to the
demise of capitalism; (ii) surplus-value plays a normative role in Marx‘s theory,
connected as it was to his theory of exploitation. Although there have been theoretical
and empirical problems with these principles, to be discussed presently, it is clear that
the rate of surplus-value has a central role in Marxian economics.
The first of these insights — the (methodologically) positive claim that the theory of
surplus-value and the OCC explain capitalist crisis — faces a historical problem. In
spite of some Marxian predictions to the contrary it is a matter of empirical fact that
capitalism has endured and expanded in the second half of the twentieth century.
Events such as the Great Depression (1929-32), and the more recent global financial
crisis, suggest that capitalism is periodically troubled, but ongoing systematic
expansion — manifest in the emerging BRIC economies of Brazil, Russia, India and
China — cast doubt over the hypothesis that Capitalism‘s end is inevitable in the
foreseeable future. There are many explanations for the failure of a falling rate of
profit (FRP) crisis to materialise. Some have proposed that orthodox Marxian theory,
on which the falling rate is based, is flawed because of underlying problems in the
formulation of value, and differences between value and money rates of profit
(Steedman, 1977). Since capitalists are motivated by maximising money profits

3
consideration of value rates are irrelevant. This critique is also connected to the claim
that capitalism is exploitative, the latter referring to a situation where an individual,
group or class, works longer than is necessary to produce the equivalent of what they
consume. Of course, the claim that capitalism is exploitative is one of the foundations
of Marxian economics and radical political economy.2 However, work in the last half-
century has suggested that (contra Marx) the rate of surplus-value is not necessarily
equal to the rate of exploitation, though capitalist exploitation is a necessary condition
for the existence of positive profits (see Morishima, 1973, Roemer, 1981). Since the
present paper adopts an empirical macroeconomic approach it is not our intention to
dwell on these issues, save to note that we endorse the Fundamental Marxian
Theorem, and will calculate the rate of surplus-value using nominal values.3
Orthodox Marxian economists have offered explanations as to why the FRP has not
materialised, in the sense of causing a fundamental crisis of capitalism. In Marx‘s
original work various factors — e.g. more intense exploitation of labour, the impact
of foreign trade, and the increase in share capital — offset this underlying tendency
(1981, pp.339-348). Value-theoretic problems notwithstanding this would be
consistent with the contemporary expansion of capitalism into the BRIC economies,
and rising share capital associated with big business.
In the 1960s and 1970s a second strand of radical thinking, which had its roots in
Lenin‘s theory of imperialism, also began to influence the New Left. Led by Baran &
Sweezy (1966), this approach attributed the success of capitalism (in terms of
maintaining and increasing profits) to growing concentration in industry, leading to
increasing monopoly power, thereby generating a tendency for surplus to rise.4 In

4
common with Marx they view capitalism as crisis-prone, but the notion of surplus
employed, and the mechanism whereby crisis is generated, is different from that of
Marx. Whereas Baran & Sweezy locate crisis in underconsumption emanating from
an inability of capitalist society to absorb surplus, the latter formulation is based on
surplus-value production and a trajectory in the rate of profit driven by the OCC.
Empirical evidence, however, began to suggest that growing concentration of control
of the means of production was no longer the trend in the UK economy: indeed, de-
concentration characterised UK industrial production in the 1980s (Henley, 1991).
Others have suggested that Baran & Sweezy overstated the degree to which modern
corporations could influence prices and profit margins: ‗Mere size does not give
monopoly power, in view of the multi-product character of most huge enterprises‘
(Howard & King, 1992, p.123). It is in this context that we will explore the
relationship between corporate profits, aggregate concentration and class conflict in
the contemporary the UK economy.
The present paper begins by estimating the level of surplus-value (as opposed to
Baran & Sweezy‘s ―surplus‖) in the UK economy, using quarterly data 1987-2009.
Among the forces which it is hypothesised drive such changes, three have been
selected as elements in our study: working class militancy (measured by aggregate
strike days), growth in the ―reserve army‖ of the unemployed, and changes in
aggregate concentration measured by the ratio of market capitalisation of FTSE100
firms to market capitalisation of FTSE All Share firms. Increasing surplus-value,
which measures changes in class-based distribution of income in the capitalist sector,
is hypothesised to be positively related to rising aggregate concentration and

5
unemployment, and negatively related to working class militancy (measured through
strike action). In examining these hypotheses the paper is structured as follows: in
Section 2 we offer a macroeconomic model of surplus-value and estimate its rate for
the UK economy; in Section 3 we shall review the literature on market concentration
and profits, before defining (and calculating) the measure of aggregate concentration
to be used in our statistical analysis; in Section 4 we outline the Quantitative Marxist
methodology adopted, and apply OLS regression to explain changes in the rate of
exploitation as a function of the variables selected (including changing aggregate
concentration). In concluding we argue that monopolising tendencies are an important
dynamic in driving changes in the distribution of income, and there exists an
important statistical relationship between changing aggregate concentration and
changes in the Marxian surplus-value rate (in the period investigated). Secondly, the
expanding or contracting nature of the reserve army of the unemployed also
influences the changing rate of surplus-value, though strike activity is of limited
importance (in terms of statistical significance and size of the coefficient). Finally, we
reflect on the methods we have used, claiming that Quantitative Marxism can make a
valuable contribution to our understanding of contemporary society.
2. Surplus-Value and Market Structure
There have been a number of significant attempts to measure Marxian categories and
their determinants (Weisskopf, 1979, Moseley, 1985, 1988, Gouverneur, 1990,
Shaikh & Tonak, 1994, Duménil, 2002). Of particular note is the work of Gouverneur
(1990), who estimated the rate of surplus-value (hereafter s ) for Germany, the UK,
France and the US over the period 1960-1986. At the outset of his analysis he points
to two ways of measuring the rate of surplus-value: (i) in terms of the ratio of total

6
surplus-value to total variable capital (which is the measure we adopt); and, (ii) as the
ratio of surplus-value to the value of labour power per productive wage earner (which
is the method Gouverneur uses). The latter approach allows the researcher to
decompose changes in the rate of surplus-value into its constituent elements (e.g.
absolute and relative surplus-value production); however, since this is not central to
the present paper we will use the former method, expressing s in terms of total
surplus-value and total variable capital.
In order to define surplus-value, and illustrate the potential implications of monopoly
power, let us take a simplified capitalist macroeconomy. Commodities are used as
inputs and combined with labour to produce outputs. Assume that the gross value of
aggregate output ( P ) is given by the sum of unit prices of commodities (the n1
vector p ) multiplied by their gross output (the 1n vector y ), i.e. pyP . The
1n vector of produced commodity inputs (analogous to the circulating elements of
constant capital in Marx‘s system) required to produce the vector of gross outputs is
given by x . And, the aggregate money wage in the capitalist economy (W ), which is
equivalent to aggregate variable capital, is spent on subsistence goods (given by the
1n vector b ) multiplied by the vector of prices. That is pbW . In such a system
the gross value of aggregate capitalist output is determined by the costs of production,
to which a rate of profit ( r ) is added. This gives us the following macroeconomic
model of the capitalist macroeconomy:
))(1( pbpxpy rP (1)
By multiplying the elements of the right-hand side of (1) we can derive aggregate
profits, )( pbpx rR . This is analogous to total surplus-value in a Marxian sense,

7
while variable capital advanced in such a macroeconomy is equal to aggregate wages
of those employed in the capitalist sector. We therefore define s thus:
pb
pbpx )(
r
W
Rs (2)
The role of growing concentration of control of the means of production in such a
system is twofold. First, if monopoly power is growing producers would be able to
charge above-competitive prices. The link between money wages and the subsistence
vector is important in the case of rising monopoly power and associated price rises. If,
for a given aggregate money wage level, prices of consumption goods increase
(through, for example, rising monopoly power), the subsistence goods workers can
purchase will fall. In other words, in equation (2), if pbW then rising prices implies
falling workers‘ consumption. The rising prices raise the numerator of s while the
denominator remains unchanged, thus shifting the distribution of income away from
workers in favour of capitalist.
Secondly, rising concentration vis-à-vis the means of production may also entail
growing monopsony power by capitalist firms over the workforce. This will be
accentuated if worker cohesion is diminishing, for example as a consequence of
legislation aimed at curbing the power of trade unions. The ―price effect‖ of high
seller concentration is likely to be picked up in cross-sectional analyses of particular
industries (see the discussion of the market concentration doctrine in Section 3,
below); however the ―cost effect‖ vis-à-vis wage impacts on the labour market and
macroeconomy as a whole, which can be driven by conglomerates, is likely to be
spread through the economy as a whole.

8
In estimating s there are further theoretical considerations which relate to the
productive-unproductive labour distinction. In the model outlined above we are
assuming that the economy is capitalist, i.e. profits are generated from all labour
employed by capital in the system (since pbr is a part of profit in equations 1 and 2).
However, we need to be clear that the model in equations (1) and (2) is for the
capitalist macroeconomy only: in estimating s we only consider the wages of labour
directly involved in capitalist production, i.e. we exclude public sector wages and the
self-employed (or ―mixed‖ income).5 In some sense we are treating public sector
workers as ―unproductive‖, though non-market workers would perhaps be a more
satisfactory description. Moseley (1985) goes further: in estimating s for the US
economy he argues that certain categories of worker employed by capitalists — e.g.
those working as managers or accountants — do not produce surplus-value, and thus
their wages should be deducted from variable capital. In the presence of such workers
this entails that the level of s will be revised up through the method of calculation.
However, while we accept the justification for removing public sector wages from the
estimation process, we do not use the productive-unproductive labour distinction, as
applied by Moseley, for the following reason: once a complex technical division of
labour has taken place it is arbitrary to ascribe the source of profit, or surplus-value
creating activity, to individuals involved in particular sub-processes when all such
workers are employed in capitalist firms, under capitalist production relations (for
further discussion of the problems with the productive-unproductive distinction see
Laibman, 1992).
We estimate s using data extracted from the Office for National Statistics (ONS)
website and other sources of UK government statistics (a full list of data sources is
9
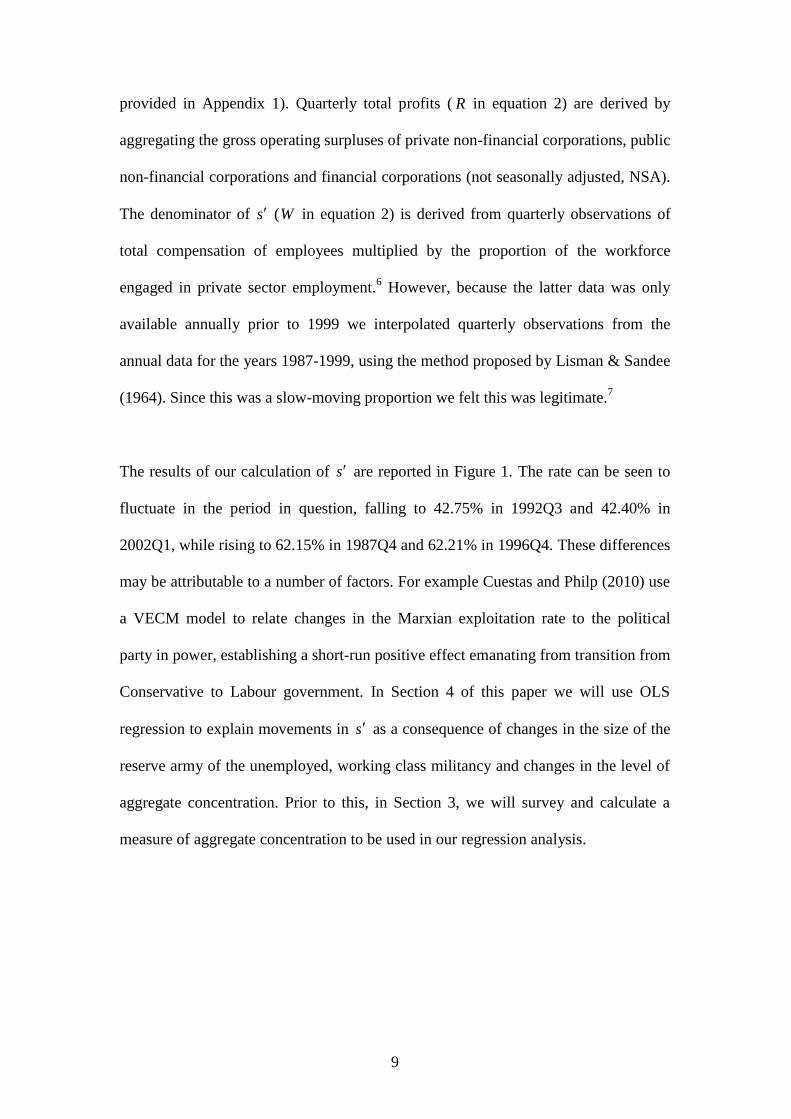
provided in Appendix 1). Quarterly total profits ( R in equation 2) are derived by
aggregating the gross operating surpluses of private non-financial corporations, public
non-financial corporations and financial corporations (not seasonally adjusted, NSA).
The denominator of s (W in equation 2) is derived from quarterly observations of
total compensation of employees multiplied by the proportion of the workforce
engaged in private sector employment.6 However, because the latter data was only
available annually prior to 1999 we interpolated quarterly observations from the
annual data for the years 1987-1999, using the method proposed by Lisman & Sandee
(1964). Since this was a slow-moving proportion we felt this was legitimate.7
The results of our calculation of s are reported in Figure 1. The rate can be seen to
fluctuate in the period in question, falling to 42.75% in 1992Q3 and 42.40% in
2002Q1, while rising to 62.15% in 1987Q4 and 62.21% in 1996Q4. These differences
may be attributable to a number of factors. For example Cuestas and Philp (2010) use
a VECM model to relate changes in the Marxian exploitation rate to the political
party in power, establishing a short-run positive effect emanating from transition from
Conservative to Labour government. In Section 4 of this paper we will use OLS
regression to explain movements in s as a consequence of changes in the size of the
reserve army of the unemployed, working class militancy and changes in the level of
aggregate concentration. Prior to this, in Section 3, we will survey and calculate a
measure of aggregate concentration to be used in our regression analysis.

10
0
0.1
0.2
0.3
0.4
0.5
0.6
0.7
0.8
0.9
1
19
86
Q1
19
87
Q1
19
88
Q1
19
89
Q1
19
90
Q1
19
91
Q1
19
92
Q1
19
93
Q1
19
94
Q1
19
95
Q1
19
96
Q1
19
97
Q1
19
98
Q1
19
99
Q1
20
00
Q1
20
01
Q1
20
02
Q1
20
03
Q1
20
04
Q1
20
05
Q1
20
06
Q1
20
07
Q1
20
08
Q1
20
09
Q1
Surplus-Value C100 MV
Figure 1: The rate of surplus-value and aggregate concentration, 1987-2009
3. Monopoly Power and Profits
Economists have long been interested in the relationship between concentration of
production and profits. For example, in orthodox microeconomic theory pure
monopoly is seen as a source of abnormal profit, and there is recognition — via
empirical research — that monopoly power can lead to higher pries, reduced output
and a monopoly welfare loss.8 Government regulation of monopoly, too, is
widespread. The scope of legislation has gradually expanded since 1890 (in the US),
and 1948 (for the UK), though the latter is now regulated within an EU framework.
Finally, the link between legal frameworks, case studies and economic context has
been considered extensively within the structure-conduct-performance paradigm,
employed within the Harvard Approach to industrial economics. Specifically the
―market concentration doctrine‖ (MCD) — proposed by Mann (1966) — suggests
that high degrees of seller concentration may facilitate collusion, thereby creating the
conditions for higher profits in those industries.

11
Empirical evidence relating to the MCD has provided mixed results. Using US data,
Bain (1951, 1956), Mann (1966) and Collins & Preston (1968) found that
concentration has a small, but statistically significant, effect on profitability. Berger &
Hannan‘s study (1998) found that US banks in highly concentrated markets were less
efficient, offering further support for the MCD. Other studies have suggested an
alternative explanation: individual firms capture market share because they are
efficient, concurrently making above-average returns. This ―efficiency hypothesis‖
has been tested by Smirlock et al. (1984), and by Eckard (1995). In each case they
found a positive relationship between profits and market share, but no significant
relationship between profits and concentration.
Industry-level analysis is similarly ambiguous in the UK case. Hitiris (1978) found
that industry price-cost margins were positively related to high degrees of seller
concentration, whereas Gerowski (1984) argues that price-cost margins are complex
and no simple relationship between seller concentration and profitability can be found.
Clarke et al (1984) examined UK manufacturing, arguing that if the efficiency
argument holds we would expect significant differences in the profit rates of small
and large firms within concentrated industries. However, contra the efficiency
hypothesis, they found little difference in the profit rates of large and small firms in
highly concentrated industries. More recent research lends some support to the MCD
in the case of the banking industries in France, Germany, Italy, Spain and the UK in
the 1990s (Goddard et al, 2004). Other recent work has investigated a panel of US
data, 1963-1992, finding a positive relationship between price-cost margins and
market concentration, and that this is weakest for increasing-concentration industries
(Dickson, 2007).
12
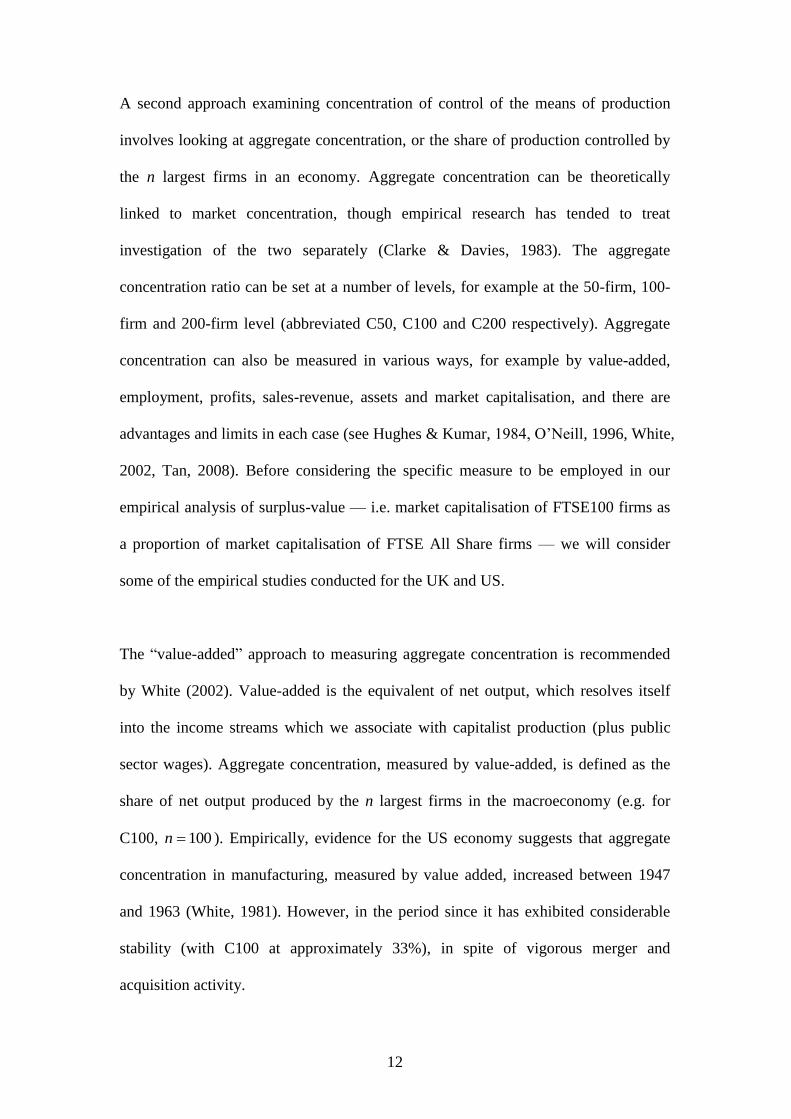
A second approach examining concentration of control of the means of production
involves looking at aggregate concentration, or the share of production controlled by
the n largest firms in an economy. Aggregate concentration can be theoretically
linked to market concentration, though empirical research has tended to treat
investigation of the two separately (Clarke & Davies, 1983). The aggregate
concentration ratio can be set at a number of levels, for example at the 50-firm, 100-
firm and 200-firm level (abbreviated C50, C100 and C200 respectively). Aggregate
concentration can also be measured in various ways, for example by value-added,
employment, profits, sales-revenue, assets and market capitalisation, and there are
advantages and limits in each case (see Hughes & Kumar, 1984, O‘Neill, 1996, White,
2002, Tan, 2008). Before considering the specific measure to be employed in our
empirical analysis of surplus-value — i.e. market capitalisation of FTSE100 firms as
a proportion of market capitalisation of FTSE All Share firms — we will consider
some of the empirical studies conducted for the UK and US.
The ―value-added‖ approach to measuring aggregate concentration is recommended
by White (2002). Value-added is the equivalent of net output, which resolves itself
into the income streams which we associate with capitalist production (plus public
sector wages). Aggregate concentration, measured by value-added, is defined as the
share of net output produced by the n largest firms in the macroeconomy (e.g. for
C100, 100n ). Empirically, evidence for the US economy suggests that aggregate
concentration in manufacturing, measured by value added, increased between 1947
and 1963 (White, 1981). However, in the period since it has exhibited considerable
stability (with C100 at approximately 33%), in spite of vigorous merger and
acquisition activity.
13
―Employment‖ and ―sales‖ constitute two further methods of measuring aggregate
concentration. The former measure is represented by the distribution of employment,
or the proportion of workers employed by the largest n companies. This measure, like
aggregate wages or payroll, is simply a component part of value-added. However,
faced with the practical problems of limited data it is a measure which has been used
extensively, especially in the UK case. The evidence of White (1981, 2002) shows
low and stable levels of aggregate employment concentration in the US economy
(using a number of values for n). In the UK case Hughes & Kumar (1984) suggest
greater fluctuations in private sector employment concentration, with a rise in C100
between 1968 and 1975 (from 34.9% to 39.8%), and a slight fall between 1975 and
1980 (to 37.3%). More recent work by Dietrich (2003) shows that employment
concentration tended to fall in the UK economy between 1979 and 1997, whether
measured by C20, C50 or C100. Sales measures of aggregate concentration in the US
economy have been constructed by Nissan and Caveny (1993). Using a variety of
measurement indexes they suggest an overall trend of rising concentration in sales in
the period 1967-1990, while research by Dietrich (2003) suggests this pattern was
mirrored between 1979-1997 for the UK economy.
Availability of data is a particular problem when seeking to estimate the trajectory of
aggregate concentration in the UK economy. This is compounded by the fact we are
seeking to examine the relationship between aggregate concentration and the change
in s , measured quarterly. Value-added, employment or sales data is not readily
available to allow us to calculate aggregate concentration in this way. Our solution is
to use a measure of C100 proposed by Hughes & Kumar — the ratio of market
capitalisation of the 100 largest companies listed on the UK Stock Exchange (FTSE

14
100) to market capitalisation of all companies (FTSE All Share). The advantage of
this measure (C100 by market capitalisation, abbreviated M ) is that it is a feasible
proxy of aggregate concentration which can be calculated quarterly using information
extracted from Thompson DataStream. The disadvantage of this measure is that it is
imperfect because firms listed on the UK stock market include some which are
ostensibly non-UK companies in terms of production activity and sales. This problem
manifests itself for many empirical investigations (in labour economics, industrial
organisation etc.) since the globalised nature of contemporary competitive capitalism
exposes the weakness of (methodologically) closed-system models.
Our estimates of M are presented in Figure 1. It is noteworthy that there is a
tendency for M to rise during much of the period, from 68.36% in 1988Q2, to
87.77% in 2008Q4 (hence, because the series is non-stationary we use lM as an
independent variable in our regression). The issue, to be discussed in the next section,
is whether changes in concentration of control of the means of production impacts on
the distribution of income in the capitalist sector, measured by s .
4. Empirical Analysis
4.1 Quantitative Marxism, Methodology and Data
In our empirical analysis we adopt a QM approach, i.e. we use quantitative data to
examine and test Marxian theoretical propositions and models. In the particular
application of QM we adopt we apply basic OLS regression, familiar from
mainstream econometrics, to investigate the relationship between distribution of
income and growing concentration of control of the means of production in the UK
economy. Plainly, readers of this Journal are likely to be familiar with the critiques of

15
mainstream economics and its ubiquitous application using econometrics. These
critiques are diverse, ranging as they do from those which suggest that mainstream
economics took mathematisation and the application of econometrics too far
(McCloskey, 1986), to those who see more fundamental problems lying behind such
an approach to social scientific investigation. It is our aim, in this section, to show
how multiple regression techniques can be used to explore issues of traditional
interest to Marxists. This should not be taken to infer that other quantitative
approaches do not have equal validity in social scientific research, nor that the
extensive range of qualitative methods open to investigators have less validity.
Mainstream economists have taken econometrics too far — emphasising statistical
complexity over economic relevance — but this should not prevent Marxist
economists from exploring these techniques alongside other methods of enquiry.
Data considerations are also important; broadly, there are three approaches which can
be adopted in selecting the data for examination (Dunne, 1991, 9-10): (i) researchers
can attempt to measure Marxian categories directly; (ii) orthodox data could be
adjusted to make it closer to the required Marxist categories; (iii) we can use Marxist
theory to attempt to explain the movement in the orthodox statistics. Of these three
approaches the first is most difficult in terms of data gathering, leading to problems
with small samples and a lack of aggregate evidence. The second approach has
offered important insights into capitalist economies (e.g. Gouverneur, 1990), but
often the categories map unsatisfactorily and the most appropriate types of data are
gathered infrequently.9 The final approach is least problematic in terms of data
requirements, but the specific Marxian insights we can garner are limited (though, we
contend, not eradicated). The implication is that no one method of data acquisition is

16
unproblematic, and we would concur with Dunne who suggests: ‗these approaches
should complement each other, using different types of data to answer different
questions at different levels of abstraction‘ (1991, 9-10).
In examining the specific case of the relationship between changing concentration of
control over the means of production in the UK economy and the rate of surplus-
value we have taken orthodox statistics. The data used to measure exploitation was
outlined at the end of Section 2, and the data used to provide our market capitalisation
measure of aggregate concentration was outlined at the end of Section 3. In the
econometric model below we use two further explanatory variables which are
intended to capture aspects of the class struggle. First, in order to proxy working class
militancy we shall consider strike action (measured by the aggregate number of days
lost due to industrial action, S ) as a variable in our regression. Although some favour
―number of strikes‖ as a proxy for militancy (e.g. Arestis & Biefang-Frisancho
Mariscal, 1998) many strikes are not registered, leading to measurement problems.
Moreover, the number of strikes makes no distinction between long strikes involving
many workers and small, local disputes. One advantage of our approach is that it
gives greater weight to disputes involving large number of workers. Secondly, the
relationship between surplus-value and unemployment — or the size of the ―reserve
army‖ — is also an important dynamic in the distribution of income (between
capitalists and their workers). In order to estimate the association between
unemployment and s we will use the claimant count (U ) to measure the size of the
reserve army of the unemployed. Our use of claimant count, rather than an
unemployment rate, stems from our earlier decision not to consider self-employed
income, instead focussing on the gross operating surpluses of companies and

17
compensation of employees working in the capitalist sector. If we used an
unemployment rate as an independent variable the self-employed would be included
in the denominator which, given they are exploitation-neutral, would provide a less
satisfactory measure.
4.3 Econometric Model, Estimation and Results
In the present paper we are interested in how changes in the distribution of income in
capitalist production — expressed as a Marxian surplus-value rate — are affected by
changes in the balance of class forces, including the extent of big business. The
dependent variable is change in the rate of surplus-value, 1 ttt sss . We
hypothesise that this is connected to aggregate strike days, and that this relationship
may be non-linear. Thus we take the natural log of aggregate strikes in the previous
period, 1tS , as one of our independent variables. Secondly, we hypothesise a
relationship between changes in the rate of surplus-value and unemployment. As
unemployment increases this creates the conditions for changing the distribution of
income in favour of capitalists. Again, we speculate that this relationship may be non-
linear so we recalculate the series in terms of natural logs, lU , and use 1 tlU as an
independent variable in our regression. Finally, as discussed in Section 3, we
hypothesise that changing aggregate concentration changes the distribution of income
in capitalist production with, for example, rising aggregate concentration leading to
an increasing rate of surplus-value. This relationship may be non-linear, hence we
transform the series M into natural logs and examine the difference, i.e. lM , as
another independent variable.10
Our hypothesis, therefore, is that:

18
lM)lUf(lSs ttt ,, 11 (3)
The OLS regression results for equation (3) are presented in Table 1. The diagnostic
tests suggest that the model is plausible, reflected in a low probability value for the F-
statistic. The Durban Watson statistic indicates no problems of first order serial
correlation. Finally, the adjusted R-squared is as expected: the model explains some
of the change in s but much of it remains unexplained since the social system is
complex and we are using proxies which are imperfect. Nevertheless, we have found
statistically significant associations. There is a tendency for s to fall through the
period in question, manifest with a negative coefficient for the constant. The positive
coefficient for 1tlS suggests that strike action is unsuccessful and/or defensive since
strikes are associated with rising surplus-value in the subsequent period. This lends
weight to the thesis that unions were, in some sense, rendered impotent by the anti-
union legislation enacted by the Conservative governments from 1979-1997. The
coefficient for 1 tlU indicates that rising levels of unemployment are associated
with increases in the rate of surplus-value in the subsequent period, as we would
expect. Finally, the movement in aggregate concentration also produced the results
we would expect: growing concentration in control over the means of production
( 0lM ) changes the distribution of income within capitalist production in favour
of capitalists, manifest as a rising rate of surplus-value in the subsequent period.

19
Variable Coefficient Std. Error t-Statistic Prob.
C -0.02728 0.015223 -1.791690 0.0766
1tlS 0.00537 0.003014 1.781443 0.0783
1 tlU 0.17327 0.048044 3.606468 0.0005
lM 0.63231 0.247881 2.550860 0.0125
R-squared 0.183094 Mean dependent var -0.00055
Adjusted R-squared 0.155245 S.D. dependent var 0.033417
F-statistic 6.574512 Durbin-Watson stat 2.189956
Prob(F-statistic) 0.000462
Table 1: Determinants of ts , 1987Q1 to 2009Q4
Before concluding, let us now consider some of the other approaches and models we
considered when examining the relationship between surplus-value and concentration
of control over the means of production. After running our initial model we also
attempted a parsimonious approach, introducing variables above, lagged for up to
four periods, as well as additional variables. For example we included growth in GDP
(which may be considered an important independent variable in a ―Smithian‖
framework). However, while the additional variables improved the R-squared (as
would be expected), growth rates emerged as insignificant.11
In addition we
considered a model which did not transform the series using natural logs, i.e.
M)Uf(Ss ttt ,, 11 . In this case the constant and 1tS ceased to be significant (at
the 10% level), and the diagnostics suggested an inferior fit. We believe this indicates
our preconception that relationships between variables may be non-linear is,
accordingly, justified.12
5. Conclusion
Movements in the rate of surplus-value can be explained by a number of forces. In the
present study we have focussed on three: the impact of strike action, the effect of

20
changes in the size of the ―reserve army‖ of the unemployed, and changing levels of
aggregate concentration among UK listed companies. The results were significant.
After a raft of anti-union legislation in the 1980s, strike action seems to have become,
largely, a defensive measure, since strikes in the previous period are associated with
rising surplus-value in the next. Secondly, the relationship between unemployment
and surplus-value is as expected: an increase in unemployment in the previous period
manifests as rising surplus-value in the next. Finally, and most interestingly, we
found rising levels of aggregate concentration among UK companies in the period
1987-2009, and that this appeared to produce a monopoly power effect, whereby the
rate of surplus-value rose within capitalist production. Monopoly capitalism, it would
seem, is ascendant.
Our empirical contribution notwithstanding, we would like to conclude with some
reflection on the approach we have adopted. It is our contention that we have
provided an important and interesting insight into the contemporary UK economy
using a QM approach. By using UK government data, and financial data extracted
from Thompson DataStream, we have examined empirical regularities and found that
they accord, convincingly, with our prior theoretical propositions. This should not be
taken to imply that UK government data is always suitable to investigate Marxian
categories, or that regression is a ubiquitous method which is universally
appropriate.13
Econometrics is just one method, and other statistical approaches are
valid and appropriate for social scientific research. Moreover, qualitative research is
extremely important, both in its own right and alongside quantitative investigation.
Our methodological claim, thus, is minimal: econometrics can be used as a tool of
Marxian investigation, but its use should not be ubiquitous. And, in the particular case
21
we have investigated — the relationship between the rate of surplus-value, union
militancy, unemployment and aggregate concentration — the results this approach
has uncovered have been insightful.

22
References
Arestis, P. and Biefang-Frisancho Mariscal, I. 1998. Capital shortages and
asymmetries in UK unemployment, Structural Change and Economic Dynamics,
vol. 9, 189-204.
Bain, J. 1951. Relation of profit rate to industry concentration: American
manufacturing 1936-1940, Quarterly Journal of Economics, vol. 65, 293-324
Bain, J. 1956. Barriers to New Competition. Cambridge, Mass., Harvard University
Press
Baran, P., and Sweezy, P. 1966. Monopoly Capital: An Essay on the American
Economic and Social Order, London, Pelican
Berger, A. and Hannan, T. 1998. The efficiency cost of market power in the banking
industry: a test of the quiet life and related hypotheses, Review of Economics
and Statistics, vol. 80, 454-465
Chow, G. 1960. Tests of equality between sets of coefficients in two linear
regressions, Econometrica, vol. 28 (3), 591–605
Clarke, R. and Davies, S. 1983. Aggregate concentration, market concentration and
diversification, Economic Journal, vol. 93, 182-192
Clarke, R., Davies, S. and Waterson, M. 1984. The profitability-concentration relation:
market power of efficiency? Journal of Industrial Economics, vol. 32, 435-450
Collins, N. and Preston, L. 1968. Concentration and Price-Cost Margins in
Manufacturing Industries, Los Angeles, University of California Press
Cuestas, J. and Philp, B. 2010. Exploitation and the class struggle. Nottingham Trent
University Discussion Papers in Applied Economics and Policy 2010/6, April.
Cowling, Keith. and Mueller, D. 1978. The social costs of monopoly, Economic
Journal, vol. 88, 77-87

23
Dickson, V. 2007. Concentration history and market power in US manufacturing
industries, Applied Economics, vol. 39, 2049-2055
Dietrich, M. 2003. Giant firms in the information economy. Sheffield Economic
Research Paper Series, 2003006, December
Duménil, G. 2002. The profit rate: where and how much did it fall? Did it recover?
Review of Radical Political Economics, vol. 34 (4), 437-461
Dunne, P. 1991. An Introduction to Quantitative Marxism, in Dunne, P. (ed.),
Quantitative Marxism, Cambridge, Polity Press
Eckard, E. 1995. A note on the profit-concentration relation, Applied Economics,
vol.27, 219-223
Freeman, A., Kliman, A. and Wells, J. (eds.) 2004. The New Value Controversy and
the Foundations of Economics, Cheltenham, Edward Elgar
Foley, D. 1986. Understanding Capital: Marx’s Economic Theory, Cambridge, Mass.,
Harvard University Press
Geroski, P. 1981. Specification and testing the profits-concentration relationship:
some experiments for the UK, Economica, vol. 48, 279-288
Goddard, J., Molyneux, P. and Wilson, J. 2004. Dynamics of growth and profitability
in banking, Journal of Money, Credit and Banking, vol. 36 (6), 1069-1090.
Gouverneur, J. 1990. Productive labour, price/value ratio and rate of surplus value:
theoretical viewpoints and empirical evidence, Cambridge Journal of
Economics, vol. 14, 1-27
Harberger, A. 1954. Monopoly and Resource Misallocation. American Economic
Review, vol. 45, 77-87
Hitiris, T. 1978. Effective protection and economic performance in UK
manufacturing industry, 1963 and 1968, Economic Journal, vol. 88, 107-120

24
Howard, M. and King, J. 1992. A History of Marxian Economics: Volume II, 1929-
1990, Macmillan, London
Henley, A. 1991. Industrial Deconcentration in UK Manufacturing since 1980, The
Manchester School, vol. 62, 40-59
Hughes, A. and Kumar, M. 1984. Recent trends in aggregate concentration in the
United Kingdom economy, Cambridge Journal of Economics, vol. 8, 235-250
Kliman, A. 2007. Reclaiming Marx’s “Capital”, New York, Lexington
Laibman, D. 1992. Value, Technical Change and Crisis, New York, M. E. Sharpe
Lisman, J. and Sandee, J. 1964. Derivation of quarterly figures from annual data,
Journal of the Royal Statistical Society Series C, vol. 13, 87-90
Mandel, E. 1976. Introduction, in Marx, K. Capital Volume 1, Harmondsworth,
Penguin
Mann, H. 1966. Seller Concentration, barriers to entry and rates of return in thirty
industries, 1950-1960, Review of Economics and Statistics, vol. 48, 296-307
Marx, K. 1976. Capital Volume 1, Harmondsworth, Penguin
Marx, K. 1981. Capital Volume 3, Harmondsworth, Penguin
McCloskey, D. 1986. The Rhetoric of Economics, Wisconsin, University of
Wisconsin Press
Morishima, M. 1973. Marx’s Economics. Cambridge, Cambridge University Press
Moseley, F. 1985. The rate of surplus value in the postwar US economy: a critique of
Weisskopf‘s estimates, Cambridge Journal of Economics, vol.9, 57-79
Moseley, F. 1988. The rate of surplus-value, the organic composition, and the general
rate of profit in the U.S. economy, 1947-67: a critique and update of Wolff‘s
estimates, American Economic Review, vol. 78 (1), 298-303

25
Nissan, E. and Caveny, R. 1993. Concentration of sales and assets of the top 25
Fortune 500 firms: 1967-90, Applied Economics, vol. 25, 191-197.
O‘Neill, P. 1996. The trend of aggregate concentration in the United States, American
Journal of Economics and Sociology, vol. 55(2), 197-211
Roemer, J. 1981. Analytical foundations of Marxian economic theory, Cambridge,
Cambridge University Press
Roemer, J. 1982. A general theory of exploitation and class, Cambridge, Mass.,
Harvard University Press
Shaikh, A, and Tonak, E. 1994. Measuring the Wealth of Nations: The Political
Economy of National Accounts, Cambridge, Cambridge University Press
Smirlock, M., Gilligan, T. and Marshall, W. 1984. Tobin‘s q and the structure
performance relationship, American Economic Review, vol. 74, 1051-1060
Steedman, I. 1977. Marx After Sraffa, London, Verso
Tan, E. 2008. Champernowne Model Estimates of Aggregate Concentration in the US,
1931-2000, Social Science Research Network Working Paper, available at
http://papers.ssrn.com/sol3/papers.cfm?abstract_id=1285070, accessed 3/11/10
Veneziani, R. 2007. Exploitation and time, Journal of Economic Theory, vol. 132,
189-207
Weisskopf, T. 1979. Marxian crisis theory and the rate of profit in the postwar US
economy, Cambridge Journal of Economics, vol. 3, 341-378
White, L. 1981. What has been happening to aggregate concentration in the United
States? Journal of Industrial Economics, vol. 29, 223-30
White, L. 2002. Trends in aggregate concentration in the United States, Journal of
Economic perspectives, vol. 16(4), 137-160

26
Yoshihara, N. 2010. Class and exploitation in general convex cone economies,
Journal of Economic Behaviour and Organization, forthcoming

27
Appendix 1: Statistics Sources
Definition ONS Code Source
Gross Operating Surplus: Financial
Corporations (NSA)
NQNV ONS Website
http://www.statistics.gov.uk/default.asp
Accessed 15th
October, 2010 Gross Operating Surplus: NFCos:
Private (NSA)
NRJK
Gross Operating Surplus: NFCos:
Public: (NSA)
NRJT
Total Compensation of
Employees (NSA)
HAEA
Aggregate Strike Days (NSA)
BBFW
Claimant Count (NSA)
BCJA
Private Sector Employment as a
Proportion of the Total (Annual)
DB37 1992-2010 ONS Website (as above)
1986-1991
Economic Trends 434, December 1989
London: HMSO
Economic Trends 458, December 1991
London: HMSO
Social Trends 20, 1990. London: HMSO
Market Capitalisation
FTSE100
Thompson DataStream
Market Capitalisation
FTSE All Share
Thompson DataStream

28
Endnotes
1 The authors would like to thank Simeon Coleman, Carlyn Dobson, Barry Harrison,
John Marsh, Marie Stack, and Dan Wheatley for comments on an earlier draft.
Remaining errors are our own.
2 This was most exhaustively considered in the first volume of Capital (Marx, 1976).
Important contributions in recent decades include Morishima (1973), Steedman
(1977), Roemer (1981, 1982), Foley (1986), Laibman (1992), Freeman et al (2004),
Kliman (2007), Veneziani (2007) and Yoshihara (2010).
3 Morishima demonstrates that the conditions ‗necessary and sufficient for the
existence of a set of non-negative prices and a wage rate yielding positive profits in
every industry … [exist] if and only if the ―real wage rate‖ … is given such that the
rate of exploitation … is positive. This result … may be claimed as the Fundamental
Marxian Theorem, because it asserts that the exploitation of labourers by capitalists is
necessary and sufficient for the existence of a price-wage set yielding positive profits
or, in other words, for the possibility of conserving the capitalist economy‘ (1973,
p.53).
4 While the present paper is concerned with the relationship between surplus-value
and elements in the class struggle, contemporary events resonate with many other
aspects of Baran & Sweezy‘s work. They analyse monopoly capitalist society in
terms of giant corporations, run by self-perpetuating managerial groups, which
dominate mature capitalist economies. The sales effort, manifest through advertising,
is central in the capitalist socio-economy. Military spending is conceptually important,

29
supporting capitalist industry and absorbing surplus. Large corporations are
considered part of an associated imperialist process. The significance of the latter, for
international relations, is summarised thus: ‗What … [multinationals] want is
monopolistic control over foreign sources of supply and foreign markets … And for
this what they need is not trading partners but ‗allies‘ and clients willing to adjust
their laws and policies to the requirements of … Big Business (1966, p.200). The role
of US big business in the aftermath of the recent Iraq War might be considered a case
in point, as the Vietnam War was at the time when Baran & Sweezy were writing.
5 Roemer (1982) uses a rational choice approach to show that five classes can emerge
in a pure capitalist economy (where exploitation is mediated via the labour market): (i)
pure capitalist; (ii) small capitalist; (iii) petty bourgeois artisan; (iv) semi-proletarian;
(v) proletarian. Capitalists are, in essence, employers; proletarians are employed.
However, remaining agents are wholly or party self-employed and while working for
themselves they extract no surplus-labour from another. In this sense they are
exploitation-neutral. Hence, in empirically calculating s in the present paper we
remove self-employed activity (and remuneration), instead focussing on wage and
non-wage income derived from capitalist employment.
6 The definition of wages is an issue for Marxian economists. The sum of
compensation of employees include some elements which might be thought of as
rewards paid out of surplus-value — for example the bonuses of bankers, media
advertising executives etc. Marxian research on wage inequality and the nature of
bonuses would be an interesting area for further development.
30
7 In order to assess whether this procedure was reasonable we calculated an
interpolated series (from the annual data) for the period 1999-2009 and compared it to
the quarterly series available via the ONS website for those years. Deviations were
very small. The largest deviation of the predicted from the actual quarterly surplus-
value rate was 0.228 percentage points, i.e. the interpolated level of s in 2009Q3
was 53.01% whereas the actual series provided an estimate of 52.78%. Only 5 of the
54 interpolations caused a deviation in s of more than 0.1 percentage points.
8 Harberger (1954) conducted an empirical study of US manufacturing (1924-1928)
and found that approximately 4% of manufacturing resources were misallocated in
the second half of the 1920s, representing approximately 1.5% of gross national
product. On this basis he concluded: ‗Our economy emphatically does not seem to be
monopoly capitalist in big red letters … When we are interested in the big picture of
our manufacturing economy, we need not apologise for treating it as competitive, for
in fact it is awfully close to being so‘ (p.87). Subsequent estimates by Cowling &
Mueller (1978) adopted an alternative approach which took account of firms with
below-competitive profits. Their results for the US economy (1963-1966) suggested a
maximum monopoly welfare loss of 13.14%, and a monopoly welfare loss for the UK
economy (1968-1969) of up to 7.20%.
9 The frequency of data is also a problem in UK aggregate concentration evidence.
For example Hughes & Kumar (1984) only provide an annual series for their C100
‗market valuation‘ measure (which is essential the same as our market capitalisation
approach) of aggregate concentration; other measures — such as C100 by
employment, sales and assets — are only provided at five year intervals.
31
10 All of the independent variables were tested for stationarity using the Augmented
Dickey-Fuller test. The series S was found to be stationary. The remaining
explanatory variables were transformed (as above) in order to induce stationarity so
that each was of the same order.
11 We also tested for structural breaks in the data, especially 1997Q2 which was
associated with the election of the first New Labour Government. The Chow (1960)
test did not suggest any structural break in our data.
12 The regression results derived in this process are available from the authors on
request, as are the tabulated data which was the basis for the regressions.
13 Other datasets can be used to investigate the capitalist socio-economy, for example
the Labour Force Survey and the British Household Panel Survey. However, the
tendency to construct employee and employer surveys separately creates an
impediment to investigating the labour process at the microeconomic level.