Surgical Improvement Project (SIP)
59
Surgical Improvement Project (SIP) UW Medical Center February 9, 2005 Executive Sponsors: Lisa Brandenburg Dr. Ed Walker Dr. Ernie Weymuller
Transcript of Surgical Improvement Project (SIP)

Surgical Improvement Project (SIP)UW Medical Center
February 9, 2005
Executive Sponsors: Lisa BrandenburgDr. Ed WalkerDr. Ernie Weymuller

AgendaWelcomeSIP OverviewLean Overview
Break
Swedish Medical Center Moving ForwardQ & A
SponsorsDr. Mika SinananJ.Duncan, M.Alotis,
Y.Jackson
Jeff McAuliffeDr. Mika Sinanan
5 min60 min
10 min
5 min10 min15 min
WasteQuality
Steady FlowProcess Standardization
Process WalkVisual Systems

Surgical Improvement Project Mission
Make UWMC the First Choice for Patients seeking Excellence in Surgical Care
Make UWMC a Premier Practice and Work Site for All Members of the Surgical Team
Assure a Safe, Patient Centered, and EfficientEnvironment that Contributes to Fiscal Success for UWMC
Integrate Academic, Educational, and Service Rolesof UWMC Surgical Faculty and Staff Seamlessly
PASCO
Surgical Improvement Project Teams
SIP 1Schedule to 00:01 on the Day of Surgery
SIP 2Day of Surgery: 00:02 to Incision
First CaseSIP 3
Day of Surgery: After Incision for First Case
to Midnight
SIP 4Leadership and
Culture
SIP 5Strategy/Strategic
Planning
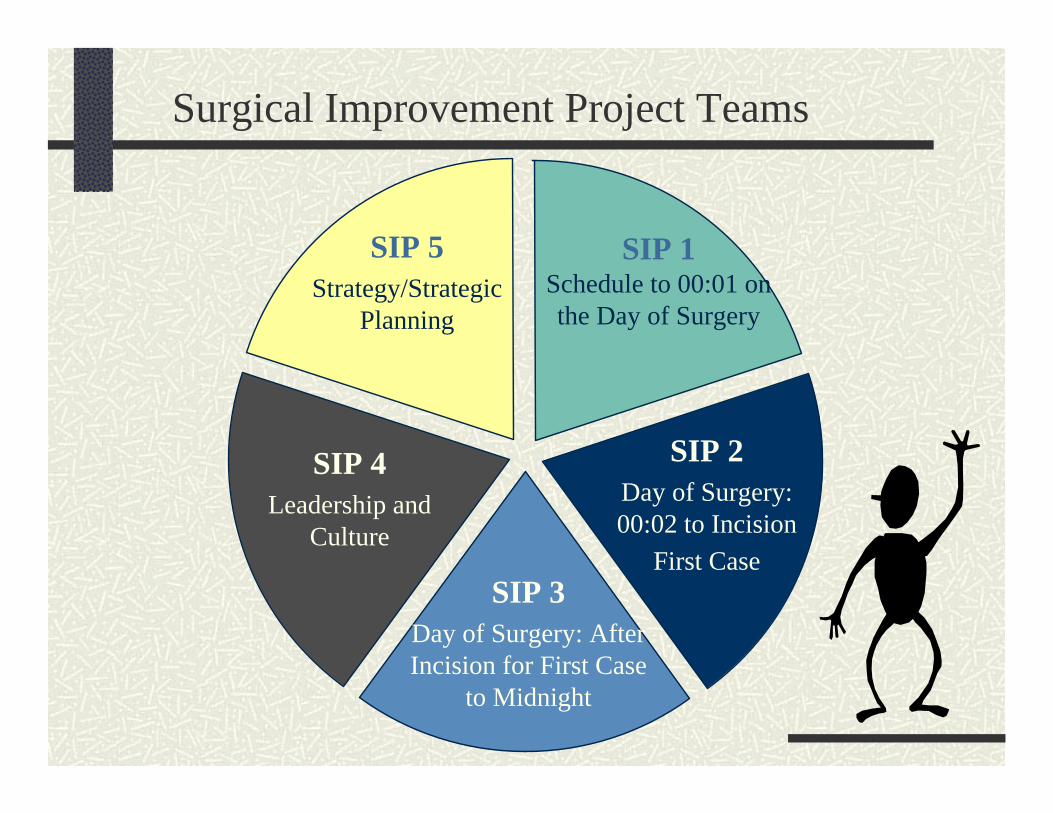
Project Timeline
DEC JAN FEB MAR APR MAY JUL
Oversight Team Kickoff
Management GT Kickoff
SIP Teams’ Kickoff
Lean Principles
Current State Report Out
Future State Design
Future State Report Out
Implementation Plan
Milestones
Implementation
JUN

Surgical Improvement Project Countdown
172 days until August 1st

Lean Methodology Has A Rich History
OriginModeled after JIT training for industrial engineersToyota workshops for suppliers
CharacteristicsIntensive education and learning by doingAll organization levels learn togetherRapid turning of Plan-Do-Check-Act Cycle (PDCA)Creates spirit of improvementAnalysis, visioning and implementation during the project to achieve at least 50% improvement“Ownership” of improvements
Similar ApproachesToyota, Boeing, GM, GE, Hillenbrand, Genie IndustriesSwedish, Children's, Virginia Mason, HMC

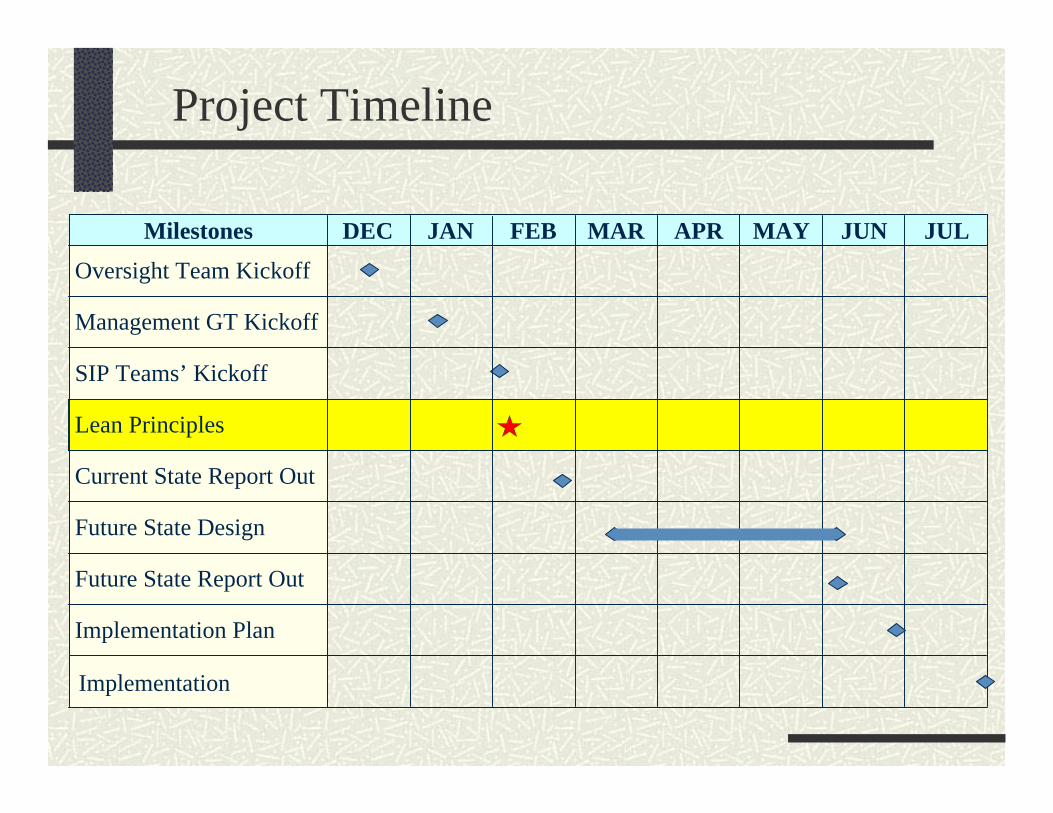
What is Lean?
Reduce WasteReduce Flow TimeReduce CostReduce VariationIncrease Visual CuesImprove Teamwork
L E A N
TODAY50%
Do not reach for perfection –Go for 50% improvement
TODAY!
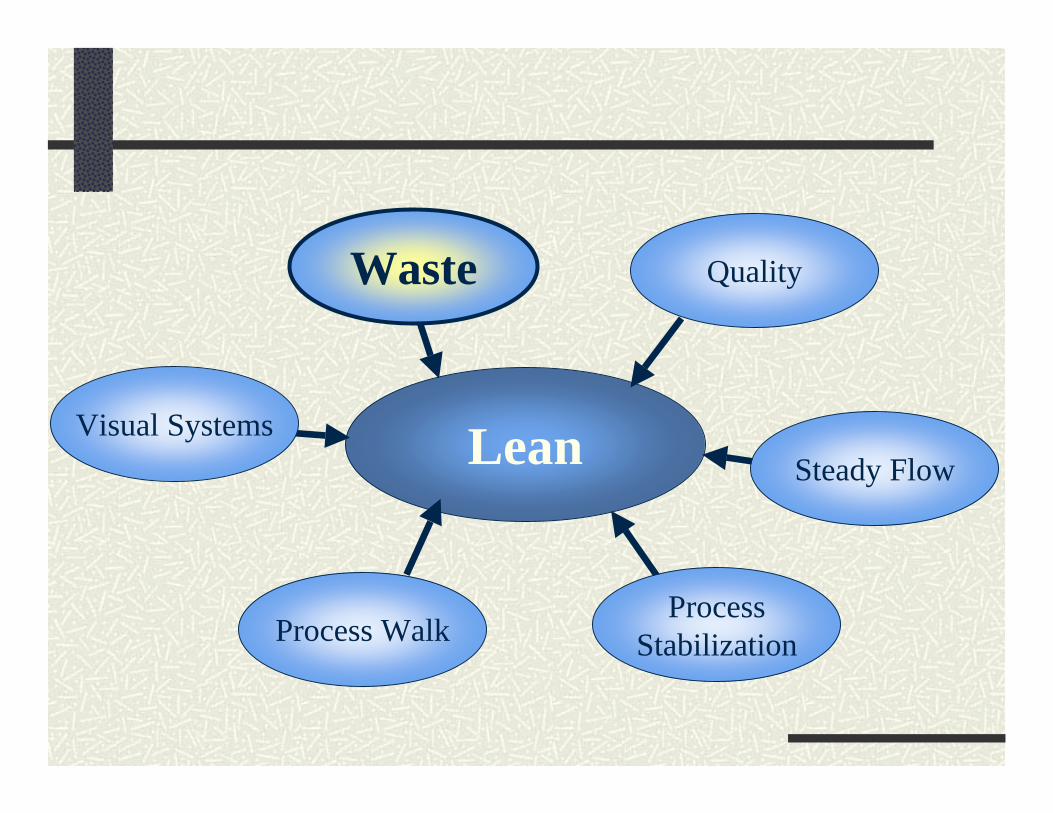
Lean
QualityWaste
Steady Flow
ProcessStabilizationProcess Walk
Visual Systems

Waste-ologyDefinition by Webster’s Dictionary:waste [ wayst ]
verb: to use something or use something up carelessly, extravagantly, or without effectnoun: unwanted or unusable by-products
Lean definition * : “Waste being any activity that does not add value to the final product….”
* Ohno, Shingo, Value Stream Mapping
Removal of Waste begets:Increased ResourceDecreased Cycle Time Reduced CostIncreased Quality

8 Deadly Wastes
Processing Search Time
Correction Transportation
Inventory Space
Wait Time Complexity
Waste Comes in Many Forms“Disguised as Useful Work”

Why Focus on Waste?
Because most processes are 95–99% non-value-added, a focus on eliminating waste is the best leverage for an improvement effort.
NVA 95%
Necessary Non-Value Added
VA5%

Value Added Timeline
Value-Added (VA)
Non-Value-Added (NVA)
Total time = 70 minutes
VA time = 6.5 minutes
Percent of NVA time = 91%
Travel distance = .25 mile
Number of Process steps = 25
Value-added steps = 4
Number of Inspection steps = 4
Number of queues = 11
First Unit Dose for Medication from Order to Patient Delivery
Write OrderDispense In
PharmacyEnter Data Administer
To Patient
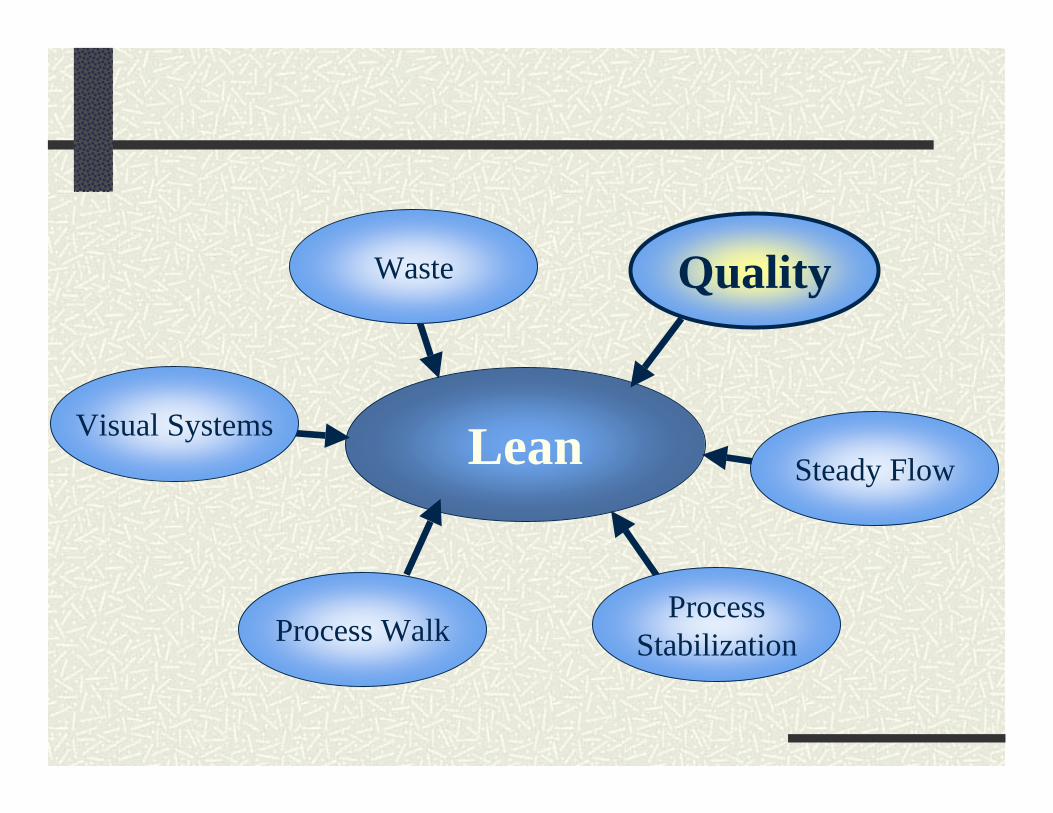
Lean
Quality
Steady Flow
ProcessStabilizationProcess Walk
Visual Systems
Waste

What is An Acceptable Quality Standard?
At one error in 1000 events, here is what happens:
22,000 checks are deducted from the wrong bank account everyday500 incorrect surgeries are completed every week2,000 unsafe airplane landings made every day16,000 pieces of mail are lost by the Postal Service every hour

Level 5: Eliminate Opportunities for Errors(CPOE)
Suppliers 1 2 3 4 Customers
Process controls and design prevent error
5

Level 3: Work Unit Inspects(Needle and Sponge count)
Suppliers 1 2 3 4 Customers
Erroroccurs
Defectdetected
5
Suppliers 1 3 4 Customers
Errorcaused, detected and corrected
5
Level 4: Self Inspection and Correction(Patient ID, Surgery Site Check)
Feedback
2

Level 1: Customer Inspects(DOH)
Suppliers 1 2 3 4 Customers
Erroroccurs
Inspector finds defect
Feedback
5
Level 2: Company Inspects (at the end of the process)
(QA, Audit, Narcotic Count)
Suppliers 1 2 3 4
Erroroccurs
Customer finds defect
Feedback
Customers

Level 3: Work Unit Inspect
Level 2: Company Inspects
Level 1: Customer Inspects
Level 5: Eliminate Opportunities for Errors
Levels of Quality System
PreventErrors
Level 4: Self Inspection
Check forDefects
Detect Errors
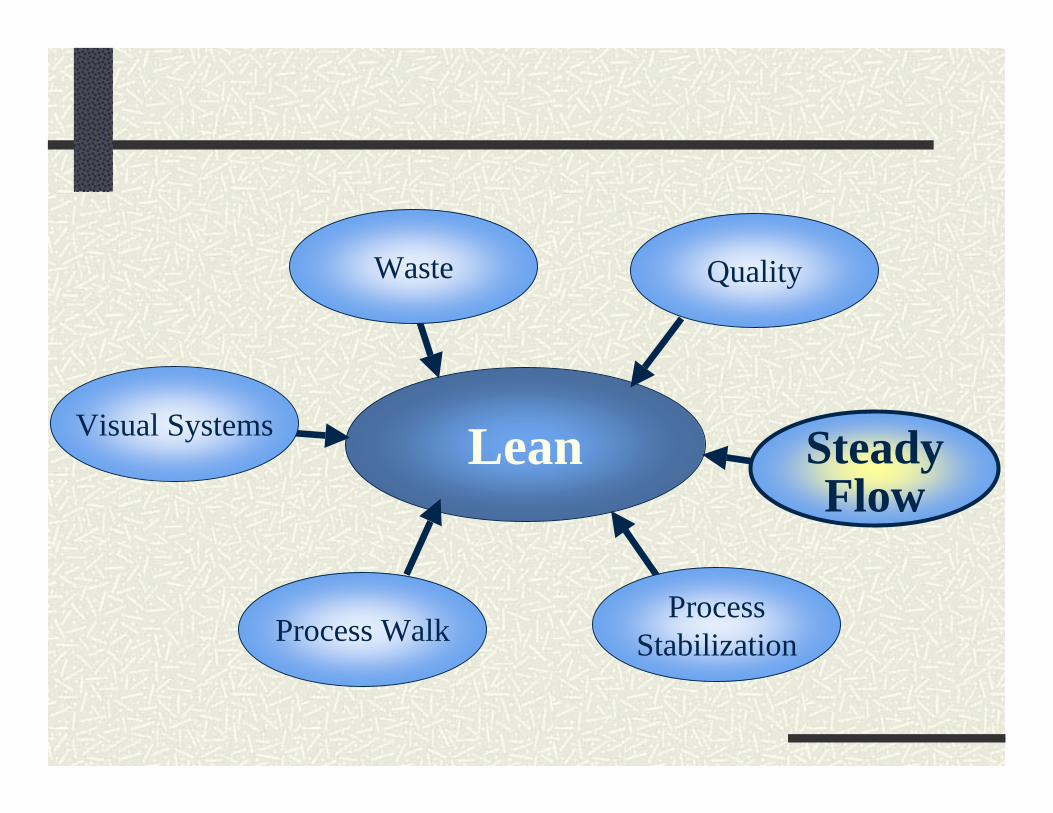
Lean
QualityWaste
SteadyFlow
ProcessStabilizationProcess Walk
Visual Systems

Keep the Process Moving, Forward (Streamlined Process)
AFTER LEANBEFORE LEAN

Batch and Queue of Patients
Patient gets admitted
Patient waits to be seen
Patient gets seen by
PreOp RNPatient waits
Patient gets seen by Surgeon
Patient waitsPatient get taken to Holding
Area
Patient waits ETC….

Steady Flow Processing
Even, steady pace and rhythm to the work flowAttention and completion to “one-at-a-time”Agile, speedy customer response time
BEFORE AFTER

Benefits of Steady Flow Processing
Better communicationDecreased response timeIncreased productivity
Requires less spaceIdentifies quality problems upstream in the process

The Steps to Steady Flow Processing
1. Plan and implement the sequence of work activities and the physical layout
2. Standardize the work methods
3. Keep pace with customers’ demand—one complete transaction at a time
4. Cross-train everyone to balance the work

Lean
QualityWaste
Steady Flow
ProcessStabilizationProcess Walk
Visual Systems
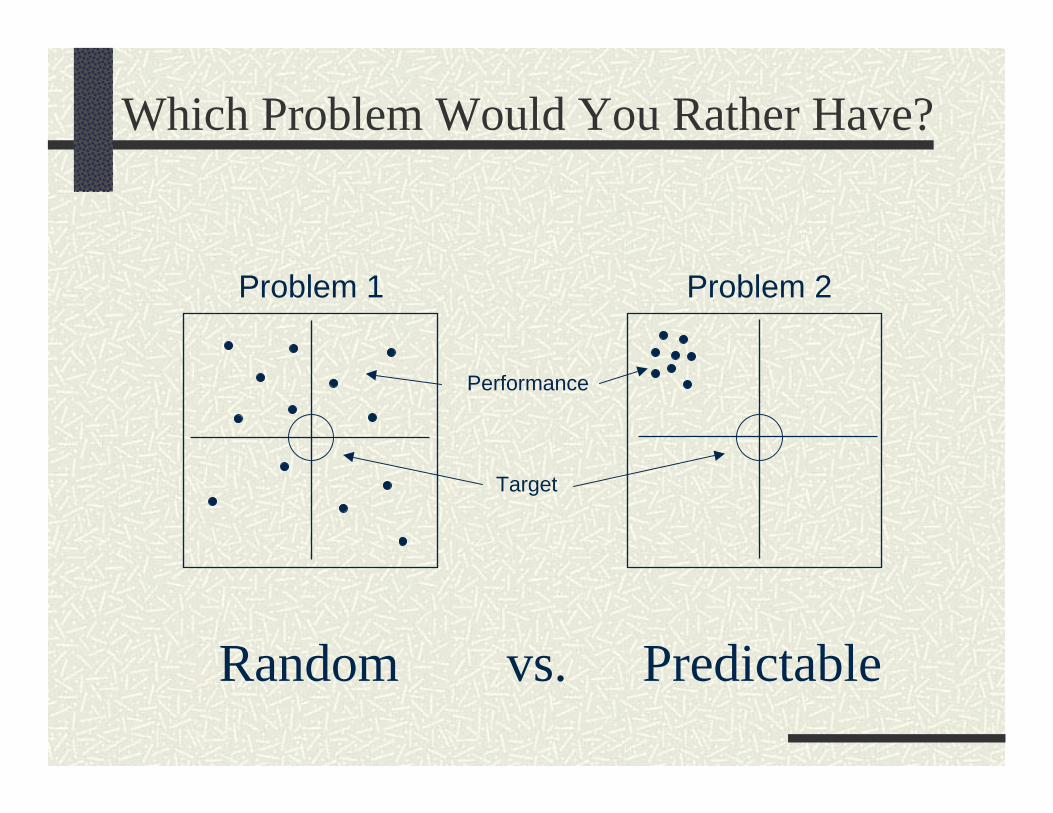
Which Problem Would You Rather Have?
Problem 1 Problem 2
Performance
Target
Random Predictablevs.
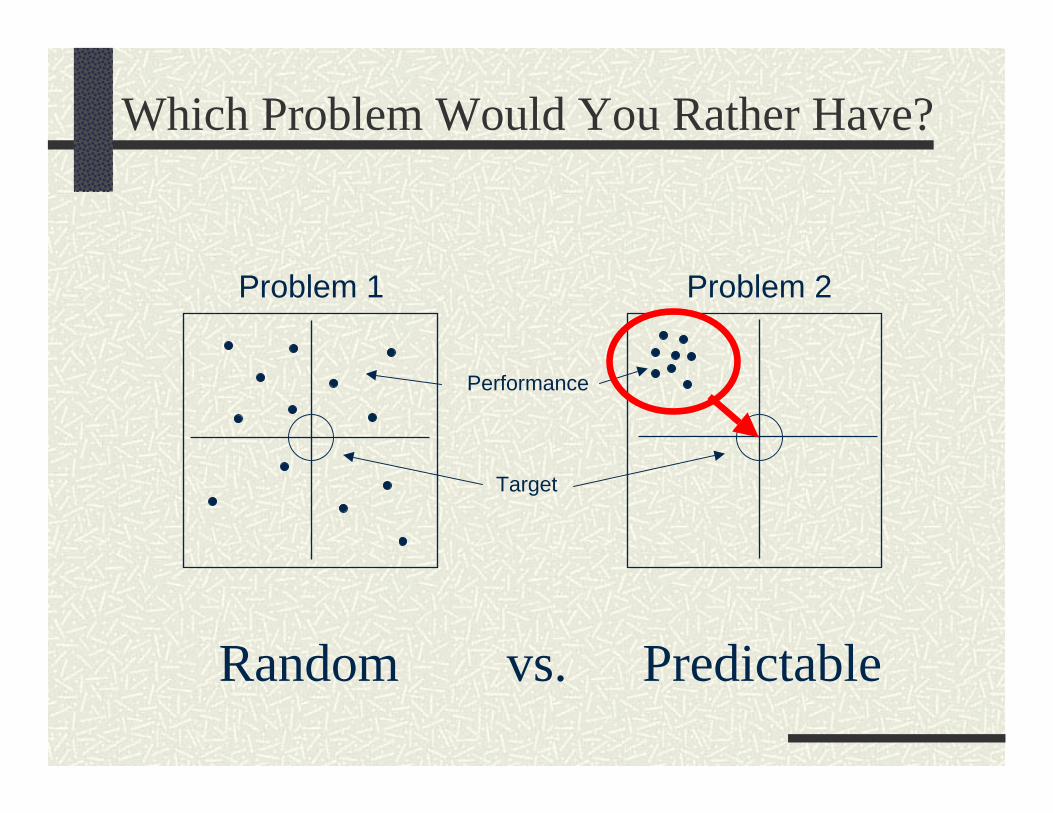
Which Problem Would You Rather Have?
Problem 1 Problem 2
Performance
Target
Random Predictablevs.

Attack Variation
Which of these is the major cause of process variation in results?
People Materials
Equipment Work Methods
Results

Attack Variation
Which of these is the major cause of process variation in results?
People Materials
Equipment Work Methods
Results

Why is Variability Critical?
… Reliable Methods are:• Safer• More Predictable• More Controllable• More Repeatable • Less Costly
A Process is as Strong as the Weakest Link …
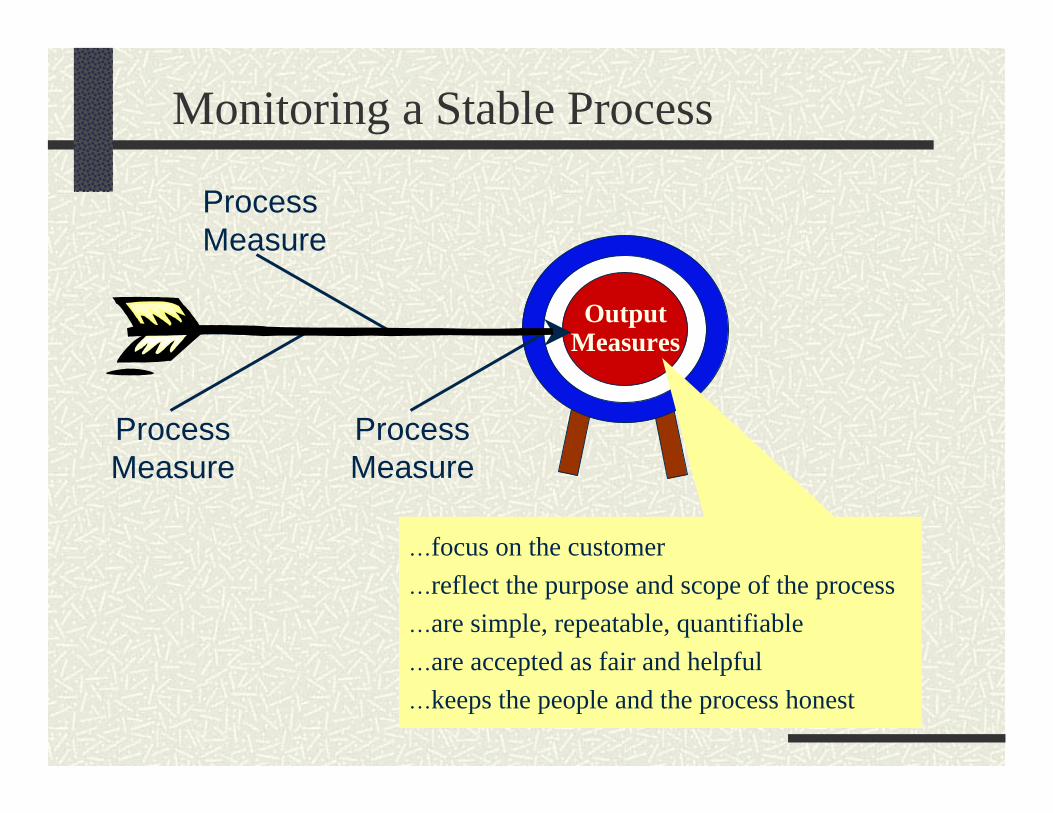
Output Measures
Monitoring a Stable Process
ProcessMeasure
ProcessMeasure
ProcessMeasure
…focus on the customer…reflect the purpose and scope of the process…are simple, repeatable, quantifiable…are accepted as fair and helpful…keeps the people and the process honest

Lean
QualityWaste
Steady Flow
ProcessStabilization
ProcessWalk
Visual Systems

Process Walk: 3 Essential Steps“Improvement does not happen in a conference room.”Go to the Actual PlaceTalk to the Actual People working in the processObserve the Actual Process
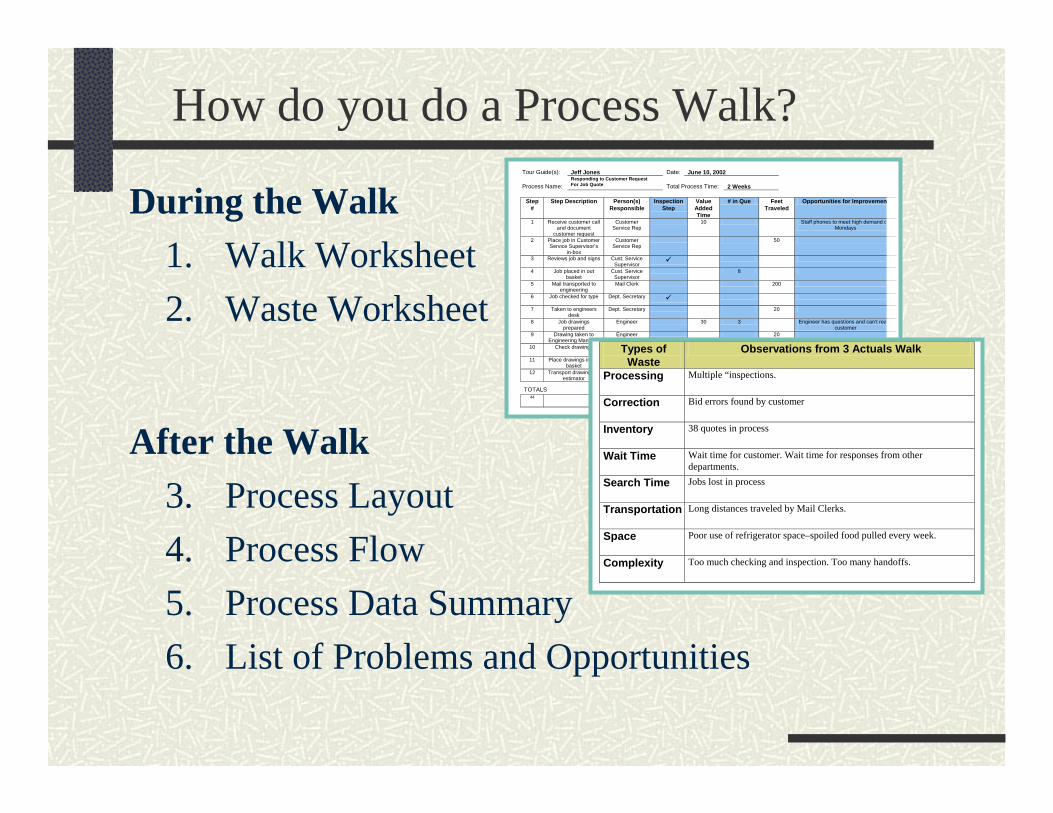
How do you do a Process Walk?
During the Walk1. Walk Worksheet2. Waste Worksheet
After the Walk3. Process Layout4. Process Flow5. Process Data Summary6. List of Problems and Opportunities
Tour Guide(s):
Jeff Jones
Date:
June 10, 2002
Process Name:
Responding to Customer Request For Job Quote
Total Process Time:
2 Weeks
Step
# Step Description
Person(s)
Responsible Inspection
Step Value Added Time
# in Que Feet Traveled
Opportunities for Improvemen
1 Receive customer call and document
customer request
Customer Service Rep
10 Staff phones to meet high demand oMondays
2 Place job in Customer Service Supervisor’s
in-box
Customer Service Rep
50
3 Reviews job and signs Cust. Service Supervisor
4 Job placed in out basket
Cust. Service Supervisor
8
5 Mail transported to engineering
Mail Clerk 200
6 Job checked for type Dept. Secretary
7 Taken to engineers desk
Dept. Secretary 20
8 Job drawings prepared
Engineer 30 3 Engineer has questions and can’t reacustomer
9 Drawing taken to Engineering Manager
Engineer 20
10 Check drawings Engineering Manager
6
11 Place drawings in out basket
Engineering Manager
12 Transport drawings to estimator
Mail Clerk 300
TOTALS 44 8 90 min. 8 queues 38
WIP orders 1960
Types of Waste
Observations from 3 Actuals Walk
Processing
Multiple “inspections.
Correction
Bid errors found by customer
Inventory
38 quotes in process
Wait Time
Wait time for customer. Wait time for responses from other departments.
Search Time
Jobs lost in process
Transportation
Long distances traveled by Mail Clerks.
Space
Poor use of refrigerator space–spoiled food pulled every week.
Complexity
Too much checking and inspection. Too many handoffs.

Process Layout
Locations
Workstations
People Movement

Flow ChartingEliminate assumptionsEveryone has a common understanding of the process and issues

Process Flow

RPI #2Central Services/ Processing
Current New Variation # of process steps 66 39 - 41% Total process time 834 min 512 min - 39% % of VA steps 42% 51% + 21% % of VA time 50% 66% + 32% # of checking steps 18 11 - 39% # of handoffs 12 8 - 33% # of queues 14 8 - 60% Work in progress 82 41 - 50%

Workflow45% reduction in the number of PYXIS “stock out” calls per day
66% reduction in wait time from report to fill in PYXIS
Physical LayoutA picture is worth a thousand words
Error reduction40% reduction in reported misfills
86% reduction in pick errors for the load process
BEFORE AFTER
Pharmacy RPI

Lean
QualityWaste
Steady Flow
ProcessStabilizationProcess Walk
VisualSystems

“A system of organization that is visible and intuitively obvious.”
Sort (Seiri)Set in Order (Seiton)Shine (Seiso)Standardize (Seiketsu)Sustain (Shitsuke)
BEFORE
AFTER
Visual System (5 S)

Benefits of a Visual System
Eliminates non-value-added search timeProvides a foundation for process standardizationReduces “space requirements”Communicates “how we are doing” to everyoneCan trigger corrective action
BEFORE
AFTER
Pharmacy RPI

History of Lean/RPI Improvements in Surgery
July 2001, SPD-Decontam - Providence
Sept 2001, SPD-Assembly- Providence
Oct 2001, SPD-Decontam - First Hill
Dec 2001, SPD-Assembly - First Hill
March 2002, Case Cart-Assembly - Providence
April 2002, OR 5S work - First Hill
Sept 2002, Case Cart Assembly - First Hill
May 2003, OR Turnaround - First Hill
July 2003, PreOp Chart Assembly - First Hill
May 2004, Periop Vision Workshop
Nov 2004, Patient Flow/Tracking, First Hill
Winter/Spring 2004, Value Stream Mapping
The Swedish Medical Center Experience
The Swedish Medical Center Experience

RPI - First Hill Campus Instrument Lead Time in Assembly
Assembly Lead Time
0
100
200
300
400
500
600
700
beforerpi
beforerpi
afterrpi #1
afterrpi #1
14-Jan 21-Jan 23-Jan 24-Jan 25-Jan 28-Jan 29-Jan 4-Feb 5-Feb 6-Feb 7-Feb 25-Feb
7-Mar 8-Mar 12-Mar
Aver
age
min
utes
RPI #1
RPI #2
Baseline
Target
The Swedish Medical Center Experience

Sterile Processing, FHC
Before - the “dumproom”
After - Employeedevelopment lounge
Location: Triangle Room, Sterile Processing, First Hill
The Swedish Medical Center Experience
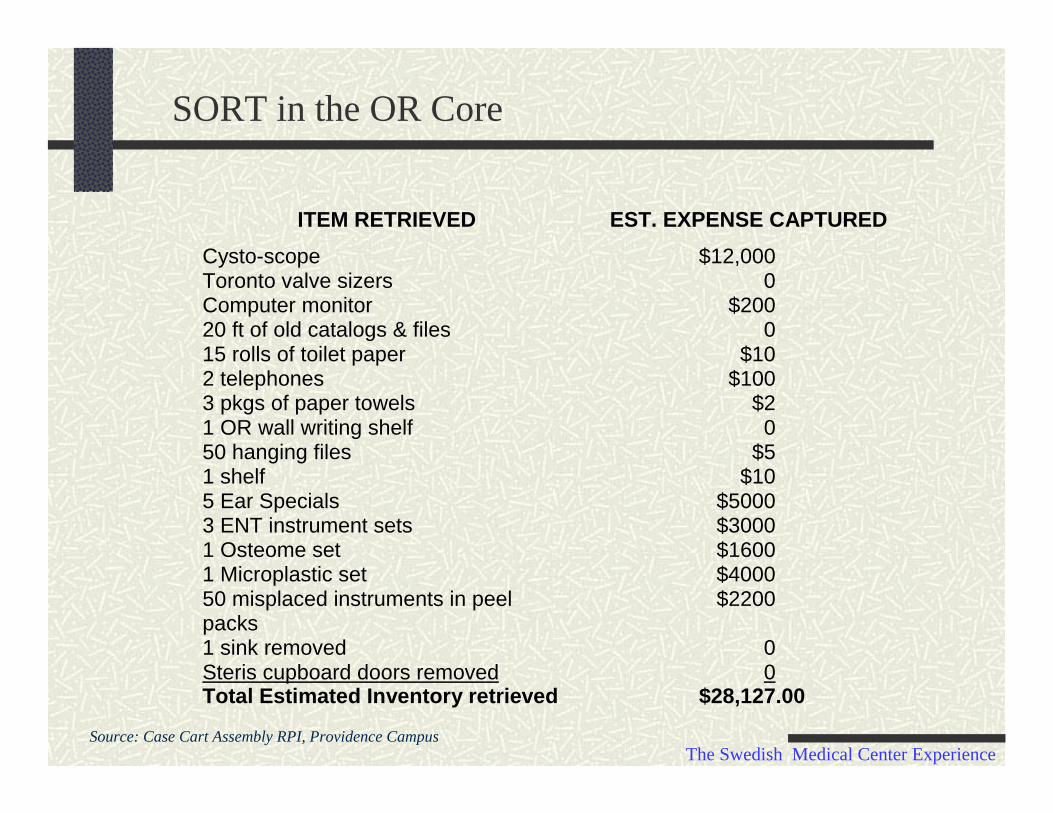
SORT in the OR Core
ITEM RETRIEVED EST. EXPENSE CAPTUREDCysto-scope $12,000Toronto valve sizers 0Computer monitor $20020 ft of old catalogs & files 015 rolls of toilet paper $102 telephones $1003 pkgs of paper towels $21 OR wall writing shelf 050 hanging files $51 shelf $105 Ear Specials $50003 ENT instrument sets $30001 Osteome set $16001 Microplastic set $400050 misplaced instruments in peelpacks
$2200
1 sink removed 0Steris cupboard doors removed 0Total Estimated Inventory retrieved $28,127.00
Source: Case Cart Assembly RPI, Providence CampusThe Swedish Medical Center Experience

Case Cart Lead TimeFirst Hill Campus
0
5
10
15
20
25
30
35
40
Hours
1 2 3 4 5 6Before RPI After RPI
Case Cart AssemblyFirst Hill Campus
Range of Lead Time (excluding first start)
24- 40 hours
0.5 - 3.0 hours
The Swedish Medical Center Experience

Complete Case Cart DeliveryFirst Hill Campus
Percent of Incomplete Case Carts
0
20
40
60
80
100
18-A
ug
19-A
ug
20-A
ug
21-A
ug
22-A
ug
23-A
ug
24-A
ug
25-A
ug
26-A
ug
27-A
ug
28-A
ug
29-A
ug
30-A
ug
1-Se
p
2-Se
p
3-Se
p
4-Se
p
5-Se
p
6-Se
p
11-N
ov
12-N
ov
13-N
ov
14-N
ov
15-N
ov
16-N
ov
17-N
ov
18-N
ov
19-N
ov
20-N
ov
21-N
ov
22-N
ov
23-N
ov
24-N
ov
25-N
ov
% In
com
plet
e
RPI Held in Late September
Average = 22%
Average = 4% 82% improvement
The Swedish Medical Center Experience

Periop Value Stream Redesign
DOS work cellAncillary SvcsPull SystemOR Suite StdzSurgery Staffing Flow
CIS Supply Chain Operations Post CIS
The Swedish Medical Center Experience

Periop Value Stream Redesign
DOS work cellAncillary SvcsPull SystemOR Suite StdzSurgery Staffing Flow
CIS Supply Chain Operations Post CIS
The Swedish Medical Center Experience
Procedure list controlOR Core & Suite stockingPoint of Use MaterialsMaterial consignmentSpecial Orders

Periop Value Stream Redesign
DOS work cellAncillary SvcsPull SystemOR Suite StdzSurgery Staffing Flow
CIS Supply Chain Operations Post CIS
The Swedish Medical Center Experience
Procedure list controlOR Core & Suite stockingPoint of Use MaterialsMaterial consignmentSpecial Orders
Patient flow & trackingSchedule finalization & release48 hour clinical review
Interface with EMRBarcode usageCharging templates

Moving Forward

Surgical Improvement Project Mission
Make UWMC the First Choice for Patients seeking Excellence in Surgical Care
Make UWMC a Premier Practice and Work Site for All Members of the Surgical Team
Assure a Safe, Patient Centered, and EfficientEnvironment that Contributes to Fiscal Success for UWMC
Integrate Academic, Educational, and Service Rolesof UWMC Surgical Faculty and Staff Seamlessly
PASCO

Project Timeline
DEC JAN FEB MAR APR MAY JUL
Oversight Team Kickoff
Management GT Kickoff
SIP Teams’ Kickoff
Lean Principles
Current State Report Out
Future State Design
Future State Report Out
Implementation Plan
Milestones
Implementation
JUN

Communication
Decide to have surgery
Prepare for surgery
Go into surgery
Recover from surgery
Be discharged
Value Stream for Surgical Care
SIP 1 SIP 2 SIP 3
SIP 4 SIP 5

Communication
How will all of the changes be communicated?
Surgispot
Bulletin Board
MGT meeting
Oversight meeting
Website

Surgical Improvement Project
We have
172 days until August 1st
Any Questions?