SurfBI Manufacturing Analytics - Oracle · Manufacturing Analytics references information from the...
174
Oracle Business Intelligence Applications User’s Guide for Manufacturing Analytics Version 7.9.6.3 Extension Pack
Transcript of SurfBI Manufacturing Analytics - Oracle · Manufacturing Analytics references information from the...

Oracle Business Intelligence Applications User’s Guide for Manufacturing Analytics
Version 7.9.6.3 Extension Pack
Contents
Preface .................................................................................................................................................... 6
Audience ........................................................................................................................................... 6
Documentation Accessibility .......................................................................................................... 6
Accessibility of Code Examples in Documentation ................................................................ 6
Accessibility of Links to External Web Sites in Documentation ........................................... 7
TTY Access to Oracle Support Services .................................................................................... 7
Related Documents .......................................................................................................................... 7
Conventions ...................................................................................................................................... 7
Overview of Oracle Manufacturing Analytics ................................................................................. 7
Facts Descriptions ................................................................................................................................ 8
Subject Area Details ........................................................................................................................... 11
Manufacturing – Subject Area Details ........................................................................................ 11
Inventory and Costing – Subject Area Details ........................................................................... 46
Planning - Subject Area Details .................................................................................................... 65
Discrete Quality – Subject Area Details ...................................................................................... 71
Process Quality - Subject Area Details ........................................................................................ 93
Kanban Subject Area Details ........................................................................................................... 113
Kimball Matrix ................................................................................................................................. 122
Manufacturing .............................................................................................................................. 122
Planning......................................................................................................................................... 136
Discrete Quality ............................................................................................................................ 137
Process Quality ............................................................................................................................. 138
Manufacturing Execution Dashboard ........................................................................................... 138
VP Manufacturing Dashboard Page .......................................................................................... 138
Production Performance Report ............................................................................................ 138
Production Cost Report ........................................................................................................... 139
Inventory Report ...................................................................................................................... 139
Quality Report .......................................................................................................................... 140
Cross Plant Analysis Report ................................................................................................... 140
Key Category Tracking Report ............................................................................................... 140
Production to Plan Summary Dashboard Page ....................................................................... 141
Production to Plan Summary Report .................................................................................... 141
Production Cost Summary Dashboard Page ........................................................................... 142
Cost Distribution Analysis Report ......................................................................................... 142
Margin Analysis Report .......................................................................................................... 143
Resource Cost Variance Report .............................................................................................. 143
Material Cost Variance Report ............................................................................................... 144
Overhead Cost Variance Report ............................................................................................ 144
Inventory Summary Dashboard Page ....................................................................................... 144
Inventory Turns Trend Report ............................................................................................... 145
Inventory Turns by Category Report .................................................................................... 145
Quality Summary Dashboard Page ........................................................................................... 146
Production Scrap Distribution Trend Report ....................................................................... 146
Production Scrap Trend Report ............................................................................................. 146
Service Level Summary Dashboard Page ................................................................................. 147
Ship Date Compliance Report ................................................................................................ 147
Promise Date Compliance Report.......................................................................................... 148
Request Date Compliance Report .......................................................................................... 148
** All the reports on the Service Level Summary Dashboard page require the licensing and
deploying of the Supply Chain and Order Management analytics module .................................... 148
Plant Manager Dashboard Page ................................................................................................ 148
Production Cost Report ........................................................................................................... 149
Production to Plan Report ...................................................................................................... 149
Resource Efficiency Report ..................................................................................................... 149
Trending Report ....................................................................................................................... 150
Shop Floor Supervisor Dashboard Page ................................................................................... 150
Overall Productivity Report ................................................................................................... 150
Productivity by Resource Report ........................................................................................... 150
Shop Floor Utilization Summary Report .............................................................................. 151
Lot Genealogy Dashboard Page ................................................................................................. 151
Lot Genealogy Report .............................................................................................................. 151
Cost Controller Dashboard Page ..................................................................................................... 152
Cost Metrics Report ................................................................................................................. 152
Total Cost Trend Report .......................................................................................................... 153
Manufacturing Cost Variance Report ................................................................................... 153
Cross Functional Dashboard Page ............................................................................................. 153

Planning Dashboard ............................................................................................................................ 155
Plan Summary Dashboard Page ...................................................................................................... 155
Demand Schedule by Time bucket: ............................................................................................ 155
Demand Pegging Trend: .............................................................................................................. 156
Demand Fulfillment Performance:.............................................................................................. 156
Demand Fulfillment Distribution: ............................................................................................... 156
Supply Distribution: .................................................................................................................... 156
Supply Schedule by Time bucket: ............................................................................................... 156
Pegging Details Dashboard Page ..................................................................................................... 156
Pegging Details Report ............................................................................................................ 156
Demand Schedule Dashboard Page .......................................................................................... 157
Supply Schedule Dashboard Page ............................................................................................. 158
Quality Dashboard .............................................................................................................................. 159
Quality Summary Dashboard Page ........................................................................................... 159
Scrap by Product Category ..................................................................................................... 159
Work Order Scrap Detail Report ........................................................................................... 159
Scrap by Scrap Reason Report ................................................................................................ 160
Quality Test Analysis Dashboard Page .................................................................................... 160
Test Conformance .................................................................................................................... 160
Test Distribution ....................................................................................................................... 160
Test Conformance Details Report .......................................................................................... 160
Test Distribution by Product Category ................................................................................. 161
Kanban Dashboard .......................................................................................................................... 161
Inventory and Costing Dashboard ................................................................................................ 166
Inventory Management Dashboard Page ....................................................................................... 167
Cross Plant Analysis ..................................................................................................................... 167
Cross Category Analysis .............................................................................................................. 168
Inventory Analysis ....................................................................................................................... 169
Manufacturing Cost ........................................................................................................................ 170
Manufacturing Cost Variance ..................................................................................................... 171
Excess & Obsolescence ................................................................................................................... 171
Excess Inventory.......................................................................................................................... 172
Obsolete Inventory ..................................................................................................................... 173
Obsolete Inventory by Lot ........................................................................................................... 173
Manufacturing Cost Detail .............................................................................................................. 174
Manufacturing Cost Details ........................................................................................................ 174

Preface
Oracle Business Intelligence Applications are comprehensive prebuilt solutions that deliver
pervasive intelligence across an organization, empowering users at all level, from front line
operational users to senior management, with the key information they need to maximize
effectiveness. Intuitive and role-based, these solutions transform and integrate data from a
range of enterprise sources, including Siebel, Oracle, PeopleSoft, SAP, and corporate data
warehouses, into actionable insight that enables more effective actions, decisions, and
processes.
Oracle Business Intelligence Applications are built on Oracle Business Intelligence Suite
Enterprise Edition, a comprehensive next-generation BI and analytics platform.
This guide explains how to install, set up, configure, and customize Oracle Business
Intelligence Applications Version 7.9.6.3 Extension Pack.
Oracle recommends reading Oracle Business Intelligence Applications Release Notes before
installing or using Oracle Business Intelligence Applications. The Oracle Business
Intelligence Applications Release Notes are available:
On the Oracle Business Intelligence Applications CD-ROM.
On the Oracle Technology Network at
http://www.oracle.com/technology/documentation/bi_apps.html (to register for a free
account on the Oracle Technology Network, go to
http://www.oracle.com/technology/about/index.html).
Audience
This document is intended for BI managers and implementers of Oracle Business
Intelligence Applications.
Documentation Accessibility
Our goal is to make Oracle products, services, and supporting documentation accessible,
with good usability, to the disabled community. To that end, our documentation includes
features that make information available to users of assistive technology. This
documentation is available in HTML format, and contains markup to facilitate access by the
disabled community. Accessibility standards will continue to evolve over time, and Oracle is
actively engaged with other market-leading technology vendors to address technical
obstacles so that our documentation can be accessible to all of our customers. For more
information, visit the Oracle Accessibility Program Web site at
http://www.oracle.com/accessibility/.
Accessibility of Code Examples in Documentation
Screen readers may not always correctly read the code examples in this document. The
conventions for writing code require that closing braces should appear on an otherwise
empty line; however, some screen readers may not always read a line of text that consists
solely of a bracket or brace.
Accessibility of Links to External Web Sites in Documentation
This documentation may contain links to Web sites of other companies or organizations that
Oracle does not own or control. Oracle neither evaluates nor makes any representations
regarding the accessibility of these Web sites.
TTY Access to Oracle Support Services
Oracle provides dedicated Text Telephone (TTY) access to Oracle Support Services within
the United States of America 24 hours a day, 7 days a week. For TTY support, call
800.446.2398. Outside the United States, call +1.407.458.2479.
Related Documents
For more information, see the following documents in the Oracle Business Intelligence
Applications Release 7.9.6.3 Extension Pack documentation set (available at
http://www.oracle.com/technology/documentation/bi_apps.html):
Oracle Business Intelligence Applications Release Notes
System Requirements and Supported Platforms for Oracle Business Intelligence Applications for
Oracle Data Integrator Users
Conventions
The following text conventions are used in this document:
Boldface type indicates graphical user interface elements associated with an action, or
terms defined in text or the glossary.
Italic type indicates book titles, emphasis, or placeholder variables for which you supply
particular values.
Monospace type indicates commands within a paragraph, URLs, codein examples, text
that appears on the screen, or text that you enter.
Overview of Oracle Manufacturing Analytics
Oracle Manufacturing Analytics is a prebuilt analytical solution that is compatible with
Oracle BI Applications. Pre built dashboards provide KPIs on planned vs. actual production,
production costing, inventory, manufacturing quality and related manufacturing execution
activities.
Use Manufacturing Analytics to analyze manufacturing performance on the following Key
Performance Indicators (KPIs):
Production to Plan: Compare Actual production values with planned production
values.
On-Time Production: Find out the percentage of on-time production to total
production.
Production Backlog: View the cumulative value for all the open jobs.
Backlog %: Find out the percentage of open jobs to total number of jobs taken into
production.
Past due Backlog %: Find out how many jobs are currently running late.
Cost Variance %: View standard and actual costs for all the jobs and resulting cost
variances (standard costs include material, resource, outside processing, and
overhead costs.)
Resource Utilization: Find out how many hours of available resources were actually
utilized.
Scrap %: Compare the scrap value with production value and find out the percentage
of scrap for all jobs.
Service Level Compliance %: Find out how many work orders are completed on time
with respect to the sales order lines pegged to the work order.
Inventory Value: Find out how much inventory is maintained by the manufacturing
organizations (including On-Hand, Intransit & WIP).
Discrete Quality Test Results and Result Conformances.
Manufacturing Analytics references information from the following application areas of
Oracle E-Business Suite:
Oracle Advanced Supply Chain Planning
Oracle Work in Process
Oracle Inventory
Oracle Order Management
Oracle Process Manufacturing
Oracle Cost Management
Oracle Bills of Material
Oracle Discrete Quality
Oracle Process Quality
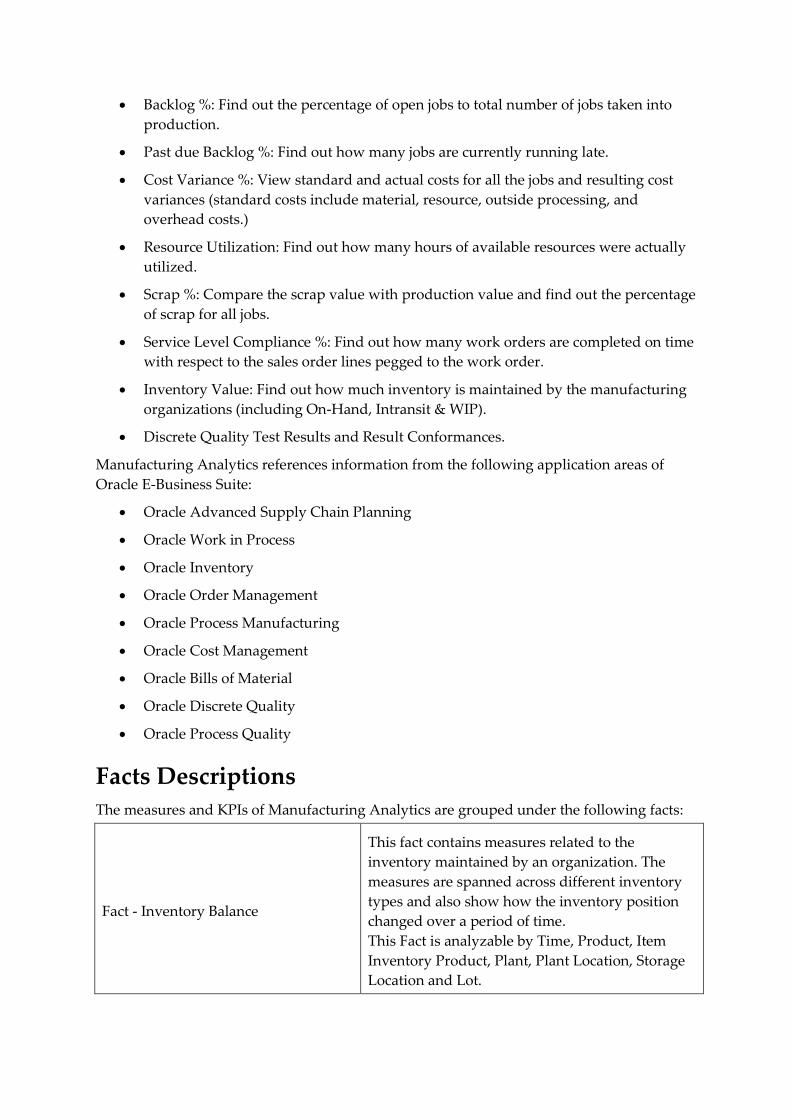
Facts Descriptions
The measures and KPIs of Manufacturing Analytics are grouped under the following facts:
Fact - Inventory Balance
This fact contains measures related to the
inventory maintained by an organization. The
measures are spanned across different inventory
types and also show how the inventory position
changed over a period of time.
This Fact is analyzable by Time, Product, Item
Inventory Product, Plant, Plant Location, Storage
Location and Lot.
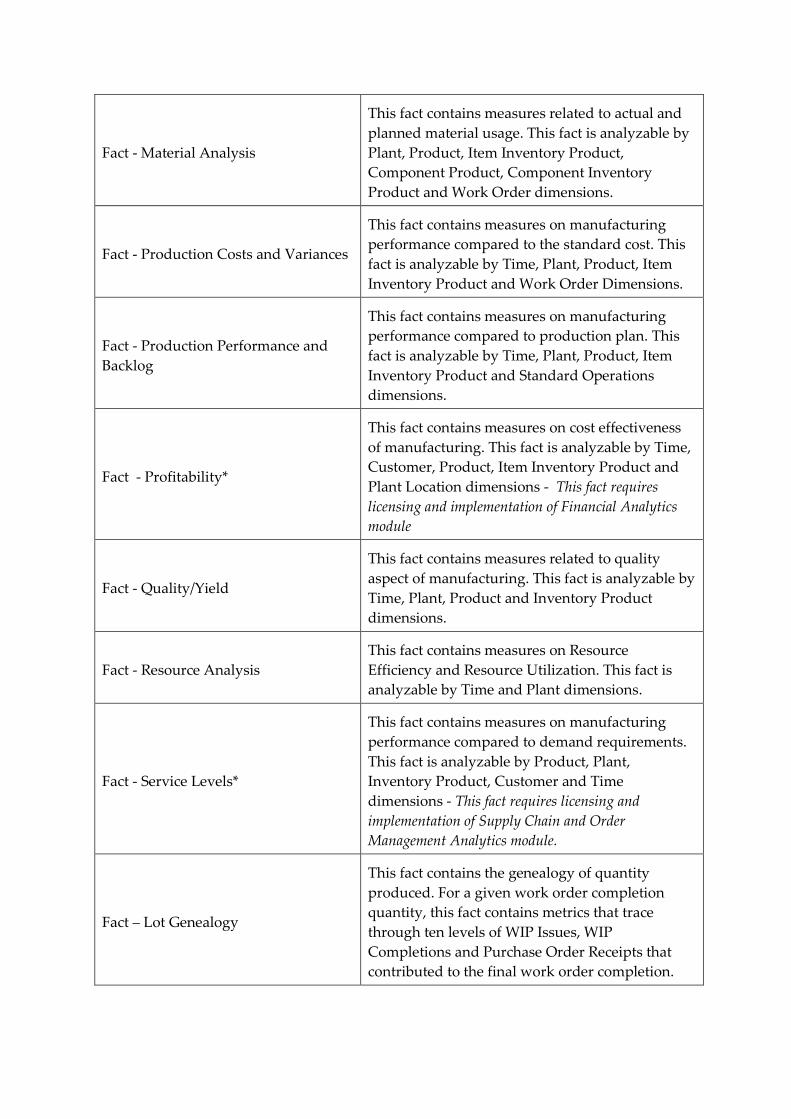
Fact - Material Analysis
This fact contains measures related to actual and
planned material usage. This fact is analyzable by
Plant, Product, Item Inventory Product,
Component Product, Component Inventory
Product and Work Order dimensions.
Fact - Production Costs and Variances
This fact contains measures on manufacturing
performance compared to the standard cost. This
fact is analyzable by Time, Plant, Product, Item
Inventory Product and Work Order Dimensions.
Fact - Production Performance and
Backlog
This fact contains measures on manufacturing
performance compared to production plan. This
fact is analyzable by Time, Plant, Product, Item
Inventory Product and Standard Operations
dimensions.
Fact - Profitability*
This fact contains measures on cost effectiveness
of manufacturing. This fact is analyzable by Time,
Customer, Product, Item Inventory Product and
Plant Location dimensions - This fact requires
licensing and implementation of Financial Analytics
module
Fact - Quality/Yield
This fact contains measures related to quality
aspect of manufacturing. This fact is analyzable by
Time, Plant, Product and Inventory Product
dimensions.
Fact - Resource Analysis
This fact contains measures on Resource
Efficiency and Resource Utilization. This fact is
analyzable by Time and Plant dimensions.
Fact - Service Levels*
This fact contains measures on manufacturing
performance compared to demand requirements.
This fact is analyzable by Product, Plant,
Inventory Product, Customer and Time
dimensions - This fact requires licensing and
implementation of Supply Chain and Order
Management Analytics module.
Fact – Lot Genealogy
This fact contains the genealogy of quantity
produced. For a given work order completion
quantity, this fact contains metrics that trace
through ten levels of WIP Issues, WIP
Completions and Purchase Order Receipts that
contributed to the final work order completion.

Fact - Manufacturing Cost
This Fact contains manufacturing cost metrics
including cost distribution by different cost
components. This Fact is analyzable by Product,
Item Inventory Product, Plant, Plant Location,
Time and Work Order.
Fact - Material Cost Distribution
This Fact provides ledger posting values of
Material Transactions and is analyzable by Cost
Elements, Product, Item Inventory Product, Plant,
Time, and GL Account.
Fact - Demand
Used to analyze the Demand Quantity and the
Demand Quantity Bucketing by Demand Details,
Demand Item Details, Demand Organization,
Plan, Supply Details, Supply Item Details, Supply
OSP Details and Time dimension.
Fact - Supply
Used to analyze the Allocated, Ordered &
Completed Quantity and Supply Bucketing by
Demand Details, Demand Item Details, Demand
Organization, Plan, Supply Details, Supply Item
Details, Supply OSP Details and Time dimension.
Fact – QA Results
The Fact - QA Results is analyzed by Time,
Department, Collection Plan, Organization,
Project, Non Conformance, Work Order, Resource
and Task.
Fact – Test Results
This fact table contains all the measures and
attributes related to measuring results obtained
while performing the tests. The test results can be
analyzed by the following dimensions Time, Test,
Organization, Product, Inventory Item, Lot,
Sample, Specification, Test Executor, Source,
Storage Location and Work Order.
Fact – Kanban Card Activity
The Fact – Kanban Card Activity is analyzable by
Time, Item Inventory Product, Storage Location,
Supplier, Work Order, Inventory Organization,
Kanban Codes and Kanban Card dimensions.
Fact – Purchase Order
The Fact – Purchase Order is analyzable by Time,
Item Inventory Product, Storage Location,
Supplier, Purchase Order and Inventory
Organization.
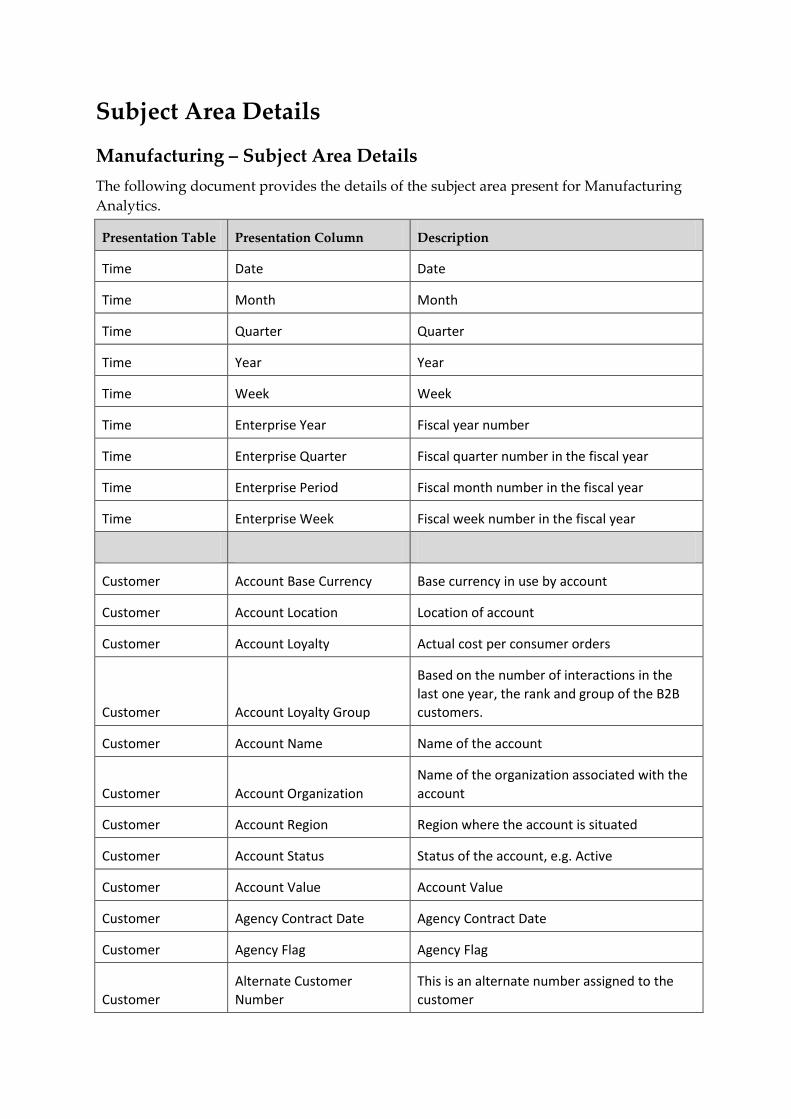
Subject Area Details
Manufacturing – Subject Area Details
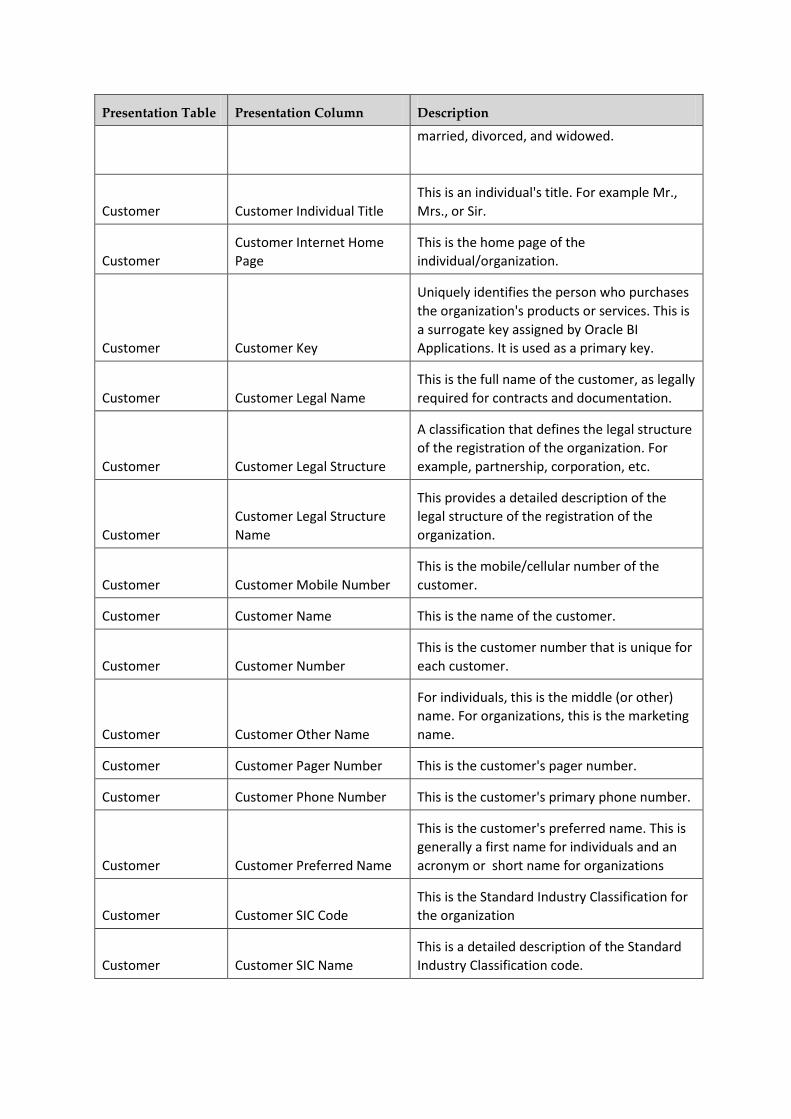
The following document provides the details of the subject area present for Manufacturing
Analytics.
Presentation Table Presentation Column Description
Time Date Date
Time Month Month
Time Quarter Quarter
Time Year Year
Time Week Week
Time Enterprise Year Fiscal year number
Time Enterprise Quarter Fiscal quarter number in the fiscal year
Time Enterprise Period Fiscal month number in the fiscal year
Time Enterprise Week Fiscal week number in the fiscal year
Customer Account Base Currency Base currency in use by account
Customer Account Location Location of account
Customer Account Loyalty Actual cost per consumer orders
Customer Account Loyalty Group
Based on the number of interactions in the
last one year, the rank and group of the B2B
customers.
Customer Account Name Name of the account
Customer Account Organization
Name of the organization associated with the
account
Customer Account Region Region where the account is situated
Customer Account Status Status of the account, e.g. Active
Customer Account Value Account Value
Customer Agency Contract Date Agency Contract Date
Customer Agency Flag Agency Flag
Customer
Alternate Customer
Number
This is an alternate number assigned to the
customer
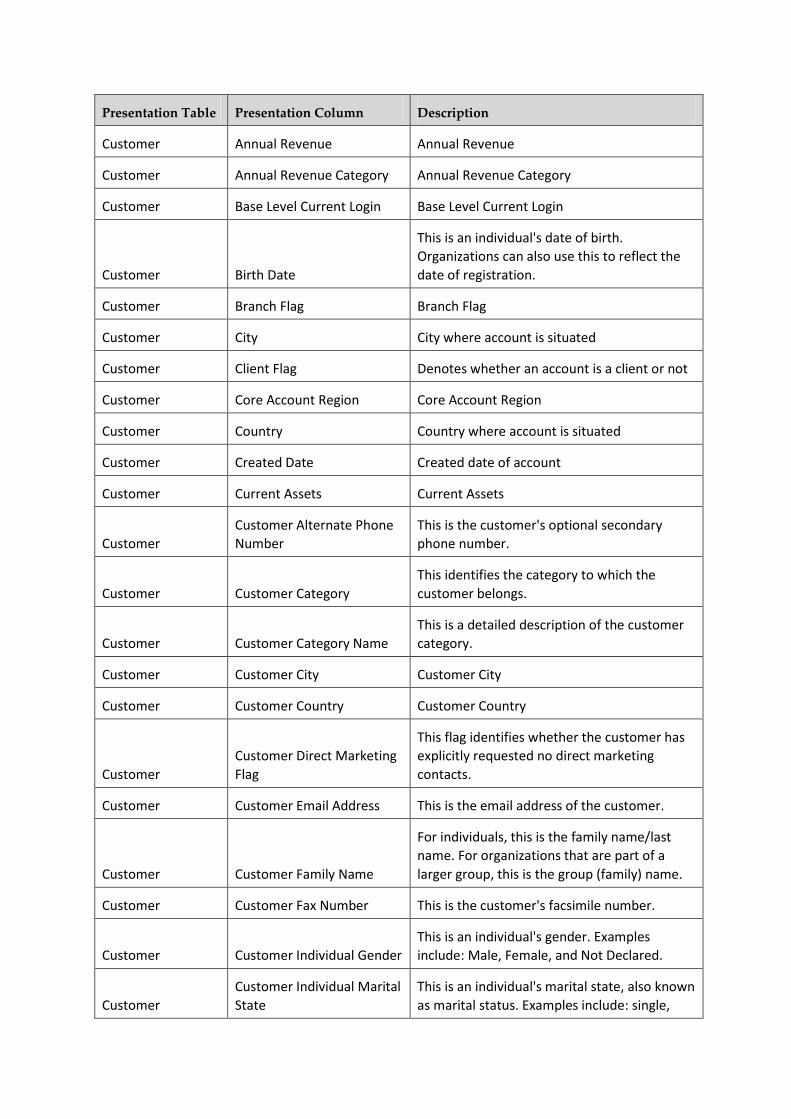
Presentation Table Presentation Column Description
Customer Annual Revenue Annual Revenue
Customer Annual Revenue Category Annual Revenue Category
Customer Base Level Current Login Base Level Current Login
Customer Birth Date
This is an individual's date of birth.
Organizations can also use this to reflect the
date of registration.
Customer Branch Flag Branch Flag
Customer City City where account is situated
Customer Client Flag Denotes whether an account is a client or not
Customer Core Account Region Core Account Region
Customer Country Country where account is situated
Customer Created Date Created date of account
Customer Current Assets Current Assets
Customer
Customer Alternate Phone
Number
This is the customer's optional secondary
phone number.
Customer Customer Category
This identifies the category to which the
customer belongs.
Customer Customer Category Name
This is a detailed description of the customer
category.
Customer Customer City Customer City
Customer Customer Country Customer Country
Customer
Customer Direct Marketing
Flag
This flag identifies whether the customer has
explicitly requested no direct marketing
contacts.
Customer Customer Email Address This is the email address of the customer.
Customer Customer Family Name
For individuals, this is the family name/last
name. For organizations that are part of a
larger group, this is the group (family) name.
Customer Customer Fax Number This is the customer's facsimile number.
Customer Customer Individual Gender
This is an individual's gender. Examples
include: Male, Female, and Not Declared.
Customer
Customer Individual Marital
State
This is an individual's marital state, also known
as marital status. Examples include: single,
Presentation Table Presentation Column Description
married, divorced, and widowed.
Customer Customer Individual Title
This is an individual's title. For example Mr.,
Mrs., or Sir.
Customer
Customer Internet Home
Page
This is the home page of the
individual/organization.
Customer Customer Key
Uniquely identifies the person who purchases
the organization's products or services. This is
a surrogate key assigned by Oracle BI
Applications. It is used as a primary key.
Customer Customer Legal Name
This is the full name of the customer, as legally
required for contracts and documentation.
Customer Customer Legal Structure
A classification that defines the legal structure
of the registration of the organization. For
example, partnership, corporation, etc.
Customer
Customer Legal Structure
Name
This provides a detailed description of the
legal structure of the registration of the
organization.
Customer Customer Mobile Number
This is the mobile/cellular number of the
customer.
Customer Customer Name This is the name of the customer.
Customer Customer Number
This is the customer number that is unique for
each customer.
Customer Customer Other Name
For individuals, this is the middle (or other)
name. For organizations, this is the marketing
name.
Customer Customer Pager Number This is the customer's pager number.
Customer Customer Phone Number This is the customer's primary phone number.
Customer Customer Preferred Name
This is the customer's preferred name. This is
generally a first name for individuals and an
acronym or short name for organizations
Customer Customer SIC Code
This is the Standard Industry Classification for
the organization
Customer Customer SIC Name
This is a detailed description of the Standard
Industry Classification code.

Presentation Table Presentation Column Description
Customer Customer Solicitation Flag
This flag defines whether the customer has
specifically requested that no marketing
material be sent to them or that no illegal
contacts are permitted.
Customer Customer State Customer State
Customer Customer Street Address Customer Street Address
Customer Customer Type This code identifies the customer type
Customer Customer Type Name
This is a detailed description of the customer
type
Customer Date Formed Date account formed
Customer Exchange Loc Exchange Loc
Customer Expertise Expertise
Customer Facility Type
Type of loan facility, either ""New"" or
""Renewal"""
Customer Financing Method Financing Method
Customer Freight Terms Freight Terms
Customer Frequency Category Frequency Category
Customer Gross Profit Gross Profit
Customer Growth % Growth %
Customer Growth Horizon Growth Horizon
Customer Growth Objective Growth Objective
Customer Hierarchy Based Login Hierarchy Based Login
Customer Industry Name Industry Name
Customer Key Competitor
Denotes whether an account is a key
competitor or not
Customer Legal Form Legal Form
Customer Line of Business Account's line of business
Customer Main Phone Number Account's main phone number
Customer Margin Vs. Industry Margin Vs. Industry
Customer Market Cap Preference Market Cap Preference
Customer Market Potential Market Potential
Presentation Table Presentation Column Description
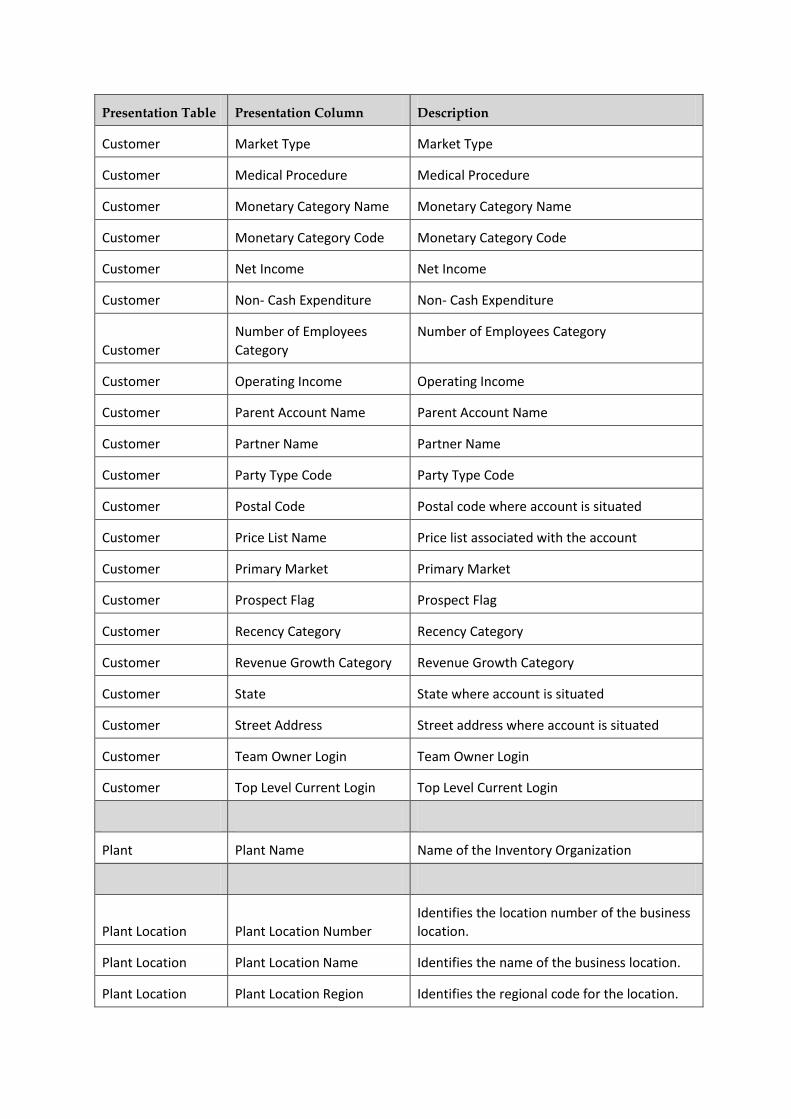
Customer Market Type Market Type
Customer Medical Procedure Medical Procedure
Customer Monetary Category Name Monetary Category Name
Customer Monetary Category Code Monetary Category Code
Customer Net Income Net Income
Customer Non- Cash Expenditure Non- Cash Expenditure
Customer
Number of Employees
Category
Number of Employees Category
Customer Operating Income Operating Income
Customer Parent Account Name Parent Account Name
Customer Partner Name Partner Name
Customer Party Type Code Party Type Code
Customer Postal Code Postal code where account is situated
Customer Price List Name Price list associated with the account
Customer Primary Market Primary Market
Customer Prospect Flag Prospect Flag
Customer Recency Category Recency Category
Customer Revenue Growth Category Revenue Growth Category
Customer State State where account is situated
Customer Street Address Street address where account is situated
Customer Team Owner Login Team Owner Login
Customer Top Level Current Login Top Level Current Login
Plant Plant Name Name of the Inventory Organization
Plant Location Plant Location Number
Identifies the location number of the business
location.
Plant Location Plant Location Name Identifies the name of the business location.
Plant Location Plant Location Region Identifies the regional code for the location.
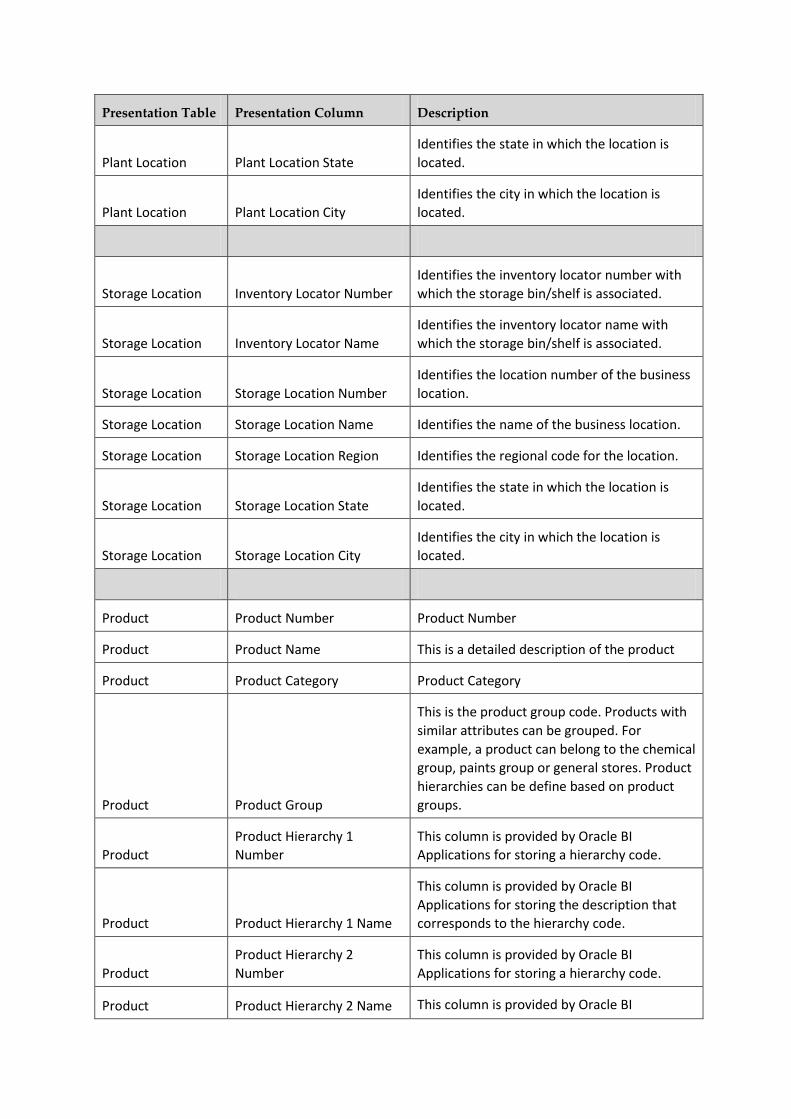
Presentation Table Presentation Column Description
Plant Location Plant Location State
Identifies the state in which the location is
located.
Plant Location Plant Location City
Identifies the city in which the location is
located.
Storage Location Inventory Locator Number
Identifies the inventory locator number with
which the storage bin/shelf is associated.
Storage Location Inventory Locator Name
Identifies the inventory locator name with
which the storage bin/shelf is associated.
Storage Location Storage Location Number
Identifies the location number of the business
location.
Storage Location Storage Location Name Identifies the name of the business location.
Storage Location Storage Location Region Identifies the regional code for the location.
Storage Location Storage Location State
Identifies the state in which the location is
located.
Storage Location Storage Location City
Identifies the city in which the location is
located.
Product Product Number Product Number
Product Product Name This is a detailed description of the product
Product Product Category Product Category
Product Product Group
This is the product group code. Products with
similar attributes can be grouped. For
example, a product can belong to the chemical
group, paints group or general stores. Product
hierarchies can be define based on product
groups.
Product
Product Hierarchy 1
Number
This column is provided by Oracle BI
Applications for storing a hierarchy code.
Product Product Hierarchy 1 Name
This column is provided by Oracle BI
Applications for storing the description that
corresponds to the hierarchy code.
Product
Product Hierarchy 2
Number
This column is provided by Oracle BI
Applications for storing a hierarchy code.
Product Product Hierarchy 2 Name This column is provided by Oracle BI
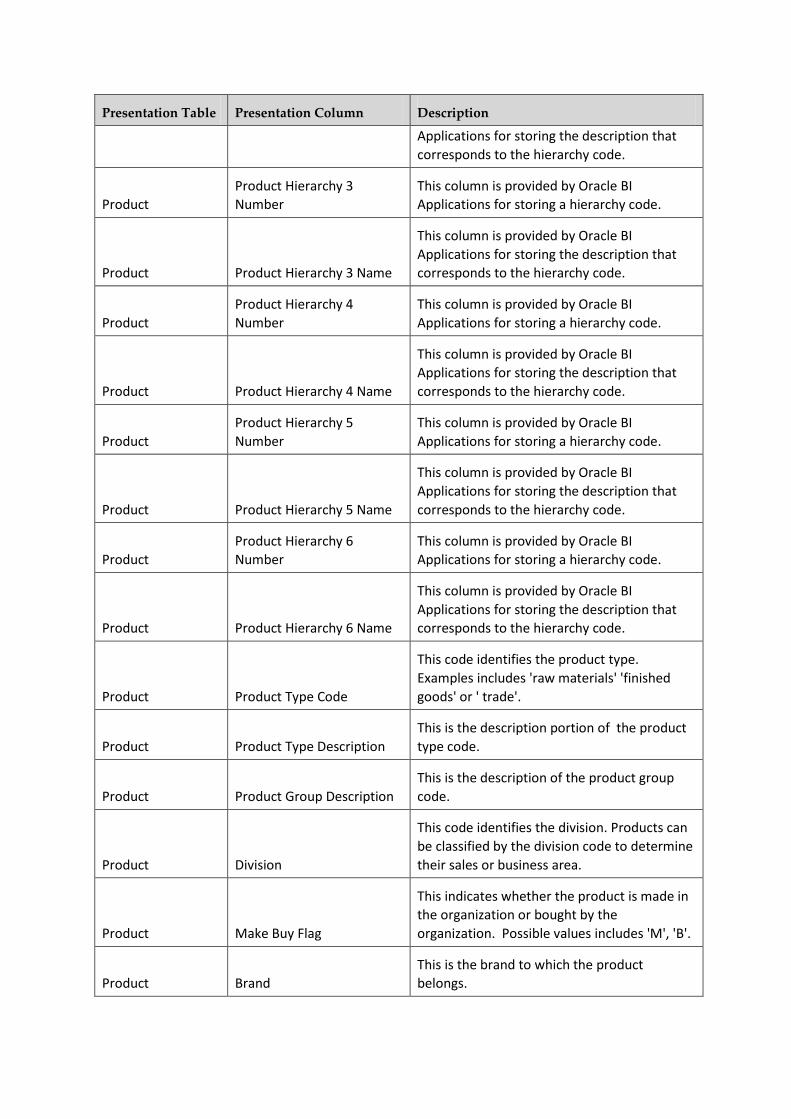
Presentation Table Presentation Column Description
Applications for storing the description that
corresponds to the hierarchy code.
Product
Product Hierarchy 3
Number
This column is provided by Oracle BI
Applications for storing a hierarchy code.
Product Product Hierarchy 3 Name
This column is provided by Oracle BI
Applications for storing the description that
corresponds to the hierarchy code.
Product
Product Hierarchy 4
Number
This column is provided by Oracle BI
Applications for storing a hierarchy code.
Product Product Hierarchy 4 Name
This column is provided by Oracle BI
Applications for storing the description that
corresponds to the hierarchy code.
Product
Product Hierarchy 5
Number
This column is provided by Oracle BI
Applications for storing a hierarchy code.
Product Product Hierarchy 5 Name
This column is provided by Oracle BI
Applications for storing the description that
corresponds to the hierarchy code.
Product
Product Hierarchy 6
Number
This column is provided by Oracle BI
Applications for storing a hierarchy code.
Product Product Hierarchy 6 Name
This column is provided by Oracle BI
Applications for storing the description that
corresponds to the hierarchy code.
Product Product Type Code
This code identifies the product type.
Examples includes 'raw materials' 'finished
goods' or ' trade'.
Product Product Type Description
This is the description portion of the product
type code.
Product Product Group Description
This is the description of the product group
code.
Product Division
This code identifies the division. Products can
be classified by the division code to determine
their sales or business area.
Product Make Buy Flag
This indicates whether the product is made in
the organization or bought by the
organization. Possible values includes 'M', 'B'.
Product Brand
This is the brand to which the product
belongs.

Presentation Table Presentation Column Description
Product Color This identifies the color of the product.
Product Configurable Product Flag
This indicates whether the product is
configurable or not.
Product Configuration Category This code identifies the configuration category
Product Discontinuation Date
This is the date on which the product was
discontinued from the market.
Product Product Repurchase Period
This is the expected period between the
purchases of a product. It is used for
sensitivity and profile styles of analysis. The
repurchase period is stored in monthly units.
Product Sales UOM
This is a sales unit of measure code to
measure the product sold.
Product Shelf Life This is the shelf life of the product
Product Source Of Supply
A field for determining any unique sources of
supply for the product - internal or external.
Product Standard UOM Code
This is the Standard unit of measure code in
which the product is managed.
Item Inventory
Product Product Number
Product Number
Item Inventory
Product Inventory Category
Inventory Category
Item Inventory
Product
Manufacturing Product ABC
Flag
Indicator that classifies a material as an A, B,
or C part according to its consumption value.
Item Inventory
Product
Manufacturing Product
Back flush Flag
Determines whether the back flush indicator is
set in the production order.
Item Inventory
Product
Manufacturing Product Bulk
Item Flag
Bulk item Indicator
Item Inventory
Product
Manufacturing Product
Buyer
Buyer Code
Item Inventory
Product
Manufacturing Product
Buyer Name
Buyer Name
Item Inventory
Product
Manufacturing Product
Commodity
Commodity Code
Item Inventory Manufacturing Product Commodity Name

Presentation Table Presentation Column Description
Product Commodity Description
Item Inventory
Product
Manufacturing Product
Commodity UOM
Unit of measure of commodity
Item Inventory
Product
Manufacturing Product
Commodity UOM Name
Unit of measure of commodity
Item Inventory
Product
Manufacturing Product
External Procurement Time
Time needed to obtain the material or service
if it is procured externally.
Item Inventory
Product
Manufacturing Product
External Storage Location
External storage location Code
Item Inventory
Product
Manufacturing Product
External Storage Location
Name
External storage location description
Item Inventory
Product
Manufacturing Product
Fixed Lot Size
Fixed lot size
Item Inventory
Product
Manufacturing Product
Forecast Period
Forecast period (Like Weekly , Monthly etc)
Item Inventory
Product
Manufacturing Product
Internal Manufacturing
Time
Internal manufacturing time
Item Inventory
Product
Manufacturing Product
Internal Storage Location
Internal storage location Code
Item Inventory
Product
Manufacturing Product
Internal Storage Location
Name
Internal storage location description
Item Inventory
Product
Manufacturing Product
Issue UOM
Unit of measure in issues
Item Inventory
Product
Manufacturing Product
Issue UOM Description
Description of unit of measure in issues
Item Inventory
Product
Manufacturing Product
Loading Type
Loading type Code
Item Inventory
Product
Manufacturing Product
Loading Type Name
Loading type Name
Item Inventory
Product
Manufacturing Product Lot
Ordering Cost
Cost of ordering a lot
Item Inventory
Product
Manufacturing Product Lot
Size
Lot size Code

Presentation Table Presentation Column Description
Item Inventory
Product
Manufacturing Product Lot
Size Name
Lot size description
Item Inventory
Product
Manufacturing Product
Manufacturing UOM
Unit of measure in manufacturing
Item Inventory
Product
Manufacturing Product
Manufacturing UOM
Description
Description of unit of measure in
manufacturing
Item Inventory
Product
Manufacturing Product Max
Lot Size
Maximum lot size
Item Inventory
Product
Manufacturing Product Max
Stock Level
Maximum stock level
Item Inventory
Product
Manufacturing Product Max
Storage Days
Maximum storage period in days
Item Inventory
Product
Manufacturing Product Min
Lot Size
Minimum lot size
Item Inventory
Product
Manufacturing Product
MRP Group
Planning group Code
Item Inventory
Product
Manufacturing Product
MRP Group Description
Planning group description
Item Inventory
Product
Manufacturing Product
MRP Profile
Planning profile Code
Item Inventory
Product
Manufacturing Product
MRP Profile Description
Planning profile description
Item Inventory
Product
Manufacturing Product
MRP Time Fence
Planning time fence
Item Inventory
Product
Manufacturing Product
MRP Type
Planning type Code
Item Inventory
Product
Manufacturing Product
MRP Type Description
Planning type description
Item Inventory
Product
Manufacturing Product
Place Of Manufacture
Place of manufacturing
Item Inventory
Product
Manufacturing Product
Planner
Planner Code
Item Inventory
Product
Manufacturing Product
Planner Name
Planner Name

Presentation Table Presentation Column Description
Item Inventory
Product
Manufacturing Product
Procurement Type
Procurement Type Code
Item Inventory
Product
Manufacturing Product
Procurement Type Name
Procurement Type Description
Item Inventory
Product
Manufacturing Product
Profit Center Name
Profit center name
Item Inventory
Product
Manufacturing Product
Profit Center Number
Profit center number
Item Inventory
Product
Manufacturing Product QA
Inspection Flag
QA Inspection Indicator
Item Inventory
Product
Manufacturing Product
Reorder Point
Reorder point quantity (If the stock falls below
this quantity, the system flags the material for
requirements planning).
Item Inventory
Product
Manufacturing Product
Repetitive Manufacturing
Flag
Repetitive manufacturing Indicator
Item Inventory
Product
Manufacturing Product
Special Procurement Type
Special Procurement Type Code
Item Inventory
Product
Manufacturing Product
Special Procurement Type
Description
Special Procurement Type Description
Item Inventory
Product Plant Safety Stock
This is a product's safety stock level for a
plant. The safety stock level helps to maintain
sufficient on hand inventory to prevent stock-
outs during replenishment cycles.
Component
Product Product Number
Component Product Number
Component
Product Product Name
Name of the Component Product
Component
Product Product Type
Type of the Component Product
Component
Product Product Type Code
This code identifies the Component Product
Type
Component
Product Product Type Description
This is the description portion of the
Component Product Type Code.
Presentation Table Presentation Column Description
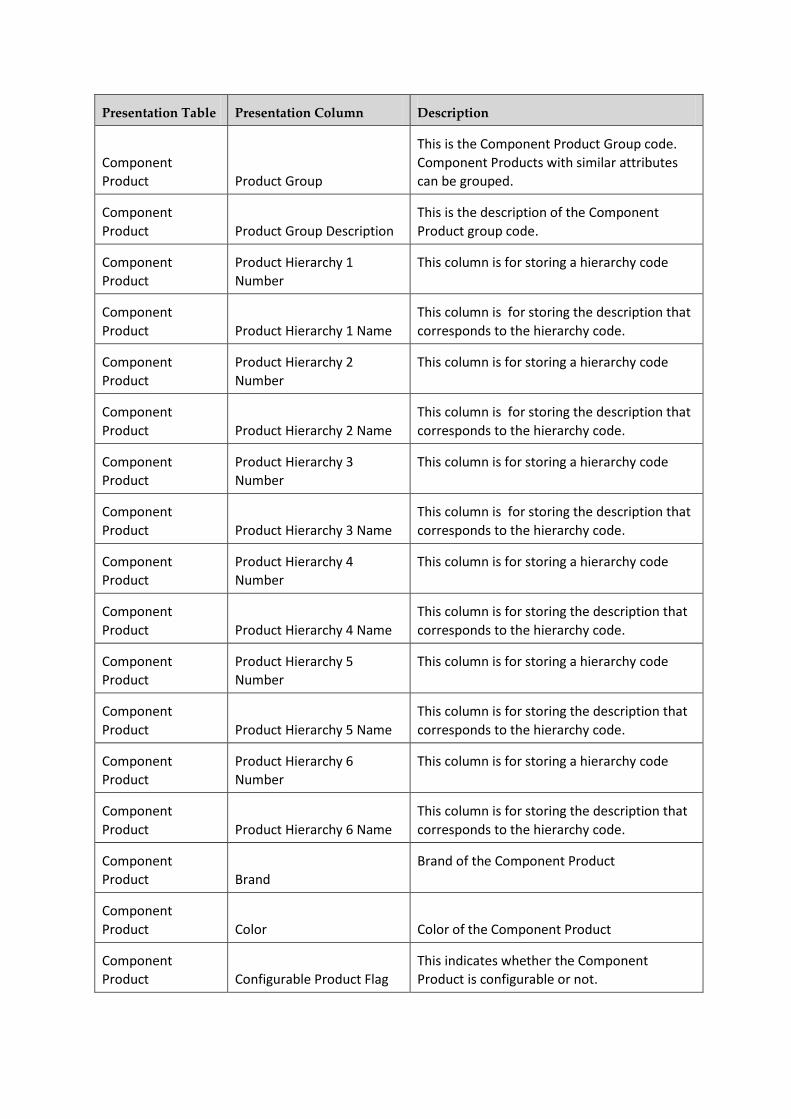
Component
Product Product Group
This is the Component Product Group code.
Component Products with similar attributes
can be grouped.
Component
Product Product Group Description
This is the description of the Component
Product group code.
Component
Product
Product Hierarchy 1
Number
This column is for storing a hierarchy code
Component
Product Product Hierarchy 1 Name
This column is for storing the description that
corresponds to the hierarchy code.
Component
Product
Product Hierarchy 2
Number
This column is for storing a hierarchy code
Component
Product Product Hierarchy 2 Name
This column is for storing the description that
corresponds to the hierarchy code.
Component
Product
Product Hierarchy 3
Number
This column is for storing a hierarchy code
Component
Product Product Hierarchy 3 Name
This column is for storing the description that
corresponds to the hierarchy code.
Component
Product
Product Hierarchy 4
Number
This column is for storing a hierarchy code
Component
Product Product Hierarchy 4 Name
This column is for storing the description that
corresponds to the hierarchy code.
Component
Product
Product Hierarchy 5
Number
This column is for storing a hierarchy code
Component
Product Product Hierarchy 5 Name
This column is for storing the description that
corresponds to the hierarchy code.
Component
Product
Product Hierarchy 6
Number
This column is for storing a hierarchy code
Component
Product Product Hierarchy 6 Name
This column is for storing the description that
corresponds to the hierarchy code.
Component
Product Brand
Brand of the Component Product
Component
Product Color Color of the Component Product
Component
Product Configurable Product Flag
This indicates whether the Component
Product is configurable or not.
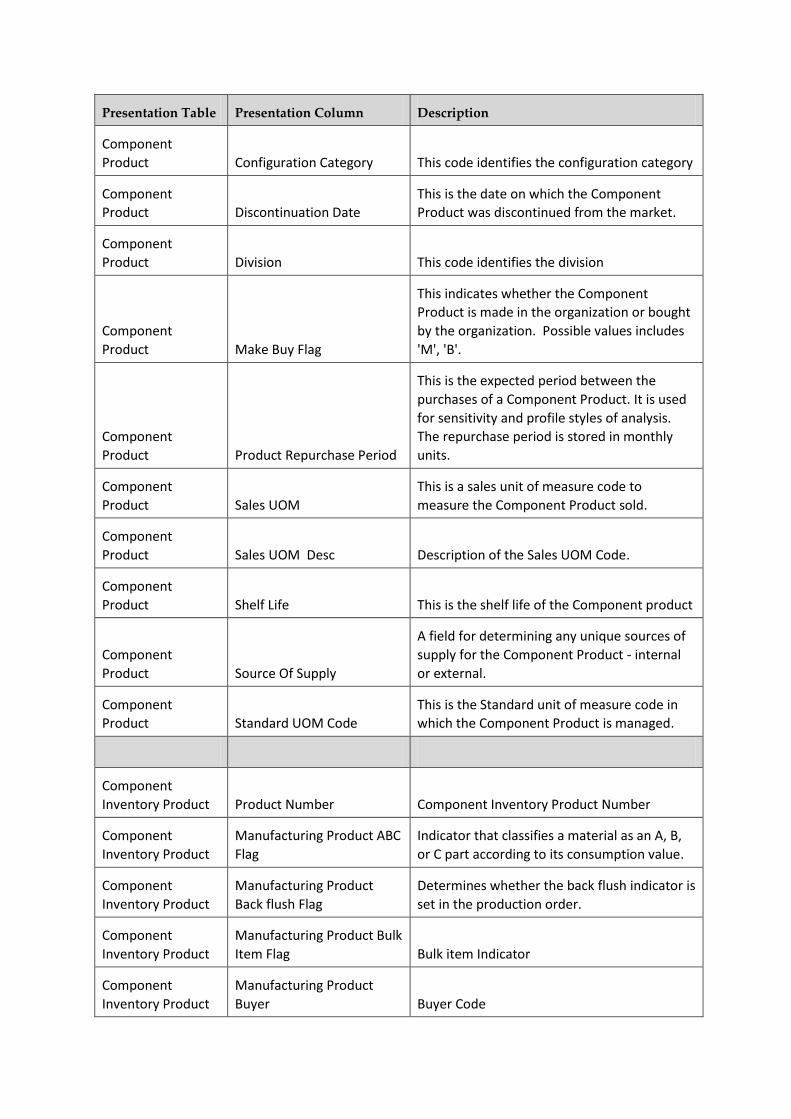
Presentation Table Presentation Column Description
Component
Product Configuration Category This code identifies the configuration category
Component
Product Discontinuation Date
This is the date on which the Component
Product was discontinued from the market.
Component
Product Division This code identifies the division
Component
Product Make Buy Flag
This indicates whether the Component
Product is made in the organization or bought
by the organization. Possible values includes
'M', 'B'.
Component
Product Product Repurchase Period
This is the expected period between the
purchases of a Component Product. It is used
for sensitivity and profile styles of analysis.
The repurchase period is stored in monthly
units.
Component
Product Sales UOM
This is a sales unit of measure code to
measure the Component Product sold.
Component
Product Sales UOM Desc Description of the Sales UOM Code.
Component
Product Shelf Life This is the shelf life of the Component product
Component
Product Source Of Supply
A field for determining any unique sources of
supply for the Component Product - internal
or external.
Component
Product Standard UOM Code
This is the Standard unit of measure code in
which the Component Product is managed.
Component
Inventory Product Product Number Component Inventory Product Number
Component
Inventory Product
Manufacturing Product ABC
Flag
Indicator that classifies a material as an A, B,
or C part according to its consumption value.
Component
Inventory Product
Manufacturing Product
Back flush Flag
Determines whether the back flush indicator is
set in the production order.
Component
Inventory Product
Manufacturing Product Bulk
Item Flag Bulk item Indicator
Component
Inventory Product
Manufacturing Product
Buyer Buyer Code
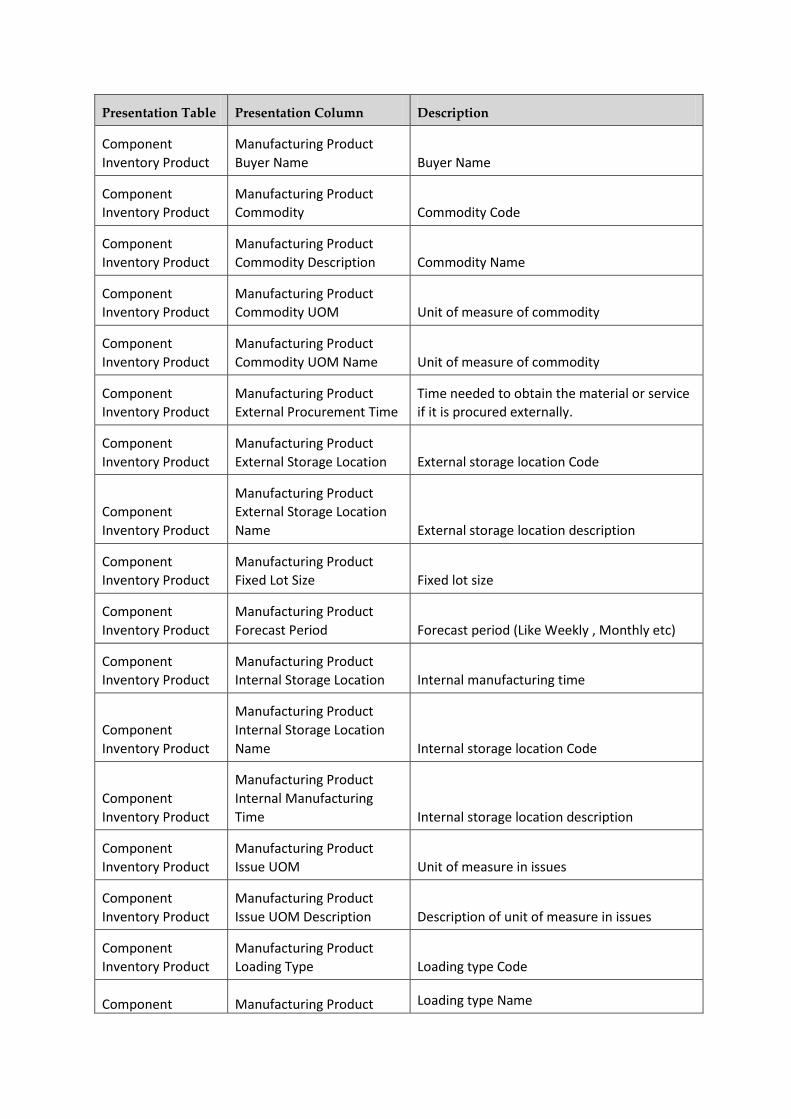
Presentation Table Presentation Column Description
Component
Inventory Product
Manufacturing Product
Buyer Name Buyer Name
Component
Inventory Product
Manufacturing Product
Commodity Commodity Code
Component
Inventory Product
Manufacturing Product
Commodity Description Commodity Name
Component
Inventory Product
Manufacturing Product
Commodity UOM Unit of measure of commodity
Component
Inventory Product
Manufacturing Product
Commodity UOM Name Unit of measure of commodity
Component
Inventory Product
Manufacturing Product
External Procurement Time
Time needed to obtain the material or service
if it is procured externally.
Component
Inventory Product
Manufacturing Product
External Storage Location External storage location Code
Component
Inventory Product
Manufacturing Product
External Storage Location
Name External storage location description
Component
Inventory Product
Manufacturing Product
Fixed Lot Size Fixed lot size
Component
Inventory Product
Manufacturing Product
Forecast Period Forecast period (Like Weekly , Monthly etc)
Component
Inventory Product
Manufacturing Product
Internal Storage Location Internal manufacturing time
Component
Inventory Product
Manufacturing Product
Internal Storage Location
Name Internal storage location Code
Component
Inventory Product
Manufacturing Product
Internal Manufacturing
Time Internal storage location description
Component
Inventory Product
Manufacturing Product
Issue UOM Unit of measure in issues
Component
Inventory Product
Manufacturing Product
Issue UOM Description Description of unit of measure in issues
Component
Inventory Product
Manufacturing Product
Loading Type Loading type Code
Component Manufacturing Product Loading type Name
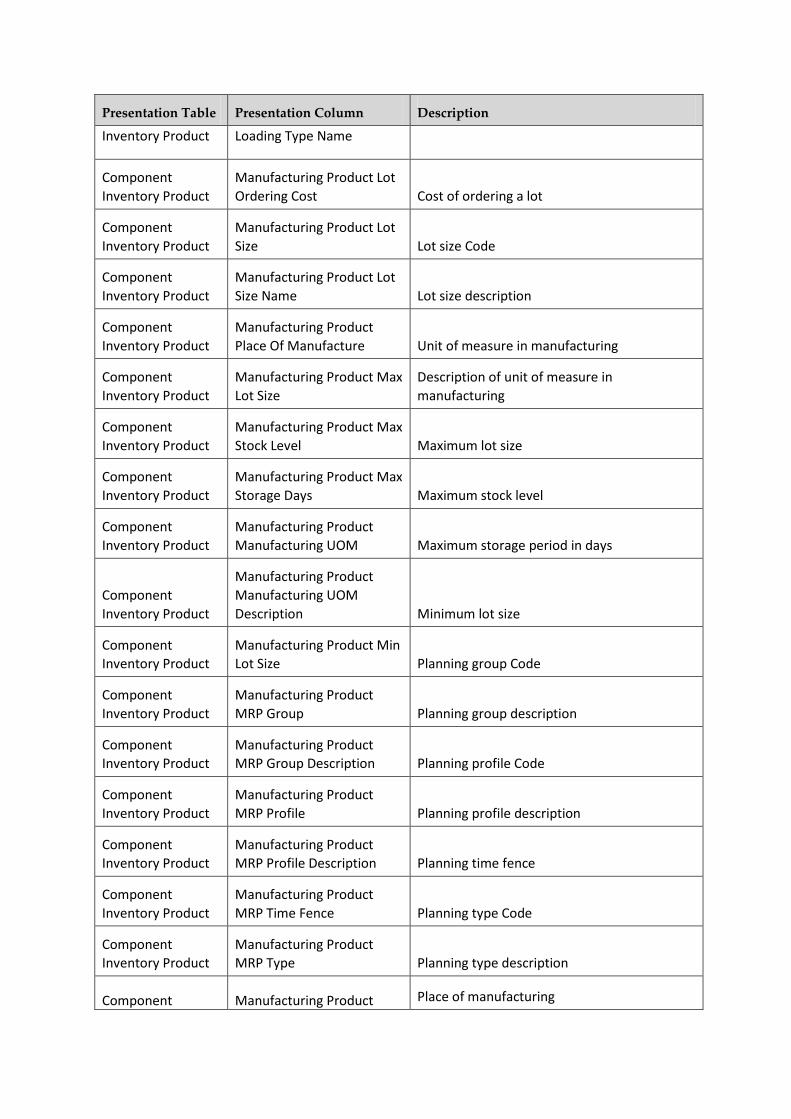
Presentation Table Presentation Column Description
Inventory Product Loading Type Name
Component
Inventory Product
Manufacturing Product Lot
Ordering Cost Cost of ordering a lot
Component
Inventory Product
Manufacturing Product Lot
Size Lot size Code
Component
Inventory Product
Manufacturing Product Lot
Size Name Lot size description
Component
Inventory Product
Manufacturing Product
Place Of Manufacture Unit of measure in manufacturing
Component
Inventory Product
Manufacturing Product Max
Lot Size
Description of unit of measure in
manufacturing
Component
Inventory Product
Manufacturing Product Max
Stock Level Maximum lot size
Component
Inventory Product
Manufacturing Product Max
Storage Days Maximum stock level
Component
Inventory Product
Manufacturing Product
Manufacturing UOM Maximum storage period in days
Component
Inventory Product
Manufacturing Product
Manufacturing UOM
Description Minimum lot size
Component
Inventory Product
Manufacturing Product Min
Lot Size Planning group Code
Component
Inventory Product
Manufacturing Product
MRP Group Planning group description
Component
Inventory Product
Manufacturing Product
MRP Group Description Planning profile Code
Component
Inventory Product
Manufacturing Product
MRP Profile Planning profile description
Component
Inventory Product
Manufacturing Product
MRP Profile Description Planning time fence
Component
Inventory Product
Manufacturing Product
MRP Time Fence Planning type Code
Component
Inventory Product
Manufacturing Product
MRP Type Planning type description
Component Manufacturing Product Place of manufacturing

Presentation Table Presentation Column Description
Inventory Product MRP Type Description
Component
Inventory Product
Manufacturing Product
Planner Planner Code
Component
Inventory Product
Manufacturing Product
Planner Name Planner Name
Component
Inventory Product
Manufacturing Product
Procurement Type Procurement Type Code
Component
Inventory Product
Manufacturing Product
Procurement Type Name Procurement Type Description
Component
Inventory Product
Manufacturing Product
Profit Center Name Profit center name
Component
Inventory Product
Manufacturing Product
Profit Center Number Profit center number
Component
Inventory Product
Manufacturing Product QA
Inspection Flag QA Inspection Indicator
Component
Inventory Product
Manufacturing Product
Reorder Point
Reorder point quantity (If the stock falls below
this quantity, the system flags the material for
requirements planning).
Component
Inventory Product
Manufacturing Product
Repetitive Manufacturing
Flag Repetitive manufacturing Indicator
Component
Inventory Product
Manufacturing Product
Special Procurement Type Special Procurement Type Code
Component
Inventory Product
Manufacturing Product
Special Procurement Type
Description Special Procurement Type Description
Lot Lot Number Number identifier assigned to the Lot
Lot Supplier Lot Number
Applicable for procured item, it is the lot
number assigned by the supplier.
Lot Description Description of the Item Lot
Lot Item Size Item Size
Lot Grade Code Grade Code of the Item Lot
Lot Color Color of the Item Lot
Presentation Table Presentation Column Description
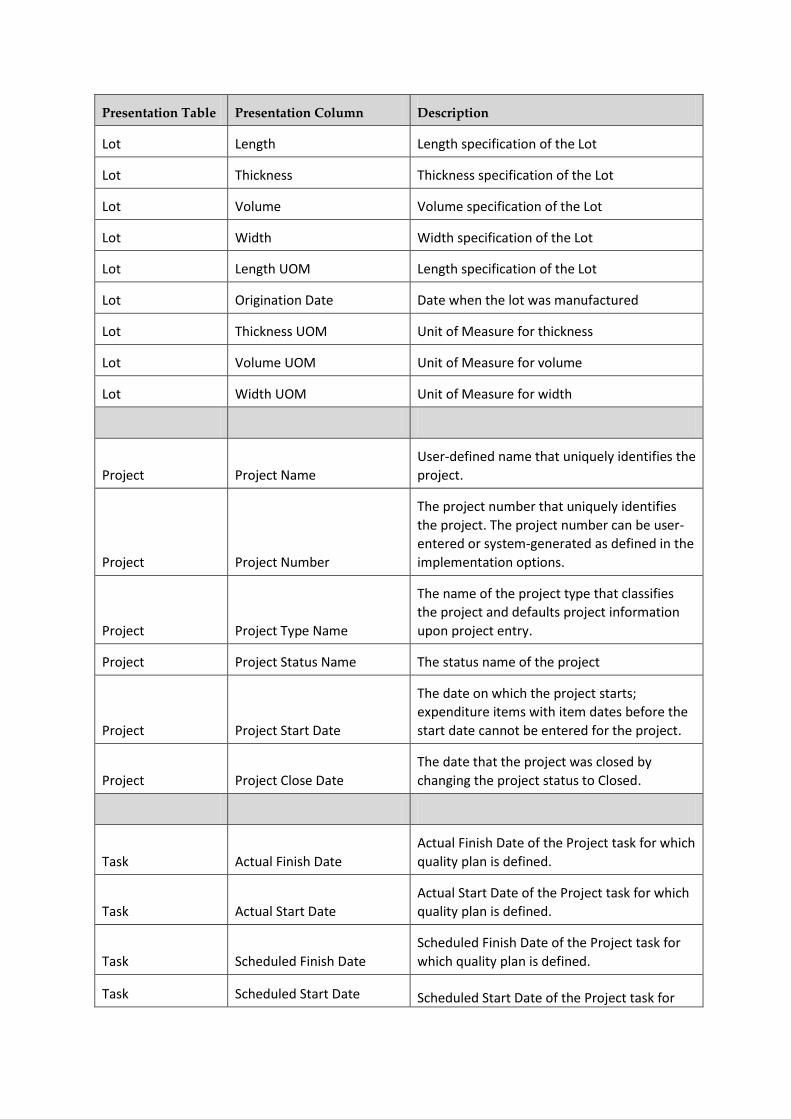
Lot Length Length specification of the Lot
Lot Thickness Thickness specification of the Lot
Lot Volume Volume specification of the Lot
Lot Width Width specification of the Lot
Lot Length UOM Length specification of the Lot
Lot Origination Date Date when the lot was manufactured
Lot Thickness UOM Unit of Measure for thickness
Lot Volume UOM Unit of Measure for volume
Lot Width UOM Unit of Measure for width
Project Project Name
User-defined name that uniquely identifies the
project.
Project Project Number
The project number that uniquely identifies
the project. The project number can be user-
entered or system-generated as defined in the
implementation options.
Project Project Type Name
The name of the project type that classifies
the project and defaults project information
upon project entry.
Project Project Status Name The status name of the project
Project Project Start Date
The date on which the project starts;
expenditure items with item dates before the
start date cannot be entered for the project.
Project Project Close Date
The date that the project was closed by
changing the project status to Closed.
Task Actual Finish Date
Actual Finish Date of the Project task for which
quality plan is defined.
Task Actual Start Date
Actual Start Date of the Project task for which
quality plan is defined.
Task Scheduled Finish Date
Scheduled Finish Date of the Project task for
which quality plan is defined.
Task Scheduled Start Date Scheduled Start Date of the Project task for
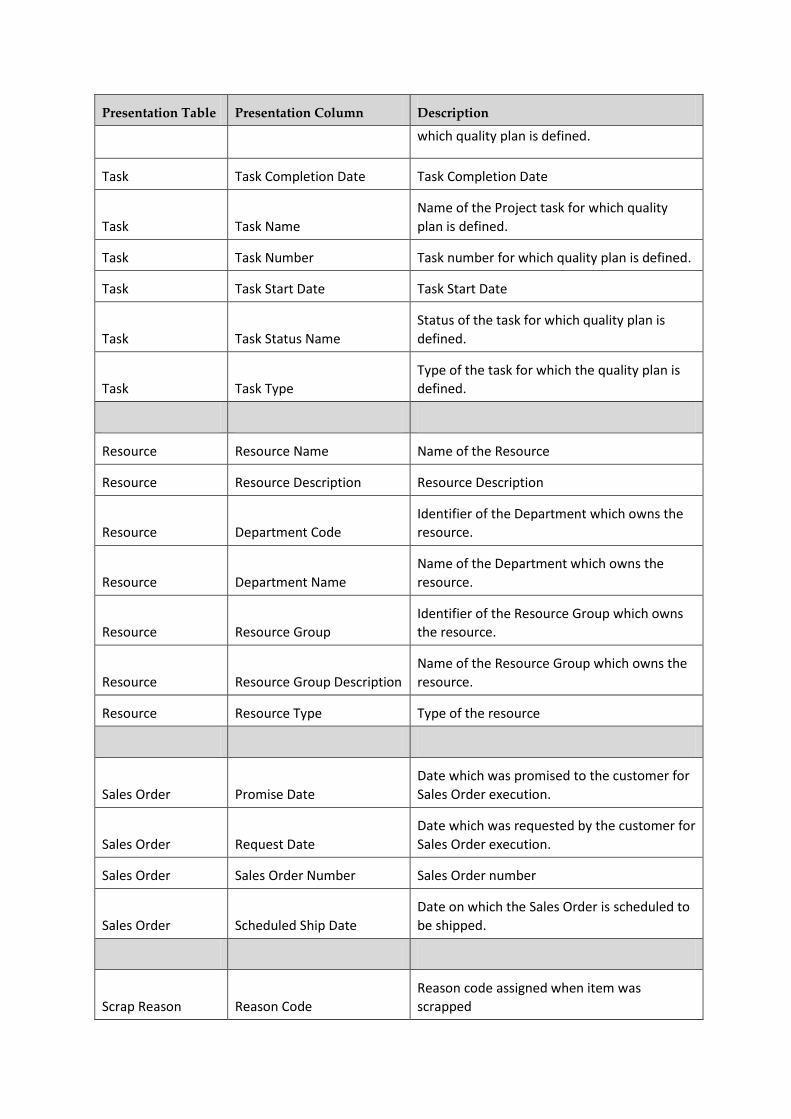
Presentation Table Presentation Column Description
which quality plan is defined.
Task Task Completion Date Task Completion Date
Task Task Name
Name of the Project task for which quality
plan is defined.
Task Task Number Task number for which quality plan is defined.
Task Task Start Date Task Start Date
Task Task Status Name
Status of the task for which quality plan is
defined.
Task Task Type
Type of the task for which the quality plan is
defined.
Resource Resource Name Name of the Resource
Resource Resource Description Resource Description
Resource Department Code
Identifier of the Department which owns the
resource.
Resource Department Name
Name of the Department which owns the
resource.
Resource Resource Group
Identifier of the Resource Group which owns
the resource.
Resource Resource Group Description
Name of the Resource Group which owns the
resource.
Resource Resource Type Type of the resource
Sales Order Promise Date
Date which was promised to the customer for
Sales Order execution.
Sales Order Request Date
Date which was requested by the customer for
Sales Order execution.
Sales Order Sales Order Number Sales Order number
Sales Order Scheduled Ship Date
Date on which the Sales Order is scheduled to
be shipped.
Scrap Reason Reason Code
Reason code assigned when item was
scrapped

Presentation Table Presentation Column Description
Scrap Reason Reason Code Description Description of the scrap reason code
Work Order Work Order Number Work Order Number
Work Order Parent Work Order
The Work Order which led to the creation of
the present Work Order.
Work Order Work Order Status Status of Work Order
Work Order Work Order Type Work Order Type
Work Order Work Order Class Work Order Class
Work Order Bom Revision BOM revision for the primary assembly
Work Order Actual Start Date Actual Start Date of the Work Order
Work Order Actual Completion Date Actual Completion Date of the Work Order
Work Order Alternate Bom Designator Alternate bill of material used in a job
Work Order
Alternate Routing
Designator Alternate routing used in a job
Work Order Bom Revision Date
Date of assembly item revision used to
explode the bills of material used in the job.
Work Order Planned Start Date Planned Start Date of the Work Order
Work Order Due Date Due date for the Work Order
Work Order Planned Completion Date Planned Completion Date of the Work Order
Work Order Closed Date Date when the Work Order is closed
Work Order Actual
Completion Date Year
Year, per Gregorian Calendar, when the Work
Order is actually completed. It is derived from
the Actual Completion Date for the Work
Order.
Work Order Actual
Completion Date Quarter
Quarter, per Gregorian Calendar, when the
Work Order is actually completed. It is derived
from the Actual Completion Date for the Work
Order.
Work Order Actual
Completion Date Month
Month, per Gregorian Calendar, when the
Work Order is actually completed. It is derived
from the Actual Completion Date for the Work
Order.

Presentation Table Presentation Column Description
Work Order Actual
Completion Date Week
Week, per Gregorian Calendar, when the
Work Order is actually completed. It is derived
from the Actual Completion Date for the Work
Order.
Work Order Actual
Completion Date Date
Date, per Gregorian Calendar, when the Work
Order is actually completed.
Work Order Actual
Completion Date Enterprise Year
Year, per Enterprise Calendar, when the Work
Order is actually completed. It is derived from
the Actual. Completion Date for the Work
Order
Work Order Actual
Completion Date Enterprise Quarter
Quarter, per Enterprise Calendar, when the
Work Order is actually completed. It is derived
from the Actual Completion Date for the Work
Order.
Work Order Actual
Completion Date Enterprise Period
Period, per Enterprise Calendar, when the
Work Order is actually completed. It is derived
from the Actual Completion Date for the Work
Order.
Work Order Actual
Completion Date Enterprise Week
Week, per Enterprise Calendar, when the
Work Order is actually completed. It is derived
from the Actual Completion Date for the Work
Order.
Work Order Actual
Start Date Year
Year, per Gregorian Calendar, when the Work
Order is actually started. It is derived from the
Actual Start Date for the Work Order.
Work Order Actual
Start Date Quarter
Quarter, per Gregorian Calendar, when the
Work Order is actually started. It is derived
from the Actual Start Date for the Work Order.
Work Order Actual
Start Date Month
Month, per Gregorian Calendar, when the
Work Order is actually started. It is derived
from the Actual Start Date for the Work Order.
Work Order Actual
Start Date Week
Week, per Gregorian Calendar, when the
Work Order is actually started. It is derived
from the Actual Start Date for the Work Order.
Work Order Actual
Start Date Date
Date, per Gregorian Calendar, when the Work
Order is actually started.
Work Order Actual
Start Date Enterprise Year Year, per Enterprise Calendar, when the Work
Order is actually started. It is derived from the
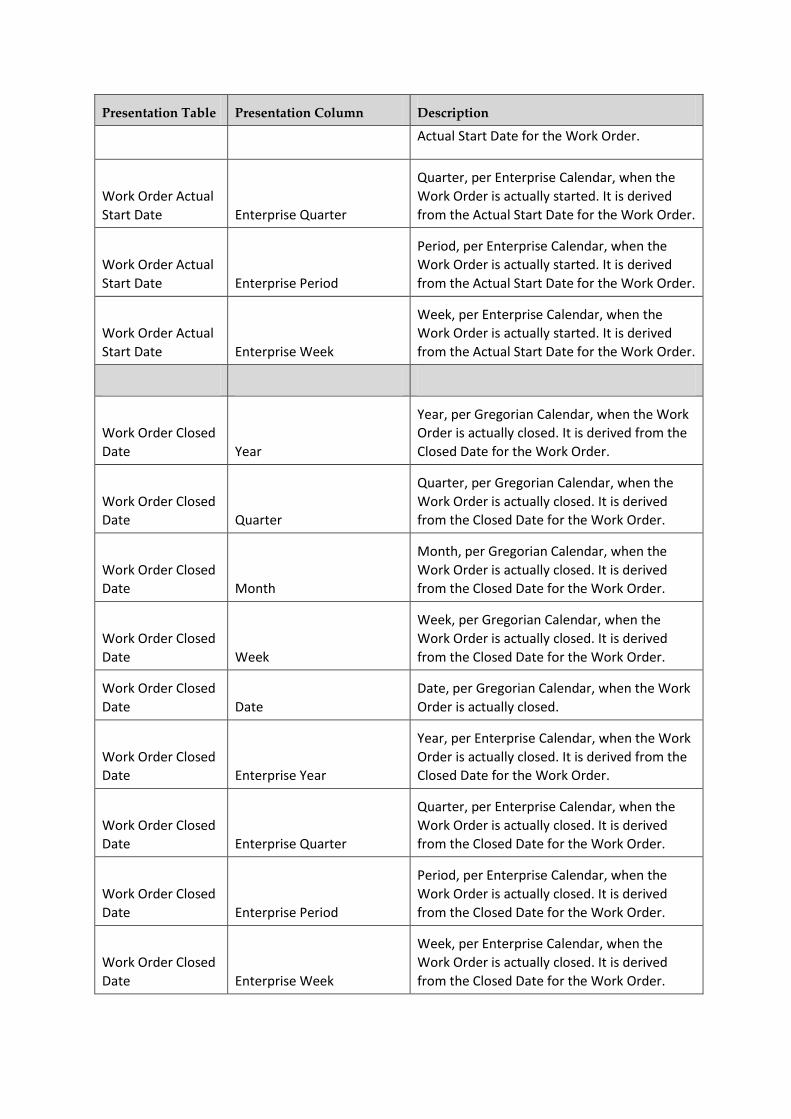
Presentation Table Presentation Column Description
Actual Start Date for the Work Order.
Work Order Actual
Start Date Enterprise Quarter
Quarter, per Enterprise Calendar, when the
Work Order is actually started. It is derived
from the Actual Start Date for the Work Order.
Work Order Actual
Start Date Enterprise Period
Period, per Enterprise Calendar, when the
Work Order is actually started. It is derived
from the Actual Start Date for the Work Order.
Work Order Actual
Start Date Enterprise Week
Week, per Enterprise Calendar, when the
Work Order is actually started. It is derived
from the Actual Start Date for the Work Order.
Work Order Closed
Date Year
Year, per Gregorian Calendar, when the Work
Order is actually closed. It is derived from the
Closed Date for the Work Order.
Work Order Closed
Date Quarter
Quarter, per Gregorian Calendar, when the
Work Order is actually closed. It is derived
from the Closed Date for the Work Order.
Work Order Closed
Date Month
Month, per Gregorian Calendar, when the
Work Order is actually closed. It is derived
from the Closed Date for the Work Order.
Work Order Closed
Date Week
Week, per Gregorian Calendar, when the
Work Order is actually closed. It is derived
from the Closed Date for the Work Order.
Work Order Closed
Date Date
Date, per Gregorian Calendar, when the Work
Order is actually closed.
Work Order Closed
Date Enterprise Year
Year, per Enterprise Calendar, when the Work
Order is actually closed. It is derived from the
Closed Date for the Work Order.
Work Order Closed
Date Enterprise Quarter
Quarter, per Enterprise Calendar, when the
Work Order is actually closed. It is derived
from the Closed Date for the Work Order.
Work Order Closed
Date Enterprise Period
Period, per Enterprise Calendar, when the
Work Order is actually closed. It is derived
from the Closed Date for the Work Order.
Work Order Closed
Date Enterprise Week
Week, per Enterprise Calendar, when the
Work Order is actually closed. It is derived
from the Closed Date for the Work Order.
Presentation Table Presentation Column Description
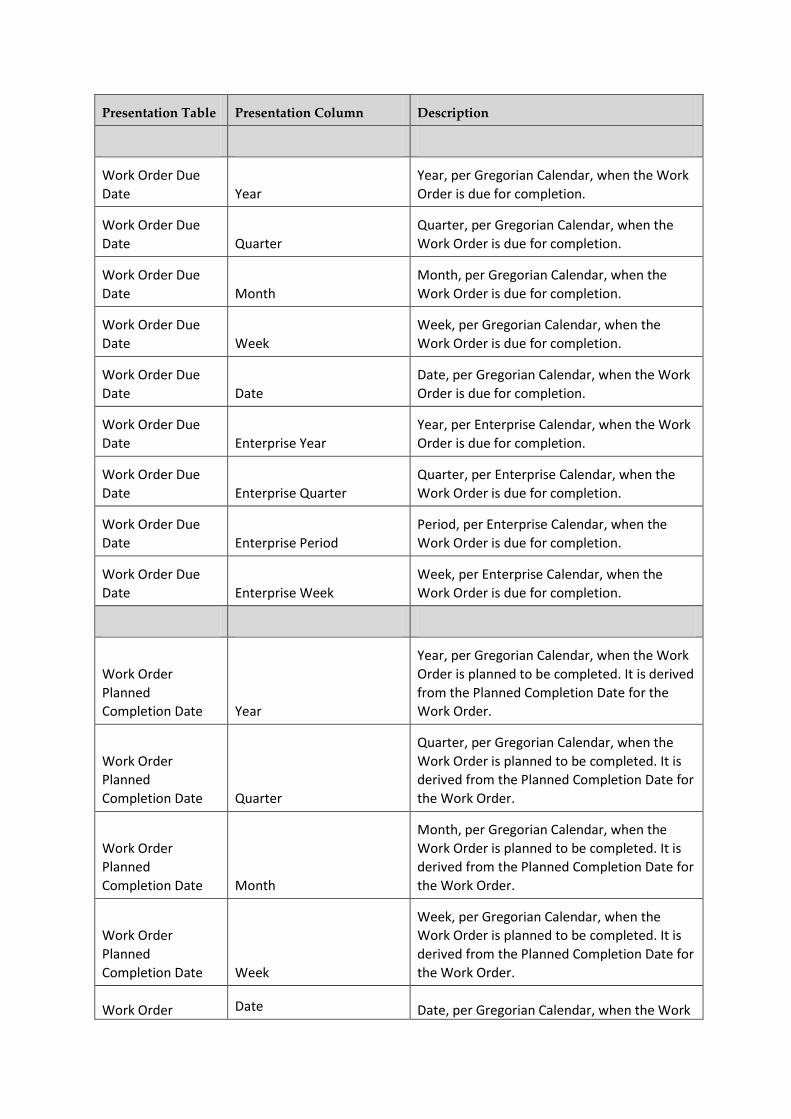
Work Order Due
Date Year
Year, per Gregorian Calendar, when the Work
Order is due for completion.
Work Order Due
Date Quarter
Quarter, per Gregorian Calendar, when the
Work Order is due for completion.
Work Order Due
Date Month
Month, per Gregorian Calendar, when the
Work Order is due for completion.
Work Order Due
Date Week
Week, per Gregorian Calendar, when the
Work Order is due for completion.
Work Order Due
Date Date
Date, per Gregorian Calendar, when the Work
Order is due for completion.
Work Order Due
Date Enterprise Year
Year, per Enterprise Calendar, when the Work
Order is due for completion.
Work Order Due
Date Enterprise Quarter
Quarter, per Enterprise Calendar, when the
Work Order is due for completion.
Work Order Due
Date Enterprise Period
Period, per Enterprise Calendar, when the
Work Order is due for completion.
Work Order Due
Date Enterprise Week
Week, per Enterprise Calendar, when the
Work Order is due for completion.
Work Order
Planned
Completion Date Year
Year, per Gregorian Calendar, when the Work
Order is planned to be completed. It is derived
from the Planned Completion Date for the
Work Order.
Work Order
Planned
Completion Date Quarter
Quarter, per Gregorian Calendar, when the
Work Order is planned to be completed. It is
derived from the Planned Completion Date for
the Work Order.
Work Order
Planned
Completion Date Month
Month, per Gregorian Calendar, when the
Work Order is planned to be completed. It is
derived from the Planned Completion Date for
the Work Order.
Work Order
Planned
Completion Date Week
Week, per Gregorian Calendar, when the
Work Order is planned to be completed. It is
derived from the Planned Completion Date for
the Work Order.
Work Order Date Date, per Gregorian Calendar, when the Work
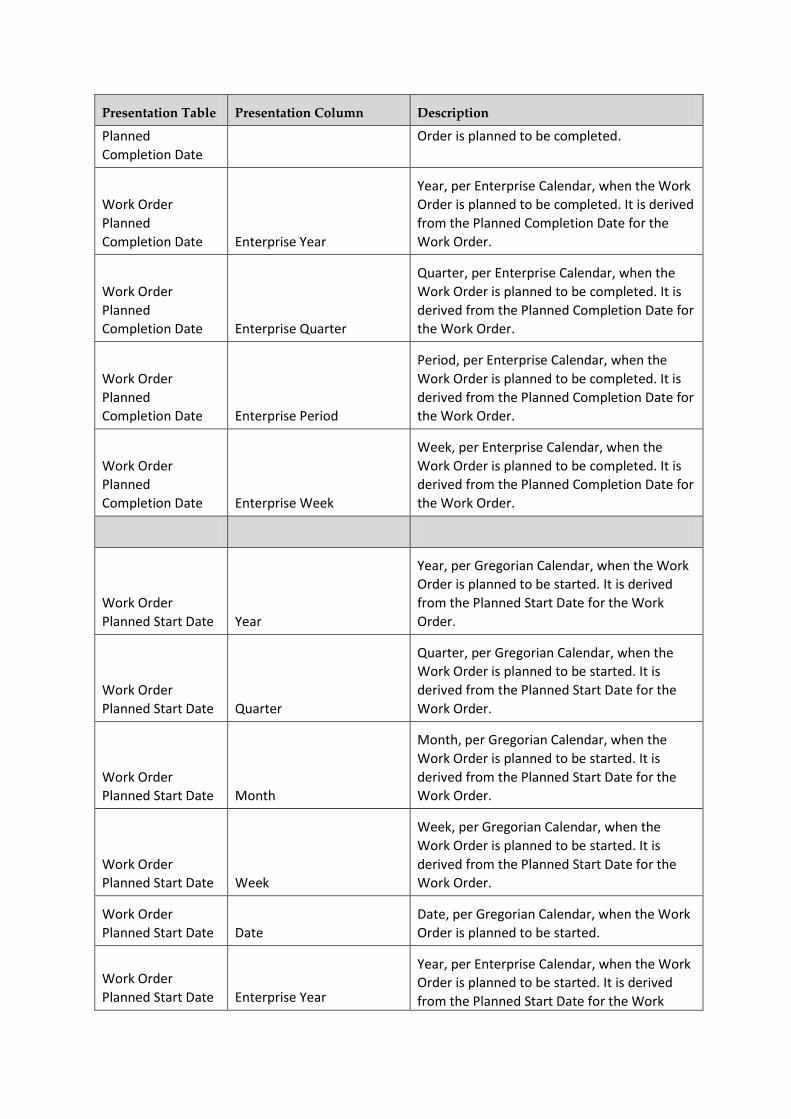
Presentation Table Presentation Column Description
Planned
Completion Date
Order is planned to be completed.
Work Order
Planned
Completion Date Enterprise Year
Year, per Enterprise Calendar, when the Work
Order is planned to be completed. It is derived
from the Planned Completion Date for the
Work Order.
Work Order
Planned
Completion Date Enterprise Quarter
Quarter, per Enterprise Calendar, when the
Work Order is planned to be completed. It is
derived from the Planned Completion Date for
the Work Order.
Work Order
Planned
Completion Date Enterprise Period
Period, per Enterprise Calendar, when the
Work Order is planned to be completed. It is
derived from the Planned Completion Date for
the Work Order.
Work Order
Planned
Completion Date Enterprise Week
Week, per Enterprise Calendar, when the
Work Order is planned to be completed. It is
derived from the Planned Completion Date for
the Work Order.
Work Order
Planned Start Date Year
Year, per Gregorian Calendar, when the Work
Order is planned to be started. It is derived
from the Planned Start Date for the Work
Order.
Work Order
Planned Start Date Quarter
Quarter, per Gregorian Calendar, when the
Work Order is planned to be started. It is
derived from the Planned Start Date for the
Work Order.
Work Order
Planned Start Date Month
Month, per Gregorian Calendar, when the
Work Order is planned to be started. It is
derived from the Planned Start Date for the
Work Order.
Work Order
Planned Start Date Week
Week, per Gregorian Calendar, when the
Work Order is planned to be started. It is
derived from the Planned Start Date for the
Work Order.
Work Order
Planned Start Date Date
Date, per Gregorian Calendar, when the Work
Order is planned to be started.
Work Order
Planned Start Date Enterprise Year
Year, per Enterprise Calendar, when the Work
Order is planned to be started. It is derived
from the Planned Start Date for the Work
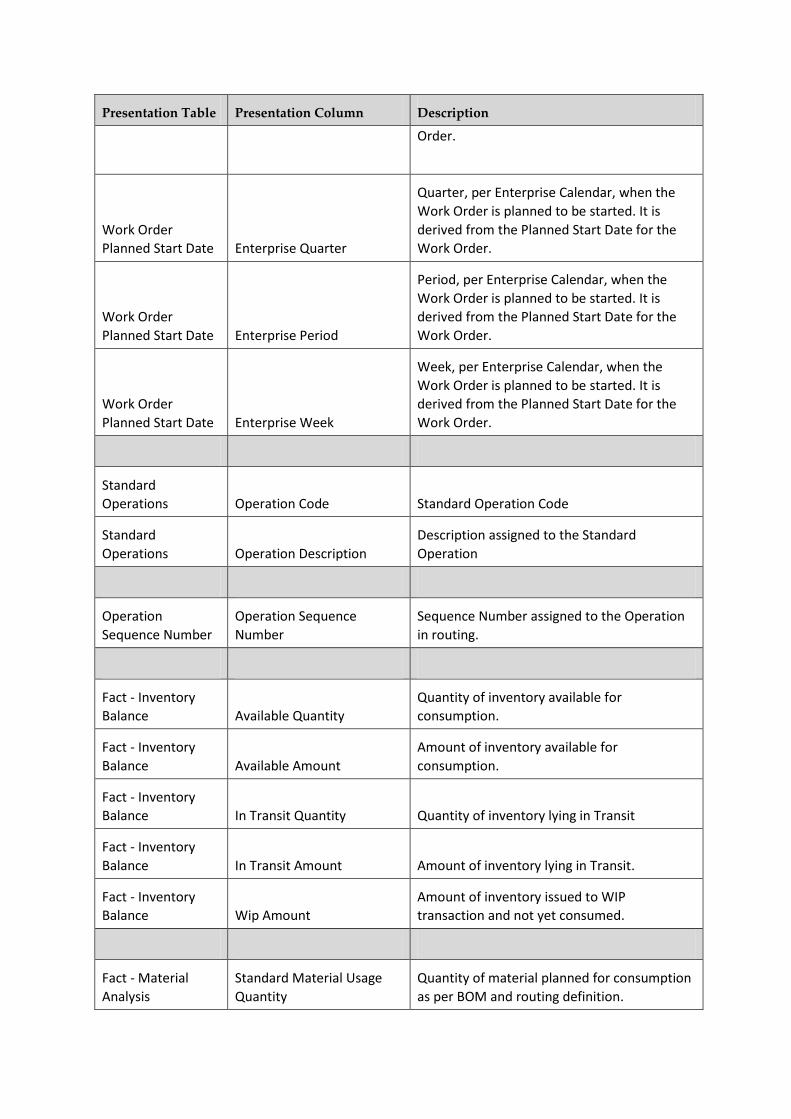
Presentation Table Presentation Column Description
Order.
Work Order
Planned Start Date Enterprise Quarter
Quarter, per Enterprise Calendar, when the
Work Order is planned to be started. It is
derived from the Planned Start Date for the
Work Order.
Work Order
Planned Start Date Enterprise Period
Period, per Enterprise Calendar, when the
Work Order is planned to be started. It is
derived from the Planned Start Date for the
Work Order.
Work Order
Planned Start Date Enterprise Week
Week, per Enterprise Calendar, when the
Work Order is planned to be started. It is
derived from the Planned Start Date for the
Work Order.
Standard
Operations Operation Code Standard Operation Code
Standard
Operations Operation Description
Description assigned to the Standard
Operation
Operation
Sequence Number
Operation Sequence
Number
Sequence Number assigned to the Operation
in routing.
Fact - Inventory
Balance Available Quantity
Quantity of inventory available for
consumption.
Fact - Inventory
Balance Available Amount
Amount of inventory available for
consumption.
Fact - Inventory
Balance In Transit Quantity Quantity of inventory lying in Transit
Fact - Inventory
Balance In Transit Amount Amount of inventory lying in Transit.
Fact - Inventory
Balance Wip Amount
Amount of inventory issued to WIP
transaction and not yet consumed.
Fact - Material
Analysis
Standard Material Usage
Quantity
Quantity of material planned for consumption
as per BOM and routing definition.
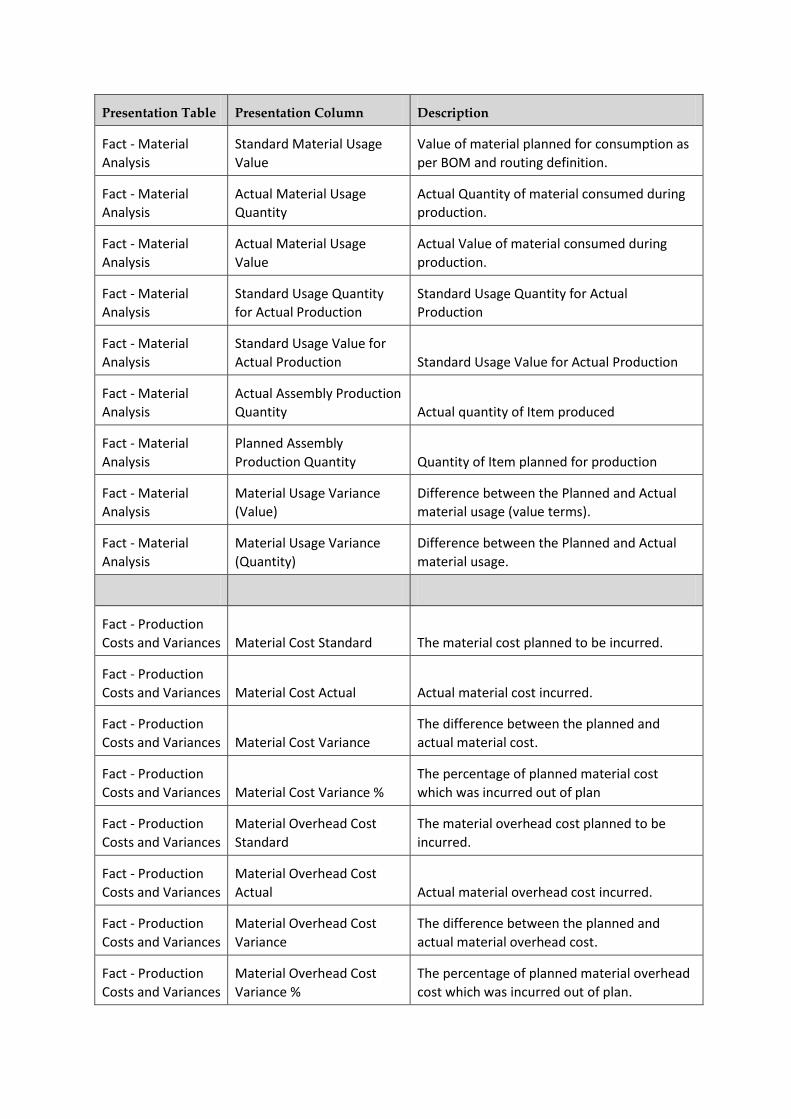
Presentation Table Presentation Column Description
Fact - Material
Analysis
Standard Material Usage
Value
Value of material planned for consumption as
per BOM and routing definition.
Fact - Material
Analysis
Actual Material Usage
Quantity
Actual Quantity of material consumed during
production.
Fact - Material
Analysis
Actual Material Usage
Value
Actual Value of material consumed during
production.
Fact - Material
Analysis
Standard Usage Quantity
for Actual Production
Standard Usage Quantity for Actual
Production
Fact - Material
Analysis
Standard Usage Value for
Actual Production Standard Usage Value for Actual Production
Fact - Material
Analysis
Actual Assembly Production
Quantity Actual quantity of Item produced
Fact - Material
Analysis
Planned Assembly
Production Quantity Quantity of Item planned for production
Fact - Material
Analysis
Material Usage Variance
(Value)
Difference between the Planned and Actual
material usage (value terms).
Fact - Material
Analysis
Material Usage Variance
(Quantity)
Difference between the Planned and Actual
material usage.
Fact - Production
Costs and Variances Material Cost Standard The material cost planned to be incurred.
Fact - Production
Costs and Variances Material Cost Actual Actual material cost incurred.
Fact - Production
Costs and Variances Material Cost Variance
The difference between the planned and
actual material cost.
Fact - Production
Costs and Variances Material Cost Variance %
The percentage of planned material cost
which was incurred out of plan
Fact - Production
Costs and Variances
Material Overhead Cost
Standard
The material overhead cost planned to be
incurred.
Fact - Production
Costs and Variances
Material Overhead Cost
Actual Actual material overhead cost incurred.
Fact - Production
Costs and Variances
Material Overhead Cost
Variance
The difference between the planned and
actual material overhead cost.
Fact - Production
Costs and Variances
Material Overhead Cost
Variance %
The percentage of planned material overhead
cost which was incurred out of plan.
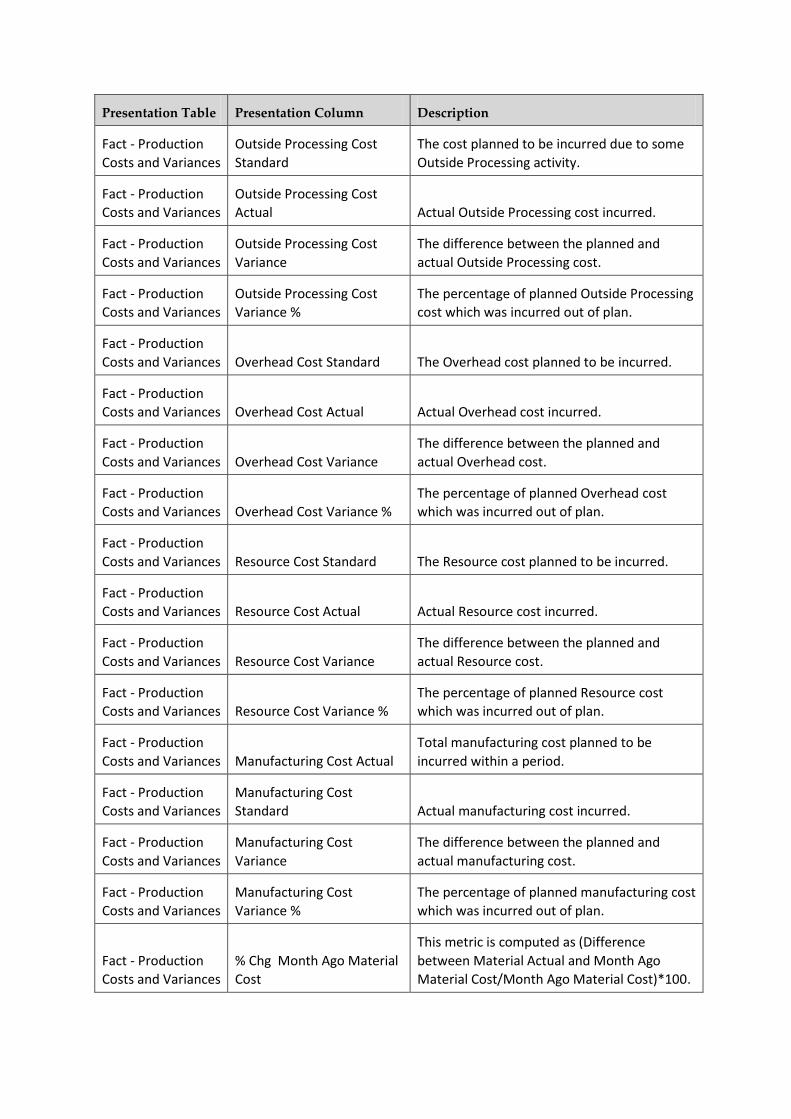
Presentation Table Presentation Column Description
Fact - Production
Costs and Variances
Outside Processing Cost
Standard
The cost planned to be incurred due to some
Outside Processing activity.
Fact - Production
Costs and Variances
Outside Processing Cost
Actual Actual Outside Processing cost incurred.
Fact - Production
Costs and Variances
Outside Processing Cost
Variance
The difference between the planned and
actual Outside Processing cost.
Fact - Production
Costs and Variances
Outside Processing Cost
Variance %
The percentage of planned Outside Processing
cost which was incurred out of plan.
Fact - Production
Costs and Variances Overhead Cost Standard The Overhead cost planned to be incurred.
Fact - Production
Costs and Variances Overhead Cost Actual Actual Overhead cost incurred.
Fact - Production
Costs and Variances Overhead Cost Variance
The difference between the planned and
actual Overhead cost.
Fact - Production
Costs and Variances Overhead Cost Variance %
The percentage of planned Overhead cost
which was incurred out of plan.
Fact - Production
Costs and Variances Resource Cost Standard The Resource cost planned to be incurred.
Fact - Production
Costs and Variances Resource Cost Actual Actual Resource cost incurred.
Fact - Production
Costs and Variances Resource Cost Variance
The difference between the planned and
actual Resource cost.
Fact - Production
Costs and Variances Resource Cost Variance %
The percentage of planned Resource cost
which was incurred out of plan.
Fact - Production
Costs and Variances Manufacturing Cost Actual
Total manufacturing cost planned to be
incurred within a period.
Fact - Production
Costs and Variances
Manufacturing Cost
Standard Actual manufacturing cost incurred.
Fact - Production
Costs and Variances
Manufacturing Cost
Variance
The difference between the planned and
actual manufacturing cost.
Fact - Production
Costs and Variances
Manufacturing Cost
Variance %
The percentage of planned manufacturing cost
which was incurred out of plan.
Fact - Production
Costs and Variances
% Chg Month Ago Material
Cost
This metric is computed as (Difference
between Material Actual and Month Ago
Material Cost/Month Ago Material Cost)*100.

Presentation Table Presentation Column Description
Fact - Production
Costs and Variances
% Chg Month Ago Material
Overhead Cost
This metric is computed as (Difference
between Material Overhead Actual and Month
Ago Material Overhead Cost/Month Ago
Material Overhead Cost)*100.
Fact - Production
Costs and Variances
% Chg Month Ago Outside
Processing Cost
This metric is computed as (Difference
between Outside Processing Actual and
Month Ago Outside Processing Cost/Month
Ago Outside Processing Cost)*100.
Fact - Production
Costs and Variances
% Chg Month Ago
Overhead Cost
This metric is computed as (Difference
between Overhead Actual and Month Ago
Overhead Cost/Month Ago Overhead
Cost)*100.
Fact - Production
Costs and Variances
% Chg Month Ago Resource
Cost
This metric is computed as (Difference
between Resource Actual and Month Ago
Resource Cost/Month Ago Resource
Cost)*100.
Fact - Production
Costs and Variances
% Chg Quarter Ago Material
Cost
This metric is computed as (Difference
between Material Actual and Month Ago
Material Cost/Quarter Ago Material
Cost)*100.
Fact - Production
Costs and Variances
% Chg Quarter Ago Material
Overhead Cost
This metric is computed as (Difference
between Material Overhead Actual and Month
Ago Material Overhead Cost/Quarter Ago
Material Overhead Cost)*100.
Fact - Production
Costs and Variances
% Chg Quarter Ago Outside
Processing Cost
This metric is computed as (Difference
between Outside Processing Actual and
Month Ago Outside Processing Cost/Quarter
Ago Outside Processing Cost)*100.
Fact - Production
Costs and Variances
% Chg Quarter Ago
Overhead Cost
This metric is computed as (Difference
between Overhead Actual and Month Ago
Overhead Cost/Quarter Ago Overhead
Cost)*100.
Fact - Production
Costs and Variances
% Chg Quarter Ago
Resource Cost
This metric is computed as (Difference
between Resource Actual and Month Ago
Resource Cost/Quarter Ago Resource
Cost)*100.
Fact - Production
Costs and Variances
% Chg Year Ago Material
Cost
This metric is computed as (Difference
between Material Actual and Month Ago
Material Cost/Year Ago Material Cost*100.
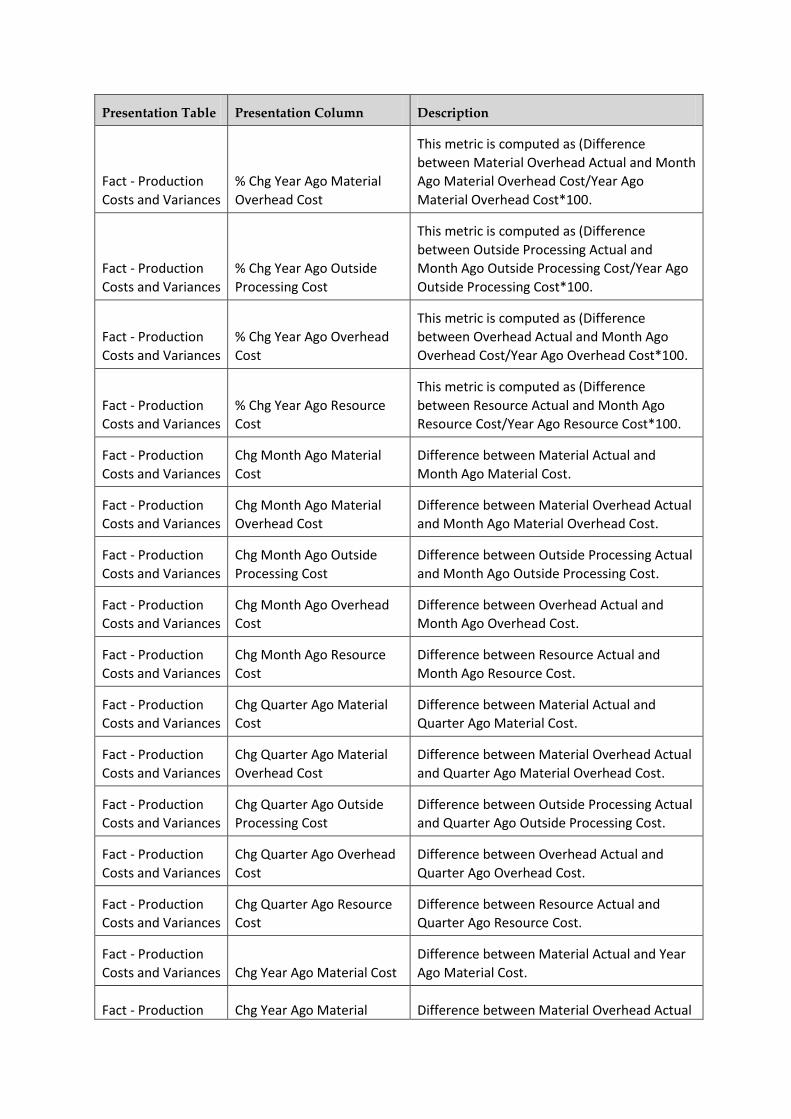
Presentation Table Presentation Column Description
Fact - Production
Costs and Variances
% Chg Year Ago Material
Overhead Cost
This metric is computed as (Difference
between Material Overhead Actual and Month
Ago Material Overhead Cost/Year Ago
Material Overhead Cost*100.
Fact - Production
Costs and Variances
% Chg Year Ago Outside
Processing Cost
This metric is computed as (Difference
between Outside Processing Actual and
Month Ago Outside Processing Cost/Year Ago
Outside Processing Cost*100.
Fact - Production
Costs and Variances
% Chg Year Ago Overhead
Cost
This metric is computed as (Difference
between Overhead Actual and Month Ago
Overhead Cost/Year Ago Overhead Cost*100.
Fact - Production
Costs and Variances
% Chg Year Ago Resource
Cost
This metric is computed as (Difference
between Resource Actual and Month Ago
Resource Cost/Year Ago Resource Cost*100.
Fact - Production
Costs and Variances
Chg Month Ago Material
Cost
Difference between Material Actual and
Month Ago Material Cost.
Fact - Production
Costs and Variances
Chg Month Ago Material
Overhead Cost
Difference between Material Overhead Actual
and Month Ago Material Overhead Cost.
Fact - Production
Costs and Variances
Chg Month Ago Outside
Processing Cost
Difference between Outside Processing Actual
and Month Ago Outside Processing Cost.
Fact - Production
Costs and Variances
Chg Month Ago Overhead
Cost
Difference between Overhead Actual and
Month Ago Overhead Cost.
Fact - Production
Costs and Variances
Chg Month Ago Resource
Cost
Difference between Resource Actual and
Month Ago Resource Cost.
Fact - Production
Costs and Variances
Chg Quarter Ago Material
Cost
Difference between Material Actual and
Quarter Ago Material Cost.
Fact - Production
Costs and Variances
Chg Quarter Ago Material
Overhead Cost
Difference between Material Overhead Actual
and Quarter Ago Material Overhead Cost.
Fact - Production
Costs and Variances
Chg Quarter Ago Outside
Processing Cost
Difference between Outside Processing Actual
and Quarter Ago Outside Processing Cost.
Fact - Production
Costs and Variances
Chg Quarter Ago Overhead
Cost
Difference between Overhead Actual and
Quarter Ago Overhead Cost.
Fact - Production
Costs and Variances
Chg Quarter Ago Resource
Cost
Difference between Resource Actual and
Quarter Ago Resource Cost.
Fact - Production
Costs and Variances Chg Year Ago Material Cost
Difference between Material Actual and Year
Ago Material Cost.
Fact - Production Chg Year Ago Material Difference between Material Overhead Actual

Presentation Table Presentation Column Description
Costs and Variances Overhead Cost and Year Ago Material Overhead Cost.
Fact - Production
Costs and Variances
Chg Year Ago Outside
Processing Cost
Difference between Outside Processing Actual
and Year Ago Outside Processing Cost.
Fact - Production
Costs and Variances
Chg Year Ago Overhead
Cost
Difference between Overhead Cost Actual and
Year Ago Overhead Cost.
Fact - Production
Costs and Variances Chg Year Ago Resource Cost
Difference between Resource Cost Actual and
Year Ago Resource Cost.
Fact - Production
Costs and Variances Month Ago Material Cost Material Cost of the work order last month
Fact - Production
Costs and Variances
Month Ago Material
Overhead Cost
Material Overhead Cost of the work order last
month.
Fact - Production
Costs and Variances
Month Ago Outside
Processing Cost
Outside Processing Cost of the work order last
month.
Fact - Production
Costs and Variances Month Ago Overhead Cost Overhead Cost of the work order last month
Fact - Production
Costs and Variances Month Ago Resource Cost Resource Cost of the work order last month
Fact - Production
Costs and Variances Quarter Ago Material Cost Material Cost of the work order last quarter
Fact - Production
Costs and Variances
Quarter Ago Material
Overhead Cost
Material Overhead Cost of the work order last
quarter.
Fact - Production
Costs and Variances
Quarter Ago Outside
Processing Cost
Outside Processing Cost of the work order last
quarter
Fact - Production
Costs and Variances Quarter Ago Overhead Cost Overhead Cost of the work order last quarter
Fact - Production
Costs and Variances Quarter Ago Resource Cost Resource Cost of the work order last quarter
Fact - Production
Costs and Variances
Quarter Ago Manufacturing
Cost
Manufacturing Cost of the work order last
quarter
Fact - Production
Costs and Variances Year Ago Material Cost Material Cost of the work order last year
Fact - Production
Costs and Variances
Year Ago Material
Overhead Cost
Material Overhead Cost of the work order last
year
Fact - Production
Costs and Variances
Year Ago Outside
Processing Cost
Outside Processing Cost of the work order last
year
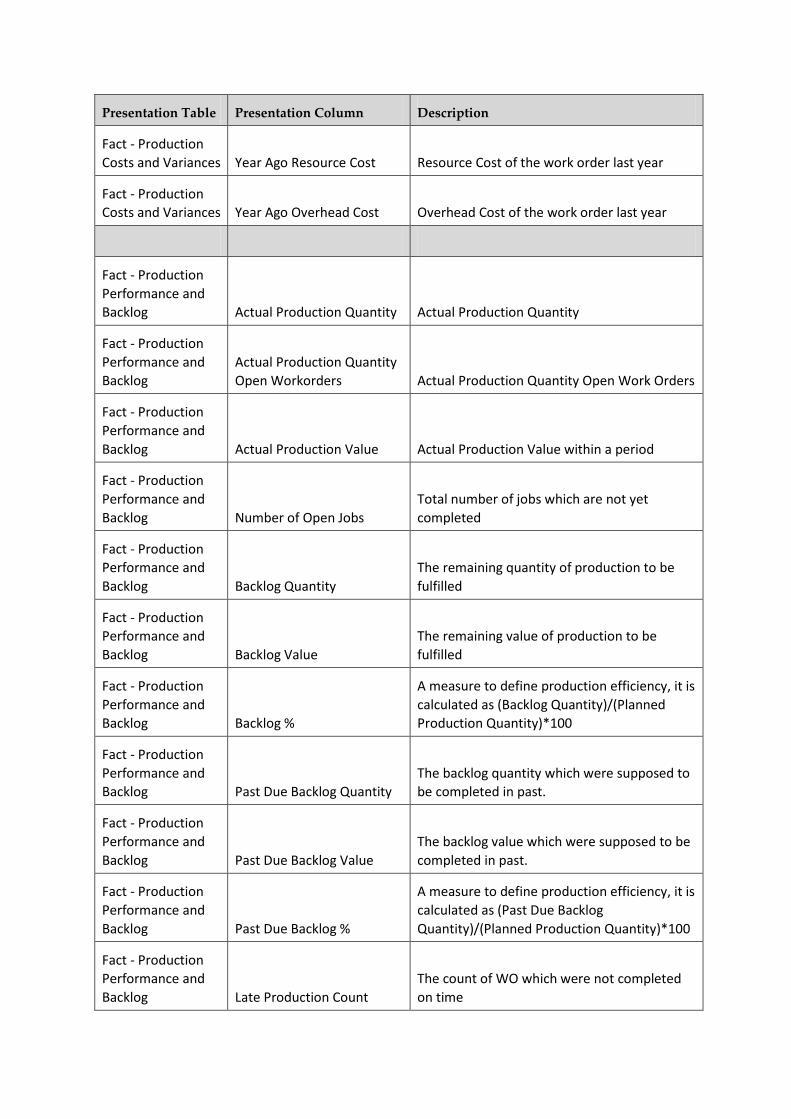
Presentation Table Presentation Column Description
Fact - Production
Costs and Variances Year Ago Resource Cost Resource Cost of the work order last year
Fact - Production
Costs and Variances Year Ago Overhead Cost Overhead Cost of the work order last year
Fact - Production
Performance and
Backlog Actual Production Quantity Actual Production Quantity
Fact - Production
Performance and
Backlog
Actual Production Quantity
Open Workorders Actual Production Quantity Open Work Orders
Fact - Production
Performance and
Backlog Actual Production Value Actual Production Value within a period
Fact - Production
Performance and
Backlog Number of Open Jobs
Total number of jobs which are not yet
completed
Fact - Production
Performance and
Backlog Backlog Quantity
The remaining quantity of production to be
fulfilled
Fact - Production
Performance and
Backlog Backlog Value
The remaining value of production to be
fulfilled
Fact - Production
Performance and
Backlog Backlog %
A measure to define production efficiency, it is
calculated as (Backlog Quantity)/(Planned
Production Quantity)*100
Fact - Production
Performance and
Backlog Past Due Backlog Quantity
The backlog quantity which were supposed to
be completed in past.
Fact - Production
Performance and
Backlog Past Due Backlog Value
The backlog value which were supposed to be
completed in past.
Fact - Production
Performance and
Backlog Past Due Backlog %
A measure to define production efficiency, it is
calculated as (Past Due Backlog
Quantity)/(Planned Production Quantity)*100
Fact - Production
Performance and
Backlog Late Production Count
The count of WO which were not completed
on time

Presentation Table Presentation Column Description
Fact - Production
Performance and
Backlog Late Production Quantity
The planned production quantity which were
not completed on time
Fact - Production
Performance and
Backlog Late Production Value
The planned production value which were not
completed on time
Fact - Production
Performance and
Backlog On Time Production Count
The count of WO which were completed on
time
Fact - Production
Performance and
Backlog
On Time Production
Quantity
The planned production quantity which were
completed on time
Fact - Production
Performance and
Backlog On Time Production Value
The planned production value which were
completed on time
Fact - Production
Performance and
Backlog Performance to Schedule %
The percentage of Work Order which were
completed as per schedule
Fact - Production
Performance and
Backlog Planned Production Value Planned Production Value within a period
Fact - Production
Performance and
Backlog
Production Backlog Days of
production
The number of days required to fulfill the
production backlog
Fact - Production
Performance and
Backlog
Start Quantity for Open
Work Orders Start Quantity for Open Work Orders
Fact - Production
Performance and
Backlog Number of Work Orders Number of Work Orders
Fact - Production
Performance and
Backlog
Number of Completed
Work Orders Number of Completed Work Orders
Fact - Production
Performance and
Backlog
Cycle Time for Work Orders
(Hours)
The total time taken for Work Order
Completion. Measured as (Last Unit Actual
Completion Time - First Unit Actual Start Time)
Fact - Production
Performance and
Backlog
Planned Production
Quantity
The quantity of items planned for production
within a particular period of time
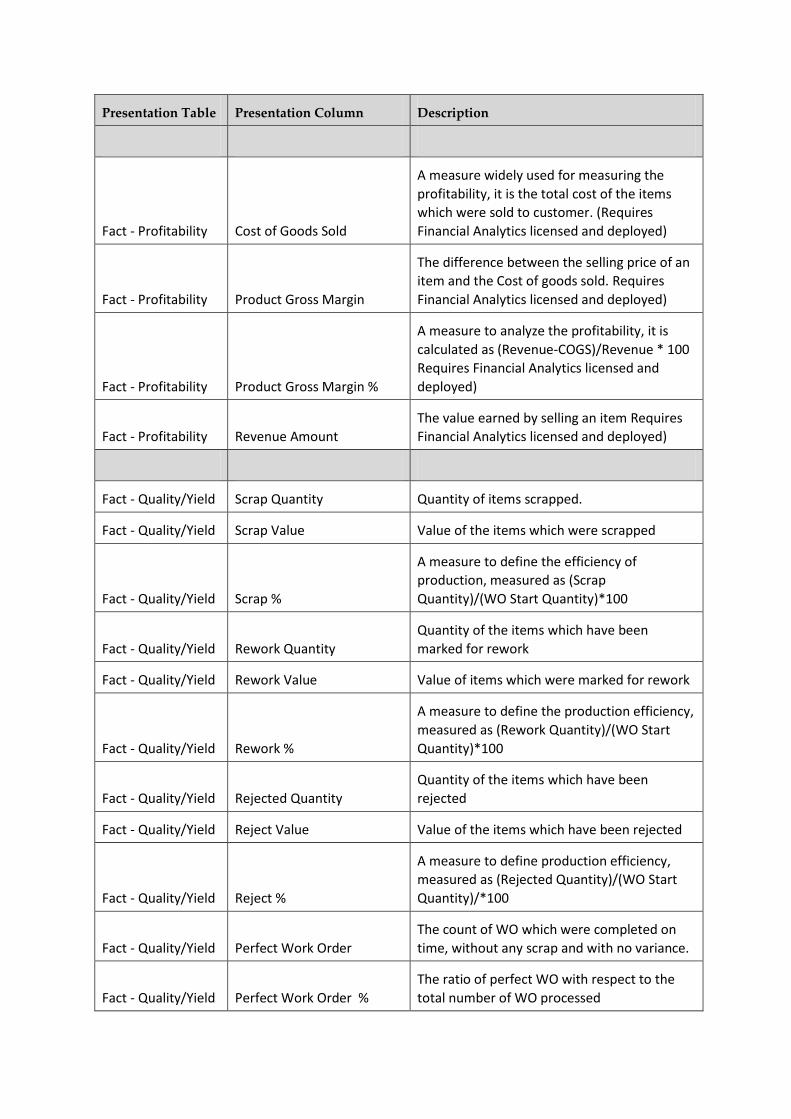
Presentation Table Presentation Column Description
Fact - Profitability Cost of Goods Sold
A measure widely used for measuring the
profitability, it is the total cost of the items
which were sold to customer. (Requires
Financial Analytics licensed and deployed)
Fact - Profitability Product Gross Margin
The difference between the selling price of an
item and the Cost of goods sold. Requires
Financial Analytics licensed and deployed)
Fact - Profitability Product Gross Margin %
A measure to analyze the profitability, it is
calculated as (Revenue-COGS)/Revenue * 100
Requires Financial Analytics licensed and
deployed)
Fact - Profitability Revenue Amount
The value earned by selling an item Requires
Financial Analytics licensed and deployed)
Fact - Quality/Yield Scrap Quantity Quantity of items scrapped.
Fact - Quality/Yield Scrap Value Value of the items which were scrapped
Fact - Quality/Yield Scrap %
A measure to define the efficiency of
production, measured as (Scrap
Quantity)/(WO Start Quantity)*100
Fact - Quality/Yield Rework Quantity
Quantity of the items which have been
marked for rework
Fact - Quality/Yield Rework Value Value of items which were marked for rework
Fact - Quality/Yield Rework %
A measure to define the production efficiency,
measured as (Rework Quantity)/(WO Start
Quantity)*100
Fact - Quality/Yield Rejected Quantity
Quantity of the items which have been
rejected
Fact - Quality/Yield Reject Value Value of the items which have been rejected
Fact - Quality/Yield Reject %
A measure to define production efficiency,
measured as (Rejected Quantity)/(WO Start
Quantity)/*100
Fact - Quality/Yield Perfect Work Order
The count of WO which were completed on
time, without any scrap and with no variance.
Fact - Quality/Yield Perfect Work Order %
The ratio of perfect WO with respect to the
total number of WO processed

Presentation Table Presentation Column Description
Fact - Quality/Yield Yield %
The completed output from a production
process compared to the starting quantity of
the same process.
Fact - Resource
Analysis Available Hours
Number of hours for which the resource was
available, as defined by calendar.
Fact - Resource
Analysis Actual Hours
Actual number of hours for which the resource
was used in different tasks.
Fact - Resource
Analysis
Actual Resource Usage
Value
Actual usage of the resource in value terms
considering the number of hours resources
were used and their hourly rate.
Fact - Resource
Analysis Standard Hours
Number of hours for which the resource was
planned for production tasks.
Fact - Resource
Analysis
Standard Resource Usage
Value
Planned usage of the resource in value terms
considering the number of hours resources
were planned to be used and their hourly rate.
Fact - Resource
Analysis Resource Utilization
Defines the utilization factor for a resource. It
is calculated as (Actual Hours)/(Available
Hours) for the resource
Fact - Resource
Analysis Resource Efficiency
Defines the efficiency of a resource. It is
calculated as (Standard Hours)/ (Actual Hours)
for the resource.
Fact - Resource
Analysis
Resource Usage Variance
(Hours)
Difference between the planned and actual
usage of the resource in terms of hours.
Fact - Resource
Analysis
Resource Usage Variance
(Value)
Difference between the planned and actual
usage of the resource in value terms,
considering the hourly rate defined for the
resource.
Fact - Resource
Analysis No. of Operators
Number of resources required to complete a
Work Order
Fact - Resource
Analysis Operation Start Quantity Work Order Start Quantity for the operation
Fact - Resource
Analysis
Operation Completed
Quantity Number of units completed by the operation
Fact - Service Levels Count of Sales Orders Total number of sales orders which are
pegged to Work Order (Requires Supply Chain

Presentation Table Presentation Column Description
and Order Management Analytics licensed and
deployed)
Fact - Service Levels
Order Fulfillment -
Performance to Promise
Date
Number of Work Orders which were pegged
to Sales Order line and completed before the
Sales Order Line’s Promise Date (Requires
Supply Chain and Order Management
Analytics licensed and deployed)
Fact - Service Levels
Order Fulfillment -
Performance to Request
Date
Number of Work Orders which were pegged
to Sales Order line and completed before the
Sales Order Line’s Request Date (Requires
Supply Chain and Order Management
Analytics licensed and deployed)
Fact - Service Levels
Order Fulfillment -
Performance to Scheduled
Ship Date
Number of Work Orders which were pegged
to Sales Order line and completed before the
Sales Order Line’s Scheduled Ship Date
(Requires Supply Chain and Order
Management Analytics licensed and deployed)
Fact - Lot Genealogy Level 1 - Lot Number Lot Number of the Parent Manufacturing Item
Fact - Lot Genealogy
Level 1 - Work Order
Number
Work Order Number of the Parent
Manufacturing Item
Fact - Lot Genealogy
Level 1 - Inventory Org
Name
Name of the Organization where the Item
Produced
Fact - Lot Genealogy Level 1 - Transaction Date Date of the Transaction
Fact - Lot Genealogy
Level 1 - Transaction
Quantity Quantity of the Lot Number
Fact - Lot Genealogy
Level 1 - Manufacturing
Product Number
Item Number of the Parent level
Manufacturing Item
Fact - Lot Genealogy
Level 1 - Manufacturing
Product Description
Item Description of the Patent Level
Manufacturing Item
Fact - Lot Genealogy Level 1 - Inventory Category
Inventory Category Associated with the
Manufacturing Item
Fact - Lot Genealogy Level 3 - Lot Number
Lot Number of the Level1 Child of Parent
Manufacturing Item
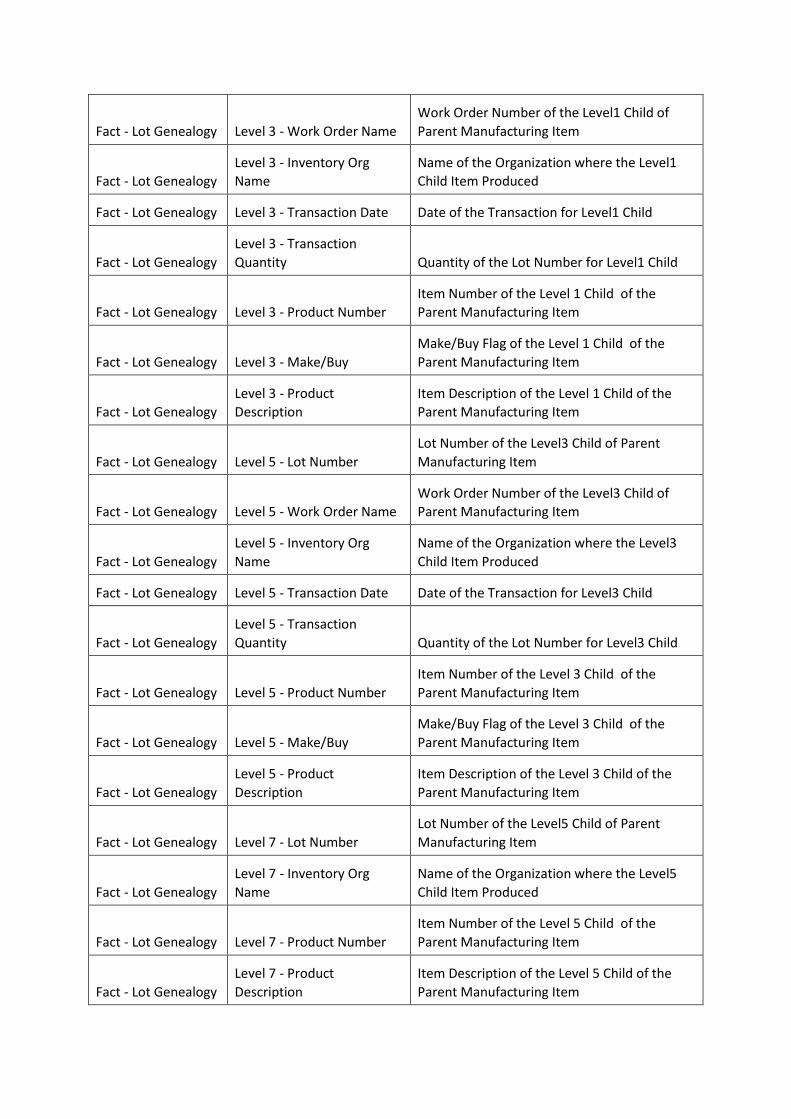
Fact - Lot Genealogy Level 3 - Work Order Name
Work Order Number of the Level1 Child of
Parent Manufacturing Item
Fact - Lot Genealogy
Level 3 - Inventory Org
Name
Name of the Organization where the Level1
Child Item Produced
Fact - Lot Genealogy Level 3 - Transaction Date Date of the Transaction for Level1 Child
Fact - Lot Genealogy
Level 3 - Transaction
Quantity Quantity of the Lot Number for Level1 Child
Fact - Lot Genealogy Level 3 - Product Number
Item Number of the Level 1 Child of the
Parent Manufacturing Item
Fact - Lot Genealogy Level 3 - Make/Buy
Make/Buy Flag of the Level 1 Child of the
Parent Manufacturing Item
Fact - Lot Genealogy
Level 3 - Product
Description
Item Description of the Level 1 Child of the
Parent Manufacturing Item
Fact - Lot Genealogy Level 5 - Lot Number
Lot Number of the Level3 Child of Parent
Manufacturing Item
Fact - Lot Genealogy Level 5 - Work Order Name
Work Order Number of the Level3 Child of
Parent Manufacturing Item
Fact - Lot Genealogy
Level 5 - Inventory Org
Name
Name of the Organization where the Level3
Child Item Produced
Fact - Lot Genealogy Level 5 - Transaction Date Date of the Transaction for Level3 Child
Fact - Lot Genealogy
Level 5 - Transaction
Quantity Quantity of the Lot Number for Level3 Child
Fact - Lot Genealogy Level 5 - Product Number
Item Number of the Level 3 Child of the
Parent Manufacturing Item
Fact - Lot Genealogy Level 5 - Make/Buy
Make/Buy Flag of the Level 3 Child of the
Parent Manufacturing Item
Fact - Lot Genealogy
Level 5 - Product
Description
Item Description of the Level 3 Child of the
Parent Manufacturing Item
Fact - Lot Genealogy Level 7 - Lot Number
Lot Number of the Level5 Child of Parent
Manufacturing Item
Fact - Lot Genealogy
Level 7 - Inventory Org
Name
Name of the Organization where the Level5
Child Item Produced
Fact - Lot Genealogy Level 7 - Product Number
Item Number of the Level 5 Child of the
Parent Manufacturing Item
Fact - Lot Genealogy
Level 7 - Product
Description
Item Description of the Level 5 Child of the
Parent Manufacturing Item

Fact - Lot Genealogy Level 7 - Work Order Name
Work Order Number of the Level5 Child of
Parent Manufacturing Item
Fact - Lot Genealogy Level 7 - Make/Buy
Make/Buy Flag of the Level 5 Child of the
Parent Manufacturing Item
Fact - Lot Genealogy Level 9 - Supplier Number
Account Number of the Supplier for the Buy
Components of Parent Lot Number
Fact - Lot Genealogy Level 9 - Supplier Name
Name of the Supplier for the Buy Components
of Parent Lot Number
Fact - Lot Genealogy
Level 9 - Vendor Lot
Number Lot Number of the Supplier
Fact - Lot Genealogy Level 9 - Lot Number
Lot Number of the Buy Component of the
Parent Lot Number
Fact - Lot Genealogy
Level 9 - Inventory Org
Name
Name of the Organization where the Item
Received
Fact - Lot Genealogy Level 9 - Product Number
Item Number of the Buy Component of the
Parent Manufacturing Item
Fact - Lot Genealogy
Level 9 - Product
Description
Item Description of the Buy Component of the
Parent Manufacturing Item
Fact - Lot Genealogy Level 9 - Receipt Date PO Receipt Date
Inventory and Costing – Subject Area Details
Presentation Table Presentation Column Descriptions
Fact - Indented Bills Of
Material Cost
Level 1 Item Cost Level 1 Item Cost
Fact - Indented Bills Of
Material Cost
Level 1 Material Cost Level 1 Material Cost
Fact - Indented Bills Of
Material Cost
Level 1 Material Overhead
Cost
Level 1 Material Overhead Cost
Fact - Indented Bills Of
Material Cost
Level 1 Resource Cost Level 1 Resource Cost
Fact - Indented Bills Of
Material Cost
Level 1 Overhead Cost Level 1 Overhead Cost
Fact - Indented Bills Of
Material Cost
Level 1 Outside Processing
Cost
Level 1 Outside Processing Cost
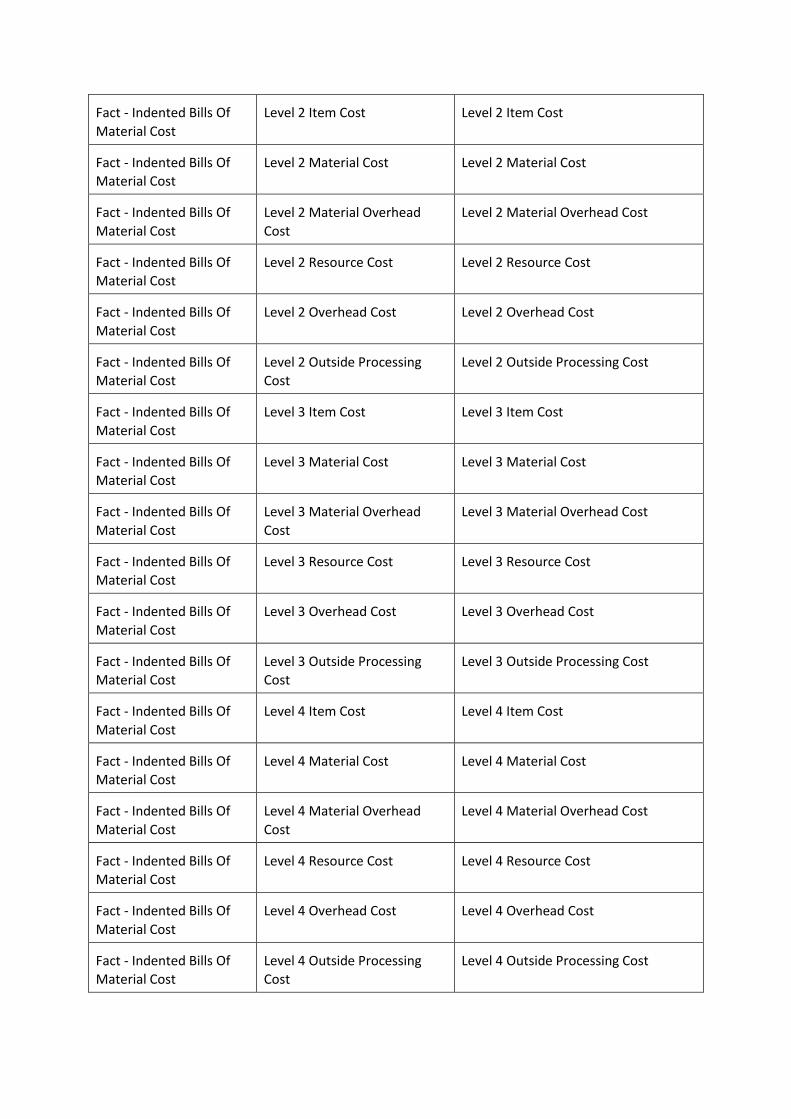
Fact - Indented Bills Of
Material Cost
Level 2 Item Cost Level 2 Item Cost
Fact - Indented Bills Of
Material Cost
Level 2 Material Cost Level 2 Material Cost
Fact - Indented Bills Of
Material Cost
Level 2 Material Overhead
Cost
Level 2 Material Overhead Cost
Fact - Indented Bills Of
Material Cost
Level 2 Resource Cost Level 2 Resource Cost
Fact - Indented Bills Of
Material Cost
Level 2 Overhead Cost Level 2 Overhead Cost
Fact - Indented Bills Of
Material Cost
Level 2 Outside Processing
Cost
Level 2 Outside Processing Cost
Fact - Indented Bills Of
Material Cost
Level 3 Item Cost Level 3 Item Cost
Fact - Indented Bills Of
Material Cost
Level 3 Material Cost Level 3 Material Cost
Fact - Indented Bills Of
Material Cost
Level 3 Material Overhead
Cost
Level 3 Material Overhead Cost
Fact - Indented Bills Of
Material Cost
Level 3 Resource Cost Level 3 Resource Cost
Fact - Indented Bills Of
Material Cost
Level 3 Overhead Cost Level 3 Overhead Cost
Fact - Indented Bills Of
Material Cost
Level 3 Outside Processing
Cost
Level 3 Outside Processing Cost
Fact - Indented Bills Of
Material Cost
Level 4 Item Cost Level 4 Item Cost
Fact - Indented Bills Of
Material Cost
Level 4 Material Cost Level 4 Material Cost
Fact - Indented Bills Of
Material Cost
Level 4 Material Overhead
Cost
Level 4 Material Overhead Cost
Fact - Indented Bills Of
Material Cost
Level 4 Resource Cost Level 4 Resource Cost
Fact - Indented Bills Of
Material Cost
Level 4 Overhead Cost Level 4 Overhead Cost
Fact - Indented Bills Of
Material Cost
Level 4 Outside Processing
Cost
Level 4 Outside Processing Cost

Fact - Indented Bills Of
Material Cost
Level 5 Item Cost Level 5 Item Cost
Fact - Indented Bills Of
Material Cost
Level 5 Material Cost Level 5 Material Cost
Fact - Indented Bills Of
Material Cost
Level 5 Material Overhead
Cost
Level 5 Material Overhead Cost
Fact - Indented Bills Of
Material Cost
Level 5 Resource Cost Level 5 Resource Cost
Fact - Indented Bills Of
Material Cost
Level 5 Overhead Cost Level 5 Overhead Cost
Fact - Indented Bills Of
Material Cost
Level 5 Outside Processing
Cost
Level 5 Outside Processing Cost
Fact - Indented Bills Of
Material Cost
Level 6 Item Cost Level 6 Item Cost
Fact - Indented Bills Of
Material Cost
Level 6 Material Cost Level 6 Material Cost
Fact - Indented Bills Of
Material Cost
Level 6 Material Overhead
Cost
Level 6 Material Overhead Cost
Fact - Indented Bills Of
Material Cost
Level 6 Resource Cost Level 6 Resource Cost
Fact - Indented Bills Of
Material Cost
Level 6 Overhead Cost Level 6 Overhead Cost
Fact - Indented Bills Of
Material Cost
Level 6 Outside Processing
Cost
Level 6 Outside Processing Cost
Fact - Indented Bills Of
Material Cost
Level 7 Item Cost Level 7 Item Cost
Fact - Indented Bills Of
Material Cost
Level 7 Material Cost Level 7 Material Cost
Fact - Indented Bills Of
Material Cost
Level 7 Material Overhead
Cost
Level 7 Material Overhead Cost
Fact - Indented Bills Of
Material Cost
Level 7 Resource Cost Level 7 Resource Cost
Fact - Indented Bills Of
Material Cost
Level 7 Overhead Cost Level 7 Overhead Cost
Fact - Indented Bills Of
Material Cost
Level 7 Outside Processing
Cost
Level 7 Outside Processing Cost
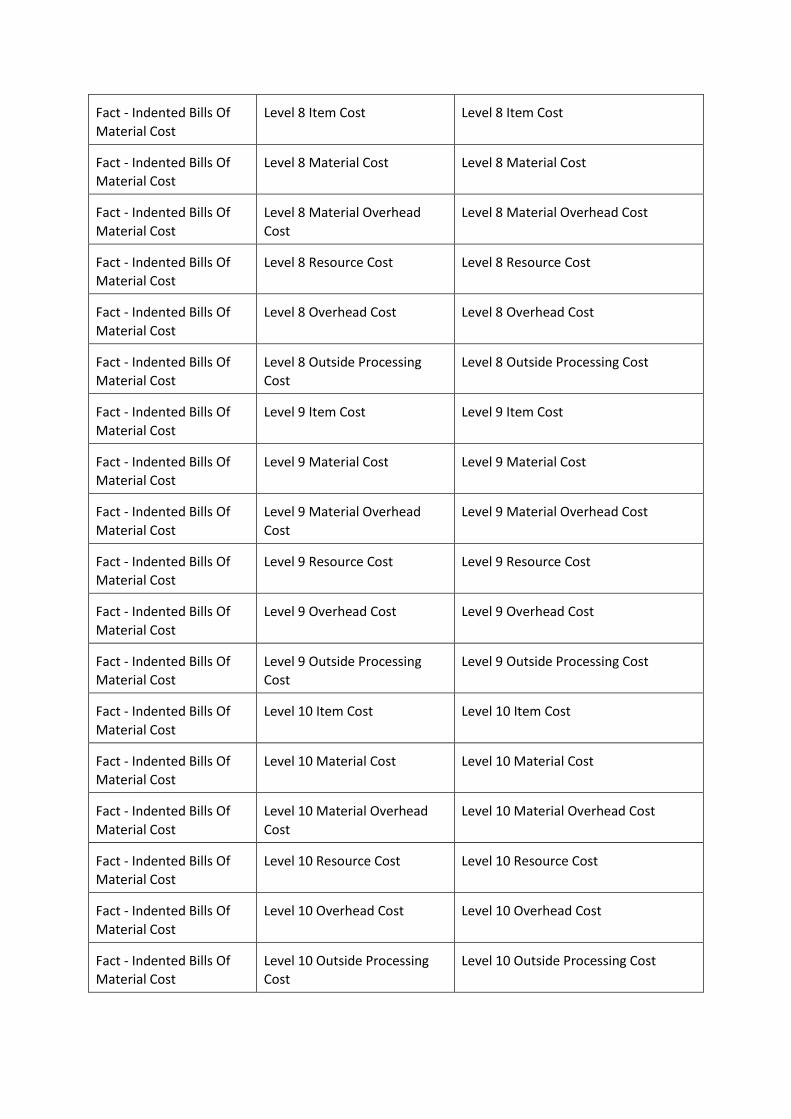
Fact - Indented Bills Of
Material Cost
Level 8 Item Cost Level 8 Item Cost
Fact - Indented Bills Of
Material Cost
Level 8 Material Cost Level 8 Material Cost
Fact - Indented Bills Of
Material Cost
Level 8 Material Overhead
Cost
Level 8 Material Overhead Cost
Fact - Indented Bills Of
Material Cost
Level 8 Resource Cost Level 8 Resource Cost
Fact - Indented Bills Of
Material Cost
Level 8 Overhead Cost Level 8 Overhead Cost
Fact - Indented Bills Of
Material Cost
Level 8 Outside Processing
Cost
Level 8 Outside Processing Cost
Fact - Indented Bills Of
Material Cost
Level 9 Item Cost Level 9 Item Cost
Fact - Indented Bills Of
Material Cost
Level 9 Material Cost Level 9 Material Cost
Fact - Indented Bills Of
Material Cost
Level 9 Material Overhead
Cost
Level 9 Material Overhead Cost
Fact - Indented Bills Of
Material Cost
Level 9 Resource Cost Level 9 Resource Cost
Fact - Indented Bills Of
Material Cost
Level 9 Overhead Cost Level 9 Overhead Cost
Fact - Indented Bills Of
Material Cost
Level 9 Outside Processing
Cost
Level 9 Outside Processing Cost
Fact - Indented Bills Of
Material Cost
Level 10 Item Cost Level 10 Item Cost
Fact - Indented Bills Of
Material Cost
Level 10 Material Cost Level 10 Material Cost
Fact - Indented Bills Of
Material Cost
Level 10 Material Overhead
Cost
Level 10 Material Overhead Cost
Fact - Indented Bills Of
Material Cost
Level 10 Resource Cost Level 10 Resource Cost
Fact - Indented Bills Of
Material Cost
Level 10 Overhead Cost Level 10 Overhead Cost
Fact - Indented Bills Of
Material Cost
Level 10 Outside Processing
Cost
Level 10 Outside Processing Cost

Fact - Inventory Balance Available Amount This metric is the quantity of product
available to fill open orders multiplied
by Item Unit Standard Cost and Global
Exchange Rate. Available product is
defined as unrestricted inventory that
is not reserved, blocked or otherwise
unavailable for immediate demand
fulfillment. The Available Quantity
metric is an important component for
understanding historical inventory
fluctuations, stock outs, and allocation
situations. By analyzing available
inventory activity over time, slow-
moving and obsolete materials can be
identified.
Fact - Inventory Balance Available Quantity This metric is the quantity of product
available to fill open orders. Available
product is defined as unrestricted
inventory that is not reserved, blocked
or otherwise unavailable for
immediate demand fulfillment. The
Available Quantity metric is an
important component for
understanding historical inventory
fluctuations, stock outs, and allocation
situations. By analyzing available
inventory activity over time, slow-
moving and obsolete materials can be
identified
Fact - Inventory Balance Available Consignment
Quantity
Quantity in the warehouse that
belongs to a consignment vendor and
is not subject to usage restrictions. A
consignment vendor retains ownership
of the quantity until it is withdrawn
from stores.
Fact - Inventory Balance Avg Daily Inventory Value Last
365 Days
Average Daily Inventory Value for the
last 365 days
Fact - Inventory Balance Block Consignment Quantity Quantity of all blocked batches that
belong to a consignment vendor.
Examples of batches are: Production
lots, delivery lots etc.
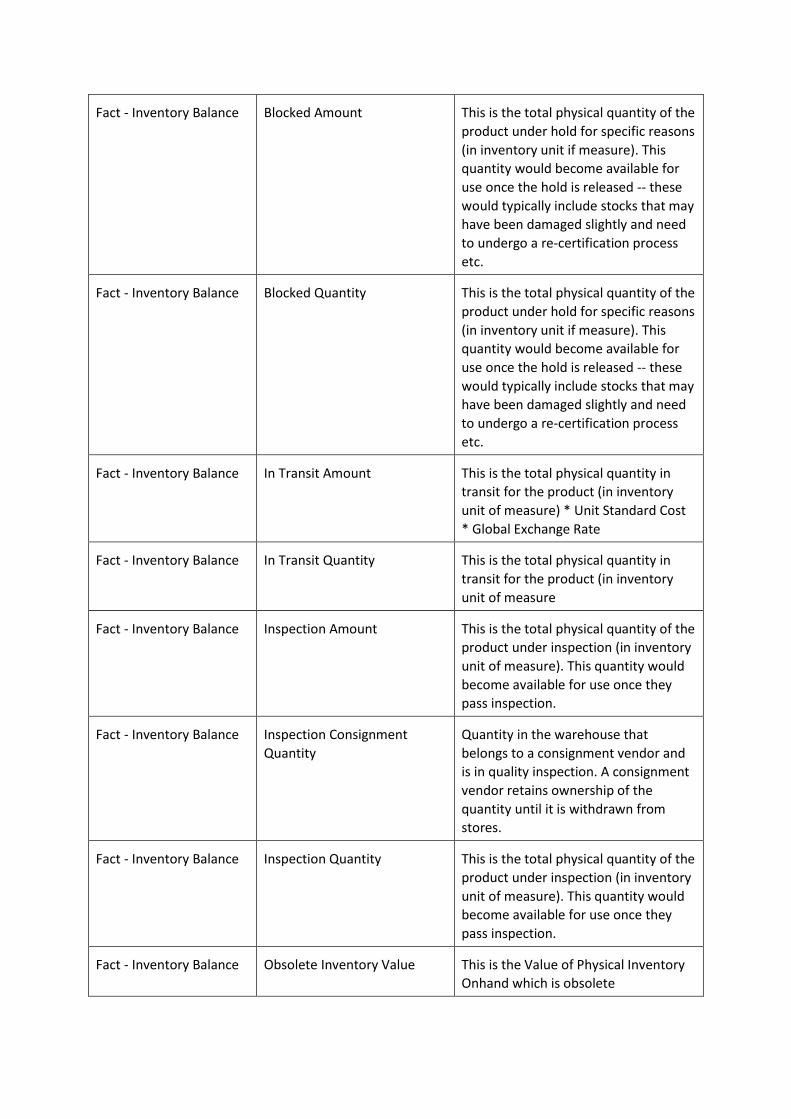
Fact - Inventory Balance Blocked Amount This is the total physical quantity of the
product under hold for specific reasons
(in inventory unit if measure). This
quantity would become available for
use once the hold is released -- these
would typically include stocks that may
have been damaged slightly and need
to undergo a re-certification process
etc.
Fact - Inventory Balance Blocked Quantity This is the total physical quantity of the
product under hold for specific reasons
(in inventory unit if measure). This
quantity would become available for
use once the hold is released -- these
would typically include stocks that may
have been damaged slightly and need
to undergo a re-certification process
etc.
Fact - Inventory Balance In Transit Amount This is the total physical quantity in
transit for the product (in inventory
unit of measure) * Unit Standard Cost
* Global Exchange Rate
Fact - Inventory Balance In Transit Quantity This is the total physical quantity in
transit for the product (in inventory
unit of measure
Fact - Inventory Balance Inspection Amount This is the total physical quantity of the
product under inspection (in inventory
unit of measure). This quantity would
become available for use once they
pass inspection.
Fact - Inventory Balance Inspection Consignment
Quantity
Quantity in the warehouse that
belongs to a consignment vendor and
is in quality inspection. A consignment
vendor retains ownership of the
quantity until it is withdrawn from
stores.
Fact - Inventory Balance Inspection Quantity This is the total physical quantity of the
product under inspection (in inventory
unit of measure). This quantity would
become available for use once they
pass inspection.
Fact - Inventory Balance Obsolete Inventory Value This is the Value of Physical Inventory
Onhand which is obsolete

Fact - Inventory Balance Obsolete Inventory Quantity This is the Quantity of Physical
Inventory Onhand which is obsolete
Fact - Inventory Balance Reorder Point Reorder Point is the inventory level at
the storage location that triggers a re-
order for replenishment of this
product.
Fact - Inventory Balance Replenishment Amount This represents the standard re-order
quantity size for replenishment of
inventory of this product (in inventory
units of measure).
Fact - Inventory Balance Replenishment Quantity This represents the standard re-order
quantity size for replenishment of
inventory of this product (in inventory
units of measure).
Fact - Inventory Balance Restricted Amount This metric is the balance of inventory
that is on reserve and restricted from
use for open orders or manufacturing
production orders. This type of
inventory is also known as allocated or
assigned material. The Restricted
Quantity metric is useful in
determining the amount of material
that is on reserve for future production
or customer orders.
Fact - Inventory Balance Restricted Consignment
Quantity
Quantity in the warehouse that
belongs to a consignment vendor and
has usage restrictions. A consignment
vendor retains ownership of the
quantity until it is withdrawn from
stores.
Fact - Inventory Balance Restricted Quantity This metric is the balance of inventory
that is on reserve and restricted from
use for open orders or manufacturing
production orders. This type of
inventory is also known as allocated or
assigned material. The Restricted
Quantity metric is useful in
determining the amount of material
that is on reserve for future production
or customer orders.
Fact - Inventory Balance Returned Amount This is the value of Physical inventory
which is returned by customers
Fact - Inventory Balance Returned Quantity This is the Physical inventory which is

returned by customers
Fact - Inventory Balance Standard Cost Amount This is the total Available Amount of
the Physical Inventory
Fact - Inventory Balance Total Daily Inventory Value
Last 365 Days
Total Daily Inventory Value Last 365
Days
Fact - Inventory Balance Usable Quantity This is the Total Usable Quantity
available as physical stock
Fact - Inventory Balance Value Only Amount This is the total Available Amount of
the Physical Inventory
Fact - Inventory Balance Value Transfer Amount Value Transfer Amount
Fact - Inventory Balance WIP Amount This is the Value of Inventory Issued to
Workorders that are not completed
Fact - Inventory Balance Days In Inventory This is the total No. of Days since the
inventory is lying
Fact - Inventory Balance Days Left Expiry This is the No. of Days remaining for
the inventory to expire
Fact - Inventory Balance Days since Expired This is the No. of Days since the
inventory expired
Fact - Inventory Balance Chg Year Ago Available
Amount
Change in Available Amount from Prior
Year
Fact - Inventory Balance Chg Year Ago Available
Quantity
Change in Available Quantity from
Prior Year
Fact - Inventory Balance Chg Year Ago Blocked Amount Change in Blocked Amount from Prior
Year
Fact - Inventory Balance Chg Year Ago Blocked
Quantity
Change in Blocked Quantity from Prior
Year
Fact - Inventory Balance Chg Year Ago In Transit
Amount
Change in Transit Amount from Prior
Year
Fact - Inventory Balance Chg Year Ago In Transit
Quantity
Change in Transit Quantity from Prior
Year
Fact - Inventory Balance Chg Year Ago Inspection
Amount
Change in Inspection Amount from
Prior Year
Fact - Inventory Balance Chg Year Ago Inspection
Quantity
Change in Inspection Quantity from
Prior Year
Fact - Inventory Balance Chg Year Ago Obsolete
Inventory
Change in Obsolete Inventory from
Prior Year
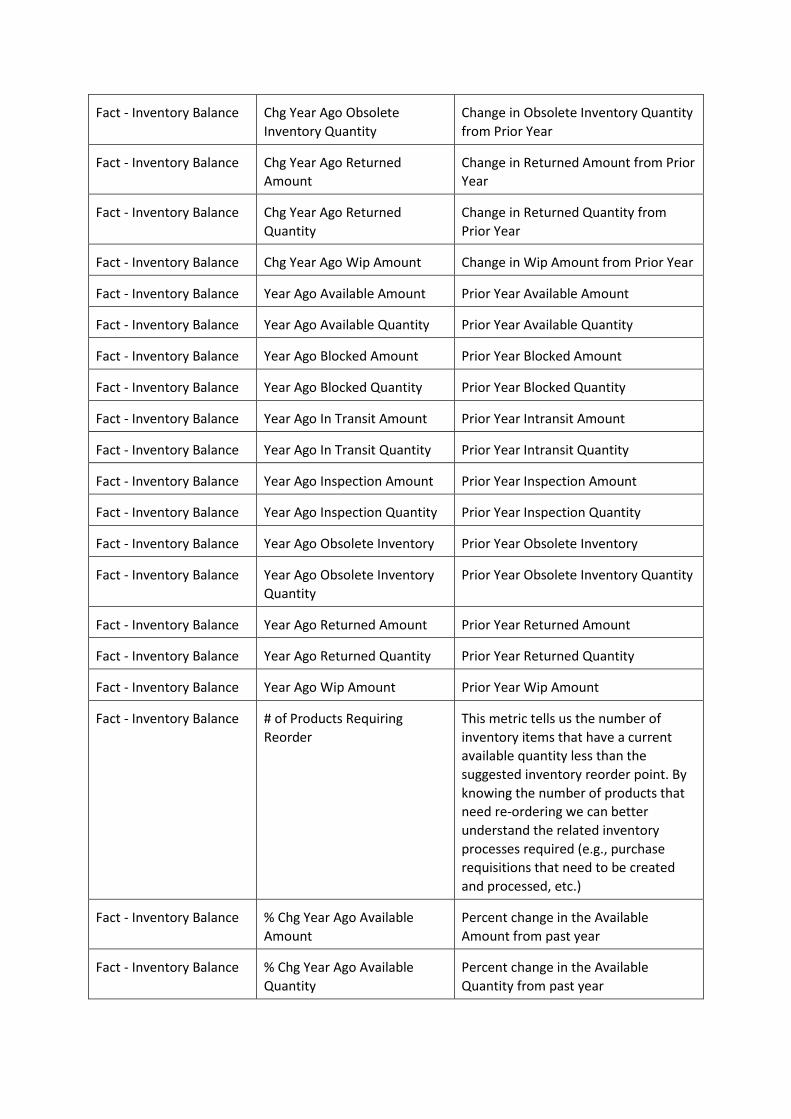
Fact - Inventory Balance Chg Year Ago Obsolete
Inventory Quantity
Change in Obsolete Inventory Quantity
from Prior Year
Fact - Inventory Balance Chg Year Ago Returned
Amount
Change in Returned Amount from Prior
Year
Fact - Inventory Balance Chg Year Ago Returned
Quantity
Change in Returned Quantity from
Prior Year
Fact - Inventory Balance Chg Year Ago Wip Amount Change in Wip Amount from Prior Year
Fact - Inventory Balance Year Ago Available Amount Prior Year Available Amount
Fact - Inventory Balance Year Ago Available Quantity Prior Year Available Quantity
Fact - Inventory Balance Year Ago Blocked Amount Prior Year Blocked Amount
Fact - Inventory Balance Year Ago Blocked Quantity Prior Year Blocked Quantity
Fact - Inventory Balance Year Ago In Transit Amount Prior Year Intransit Amount
Fact - Inventory Balance Year Ago In Transit Quantity Prior Year Intransit Quantity
Fact - Inventory Balance Year Ago Inspection Amount Prior Year Inspection Amount
Fact - Inventory Balance Year Ago Inspection Quantity Prior Year Inspection Quantity
Fact - Inventory Balance Year Ago Obsolete Inventory Prior Year Obsolete Inventory
Fact - Inventory Balance Year Ago Obsolete Inventory
Quantity
Prior Year Obsolete Inventory Quantity
Fact - Inventory Balance Year Ago Returned Amount Prior Year Returned Amount
Fact - Inventory Balance Year Ago Returned Quantity Prior Year Returned Quantity
Fact - Inventory Balance Year Ago Wip Amount Prior Year Wip Amount
Fact - Inventory Balance # of Products Requiring
Reorder
This metric tells us the number of
inventory items that have a current
available quantity less than the
suggested inventory reorder point. By
knowing the number of products that
need re-ordering we can better
understand the related inventory
processes required (e.g., purchase
requisitions that need to be created
and processed, etc.)
Fact - Inventory Balance % Chg Year Ago Available
Amount
Percent change in the Available
Amount from past year
Fact - Inventory Balance % Chg Year Ago Available
Quantity
Percent change in the Available
Quantity from past year

Fact - Inventory Balance % Chg Year Ago Blocked
Amount
Percent change in the Blocked Amount
from past year
Fact - Inventory Balance % Chg Year Ago Blocked
Quantity
Percent change in the Blocked
Quantity from past year
Fact - Inventory Balance % Chg Year Ago In Transit
Amount
Percent change in the Transit Amount
from past year
Fact - Inventory Balance % Chg Year Ago In Transit
Quantity
Percent change in the Transit Quantity
from past year
Fact - Inventory Balance % Chg Year Ago Inspection
Amount
Percent change in the Inspection
Amount from past year
Fact - Inventory Balance % Chg Year Ago Inspection
Quantity
Percent change in the Inspection
Quantity from past year
Fact - Inventory Balance % Chg Year Ago Obsolete
Inventory
Percent change in the Obsolete
Inventory from past year
Fact - Inventory Balance % Chg Year Ago Obsolete
Inventory Quantity
Percent change in the Obsolete
Inventory Quantity from past year
Fact - Inventory Balance % Chg Year Ago Returned
Amount
Percent change in the Returned
Amount from past year
Fact - Inventory Balance % Chg Year Ago Returned
Quantity
Percent change in the Returned
Quantity from past year
Fact - Inventory Balance % Chg Year Ago Wip Amount Percent change in the Wip Amount
from past year
Fact - Inventory
Transaction
% Chg Year Ago Actual Issue
Quantity
Percent change in the Actual Issue
Quantity from past year
Fact - Inventory
Transaction
% Chg Year Ago Actual Receipt
Quantity
Percent change in the Actual Receipt
Quantity from past year
Fact - Inventory
Transaction
% Chg Year Ago Customer
Returned Quantity
Percent change in the Customer
Returned Quantity from past year
Fact - Inventory
Transaction
% Chg Year Ago Material
Amount
Percent change in the Material
Amount from past year
Fact - Inventory
Transaction
% Chg Year Ago Returned
Quantity
Percent change in the Returned
Quantity from past year
Fact - Inventory
Transaction
% Chg Year Ago Supplier
Returned Quantity
Percent change in the Supplier
Returned Quantity from past year
Fact - Inventory % Chg Year Ago Returned Percent change in the Returned
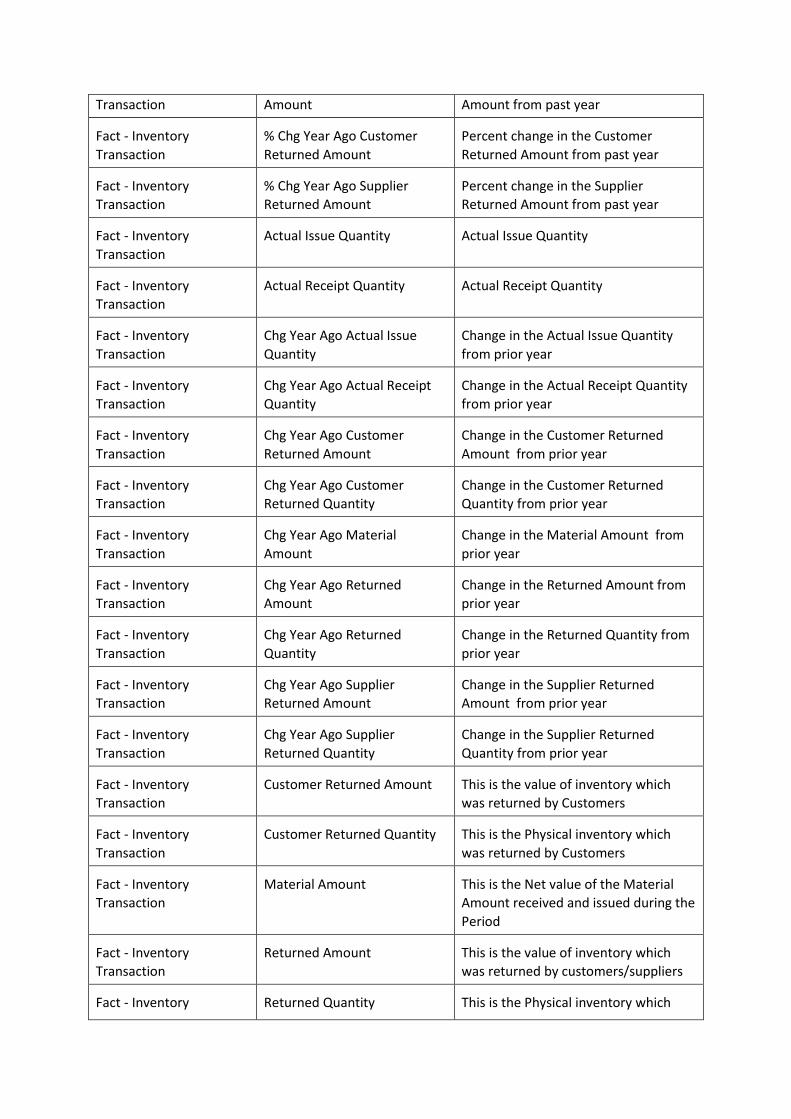
Transaction Amount Amount from past year
Fact - Inventory
Transaction
% Chg Year Ago Customer
Returned Amount
Percent change in the Customer
Returned Amount from past year
Fact - Inventory
Transaction
% Chg Year Ago Supplier
Returned Amount
Percent change in the Supplier
Returned Amount from past year
Fact - Inventory
Transaction
Actual Issue Quantity Actual Issue Quantity
Fact - Inventory
Transaction
Actual Receipt Quantity Actual Receipt Quantity
Fact - Inventory
Transaction
Chg Year Ago Actual Issue
Quantity
Change in the Actual Issue Quantity
from prior year
Fact - Inventory
Transaction
Chg Year Ago Actual Receipt
Quantity
Change in the Actual Receipt Quantity
from prior year
Fact - Inventory
Transaction
Chg Year Ago Customer
Returned Amount
Change in the Customer Returned
Amount from prior year
Fact - Inventory
Transaction
Chg Year Ago Customer
Returned Quantity
Change in the Customer Returned
Quantity from prior year
Fact - Inventory
Transaction
Chg Year Ago Material
Amount
Change in the Material Amount from
prior year
Fact - Inventory
Transaction
Chg Year Ago Returned
Amount
Change in the Returned Amount from
prior year
Fact - Inventory
Transaction
Chg Year Ago Returned
Quantity
Change in the Returned Quantity from
prior year
Fact - Inventory
Transaction
Chg Year Ago Supplier
Returned Amount
Change in the Supplier Returned
Amount from prior year
Fact - Inventory
Transaction
Chg Year Ago Supplier
Returned Quantity
Change in the Supplier Returned
Quantity from prior year
Fact - Inventory
Transaction
Customer Returned Amount This is the value of inventory which
was returned by Customers
Fact - Inventory
Transaction
Customer Returned Quantity This is the Physical inventory which
was returned by Customers
Fact - Inventory
Transaction
Material Amount This is the Net value of the Material
Amount received and issued during the
Period
Fact - Inventory
Transaction
Returned Amount This is the value of inventory which
was returned by customers/suppliers
Fact - Inventory Returned Quantity This is the Physical inventory which
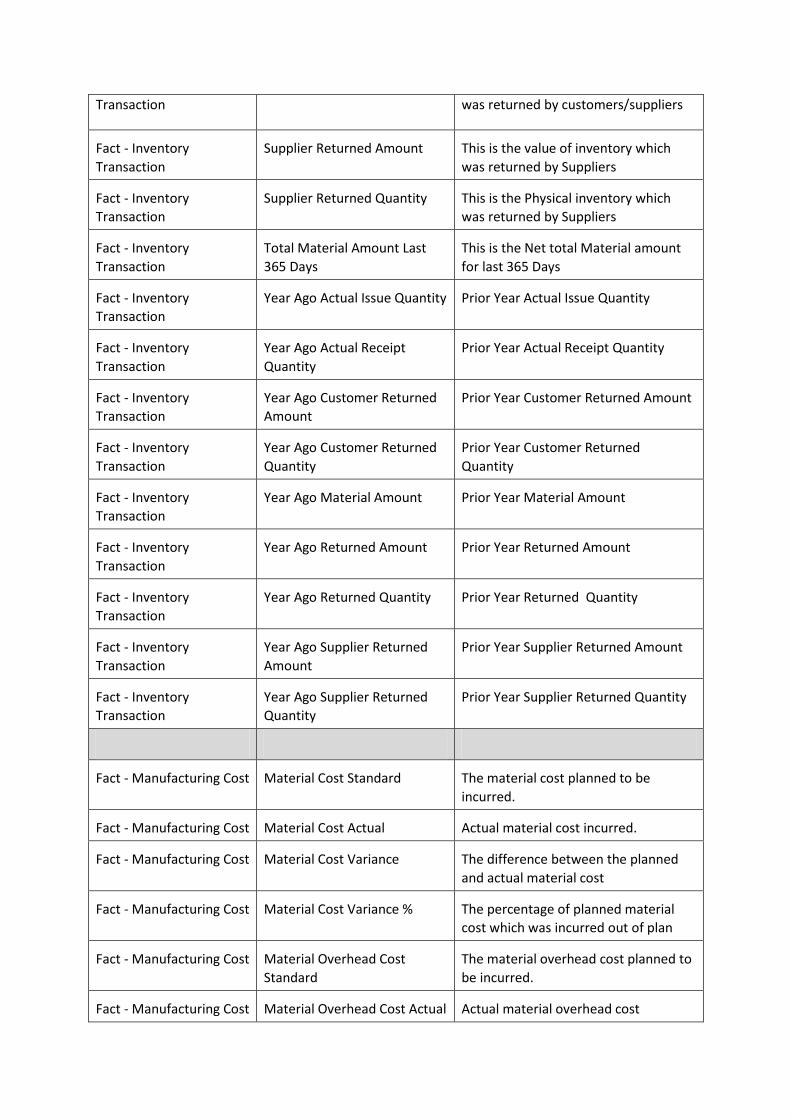
Transaction was returned by customers/suppliers
Fact - Inventory
Transaction
Supplier Returned Amount This is the value of inventory which
was returned by Suppliers
Fact - Inventory
Transaction
Supplier Returned Quantity This is the Physical inventory which
was returned by Suppliers
Fact - Inventory
Transaction
Total Material Amount Last
365 Days
This is the Net total Material amount
for last 365 Days
Fact - Inventory
Transaction
Year Ago Actual Issue Quantity Prior Year Actual Issue Quantity
Fact - Inventory
Transaction
Year Ago Actual Receipt
Quantity
Prior Year Actual Receipt Quantity
Fact - Inventory
Transaction
Year Ago Customer Returned
Amount
Prior Year Customer Returned Amount
Fact - Inventory
Transaction
Year Ago Customer Returned
Quantity
Prior Year Customer Returned
Quantity
Fact - Inventory
Transaction
Year Ago Material Amount Prior Year Material Amount
Fact - Inventory
Transaction
Year Ago Returned Amount Prior Year Returned Amount
Fact - Inventory
Transaction
Year Ago Returned Quantity Prior Year Returned Quantity
Fact - Inventory
Transaction
Year Ago Supplier Returned
Amount
Prior Year Supplier Returned Amount
Fact - Inventory
Transaction
Year Ago Supplier Returned
Quantity
Prior Year Supplier Returned Quantity
Fact - Manufacturing Cost Material Cost Standard The material cost planned to be
incurred.
Fact - Manufacturing Cost Material Cost Actual Actual material cost incurred.
Fact - Manufacturing Cost Material Cost Variance The difference between the planned
and actual material cost
Fact - Manufacturing Cost Material Cost Variance % The percentage of planned material
cost which was incurred out of plan
Fact - Manufacturing Cost Material Overhead Cost
Standard
The material overhead cost planned to
be incurred.
Fact - Manufacturing Cost Material Overhead Cost Actual Actual material overhead cost
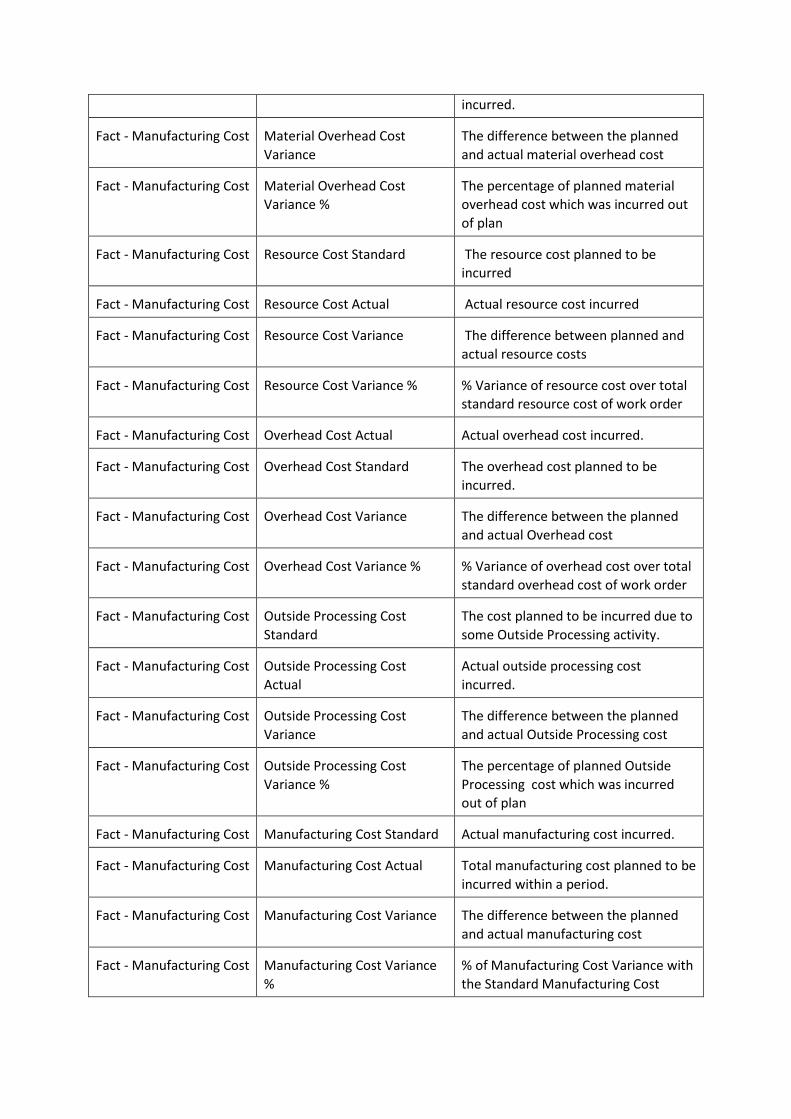
incurred.
Fact - Manufacturing Cost Material Overhead Cost
Variance
The difference between the planned
and actual material overhead cost
Fact - Manufacturing Cost Material Overhead Cost
Variance %
The percentage of planned material
overhead cost which was incurred out
of plan
Fact - Manufacturing Cost Resource Cost Standard The resource cost planned to be
incurred
Fact - Manufacturing Cost Resource Cost Actual Actual resource cost incurred
Fact - Manufacturing Cost Resource Cost Variance The difference between planned and
actual resource costs
Fact - Manufacturing Cost Resource Cost Variance % % Variance of resource cost over total
standard resource cost of work order
Fact - Manufacturing Cost Overhead Cost Actual Actual overhead cost incurred.
Fact - Manufacturing Cost Overhead Cost Standard The overhead cost planned to be
incurred.
Fact - Manufacturing Cost Overhead Cost Variance The difference between the planned
and actual Overhead cost
Fact - Manufacturing Cost Overhead Cost Variance % % Variance of overhead cost over total
standard overhead cost of work order
Fact - Manufacturing Cost Outside Processing Cost
Standard
The cost planned to be incurred due to
some Outside Processing activity.
Fact - Manufacturing Cost Outside Processing Cost
Actual
Actual outside processing cost
incurred.
Fact - Manufacturing Cost Outside Processing Cost
Variance
The difference between the planned
and actual Outside Processing cost
Fact - Manufacturing Cost Outside Processing Cost
Variance %
The percentage of planned Outside
Processing cost which was incurred
out of plan
Fact - Manufacturing Cost Manufacturing Cost Standard Actual manufacturing cost incurred.
Fact - Manufacturing Cost Manufacturing Cost Actual Total manufacturing cost planned to be
incurred within a period.
Fact - Manufacturing Cost Manufacturing Cost Variance The difference between the planned
and actual manufacturing cost
Fact - Manufacturing Cost Manufacturing Cost Variance
%
% of Manufacturing Cost Variance with
the Standard Manufacturing Cost
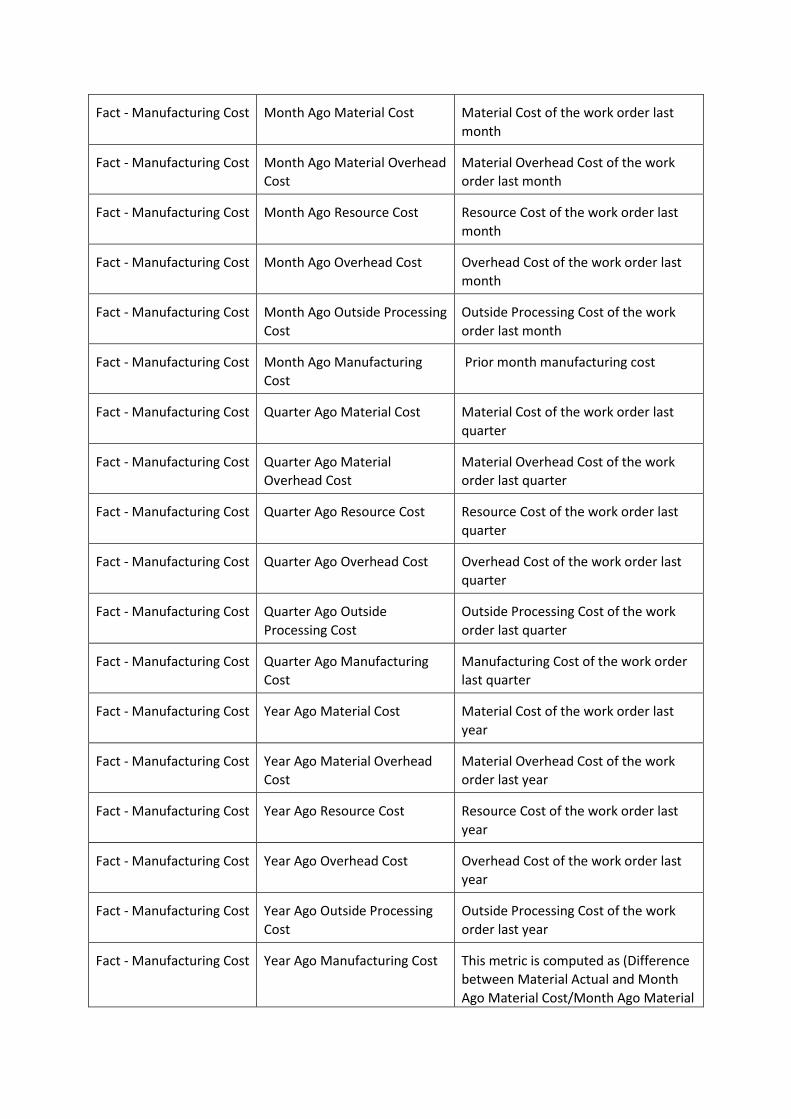
Fact - Manufacturing Cost Month Ago Material Cost Material Cost of the work order last
month
Fact - Manufacturing Cost Month Ago Material Overhead
Cost
Material Overhead Cost of the work
order last month
Fact - Manufacturing Cost Month Ago Resource Cost Resource Cost of the work order last
month
Fact - Manufacturing Cost Month Ago Overhead Cost Overhead Cost of the work order last
month
Fact - Manufacturing Cost Month Ago Outside Processing
Cost
Outside Processing Cost of the work
order last month
Fact - Manufacturing Cost Month Ago Manufacturing
Cost
Prior month manufacturing cost
Fact - Manufacturing Cost Quarter Ago Material Cost Material Cost of the work order last
quarter
Fact - Manufacturing Cost Quarter Ago Material
Overhead Cost
Material Overhead Cost of the work
order last quarter
Fact - Manufacturing Cost Quarter Ago Resource Cost Resource Cost of the work order last
quarter
Fact - Manufacturing Cost Quarter Ago Overhead Cost Overhead Cost of the work order last
quarter
Fact - Manufacturing Cost Quarter Ago Outside
Processing Cost
Outside Processing Cost of the work
order last quarter
Fact - Manufacturing Cost Quarter Ago Manufacturing
Cost
Manufacturing Cost of the work order
last quarter
Fact - Manufacturing Cost Year Ago Material Cost Material Cost of the work order last
year
Fact - Manufacturing Cost Year Ago Material Overhead
Cost
Material Overhead Cost of the work
order last year
Fact - Manufacturing Cost Year Ago Resource Cost Resource Cost of the work order last
year
Fact - Manufacturing Cost Year Ago Overhead Cost Overhead Cost of the work order last
year
Fact - Manufacturing Cost Year Ago Outside Processing
Cost
Outside Processing Cost of the work
order last year
Fact - Manufacturing Cost Year Ago Manufacturing Cost This metric is computed as (Difference
between Material Actual and Month
Ago Material Cost/Month Ago Material

Cost)*100
Fact - Manufacturing Cost Chg Month Ago Material Cost Difference between Material Actual
and Month Ago Material Cost
Fact - Manufacturing Cost Chg Month Ago Material
Overhead Cost
Difference between Material Overhead
Actual and Month Ago Material
Overhead Cost
Fact - Manufacturing Cost Chg Month Ago Resource Cost Difference between Resource Actual
and Month Ago Resource Cost
Fact - Manufacturing Cost Chg Month Ago Overhead
Cost
Difference between Overhead Actual
and Month Ago Overhead Cost
Fact - Manufacturing Cost Chg Month Ago Outside
Processing Cost
Difference between Outside Processing
Actual and Month Ago Outside
Processing Cost
Fact - Manufacturing Cost Chg Month Ago
Manufacturing Cost
Difference between Outside Processing
Actual and Month Ago Manufacturing
Cost
Fact - Manufacturing Cost Chg Quarter Ago Material Cost Difference between Material Actual
and Quarter Ago Material Cost
Fact - Manufacturing Cost Chg Quarter Ago Material
Overhead Cost
Difference between Material Overhead
Actual and Quarter Ago Material
Overhead Cost
Fact - Manufacturing Cost Chg Quarter Ago Resource
Cost
Difference between Resource Actual
and Quarter Ago Resource Cost
Fact - Manufacturing Cost Chg Quarter Ago Overhead
Cost
Difference between Overhead Actual
and Quarter Ago Overhead Cost
Fact - Manufacturing Cost Chg Quarter Ago Outside
Processing Cost
Difference between outside
processing actual and quarter ago
outside processing cost
Fact - Manufacturing Cost Chg Quarter Ago
Manufacturing Cost
Difference between Outside Processing
Actual and Quarter Ago Manufacturing
Cost
Fact - Manufacturing Cost Chg Year Ago Material Cost Difference between Material Actual
and Year Ago Material Cost
Fact - Manufacturing Cost Chg Year Ago Material
Overhead Cost
Difference between Material Overhead
Actual and Year Ago Material
Overhead Cost
Fact - Manufacturing Cost Chg Year Ago Resource Cost Difference between Resource Cost
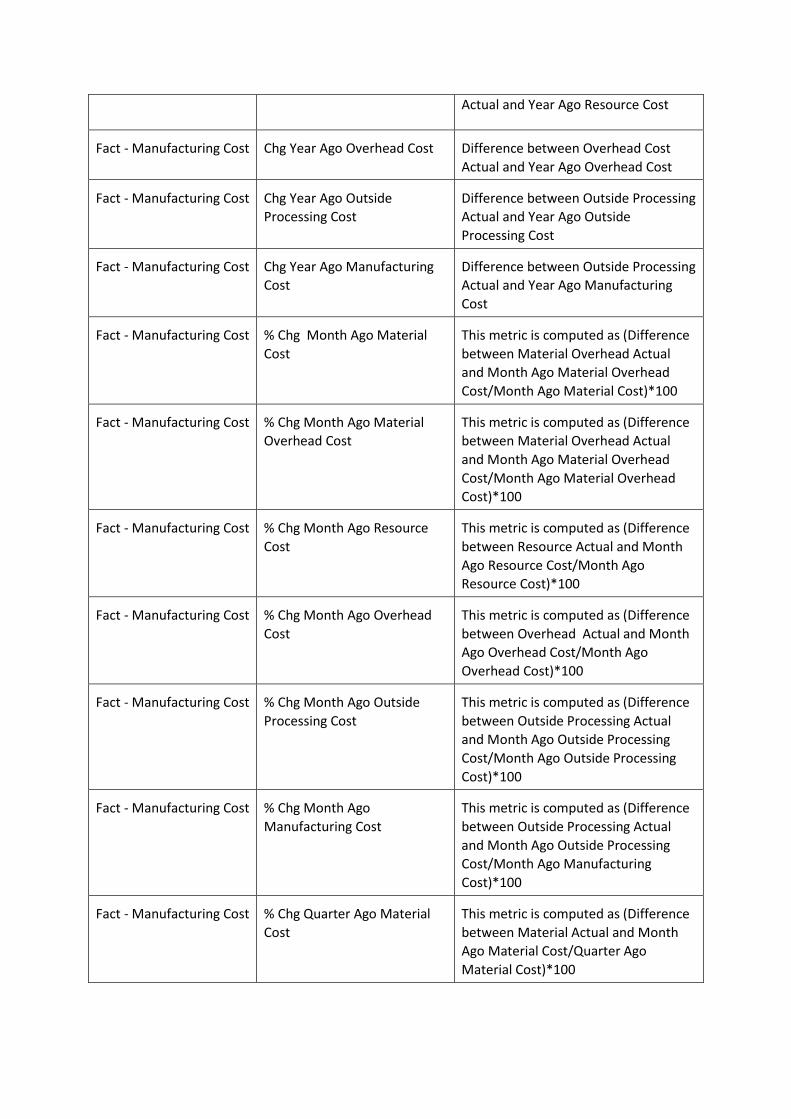
Actual and Year Ago Resource Cost
Fact - Manufacturing Cost Chg Year Ago Overhead Cost Difference between Overhead Cost
Actual and Year Ago Overhead Cost
Fact - Manufacturing Cost Chg Year Ago Outside
Processing Cost
Difference between Outside Processing
Actual and Year Ago Outside
Processing Cost
Fact - Manufacturing Cost Chg Year Ago Manufacturing
Cost
Difference between Outside Processing
Actual and Year Ago Manufacturing
Cost
Fact - Manufacturing Cost % Chg Month Ago Material
Cost
This metric is computed as (Difference
between Material Overhead Actual
and Month Ago Material Overhead
Cost/Month Ago Material Cost)*100
Fact - Manufacturing Cost % Chg Month Ago Material
Overhead Cost
This metric is computed as (Difference
between Material Overhead Actual
and Month Ago Material Overhead
Cost/Month Ago Material Overhead
Cost)*100
Fact - Manufacturing Cost % Chg Month Ago Resource
Cost
This metric is computed as (Difference
between Resource Actual and Month
Ago Resource Cost/Month Ago
Resource Cost)*100
Fact - Manufacturing Cost % Chg Month Ago Overhead
Cost
This metric is computed as (Difference
between Overhead Actual and Month
Ago Overhead Cost/Month Ago
Overhead Cost)*100
Fact - Manufacturing Cost % Chg Month Ago Outside
Processing Cost
This metric is computed as (Difference
between Outside Processing Actual
and Month Ago Outside Processing
Cost/Month Ago Outside Processing
Cost)*100
Fact - Manufacturing Cost % Chg Month Ago
Manufacturing Cost
This metric is computed as (Difference
between Outside Processing Actual
and Month Ago Outside Processing
Cost/Month Ago Manufacturing
Cost)*100
Fact - Manufacturing Cost % Chg Quarter Ago Material
Cost
This metric is computed as (Difference
between Material Actual and Month
Ago Material Cost/Quarter Ago
Material Cost)*100

Fact - Manufacturing Cost % Chg Quarter Ago Material
Overhead Cost
This metric is computed as (Difference
between Material Overhead Actual
and Month Ago Material Overhead
Cost/Quarter Ago Material Overhead
Cost)*100
Fact - Manufacturing Cost % Chg Quarter Ago Resource
Cost
This metric is computed as (Difference
between Outside Processing Actual
and Month Ago Outside Processing
Cost/Quarter Ago Resource Cost)*100
Fact - Manufacturing Cost % Chg Quarter Ago Overhead
Cost
This metric is computed as (Difference
between Outside Processing Actual
and Month Ago Outside Processing
Cost/Quarter Ago Overhead Cost)*100
Fact - Manufacturing Cost % Chg Quarter Ago Outside
Processing Cost
This metric is computed as (Difference
between Outside Processing Actual
and Month Ago Outside Processing
Cost/Quarter Ago Outside Processing
Cost)*100
Fact - Manufacturing Cost % Chg Quarter Ago
Manufacturing Cost
This metric is computed as (Difference
between Outside Processing Actual
and Month Ago Outside Processing
Cost/Quarter Ago Manufacturing
Cost)*100
Fact - Manufacturing Cost % Chg Year Ago Material Cost This metric is computed as (Difference
between Material Actual and Month
Ago Material Cost/Year Ago Material
Cost*100
Fact - Manufacturing Cost % Chg Year Ago Material
Overhead Cost
This metric is computed as (Difference
between Material Overhead Actual
and Month Ago Material Overhead
Cost/Year Ago Material Overhead
Cost*100
Fact - Manufacturing Cost % Chg Year Ago Resource Cost This metric is computed as (Difference
between Material Overhead Actual
and Month Ago Material Overhead
Cost/Year Ago Resource Cost*100
Fact - Manufacturing Cost % Chg Year Ago Overhead
Cost
This metric is computed as (Difference
between Material Overhead Actual
and Month Ago Material Overhead
Cost/Year Ago Overhead Cost*100
Fact - Manufacturing Cost % Chg Year Ago Outside
Processing Cost
This metric is computed as (Difference
between Material Overhead Actual
and Month Ago Material Overhead

Cost/Year Ago Outside Processing
Cost*100
Fact - Manufacturing Cost % Chg Year Ago
Manufacturing Cost
This metric is computed as (Difference
between Material Overhead Actual
and Month Ago Material Overhead
Cost/Year Ago Manufacturing
Cost*100
Fact - Manufacturing Cost Material Cost ITD Actual Cost of Material for ITD
Fact - Manufacturing Cost Resource Cost ITD Actual Cost of Resource for ITD
Fact - Manufacturing Cost Overhead Cost ITD Actual Overhead Cost for ITD
Fact - Material Cost
Distribution
Base Transaction Value This is the Base Transaction Value for
the Cost Sub Element of the
Transaction
Fact - Material Cost
Distribution
Primary Quantity Primary Quantity of the Transaction
Fact - Material Cost
Distribution
Rate / Amount This is the Rate at which the Cost Sub
element was Costed for the
Transaction
Fact - Sales Order Line # Sales Order Line Impacted Number of Sales Order Line Impacted
Fact - Sales Order Line Demand Quantity Demand Quantity
Fact - Sales Order Line Total Shipped Quantity This is the Total Shipped Quantity
Fact - Sales Order Line Total Shipment Line Count Total Count of Shipment Lines which
are scheduled/Delivered
Fact - Sales Order Line Unit Selling Price This is the Unit Selling Price of the
Sales order line Item
Fact - Sales Order Line Unit Standard Cost This is the Unit Cost of the Sales Order
Line Item
Fact - Sales Order Line Zero Cost Shipped Quantity Sum of the Quantity Shipped with cost
as Zero
Fact - Sales Order Line Total Shipment Revenue (K) This is the total Value of the Shipments
Delivered
Fact - Sales Order Line Zero Cost Shipment Line
Count
Total Count of Sales order lines
shipped with Cost as Zero

Fact - Sales Order Line Zero Cost Shipped Revenue (K) Total Revenue of the Zero costed sales
order lines shipped
Fact - Sales Order Line Sales Order Revenue Value
Impacted (K)
Impacted Sales Order Revenue Value in
USD
Fact - Sales Order Line Loss Incurred (K) Loss Incurred in USD
Fact - Customer and
Supplier Returns
Customer Returned Quantity Physical Quantity of product that is
returned to a location by customer
Fact - Customer and
Supplier Returns
Customer Returned Amount Value of product that is returned to a
location by customer
Fact - Customer and
Supplier Returns
Supplier Returned Quantity Physical Quantity of product that is
returned to a location by supplier
Fact - Customer and
Supplier Returns
Supplier Returned Amount Value of product that is returned to a
location by supplier
Fact - Customer and
Supplier Returns
Year Ago Customer Returned
Quantity
Physical Quantity of product that is
returned to a location by customer a
year ago
Fact - Customer and
Supplier Returns
Chg Year Ago Customer
Returned Quantity
(Customer Returned Quantity - Year
Ago Returned Quantity)
Fact - Customer and
Supplier Returns
% Chg Year Ago Customer
Returned Quantity
(Customer Returned Quantity - Year
Ago Customer Returned Quantity) *
100 / (Year Ago Customer Returned
Quantity)
Fact - Customer and
Supplier Returns
Year Ago Customer Returned
Amount
Value of product that is returned to a
location by customer a year ago
Fact - Customer and
Supplier Returns
Year Ago Supplier Returned
Amount -
Value of product that is returned to a
location by supplier a year ago
Fact - Customer and
Supplier Returns
Chg Year Ago Supplier
Returned Amount
Supplier Returned Amount - Year Ago
Supplier Returned Amount
Fact - Customer and
Supplier Returns
% Chg Year Ago Supplier
Returned Amount
(Supplier Returned Amount - Year Ago
Supplier Returned Amount) * 100 /
(Year Ago Supplier Returned Amount)
Fact - Customer and
Supplier Returns
Year Ago Supplier Returned
Quantity
Physical Quantity of product that is
returned to a location by supplier a
year ago
Fact - Customer and
Supplier Returns
Chg Year Ago Supplier
Returned Quantity
(Supplier Returned Quantity - Year Ago
Supplier Returned Quantity)
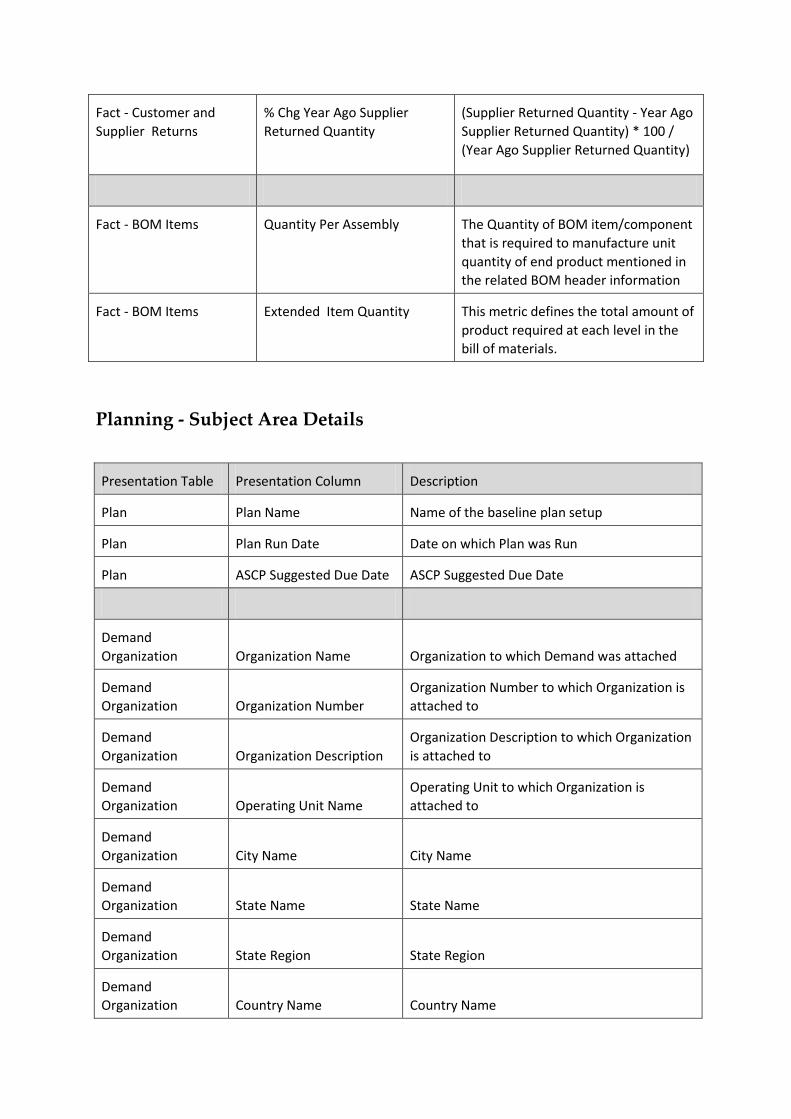
Fact - Customer and
Supplier Returns
% Chg Year Ago Supplier
Returned Quantity
(Supplier Returned Quantity - Year Ago
Supplier Returned Quantity) * 100 /
(Year Ago Supplier Returned Quantity)
Fact - BOM Items Quantity Per Assembly The Quantity of BOM item/component
that is required to manufacture unit
quantity of end product mentioned in
the related BOM header information
Fact - BOM Items Extended Item Quantity This metric defines the total amount of
product required at each level in the
bill of materials.
Planning - Subject Area Details
Presentation Table Presentation Column Description
Plan Plan Name Name of the baseline plan setup
Plan Plan Run Date Date on which Plan was Run
Plan ASCP Suggested Due Date ASCP Suggested Due Date
Demand
Organization Organization Name Organization to which Demand was attached
Demand
Organization Organization Number
Organization Number to which Organization is
attached to
Demand
Organization Organization Description
Organization Description to which Organization
is attached to
Demand
Organization Operating Unit Name
Operating Unit to which Organization is
attached to
Demand
Organization City Name City Name
Demand
Organization State Name State Name
Demand
Organization State Region State Region
Demand
Organization Country Name Country Name

Presentation Table Presentation Column Description
Demand
Organization Country Region Country Region
Demand Details Sales Order Number
Sales order Number or Planned Order Number
from planning demand
Demand Details Sales Order Status Status of the Sales Order
Demand Details Sales Order Line Number Line Number of the Sales Order
Demand Details Sales Order Line Status Status of the Sales Order Line
Demand Details Sales Representative Salesperson on the Sales order line
Demand Details Sales Order Date Date on which the Sales Order was placed
Demand Details Customer Name Name of the Customer
Demand Details Customer Number Number assigned to the customer
Demand Details Customer PO
Customer purchase order from which the Sales
order is created
Demand Details Customer Request Date The Request date associated in the Sales order
Demand Details Demand Project Number
Project Number associated with the Demand
Sales Order
Demand Details Demand Project Task
Task of the project to which Sales Order is
assigned
Demand Details Demand Type
Source type of the Demand from which it is
generated
Demand Details Project Manager Name
Name of the Project Manager associated with
the Sales Order Project Number
Demand Details Level Num Level Number of the Demand from the Pegging
Demand Details
Demand Order Promise
Date Schedule Promised Date of the Demand Order
Demand Details Demand Item Category Item Category of the Demand Item
Demand Item
Details BOM Type To indicate whether it’s a Engineering BOM
Demand Item
Details
Sales Order Part
Description Item Description of the Demand Order Item
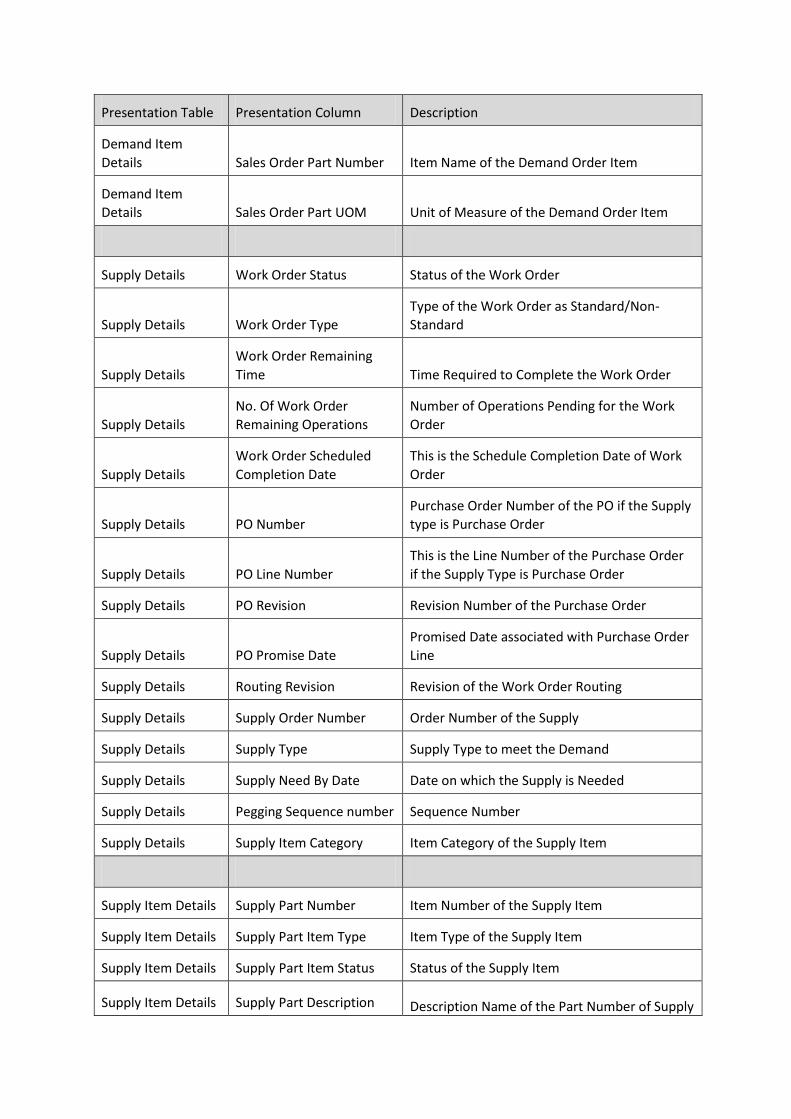
Presentation Table Presentation Column Description
Demand Item
Details Sales Order Part Number Item Name of the Demand Order Item
Demand Item
Details Sales Order Part UOM Unit of Measure of the Demand Order Item
Supply Details Work Order Status Status of the Work Order
Supply Details Work Order Type
Type of the Work Order as Standard/Non-
Standard
Supply Details
Work Order Remaining
Time Time Required to Complete the Work Order
Supply Details
No. Of Work Order
Remaining Operations
Number of Operations Pending for the Work
Order
Supply Details
Work Order Scheduled
Completion Date
This is the Schedule Completion Date of Work
Order
Supply Details PO Number
Purchase Order Number of the PO if the Supply
type is Purchase Order
Supply Details PO Line Number
This is the Line Number of the Purchase Order
if the Supply Type is Purchase Order
Supply Details PO Revision Revision Number of the Purchase Order
Supply Details PO Promise Date
Promised Date associated with Purchase Order
Line
Supply Details Routing Revision Revision of the Work Order Routing
Supply Details Supply Order Number Order Number of the Supply
Supply Details Supply Type Supply Type to meet the Demand
Supply Details Supply Need By Date Date on which the Supply is Needed
Supply Details Pegging Sequence number Sequence Number
Supply Details Supply Item Category Item Category of the Supply Item
Supply Item Details Supply Part Number Item Number of the Supply Item
Supply Item Details Supply Part Item Type Item Type of the Supply Item
Supply Item Details Supply Part Item Status Status of the Supply Item
Supply Item Details Supply Part Description Description Name of the Part Number of Supply
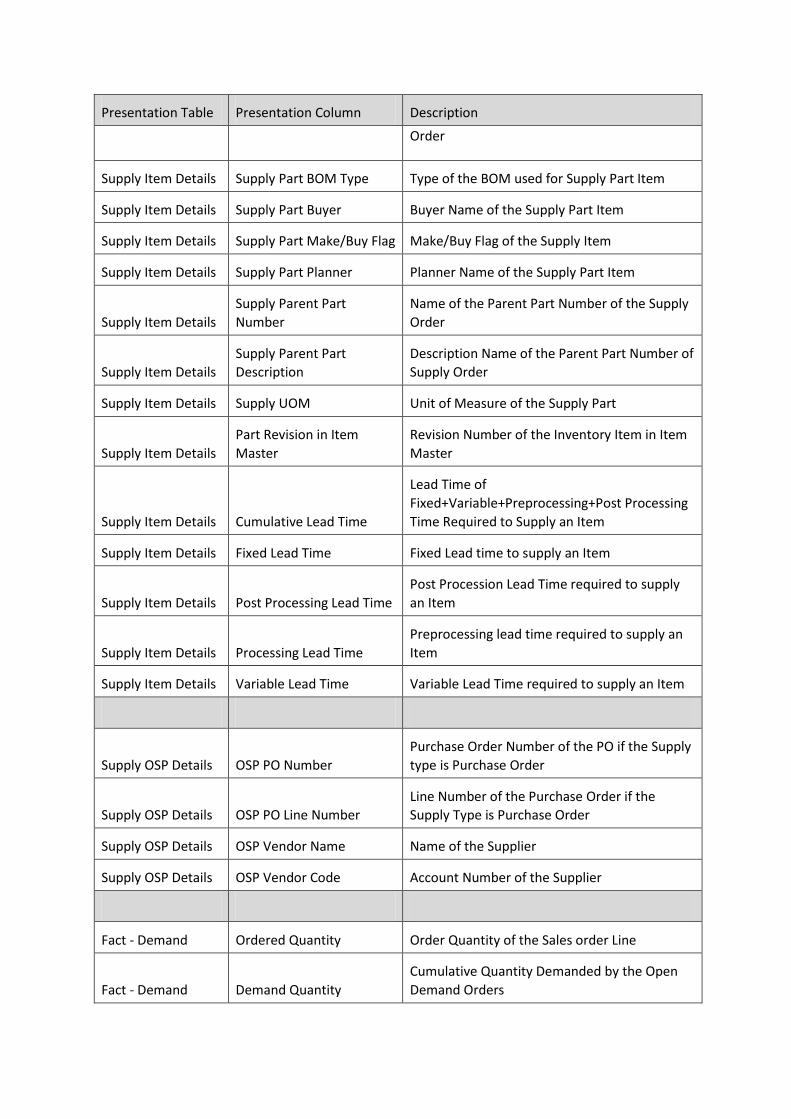
Presentation Table Presentation Column Description
Order
Supply Item Details Supply Part BOM Type Type of the BOM used for Supply Part Item
Supply Item Details Supply Part Buyer Buyer Name of the Supply Part Item
Supply Item Details Supply Part Make/Buy Flag Make/Buy Flag of the Supply Item
Supply Item Details Supply Part Planner Planner Name of the Supply Part Item
Supply Item Details
Supply Parent Part
Number
Name of the Parent Part Number of the Supply
Order
Supply Item Details
Supply Parent Part
Description
Description Name of the Parent Part Number of
Supply Order
Supply Item Details Supply UOM Unit of Measure of the Supply Part
Supply Item Details
Part Revision in Item
Master
Revision Number of the Inventory Item in Item
Master
Supply Item Details Cumulative Lead Time
Lead Time of
Fixed+Variable+Preprocessing+Post Processing
Time Required to Supply an Item
Supply Item Details Fixed Lead Time Fixed Lead time to supply an Item
Supply Item Details Post Processing Lead Time
Post Procession Lead Time required to supply
an Item
Supply Item Details Processing Lead Time
Preprocessing lead time required to supply an
Item
Supply Item Details Variable Lead Time Variable Lead Time required to supply an Item
Supply OSP Details OSP PO Number
Purchase Order Number of the PO if the Supply
type is Purchase Order
Supply OSP Details OSP PO Line Number
Line Number of the Purchase Order if the
Supply Type is Purchase Order
Supply OSP Details OSP Vendor Name Name of the Supplier
Supply OSP Details OSP Vendor Code Account Number of the Supplier
Fact - Demand Ordered Quantity Order Quantity of the Sales order Line
Fact - Demand Demand Quantity
Cumulative Quantity Demanded by the Open
Demand Orders

Presentation Table Presentation Column Description
Fact - Demand
0 - 15 Days Demand
Quantity
Demand Quantity falling between 0-15 days as
of Plan Run Date to the Demand Date
Fact - Demand
16 - 30 Days Demand
Quantity
Demand Quantity falling between 16-30 days as
of Plan Run Date to the Demand Date
Fact - Demand
31 - 45 Days Demand
Quantity
Demand Quantity falling between 31-45 days as
of Plan Run Date to the Demand Date
Fact - Demand
46 - 60 Days Demand
Quantity
Demand Quantity falling between 46-60 days as
of Plan Run Date to the Demand Date
Fact - Demand
60+ Days Demand
Quantity
Demand Quantity falling greater than 60+days
as of Plan Run Date to the Demand Date
Fact - Supply
Actual Completed
Quantity
Actual Completed Quantity of the Demand
Order
Fact - Supply Allocated Quantity
Allocated Quantity of the Demand Order
against a Supply Order
Fact - Supply Ordered Quantity Order Quantity on the Sales order Line
Fact - Supply Material Cost This is the Material Cost of the Item
Fact - Supply Material Overhead Cost
The Material Overhead cost incurred while
completing a Supply Order
Fact - Supply Resource Cost Cost allocated for the Resource
Fact - Supply Overhead Cost Overhead Cost of the Supply Order
Fact - Supply Outside Processing cost Outside Processing cost of the Supply Order
Fact - Supply Manufacturing Cost Total Manufacturing Cost of the Supply Order
Fact - Supply
0 - 15 Days Supply
Quantity
Supply Quantity falling in between 0-15 days as
of Plan Run Date to the Schedule Supply Date
Fact - Supply
16 - 30 Days Supply
Quantity
Supply Quantity falling in between 16-30 days
as of Plan Run Date to the Schedule Supply
Date
Fact - Supply
31 - 45 Days Supply
Quantity
Supply Quantity falling in between 31-45 days
as of Plan Run Date to the Schedule Supply
Date
Fact - Supply
46 - 60 Days Supply
Quantity
Supply Quantity falling in between 46-60 days
as of Plan Run Date to the Schedule Supply
Date
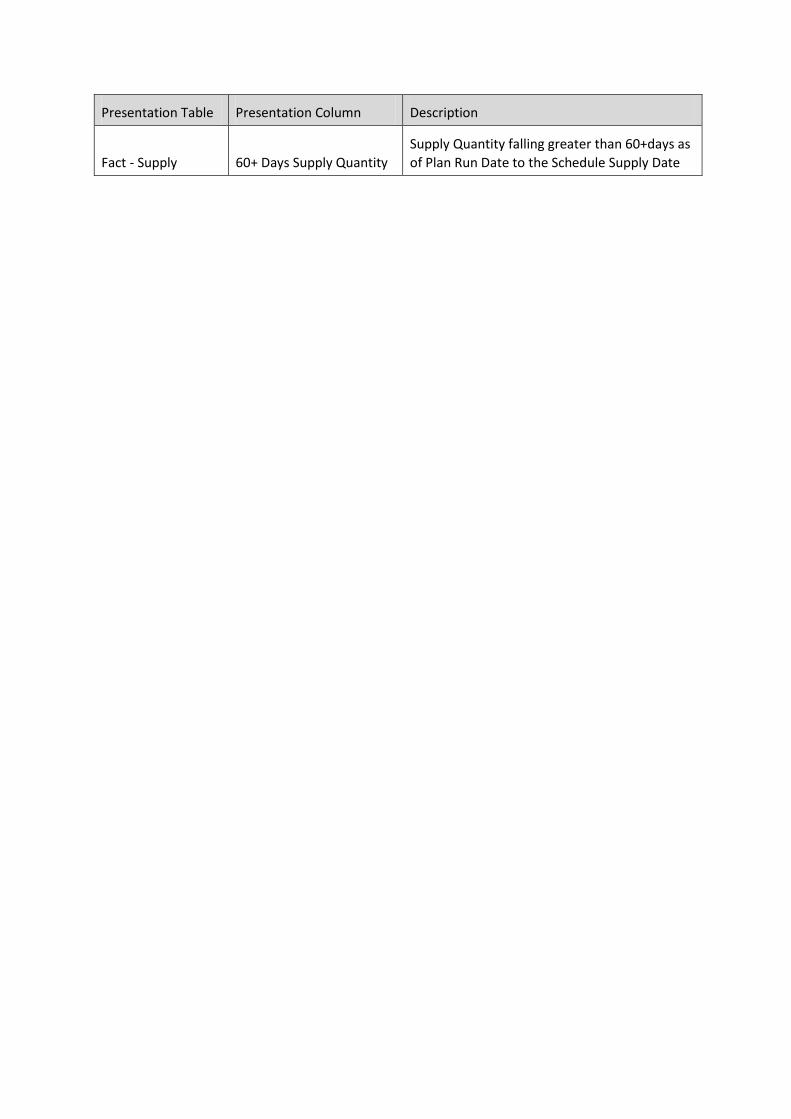
Presentation Table Presentation Column Description
Fact - Supply 60+ Days Supply Quantity
Supply Quantity falling greater than 60+days as
of Plan Run Date to the Schedule Supply Date

Discrete Quality – Subject Area Details
Presentation Table
Presentation
Column Description
Time Date Date of quality result collection
Time Month Month of quality result collection
Time Quarter Quarter of quality result collection
Time Year Year of quality result collection
Customer
Account Base
Currency Base currency in use by account
Customer
Account
Location Location of account
Customer
Account
Loyalty Actual cost per consumer orders.
Customer
Account
Loyalty Group
Based on the number of interactions in the last
one year , rank and group the B2B customers.
Customer Account Name Name of account
Customer
Account
Organization
Name of organization associated with the
account
Customer Account Region Region where account is situated
Customer Account Status Status of account, e.g. Active
Customer Account Value Account Value
Customer
Agency
Contract Date Agency Contract Date
Customer Agency Flag Agency Flag
Customer
Alternate
Customer
Number
This is an alternate number assigned to the
customer.
Customer
Annual
Revenue Annual Revenue
Customer
Annual
Revenue
Category Annual Revenue Category
Customer
Base Level
Current Login Base Level Current Login
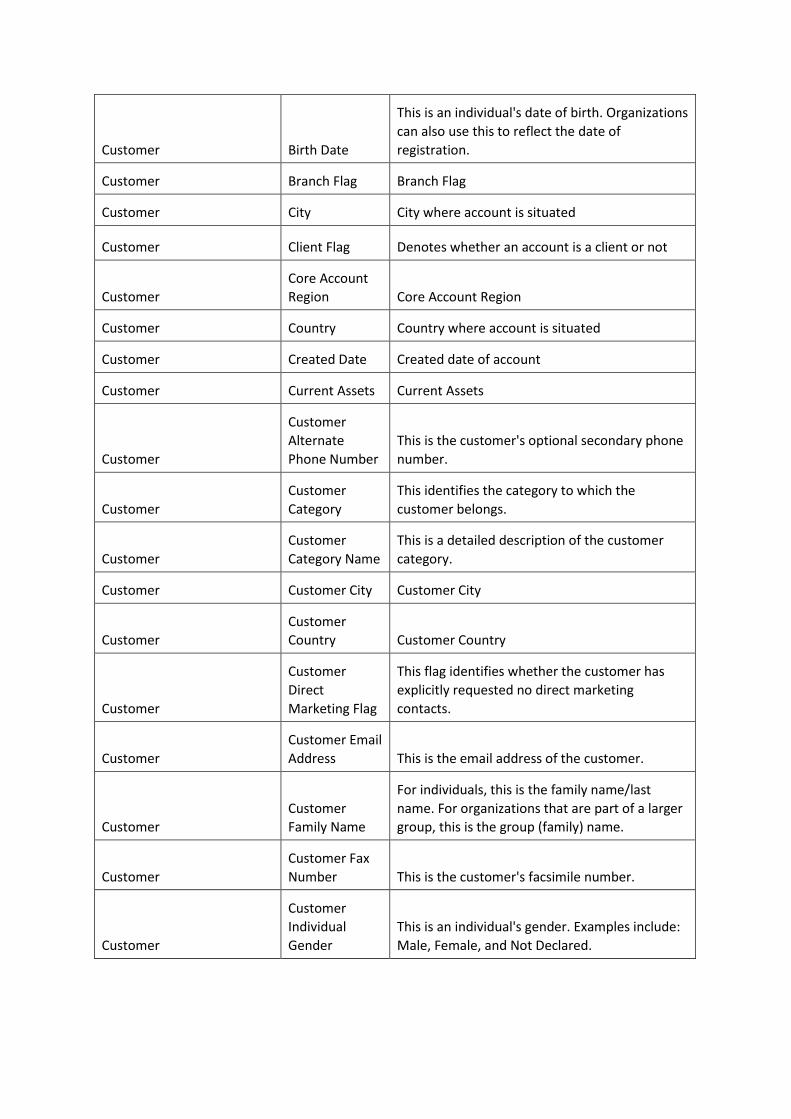
Customer Birth Date
This is an individual's date of birth. Organizations
can also use this to reflect the date of
registration.
Customer Branch Flag Branch Flag
Customer City City where account is situated
Customer Client Flag Denotes whether an account is a client or not
Customer
Core Account
Region Core Account Region
Customer Country Country where account is situated
Customer Created Date Created date of account
Customer Current Assets Current Assets
Customer
Customer
Alternate
Phone Number
This is the customer's optional secondary phone
number.
Customer
Customer
Category
This identifies the category to which the
customer belongs.
Customer
Customer
Category Name
This is a detailed description of the customer
category.
Customer Customer City Customer City
Customer
Customer
Country Customer Country
Customer
Customer
Direct
Marketing Flag
This flag identifies whether the customer has
explicitly requested no direct marketing
contacts.
Customer
Customer Email
Address This is the email address of the customer.
Customer
Customer
Family Name
For individuals, this is the family name/last
name. For organizations that are part of a larger
group, this is the group (family) name.
Customer
Customer Fax
Number This is the customer's facsimile number.
Customer
Customer
Individual
Gender
This is an individual's gender. Examples include:
Male, Female, and Not Declared.
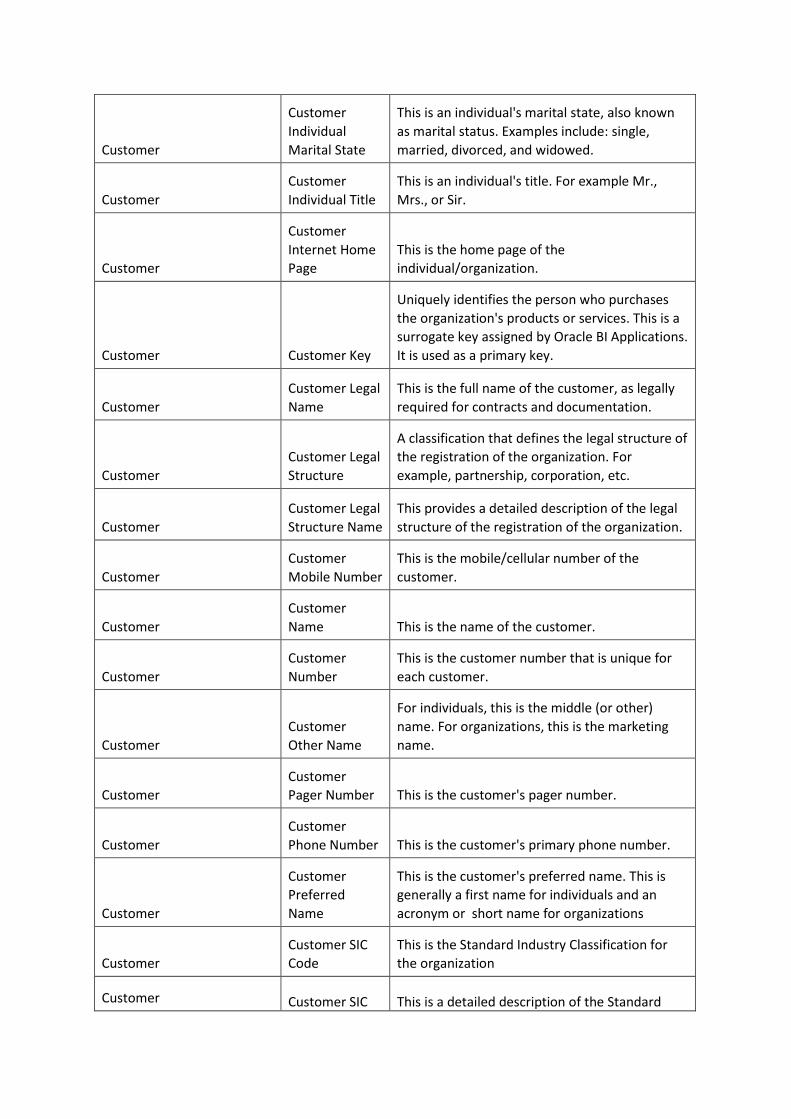
Customer
Customer
Individual
Marital State
This is an individual's marital state, also known
as marital status. Examples include: single,
married, divorced, and widowed.
Customer
Customer
Individual Title
This is an individual's title. For example Mr.,
Mrs., or Sir.
Customer
Customer
Internet Home
Page
This is the home page of the
individual/organization.
Customer Customer Key
Uniquely identifies the person who purchases
the organization's products or services. This is a
surrogate key assigned by Oracle BI Applications.
It is used as a primary key.
Customer
Customer Legal
Name
This is the full name of the customer, as legally
required for contracts and documentation.
Customer
Customer Legal
Structure
A classification that defines the legal structure of
the registration of the organization. For
example, partnership, corporation, etc.
Customer
Customer Legal
Structure Name
This provides a detailed description of the legal
structure of the registration of the organization.
Customer
Customer
Mobile Number
This is the mobile/cellular number of the
customer.
Customer
Customer
Name This is the name of the customer.
Customer
Customer
Number
This is the customer number that is unique for
each customer.
Customer
Customer
Other Name
For individuals, this is the middle (or other)
name. For organizations, this is the marketing
name.
Customer
Customer
Pager Number This is the customer's pager number.
Customer
Customer
Phone Number This is the customer's primary phone number.
Customer
Customer
Preferred
Name
This is the customer's preferred name. This is
generally a first name for individuals and an
acronym or short name for organizations
Customer
Customer SIC
Code
This is the Standard Industry Classification for
the organization
Customer Customer SIC This is a detailed description of the Standard

Name Industry Classification code
Customer
Customer
Solicitation Flag
This flag defines whether the customer has
specifically requested that no marketing
material be sent to them or that no illegal
contacts are permitted
Customer Customer State Customer State
Customer
Customer
Street Address Customer Street Address
Customer Customer Type This code identifies the customer type
Customer
Customer Type
Name
This is a detailed description of the customer
type
Customer Date Formed Date account formed
Customer Exchange Loc Exchange Loc
Customer Expertise Expertise
Customer Facility Type
Type of loan facility, either ""New"" or
""Renewal"""
Customer
Financing
Method Financing Method
Customer Freight Terms Freight Terms
Customer
Frequency
Category Frequency Category
Customer Gross Profit Gross Profit
Customer Growth % Growth %
Customer
Growth
Horizon Growth Horizon
Customer
Growth
Objective Growth Objective
Customer
Hierarchy
Based Login Hierarchy Based Login
Customer Industry Name Industry Name
Customer Key Competitor
Denotes whether an account is a key competitor
or not
Customer Legal Form Legal Form
Customer Line of Account's line of business
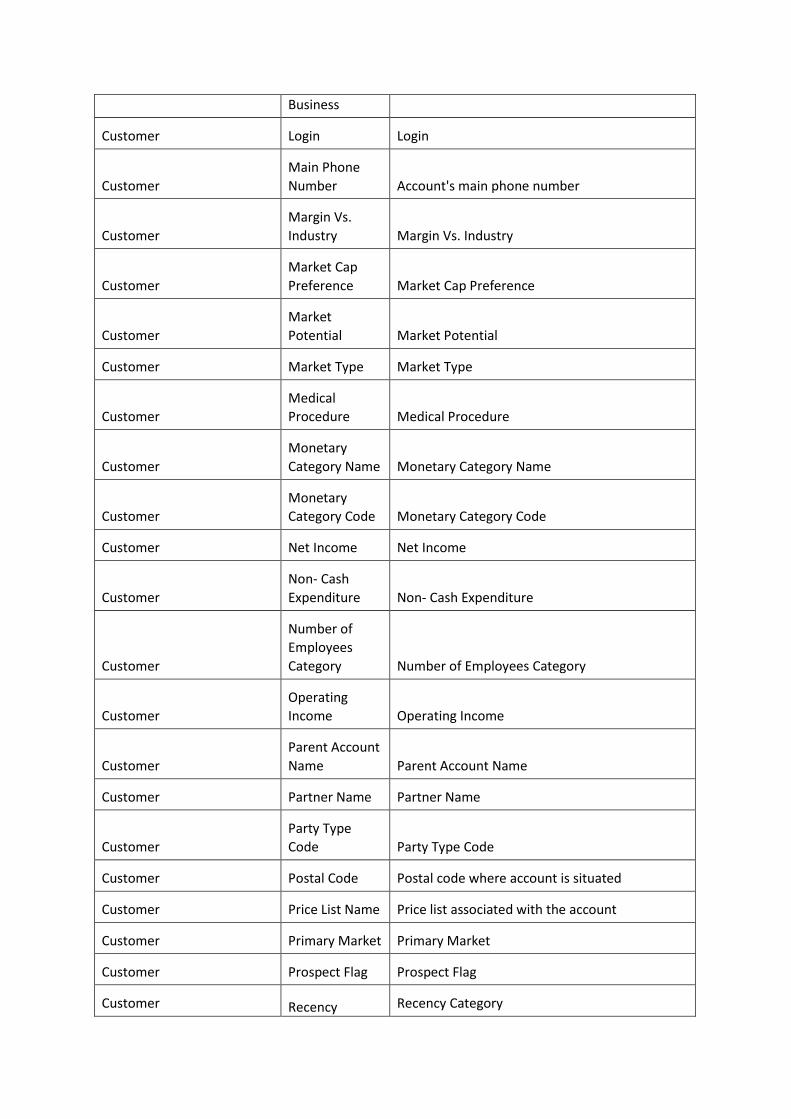
Business
Customer Login Login
Customer
Main Phone
Number Account's main phone number
Customer
Margin Vs.
Industry Margin Vs. Industry
Customer
Market Cap
Preference Market Cap Preference
Customer
Market
Potential Market Potential
Customer Market Type Market Type
Customer
Medical
Procedure Medical Procedure
Customer
Monetary
Category Name Monetary Category Name
Customer
Monetary
Category Code Monetary Category Code
Customer Net Income Net Income
Customer
Non- Cash
Expenditure Non- Cash Expenditure
Customer
Number of
Employees
Category Number of Employees Category
Customer
Operating
Income Operating Income
Customer
Parent Account
Name Parent Account Name
Customer Partner Name Partner Name
Customer
Party Type
Code Party Type Code
Customer Postal Code Postal code where account is situated
Customer Price List Name Price list associated with the account
Customer Primary Market Primary Market
Customer Prospect Flag Prospect Flag
Customer Recency Recency Category

Category
Customer
Revenue
Growth
Category Revenue Growth Category
Customer State State where account is situated
Customer Street Address Street address where account is situated
Customer
Team Owner
Login Team Owner Login
Customer
Top Level
Current Login Top Level Current Login
Collection Plan Plan Name Name of the collection plan
Collection Plan
Plan
Description Plan Description
Collection Plan Plan Type Code Plan Type Code
Product
Product
Number Product Number
Product Product Name This is a detailed description of the product
Product
Product
Category Product Category
Product Product Group
This is the product group code. Products with
similar attributes can be grouped. For example,
a product can belong to the chemical group,
paints group or general stores. Product
hierarchies can be define based on product
groups
Product
Product
Hierarchy 1
Number
This column is provided by Oracle BI Applications
for storing a hierarchy code
Product
Product
Hierarchy 1
Name
This column is provided by Oracle BI Applications
for storing the description that corresponds to
the hierarchy code
Product
Product
Hierarchy 2
Number
This column is provided by Oracle BI Applications
for storing a hierarchy code
Product
Product
Hierarchy 2
Name
This column is provided by Oracle BI Applications
for storing the description that corresponds to
the hierarchy code
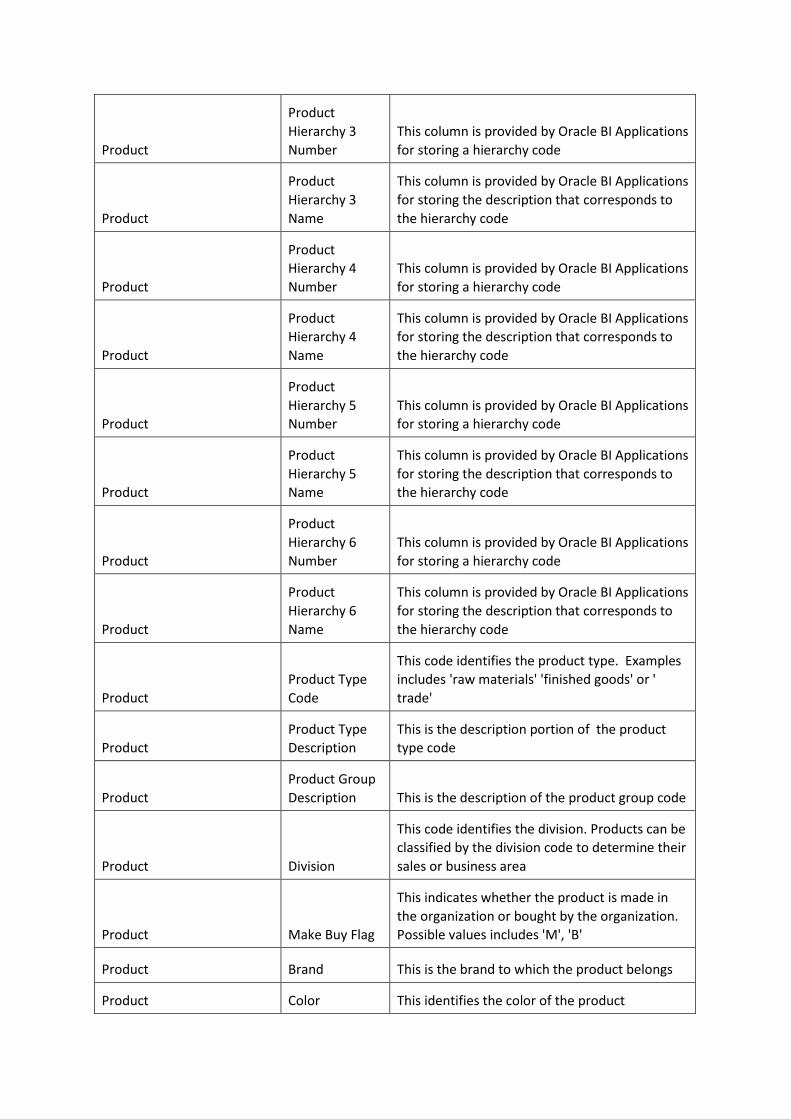
Product
Product
Hierarchy 3
Number
This column is provided by Oracle BI Applications
for storing a hierarchy code
Product
Product
Hierarchy 3
Name
This column is provided by Oracle BI Applications
for storing the description that corresponds to
the hierarchy code
Product
Product
Hierarchy 4
Number
This column is provided by Oracle BI Applications
for storing a hierarchy code
Product
Product
Hierarchy 4
Name
This column is provided by Oracle BI Applications
for storing the description that corresponds to
the hierarchy code
Product
Product
Hierarchy 5
Number
This column is provided by Oracle BI Applications
for storing a hierarchy code
Product
Product
Hierarchy 5
Name
This column is provided by Oracle BI Applications
for storing the description that corresponds to
the hierarchy code
Product
Product
Hierarchy 6
Number
This column is provided by Oracle BI Applications
for storing a hierarchy code
Product
Product
Hierarchy 6
Name
This column is provided by Oracle BI Applications
for storing the description that corresponds to
the hierarchy code
Product
Product Type
Code
This code identifies the product type. Examples
includes 'raw materials' 'finished goods' or '
trade'
Product
Product Type
Description
This is the description portion of the product
type code
Product
Product Group
Description This is the description of the product group code
Product Division
This code identifies the division. Products can be
classified by the division code to determine their
sales or business area
Product Make Buy Flag
This indicates whether the product is made in
the organization or bought by the organization.
Possible values includes 'M', 'B'
Product Brand This is the brand to which the product belongs
Product Color This identifies the color of the product
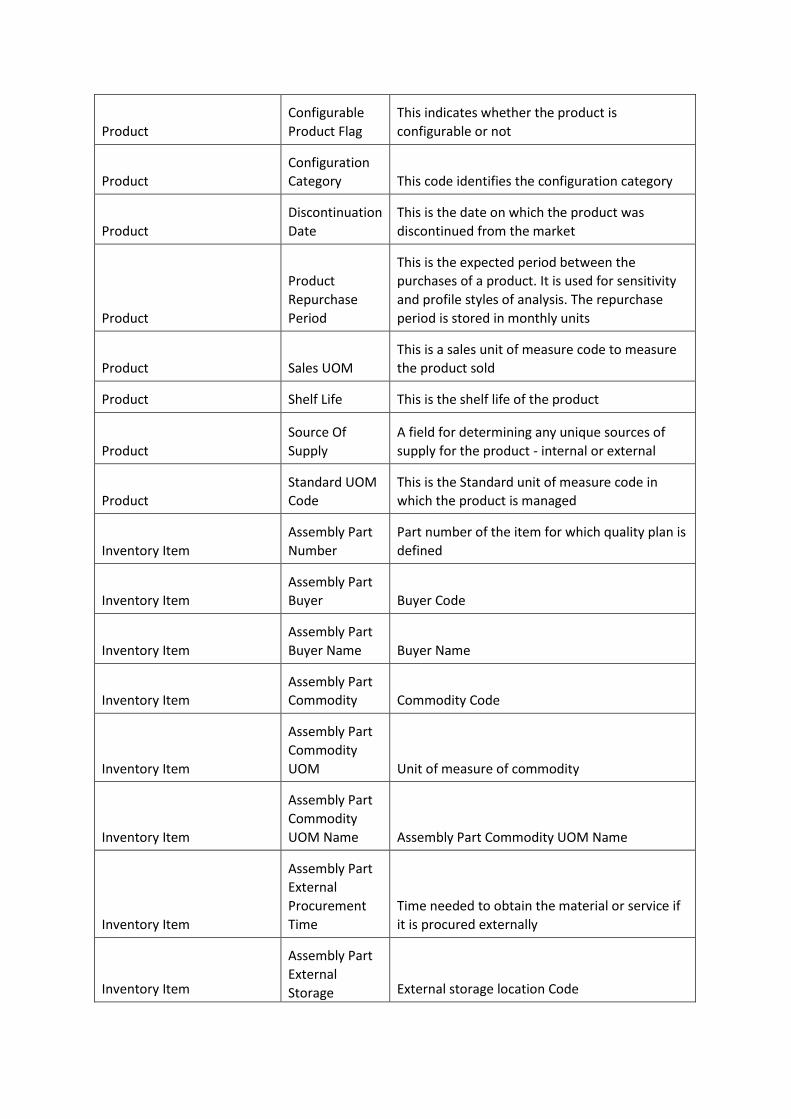
Product
Configurable
Product Flag
This indicates whether the product is
configurable or not
Product
Configuration
Category This code identifies the configuration category
Product
Discontinuation
Date
This is the date on which the product was
discontinued from the market
Product
Product
Repurchase
Period
This is the expected period between the
purchases of a product. It is used for sensitivity
and profile styles of analysis. The repurchase
period is stored in monthly units
Product Sales UOM
This is a sales unit of measure code to measure
the product sold
Product Shelf Life This is the shelf life of the product
Product
Source Of
Supply
A field for determining any unique sources of
supply for the product - internal or external
Product
Standard UOM
Code
This is the Standard unit of measure code in
which the product is managed
Inventory Item
Assembly Part
Number
Part number of the item for which quality plan is
defined
Inventory Item
Assembly Part
Buyer Buyer Code
Inventory Item
Assembly Part
Buyer Name Buyer Name
Inventory Item
Assembly Part
Commodity Commodity Code
Inventory Item
Assembly Part
Commodity
UOM Unit of measure of commodity
Inventory Item
Assembly Part
Commodity
UOM Name Assembly Part Commodity UOM Name
Inventory Item
Assembly Part
External
Procurement
Time
Time needed to obtain the material or service if
it is procured externally
Inventory Item
Assembly Part
External
Storage External storage location Code

Location
Inventory Item
Assembly Part
External
Storage
Location Name
External storage location OVERRIDE LOGICAL
NAME DESCRIPTION
Inventory Item
Assembly Part
Fixed Lot Size Fixed lot size
Inventory Item
Assembly Part
Forecast Period Forecast period (Like Weekly , Monthly etc)
Inventory Item
Assembly Part
Internal
Manufacturing
Time Internal manufacturing time
Inventory Item
Assembly Part
Internal
Storage
Location Internal storage location Code
Inventory Item
Assembly Part
Internal
Storage
Location Name
Internal storage location OVERRIDE LOGICAL
NAME DESCRIPTION
Inventory Item
Assembly Part
Issue UOM Unit of measure in issues
Inventory Item
Assembly Part
Lot Ordering
Cost Cost of ordering a lot
Inventory Item
Assembly Part
Lot Size Lot size Code
Inventory Item
Assembly Part
Lot Size Name Lot size OVERRIDE LOGICAL NAME DESCRIPTION
Inventory Item
Assembly Part
Manufacturing
UOM Unit of measure in manufacturing
Inventory Item
Assembly Part
Max Lot Size Maximum lot size
Inventory Item
Assembly Part
Max Stock
Level Maximum stock level
Inventory Item Assembly Part Maximum storage period in days
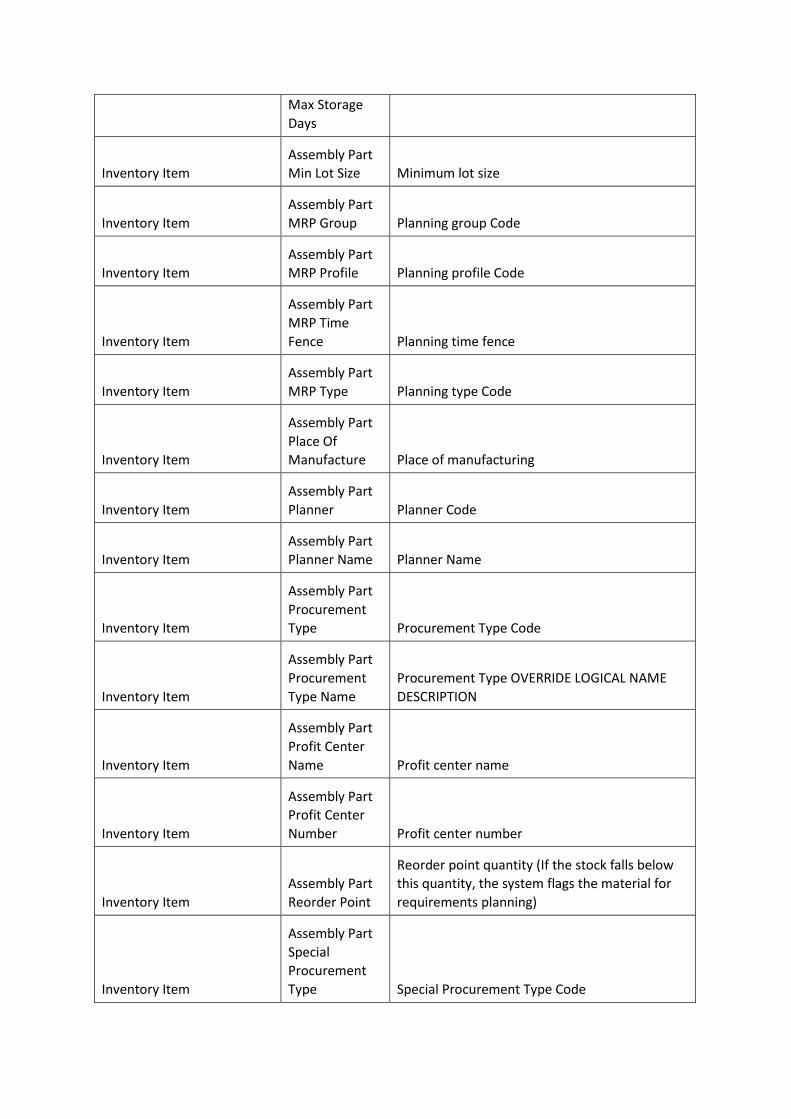
Max Storage
Days
Inventory Item
Assembly Part
Min Lot Size Minimum lot size
Inventory Item
Assembly Part
MRP Group Planning group Code
Inventory Item
Assembly Part
MRP Profile Planning profile Code
Inventory Item
Assembly Part
MRP Time
Fence Planning time fence
Inventory Item
Assembly Part
MRP Type Planning type Code
Inventory Item
Assembly Part
Place Of
Manufacture Place of manufacturing
Inventory Item
Assembly Part
Planner Planner Code
Inventory Item
Assembly Part
Planner Name Planner Name
Inventory Item
Assembly Part
Procurement
Type Procurement Type Code
Inventory Item
Assembly Part
Procurement
Type Name
Procurement Type OVERRIDE LOGICAL NAME
DESCRIPTION
Inventory Item
Assembly Part
Profit Center
Name Profit center name
Inventory Item
Assembly Part
Profit Center
Number Profit center number
Inventory Item
Assembly Part
Reorder Point
Reorder point quantity (If the stock falls below
this quantity, the system flags the material for
requirements planning)
Inventory Item
Assembly Part
Special
Procurement
Type Special Procurement Type Code
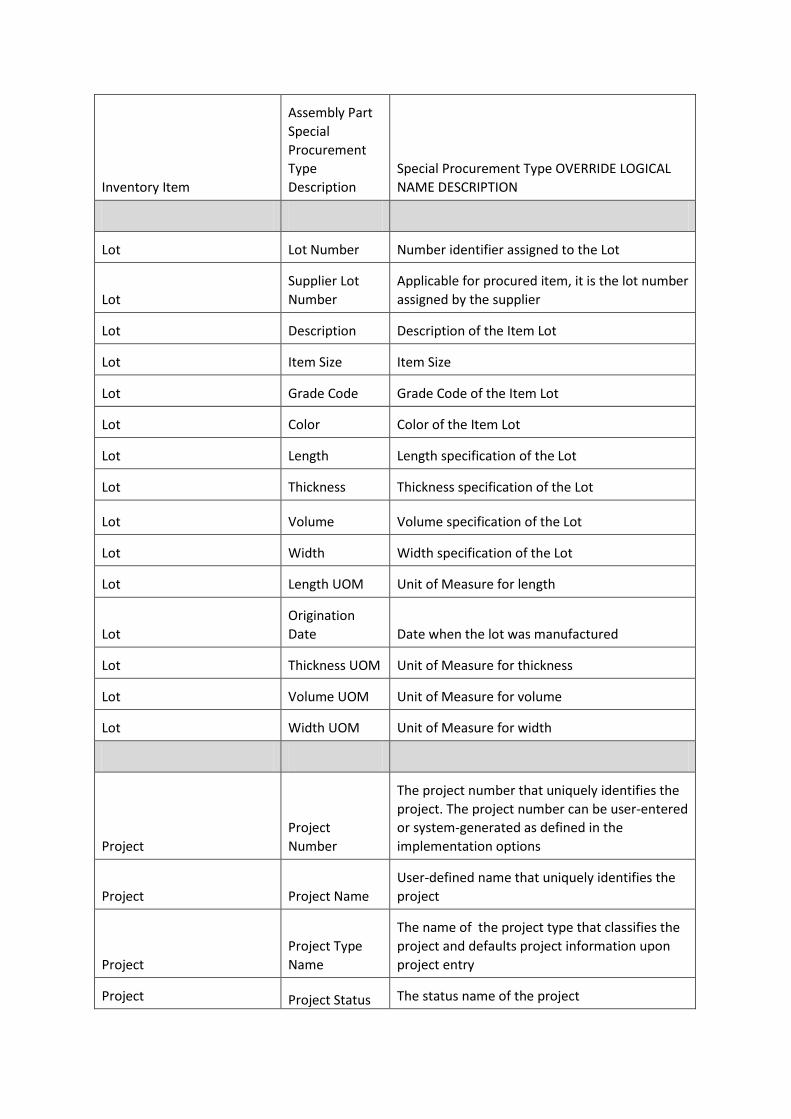
Inventory Item
Assembly Part
Special
Procurement
Type
Description
Special Procurement Type OVERRIDE LOGICAL
NAME DESCRIPTION
Lot Lot Number Number identifier assigned to the Lot
Lot
Supplier Lot
Number
Applicable for procured item, it is the lot number
assigned by the supplier
Lot Description Description of the Item Lot
Lot Item Size Item Size
Lot Grade Code Grade Code of the Item Lot
Lot Color Color of the Item Lot
Lot Length Length specification of the Lot
Lot Thickness Thickness specification of the Lot
Lot Volume Volume specification of the Lot
Lot Width Width specification of the Lot
Lot Length UOM Unit of Measure for length
Lot
Origination
Date Date when the lot was manufactured
Lot Thickness UOM Unit of Measure for thickness
Lot Volume UOM Unit of Measure for volume
Lot Width UOM Unit of Measure for width
Project
Project
Number
The project number that uniquely identifies the
project. The project number can be user-entered
or system-generated as defined in the
implementation options
Project Project Name
User-defined name that uniquely identifies the
project
Project
Project Type
Name
The name of the project type that classifies the
project and defaults project information upon
project entry
Project Project Status The status name of the project

Name
Project
Project Start
Date
The date on which the project starts;
expenditure items with item dates before the
start date cannot be entered for the project
Project
Project Close
Date
The date that the project was closed by changing
the project status to Closed
Organization Org Name
Name of the Inventory Organization in which
Quality plan is defined
Organization Org Number
Unique identifier of the Inventory Organization
in which Quality plan is defined
Organization
Org Hierarchy 1
Number Org Hierarchy 1 Number
Organization
Org Hierarchy 1
Name Org Hierarchy 1 Name
Organization
Org Hierarchy 2
Number Org Hierarchy 2 Number
Organization
Org Hierarchy 2
Name Org Hierarchy 2 Name
Organization
Org Hierarchy 3
Number Org Hierarchy 3 Number
Organization
Org Hierarchy 3
Name Org Hierarchy 3 Name
Organization
Org Hierarchy 4
Number Org Hierarchy 4 Number
Organization
Org Hierarchy 4
Name Org Hierarchy 4 Name
Organization
Org Hierarchy 5
Number Org Hierarchy 5 Number
Organization
Org Hierarchy 5
Name Org Hierarchy 5 Name
Organization
Org Hierarchy 6
Number Org Hierarchy 6 Number
Organization
Org Hierarchy 6
Name Org Hierarchy 6 Name
Organization
Org Hierarchy 7
Number Org Hierarchy 7 Number

Organization
Org Hierarchy 7
Name Org Hierarchy 7 Name
Organization
Org Hierarchy 8
Number Org Hierarchy 8 Number
Organization
Org Hierarchy 8
Name Org Hierarchy 8 Name
Organization
Org Hierarchy 9
Number Org Hierarchy 9 Number
Organization
Org Hierarchy 9
Name Org Hierarchy 9 Name
Organization
Org Hierarchy
10 Number Org Hierarchy 10 Number
Organization
Org Hierarchy
10 Name Org Hierarchy 10 Name
Organization
Org Hierarchy
11 Number Org Hierarchy 11 Number
Organization
Org Hierarchy
11 Name Org Hierarchy 11 Name
Organization
Org Hierarchy
12 Number Org Hierarchy 12 Number
Organization
Org Hierarchy
12 Name Org Hierarchy 12 Name
Organization
Org Hierarchy
13 Number Org Hierarchy 13 Number
Organization
Org Hierarchy
13 Name Org Hierarchy 13 Name
Organization
Org Top
Hierarchy
Number Org Top Hierarchy Number
Organization
Org Top
Hierarchy
Name Org Top Hierarchy Name
Department
Department
Name
Code of the department in which Quality plan is
defined
Department
Department
Code
Name of the department in which Quality plan is
defined
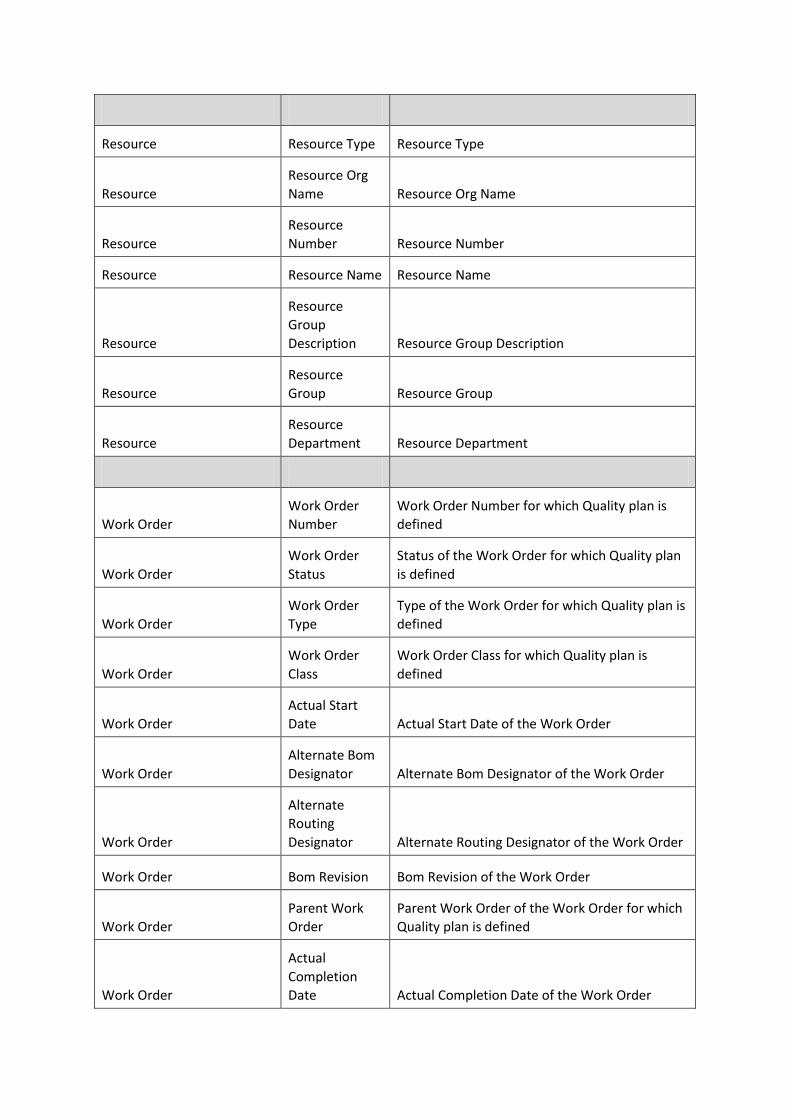
Resource Resource Type Resource Type
Resource
Resource Org
Name Resource Org Name
Resource
Resource
Number Resource Number
Resource Resource Name Resource Name
Resource
Resource
Group
Description Resource Group Description
Resource
Resource
Group Resource Group
Resource
Resource
Department Resource Department
Work Order
Work Order
Number
Work Order Number for which Quality plan is
defined
Work Order
Work Order
Status
Status of the Work Order for which Quality plan
is defined
Work Order
Work Order
Type
Type of the Work Order for which Quality plan is
defined
Work Order
Work Order
Class
Work Order Class for which Quality plan is
defined
Work Order
Actual Start
Date Actual Start Date of the Work Order
Work Order
Alternate Bom
Designator Alternate Bom Designator of the Work Order
Work Order
Alternate
Routing
Designator Alternate Routing Designator of the Work Order
Work Order Bom Revision Bom Revision of the Work Order
Work Order
Parent Work
Order
Parent Work Order of the Work Order for which
Quality plan is defined
Work Order
Actual
Completion
Date Actual Completion Date of the Work Order
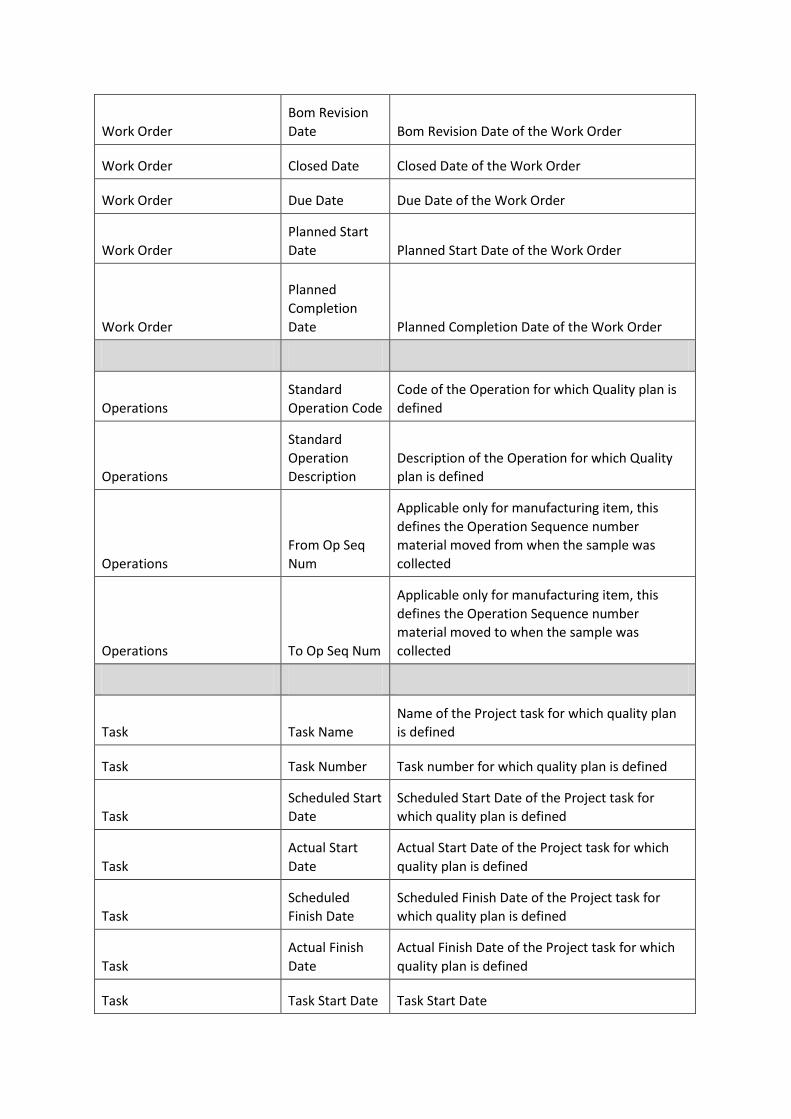
Work Order
Bom Revision
Date Bom Revision Date of the Work Order
Work Order Closed Date Closed Date of the Work Order
Work Order Due Date Due Date of the Work Order
Work Order
Planned Start
Date Planned Start Date of the Work Order
Work Order
Planned
Completion
Date Planned Completion Date of the Work Order
Operations
Standard
Operation Code
Code of the Operation for which Quality plan is
defined
Operations
Standard
Operation
Description
Description of the Operation for which Quality
plan is defined
Operations
From Op Seq
Num
Applicable only for manufacturing item, this
defines the Operation Sequence number
material moved from when the sample was
collected
Operations To Op Seq Num
Applicable only for manufacturing item, this
defines the Operation Sequence number
material moved to when the sample was
collected
Task Task Name
Name of the Project task for which quality plan
is defined
Task Task Number Task number for which quality plan is defined
Task
Scheduled Start
Date
Scheduled Start Date of the Project task for
which quality plan is defined
Task
Actual Start
Date
Actual Start Date of the Project task for which
quality plan is defined
Task
Scheduled
Finish Date
Scheduled Finish Date of the Project task for
which quality plan is defined
Task
Actual Finish
Date
Actual Finish Date of the Project task for which
quality plan is defined
Task Task Start Date Task Start Date
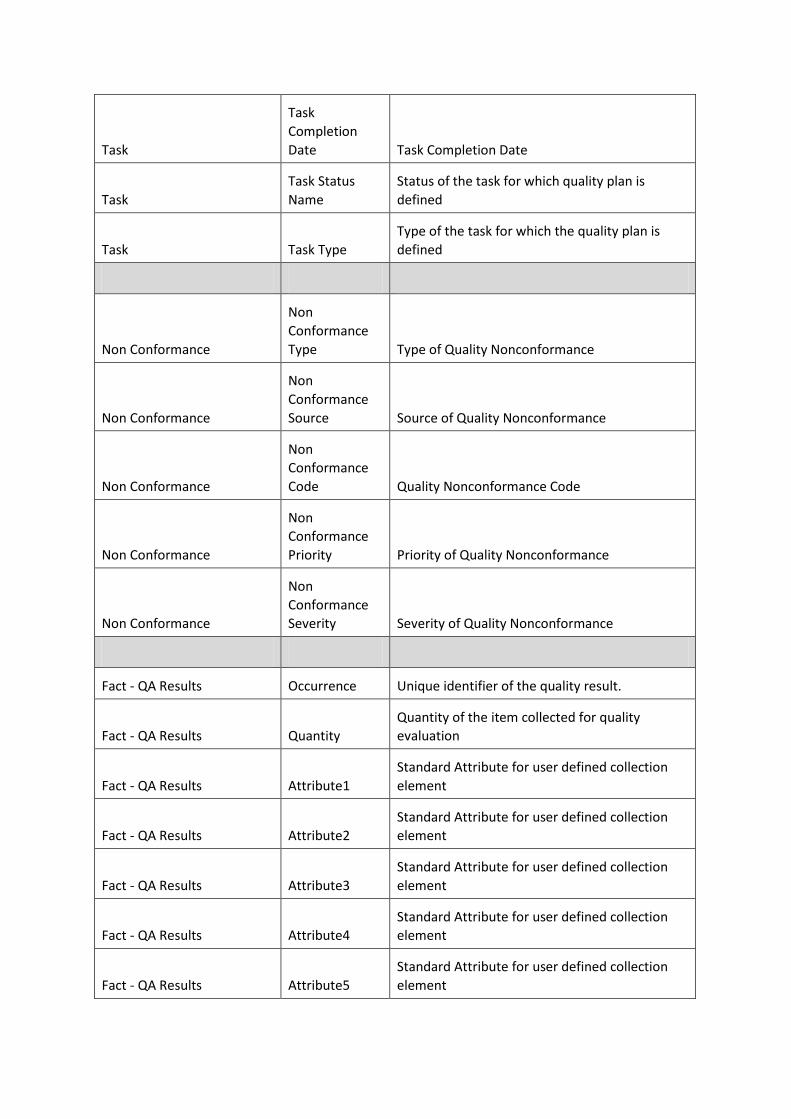
Task
Task
Completion
Date Task Completion Date
Task
Task Status
Name
Status of the task for which quality plan is
defined
Task Task Type
Type of the task for which the quality plan is
defined
Non Conformance
Non
Conformance
Type Type of Quality Nonconformance
Non Conformance
Non
Conformance
Source Source of Quality Nonconformance
Non Conformance
Non
Conformance
Code Quality Nonconformance Code
Non Conformance
Non
Conformance
Priority Priority of Quality Nonconformance
Non Conformance
Non
Conformance
Severity Severity of Quality Nonconformance
Fact - QA Results Occurrence Unique identifier of the quality result.
Fact - QA Results Quantity
Quantity of the item collected for quality
evaluation
Fact - QA Results Attribute1
Standard Attribute for user defined collection
element
Fact - QA Results Attribute2
Standard Attribute for user defined collection
element
Fact - QA Results Attribute3
Standard Attribute for user defined collection
element
Fact - QA Results Attribute4
Standard Attribute for user defined collection
element
Fact - QA Results Attribute5
Standard Attribute for user defined collection
element

Fact - QA Results Attribute6
Standard Attribute for user defined collection
element
Fact - QA Results Attribute7
Standard Attribute for user defined collection
element
Fact - QA Results Attribute8
Standard Attribute for user defined collection
element
Fact - QA Results Attribute9
Standard Attribute for user defined collection
element
Fact - QA Results Attribute10
Standard Attribute for user defined collection
element
Fact - QA Results Attribute11
Standard Attribute for user defined collection
element
Fact - QA Results Attribute12
Standard Attribute for user defined collection
element
Fact - QA Results Attribute13
Standard Attribute for user defined collection
element
Fact - QA Results Attribute14
Standard Attribute for user defined collection
element
Fact - QA Results Attribute15
Standard Attribute for user defined collection
element
Fact - QA Results Attribute16
Standard Attribute for user defined collection
element
Fact - QA Results Attribute17
Standard Attribute for user defined collection
element
Fact - QA Results Attribute18
Standard Attribute for user defined collection
element
Fact - QA Results Attribute19
Standard Attribute for user defined collection
element
Fact - QA Results Attribute20
Standard Attribute for user defined collection
element
Fact - QA Results Attribute21
Standard Attribute for user defined collection
element
Fact - QA Results Attribute22
Standard Attribute for user defined collection
element
Fact - QA Results Attribute23
Standard Attribute for user defined collection
element

Fact - QA Results Attribute24
Standard Attribute for user defined collection
element
Fact - QA Results Attribute25
Standard Attribute for user defined collection
element
Fact - QA Results Attribute26
Standard Attribute for user defined collection
element
Fact - QA Results Attribute27
Standard Attribute for user defined collection
element
Fact - QA Results Attribute28
Standard Attribute for user defined collection
element
Fact - QA Results Attribute29
Standard Attribute for user defined collection
element
Fact - QA Results Attribute30
Standard Attribute for user defined collection
element
Fact - QA Results Attribute31
Standard Attribute for user defined collection
element
Fact - QA Results Attribute32
Standard Attribute for user defined collection
element
Fact - QA Results Attribute33
Standard Attribute for user defined collection
element
Fact - QA Results Attribute34
Standard Attribute for user defined collection
element
Fact - QA Results Attribute35
Standard Attribute for user defined collection
element
Fact - QA Results Attribute36
Standard Attribute for user defined collection
element
Fact - QA Results Attribute37
Standard Attribute for user defined collection
element
Fact - QA Results Attribute38
Standard Attribute for user defined collection
element
Fact - QA Results Attribute39
Standard Attribute for user defined collection
element
Fact - QA Results Attribute40
Standard Attribute for user defined collection
element
Fact - QA Results Attribute41
Standard Attribute for user defined collection
element
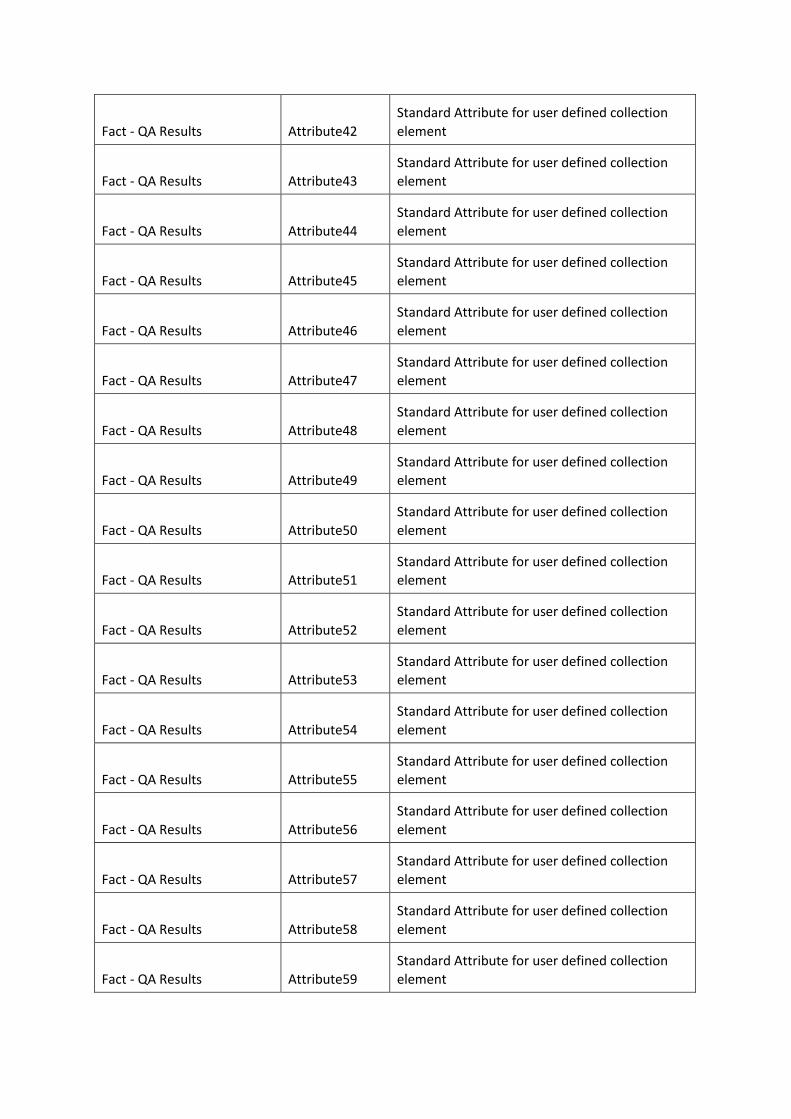
Fact - QA Results Attribute42
Standard Attribute for user defined collection
element
Fact - QA Results Attribute43
Standard Attribute for user defined collection
element
Fact - QA Results Attribute44
Standard Attribute for user defined collection
element
Fact - QA Results Attribute45
Standard Attribute for user defined collection
element
Fact - QA Results Attribute46
Standard Attribute for user defined collection
element
Fact - QA Results Attribute47
Standard Attribute for user defined collection
element
Fact - QA Results Attribute48
Standard Attribute for user defined collection
element
Fact - QA Results Attribute49
Standard Attribute for user defined collection
element
Fact - QA Results Attribute50
Standard Attribute for user defined collection
element
Fact - QA Results Attribute51
Standard Attribute for user defined collection
element
Fact - QA Results Attribute52
Standard Attribute for user defined collection
element
Fact - QA Results Attribute53
Standard Attribute for user defined collection
element
Fact - QA Results Attribute54
Standard Attribute for user defined collection
element
Fact - QA Results Attribute55
Standard Attribute for user defined collection
element
Fact - QA Results Attribute56
Standard Attribute for user defined collection
element
Fact - QA Results Attribute57
Standard Attribute for user defined collection
element
Fact - QA Results Attribute58
Standard Attribute for user defined collection
element
Fact - QA Results Attribute59
Standard Attribute for user defined collection
element
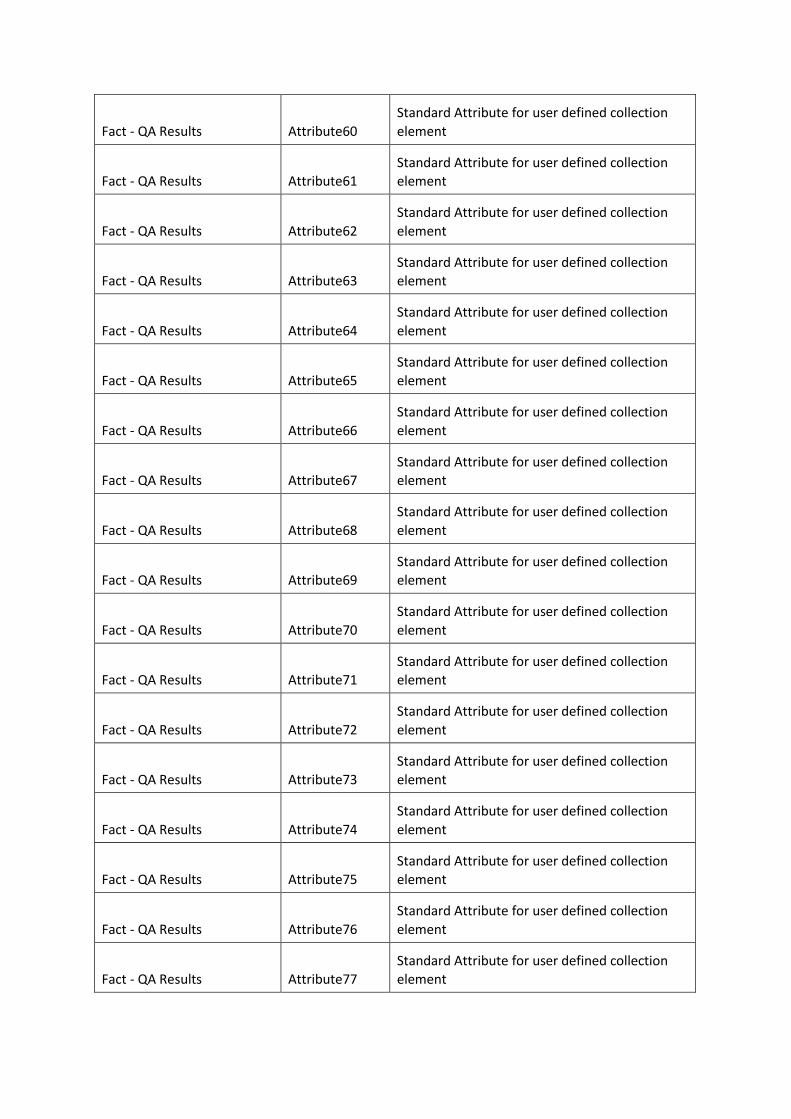
Fact - QA Results Attribute60
Standard Attribute for user defined collection
element
Fact - QA Results Attribute61
Standard Attribute for user defined collection
element
Fact - QA Results Attribute62
Standard Attribute for user defined collection
element
Fact - QA Results Attribute63
Standard Attribute for user defined collection
element
Fact - QA Results Attribute64
Standard Attribute for user defined collection
element
Fact - QA Results Attribute65
Standard Attribute for user defined collection
element
Fact - QA Results Attribute66
Standard Attribute for user defined collection
element
Fact - QA Results Attribute67
Standard Attribute for user defined collection
element
Fact - QA Results Attribute68
Standard Attribute for user defined collection
element
Fact - QA Results Attribute69
Standard Attribute for user defined collection
element
Fact - QA Results Attribute70
Standard Attribute for user defined collection
element
Fact - QA Results Attribute71
Standard Attribute for user defined collection
element
Fact - QA Results Attribute72
Standard Attribute for user defined collection
element
Fact - QA Results Attribute73
Standard Attribute for user defined collection
element
Fact - QA Results Attribute74
Standard Attribute for user defined collection
element
Fact - QA Results Attribute75
Standard Attribute for user defined collection
element
Fact - QA Results Attribute76
Standard Attribute for user defined collection
element
Fact - QA Results Attribute77
Standard Attribute for user defined collection
element

Fact - QA Results Attribute78
Standard Attribute for user defined collection
element
Fact - QA Results Attribute79
Standard Attribute for user defined collection
element
Fact - QA Results Attribute80
Standard Attribute for user defined collection
element
Fact - QA Results Attribute81
Standard Attribute for user defined collection
element
Fact - QA Results Attribute82
Standard Attribute for user defined collection
element
Fact - QA Results Attribute83
Standard Attribute for user defined collection
element
Fact - QA Results Attribute84
Standard Attribute for user defined collection
element
Fact - QA Results Attribute85
Standard Attribute for user defined collection
element
Fact - QA Results Attribute86
Standard Attribute for user defined collection
element
Fact - QA Results Attribute87
Standard Attribute for user defined collection
element
Fact - QA Results Attribute88
Standard Attribute for user defined collection
element
Fact - QA Results Attribute89
Standard Attribute for user defined collection
element
Fact - QA Results Attribute90
Standard Attribute for user defined collection
element
Fact - QA Results Attribute91
Standard Attribute for user defined collection
element
Fact - QA Results Attribute92
Standard Attribute for user defined collection
element
Fact - QA Results Attribute93
Standard Attribute for user defined collection
element
Fact - QA Results Attribute94
Standard Attribute for user defined collection
element
Fact - QA Results Attribute95
Standard Attribute for user defined collection
element
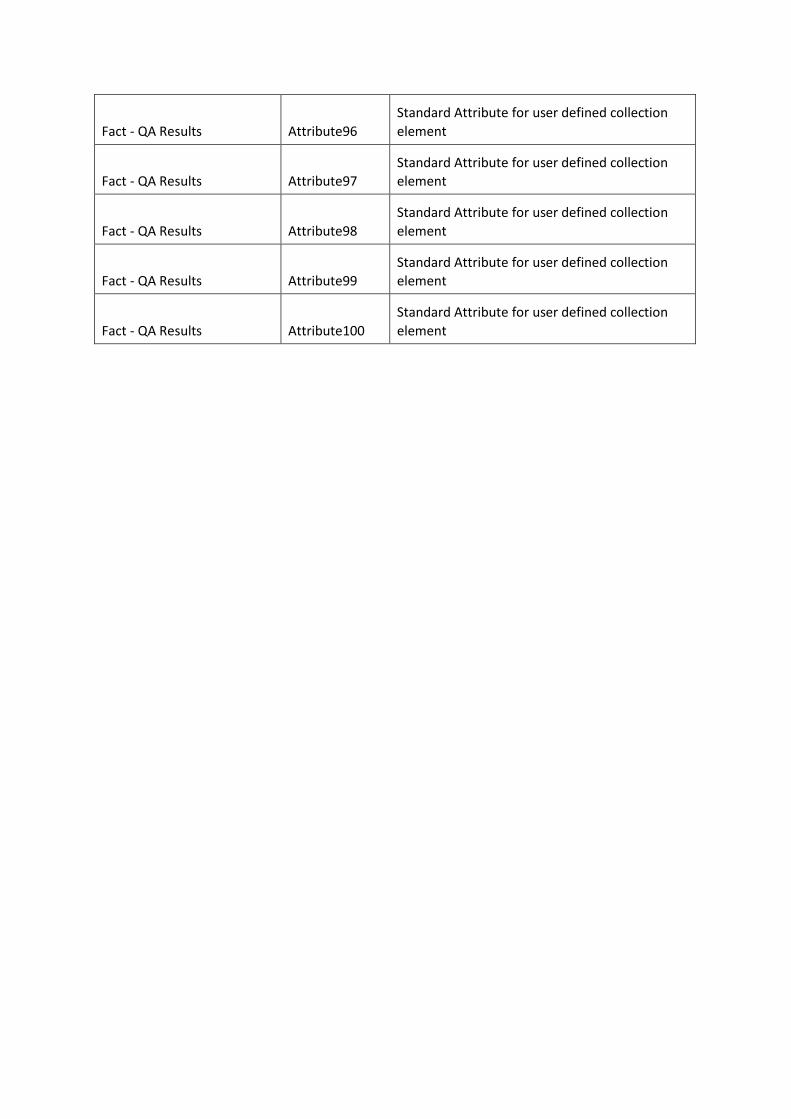
Fact - QA Results Attribute96
Standard Attribute for user defined collection
element
Fact - QA Results Attribute97
Standard Attribute for user defined collection
element
Fact - QA Results Attribute98
Standard Attribute for user defined collection
element
Fact - QA Results Attribute99
Standard Attribute for user defined collection
element
Fact - QA Results Attribute100
Standard Attribute for user defined collection
element
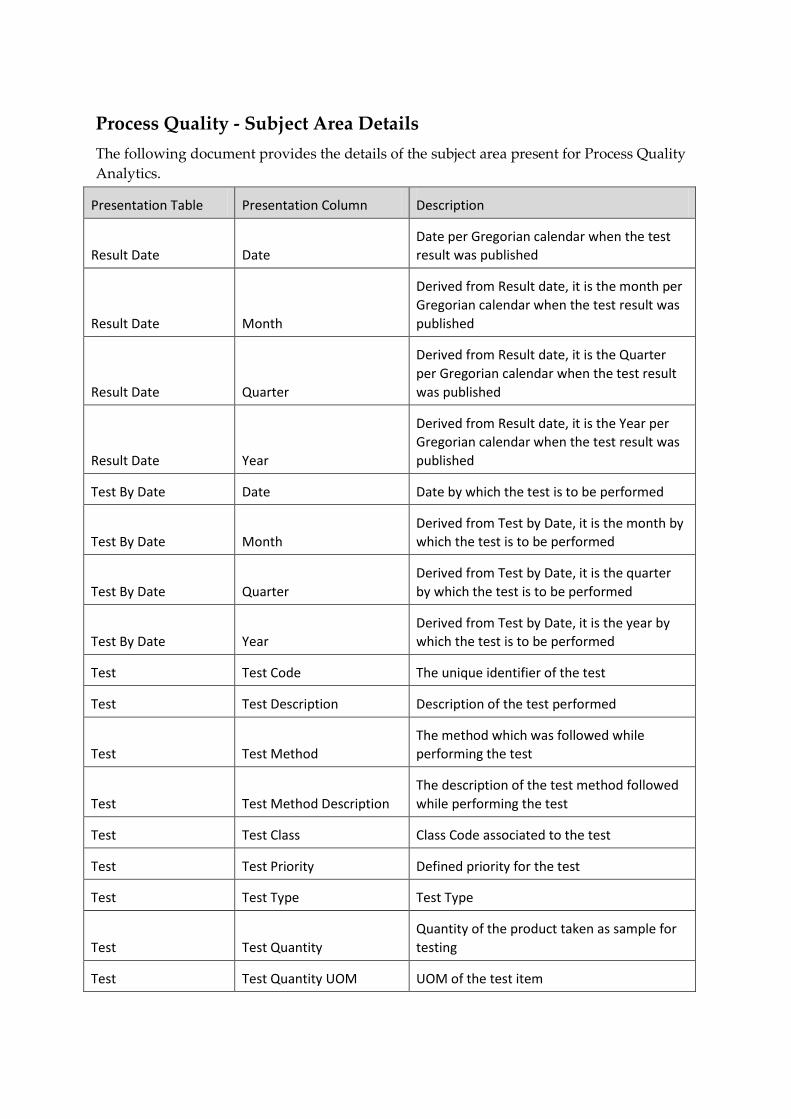
Process Quality - Subject Area Details
The following document provides the details of the subject area present for Process Quality
Analytics.
Presentation Table Presentation Column Description
Result Date Date
Date per Gregorian calendar when the test
result was published
Result Date Month
Derived from Result date, it is the month per
Gregorian calendar when the test result was
published
Result Date Quarter
Derived from Result date, it is the Quarter
per Gregorian calendar when the test result
was published
Result Date Year
Derived from Result date, it is the Year per
Gregorian calendar when the test result was
published
Test By Date Date Date by which the test is to be performed
Test By Date Month
Derived from Test by Date, it is the month by
which the test is to be performed
Test By Date Quarter
Derived from Test by Date, it is the quarter
by which the test is to be performed
Test By Date Year
Derived from Test by Date, it is the year by
which the test is to be performed
Test Test Code The unique identifier of the test
Test Test Description Description of the test performed
Test Test Method
The method which was followed while
performing the test
Test Test Method Description
The description of the test method followed
while performing the test
Test Test Class Class Code associated to the test
Test Test Priority Defined priority for the test
Test Test Type Test Type
Test Test Quantity
Quantity of the product taken as sample for
testing
Test Test Quantity UOM UOM of the test item

Presentation Table Presentation Column Description
Test Test Duration(Seconds) Duration of the test
Test Test Replicate
Number of times test performed on same
sample
Test Test Unit Test Unit
Test
Minimum Value Below
Action Minimum Value Below Action
Test
Maximum Value Below
Action Maximum Value Below Action
Test
Minimum Value Above
Action Minimum Value Above Action
Test
Maximum Value Above
Action Maximum Value Above Action
Test Result Test Sequence
The Sequence number assigned to the test
while defining the test specification.
Test Result Experimental Error Type
The error type associated when experimental
error took place while performing the test
Test Result Test Evaluation Test Disposition
Test Result Test Passed Indicator
The identifier which defines whether the test
was pass or fail
Test Result Additional Test Flag
The identifier which defines whether
additional test needs to be performed or not
Test Result Viability Duration
The duration for which the test result will be
viable. Beyond this time limit same and/or
different test might be necessitated.
Sample Organization Organization Number
Unique identifier of the Inventory
Organization from which the sample is
obtained
Sample Organization Organization Name
Name of the Inventory Organization from
which the sample is obtained
Sample Organization Org Hierarchy 1 Number
This column is provided by Oracle BI
Applications for storing a hierarchy code

Presentation Table Presentation Column Description
Sample Organization Org Hierarchy 1 Name
This column is provided by Oracle BI
Applications for storing the description that
corresponds to the hierarchy code
Sample Organization Org Hierarchy 2 Number
This column is provided by Oracle BI
Applications for storing a hierarchy code
Sample Organization Org Hierarchy 2 Name
This column is provided by Oracle BI
Applications for storing the description that
corresponds to the hierarchy code
Sample Organization Org Hierarchy 3 Number
This column is provided by Oracle BI
Applications for storing a hierarchy code
Sample Organization Org Hierarchy 3 Name
This column is provided by Oracle BI
Applications for storing the description that
corresponds to the hierarchy code
Sample Organization Org Hierarchy 4 Number
This column is provided by Oracle BI
Applications for storing a hierarchy code
Sample Organization Org Hierarchy 4 Name
This column is provided by Oracle BI
Applications for storing the description that
corresponds to the hierarchy code
Sample Organization Org Hierarchy 5 Number
This column is provided by Oracle BI
Applications for storing a hierarchy code
Sample Organization Org Hierarchy 5 Name
This column is provided by Oracle BI
Applications for storing the description that
corresponds to the hierarchy code
Sample Organization Org Hierarchy 6 Number
This column is provided by Oracle BI
Applications for storing a hierarchy code
Sample Organization Org Hierarchy 6 Name
This column is provided by Oracle BI
Applications for storing the description that
corresponds to the hierarchy code
Sample Organization Org Hierarchy 7 Number
This column is provided by Oracle BI
Applications for storing a hierarchy code
Sample Organization Org Hierarchy 7 Name
This column is provided by Oracle BI
Applications for storing the description that
corresponds to the hierarchy code
Sample Organization Org Hierarchy 8 Number
This column is provided by Oracle BI
Applications for storing a hierarchy code
Sample Organization Org Hierarchy 8 Name This column is provided by Oracle BI
Applications for storing the description that

Presentation Table Presentation Column Description
corresponds to the hierarchy code
Sample Organization Org Hierarchy 9 Number
This column is provided by Oracle BI
Applications for storing a hierarchy code
Sample Organization Org Hierarchy 9 Name
This column is provided by Oracle BI
Applications for storing the description that
corresponds to the hierarchy code
Sample Organization Org Hierarchy 10 Number
This column is provided by Oracle BI
Applications for storing a hierarchy code
Sample Organization Org Hierarchy 10 Name
This column is provided by Oracle BI
Applications for storing the description that
corresponds to the hierarchy code
Sample Organization Org Hierarchy 11 Number
This column is provided by Oracle BI
Applications for storing a hierarchy code
Sample Organization Org Hierarchy 11 Name
This column is provided by Oracle BI
Applications for storing the description that
corresponds to the hierarchy code
Sample Organization Org Hierarchy 12 Number
This column is provided by Oracle BI
Applications for storing a hierarchy code
Sample Organization Org Hierarchy 12 Name
This column is provided by Oracle BI
Applications for storing the description that
corresponds to the hierarchy code
Sample Organization Org Hierarchy 13 Number
This column is provided by Oracle BI
Applications for storing a hierarchy code
Sample Organization Org Hierarchy 13 Name
This column is provided by Oracle BI
Applications for storing the description that
corresponds to the hierarchy code
Sample Organization
Org Top Hierarchy
Number
This column is provided by Oracle BI
Applications for storing a hierarchy code
Sample Organization Org Top Hierarchy Name
This column is provided by Oracle BI
Applications for storing the description that
corresponds to the hierarchy code
Lab Organization Organization Number
Unique identifier of the Inventory
Organization in which the Quality plan is
executed

Presentation Table Presentation Column Description
Lab Organization Organization Name
Name of the Inventory Organization in which
the Quality plan is executed
Lab Organization Org Hierarchy 1 Number
This column is provided by Oracle BI
Applications for storing a hierarchy code
Lab Organization Org Hierarchy 1 Name
This column is provided by Oracle BI
Applications for storing the description that
corresponds to the hierarchy code
Lab Organization Org Hierarchy 2 Number
This column is provided by Oracle BI
Applications for storing a hierarchy code
Lab Organization Org Hierarchy 2 Name
This column is provided by Oracle BI
Applications for storing the description that
corresponds to the hierarchy code
Lab Organization Org Hierarchy 3 Number
This column is provided by Oracle BI
Applications for storing a hierarchy code
Lab Organization Org Hierarchy 3 Name
This column is provided by Oracle BI
Applications for storing the description that
corresponds to the hierarchy code
Lab Organization Org Hierarchy 4 Number
This column is provided by Oracle BI
Applications for storing a hierarchy code
Lab Organization Org Hierarchy 4 Name
This column is provided by Oracle BI
Applications for storing the description that
corresponds to the hierarchy code
Lab Organization Org Hierarchy 5 Number
This column is provided by Oracle BI
Applications for storing a hierarchy code
Lab Organization Org Hierarchy 5 Name
This column is provided by Oracle BI
Applications for storing the description that
corresponds to the hierarchy code
Lab Organization Org Hierarchy 6 Number
This column is provided by Oracle BI
Applications for storing a hierarchy code
Lab Organization Org Hierarchy 6 Name
This column is provided by Oracle BI
Applications for storing the description that
corresponds to the hierarchy code
Lab Organization Org Hierarchy 7 Number
This column is provided by Oracle BI
Applications for storing a hierarchy code
Lab Organization Org Hierarchy 7 Name
This column is provided by Oracle BI
Applications for storing the description that
corresponds to the hierarchy code
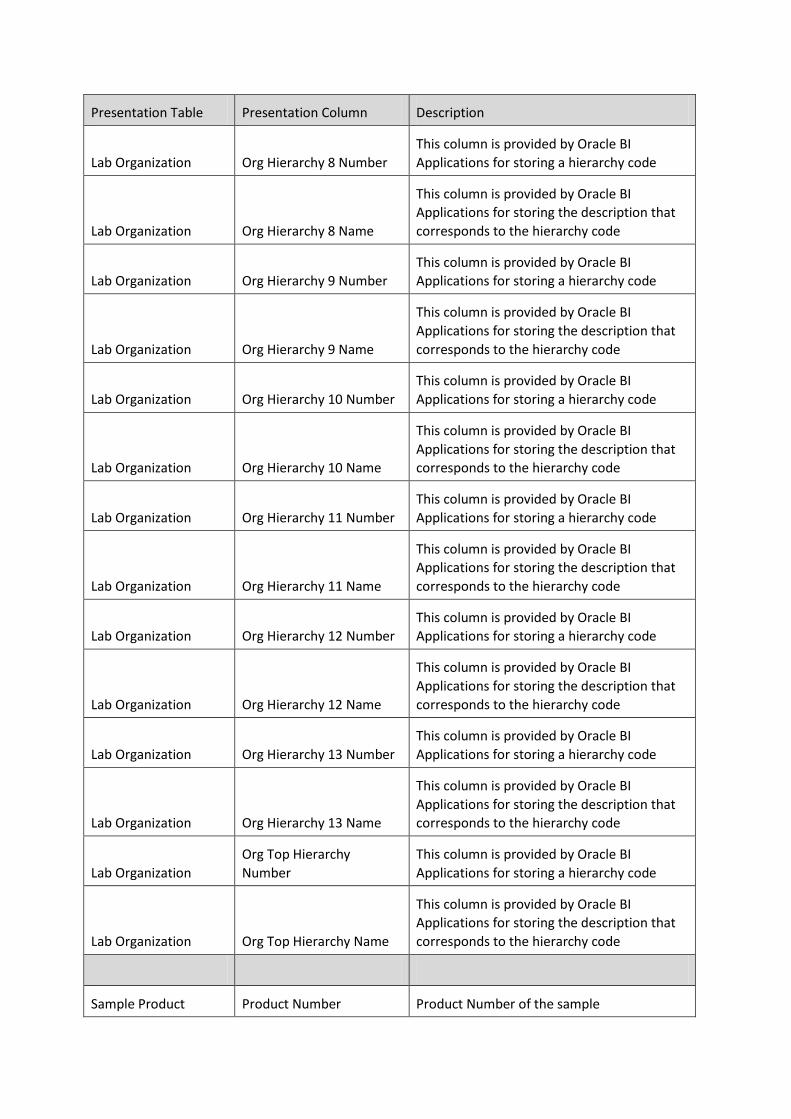
Presentation Table Presentation Column Description
Lab Organization Org Hierarchy 8 Number
This column is provided by Oracle BI
Applications for storing a hierarchy code
Lab Organization Org Hierarchy 8 Name
This column is provided by Oracle BI
Applications for storing the description that
corresponds to the hierarchy code
Lab Organization Org Hierarchy 9 Number
This column is provided by Oracle BI
Applications for storing a hierarchy code
Lab Organization Org Hierarchy 9 Name
This column is provided by Oracle BI
Applications for storing the description that
corresponds to the hierarchy code
Lab Organization Org Hierarchy 10 Number
This column is provided by Oracle BI
Applications for storing a hierarchy code
Lab Organization Org Hierarchy 10 Name
This column is provided by Oracle BI
Applications for storing the description that
corresponds to the hierarchy code
Lab Organization Org Hierarchy 11 Number
This column is provided by Oracle BI
Applications for storing a hierarchy code
Lab Organization Org Hierarchy 11 Name
This column is provided by Oracle BI
Applications for storing the description that
corresponds to the hierarchy code
Lab Organization Org Hierarchy 12 Number
This column is provided by Oracle BI
Applications for storing a hierarchy code
Lab Organization Org Hierarchy 12 Name
This column is provided by Oracle BI
Applications for storing the description that
corresponds to the hierarchy code
Lab Organization Org Hierarchy 13 Number
This column is provided by Oracle BI
Applications for storing a hierarchy code
Lab Organization Org Hierarchy 13 Name
This column is provided by Oracle BI
Applications for storing the description that
corresponds to the hierarchy code
Lab Organization
Org Top Hierarchy
Number
This column is provided by Oracle BI
Applications for storing a hierarchy code
Lab Organization Org Top Hierarchy Name
This column is provided by Oracle BI
Applications for storing the description that
corresponds to the hierarchy code
Sample Product Product Number Product Number of the sample
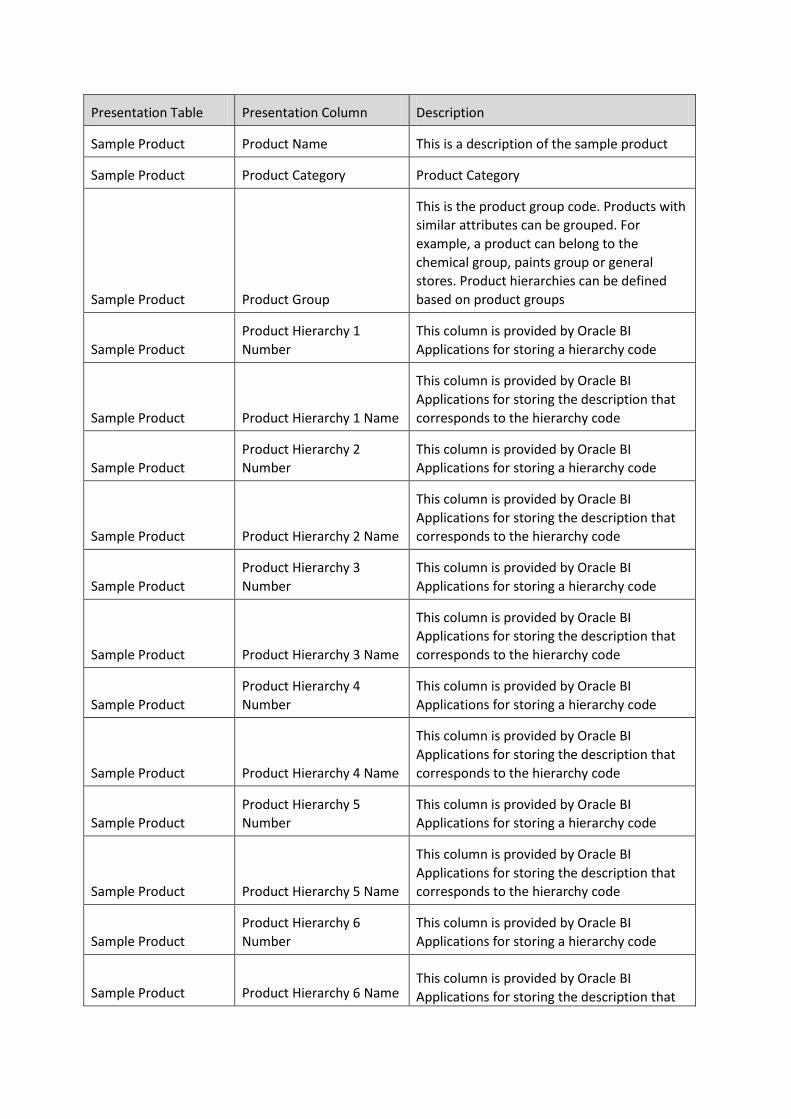
Presentation Table Presentation Column Description
Sample Product Product Name This is a description of the sample product
Sample Product Product Category Product Category
Sample Product Product Group
This is the product group code. Products with
similar attributes can be grouped. For
example, a product can belong to the
chemical group, paints group or general
stores. Product hierarchies can be defined
based on product groups
Sample Product
Product Hierarchy 1
Number
This column is provided by Oracle BI
Applications for storing a hierarchy code
Sample Product Product Hierarchy 1 Name
This column is provided by Oracle BI
Applications for storing the description that
corresponds to the hierarchy code
Sample Product
Product Hierarchy 2
Number
This column is provided by Oracle BI
Applications for storing a hierarchy code
Sample Product Product Hierarchy 2 Name
This column is provided by Oracle BI
Applications for storing the description that
corresponds to the hierarchy code
Sample Product
Product Hierarchy 3
Number
This column is provided by Oracle BI
Applications for storing a hierarchy code
Sample Product Product Hierarchy 3 Name
This column is provided by Oracle BI
Applications for storing the description that
corresponds to the hierarchy code
Sample Product
Product Hierarchy 4
Number
This column is provided by Oracle BI
Applications for storing a hierarchy code
Sample Product Product Hierarchy 4 Name
This column is provided by Oracle BI
Applications for storing the description that
corresponds to the hierarchy code
Sample Product
Product Hierarchy 5
Number
This column is provided by Oracle BI
Applications for storing a hierarchy code
Sample Product Product Hierarchy 5 Name
This column is provided by Oracle BI
Applications for storing the description that
corresponds to the hierarchy code
Sample Product
Product Hierarchy 6
Number
This column is provided by Oracle BI
Applications for storing a hierarchy code
Sample Product Product Hierarchy 6 Name This column is provided by Oracle BI
Applications for storing the description that
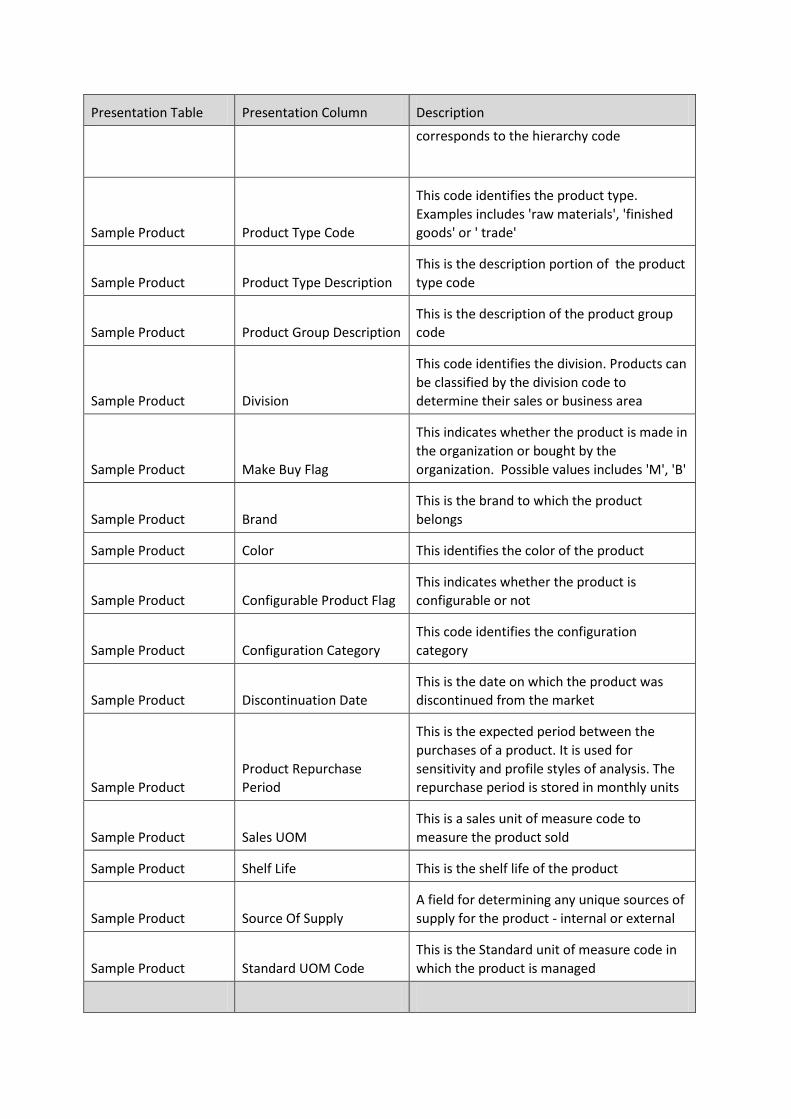
Presentation Table Presentation Column Description
corresponds to the hierarchy code
Sample Product Product Type Code
This code identifies the product type.
Examples includes 'raw materials', 'finished
goods' or ' trade'
Sample Product Product Type Description
This is the description portion of the product
type code
Sample Product Product Group Description
This is the description of the product group
code
Sample Product Division
This code identifies the division. Products can
be classified by the division code to
determine their sales or business area
Sample Product Make Buy Flag
This indicates whether the product is made in
the organization or bought by the
organization. Possible values includes 'M', 'B'
Sample Product Brand
This is the brand to which the product
belongs
Sample Product Color This identifies the color of the product
Sample Product Configurable Product Flag
This indicates whether the product is
configurable or not
Sample Product Configuration Category
This code identifies the configuration
category
Sample Product Discontinuation Date
This is the date on which the product was
discontinued from the market
Sample Product
Product Repurchase
Period
This is the expected period between the
purchases of a product. It is used for
sensitivity and profile styles of analysis. The
repurchase period is stored in monthly units
Sample Product Sales UOM
This is a sales unit of measure code to
measure the product sold
Sample Product Shelf Life This is the shelf life of the product
Sample Product Source Of Supply
A field for determining any unique sources of
supply for the product - internal or external
Sample Product Standard UOM Code
This is the Standard unit of measure code in
which the product is managed
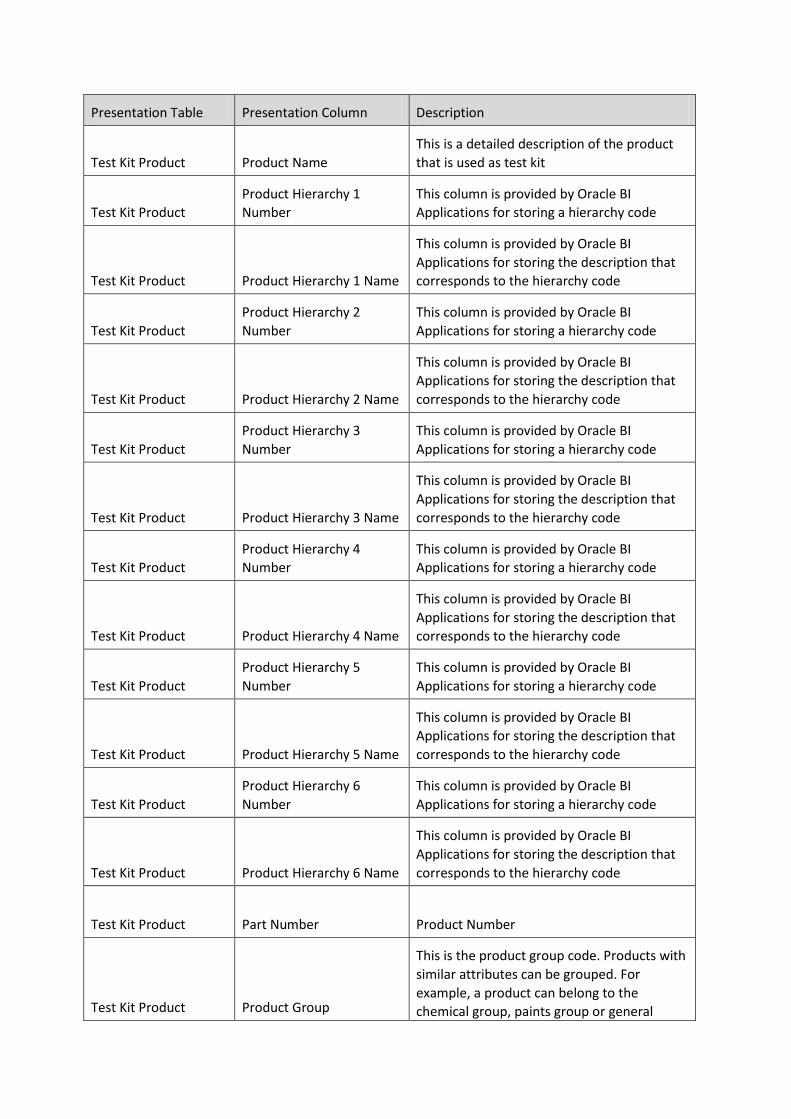
Presentation Table Presentation Column Description
Test Kit Product Product Name
This is a detailed description of the product
that is used as test kit
Test Kit Product
Product Hierarchy 1
Number
This column is provided by Oracle BI
Applications for storing a hierarchy code
Test Kit Product Product Hierarchy 1 Name
This column is provided by Oracle BI
Applications for storing the description that
corresponds to the hierarchy code
Test Kit Product
Product Hierarchy 2
Number
This column is provided by Oracle BI
Applications for storing a hierarchy code
Test Kit Product Product Hierarchy 2 Name
This column is provided by Oracle BI
Applications for storing the description that
corresponds to the hierarchy code
Test Kit Product
Product Hierarchy 3
Number
This column is provided by Oracle BI
Applications for storing a hierarchy code
Test Kit Product Product Hierarchy 3 Name
This column is provided by Oracle BI
Applications for storing the description that
corresponds to the hierarchy code
Test Kit Product
Product Hierarchy 4
Number
This column is provided by Oracle BI
Applications for storing a hierarchy code
Test Kit Product Product Hierarchy 4 Name
This column is provided by Oracle BI
Applications for storing the description that
corresponds to the hierarchy code
Test Kit Product
Product Hierarchy 5
Number
This column is provided by Oracle BI
Applications for storing a hierarchy code
Test Kit Product Product Hierarchy 5 Name
This column is provided by Oracle BI
Applications for storing the description that
corresponds to the hierarchy code
Test Kit Product
Product Hierarchy 6
Number
This column is provided by Oracle BI
Applications for storing a hierarchy code
Test Kit Product Product Hierarchy 6 Name
This column is provided by Oracle BI
Applications for storing the description that
corresponds to the hierarchy code
Test Kit Product Part Number Product Number
Test Kit Product Product Group
This is the product group code. Products with
similar attributes can be grouped. For
example, a product can belong to the
chemical group, paints group or general
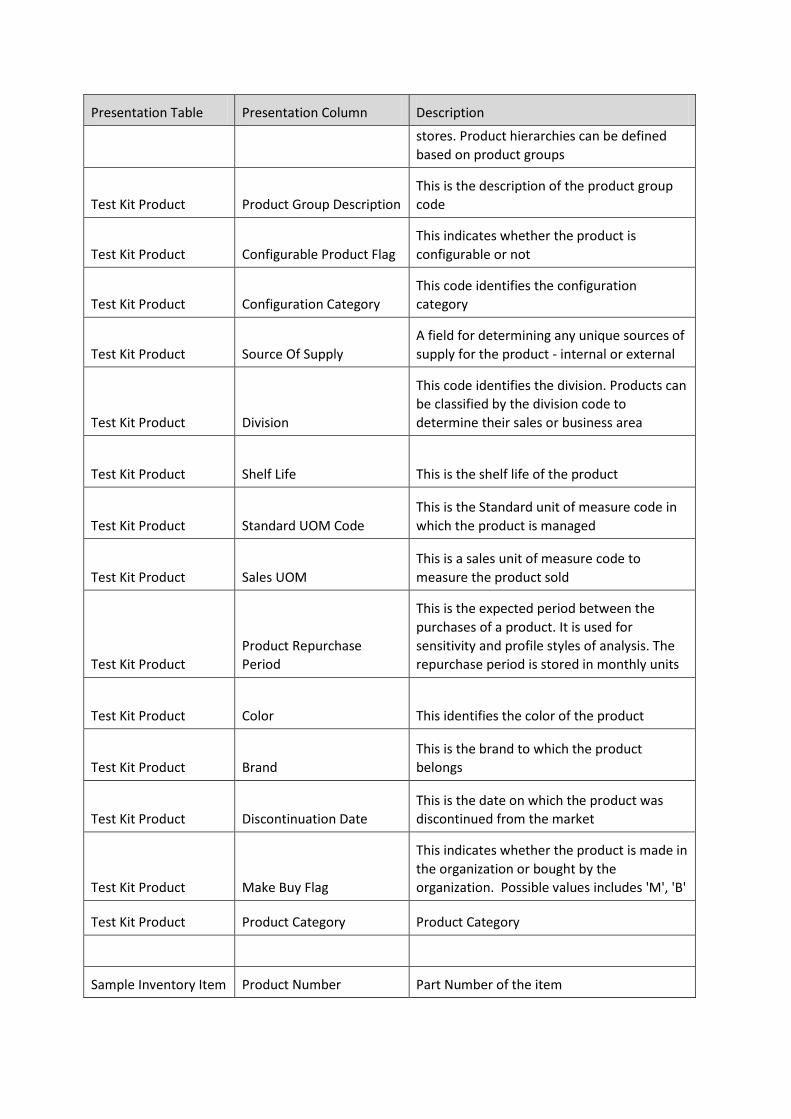
Presentation Table Presentation Column Description
stores. Product hierarchies can be defined
based on product groups
Test Kit Product Product Group Description
This is the description of the product group
code
Test Kit Product Configurable Product Flag
This indicates whether the product is
configurable or not
Test Kit Product Configuration Category
This code identifies the configuration
category
Test Kit Product Source Of Supply
A field for determining any unique sources of
supply for the product - internal or external
Test Kit Product Division
This code identifies the division. Products can
be classified by the division code to
determine their sales or business area
Test Kit Product Shelf Life This is the shelf life of the product
Test Kit Product Standard UOM Code
This is the Standard unit of measure code in
which the product is managed
Test Kit Product Sales UOM
This is a sales unit of measure code to
measure the product sold
Test Kit Product
Product Repurchase
Period
This is the expected period between the
purchases of a product. It is used for
sensitivity and profile styles of analysis. The
repurchase period is stored in monthly units
Test Kit Product Color This identifies the color of the product
Test Kit Product Brand
This is the brand to which the product
belongs
Test Kit Product Discontinuation Date
This is the date on which the product was
discontinued from the market
Test Kit Product Make Buy Flag
This indicates whether the product is made in
the organization or bought by the
organization. Possible values includes 'M', 'B'
Test Kit Product Product Category Product Category
Sample Inventory Item Product Number Part Number of the item

Presentation Table Presentation Column Description
Sample Inventory Item Product ABC Flag
ABC Indicator (Indicator that classifies a
material as an A, B, or C part according to its
consumption value )
Sample Inventory Item Inventory Category Inventory Category
Sample Inventory Item Product Back flush Flag
Back flush Indicator (Determines whether the
back flush indicator is set in the production
order)
Sample Inventory Item Product Bulk Item Flag Bulk item Indicator
Sample Inventory Item Product Buyer Buyer Code
Sample Inventory Item Product Buyer Name Buyer Name
Sample Inventory Item Product Commodity Commodity Code
Sample Inventory Item
Product Commodity
Description Commodity Name
Sample Inventory Item Product Commodity UOM Unit of measure of commodity
Sample Inventory Item
Product Commodity UOM
Name UOM Name
Sample Inventory Item
Product External
Procurement Time
Time needed to obtain the material or
service if it is procured externally
Sample Inventory Item
Product External Storage
Location External Storage Location Code
Sample Inventory Item
Product External Storage
Location Name External Storage Location Name
Sample Inventory Item Product Fixed Lot Size Fixed Lot Size
Sample Inventory Item Product Forecast Period Forecast Period (Weekly, Monthly etc…)
Sample Inventory Item
Product Internal
Manufacturing Time Internal Manufacturing Time
Sample Inventory Item
Product Internal Storage
Location Internal Storage Location Code
Sample Inventory Item
Product Internal Storage
Location Name Internal Storage Location Name
Sample Inventory Item Product Issue UOM Unit Of Measure in Issues
Sample Inventory Item
Product Issue UOM
Description Unit Of Measure Description in Issues

Presentation Table Presentation Column Description
Sample Inventory Item Product Loading Type Loading Type Code
Sample Inventory Item
Product Loading Type
Name Loading Type Name
Sample Inventory Item Product Lot Ordering Cost Cost Of ordering A Lot
Sample Inventory Item Product Lot Size Lot Size Code
Sample Inventory Item Product Lot Size Name Lot Size Name
Sample Inventory Item
Product Manufacturing
UOM Unit Of Measure In Manufacturing
Sample Inventory Item
Product Manufacturing
UOM Description
Unit Of Measure Description In
Manufacturing
Sample Inventory Item Product Max Lot Size Maximum Lot Size
Sample Inventory Item Product Max Stock Level Maximum Stock Level
Sample Inventory Item Product Max Storage Days Maximum Storage Period in Days
Sample Inventory Item Product Min Lot Size Minimum Lot Size
Sample Inventory Item Product MRP Group Planning Group Code
Sample Inventory Item
Product MRP Group
Description Planning Group Description
Sample Inventory Item Product MRP Profile Planning Profile Code
Sample Inventory Item
Product MRP Profile
Description Planning Profile Description
Sample Inventory Item Product MRP Time Fence Planning Time Fence
Sample Inventory Item Product MRP Type Planning Type Code
Sample Inventory Item
Product MRP Type
Description Planning Type Description
Sample Inventory Item
Product Place Of
Manufacture Place Of Manufacturing
Sample Inventory Item Product Planner Planner Code
Sample Inventory Item Product Planner Name Planner Name
Sample Inventory Item
Product Procurement
Type Procurement Type Code
Sample Inventory Item
Product Procurement
Type Name Procurement Type Description

Presentation Table Presentation Column Description
Sample Inventory Item
Product Profit Center
Name Profit Center Name
Sample Inventory Item
Product Profit Center
Number Profit Center Number
Sample Inventory Item
Product QA Inspection
Flag QA Inspection Indicator
Sample Inventory Item Product Reorder Point
Reorder Point Quantity(If the stock falls
below this quantity, the system flags the
material for requirements planning)
Sample Inventory Item
Product Repetitive
Manufacturing Flag Repetitive Manufacturing Indicator
Sample Inventory Item
Product Special
Procurement Type Special Procurement Type Code
Sample Inventory Item
Product Special
Procurement Type
Description Special Procurement Type Description
Test Kit Inventory Item Product Number Product Number
Test Kit Inventory Item Product Fixed Lot Size Fixed Lot Size
Test Kit Inventory Item Product Max Stock Level Maximum Stock Level
Test Kit Inventory Item Product Lot Ordering Cost Cost Of ordering A Lot
Test Kit Inventory Item Product MRP Time Fence Planning Time Fence
Test Kit Inventory Item
Product External
Procurement Time
Time needed to obtain the material or
service if it is procured externally
Test Kit Inventory Item
Product Internal
Manufacturing Time Internal Manufacturing Time
Test Kit Inventory Item Product Max Storage Days Maximum Storage Period in Days
Test Kit Inventory Item Product MRP Profile Planning Profile Code
Test Kit Inventory Item Product MRP Type Planning Type Code
Test Kit Inventory Item Product MRP Group Planning Group Code
Test Kit Inventory Item Product Lot Size Lot Size Code
Test Kit Inventory Item Product Lot Size Name Lot Size Description
Test Kit Inventory Item Product Forecast Period Forecast Period (Weekly, Monthly etc…)

Presentation Table Presentation Column Description
Test Kit Inventory Item
Product Manufacturing
UOM Unit Of Measure In Manufacturing
Test Kit Inventory Item Product Issue UOM Unit Of Measure in Issues
Test Kit Inventory Item
Product Place Of
Manufacture Place Of Manufacturing
Test Kit Inventory Item
Product Internal Storage
Location Internal Storage Location Code
Test Kit Inventory Item
Product Internal Storage
Location Name Internal Storage Location Description
Test Kit Inventory Item
Product External Storage
Location External Storage Location Code
Test Kit Inventory Item
Product External Storage
Location Name External Storage Location Description
Test Kit Inventory Item Product Description Description of the Item
Test Kit Inventory Item Product Planner Planner Code
Test Kit Inventory Item Product Planner Name Planner Name
Test Kit Inventory Item
Product Procurement
Type Procurement Type Code
Test Kit Inventory Item Procurement Type Name Procurement Type Description
Test Kit Inventory Item
Product Special
Procurement Type Special Procurement Type Code
Test Kit Inventory Item
Product Special
Procurement Type
Description Special Procurement Type Description
Test Kit Inventory Item Product Buyer Buyer Code
Test Kit Inventory Item Product Buyer Name Buyer Name
Test Kit Inventory Item Product Commodity Commodity Code
Test Kit Inventory Item Product Commodity UOM Unit of measure of commodity
Test Kit Inventory Item
Product Profit Center
Number Profit Center Number
Test Kit Inventory Item
Product Profit Center
Name Profit Center Name
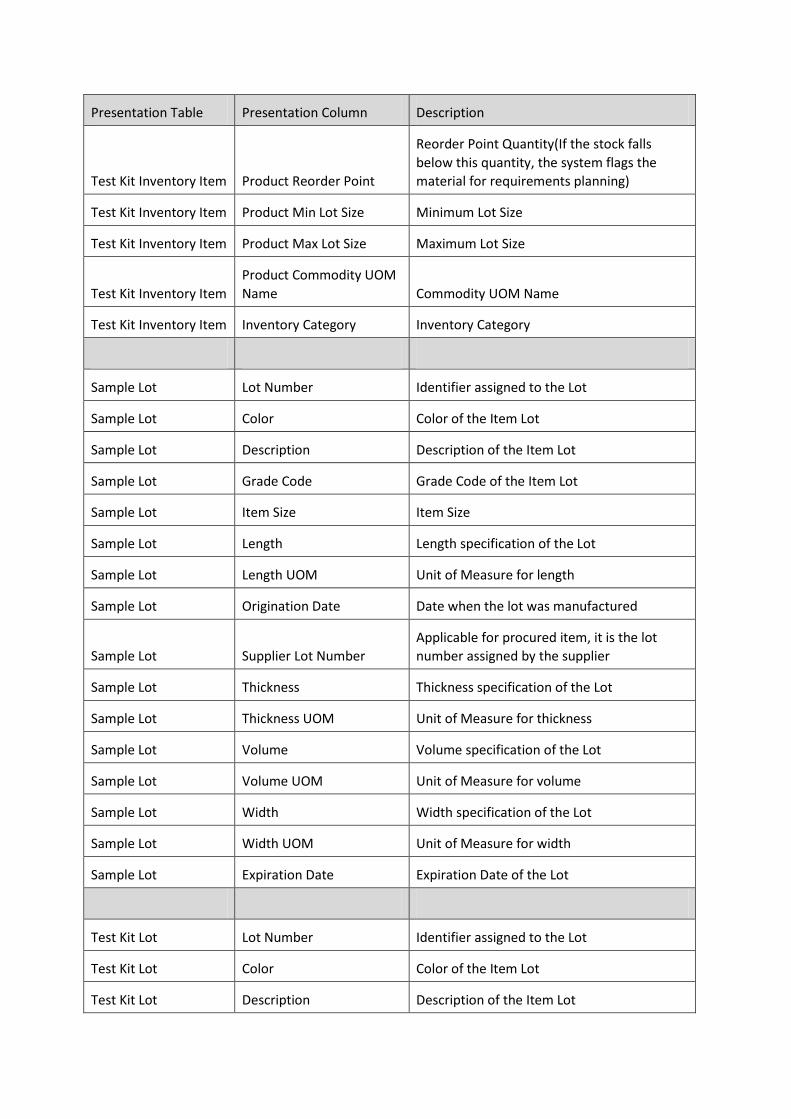
Presentation Table Presentation Column Description
Test Kit Inventory Item Product Reorder Point
Reorder Point Quantity(If the stock falls
below this quantity, the system flags the
material for requirements planning)
Test Kit Inventory Item Product Min Lot Size Minimum Lot Size
Test Kit Inventory Item Product Max Lot Size Maximum Lot Size
Test Kit Inventory Item
Product Commodity UOM
Name Commodity UOM Name
Test Kit Inventory Item Inventory Category Inventory Category
Sample Lot Lot Number Identifier assigned to the Lot
Sample Lot Color Color of the Item Lot
Sample Lot Description Description of the Item Lot
Sample Lot Grade Code Grade Code of the Item Lot
Sample Lot Item Size Item Size
Sample Lot Length Length specification of the Lot
Sample Lot Length UOM Unit of Measure for length
Sample Lot Origination Date Date when the lot was manufactured
Sample Lot Supplier Lot Number
Applicable for procured item, it is the lot
number assigned by the supplier
Sample Lot Thickness Thickness specification of the Lot
Sample Lot Thickness UOM Unit of Measure for thickness
Sample Lot Volume Volume specification of the Lot
Sample Lot Volume UOM Unit of Measure for volume
Sample Lot Width Width specification of the Lot
Sample Lot Width UOM Unit of Measure for width
Sample Lot Expiration Date Expiration Date of the Lot
Test Kit Lot Lot Number Identifier assigned to the Lot
Test Kit Lot Color Color of the Item Lot
Test Kit Lot Description Description of the Item Lot
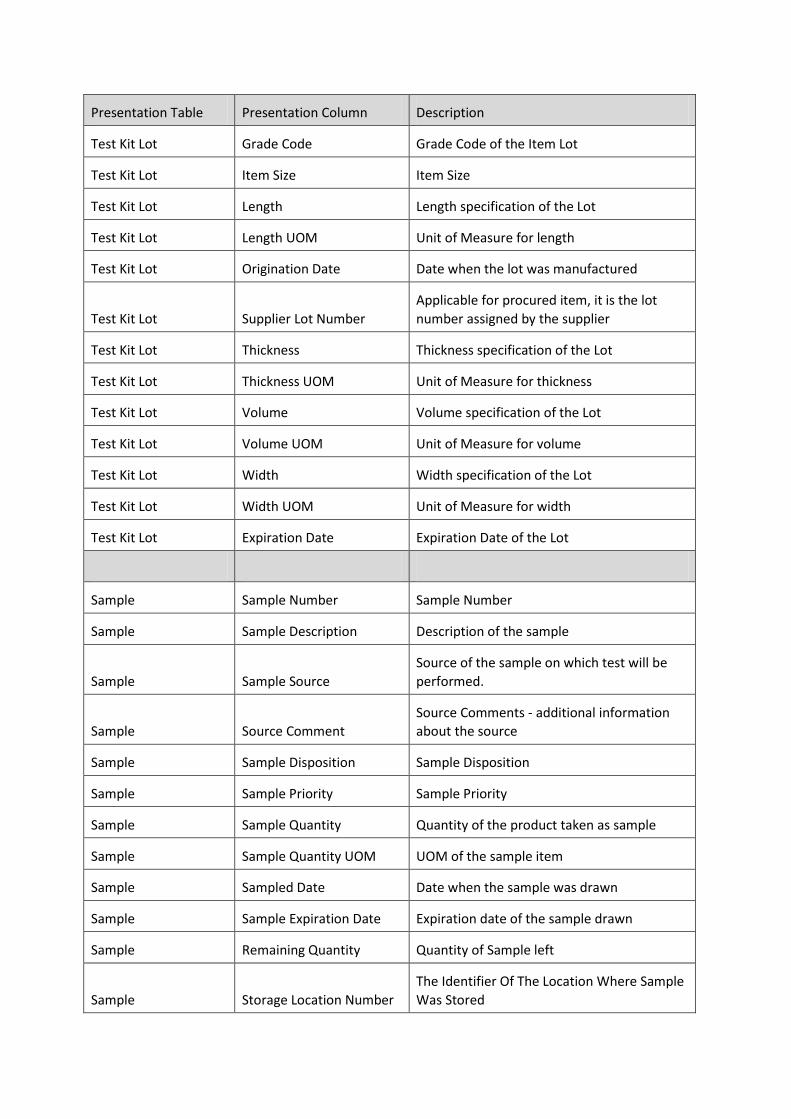
Presentation Table Presentation Column Description
Test Kit Lot Grade Code Grade Code of the Item Lot
Test Kit Lot Item Size Item Size
Test Kit Lot Length Length specification of the Lot
Test Kit Lot Length UOM Unit of Measure for length
Test Kit Lot Origination Date Date when the lot was manufactured
Test Kit Lot Supplier Lot Number
Applicable for procured item, it is the lot
number assigned by the supplier
Test Kit Lot Thickness Thickness specification of the Lot
Test Kit Lot Thickness UOM Unit of Measure for thickness
Test Kit Lot Volume Volume specification of the Lot
Test Kit Lot Volume UOM Unit of Measure for volume
Test Kit Lot Width Width specification of the Lot
Test Kit Lot Width UOM Unit of Measure for width
Test Kit Lot Expiration Date Expiration Date of the Lot
Sample Sample Number Sample Number
Sample Sample Description Description of the sample
Sample Sample Source
Source of the sample on which test will be
performed.
Sample Source Comment
Source Comments - additional information
about the source
Sample Sample Disposition Sample Disposition
Sample Sample Priority Sample Priority
Sample Sample Quantity Quantity of the product taken as sample
Sample Sample Quantity UOM UOM of the sample item
Sample Sampled Date Date when the sample was drawn
Sample Sample Expiration Date Expiration date of the sample drawn
Sample Remaining Quantity Quantity of Sample left
Sample Storage Location Number
The Identifier Of The Location Where Sample
Was Stored
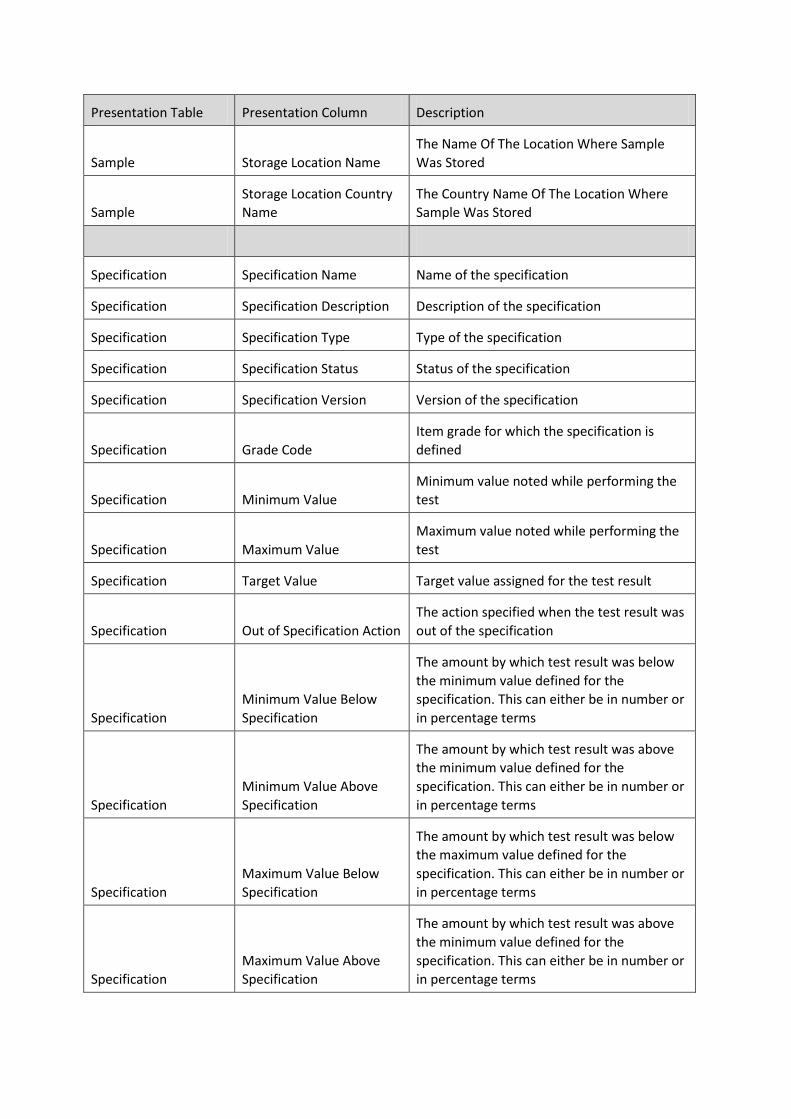
Presentation Table Presentation Column Description
Sample Storage Location Name
The Name Of The Location Where Sample
Was Stored
Sample
Storage Location Country
Name
The Country Name Of The Location Where
Sample Was Stored
Specification Specification Name Name of the specification
Specification Specification Description Description of the specification
Specification Specification Type Type of the specification
Specification Specification Status Status of the specification
Specification Specification Version Version of the specification
Specification Grade Code
Item grade for which the specification is
defined
Specification Minimum Value
Minimum value noted while performing the
test
Specification Maximum Value
Maximum value noted while performing the
test
Specification Target Value Target value assigned for the test result
Specification Out of Specification Action
The action specified when the test result was
out of the specification
Specification
Minimum Value Below
Specification
The amount by which test result was below
the minimum value defined for the
specification. This can either be in number or
in percentage terms
Specification
Minimum Value Above
Specification
The amount by which test result was above
the minimum value defined for the
specification. This can either be in number or
in percentage terms
Specification
Maximum Value Below
Specification
The amount by which test result was below
the maximum value defined for the
specification. This can either be in number or
in percentage terms
Specification
Maximum Value Above
Specification
The amount by which test result was above
the minimum value defined for the
specification. This can either be in number or
in percentage terms
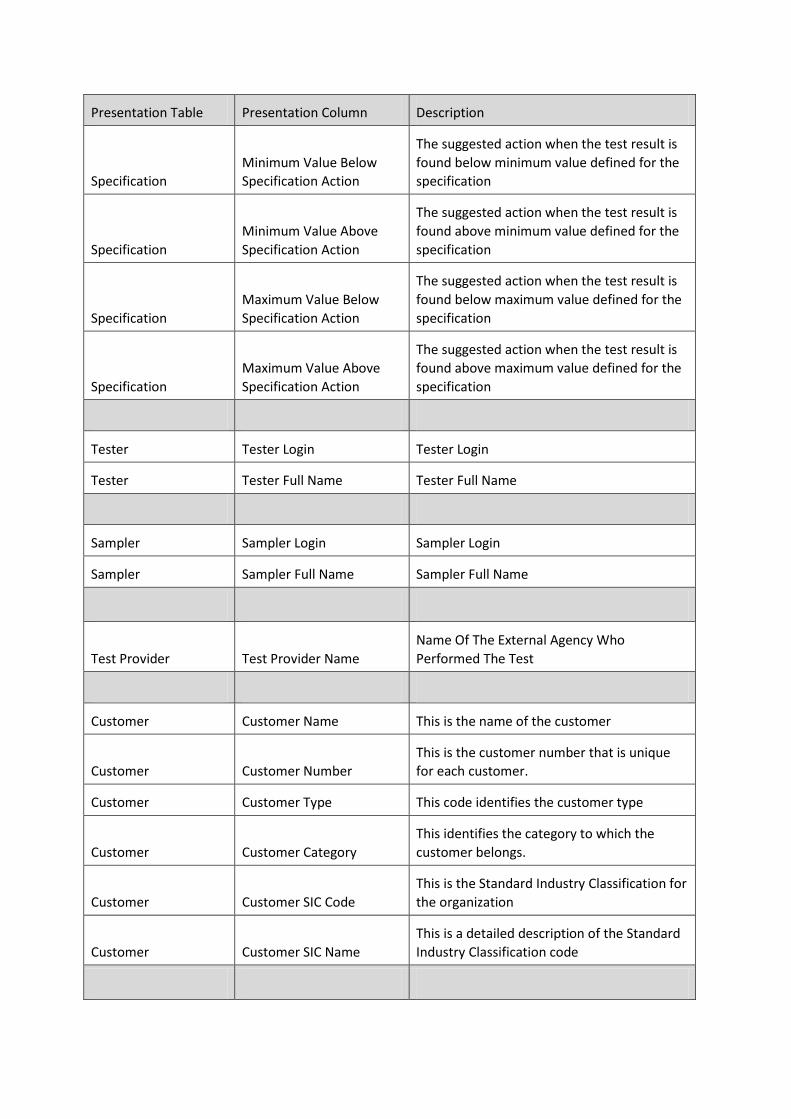
Presentation Table Presentation Column Description
Specification
Minimum Value Below
Specification Action
The suggested action when the test result is
found below minimum value defined for the
specification
Specification
Minimum Value Above
Specification Action
The suggested action when the test result is
found above minimum value defined for the
specification
Specification
Maximum Value Below
Specification Action
The suggested action when the test result is
found below maximum value defined for the
specification
Specification
Maximum Value Above
Specification Action
The suggested action when the test result is
found above maximum value defined for the
specification
Tester Tester Login Tester Login
Tester Tester Full Name Tester Full Name
Sampler Sampler Login Sampler Login
Sampler Sampler Full Name Sampler Full Name
Test Provider Test Provider Name
Name Of The External Agency Who
Performed The Test
Customer Customer Name This is the name of the customer
Customer Customer Number
This is the customer number that is unique
for each customer.
Customer Customer Type This code identifies the customer type
Customer Customer Category
This identifies the category to which the
customer belongs.
Customer Customer SIC Code
This is the Standard Industry Classification for
the organization
Customer Customer SIC Name
This is a detailed description of the Standard
Industry Classification code

Presentation Table Presentation Column Description
Ship To Location Ship To Location City
This Code Identifies The City Of The Customer
Location
Ship To Location Ship To Location State
This Code Identifies The Customer Location
Examples include AZ,CA,OH etc…
Ship To Location Ship To Location Country
This Code Identifies The Country Code Of The
Customer Location for Example, USA stands
for United States Of America, UK Stands for
United Kingdom etc..
Ship To Location
Ship To Location Postal
Code
This is the Postal Code Of The Customer
Location
Ship To Location
Ship To Location Contact
Name
This is the primary contact name of this
customer location
Ship To Location
Ship To Location Phone
Number
This is the phone number of the customer
location
Supplier Supplier Number
This is a unique number assigned to a
supplier within a business organization.
These numbers could be used in reports for
reporting on individual suppliers, their
outstanding supplies, their percentage of the
ORGANIZATIONS spend budget etc. Many
organizations evolve a detailed coded system
to identify their suppliers. These could be a
series of numeric digits with some inbuilt
string position logic within them that could
help in deciphering their attributes. Example:
100316 GE MEDICAL SYSTEMS, 100354 CISCO
SYSTEMS, 100234 INTEGRATED STEEL,
SOLECTRON etc.
Supplier Supplier Name
This is the detailed description of a specific
supplier as stored in the source system. All
important reports around suppliers are
expected to feature this column. Example :
GE MEDICAL SYSTEMS, CISCO SYSTEMS,
INTEGRATED STEEL, SOLECTRON etc.
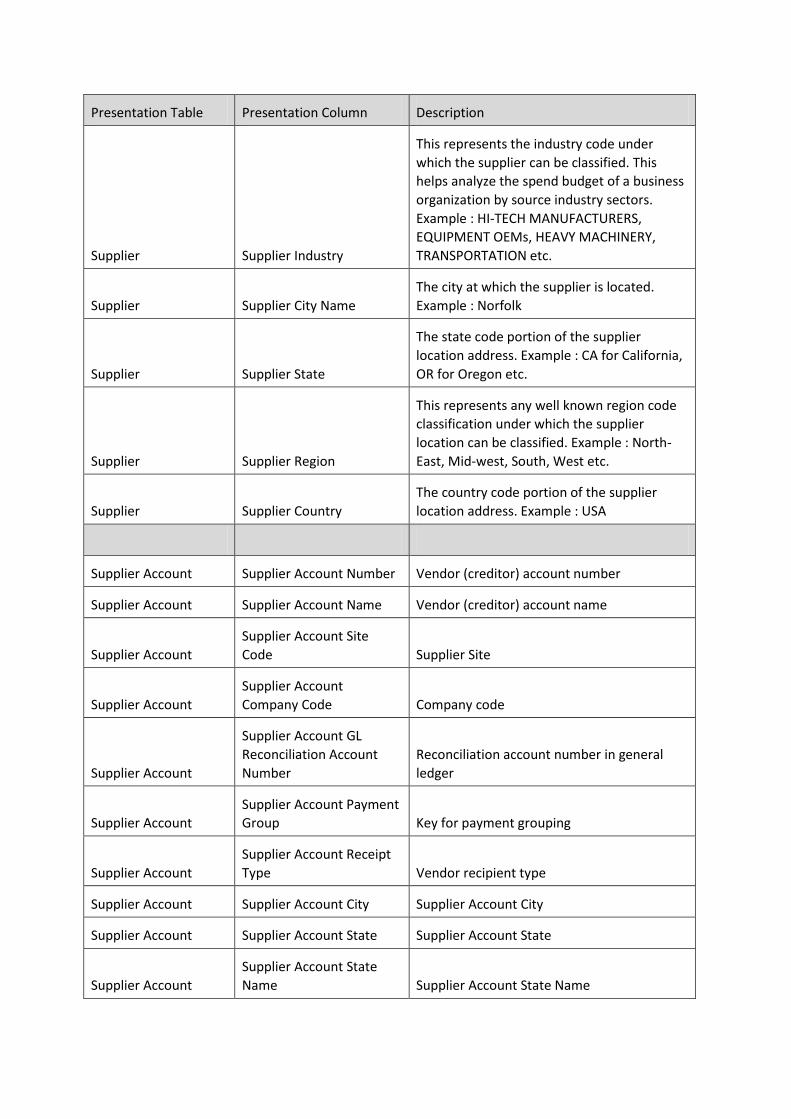
Presentation Table Presentation Column Description
Supplier Supplier Industry
This represents the industry code under
which the supplier can be classified. This
helps analyze the spend budget of a business
organization by source industry sectors.
Example : HI-TECH MANUFACTURERS,
EQUIPMENT OEMs, HEAVY MACHINERY,
TRANSPORTATION etc.
Supplier Supplier City Name
The city at which the supplier is located.
Example : Norfolk
Supplier Supplier State
The state code portion of the supplier
location address. Example : CA for California,
OR for Oregon etc.
Supplier Supplier Region
This represents any well known region code
classification under which the supplier
location can be classified. Example : North-
East, Mid-west, South, West etc.
Supplier Supplier Country
The country code portion of the supplier
location address. Example : USA
Supplier Account Supplier Account Number Vendor (creditor) account number
Supplier Account Supplier Account Name Vendor (creditor) account name
Supplier Account
Supplier Account Site
Code Supplier Site
Supplier Account
Supplier Account
Company Code Company code
Supplier Account
Supplier Account GL
Reconciliation Account
Number
Reconciliation account number in general
ledger
Supplier Account
Supplier Account Payment
Group Key for payment grouping
Supplier Account
Supplier Account Receipt
Type Vendor recipient type
Supplier Account Supplier Account City Supplier Account City
Supplier Account Supplier Account State Supplier Account State
Supplier Account
Supplier Account State
Name Supplier Account State Name

Presentation Table Presentation Column Description
Supplier Account Supplier Account Country Supplier Account Country
Supplier Account
Supplier Account Country
Name Supplier Account Country Name
Supplier Account
Supplier Account
Customer Number Supplier Account Customer Number
Work Order Work Order Number Work Order Number
Work Order Work Order Type Work Order Type
Work Order Work Order Class Work Order Class
Work Order Work Order Status Status Of the Work Order
Work Order Planned Start Date Planned Start Date Of The Work Order
Work Order Planned Completion Date Planned Completion Date Of The Work Order
Work Order Due Date Due Date For The Work Order
Work Order Actual Start Date Actual Start Date Of The Work Order
Work Order Actual Completion Date Actual Completion Date Of The Work Order
Work Order Closed Date
Date, Per Gregorian Calendar ,when the
Work Order is actually Closed
Fact - Test Results Test Result Result of the test performed
Fact - Test Results Test Quantity The quantity on which test was performed
Fact - Test Results Sample Quantity The sample quantity taken for the test
Fact - Test Results Consumed Quantity
The quantity of item which was completely
consumed while performing the test. This
quantity can't be returned to inventory or as
sample.
Fact - Test Results Remaining Quantity
The remaining quantity of the item after test
was performed
Kanban Subject Area Details
The following document provides the details of the subject area present for Kanban
Analytics.
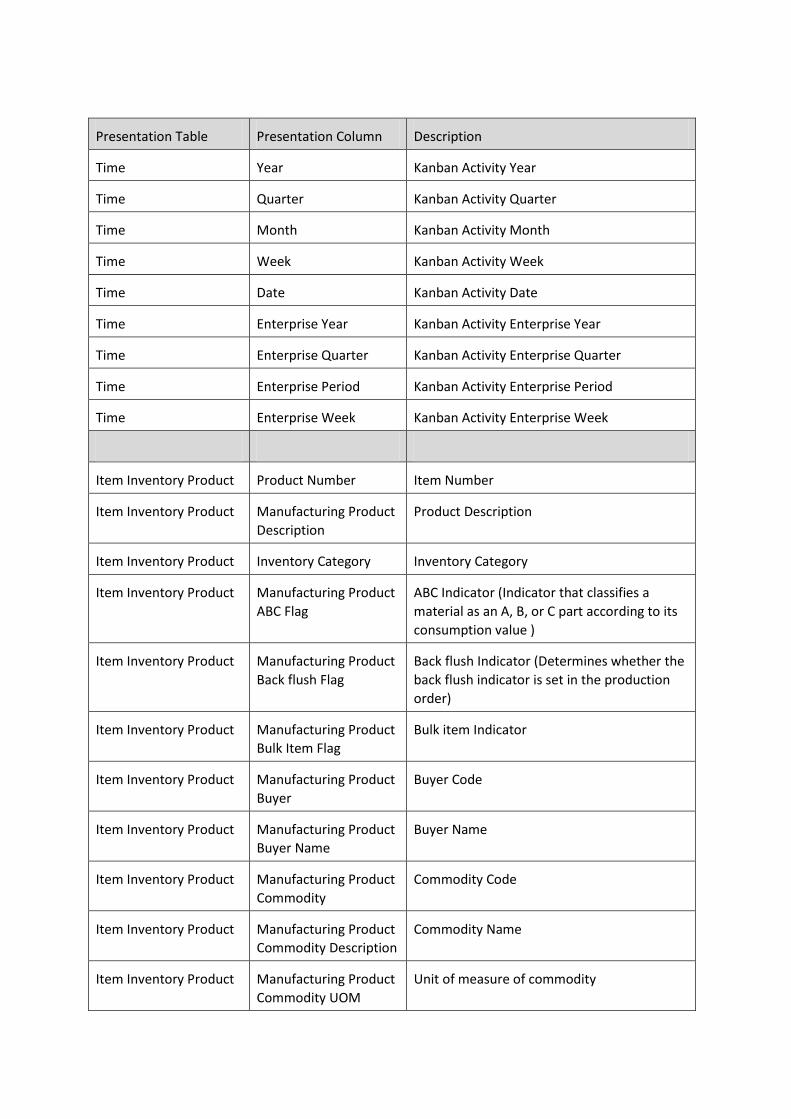
Presentation Table Presentation Column Description
Time Year Kanban Activity Year
Time Quarter Kanban Activity Quarter
Time Month Kanban Activity Month
Time Week Kanban Activity Week
Time Date Kanban Activity Date
Time Enterprise Year Kanban Activity Enterprise Year
Time Enterprise Quarter Kanban Activity Enterprise Quarter
Time Enterprise Period Kanban Activity Enterprise Period
Time Enterprise Week Kanban Activity Enterprise Week
Item Inventory Product Product Number Item Number
Item Inventory Product Manufacturing Product
Description
Product Description
Item Inventory Product Inventory Category Inventory Category
Item Inventory Product Manufacturing Product
ABC Flag
ABC Indicator (Indicator that classifies a
material as an A, B, or C part according to its
consumption value )
Item Inventory Product Manufacturing Product
Back flush Flag
Back flush Indicator (Determines whether the
back flush indicator is set in the production
order)
Item Inventory Product Manufacturing Product
Bulk Item Flag
Bulk item Indicator
Item Inventory Product Manufacturing Product
Buyer
Buyer Code
Item Inventory Product Manufacturing Product
Buyer Name
Buyer Name
Item Inventory Product Manufacturing Product
Commodity
Commodity Code
Item Inventory Product Manufacturing Product
Commodity Description
Commodity Name
Item Inventory Product Manufacturing Product
Commodity UOM
Unit of measure of commodity
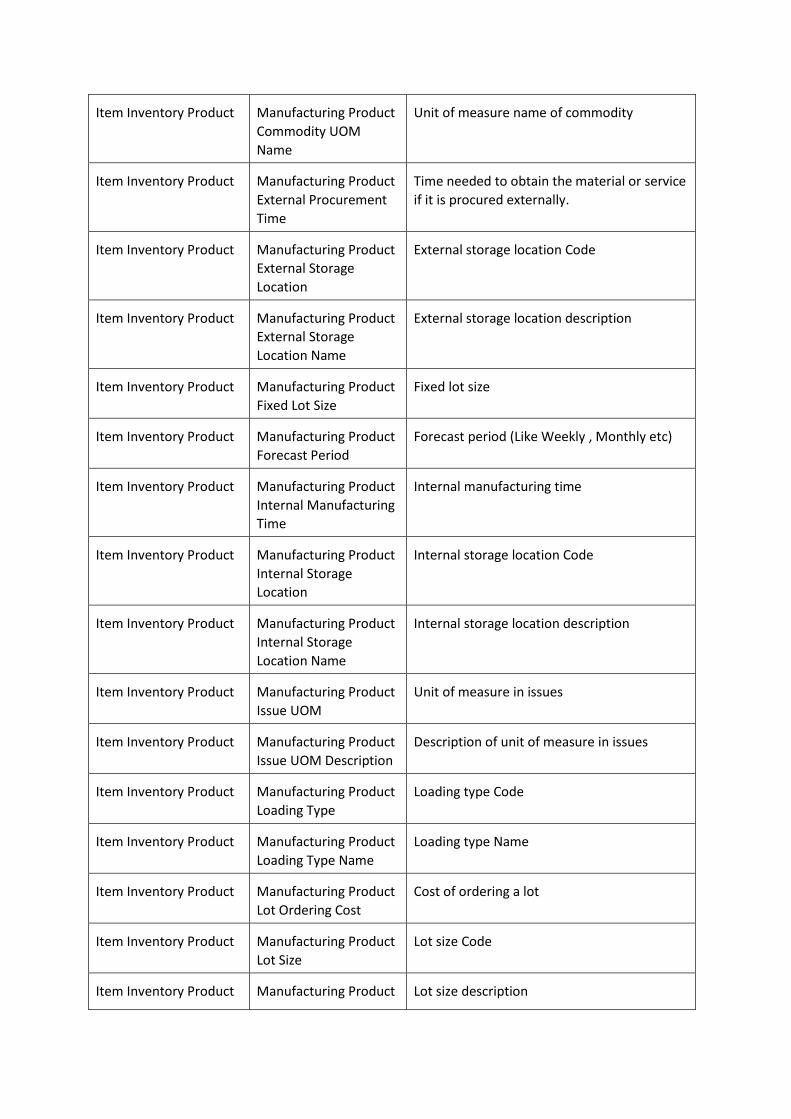
Item Inventory Product Manufacturing Product
Commodity UOM
Name
Unit of measure name of commodity
Item Inventory Product Manufacturing Product
External Procurement
Time
Time needed to obtain the material or service
if it is procured externally.
Item Inventory Product Manufacturing Product
External Storage
Location
External storage location Code
Item Inventory Product Manufacturing Product
External Storage
Location Name
External storage location description
Item Inventory Product Manufacturing Product
Fixed Lot Size
Fixed lot size
Item Inventory Product Manufacturing Product
Forecast Period
Forecast period (Like Weekly , Monthly etc)
Item Inventory Product Manufacturing Product
Internal Manufacturing
Time
Internal manufacturing time
Item Inventory Product Manufacturing Product
Internal Storage
Location
Internal storage location Code
Item Inventory Product Manufacturing Product
Internal Storage
Location Name
Internal storage location description
Item Inventory Product Manufacturing Product
Issue UOM
Unit of measure in issues
Item Inventory Product Manufacturing Product
Issue UOM Description
Description of unit of measure in issues
Item Inventory Product Manufacturing Product
Loading Type
Loading type Code
Item Inventory Product Manufacturing Product
Loading Type Name
Loading type Name
Item Inventory Product Manufacturing Product
Lot Ordering Cost
Cost of ordering a lot
Item Inventory Product Manufacturing Product
Lot Size
Lot size Code
Item Inventory Product Manufacturing Product Lot size description

Lot Size Name
Item Inventory Product Manufacturing Product
Manufacturing UOM
Unit of measure in manufacturing
Item Inventory Product Manufacturing Product
Manufacturing UOM
Description
Description of unit of measure in
manufacturing
Item Inventory Product Manufacturing Product
Max Lot Size
Maximum lot size
Item Inventory Product Manufacturing Product
Max Stock Level
Maximum stock level
Item Inventory Product Manufacturing Product
Max Storage Days
Maximum storage period in days
Item Inventory Product Manufacturing Product
Min Lot Size
Minimum lot size
Item Inventory Product Manufacturing Product
MRP Group
Planning group Code
Item Inventory Product Manufacturing Product
MRP Group Description
Planning group description
Item Inventory Product Manufacturing Product
MRP Profile
Planning profile Code
Item Inventory Product Manufacturing Product
MRP Profile Description
Planning profile description
Item Inventory Product Manufacturing Product
MRP Time Fence
Planning time fence
Item Inventory Product Manufacturing Product
MRP Type
Planning type Code
Item Inventory Product Manufacturing Product
MRP Type Description
Planning type description
Item Inventory Product Manufacturing Product
Place Of Manufacture
Place of manufacturing
Item Inventory Product Manufacturing Product
Planner
Planner Code
Item Inventory Product Manufacturing Product
Planner Name
Planner Name
Item Inventory Product Manufacturing Product
Procurement Type
Procurement Type Code
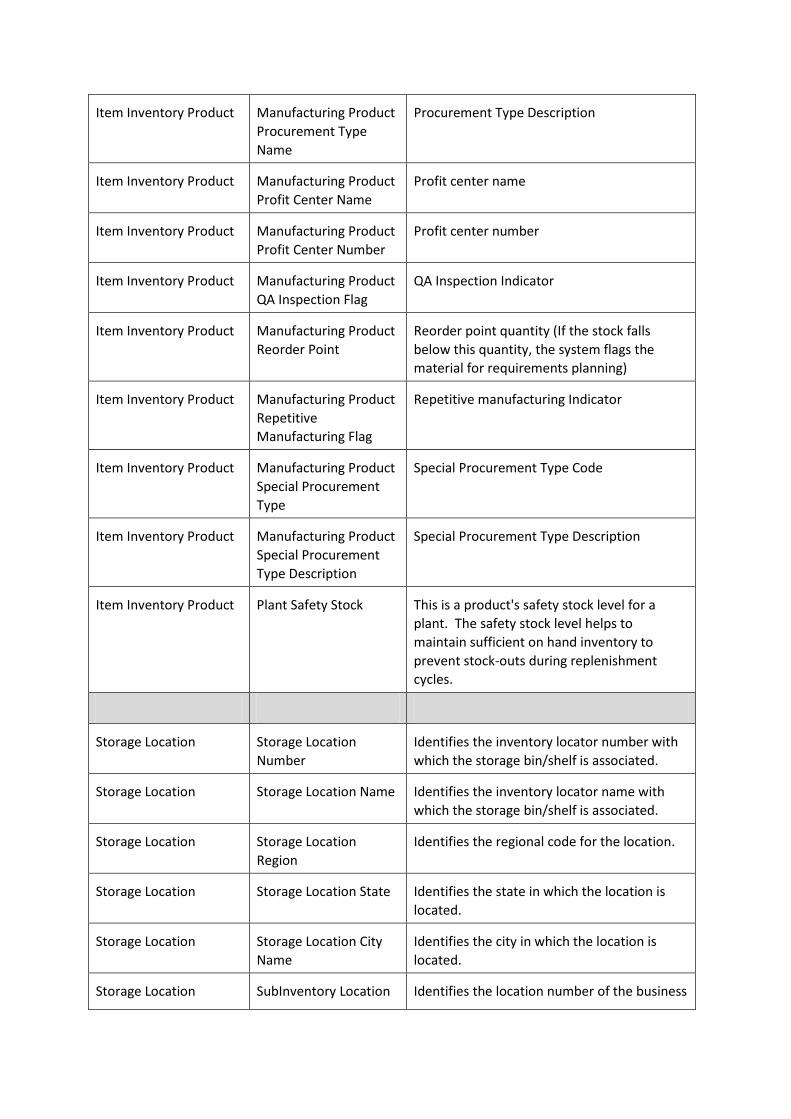
Item Inventory Product Manufacturing Product
Procurement Type
Name
Procurement Type Description
Item Inventory Product Manufacturing Product
Profit Center Name
Profit center name
Item Inventory Product Manufacturing Product
Profit Center Number
Profit center number
Item Inventory Product Manufacturing Product
QA Inspection Flag
QA Inspection Indicator
Item Inventory Product Manufacturing Product
Reorder Point
Reorder point quantity (If the stock falls
below this quantity, the system flags the
material for requirements planning)
Item Inventory Product Manufacturing Product
Repetitive
Manufacturing Flag
Repetitive manufacturing Indicator
Item Inventory Product Manufacturing Product
Special Procurement
Type
Special Procurement Type Code
Item Inventory Product Manufacturing Product
Special Procurement
Type Description
Special Procurement Type Description
Item Inventory Product Plant Safety Stock This is a product's safety stock level for a
plant. The safety stock level helps to
maintain sufficient on hand inventory to
prevent stock-outs during replenishment
cycles.
Storage Location Storage Location
Number
Identifies the inventory locator number with
which the storage bin/shelf is associated.
Storage Location Storage Location Name Identifies the inventory locator name with
which the storage bin/shelf is associated.
Storage Location Storage Location
Region
Identifies the regional code for the location.
Storage Location Storage Location State Identifies the state in which the location is
located.
Storage Location Storage Location City
Name
Identifies the city in which the location is
located.
Storage Location SubInventory Location Identifies the location number of the business

location.
Supplier Supplier Number Unique identifier of the Supplier
Supplier Supplier Name Supplier Name
Supplier Supplier Industry Identifies the industry of the supplier
Supplier Supplier City Name Identifies the city of the supplier
Supplier Supplier State Identifies the State of the supplier
Supplier Supplier Region Identifies the regional code of the supplier
Supplier Supplier Country Identifies the Country of the supplier
Work Order Work Order Number Work Order Number
Work Order Work Order Type Work Order Type
Work Order Work Order Class Work Order Class
Work Order Work Order Status Status of Work Order
Work Order Parent Work Order The Work Order which led to the creation of
the present Work Order
Work Order Due Date Due date for the Work Order
Work Order Planned Start Date Planned Start Date of the Work Order
Work Order Planned Completion
Date
Planned Completion Date of the Work Order
Work Order Actual Start Date Actual Start Date of the Work Order
Work Order Actual Completion Date Actual Completion Date of the Work Order
Work Order Date Closed Date when the Work Order is closed
Work Order Bom Revision BOM revision for the primary assembly
Work Order Bom Revision Date Date of assembly item revision used to
explode the bills of material used in the job
Work Order Alternate Bom
Designator
Alternate bill of material used in a job
Work Order Alternate Routing
Designator
Alternate routing used in a job

Purchase Order Purchase Order
Number
is the Purchase Order Number raised against
the kanban item for replenishment
Inventory Organization Inventory Org Number Unique identifier of the Inventory
Organization
Inventory Organization Inventory Org Name Name of the Inventory Organization
Inventory Organization Inventory Org
Hierarchy 4 Number
Org Hierarchy 4 Number
Inventory Organization Inventory Org
Hierarchy 4 Name
Org Hierarchy 4 Name
Inventory Organization Inventory Org
Hierarchy 5 Number
Org Hierarchy 5 Number
Inventory Organization Inventory Org
Hierarchy 5 Name
Org Hierarchy 5 Name
Inventory Organization Inventory Org
Hierarchy 6 Number
Org Hierarchy 6 Number
Inventory Organization Inventory Org
Hierarchy 6 Nam
Org Hierarchy 6 Name
Inventory Organization Inventory Org
Hierarchy 7 Number
Org Hierarchy 7 Number
Inventory Organization Inventory Org
Hierarchy 7 Name
Org Hierarchy 7 Name
Inventory Organization Inventory Org
Hierarchy 8 Number
Org Hierarchy 8 Number
Inventory Organization Inventory Org
Hierarchy 8 Name
Org Hierarchy 8 Name
Inventory Organization Inventory Org
Hierarchy 9 Number
Org Hierarchy 9 Number
Inventory Organization Inventory Org
Hierarchy 9 Name
Org Hierarchy 9 Name
Inventory Organization Inventory Org
Hierarchy 10 Number
Org Hierarchy 10 Number
Inventory Organization Inventory Org
Hierarchy 10 Name
Org Hierarchy 10 Name
Inventory Organization Inventory Org
Hierarchy 11 Number
Org Hierarchy 11 Number

Inventory Organization Inventory Org
Hierarchy 11 Name
Org Hierarchy 11 Name
Inventory Organization Inventory Org
Hierarchy 12 Number
Org Hierarchy 12 Number
Inventory Organization Inventory Org
Hierarchy 12 Name
Org Hierarchy 12 Name
Inventory Organization Inventory Org
Hierarchy 13 Number
Org Hierarchy 13 Number
Inventory Organization Inventory Org
Hierarchy 13 Name
Org Hierarchy 13 Name
Inventory Organization Inventory Org Top
Hierarchy Number
Org Top Hierarchy Number
Inventory Organization Inventory Org Top
Hierarchy Name
Org Top Hierarchy Name
Inventory Organization Inventory Org
Hierarchy 1 Number
Org Hierarchy 1 Number
Inventory Organization Inventory Org
Hierarchy 1 Name
Org Hierarchy 1 Name
Inventory Organization Inventory Org
Hierarchy 2 Number
Org Hierarchy 2 Number
Inventory Organization Inventory Org
Hierarchy 2 Name
Org Hierarchy 2 Name
Inventory Organization Inventory Org
Hierarchy 3 Number
Org Hierarchy 3 Number
Inventory Organization Inventory Org
Hierarchy 3 Name
Org Hierarchy 3 Name
Kanban Codes Kanban Card Status is the status of the kanban card (Active, Hold,
Cancelled)
Kanban Codes Kanban Card Type is the type of the kanban card( Replenishable,
Non Replenishable etc)
Kanban Codes Kanban Document Type is the document type of the order placed for
replenishment (Purchase Order, Work Order
etc)
Kanban Codes Kanban Error Code is the error code of the kanban card
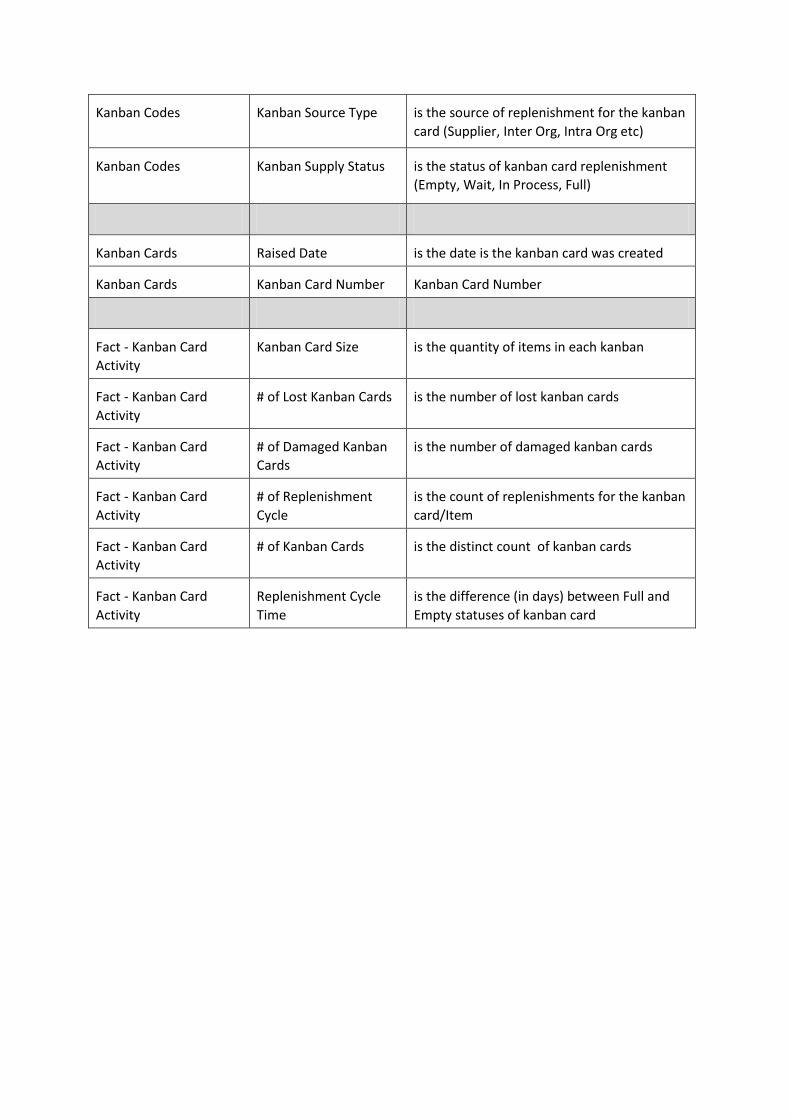
Kanban Codes Kanban Source Type is the source of replenishment for the kanban
card (Supplier, Inter Org, Intra Org etc)
Kanban Codes Kanban Supply Status is the status of kanban card replenishment
(Empty, Wait, In Process, Full)
Kanban Cards Raised Date is the date is the kanban card was created
Kanban Cards Kanban Card Number Kanban Card Number
Fact - Kanban Card
Activity
Kanban Card Size is the quantity of items in each kanban
Fact - Kanban Card
Activity
# of Lost Kanban Cards is the number of lost kanban cards
Fact - Kanban Card
Activity
# of Damaged Kanban
Cards
is the number of damaged kanban cards
Fact - Kanban Card
Activity
# of Replenishment
Cycle
is the count of replenishments for the kanban
card/Item
Fact - Kanban Card
Activity
# of Kanban Cards is the distinct count of kanban cards
Fact - Kanban Card
Activity
Replenishment Cycle
Time
is the difference (in days) between Full and
Empty statuses of kanban card
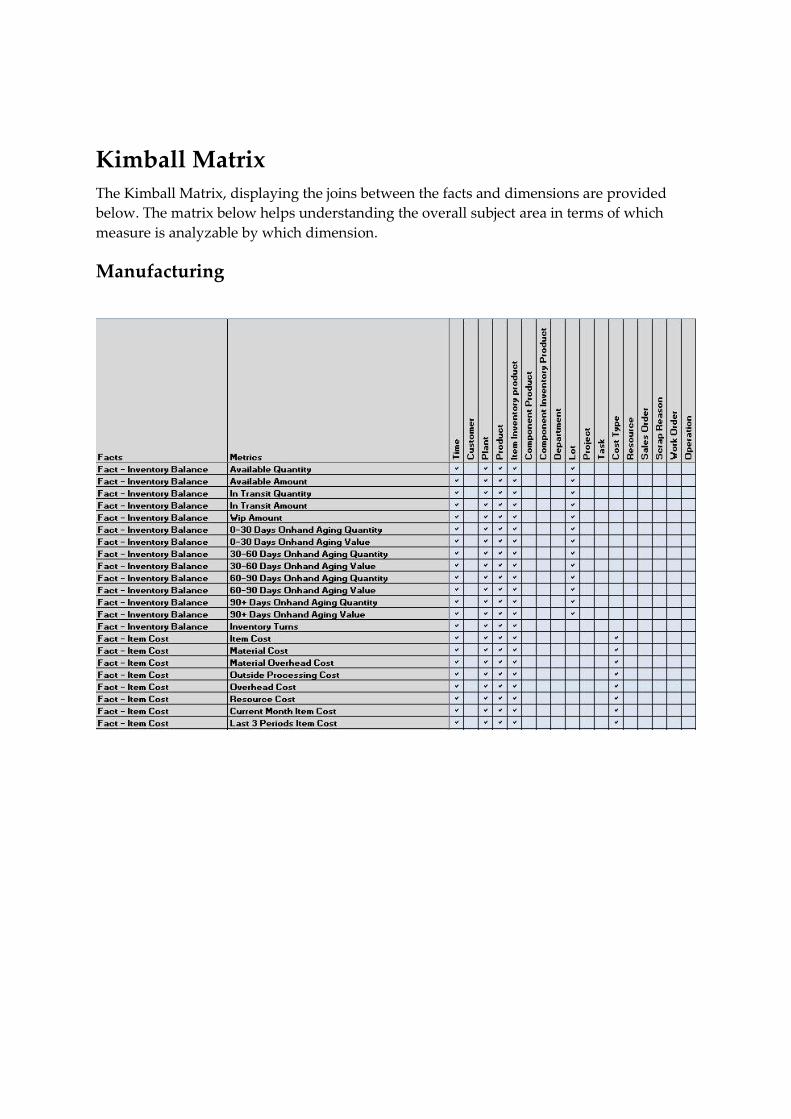
Kimball Matrix
The Kimball Matrix, displaying the joins between the facts and dimensions are provided
below. The matrix below helps understanding the overall subject area in terms of which
measure is analyzable by which dimension.
Manufacturing
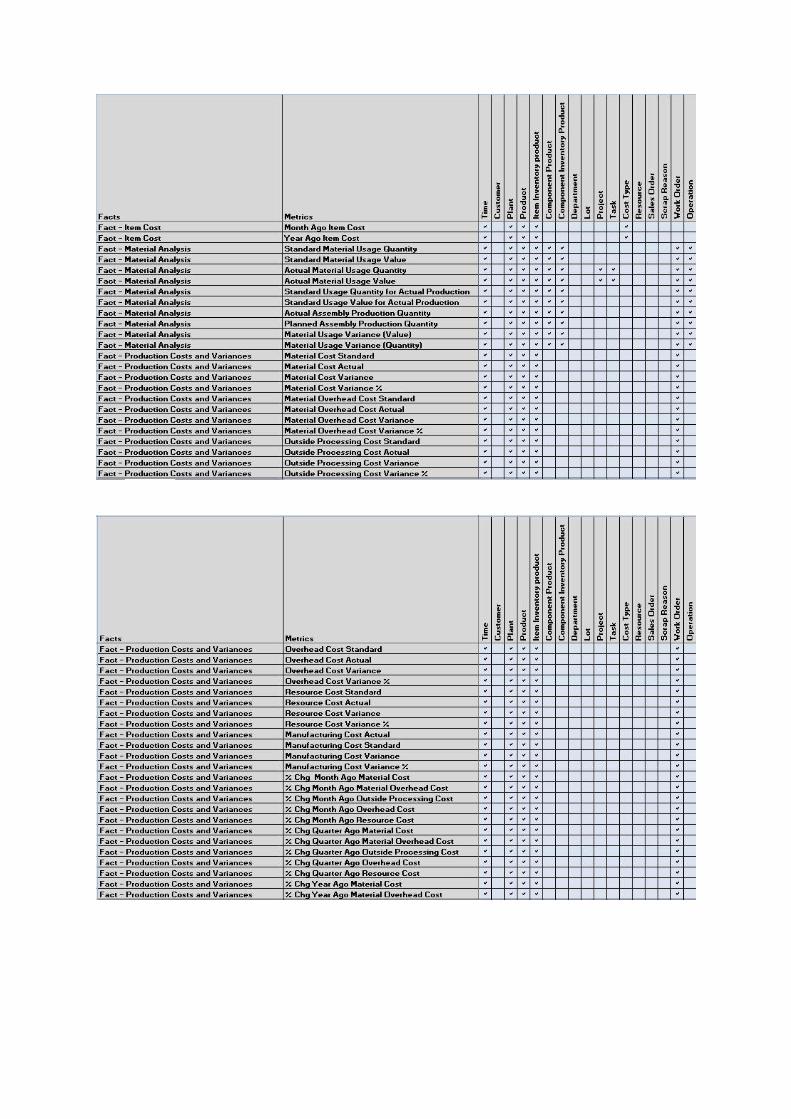
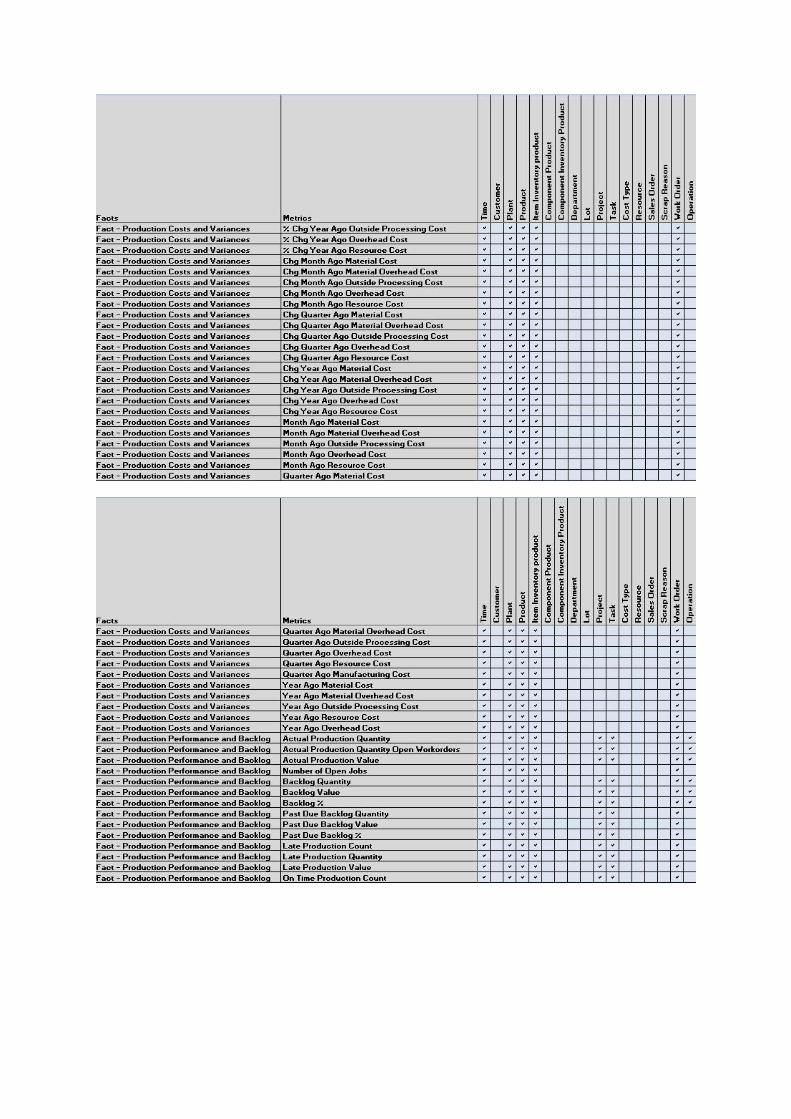
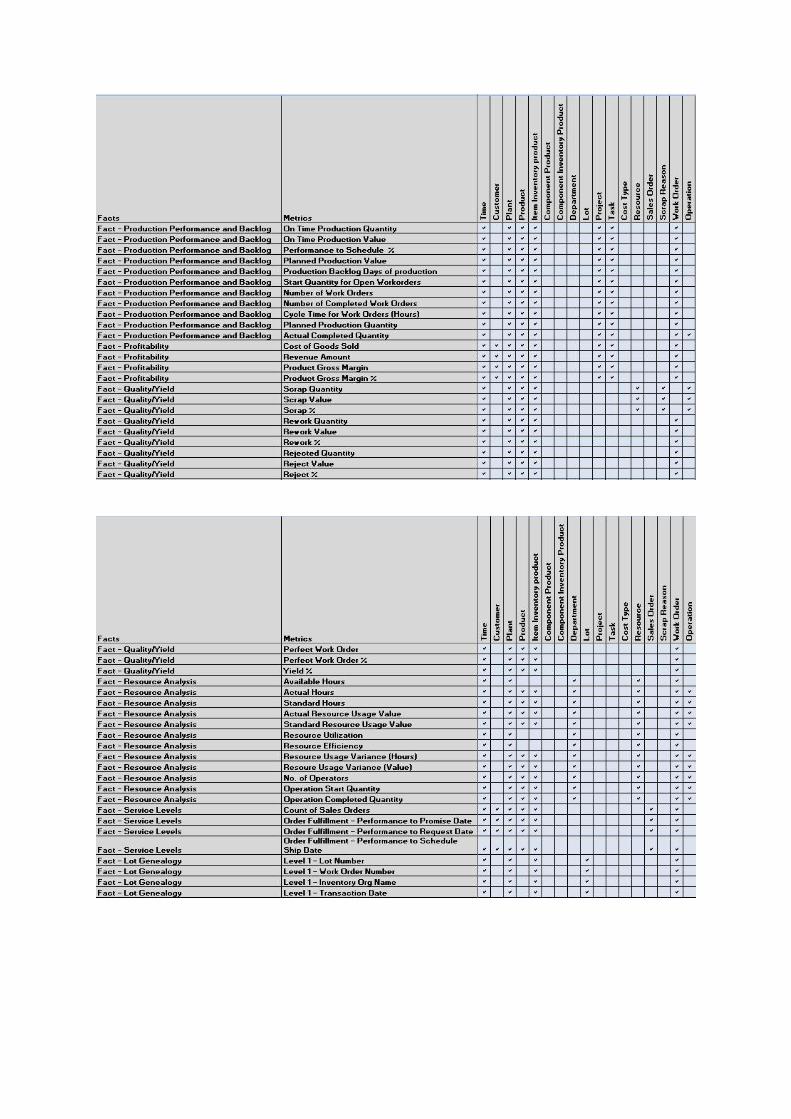

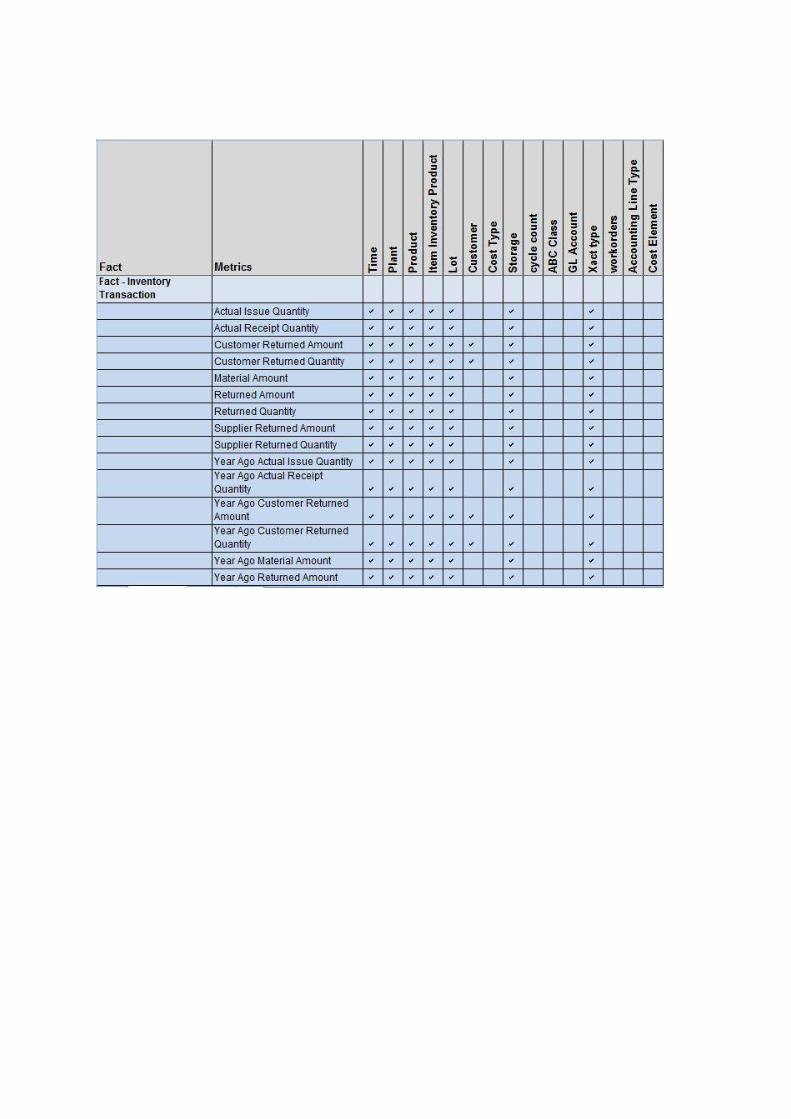
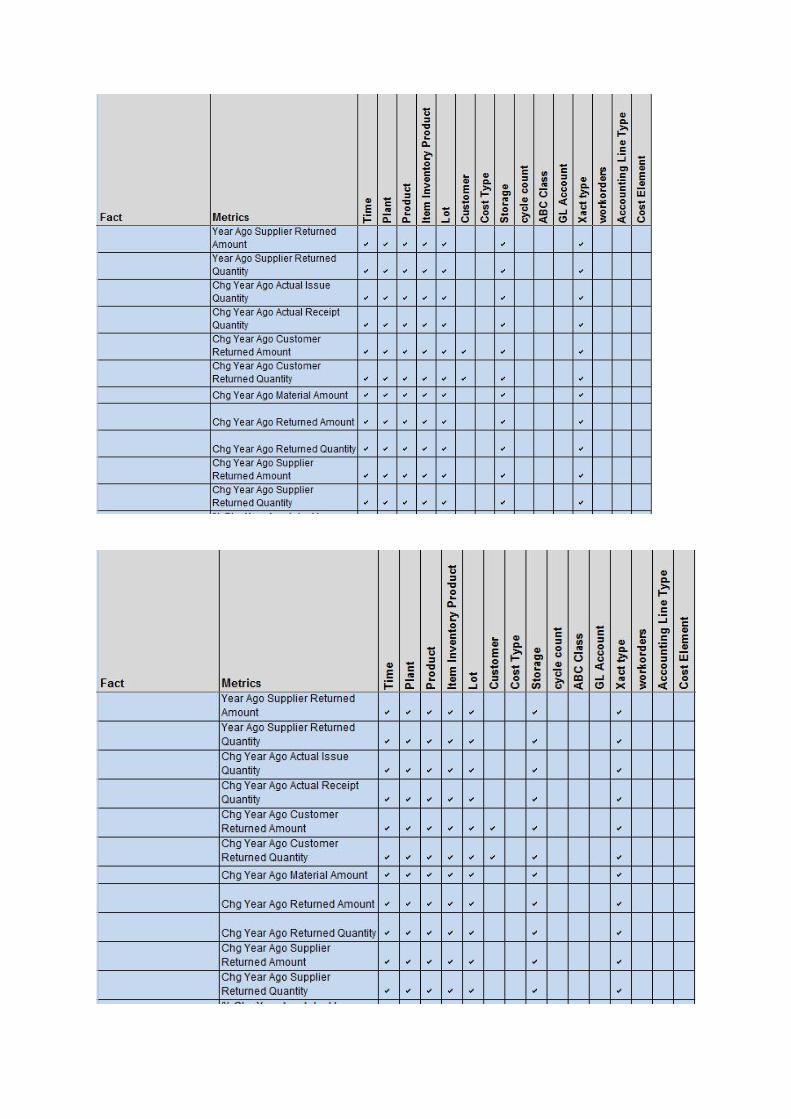


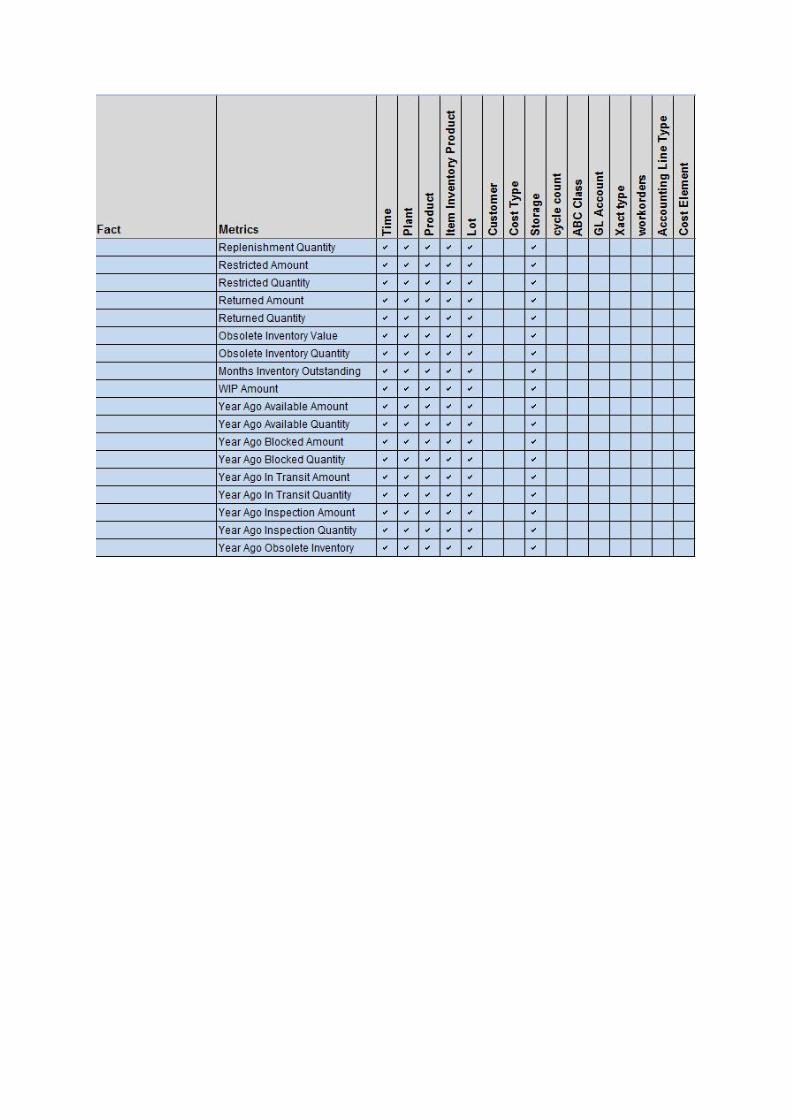
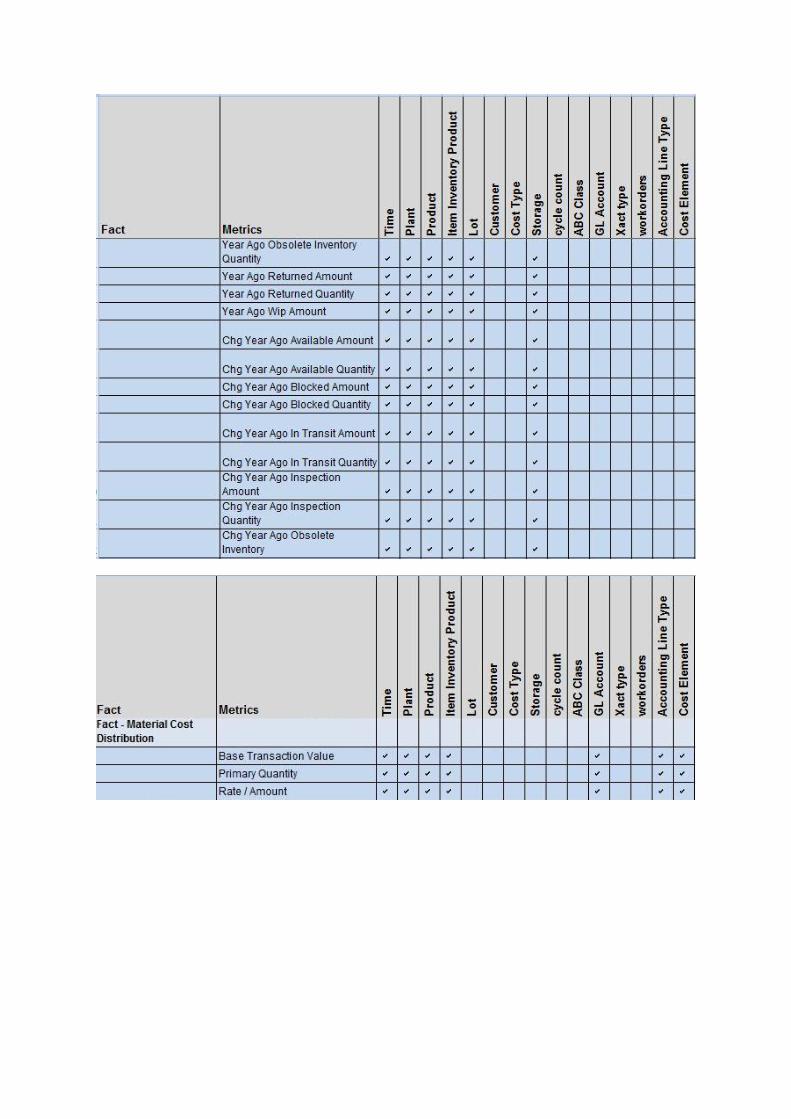

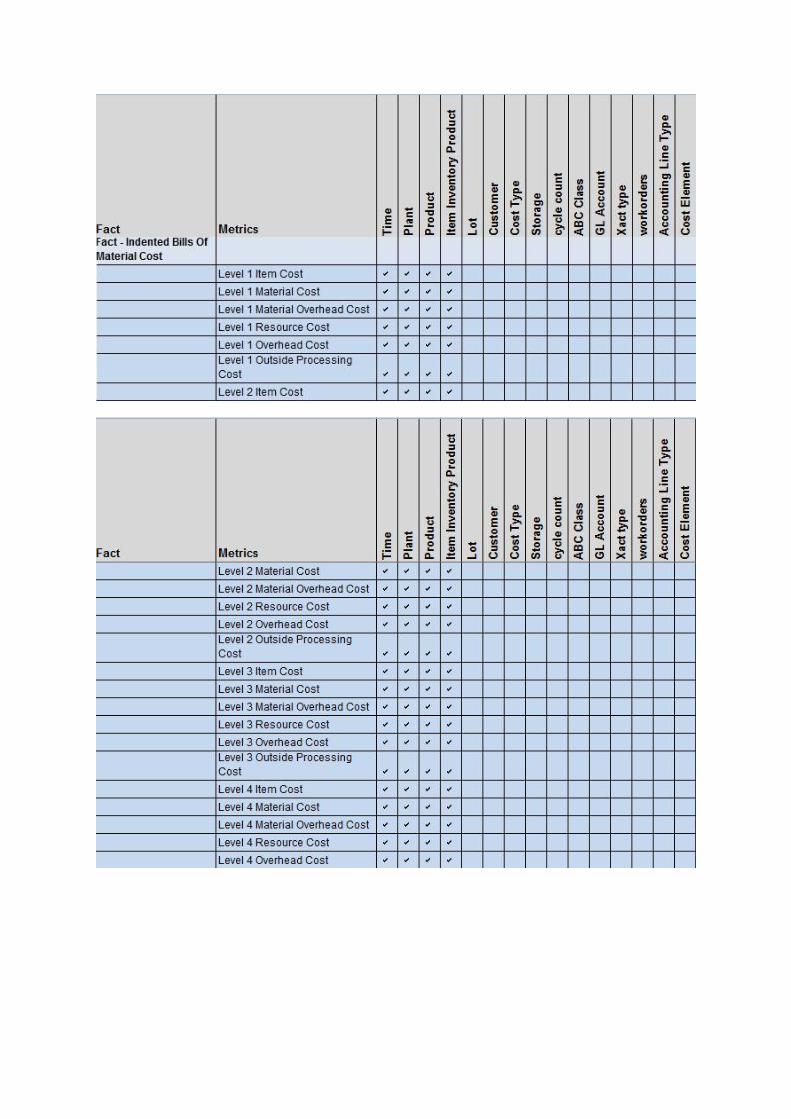

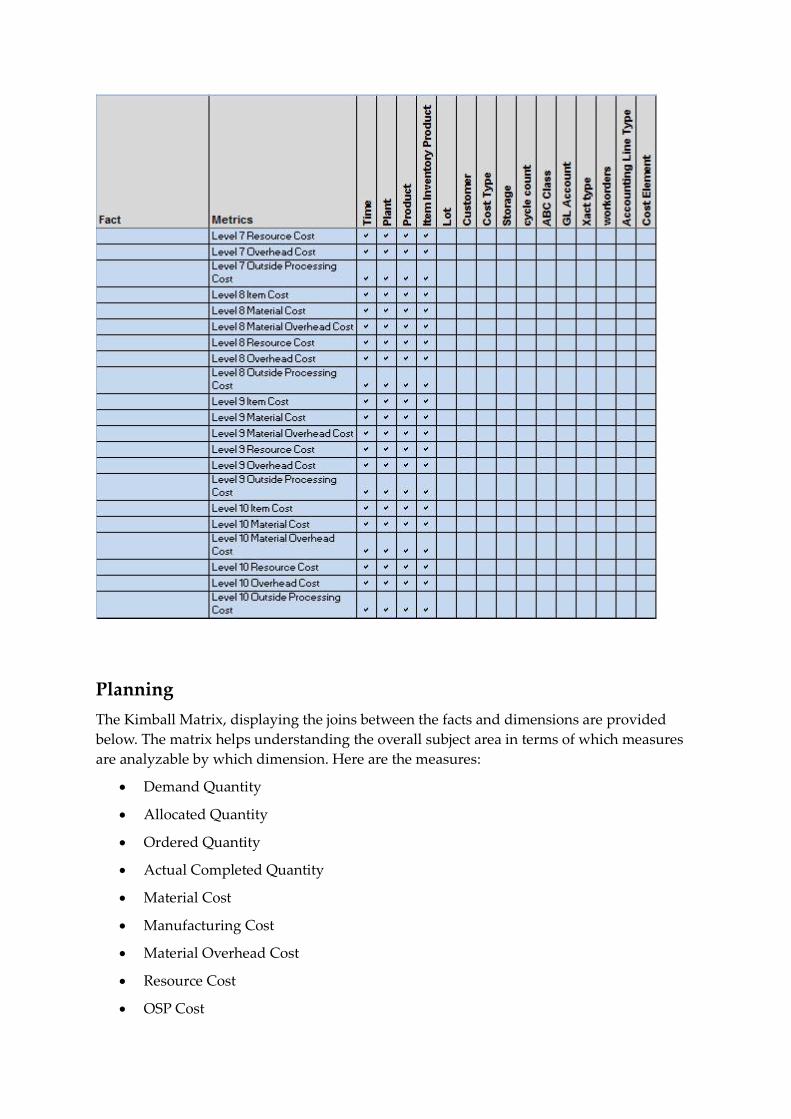
Planning
The Kimball Matrix, displaying the joins between the facts and dimensions are provided
below. The matrix helps understanding the overall subject area in terms of which measures
are analyzable by which dimension. Here are the measures:
Demand Quantity
Allocated Quantity
Ordered Quantity
Actual Completed Quantity
Material Cost
Manufacturing Cost
Material Overhead Cost
Resource Cost
OSP Cost
Sales Order Line Unit Price
0 - 15 Days Demand Quantity
16 - 30 Days Demand Quantity
31 - 45 Days Demand Quantity
46 - 60 Days Demand Quantity
60+ Days Demand Quantity
0 - 15 Days Supply Quantity
16 - 30 Days Supply Quantity
31 - 45 Days Supply Quantity
46 - 60 Days Supply Quantity
60+ Days Supply Quantity
All the above measures are analyzed by the Customer, Demand Details, Demand Item
Details, Demand Organization, Plan, Supply Details, Supply Item Details and Time
Dimensions
Discrete Quality
The Kimball Matrix, displaying the joins between the facts and dimensions are provided
below. The matrix helps understanding the overall subject area in terms of which measures
are analyzable by which dimensions.
Occurrence, Quantity, From Op Seq Num, To Op Seq Num, Attribute1, Attribute2,
Attribute3, Attribute4, Attribute5,Attribute6,Attribute7, Attribute8, Attribute9,Attribute10,
Attribute11, Attribute12, Attribute13, Attribute14, Attribute15, Attribute16, Attribute17,
Attribute18, Attribute19, Attribute20, Attribute21,Attribute22,Attribute23, Attribute24,
Attribute25, Attribute26, Attribute27, Attribute28, Attribute29, Attribute30, Attribute31,
Attribute32, Attribute33, Attribute34,Attribute35, Attribute36, Attribute37, Attribute38,
Attribute39, Attribute40, Attribute41, Attribute42, Attribute43, Attribute44, Attribute45,
Attribute46,Attribute47, Attribute48, Attribute49, Attribute50, Attribute51, Attribute52,
Attribute53, Attribute54, Attribute55, Attribute56, Attribute57, Attribute58,Attribute59,
Attribute60, Attribute61, Attribute62, Attribute63, Attribute64, Attribute65, Attribute66,
Attribute67, Attribute68, Attribute69, Attribute70,Attribute71, Attribute72, Attribute73,
Attribute74, Attribute75, Attribute76, Attribute77, Attribute78, Attribute79, Attribute80,
Attribute81, Attribute82,Attribute83, Attribute84, Attribute85, Attribute86, Attribute87,
Attribute88, Attribute89, Attribute90, Attribute91, Attribute92, Attribute93,
Attribute94,Attribute95, Attribute96, Attribute97, Attribute98, Attribute99, Attribute100
All the above measures are analyzed by Time, Department, Collection Plan, Organization,
Project, Non Conformance, Work Order, Resource and Task.

Process Quality
The Kimball Matrix, displaying the joins between the facts and dimensions are provided
below. The matrix helps understanding the overall subject area in terms of which measures
are analyzable by which dimension.
Test Result
Test Quantity
Remaining Quantity
Consumed Quantity
Sample Quantity
All the above measures are analyzed by the Time, Test, Organization, Product, Inventory Item,
Lot, Sample, Specification, Test Executor, Storage Location and Work Order.
Manufacturing Execution Dashboard
Pre-packaged content for Oracle Manufacturing Analytics is grouped under four roles - VP
Manufacturing, Plant Manager, Shop Floor Supervisor and Cost Controller. The contents are
packaged by job roles, based on the information required to fulfill the respective job roles.
VP Manufacturing Dashboard Page
VP Manufacturing page provides the user a complete 360 degree view of manufacturing
performance covering the manufacturing KPIs across manufacturing plants.
Navigation: Select Manufacturing Analytics Dashboard and click on the VP Manufacturing
Tab.
Parameters: Reports in VP Manufacturing page can be analyzed by the following
parameters:
Year
Quarter
Month
Week
Plant
Product Category
This page contains the following reports:
Production Performance Report
The Production Performance report answers the following common performance related
questions:
How am I performing with respect to the planned production?
How many Work Orders are open?
How many jobs are running late when compared to the production plan?
It contains the following KPI
Production to Plan
Production Backlog
Actual Production
Backlog %
Past due Backlog %
Users can drill on to any KPI in this report to go to the Production to Plan Summary page for
further analysis.
Production Cost Report
The Production Cost report displays all the measures related to cost incurred under different
headings during production, along with measures related to Margins maintained by the
production floor. This helps to analyze the cost effectiveness of the production process
followed in the organization.
It contains the following columns:
Production Cost
Overhead Cost
Resource Cost
Material Overhead
Outside Processing Cost
Revenue
Cost of Goods Sold
Margin
Margin%
Users can drill on to any KPI in this report to go to the Production Cost Summary page for
further analysis.
Inventory Report
The Inventory report displays measures related to the inventory maintained by the
organizations under different heads – On-Hand, Intransit and WIP. When viewed in
combination with other production related measures (as described in the previous reports)
this gives an idea whether the organization is maintaining the right inventory balance
compared to the total production processed.
It contains the following columns:
Inventory Value
In-transit Value

WIP Value
Users can drill on to any KPI in this report to go to the Inventory Summary page for further
analysis.
Quality Report
The Quality report contains measures related to the overall production quality of the
organization e.g. Scrap, Reject & Rework. These measures help the user understand the
efficiency of the production process.
It contains the following columns:
Scrap%
Rework%
Reject%
Users can drill on to any KPI in this report to go to the Quality Summary page for further
analysis.
Cross Plant Analysis Report
Cross Plant Analysis report provides the VP Manufacturing a single window to evaluate the
performance of multiple plants on several important KPIs -
Past Due Backlog %
Reject %
Perfect Work Order
Production to Plan
Overall Plant Performance
This report is organized in a graphical manner where the color of the bulb denotes the
relative performance where Green is considered to be Good, Yellow is Satisfactory and Red
is bad.
Conditional formatting has been applied on each measure with certain performance
assumptions, and these can be modified per business requirement.
Out of all the measures, user can drill on Production Performance related measures (Past
Due Backlog% and Production to Plan) to go to Production to Plan Summary page for
further information or analysis.
Key Category Tracking Report
In any business, some product categories would be considered as Key Product Categories
based on certain parameters. The Key Category Tracking report enables the user to track
such categories from perspective of:
Production to Plan
On Hand Inventory Value
The report helps user in getting answer to the following questions:
How is the plant performing in adhering to the production plan for these categories?
Are we maintaining sufficient inventory for these Categories?
User can further drill on to On Hand Inventory Value measure to go to Inventory Summary
page to analyze the inventory balance from different perspective e.g. Inventory Turns,
Aging etc.
Production to Plan Summary Dashboard Page
The Production to Plan Summary page provides detailed information about what was
planned to be produced and what has been actually produced by the plant.
Navigation: Click on any of the KPI in Production Performance report in VP Manufacturing
page or on Production Performance related measures in Cross Plant Analysis report in VP
Manufacturing page.
Parameters: The reports in this page can be analyzed by the following parameters:
Year
Quarter
Month
Week
Plant
Product Category.
This page contains one report – Production to Plan Summary.
Production to Plan Summary Report
The Production to Plan Summary report compares the actual production against the
planned production. It contains the following columns:
Plant
Product Category
Item Number
Product Name
Planned Quantity
Production Plan
Total Backlog
Actual Production
Backlog %
Past Due Backlog
Past Due Backlog %
A graphical representation of the Past Due Backlog is provided alongside the above table
report. The graph allows the user to analyze the Past Due Backlog by two dimensions –
Plant and Product Category.
Further drill on any of the measure takes user to the Work Order detail report which
provides the completed detailed information about the work order.
Production Cost Summary Dashboard Page
The Production Cost Summary page provides information about the cost incurred under
different heads during the production process and helps evaluate the cost effectiveness of
the production process.
Navigation: Click on any of the KPI in Production Cost report in VP Manufacturing page to
come to this page.
Parameters: The reports in this page can be analyzed by the following parameters:
Year
Quarter
Month
Week
Plant
Product Category.
This dashboard page contains the following reports:
Cost Distribution Analysis Report
The Cost Distribution Analysis report helps the user analyze how the total cost of
production is distributed under different elemental costs e.g. – Material Cost, Resource Cost,
Overhead Cost, Material Overhead Cost & Outside Processing Cost. Users can analyze the
report either by Plant (where the production activity is taking place) or by Product Category
(the category of the item produced)
The report has the following columns:
Plant/Product Category
Overhead Cost
Material Cost
Resource Cost
Material Overhead Cost
Outside Processing Cost
Total Cost
Two graphical presentations of the above report are also available for the user to analyze.
Bar chart – The Bar Chart displays the following columns:
Overhead Cost
Material Cost
Resource Cost
Total Cost
As per the option selected by the user, the graph allows the user to analyze the above
measures by Plant or Product Category.
Pie Chart – The Pie Chart provides an easy way to the user to identify the largest
contributing element of the production cost. It contains the following columns:
Overhead Cost
Material Cost
Resource Cost
Margin Analysis Report
The Margin Analysis report helps the user analyze profitability of the production process by
comparing the revenue earned and the cost incurred in producing the goods. Users can
analyze the report either by Plant (where the production activity is taking place) or by
Product Category (the category of the item produced) thereby identifying the most/least
profitable plant and/or product category.
The report has the following columns:
Plant/Product Category
Revenue Amount
Cost of Goods Sold
Product Gross Margin
Product Gross Margin %
A graphical representation of the above report is also available for the user to analyze the
same measures either by Plant or by Product Category. This report requires licensing and
deploying of the Financial Analytics module
Resource Cost Variance Report
The Resource Cost Variance report helps the user analyze the total cost incurred during
production process due to resources deployed. The report compares the planned cost
against the actual cost and also reports the cost variance in absolute and in percentage terms.
Users can analyze the report either by Plant (where the production activity is taking place)
or by Product Category (the category of the item produced).
The report has the following columns:
Plant/Product Category
Resource Cost Standard
Resource Cost

Resource Cost Variance
Resource Cost Variance %
The Bar chart, showing Resource Cost Variance %, helps the user to identify the plant or the
product category for which Variance % is more.
Material Cost Variance Report
The Material Cost Variance report helps the user analyze the total cost incurred during
production processes due to the materials deployed. The report compares the planned cost
against the actual cost and also reports the cost variance in absolute and in percentage terms.
Users can analyze the report either by Plant (where the production activity is taking place)
or by Product Category (the category of the item produced).
The report has the following columns:
Plant/Product Category
Material Cost Standard
Material Cost
Material Cost Variance
Material Cost Variance %
The Bar chart, showing Material Cost Variance %, helps the user in identifying the plant or
the product category for which Variance % is more.
Overhead Cost Variance Report
The Overhead Cost Variance report helps the user analyze the total cost incurred during
production processes due to the resources deployed. The report compares the planned cost
against the actual cost and also reports the cost variance in absolute and in percentage terms.
Users can analyze the report either by Plant (where the production activity is taking place)
or by Product Category (the category of the item produced).
The report has following columns:
Plant/Product Category
Overhead Cost Standard
Overhead Cost
Overhead Cost Variance
Overhead Cost Variance %
The Bar chart, showing Overhead Cost Variance %, helps the user in identifying the plant or
the product category for which Variance % is more.
Inventory Summary Dashboard Page
The Inventory Summary page provides detailed information about the inventory balance
maintained by the production facilities. The user can analyze the total inventory balance by

its Aging, by the Type of Inventory and also can find out how well the plants are using the
inventory by looking at the Inventory Turns value.
Navigation: Click on any of the KPI in Inventory report in VP Manufacturing page to come
to this page.
Parameters: The reports in this page can be analyzed by the following parameters:
Year
Quarter
Month
Week
Plant
Product Category.
This page contains the following reports:
Inventory Turns Trend Report
The Inventory Turns Trend report is a graphical representation of the Inventory Turns and
the On Hand Inventory Value over different periods of time. This helps the user in getting
answers to questions like –
How is my Onhand inventory changing over a period of time?
How is my Inventory Turning (or rolling)?
This Line-Bar graphic report contains two measures –
On Hand Inventory Value
Inventory Turns
Inventory Turns by Category Report
The Inventory Turns by Category report is a graphical representation of the Inventory Turns
and On Hand Inventory Value for different product categories. This helps the user in getting
answers to questions like:
What is my On-Hand inventory for each category?
Am I holding sufficient inventory for each category or any specific category is
contributing maximum to the inventory value?
Are there any slow moving items (Inventory Turns is low) for which I am holding
too much of Inventory?
The Line-Bar graphic report contains two measures:
On Hand Inventory Value
Inventory Turns
This graphic report is also complemented by a tabular representation of the same data. The
table report has following columns:
Product Category
Inventory Turns
On-Hand Inventory Value
Quality Summary Dashboard Page
The Quality Summary page helps the user in getting answers to the following questions:
How much scrap is generated in each period compared to the production value?
What is the trend in scrap over a period of time? Is the overall quality of production
process improving?
What are the different reasons attributed to the scrap generated during production?
Navigation: Clicking on any of the KPIs in the Quality report in VP Manufacturing page
navigates to this page
Parameters: The reports in this page can be analyzed by the following parameters:
Year
Quarter
Month
Week
Plant
Product Category.
This dashboard page contains the following reports:
Production Scrap Distribution Trend Report
The Production Scrap Distributions Trend report displays the distribution of total scrap
generated over a period by different scrap reasons. This helps the user to identify the core
reasons which are the maximum contributors to the scrap generated during production
process and to take the necessary actions to eliminate them, in order to improve the overall
production quality.
The report contains the following columns:
Week
Scrap Reason
Scrap Value
Scrap%
Production Scrap Trend Report
The Production Scrap Trend report displays the total scrap generated over a period in
comparison to the production value in the same period. This report, when viewed alongside
the other report (described above) provides an insight to the overall quality trend of the
plant or by the product category, based on the parameter selected by the user.
The report contains the following columns:
Week
Production Value
Scrap Value
Scrap Value%
This report can be viewed in tabular format or in graphical format. In graphical format the
report is generated as a bar chart where both Production Value and Scrap Value are plotted
as Bar with the length of the bar denoting the values.
Service Level Summary Dashboard Page
The Service Level Summary page helps the user in analyzing how production facilities are
performing in terms of complying with the different dates provided by the demand
generating process (Sales Order).
Typically a Sales Order will contain three major dates:
Request Date
Promise Date
Scheduled Ship Date
When a Work Order is pegged to the Sales Order line, the report helps in evaluating how the
production facility performed in fulfilling date commitments, by comparing the Work Order
completion Date with the above dates.
Navigation: Click on any of the KPI in Service Level report in VP Manufacturing page to
come to this page.
Parameters: The reports in this page can be analyzed by the following parameters:
Year
Quarter
Month
Week
Plant
Product Category
This dashboard page contains the following reports:
Ship Date Compliance Report
The Ship Date Compliance report displays product category wise compliance % to the
scheduled ship date as mentioned in the pegged Sales Order.
Scheduled Ship Date Compliance % is plotted as a bar graph in this chart with the horizontal
axis displaying the product categories.

This report highlights those categories for which the production facility is unable to
complete the production on or before committed ship date.
Promise Date Compliance Report
The Promise Date Compliance report displays product category wise compliance % to the
Promise date as mentioned in the pegged Sales Order.
Promise Date Compliance % is plotted as a bar in this chart with the horizontal axis
displaying the product categories.
This report highlights those categories for which the production facility is unable to
complete the production on or before Promise date.
Request Date Compliance Report
The Request Date Compliance report displays product category wise compliance % to the
Request date as mentioned in the pegged Sales Order.
Request Date Compliance % is plotted as a bar graph in this chart with the horizontal axis
displaying the product categories.
This report highlights those categories for which the production facility is unable to
complete the production on or before the Request date.
** All the reports on the Service Level Summary Dashboard page require the licensing and deploying
of the Supply Chain and Order Management analytics module
Plant Manager Dashboard Page
The Plant Manager Page presents all the measures and reports related to Plant level
performance.
Navigation: Select Manufacturing Analytics Dashboard and click on the Plant Manager Tab.
Parameters: Reports in the Plant Manager page can be analyzed by the following
parameters:
Year
Quarter
Month
Week
Plant
Department
Product Category.
This dashboard page contains the following reports:

Production Cost Report
The Production Cost report displays all the measures related to cost incurred under different
headings during production along with the measures related to Margins maintained by the
production floor. This helps user analyzing the cost effectiveness of the production
processes followed in the organization.
It contains the following columns:
Production Cost
Overhead Cost
Resource Cost
Material Overhead
Outside Processing Cost
Revenue
Cost of Goods Sold
Margin
Margin%
Users can drill on to any KPI in this report to go to the Production Cost Summary page for
further analysis.
Production to Plan Report
The Production to Plan report answers the following common performance related question:
How am I performing with respect to the planned production?
How much is the work order in backlog (open Work Order)?
How much is actually produced in the shop floor in a selected period?
The report displays the following columns
Product Category
Planned Production
Actual Production
Production Backlog
Backlog %
The report also has a graphical representation where Production Backlog is plotted as a Bar
against the different product categories. This chart clearly highlights the categories for
which the plant is doing well in terms of adhering to the plan and where there is a serious
slippage.
Resource Efficiency Report
The Resource Efficiency report provides clear visibility on the available resources and how
are they utilized. It also answers questions on efficiency (i.e.) when resources are utilized,
what is the efficiency in which they are working. The Resource efficiency report clearly
answers the above questions by bringing all the related measures under one common
window.
This report contains the following columns:
Resource Name
Standard Hours
Actual Hours
Resource Utilization
Resource Efficiency
Trending Report
The Trending report is a graphical report displaying how the Material Usage Variance %
and Resource Usage Variance % is changing over a period of time thereby helping the user
to keep a constant eye on the unplanned usages.
The report contains the following columns:
Material Usage Variance %
Resource Variance %
Shop Floor Supervisor Dashboard Page
The Shop Floor Supervisor dashboard page provides the shop floor supervisors with
detailed visibility into work order performance and manufacturing execution. This page has
the following dashboard prompts applicable to all the reports:
Start Date
End Date
Organization
Department
This dashboard page contains the following reports:
Overall Productivity Report
This gauge report displays the overall productivity of all the available resources in the
Organization/Department.
The Dial Gauge displays the overall productivity (in percent)
Productivity by Resource Report
The Productivity by Resource is a graphical report displaying productivity (in percent) for
each resource
The report contains the following columns:
Resource Name
Productivity (in %)
Shop Floor Utilization Summary Report
This report provides information about Productivity, Available Hours (for the resource) and
Work Order Operation Hours for the Resource
The report contains the following columns:
Resource Number
Resource Name
WO Operation Hours
Available Hours
Productivity
Lot Genealogy Dashboard Page
The Lot Genealogy Page provides the lineage at the lot level up to four levels deep. It helps
track a finished product lot and trace intermediate and raw material lots that are associated
with the finished product lot. The prompts applied for the lot genealogy report on this page
includes :
Start Date
End Date
Item Category
Product Number
This dashboard page contains the following reports:
Lot Genealogy Report
The report provides information about the lot lifecycle starting from Raw material to
finished goods.
The report contains the following columns:
Level 1 Batch Number
Product Number
Product Name
Lot Number
Completion Date
Inventory Category
Inventory Org Name
Level 2 Product Number
Product Name
Make/Buy
Lot Number
Batch Number
Level 3 Product Number
Product Name
Make/Buy
Lot Number
Batch Number
Level 4 Product Number
Product Name
Make/Buy
Lot Number
Batch Number
Level 5 Product Number
Product Name
Lot Number
Supplier Name
Vendor Lot Number
Receipt Date
Cost Controller Dashboard Page
Cost Controller dashboard page helps the user in analyzing the measures related to
manufacturing costs. Dashboard provides cost breakup, costing trend and variances in
manufacturing costs. All the reports are for current month
Cost Metrics Report
Cost Metrics report displays the cost breakup of the total manufacturing cost
It displays the following columns:
Material Cost ITD
Material Cost
Resource Cost ITD
Resource Cost

Overhead Cost ITD
Overhead Cost
Total Cost Trend Report
Total Cost Trend report displays the weekly trend of Actual Material, Resource and
Overhead Costs for the current month. The report is a graph plotted on week and Material,
Resource and Overhead Costs
Manufacturing Cost Variance Report
Manufacturing Cost Variance report displays the variance (in %) for Material, Resource
Usage and Manufacturing costs for Plants
This report displays the following columns
Plant
Material Usage Variance
Resource Usage Variance
Cross Functional Dashboard Page
The cross functional dashboard page helps the user in analyzing how production facilities
are performing in terms of complying with the different dates provided by the demand
generating process (Sales Order).
Typically a Sales Order will contain three major dates:
Request Date
Promise Date
Scheduled Ship Date
When a Work Order is pegged to the Sales Order line, the report helps in evaluating how the
production facility performed in fulfilling date commitments, by comparing the Work Order
completion Date with the above dates.
Navigation: Click on the Cross Functional tab in Manufacturing Execution dashboard to
come to this page.
Parameters: The reports in this page can be analyzed by the following parameters:
Year
Quarter
Month
Week

Plant
Product Category
This page contains the following reports
Service Levels Report
The Service level report displays the compliances of Ship, Promise and Request date. This
report drills to Service level compliance dashboard page that contains graphs for Promise
Date Compliance, Ship Date Compliance and Request Date Compliance.
Ship Date Compliance Report
The Ship Date Compliance report displays product category wise compliance % to the
scheduled ship date as mentioned in the pegged Sales Order.
Scheduled Ship Date Compliance % is plotted as a bar graph in this chart with the horizontal
axis displaying the product categories.
This report highlights those categories for which the production facility is unable to
complete the production on or before committed ship date.
Promise Date Compliance Report
The Promise Date Compliance report displays product category wise compliance % to the
Promise date as mentioned in the pegged Sales Order.
Promise Date Compliance % is plotted as a bar in this chart with the horizontal axis
displaying the product categories.
This report highlights those categories for which the production facility is unable to
complete the production on or before Promise date.
Request Date Compliance Report
The Request Date Compliance report displays product category wise compliance % to the
Request date as mentioned in the pegged Sales Order.
Request Date Compliance % is plotted as a bar graph in this chart with the horizontal axis
displaying the product categories.
This report highlights those categories for which the production facility is unable to
complete the production on or before the Request date.
Margin Analysis Report
The Margin Analysis report helps the user analyze profitability of the production process by
comparing the revenue earned and the cost incurred in producing the goods. Users can
analyze the report either by Plant (where the production activity is taking place) or by
Product Category (the category of the item produced) thereby identifying the most/least
profitable plant and/or product category.
The report has the following columns:
Plant/Product Category
Revenue Amount
Cost of Goods Sold
Product Gross Margin
Product Gross Margin %
A graphical representation of the above report is also available for the user to analyze the
same measures either by Plant or by Product Category.
** The reports on the Cross-Functional dashboard page requires the licensing and deploying of
Financials analytics and Supply Chain and Order Management analytics
Planning Dashboard
Plan Summary Dashboard Page
Plan Run Date and Plan Name are mandatory prompts in this dashboard as the underlying
facts of Planning Analytics store 7 days history of plan runs
Demand Schedule by Time bucket:
This report provides information about the pegged demand distribution over different time
buckets in Graphical Format
Demand Pegging Trend:
This report displays the trend in total order quantity, demand quantity and allocated
quantity helping user to analyze how much of the demand quantity got allocated i.e.,
pegged to supply in Graphical format.
Demand Fulfillment Performance:
This report compares the demand quantity against the actual completion quantity, by
Organization and Product category providing complete picture about the demand
fulfillment rate.
Navigation : Select Planning Analytics Dashboard and click on the Plan Summary Report Tab.
Attributes in the Report:
Organization Name
Demand Quantity
Allocated Quantity
Actual Completed Quantity
Demand Fulfillment Distribution:
This report helps user analyze how the demand for different time buckets being full filled
over different supply time bucket for each of the product categories in Graphical format
Supply Distribution:
This report helps user analyze in the supply for different time buckets by different supply
type or product category in Graphical format.
Supply Schedule by Time bucket:
This report provides information about the planned supply distribution over different time
buckets in Graphical Format
Pegging Details Dashboard Page
Pegging Details Report
On recognition of given demand, the pegging information is calculated by the ASCP engine.
This report helps us to view the pegged information to meet the given demand.
Plan Run Date and Plan Name are mandatory prompts in this dashboard as the underlying
facts of Planning Analytics store 7 days history of plan runs
Navigation : Select Planning Analytics Dashboard and click on the Pegging Details Report Tab.
Parameters : Pegging Details Report can be analyzed by the following parameters:
Plan Run Date
Plan Name
Sales Order Number

Customer Name
This report answers the following Plan, Pegging related questions:
How a Demand is met by pegging different items and their respective quantities.
What is the status of the Sales Order?
What is the Order type planned for the Item-whether it is Make/Buy?
How are the Sales Order demands going to be fulfilled and their respective statuses?
Attributes In The Report:
Item
Level Num
Customer Name
Plan Name
Demand Order
Sales Order Status
Sales Order Line Status
Demand Quantity
Supply Order
Supply Type
Supply Make/Buy Flag
Supply Quantity
Work Order Status
** The pegging details report requires the licensing and deployment of Supply Chain and
Order Management analytics module
Demand Schedule Dashboard Page
Demand is the primary driving factor for any supply chain planning analysis. Demand
Schedule page addresses the above analytical needs by answering the following questions:
The source of the demand?
When does the demand need to be fulfilled?
Whether the entire demand to be fulfilled together or the same needs to be fulfilled in
different time bucket?
Navigation : Select Planning Analytics Dashboard and click on the Demand Schedule Tab.
Parameters : Demand Schedule can be analyzed by the following parameters :
Plan Run Date
Plan Name
Sales Order Number
Customer Name
Demand Type
Sales Order Part Number
Attributes In The Report:
Customer Name
Plan Name
Plan Run Date
Sales Order Number
Demand Assembly Item
Demand Date
Demand Quantity
0-15 Days Demand Quantity
16-30 Days Demand Quantity
31-45 Days Demand Quantity
46-60 Days Demand Quantity
60+ Days Demand Quantity
Supply Schedule Dashboard Page
Supply refers to the demand fulfilling part of the supply chain. The Supply Schedule
dashboard page fulfills the analytical needs by providing answers to valuable questions like:
What is the mode of supply (whether it is Work Order or Purchase Order?)
When is it going to be fulfilled?
How is the supply quantities distributed in different time buckets?
Navigation : Select Planning Analytics Dashboard and click on the Supply Schedule Tab.
Parameters : Supply Schedule can be analyzed by the following parameters :
Plan Run Date
Plan Name
Customer Name
Sales Order Number
Supply Type
Supply Order Number
Supply Part Number
Attributes In The Report:
Customer Name
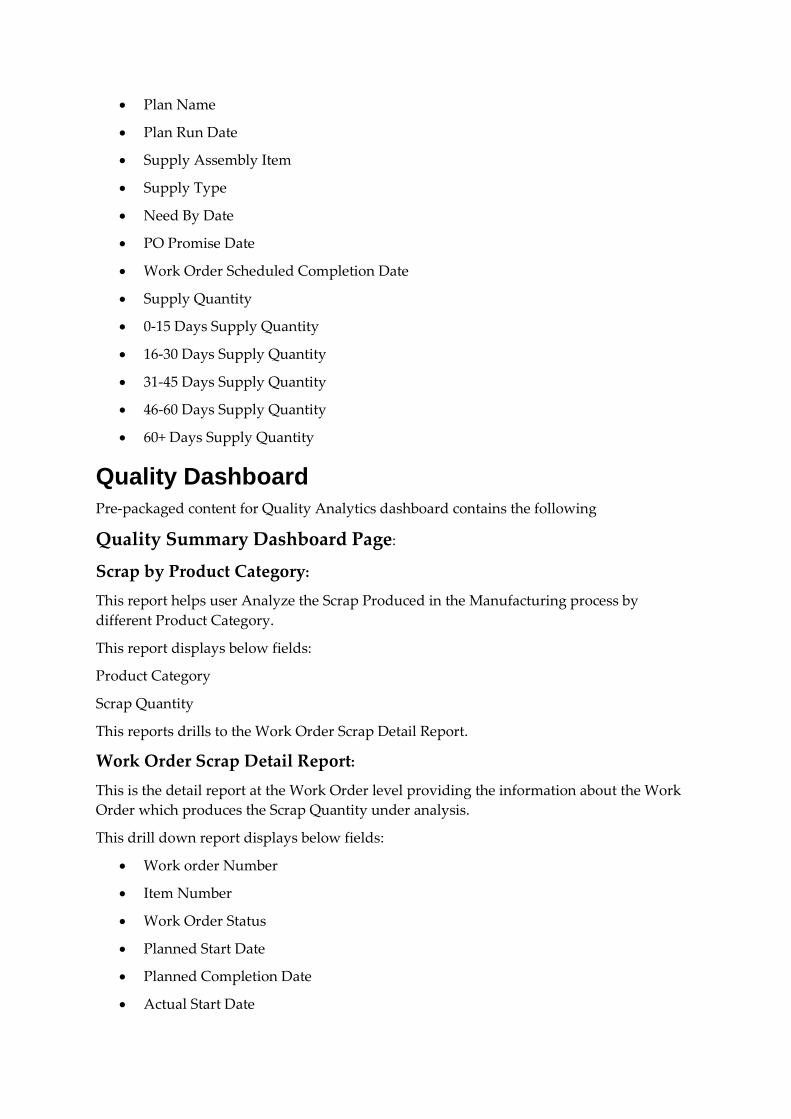
Plan Name
Plan Run Date
Supply Assembly Item
Supply Type
Need By Date
PO Promise Date
Work Order Scheduled Completion Date
Supply Quantity
0-15 Days Supply Quantity
16-30 Days Supply Quantity
31-45 Days Supply Quantity
46-60 Days Supply Quantity
60+ Days Supply Quantity
Quality Dashboard
Pre-packaged content for Quality Analytics dashboard contains the following
Quality Summary Dashboard Page:
Scrap by Product Category:
This report helps user Analyze the Scrap Produced in the Manufacturing process by
different Product Category.
This report displays below fields:
Product Category
Scrap Quantity
This reports drills to the Work Order Scrap Detail Report.
Work Order Scrap Detail Report:
This is the detail report at the Work Order level providing the information about the Work
Order which produces the Scrap Quantity under analysis.
This drill down report displays below fields:
Work order Number
Item Number
Work Order Status
Planned Start Date
Planned Completion Date
Actual Start Date
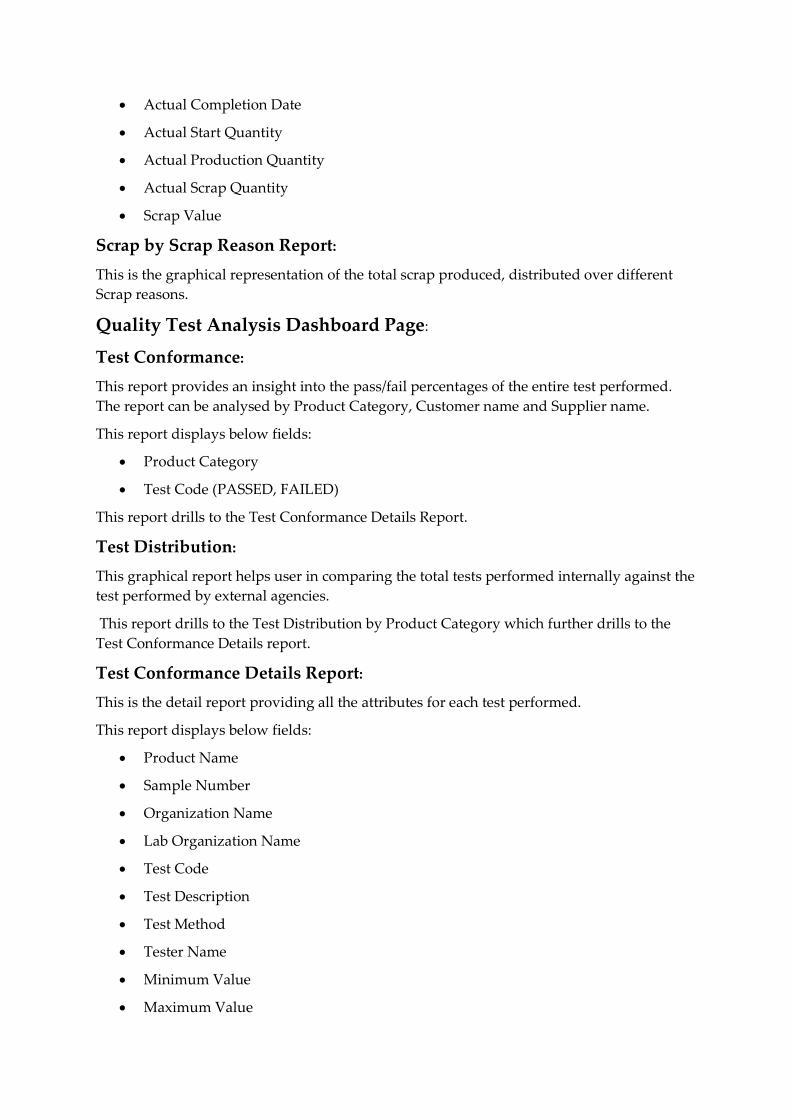
Actual Completion Date
Actual Start Quantity
Actual Production Quantity
Actual Scrap Quantity
Scrap Value
Scrap by Scrap Reason Report:
This is the graphical representation of the total scrap produced, distributed over different
Scrap reasons.
Quality Test Analysis Dashboard Page:
Test Conformance:
This report provides an insight into the pass/fail percentages of the entire test performed.
The report can be analysed by Product Category, Customer name and Supplier name.
This report displays below fields:
Product Category
Test Code (PASSED, FAILED)
This report drills to the Test Conformance Details Report.
Test Distribution:
This graphical report helps user in comparing the total tests performed internally against the
test performed by external agencies.
This report drills to the Test Distribution by Product Category which further drills to the
Test Conformance Details report.
Test Conformance Details Report:
This is the detail report providing all the attributes for each test performed.
This report displays below fields:
Product Name
Sample Number
Organization Name
Lab Organization Name
Test Code
Test Description
Test Method
Tester Name
Minimum Value
Maximum Value
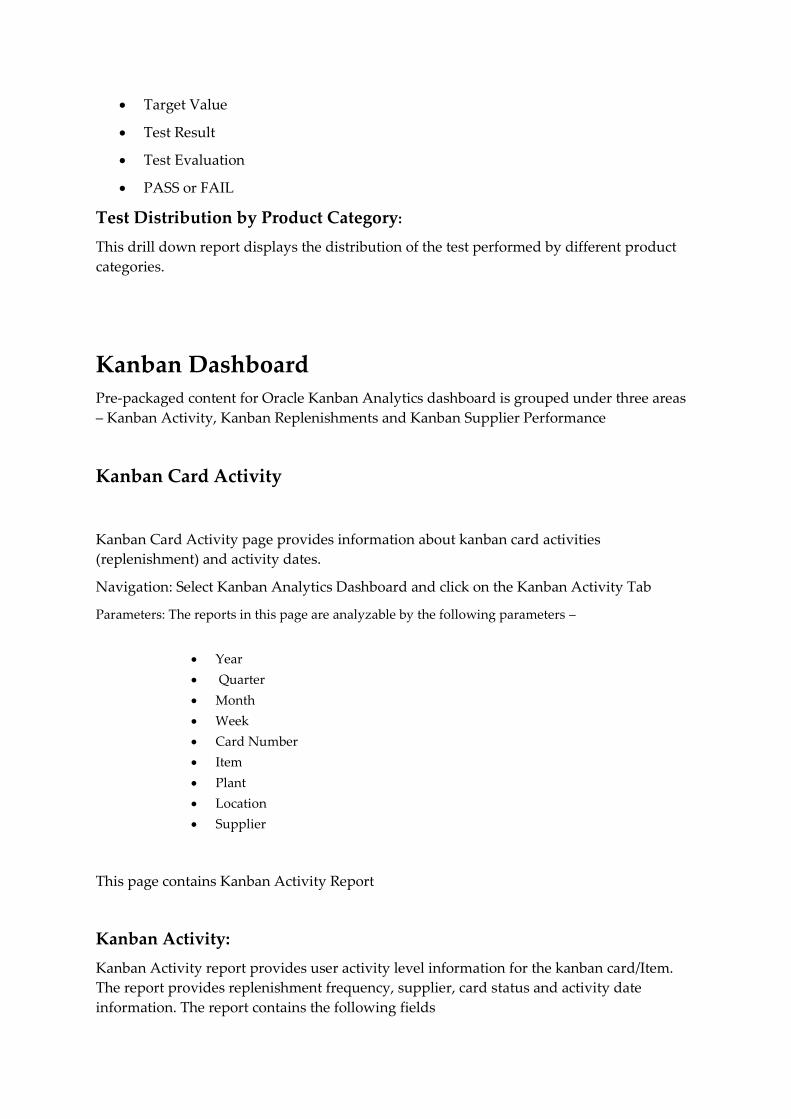
Target Value
Test Result
Test Evaluation
PASS or FAIL
Test Distribution by Product Category:
This drill down report displays the distribution of the test performed by different product
categories.
Kanban Dashboard
Pre-packaged content for Oracle Kanban Analytics dashboard is grouped under three areas
– Kanban Activity, Kanban Replenishments and Kanban Supplier Performance
Kanban Card Activity
Kanban Card Activity page provides information about kanban card activities
(replenishment) and activity dates.
Navigation: Select Kanban Analytics Dashboard and click on the Kanban Activity Tab
Parameters: The reports in this page are analyzable by the following parameters –
Year
Quarter
Month
Week
Card Number
Item
Plant
Location
Supplier
This page contains Kanban Activity Report
Kanban Activity:
Kanban Activity report provides user activity level information for the kanban card/Item.
The report provides replenishment frequency, supplier, card status and activity date
information. The report contains the following fields
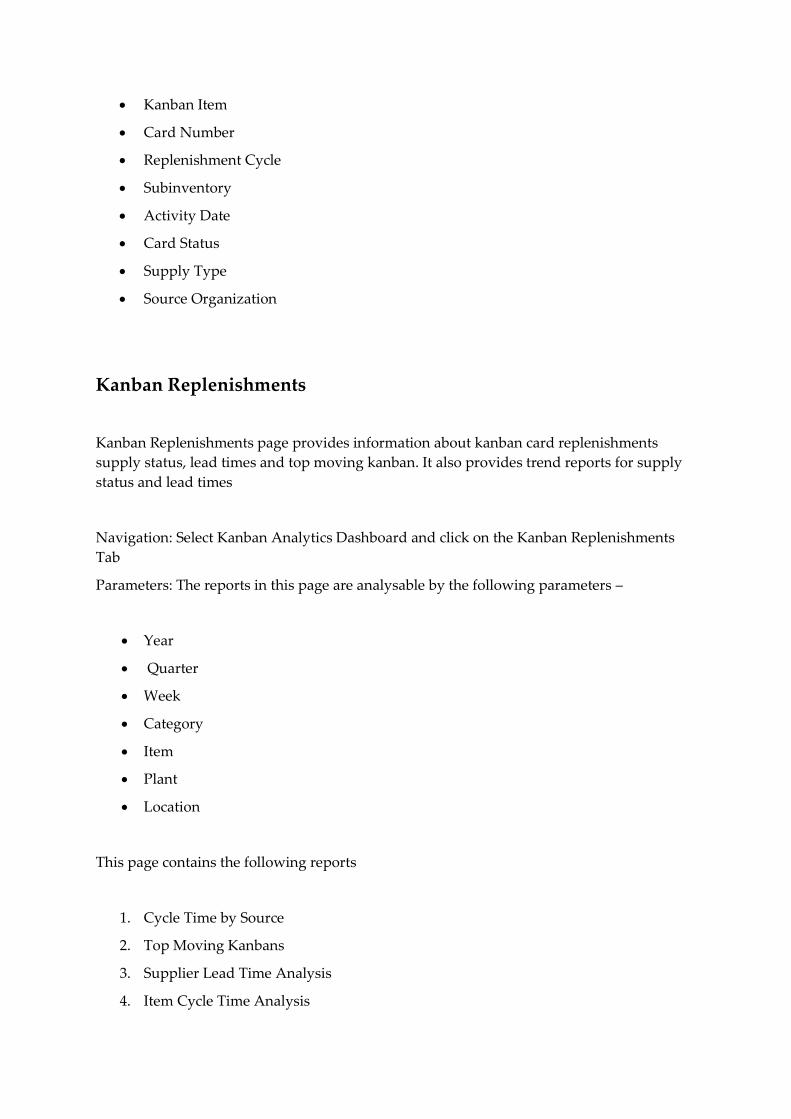
Kanban Item
Card Number
Replenishment Cycle
Subinventory
Activity Date
Card Status
Supply Type
Source Organization
Kanban Replenishments
Kanban Replenishments page provides information about kanban card replenishments
supply status, lead times and top moving kanban. It also provides trend reports for supply
status and lead times
Navigation: Select Kanban Analytics Dashboard and click on the Kanban Replenishments
Tab
Parameters: The reports in this page are analysable by the following parameters –
Year
Quarter
Week
Category
Item
Plant
Location
This page contains the following reports
1. Cycle Time by Source
2. Top Moving Kanbans
3. Supplier Lead Time Analysis
4. Item Cycle Time Analysis

5. Supply Status Trend
6. Source Cycle Time Trend
7. Purchase Order Details
8. Work Order Details
Cycle Time by Source:
Cycle time by source reports provides user the cycle time by source type (Inter Org, Intra
Org, Supplier, and Production). By clicking on the Source Type the user navigates to the
detail page reports (Purchase Order Details, Work Order Details report). This report
contains the following fields
Source Type
Cycle Time (in Days)
Top Moving Kanbans:
Top Moving Kanbans report provides user insight about the items that have high
replenishment rates and the average kanban size. This report contains the following fields
Kanban Item
No. of Kanban Cards
Kanban Size
No. of Replenishment Cycles
Supplier Lead Time Analysis:
Supplier Lead Time Analysis report provides user information about supplier lead times in
replenishing the kanban card. This report can be filtered on top 5 and bottom 5 suppliers. By
clicking on the Supplier the user navigates to the detail report Supplier Lead Time Analysis.
This report contains the following fields.
Supplier
Lead Time (in Days
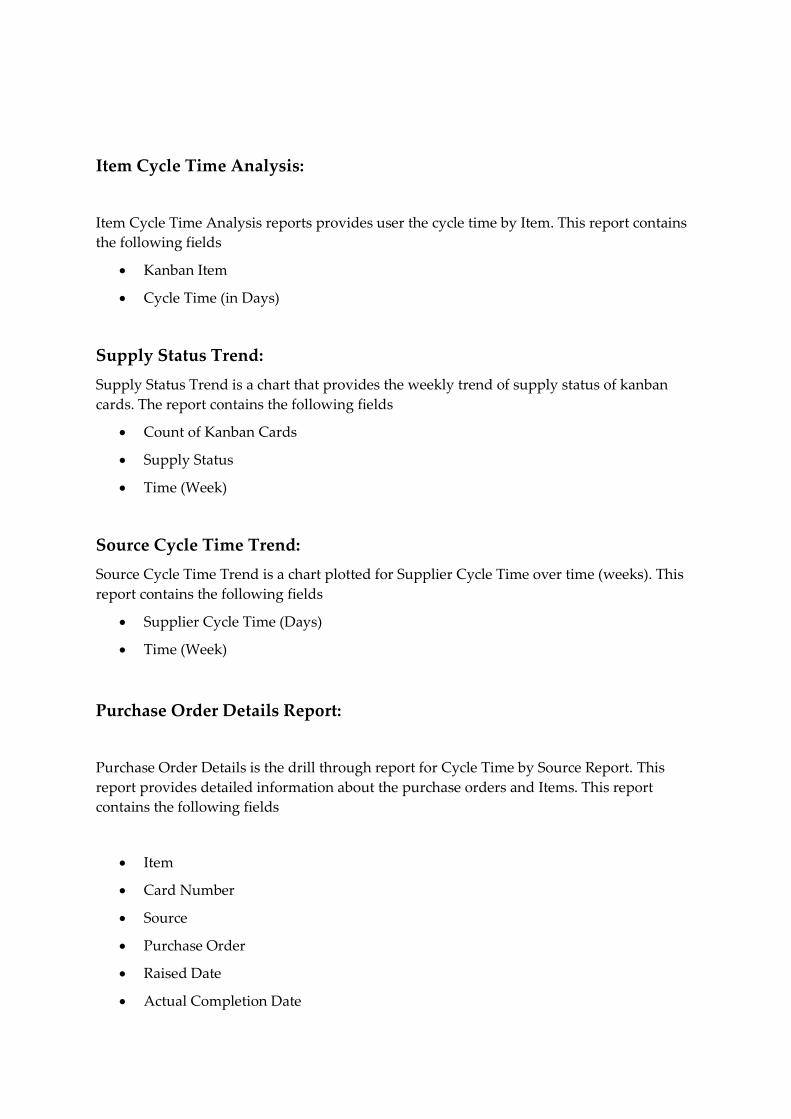
Item Cycle Time Analysis:
Item Cycle Time Analysis reports provides user the cycle time by Item. This report contains
the following fields
Kanban Item
Cycle Time (in Days)
Supply Status Trend:
Supply Status Trend is a chart that provides the weekly trend of supply status of kanban
cards. The report contains the following fields
Count of Kanban Cards
Supply Status
Time (Week)
Source Cycle Time Trend:
Source Cycle Time Trend is a chart plotted for Supplier Cycle Time over time (weeks). This
report contains the following fields
Supplier Cycle Time (Days)
Time (Week)
Purchase Order Details Report:
Purchase Order Details is the drill through report for Cycle Time by Source Report. This
report provides detailed information about the purchase orders and Items. This report
contains the following fields
Item
Card Number
Source
Purchase Order
Raised Date
Actual Completion Date
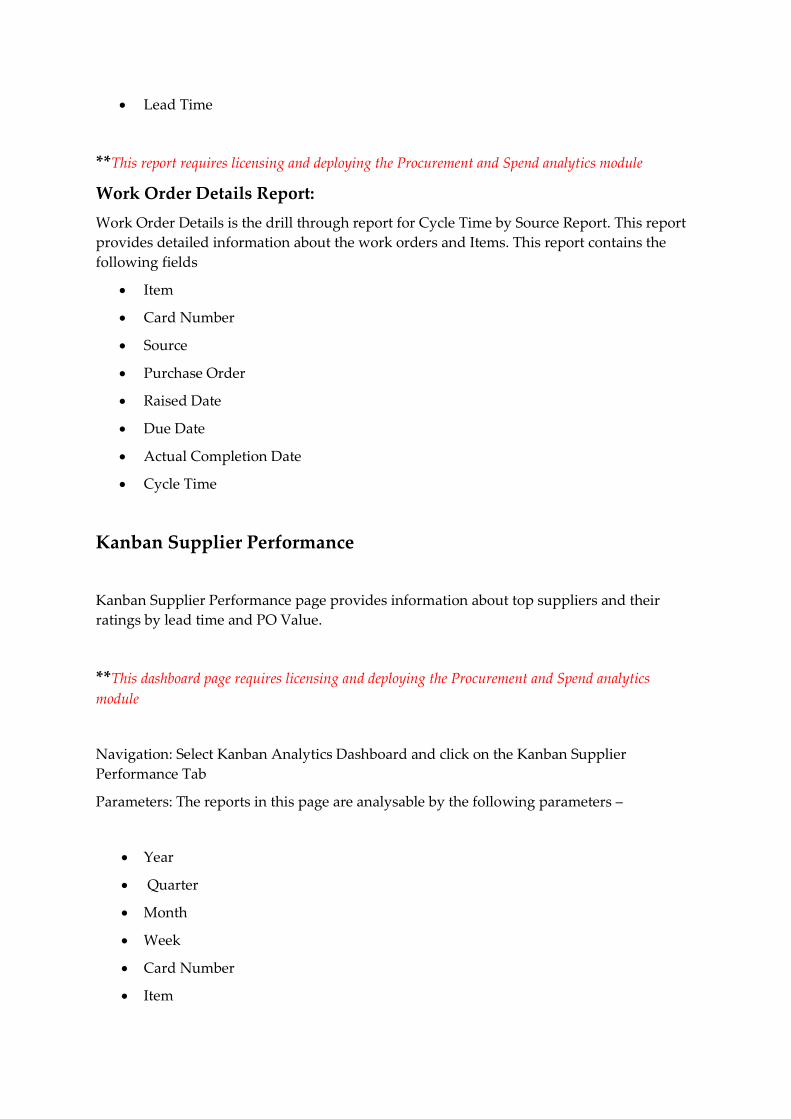
Lead Time
**This report requires licensing and deploying the Procurement and Spend analytics module
Work Order Details Report:
Work Order Details is the drill through report for Cycle Time by Source Report. This report
provides detailed information about the work orders and Items. This report contains the
following fields
Item
Card Number
Source
Purchase Order
Raised Date
Due Date
Actual Completion Date
Cycle Time
Kanban Supplier Performance
Kanban Supplier Performance page provides information about top suppliers and their
ratings by lead time and PO Value.
**This dashboard page requires licensing and deploying the Procurement and Spend analytics
module
Navigation: Select Kanban Analytics Dashboard and click on the Kanban Supplier
Performance Tab
Parameters: The reports in this page are analysable by the following parameters –
Year
Quarter
Month
Week
Card Number
Item
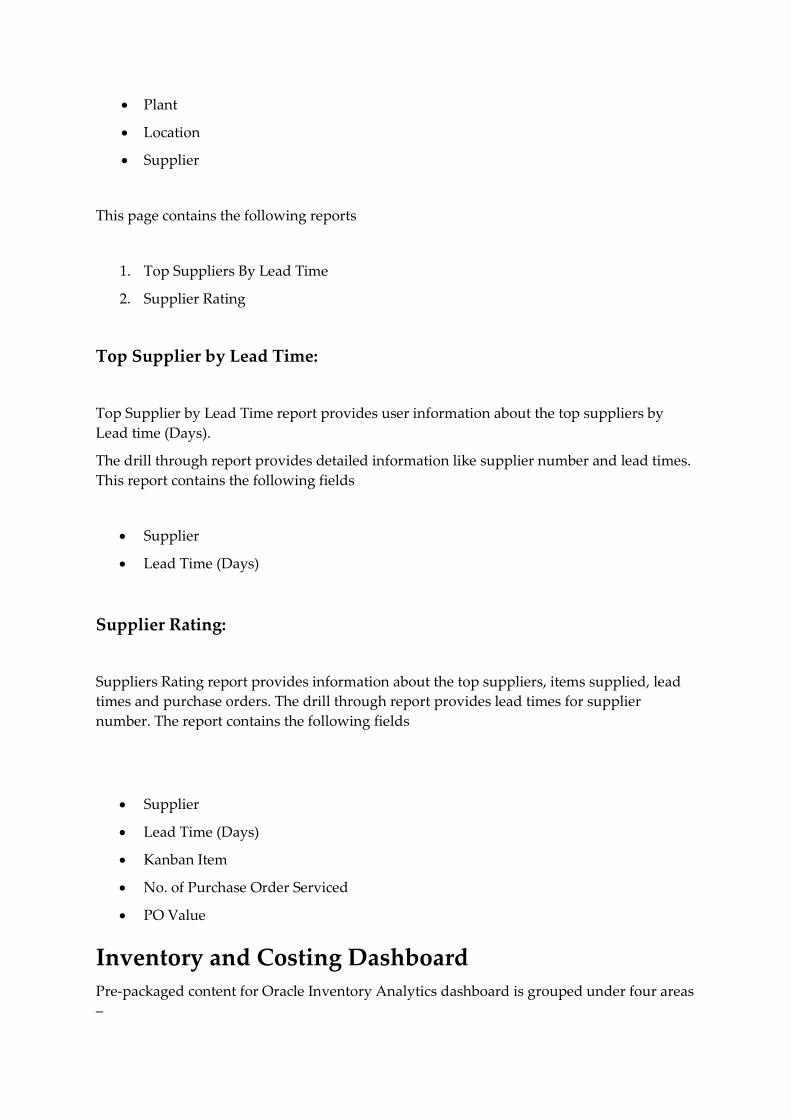
Plant
Location
Supplier
This page contains the following reports
1. Top Suppliers By Lead Time
2. Supplier Rating
Top Supplier by Lead Time:
Top Supplier by Lead Time report provides user information about the top suppliers by
Lead time (Days).
The drill through report provides detailed information like supplier number and lead times.
This report contains the following fields
Supplier
Lead Time (Days)
Supplier Rating:
Suppliers Rating report provides information about the top suppliers, items supplied, lead
times and purchase orders. The drill through report provides lead times for supplier
number. The report contains the following fields
Supplier
Lead Time (Days)
Kanban Item
No. of Purchase Order Serviced
PO Value
Inventory and Costing Dashboard
Pre-packaged content for Oracle Inventory Analytics dashboard is grouped under four areas
–
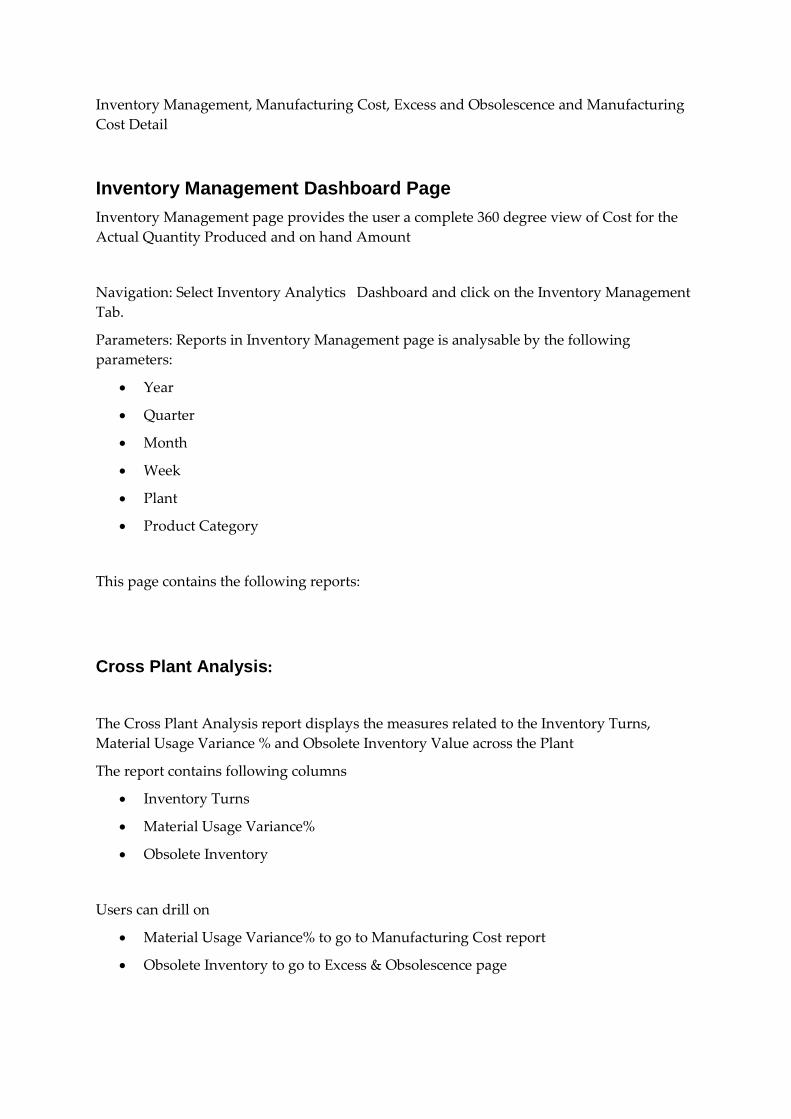
Inventory Management, Manufacturing Cost, Excess and Obsolescence and Manufacturing
Cost Detail
Inventory Management Dashboard Page
Inventory Management page provides the user a complete 360 degree view of Cost for the
Actual Quantity Produced and on hand Amount
Navigation: Select Inventory Analytics Dashboard and click on the Inventory Management
Tab.
Parameters: Reports in Inventory Management page is analysable by the following
parameters:
Year
Quarter
Month
Week
Plant
Product Category
This page contains the following reports:
Cross Plant Analysis:
The Cross Plant Analysis report displays the measures related to the Inventory Turns,
Material Usage Variance % and Obsolete Inventory Value across the Plant
The report contains following columns
Inventory Turns
Material Usage Variance%
Obsolete Inventory
Users can drill on
Material Usage Variance% to go to Manufacturing Cost report
Obsolete Inventory to go to Excess & Obsolescence page
Manufacturing Cost:
Manufacturing Cost detail report contains work order level standard and actual cost by
different cost elements and total variance.
The report has the following columns:
Work Order Number
Work Order Status
Product
Material Cost Standard
Material Cost
Material Overhead Cost Standard
Material Overhead Cost
Resource Cost Standard
Resource Cost
Overhead Cost Standard
Overhead Cost
Outside Processing Cost Standard
Outside Processing Cost
Total Cost Standard
Total Cost
Manufacturing Cost Variance
Manufacturing Cost Variance%
Cross Category Analysis:
The Cross Category Analysis report displays the measures related to the Material Usage
Variance, Inventory Turns and Obsolete Inventory Value across Product Categories
The report contains following columns
Inventory Turns
Material Usage Variance%
Obsolete Inventory

Users can drill on
Material Usage Variance% to go to Manufacturing Cost report
Inventory Turns to go to Manufacturing Cost report
Obsolete Inventory to go to Excess & Obsolescence page
Inventory Analysis:
The Inventory Analysis report helps user to have summary level information about the On-
Hand Inventory Value, Intransit Value and WIP Value across the Plant and Product
Category View by option.
The report contains following columns
On- Hand Inventory Value
Intransit Value
Wip Value
Users can drill on On-Hand Inventory value to go to the On-Hand Inventory by Item page
for further analysis.
On-Hand Inventory by Item:
On-Hand Inventory by Item report contains inventory on-hand quantity and value by item.
The report has the following columns:
Plant
Product Number
On-Hand Quantity
On-Hand Value

Manufacturing Cost
Manufacturing Cost page helps the user in analysing the measures related to manufacturing
costs. Dashboard provides cost breakup, costing trend and variances in manufacturing costs.
All the reports are for current month
Navigation: Select Inventory Analytics Dashboard and click on the Manufacturing Cost
Tab.
Parameters: Reports in Inventory Management page is analysable by the following
parameters:
Year
Quarter
Month
Week
Plant
Product Category
This page contains the following reports:
Cost Metrics:
Cost Metrics report displays the cost breakup of the total manufacturing cost
It displays the following columns:
Material Cost ITD
Material Cost
Resource Cost ITD
Resource Cost
Overhead Cost ITD
Overhead Cost
Total Cost Trend:
Total Cost Trend report displays the weekly trend of Actual Material, Resource and
Overhead Costs for the current month. The report is a graph plotted on week and Material,
Resource and Overhead Costs
Manufacturing Cost Variance:
Manufacturing Cost Variance report displays the variance (in %) for Material, Resource
Usage and Manufacturing costs for Plants
This report displays the following columns
Plant
Material Usage Variance %
Resource Usage Variance %
Manufacturing Cost Variance %
Excess & Obsolescence
The Excess & Obsolescence Summary page helps the user get complete information about
the Excess & Obsolescence Inventory. This page also helps the User to analyse the report
either by Organization (where the production activity is taking place) or by Product
Category (the category of the item produced).
Navigation: Select Inventory Analytics Dashboard and click on the Excess & Obsolescence
Tab.
Parameters: The reports in this page are analysable by the following parameters -
Year
Quarter
Month
Week
Plant
Product Category
Item Number
This page contains the following reports -
Excess Inventory:
The Excess Inventory report displays the number of items which are stored in the inventory
in excess of the current demand quantity
The report has following columns:
Item Number
Demand
On-Hand Inventory Value
Excess
Obsolete Inventory:
The Obsolete Inventory report displays the Value of Physical Inventory onhand which is
obsolete and displays for each item, the days since Expired
The report has following columns:
Item Number
Obsolete Inventory
Days since Expired
User can drill on Obsolete Inventory measure in this report to go to the Obsolete Inventory
by Item page for further analysis.
Obsolete Inventory by Item:
The Obsolete Inventory report displays the Value of inventory obsolete and days since
expired
The report has following columns:
Item Number
Plant
Item Name
Obsolete Inventory
Days since Expired
Obsolete Inventory:
Obsolete Lot Inventory report displays the Value of Physical Inventory on hand which is
obsolete and displays for each item and lot, the days since expired
The report has following columns:
Item Number
Lot Number
Obsolete Inventory
Days since Expired
User can drill on to Obsolete Inventory measure in this report to go to the Obsolete
Inventory by Lot page for further analysis.
Obsolete Inventory by Lot:
The Obsolete Inventory by Lot report displays the Value of inventory obsolete and days
since expired
The report has following columns:
Plant
Lot Number
Item Number
Item Name
Obsolete Inventory
Days since Expired

Manufacturing Cost Detail
This page provides the user detailed information of all the manufacturing costs and their
variances
This page contains the following reports -
Manufacturing Cost Details:
The manufacturing cost details report displays all the manufacturing costs for the workorder
and product
Copyright © 2012, Oracle and / or its affiliates. All rights reserved. http://www.oracle.com