SURFACTANT AND ADHESIVE FORMULATIONS FROM ALKALINE BIOMASS EXTRACTS · 2013-12-01 · representing...
103
SURFACTANT AND ADHESIVE FORMULATIONS FROM ALKALINE BIOMASS EXTRACTS By Matthew Baxter A thesis submitted in conformity with the requirements for the degree of Master of Applied Science Department of Chemical Engineering and Applied Chemistry University of Toronto © Copyright by Matthew Baxter 2012
Transcript of SURFACTANT AND ADHESIVE FORMULATIONS FROM ALKALINE BIOMASS EXTRACTS · 2013-12-01 · representing...

SURFACTANTANDADHESIVEFORMULATIONSFROMALKALINEBIOMASSEXTRACTS
By
MatthewBaxter
AthesissubmittedinconformitywiththerequirementsforthedegreeofMasterofAppliedScience
DepartmentofChemicalEngineeringandAppliedChemistry
UniversityofToronto
©CopyrightbyMatthewBaxter2012

ii
SurfactantandAdhesiveFormulationsfromAlkalineBiomassExtracts
MatthewBaxter
MasterofAppliedScience
DepartmentofChemicalEngineeringandAppliedChemistryUniversityofToronto
2012
ABSTRACT
This work studies the ability to produce effective surfactant and adhesive
formulations using surface active biological material extracted from different
biomass sources using alkaline extraction methods. Two urban waste biomass
sourceswereusedtoproducesurfactants,ReturnActivatedSludge(RAS),andsolid
Urban Refuse (UR). The third biomass source investigated was isolated mustard
protein(MP).RASandMPextractswereinvestigatedforadhesiveproduction.
Theresultsindicatethatextractsfromthewastebiomasssources,RASandUR,can
becombinedwithacommercialsurfactant,sodiumdioctylsulfosuccinate(AOT),to
producesurfactantswithlowinterfacialtensionsagainstvariousoils.Thesehighly
surface‐activeformulationswereshowntobeusefulintheremovalofbitumenfrom
contaminatedsand.

iii
RAS and MP showed potential as protein‐based wood adhesives. These sources
wereusedinadhesiveformulationstoproduceastrongbondstrengthunderlow‐
pressure,ambientpressingconditions.
iv
ACKNOWLEDGEMENTS
I would first like to thank my supervisor, Dr. Edgar Acosta, for his guidance
throughout the course of this project. His advice, encouragement, and positive
attitudetowardsthisworkwerecrucialtothesuccessfulcompletionofthisthesis,
and to my progress as a researcher. His ability to stay calm during challenging
moments is a particular characteristic thatmade it a pleasure to have him asmy
advisor.IwouldalsoliketothankDr.FlorYunuenGarciaBecerraforherguidance
in starting the project, Dr. Grant Allen for use of his laboratory, and Dr. Levente
Diosady and Dr. Enzo Montoneri for providing essential materials for the
experimentalwork.
I want to acknowledge the Ontario Ministry of Research and Innovation for the
financialsupportinpursuingthisdegree.
I would also like to show my appreciation for my fellow researchers at the
LaboratoryofColloidandFormulationEngineering(LCFE)fortheirdiscussionand
assistance in the laboratory: Americo Boza, Johanna Chan, Oliver Chung, Sumit
Kiran, SuniyaQuraishi, andZihengWang. Mysummerstudents,BritonWellsand
FrancisChoi,deserveaspecialmentionfortheirdedicationandhardwork.Iwould
like to acknowledge the staff of the Chemical Engineering and Applied Chemistry
Departmentfortheirhelpwithalladministrativematters.

v
TABLEOFCONTENTS
ACKNOWLEDGEMENTS......................................................................................................... iv
TABLEOFCONTENTS ............................................................................................................. v
LISTOFTABLES......................................................................................................................vii
LISTOFFIGURES .................................................................................................................. viii
CHAPTER1 Introduction ................................................................................................... 1
1.1 OverviewandObjectives .....................................................................................................11.2 References ................................................................................................................................6
CHAPTER2 Surfactantformulationsofalkalineextractsfromreturn
activatedsludgeandurbanrefuse,anduseinheavyoilremoval.......................... 8
2.1 Abstract .....................................................................................................................................82.2 Introduction.............................................................................................................................92.3 MaterialsandMethods...................................................................................................... 122.3.1 Materials ........................................................................................................................................... 122.3.2 Methods ............................................................................................................................................ 13
2.4 ResultsandDiscussion...................................................................................................... 192.4.1 Results ............................................................................................................................................... 192.4.2 Discussion ........................................................................................................................................ 34
2.5 Conclusion ............................................................................................................................. 42References ........................................................................................................................................ 44
CHAPTER3 Woodadhesiveformulationusingalkalineextractsfromreturn
activatedsludgeandmustardprotein ...........................................................................47
3.1 Abstract .................................................................................................................................. 473.2 Introduction.......................................................................................................................... 483.3 MaterialsandMethods...................................................................................................... 533.3.1 Materials ........................................................................................................................................... 533.3.2 Methods ............................................................................................................................................ 53
3.4 ResultsandDiscussion...................................................................................................... 563.4.1 Results ............................................................................................................................................... 563.4.2 Discussion ........................................................................................................................................ 66
3.5 Conclusion ............................................................................................................................. 743.6 References ............................................................................................................................. 75
CHAPTER4 ConclusionandRecommendations ......................................................784.1 Conclusion ............................................................................................................................. 784.2 RecommendationsforFuturework.............................................................................. 80
Nomenclature .........................................................................................................................83
APPENDIXCalculationsandDiagrams...........................................................................84

vi
CriticalMicelleConcentrationCalculation............................................................................ 84BitumenRemovalAnalysis ......................................................................................................... 87ElementalAnalysisConcentrations ......................................................................................... 89CalculationofBeta(β)ParameterforRASAOTMixture ................................................. 90References ........................................................................................................................................ 94

vii
LISTOFTABLES
Table2‐1ElementalanalysisofRASalkalineextractandUrbanRefuse(UR)extracts
............................................................................................................................................................... 19
Table2‐2–ElementalandheavymetalanalysisforRASextractandURextracts,
expressedas(g/l).Allmeasurementsarenormalizedto1g/LofTOC ............... 20

viii
LISTOFFIGURESFigure2‐1‐Concentrationvs.SurfaceTensiongraphsforalkalinewasteextracts;
a)RAS,b)FORSUD,andc)CV365............................................................................................ 22
Figure2‐2–SurfaceTensionvs.concentrationcurvesforwastebio‐basedsurfactant
mixtures,containing40%bio‐basedsurfactant(a)RAS,b)FORSUD,c)CV365),
and60%AOTbyvolume ........................................................................................................... 25
Figure2‐3‐Interfacialtensionsforwastebio‐surfactantsmixedwithAOT,witha
constantmixtureconcentrationof1gTOC/L.Bio‐basedsurfactant%isinterms
ofvolume(v/v).NOTE:ThepHwasnotcontrolledforthesemixtures.ThepH
valuesat40%bio‐surfactantforRAS,FORSUD,andCV365were10.82,7.92,
and7.53respectively.TestsforRASwerelaterconductedat40%solution
adjustedtopH7,andtheIFTagainsttoluenewassimilar(0.18mN/m). ............ 27
Figure2‐4‐IFTof40%FORSUD,60%AOTatincreasedtotalmixture
concentrations................................................................................................................................ 30
Figure2‐5–OilremovaltestsforRAS‐AOT,FORSUD‐AOT,andAOTat1g/L.a)20µL
oftolueneused(T:B0.4,b)60µLtolueneused(T:B1.2).Soilaged1month ... 32
Figure2‐6–Soilaged12months,solutionmixedfor3minutes.60µLoftoluene
used(T:B1.2).Surfactantmixturesconcentrationsof1g/L...................................... 34
Figure3‐1‐Reactionbetweenglutaraldehydeandprotein(Wong,1993) ................... 50
Figure3‐2–ViscosityversusshearratecurvesforMPandRASsolutionsthatwere
treatedwithglutaraldehyde(GL)andheattreatment(HT).GL1indicates1%
wt.glutaraldehyde.a)MPsolutionsweremadewith7.5%MustardProtein,and
b)RASwith45%solidRAScontent...................................................................................... 57
Figure3‐3‐ShearstrengthofMPadhesivewith15%MPand0.5%GLandpre‐heat
treatmentforvariousperiodsoftime.HT1means1hour,HT2is2hours,etc.
Sampleswerepressedfor18hoursunderadeadweight,forapressureof
8.6kPa................................................................................................................................................. 59

ix
Figure3‐4–ShearstrengthforMPadhesivescontaining15%,25%,and40%
(labeledMP15,MP25,MP40),withglutarldehyde(GL)mixedin‐situ.Samples
werepressedfor1hourunderadeadweightwithapressureof8.6kPa. .......... 61
Figure3‐5–SheartestresultsforRASformulations.Theformulationsunderwent
pre‐heattreatment(HT),additionofglutaraldehyde(GL),orweremixedin‐situ
withglutaraldehyde(IM).Sampleswerepresseddownfor18hoursunder
8.6kPa................................................................................................................................................. 63
Figure3‐6‐DSCthermogramofunmodifiedMustardSeedProteinIsolate(MP)and
MPcross‐linkedbywith2%glutaraldehydew/w(MPGL2),andwith0.5%
glutaraldehydeand18hoursofheattreatmentat80°C(MPGL0.5HT18) .......... 65

1
CHAPTER1 Introduction
1.1 OverviewandObjectives
Thisthesisfocusesontheuseofmultiplerenewablebiomasssourceswithsurface
active compounds to produce effective surfactant and adhesives formulations.
Surface active material can be recovered from renewable feedstock using simple
alkalineextractionmethods tohelpaddressagrowingneed fornatural,bio‐based
productsinthesurfactantandadhesivesindustries(McCoy,2008).Twosourcesof
waste biomass were explored for surfactant production and formulations
development; Return Activated Sludge (RAS), a by‐product of biologically treated
municipalwastewater,andUrbanRefuse(UR)fromsolidwastetreatmentfacilities.
Surfactantswereproduced fromRASandURusingalkalineextractionmethods to
collect a heterogenous mixture of surface active biopolymers. Adhesives were
produced from RAS, and mustard protein (MP) extracted from mustard seed, a
renewablefoodcrop.Theabilitytoextractthesurface‐activematerialsfromthese
sourcesusingalkalinemethodshasalreadybeenestablished(Garcia‐Becerraetal.
2010a;Quagliottoetal.,2006,Marnoch&Diosady,2006).Themainpurposeofthis
workwastouse thematerialsextracted fromrenewablebiologicalsources,waste
and non‐waste, and develop strategies for optimizing their formulations as
surfactantsandadhesives.

2
Return Activate Sludge is an abundant source of organic matter, containing
microorganisms and exopolymeric substances that the microbes secrete. It is
primarily made up of proteins, polysaccarides, and lipids (Frolund et al., 1996).
Someof thematerials exhibit important surface‐activeproperties,whichhave the
potentialtobeharvestedforvariousindustrialapplications.Developingavarietyof
uses from thematerial extracted fromRAScanbeuseful in reducing the costand
environmental impactof itsdisposal (Kroiss,2004). Currentuses forRAS include
fertilizerandfuelproduction(Boocok,1992). RecentworkonRASwasconducted
todevelopa simpleandefficientalkalineextractionmethod for recoveringahigh
yield of the organic material. This extract was shown to have surface‐active
capabilities, with the potential to be used in surfactant or adhesive production
(Garcia‐Becerraetal.,2010b;Garcia‐Becerraetal.,2012).
Work has also been done to demonstrate the potential surfactant properties of
solublebiopolymeric substances (SBP) thatwere isolated fromurban refuse (UR)
compost(Quagliottoetal.,2006;Montonerietal.,2009;Montonerietal.,2010).The
SBPsextracted frommunicipal solidwaste siteswere shown to lower surface the
tension of aqueous solutions, and possibly formmicelles. Similarly to RAS, these
wastes have a complex chemical composition, containing a mixture of molecules
representing the remnants of fats, proteins, polysaccharides and lignin. Green
urbanwasteswerecompostedforvariousperiodsoftime,andthedecayedorganic
matterwasextractedandtestedforsurfaceactivity(Montonerietal.,2010).

3
Akeyobjectiveforthisworkwastoimprovethesurfaceactivityoftheextractsfrom
thesewastebiomasssources,RASandUR,bymixingwithahydrophobicsynthetic
surfactant to balance the hydrophilic‐lipophilic nature of themixture, and reduce
the interfacial tension (IFT) against oils that reflect a variety of industrial
applications. Biosurfactant and synthetic surfactant mixing had been explored
beforewithmicrobiallyproducedbiosurfactants,suchasRhamnolipids(Nguyenet
al., 2008; Nguyen & Sabatini, 2011). Previous work with UR waste extracts
indicated potential synergies with the synthetic surfactant, sodium dioctyl
sulfosuccinate (AOT), as indicated by interfacial tension results of the mixtures
againsthexane(Montoneri,2010).Thisworkwillexplorethepotentialsynergiesof
RAS and UR extracts against multiple oils with varying hydrophobicities, and in
theiruseintheremovalofheavyoil(bitumen)fromcontaminatedsandparticles.
Formulationsofwoodadhesivesweredevelopedusing twobiomass sources,RAS
andmustardprotein (MP).AlthoughMP isnotawastebiomass, thisworksimply
demonstrates another potential use for biological material extracted from a
renewablebiomasssourceviaasimplealkalineextractionmethod.
Adhesiveshavebeenproducedfromavarietyofbiologicalsources.Protein‐based
adhesiveswere commonly used in the early 1900s, with protein sources such as
animal bones and hides, milk (casein), blood, fish skins, and soybeans (Frihart,
2005). Carbohydrate‐based adhesives have also been produced (Baumann, &
Conner, 2003). Protein‐based adhesives have beenmodified to improve strength

4
and moisture resistance, with much of the work being focused on soy proteins.
Thesemodificationsincludeproteindenaturingandcross‐linking(Hettiarachchyet
al.,1995;Kalapathyetal.,v1995;Wangetal.,2007).
Mustardprotein(MP)isisolatedfrommustardseed,afoodcropthatisproducedin
abundance, and contains a similar amino acidmake up to soy protein, indicating
similarabilitiestobeusedasanadhesive(Xuetal.,2003;Aideretal.,2012). RAS
andMPhavebeen shown tohavewoodadhesion capabilitiesunderhot, dry, and
high pressure bonding conditions (Garcia‐Becerra et al., 2012). However, hot
pressingisanenergyintensiveprocess,andadhesivesthatrequiretheseconditions
toformstrongbondshavelimitedapplications,suchasplywoodproduction.
In this work, modifications were introduced in the formulations of RAS and MP
basedadhesivestoenhancetheirabilitiestoformbondsunderambientconditions
and low pressure. These modifications included an optimization of the
concentration of protein and cross‐linking agent, and the introduction of heat
treatmentmethods. Protein cross‐linking is awell knownmethod for connecting
proteinstoformalargermolecule,whichcanimproveadhesivestrengthandwater
resistance(Wangetal.,2007;Reddyetal.,2008;Xiaoetal.,2010).Glutaraldehyde
is one of the most commonly used cross‐linking agents, and was used in the
formulations produced in this work. Heat treatment of formulations was
investigated to encourage the cross‐linking reaction within the adhesive
formulations.Adifferentapplicationmethodwasalsoexplored,wherebythecross‐
5
linkerwasaddedtothewoodseparatelyfromtheproteinsolutiontoallowforin‐
situcross‐linkingandimprovedwoodpenetration.
Therewerepositivefindingsonsurfactantandadhesiveformulationsinthiswork.
RAS and UR extracts showed synergies with the commercial surfactant, AOT,
resulting in mixtures with low (<1mN/m) and ultralow (<0.1mN/m) interfacial
tensions.TheRASandURformulationswithAOTwerealsoshowntobeeffectivein
bitumenremovalfromcontaminatedsand.Intheadhesivework,RASandmustard
proteinformulationswereabletoformstrongbondsunderlowpressure,ambient
bondingconditions.

6
1.2 References
Aider,M.,Djenane,D.,&Ounis,W.B.(2012).Aminoacidcomposition,foaming,emulsifyingpropertiesandsurfacehydrophobicityofmustardproteinisolateasaffectedbypHandNaCl. Int.J.FoodSci.Technol.,47(5),1028‐1036.
Baumann,M.G.D.,&Conner,A.H(2003).Carbohydratepolymersasadhesives.InA.Pizzi,&K.L.Mittal,(Eds.),HandbookofAdhesiveTechnology(pp.495‐510).NewYork:MarcelDekker.
Boocock,D.G.B.,Konar,S.K.,Leung,A.,&Ly,L.D.(1992).Fuelsandchemicalsfromsewagesludge.Fuel,71(11),1283‐1289.
Frihart,C.R.(2005).Woodadhesionandadhesives.InR.M.Rowell(Ed.),Handbookofwoodchemistryandwoodcomposites(pp.15‐273).BocaRaton,FL:CRCPress,Inc.
Frolund,B.,Palmgren,R.,Keiding,K.,&Nielsen,P.H.(1996).Extractionofextracellularpolymersfromactivatedsludgeusingacationexchangeresin.WaterRes.,30(8),1749‐1758.
GarciaBecerra,F.Y.,Acosta,E.J.,&Allen,D.G.(2010a).Alkalineextractionofwastewateractivatedsludgebiosolids.Bioresour.Technol.,101(18),6983‐91.
GarciaBecerra,F.Y.,Allen,D.G.,&Acosta,E.J.(2010b).Surfactant‐likeproperties
ofalkalineextractsfromwastewaterbiosolids.J.SurfactantsDeterg.,13,261‐271.
Garcia‐Becerra,F.Y.,Acosta,E.J.,Allen,D.G.(2012).Woodadhesivesonalkaline
extractsfromwastewaterbiosolidsandmustardprotein.J.Am.OilChem.Soc.,89(7).1315‐1323.
Hettiarachchy,N.S.,Kalapathy,U.,&Myers,D.J.(1995).Alkali‐modifiedsoyproteinwithimprovedadhesivesandhydrophobicproperties.J.Am.OilChem.Soc.,72(12),1461‐1464.
Kalapathy,U.,Hettiarachchy,N.S.,Myers,D.,&Hanna,M.A.(1995).Modificationofsoyproteinsandtheiradhesivepropertiesonwoods.J.Am.OilChem.Soc.,72(5),507‐510.
Kroiss,H.(2004).Whatisthepotentialforutilizingtheresourcesinsludge?WaterSci.Technol.,49(10),1‐10.
Marnoch,R.,&Diosady,L.L.(2006).Productionofmustardproteinisolatesfromorientalmustardseed(BrassicajunceaL.).J.Am.OilChem.Soc.,83(1),65‐69.
7
McCoy,M.(2008,January21,2008).Greenercleaners.ChemicalandEngineeringNews,86(3),15‐23.
Montoneri,E.,Boffa,V.,Savarino,P.,Perrone,D.G.,Montoneri,C.,Mendichi,R.,Acosta,E.J.,&Kiran,S.(2010).Behaviourandpropertiesinaqueoussolutionofbiopolymersisolatedfromurbanrefuse.Biomacromolecules,11,3036‐3042.
Montoneri,E.,Boffa,V.,Savarino,P.,Perrone,D.G.,Musso,G.,Mendichi,R.,Chierotti,M.R.,&Gobetto,R.(2009).Biosurfactantsfromurbangreenwaste.ChemSusChem,2(3),239‐247.
Nguyen,T.T.,&Sabatini,D.A.(2011).Characterizationandemulsificationpropertiesofrhamnolipidandsophorolipidbiosurfactantsandtheirapplications.Int.J.Mol.Sci.,12(2),1232‐1244.
Nguyen,T.T.,Youssef,N.H.,McInerney,M.J.,&Sabatini,D.A.(2008).Rhamnolipidbiosurfactantmixturesforenvironmentalremediation.WaterRes.,42,1735‐1743.
Quagliotto,P.,Montoneri,E.,Tambone,F.,Adani,F.,Gobetto,R.,&Viscardi,G.(2006).Chemicalsfromwastes:compost‐derivedhumicacid‐likematterassurfactant.Environ.Sci.Technol.,40(5),1686‐1692.
Reddy,N.,Tan,Y.,Li,Y.,&Yang,Y.(2008).Effectofglutaraldehydecrosslinkingconditionsonthestrengthandwaterstabilityofwheatglutenfibers.Macromol.Mater.Eng.,293(7),614‐620.
Wang,Y.,Mo,X.,Sun,S.,Wang,D.(2007).Soyproteinadhesionenhancebyglutaraldehydecrosslink.J.Appl.Polym.Sci.,104(1),130‐136.
Xiao,Z.,Xie,Yanjun,X.,Militz,H.,Mai,C.(2010).Effectofglutaraldehydeonwaterrelatedpropertiesofsolidwood.Holzforschung,64,483‐488.
Xu,L.,Lui,F.,Luo,H.,&Diosady,L.L.(2003).Productionofproteinisolatesfromyellowmustardmealsbymembraneprocesses.FoodRes.Int.,36(8),849‐856.
8
CHAPTER2 Surfactantformulationsofalkalineextractsfromreturnactivated
sludgeandurbanrefuse,anduseinheavyoilremoval
2.1 AbstractThepotentialsynergismbetweenbio‐basedsurfactants,producedfromthealkaline
extraction of waste biomass, and a synthetic surfactant was assessed. This
synergismwasexplored in termsof surfaceand interfacial tension reduction, and
the ability of mixtures to remove heavy oil from oil‐bearing sand. The waste
biomass sources investigatedwere return activated sludge (RAS) frommunicipal
wastewater fromToronto,Canada, andUrbanRefuse (UR)matter frommunicipal
solidwaste compost treatment facilities inPiemonte, Italy. Surfactants fromboth
sourceswereextractedusingalkalineextractionmethods.ThereweretwoURbased
surfactantsinvestigated,whichcamefromdifferenttypesofurbanwastefeedstock.
Mixturesofthesewastebio‐basedsurfactantswiththesyntheticsurfactant,sodium
dioctyl sulfosuccinate (AOT), at a total concentration of 1gTOC/L, were able to
achieve low interfacial tensions (<1mN/m)with toluene and hexane,without the
addition of electrolytes. The mixtures generally achieved IFTs an order of
magnitude below that of the pure bio‐based surfactant. At an increased total
concentrationof10gTOC/L,aURextract(labeledFORSUD),mixedat40%withAOT,
reachanultra‐low IFTof0.019mN/magainsthexane. Furthermore, theRAS‐AOT
and UR‐AOT mixtures were examined for their use in the removal of heavy oil,

9
bitumen,fromcontaminatedsand.ThelowIFTsofthemixturesprovedtobeuseful
inremovingoilfrombitumen‐coatedsandparticles.
2.2 IntroductionThe need for the development of surface‐active compounds from renewable
biological sources is growing in importance as sustainability and environmental
concernsofproducingcommercialsurfactantsfrompetroleumfeedstockcontinues
to grow. Bio‐based surfactants can be produced in a variety ofways and have a
variety of industrial applications (Lin, 2006; Rahman & Gakpe, 2008; Schramm,
Stasiuk, &Maragoni, 2003; Singh, VanHamme,&Ward, 2007; VanHamme et al.,
2006). Traditional biosurfactants can provide some advantages to synthetic
surfactants,suchaslowertoxicity,higherbiodegradability,andhighertoleranceto
pH,temperature,andsalinity(Chenetal.,2010).Theyhavebeenderivedfromthe
extraction of triglycerides, lecithin, lysolecithins, and other phospholipids from
plant and animal tissue. Traditional biosurfactants have been produced from
secretedmaterialsofmicro‐organisms.Thesematerialsincludeglycolipids,suchas
Rhamnolipidsandsophorolipids,andsaponins (Garcia‐Becerraetal.,2010a;Chen
etal.,2010).However,thereareconcernsoverthetruesustainabilityofsurfactants
derived from biomass like plants and animals, such as deforestation, and
competitive land use for food crops. Biosurfactant production from micro‐
organisms often requires relatively expensive carbon sources, which can be
alternativelyusedasfoodsourcesforanimals. Therearealsolimitationsin large‐

10
scaleproductionandpurificationefficiency(Nitschkeetal.,2005;Garcia‐Becerraet
al.,2010a).
Waste biomass is an alternative renewable source for surface‐active materials.
Surfactantsextractedfrombiologicalsourcesusingsyntheticmeansarereferredto
as bio‐based surfactants. Bio‐based surfactants can be extracted from waste
biomassthroughvariouschemicaltreatments,suchasalkalinetreatment,pyrolisis,
and simple extraction and separation (Garcia‐Becerra et al., 2010b). One of the
sources of waste biomass that this chapter explores is Return Activated Sludge
(RAS), a by‐product of biologically treated municipal wastewater, from the
Ashbridges Bay Wastewater Treatment Plant in Toronto, Canada. This is an
abundant source of organicmatter, containing various constituents such as cells,
proteins, polysaccharides, lipids, and humic substances (Garcia‐Becerra et al.,
2010c; Frolund, Keiding, & Nielsen, 1996). Identifying and exploiting a range of
value‐addedproducts from sludge canhelp reduce the environmental impact and
net cost of its disposal,which accounts for approximately 50% of total operating
costsofatypicalwastewatertreatmentplant(Kroiss,2004,Odegaardetal.,2002).
The extraction process used for RAS was developed by Garcia‐Becerra et al.
(2010b).Thiswasasimplealkalineextractioncarriedoutatroomtemperatureina
vesselexposedtoair. AtextractionpHlevelsgreaterthan12,thecellwallsofthe
micro‐organismsaredisrupted,causingcelllysis,andmostoftheorganiccontentis
liberated into the alkaline solution. The procedure collects up to 75% of the

11
sludge’s organic matter, and yields a liquor with total organic carbon (TOC)
concentrationsbetween3‐4gTOC/L(Garcia‐Becerraetal.,2010b).
Another source ofwaste biomass examined in thiswork is Urban Refuse (UR), a
sourceofdecayedorganicmaterialfrommunicipalsolidwastecompost.Surfactant
extracts from UR have been produced and examined for surface activity at the
UniversityofTorinobytheMontonerigroup,usingalabscaleprocedurecarriedout
at65°Cfor24hoursatapHof10,underanitrogenblanket(Quagliottoetal.,2006,
Montonerietal.,2010).Thefeedstockforthiscompostextractionofsurface‐active
biopolymers comes from solid urban refuse (UR) that underwent different
treatments in waste treatment facilities located in Piemonte, Italy. The extracts
wereshowntobesurfaceactive(Quagliottoetal.,2006;Montonerietal.,2009).To
further reduce interfacial tensions, UR extracts were tested in mixtures with
synthetic surfactants. Synergismswereobservedwith the commercial surfactant,
sodiumdioctylsulfosuccinate(AOT),asindicatedbylowIFTs(≈0.2mN/m)against
hexane(Montonerietal.,2010).
Thepurposeofthisworkwastofurtherevaluatethepotentialsynergismbetween
RAS and UR extracts in mixtures with the synthetic surfactant, sodium dioctyl
sulfosuccinate (AOT). This synergism was explored in terms of surface and
interfacial tension. Since RAS extract is hydrophilic in nature, and may contain
similar biopolymers to UR, it was hypothesized that it would experience similar
synergieswiththemorehydrophobicAOT.AsforURextracts,althoughinitialsigns
of synergismwith AOT have already been observed, themixtureswill be further

12
investigatedunderconditionsthataremorerelevanttoindustrialapplications.For
example, the UR extracts tested in this work were produced from a pilot scale
process, whereas previouswork used a lab scale extraction processwith slightly
differentconditions(Quagliottoetal.,2006,Montonerietal.,2010). Furthermore,
testswillbeconductedatlowerconcentrations,andwillconsideroilsthatrepresent
arangeofpotentialindustrialapplications.
It was also expected that the improved interfacial tensions of the surfactant
mixtureswouldtranslatetoimprovedperformanceintheremovaloftheheavyoil,
bitumen,fromcontaminatedsand.
2.3 MaterialsandMethods
2.3.1 MaterialsThefollowingreagentswerepurchasedfromSigma‐Aldrich(Oakville,Canada)and
used without further purification: 50% wt NaOH solution (reagent grade), for
alkaline extraction, HCl (35‐37% wt., reagent grade), hexane (HPLC grade),
hexadecane (99%+), toluene (99%+), hexadecane (99%+), NaCl (99%+), acetone
(reagent grade). Sodium Dioctyl sulfosuccinate(AOT, 96%). QC4 and high purity
Sulfur standard solutions, for ICPAESAnalysis,werepurchased fromSCPScience
(BairD’urfe,QC,Canada).

13
Cokerfedbitumen(CFB)wasdonatedbySyncrudeCanadaLtd.Thecompositionof
bitumenhasbeenreportedelsewhere(Akbarzadehetal.,2005;Kiranetal.,2009).
Washedplaysandwassievedtoameshsizeof70‐100.
2.3.2 MethodsReturnActivatedSludge(RAS)Extraction:
TheprocedureforextractingtheorganiccontentofReturnActivatedSludgefollows
that developed by Garcia‐Becerra et al. (2010b). The aerobically treated return
activated sludge (RAS) was collected from the Ashrbidges Bay Wastewater
Treatment Plant (1400 population equivalent; average capacity: 725,000m3/day;
sludge retention time: 2.5 days; aeration time: 6‐8h). The RAS sampling and
extraction tookplace inMayof 2011. RASwas collected, placed into an icebath,
transported to the lab, and left to settle for 2 hours. The clear supernatantwater
wasremovedtoreducetheamountofNaOHrequiredtoraisethepHofthesolution,
and allow for amore concentrated extract. The pH of the concentratedRASwas
thenraisedto12.6,using50%NaOHsolution,andmixedforfourhoursat500rpm
at room temperature. ThealkalineRASextractwas thenstoredat4°Candsolids
wereallowedtosettletothebottom.
UrbanRefuse(UR)Extraction:Bio‐basedsurfactantsextractedfromurbanrefusewereproducedatapilotplantin
Regione Piemonte, Italy, by the Montoneri research group at the University of
Torino. TheseURextractsarelabeledFORSUD,CV365,andash‐freeFORSUD. The

14
feedforFORSUDisaby‐productofsolidurbanwastethatwasfermentedthrough
ananaerobicdigestionprocess.CV365comesfromamixtureoffoodresiduesand
publicparkgreentrimmings,compostedaerobicallyfor365days.
The surface‐active organic material was extracted from the UR wastes using an
alkalineextraction. Thesolidwaste feedwasreactedwithNaOHfor4hat60°C,
and centrifuged. The supernatant liquidphasewas run through anultrafiltration
membranewitha5kDacutoff.Theproductwasthendriedtoyieldasolidsample
containing about 25% ash. To produce the ash‐free sample, the ash‐containing
productwas furtherwashedwithHCl ,water, hydrofluoric acid, and finallywash
withwater.Theash‐freeproductwasthendriedat60°C.
Theash‐containingandash‐freedriedsolidswere thenre‐dispersed intoaqueous
solutionsforanalysis.
ElementalAnalysis:TheTotalOrganicCarbon(TOC)contentandTotalNitrogenforRASandURextracts
weremeasuredusingaShimadzuTOC‐VCHSanalyzer(MandelScientificCompany,
Inc., Guelph, Canada). This equipment uses a non‐dispersive infrared (NDIR) gas
analyzer tomeasure the total carbon concentration in liquid samples. Potassium
hydrogenphthalatewasusedasthestandardfortheTotalCarbon(TC)calibration
curve, andwas prepared by being heated at 105°C for one hour and cooled in a
desiccator. Amixture of sodium hydrogen carbonate and sodium carbonatewas
used as the standard for developing the Inorganic Carbon (IC) calibration curve.

15
Reagent grade potassium nitrate solutionwas used as the standard for the Total
Nitrogen(TN)calibrationcurve.
The sulfur and trace metals content of the RAS and UR extracts were measured
directlyusingInductivelyCoupledPlasmaAtomicEmissionSpectrometry(ICPAES)
usingaPerkinElmerModelOptima3000DVICPAESapparatus.
SurfaceTensionMeasurements:The surface tension of RAS and UR extracts, and their mixtures with AOT, were
measuredwithaSigma700tensiometer(KSVInstruments,Helsinki,Finland)using
theDuNuoy ringmethod. Measurementswere carriedout at room temperature,
usingastabilizationtimeof10minutes.Toensureinstrumentaccuracy,thesurface
tension of deionized water (3µS/cm) was repeatedly measured under the same
conditionstoensureasurfacetensionreadingof71‐72mN/m.Thesurfacetension
ofextractsandvariousmixturesofextractandAOTwereanalyzedasafunctionof
extract concentration, in terms of mass of Total Organic Carbon (gTOC/L). The
dilutionswerepreparedusingdeionizedwater. Thecriticalmicelleconcentration
was calculated at the break point in the surface tension‐surfactant concentration
isotherm(Rosen,2004).RefertotheAppendixforfurtherexplanationandsample
calculations.

16
InterfacialTensionMeasurements:
The interfacial tension (IFT) (against hexane, toluene, and hexadecane) was
measured for the RAS extract and the Urban Refuse (UR) extracts mixed with
sodiumdioctylsulfosuccinate(AOT)atvariousratios. Nosaltwasadded,andthe
pH of the stock solutions was not adjusted. The pH for the stock RAS, FORSUD,
CV365, and ash‐free FORSUD extractswere 12.6, 8.6, 8.5, and 10.13 respectively.
For IFTsabove2mN/m, theDuNuoyringmethodwasused. For IFTs lower than
2mN/m,aspinningdroptensiometerwasused(TemcoInc.,Model500,Texas).In
thistechnique,aborosilicateglasstubewasfilledwithsurfactantmixture,anda2µL
dropletofoil(hexane,toluene,orhexadecane),wasinjectedusingaHamiltonglass
syringe(701N,10µL). Theglasstubewasspunatanappropriatespeed(RPM),at
whichtheoildropletexpandedtoapointwhereitslengthwas4timesgreaterthan
itswidth.ThewidthandRPMwerethenrecordedandusedtocalculatetheIFT(γ,
mN/m)withthefollowinggeneralequation:
(1)
In thisequation,Δρ is thedensitydifferencebetween theheavyphase (surfactant
solution) and light phase (toluene, hexane, or hexadecane) (g/mL), ω is the
rotationalvelocity(rad/s),andristhewidthoftheoildroplet(cm).Theequationis
thenconvertedtouseparametersthataredirectlyrecordedfromtheequipment:
17
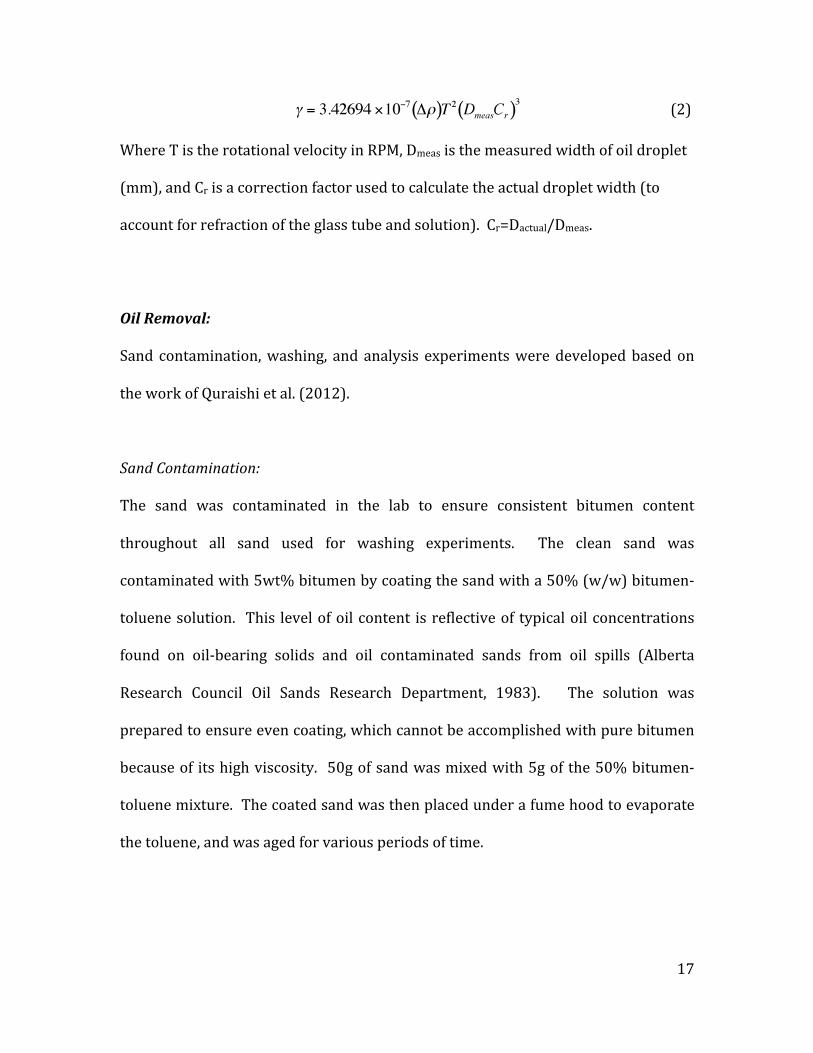
(2)
WhereTistherotationalvelocityinRPM,Dmeasisthemeasuredwidthofoildroplet
(mm),andCrisacorrectionfactorusedtocalculatetheactualdropletwidth(to
accountforrefractionoftheglasstubeandsolution).Cr=Dactual/Dmeas.
OilRemoval:Sand contamination,washing, andanalysis experimentsweredevelopedbasedon
theworkofQuraishietal.(2012).
SandContamination:
The sand was contaminated in the lab to ensure consistent bitumen content
throughout all sand used for washing experiments. The clean sand was
contaminatedwith5wt%bitumenbycoatingthesandwitha50%(w/w)bitumen‐
toluenesolution. This levelofoilcontent isreflectiveof typicaloilconcentrations
found on oil‐bearing solids and oil contaminated sands from oil spills (Alberta
Research Council Oil Sands Research Department, 1983). The solution was
preparedtoensureevencoating,whichcannotbeaccomplishedwithpurebitumen
becauseof itshighviscosity. 50gofsandwasmixedwith5gofthe50%bitumen‐
toluenemixture.Thecoatedsandwasthenplacedunderafumehoodtoevaporate
thetoluene,andwasagedforvariousperiodsoftime.

18
SurfactantWashingExperiments:1g of contaminated soil was placed in a 20mL glass scintillation vial. Varying
amountsoftoluenewereadded(5,10,15,20,or60µL)tofacilitatetheremovalof
bitumen.Thetoluenewasaddedtothevialandthenmixedfor10secondsusinga
mini vortexmixer. Then, 4mLof surfactantmixturewas added, and the vialwas
thenmixed in a VWR VX‐2500multi‐tube vortexer, for different periods of time,
ranging between 10 seconds and 3 minutes. These parameters were determined
based work by Quraishi et al. (2012), as well as preliminary tests that were
conducted to identify the challenging oil removal conditions using water. After
washing,thesampleswerecentrifugedfor20minutes,andallowedtositfor24.
OilRecoveryAnalysis:
Theamountofoil removed fromthecontaminatedsandwasdeterminedusingan
UltrospecPlusvisiblelightspectrophotometer.Afterwashing,therecoveredoiland
surfactantwashing fluidwere removedusingaglassPasteurpipette (9”), and the
remainingsandwasdriedunderafumehoodforaminimumof48hours.Thedried
sandwithresidualoilthatwasnotremovedbythesurfactantwasthencleanedwith
4mLofToluene,whichwasmixedwiththesandfor15minutes.Theassumptionis
that toluene removes all of the bitumen (Quraishi et al., 2012). For absorbance
readings, 20µL of the toluene containing the residual oilwasmixedwith another
1.5mL of toluene in an acrylic cuvette for further dilution that would allow for
absorbancereadings. Thedilutedbitumenandtoluenemixturewasthenanalyzed
forabsorbanceatawavelengthof400nm(Quraishietal.,2012). Theoil removal

19
percentagewasdeterminedbasedonpositivecontrol tests,where4mLof toluene
was used to remove all of the oil from uncleaned, contaminated sand, and the
absorbancereading fromthese tests corresponded to100%oil removal. Refer to
theappendixforaschematicofthisprocessandoilremovalequation.
2.4 ResultsandDiscussion
2.4.1 ResultsElementalAnalysis:AbasicchemicalanalysiswasperformedontheReturnActivateSludge(RAS)and
UrbanRefuse(UR)extracts;FORSUD,ash‐freeFORSUDandCV365.Table2‐1shows
the concentrations of Carbon, Nitrogen, and Sulfur (C,N,S), as well as the ratios
normalized to 1g/L of carbon. Although the overall carbon concentrations of the
concentratedextractsarequitedifferent,theN/CandS/Cratiosdonotvarymuch
betweensamples,althoughtheN/CratioappearstobeslightlyhigherforRAS.Also
note that the ratios between the filtered (ash‐free) and unfiltered FORSUD are
similar.
Table21ElementalanalysisofRASalkalineextractandUrbanRefuse(UR)extracts
ElementalConcentration(g/L) RatioSample
C N S N/C S/CRAS 3.2±0.11 0.85±0.07 0.08 0.26±0.02 0.026FORSUD 25.4±4.0 4.8±0.55 0.54 0.19±0.04 0.021CV365 32.2±5.5 4.1±0.43 0.91 0.13±0.02 0.028FORSUDash‐free 22.1±2.8 3.3±0.10 0.33 0.15±0.02 0.015
20
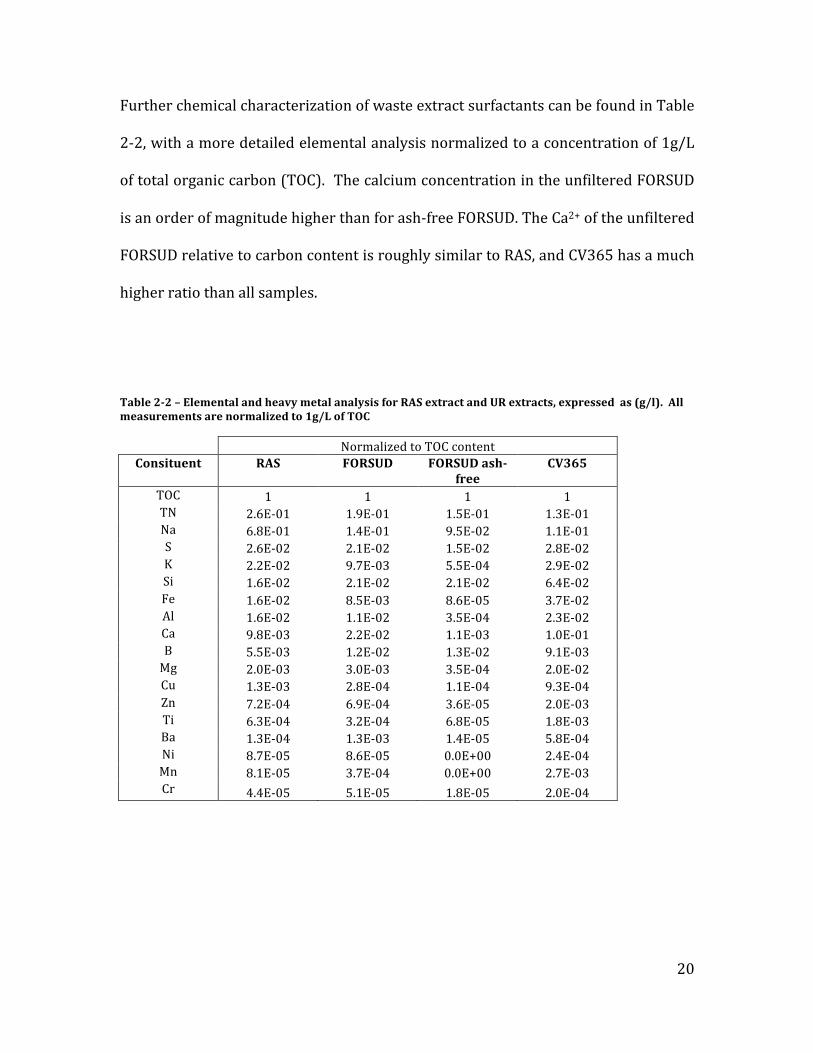
FurtherchemicalcharacterizationofwasteextractsurfactantscanbefoundinTable
2‐2,withamoredetailedelementalanalysisnormalizedtoaconcentrationof1g/L
oftotalorganiccarbon(TOC).ThecalciumconcentrationintheunfilteredFORSUD
isanorderofmagnitudehigherthanforash‐freeFORSUD.TheCa2+oftheunfiltered
FORSUDrelativetocarboncontentisroughlysimilartoRAS,andCV365hasamuch
higherratiothanallsamples.
Table22–ElementalandheavymetalanalysisforRASextractandURextracts,expressedas(g/l).Allmeasurementsarenormalizedto1g/LofTOC
NormalizedtoTOCcontentConsituent RAS FORSUD FORSUDash
freeCV365
TOC 1 1 1 1TN 2.6E‐01 1.9E‐01 1.5E‐01 1.3E‐01Na 6.8E‐01 1.4E‐01 9.5E‐02 1.1E‐01S 2.6E‐02 2.1E‐02 1.5E‐02 2.8E‐02K 2.2E‐02 9.7E‐03 5.5E‐04 2.9E‐02Si 1.6E‐02 2.1E‐02 2.1E‐02 6.4E‐02Fe 1.6E‐02 8.5E‐03 8.6E‐05 3.7E‐02Al 1.6E‐02 1.1E‐02 3.5E‐04 2.3E‐02Ca 9.8E‐03 2.2E‐02 1.1E‐03 1.0E‐01B 5.5E‐03 1.2E‐02 1.3E‐02 9.1E‐03Mg 2.0E‐03 3.0E‐03 3.5E‐04 2.0E‐02Cu 1.3E‐03 2.8E‐04 1.1E‐04 9.3E‐04Zn 7.2E‐04 6.9E‐04 3.6E‐05 2.0E‐03Ti 6.3E‐04 3.2E‐04 6.8E‐05 1.8E‐03Ba 1.3E‐04 1.3E‐03 1.4E‐05 5.8E‐04Ni 8.7E‐05 8.6E‐05 0.0E+00 2.4E‐04Mn 8.1E‐05 3.7E‐04 0.0E+00 2.7E‐03Cr 4.4E‐05 5.1E‐05 1.8E‐05 2.0E‐04

21
SurfaceTension:Garcia‐Becerra et al. (2010b)observed thatRASextractdisplayed surface activity
similar to that of commercial surfactants. Upon increasingRAS concentration, the
surface tension reduced from 72mN/m to about 35‐40mN/m beyond the critical
micelle concentration (CMC). Surface activity has also been reported for Urban
Refuseextracts(Montonerietal.,2010).ThesurfacetensionforRAS,FORSUD,and
CV365extractsstudied in thisworkarepresented inFigure2‐1,whichshowsthe
surfacetensionversustheconcentrationoftheextract,measuredingramsperlitre
ofTotalOrganicCarbon(TOC).

22
Figure21Concentrationvs.SurfaceTensiongraphsforalkalinewasteextracts;a)RAS,b)FORSUD,andc)CV365
y=‐8.742ln(x)+42.078R²=0.98079
303540455055606570
0.1 1 10 100SurfaceTension(mN/m
)
Concentration(gTOC/L)
a)RAS
303540455055606570
0.1 1 10 100SurfaceTension(mN/m
)
Concentration(gTOC/L)
b)FORSUD
303540455055606570
0.1 1 10 100SurfaceTension(mN/m
)
Concentration(gTOC/L)
c)CV365

23
The concentration of RAS extract was 3.2±0.11gTOC/L, and was diluted with
deionizedwater. ThepHwasnotcontrolled in thesemeasurements,butprevious
testshaveshownthattheextractmaintainsitssurfaceactivityoverawiderangeof
pH(Garcia‐Becerraetal.,2010c).Asreportedinthemethodssection,thepHforthe
stock RAS, FORSUD, and CV365 extracts were 12.6, 8.6, and 8.5 respectively.
FORSUDandCV365werealsodiluted,butfrommuchhigherstockconcentrationsof
TOC,asreportedinTable2‐1. Thecriticalmicelleconcentration(CMC)oftheRAS
solution was calculated as the concentration beyond which, the surface tension
becomes constant (Rosen, 2004), and in this case, equal to 39.5mN/m (Refer to
AppendixforCMCcalculation). TheCMCforRASwascalculatedtobe1.34gTOC/L.
Thesurfacetensions forFORSUDandCV365solutionscontinuedtodecreasewith
increasing concentration, but without a clear sign of becoming constant, thus no
CMCwasreportedfortheseURextracts. Theminimumsurfacetensionsrecorded
were 47.7 mN/m at 24.5 gTOC/L for FORSUD, and 50.0 mN/m at 32.2 gTOC/L for
CV365. Note that these measurements were based on dynamic surface tensions
measuredovera10minuteperiod. Previousreports forsimilarURextractswere
abletoreportCMCs,basedonsurfacetensionsmeasuredovera200minuteperiod
(Quagliottoetal.,2006;Montonerietal.,2010).Thisadditionaltimeallowsforthe
extracttoadsorbtotheair‐waterinterfaceandreachequilibrium,whichcanleadto
lower surface tension and CMC values. The 10‐minute surface tension
measurements in this work was selected to produce measurements that are
relevant to the time scale of cleaning processes, and use amethodology thatwas
24
consistentwith the surface tensions and CMCmeasurements previously reported
forRAS(GarciaBecerraetal.,2010c).
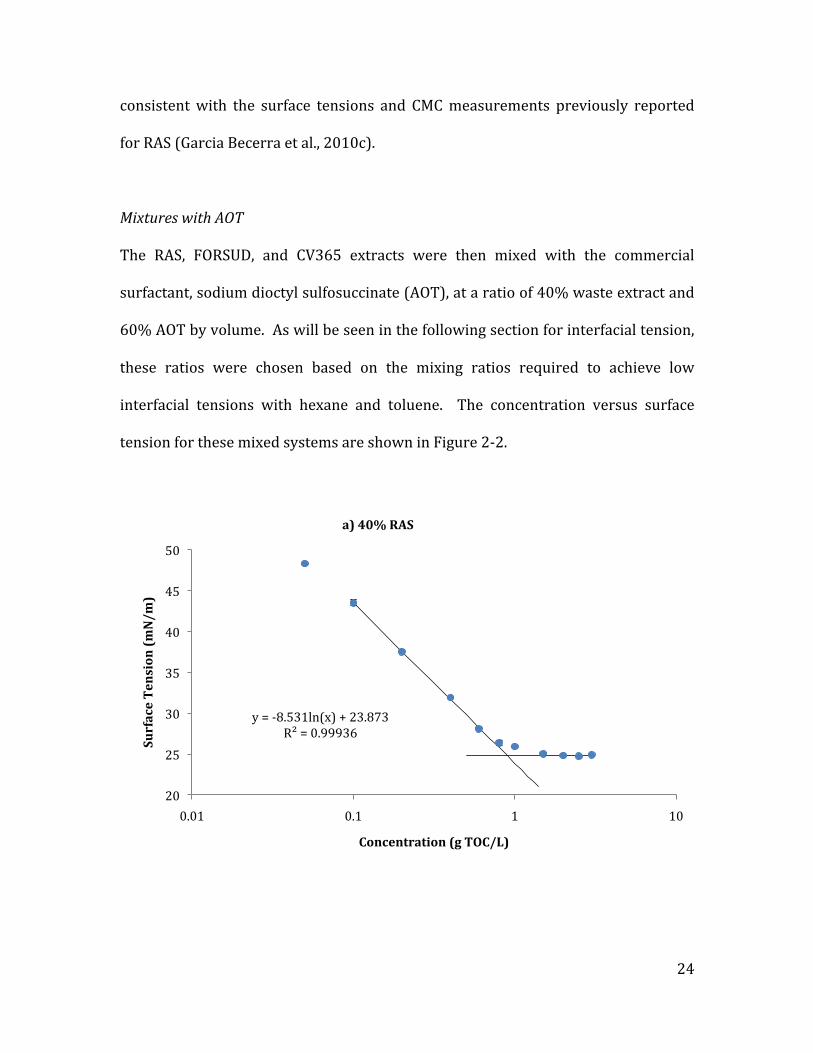
MixtureswithAOT
The RAS, FORSUD, and CV365 extracts were then mixed with the commercial
surfactant,sodiumdioctylsulfosuccinate(AOT),ataratioof40%wasteextractand
60%AOTbyvolume.Aswillbeseeninthefollowingsectionforinterfacialtension,
these ratios were chosen based on the mixing ratios required to achieve low
interfacial tensions with hexane and toluene. The concentration versus surface
tensionforthesemixedsystemsareshowninFigure2‐2.
y=‐8.531ln(x)+23.873R²=0.99936
20
25
30
35
40
45
50
0.01 0.1 1 10
SurfaceTension(mN/m
)
Concentration(gTOC/L)
a)40%RAS

25
Figure 22 – Surface Tension vs. concentration curves for waste biobased surfactant mixtures,containing40%biobasedsurfactant(a)RAS,b)FORSUD,c)CV365),and60%AOTbyvolume
y=‐7.937ln(x)+28.574R²=0.9998
20
25
30
35
40
45
50
0.01 0.1 1 10
SurfaceTension(mN/m
)
Concentration(gTOC/L)
b)40%FORSUD
y=‐6.975ln(x)+25.738R²=0.99903
20
25
30
35
40
45
50
0.01 0.1 1 10
SurfaceTension(mN/m
)
Concentration(gTOC/L)
c)40%CV365

26
These figures yield results that show much closer resemblance to commercial
surfactants,with surface tensions becoming constant at an identifiable CMC. The
CMC for the 40% RAS mixture was calculated to be 0.89 gTOC/L, with a surface
tensionof24.8mN/m.The40%FORSUDmixtureyieldedaCMCof1.66gTOC/Lwith
asurfacetensionof24.6mN/m,and40%CV365hadaCMCof1.26gTOC/Lat24.1
mN/m.
InterfacialTensionandMixtureswithAOT:The ability for the waste biomass alkaline extracts to mix with the synthetic
surfactant, sodiumdioctyl sulfosuccinate (AOT), to reduce the interfacial tensions
against various oilswas explored. RAS has not been tested for this synergism in
previousstudies. UrbanRefuseextracts,similartotheonesusedinthiswork,but
producedatalabscale,weretestedformixtureswithAOTandSDBSagainsthexane,
only. Figure 2‐3 shows the interfacial tension measurements of extract‐AOT
mixtures,atatotalsurfactantconcentrationof1gTOC/L.Theuseoftolueneasatest
oil helps asses the use of these alkaline extracts in the removal/recovery of
bituminous(heavy)oilsthathaveasimilarhydrophobicitytothatoftoluene(Kiran
etal,2009).Hexaneandhexadecane,ontheotherhand,areoilsthatarerelevantto
theextractionofaliphaticlightcrudeoils(Acostaetal,2012)

27
Figure 23 Interfacial tensions for waste biosurfactants mixed with AOT, with a constant mixtureconcentration of 1gTOC/L. Biobased surfactant% is in terms of volume (v/v). NOTE: The pHwas notcontrolled for thesemixtures.ThepHvaluesat40%bio‐surfactant forRAS,FORSUD,andCV365were10.82,7.92,and7.53respectively.Tests forRASwere laterconductedat40%solutionadjustedtopH7,andtheIFTagainsttoluenewassimilar(0.18mN/m).
0
1
2
3
4
0 20 40 60 80 100
InterfacialTension(mN/m
)
%Biobasedsurfactant
a)RASandAOTHexane
Toluene
Hexadecane
0
1
2
3
4
0 20 40 60 80 100
InterfacialTension(mN/m
)
%Biobasedsurfactant
b)FORSUDandAOT
HexaneTolueneHexadecane
0
1
2
3
4
0 20 40 60 80 100
InterfacialTension(mN/m
)
%Biobasedsurfactant
c)CV365andAOT
Hexane
Toluene
Hexadecane

28
The stock solutions of RAS, FORSUD, and CV365 were diluted to 1gTOC/L using
deionized water. The IFTs were measured against Toluene, Hexane, and
Hexadecane.TheleftsideofFigure2‐3representspureAOTat1gTOC/L,andthefar
right represents pure waste bio‐based surfactant, RAS, FORSUD, or CV365, at
1gTOC/L.Asexpected,theIFTsforpureAOTarelessthanthatofthepureRASand
UR surfactants. For Toluene, Hexane, and Hexadecane, the IFTs for pure AOT at
1gTOC/Lwere1.65, 2.97, and2.22mN/m respectively.RAS at 1gTOC/Lhad IFTsof
12.8,12.2,and11.5mN/m,FORSUDhad16.4,17.1,and18.9mN/m,andCV365had
17.3,22.0,and19.9mN/m,respectively.
Figure 2‐3 shows how the IFT of the RAS, FORSUD, and CV365were affected by
mixingwithAOT. MixingwithAOTdecreased IFTs significantly in comparison to
thebio‐basedsurfactants(alkalineextracts)ontheirown.Atcertaincompositions,
themixturereachedIFTsagainsttolueneandhexanethatwerelowerthanforpure
AOT. Thiseffectwasnotasevidentforhexadecane,buttheIFTswerestillgreatly
reducedfromthatofthepureRASandURsurfactants.ThelowestIFTobservedfor
RASmixtureswas0.18±0.017mN/magainsttoluene,at40%RAS.FORSUDreached
a low IFT of 0.60 0.01mN/m against toluene, and 0.75 0.096mN/m against
hexane.CV365reachedthelowestIFTofthewastebiomassextractswithavalueof
0.13±0.028mN/magainsthexane.RASandUrbanRefusemixtureswithAOTat1g/L
consistently converge to a low IFT at mixtures of approximately 40% bio‐based
surfactantbyvolume.

29
TheIFToftheash‐freeFORSUDwasalsomeasuredinmixtureswithAOTinvarious
proportions to determine if the removal ofminerals had any effect on interfacial
activity.TheIFTswereonlymeasuredagainsthexane.Thesolutionthatcontained
40%ash‐freeFORSUD,at1gTOC/L,achievedanIFTof2.28mN/m.Thisismorethan
doublethelowIFTfortheoriginalFORSUDmixtureagainsthexane,whichreached
alowIFTof0.75mN/m.
The interfacial activity of the 40% FORSUD mixture was also investigated as a
functionoftotalsurfactantconcentration.Figure2‐4showstheinterfacialtension
againsttoluene,hexane,andhexadecanefortotalconcentrationsofupto10gTOC/L.
TheIFTagainsthexadecanewas2.2mN/mat1gTOC/L,anddecreasedto0.42mN/m
ataround8gTOC/L. TheIFTagainsttoluenedecreasedfrom0.60mN/mtoalowof
0.15mN/m. The most significant change occurred for hexane. The IFT was
1.1mN/mat1gTOC/L,anddecreasedto0.019mN/mat10gTOC/L,whichisintheultra
lowIFTrange(<0.1mN/m).

30
Figure24IFTof40%FORSUD,60%AOTatincreasedtotalmixtureconcentrations
RemovalofBitumenfromcontaminatedsand:ThegoalforthesetestswastodetermineifthelowIFTsforthebio‐basedsurfactant
andAOTmixturescouldresultineffectiveremovalofbitumenfromsand.Toluene
wasusedasasolventtoaidinoilrecoverybyreducingtheviscosityofthebitumen
coating thesand. Theamountof tolueneaddedandagitationtimewerevaried to
providecleaningconditionsofdifferentdifficulties. Thesetestswerealsodoneon
soilthatwascontaminatedandthenagedforalongerperiodoftime(12months)to
determineiftheformulationscouldstillbeeffectiveinremovingoilfromagedsand
samples.
Testswerefirstdoneonsoilaged1month,withlowlevelsofsolventtocomparethe
performanceof40%RAS(1gTOC/L)andwater. Thesetestsusedlessthan20µLof
toluene (toluene to bitumen ratio of 0.4 by w/w), which proved to be difficult
0.01
0.1
1
1 10
InterfacialTension(mN/m
)
Concentration(gTOC/L)
40%FORSUD
Hexane
Toluene
Hexadecane
31
cleaningconditionsforbothwaterandsurfactantmixtures.When10µLoftoluene
was used, the 40% RASAOTmixture recovered 35.6 0.07% of the oil, and the
water provided no measurable oil recovery. Although this was not excellent
recovery, these results indicated the potential for bio‐based surfactant and AOT
mixtures, with much lower IFTs than water, to be advantageous in oil recovery
underchallengingextractionconditions.Additionaltestswerethenconductedwith
increasedamountstolueneandagitationtimes.Figure2‐5showsoilrecoverytests
performedusingRAS‐AOT,FORSUD‐AOT,andAOTfordifferentperiodsoftimeand
differenttolueneamounts.Thesetestswereperformedonsoilthatwasagedfor1
month.Theadditionof20µLoftoluenerepresentsasolventtobitumenratio(T:B)
of0.4,and60µLoftoluenerepresentsaT:Bratioof1.2.

32
Figure25–OilremovaltestsforRASAOT,FORSUDAOT,andAOTat1g/L.a)20µLoftolueneused(T:B0.4,b)60µLtolueneused(T:B1.2).Soilaged1month
0102030405060708090100
0 10 20 30 40 50 60 70
OilRem
oval(%)
MixingTime(Seconds)
A)20uLToluene(T:B0.4)
Water
40%RAS
40%FORSUD
AOT
0102030405060708090100
0 10 20 30 40 50 60 70
OilRem
oval(%)
MixingTime(Seconds)
b)60uLToluene(T:B1.2)
Water
40%RAS
40%FORSUD
AOT

33
At20µLoftolueneand10secondsofmixing,thereisasignificantadvantageforthe
surfactantmixtures,achieving65‐75%oilremoval,overwater,with15.1%removal.
This trend continues through to 60 seconds, as the cleaning ability for the
surfactantsappearstoplateauataround85%oilremoval,andwaterreaches62.3%.
The1g/LRAS‐AOTmixtureappears tocleanslightlybetter thantheFORSUD‐AOT
mixtureandAOTat30seconds,andat60secondstheRASandFORSUDmixtures
bothperformbetter thanpureAOT (P<0.05). Similar testswere conductedusing
60µL of toluene, providing a similar trend butwith amuch higher oil removal of
about 98% for all surfactant formulations,with no significant difference between
them, and a closer recovery performance ofwater, but still noticeably inferior oil
removalatlowmixingtimes(P<0.05).
Testswerealsocarriedoutwith40%RAS,FORSUD,andCV365mixtureswithAOT,
as well as pure AOT, for soil that was aged for a longer period of time after
contamination.Figure2‐6showstheresultsforsoilaged12months.Theseresults
show that thebitumenbecomesmoredifficult to removewith increasedaging, as
60µL (T:B of 1.2) was required for meaningful cleaning results. However, the
surfactantmixturecontinuestorecovertheoilconsiderablybetterthanwater.The
surfactantmixturesshowedsimilarremovalcapabilitiestoeachother,witharange
of92‐95%recovery.

34
Figure 26 – Soil aged 12 months, solution mixed for 3 minutes. 60µL of toluene used (T:B 1.2).Surfactantmixturesconcentrationsof1g/L
2.4.2 DiscussionSurfaceTension:
TheshapeoftheRASgraphinFigure2‐1indicatesbehaviourthatissimilartothat
expectedwithconventionalsurfactants.Thesurfacetensionoftheextractremains
constant beyond a certain concentration, indicating the formation ofmicelles and
thepresenceofacriticalmicelleconcentration(CMC). TheCMCof1.34gTOC/Lfor
thisparticularRASextractionwasconsistentwiththatreportedbyGarcia‐Becerra
etal.(2010c),whichisencouragingconsideringthepotentialforthecompositionof
theRAStovaryfromyeartoyear,aswellaswithintheyearfromseasontoseason.
Thesurfacetensionwasclosertotheextractionthattookplaceduringthesimilar
timeofyear(springof2008,ST=37.2mN/m).
0102030405060708090100
Water 40%RAS 40%FORSUD 40%CV365 AOT
OilRem
oval(%)
Soilaged1year(60uLtoluene)

35
ThesurfacetensionversusconcentrationgraphsshowninFigure2‐1fortheUrban
Refuse extracts, FORSUD and CV365 showed signs of surface activity as
demonstrated by the reduction of surface tension with increased concentrations.
However, the surface tension did not become constant, and CMC could not be
readilyidentified,aswouldbeexpectedforaconventionalsurfactant.
The surface tension for RAS on its ownwas comparable to that of a commercial
surfactant,sodiumdodecylbenzenesulfonate(SDBS),witharangeof30‐35mN/m.
However, RAS has amuch higher CMC compared to the 25mg/L CMC of SDBS in
salinesolution(Rosen,2004).TheCMCoftheAOTusedfortheseexperimentswas
0.77gTOC/L,andasurfacetensionof26mN/m.RASalsocompareswelltootherbio‐
based surfactants, such as sodium lignosulfonates, reported to havemuch higher
CMCs of 5‐10g/L, and surface tension of 42‐45mN/m (Askvik, Are Gundersen,
Sjoblom, Merta, & Stenius, 1999). The dynamic surface tensions achieved with
FORSUDandCV365morecloselyresembledthevaluesreportedforhumicmaterial,
with CMC of 8g/L and surface tension of 48mN/m (Guetzloff & Rice, 1994). As
mentionedintheresultssection,previousworkhasreportedlowersurfacetensions
and CMCs for UR extracts (Montoneri et al., 2010). The surface tension
measurements in those testswere taken for200minutes, allowingmore time for
theURcomponentstoadsorbtothesurfaceandreachequilibrium.Theprocedure
formeasuringsurfacetensioninthisworkinvolvedmeasuringtheURextractsfor
only10minutes,andmaynothaveallowedformaximumsurfaceadsorption.

36
When theUR samplesweremixedwith the synthetic surfactant,AOT, the surface
tensionisothermshowedtheclassicalbreakpointusedtodeterminetheCMCofthe
mixture.WhenRASwasmixedwithAOT,theCMCofthemixturewasslightlylower
than that of RAS alone, and the surface tension after the CMCwas lowered to 25
mN/m.Thegraphsofthethreewastebio‐basedsurfactantsshowedsimilarsurface
tensions, and similar rangesofCMCs. TheFORSUDmixturehad thehighestCMC,
then CV365, and RAS had the lowest. When the RAS, FORSUD, and CV365were
mixedwithAOT,asshowninFigure2‐2,thesurfacetensionsbecamecomparableto
thoseofconventionalmicrobiallyproducedbiosurfacants(Lin,1996).
The loweredsurfacetensionsof thewastebio‐basedsurfactantswhenmixedwith
AOT may suggest some synergism. The CMC for RAS‐AOT was lower than RAS
alone,whiletheFORSUDandCV365didn’tapproachaCMCbeforebeingmixedwith
AOT.However,thiscouldalsobeanindicationofAOTbeingthedominantfactor,as
theCMCandSTscloselyresembletheresultsachievedforAOTalone.
The CMC of surfactant mixtures has been modeled using a combination of the
pseudo phase separation model and regular solution theory by Rubingh (1979),
suchthat:
and

37
Where thecmci is theCMC foreach individual surfactant, cmc* is theCMC for the
mixture,αi is themolar fractionofeachsurfactant in thebulkphase,andxi is the
molarfractioninthemicelle.Theβparameterrepresentsthenatureofinteractions
between the two surfactants, and is the key parameter of interest. Themodel of
RubinghwasusedtodescribeandfittheCMCobtainedfortheRAS‐AOTmixturein
Figure2‐2. Aβvalueof‐0.216wascalculatedfortheRAS‐AOTsurfactantmixture
(Refer to the Appendix for calculations). The negative value is an indication of
synergistic interactions between RAS and AOT, and the formation of a mixed
micelle. Thisβ value is comparable to other anionic‐anionic surfactantmixtures,
and is relatively smallwhencompared toβ values foranionic‐nonionic surfactant
mixtures,whichrangebetween‐1.6and‐4(Rosen,2004;Joshietal.,2005).
InterfacialTensionofmixtureswithAOT:ThepotentialsynergiesbetweenURextractsandAOTwerepreviouslyobservedby
Montonerietal.(2010),buttheextractsevaluatedinthatworkwereproducedata
labscaleandwere testedathigherconcentrations (10‐13g/L). Thesamplesused
for the tests in this paper were produced in pilot plant facilities, suggesting the
potential scalability forproducing the formulationsdescribed in thiswork. Itwas
interesting to see the same type of interaction take place with RAS, which is a
differenttypeofwastebiomass,andwasextractedusingadifferenttypeofalkaline
extraction method. The IFTs against Hexane for CV365 decreased below that of

38
hexadecane and toluene as it approached a low value at a composition of 40%
CV365. The RAS‐AOT mixtures achieved the lowest IFT with toluene, which
suggeststhattheCV365mixturehasahigheraffinityforhexane.
Urban Refuse waste surfactants have been mixed with the anionic commercial
surfactant,sodiumdodecylbenzenesulfonate(SDBS),inpreviouswork(Montoneri
etal.,2010).SDBSwasabletolowertheIFTmixturebelowthatoftheURextract
surfactants, but did not lower the IFT to levels below that of pure SDBS. The
synergistic effect was not quite as strong as with AOT. Urban refuse extracts in
mixture with AOT from these previous tests were able to achieve IFTs within a
rangeof0.26‐0.30mN/magainsthexane(Montonerietal.,2010).
The IFTs for RAS, FORSUD, and CV365 when mixed with AOT were generally
decreased by one order ofmagnitude. This was especially the case for RAS and
toluene,wheretheIFTcameclosetoreachingultra‐lowIFTs(<0.1mN/m),whichis
an indication that the mixture would possibly be useful for environmental
remediationorenhancedoilrecovery.Thisdrasticdifferencewasalsoobservedfor
bio‐surfactant/syntheticsurfactantmixturescontainingRhamnolipidbio‐surfactant
and anionic alkyl propoxylated sulfate surfactants. However, with a better
performingbio‐surfactantandtheuseofoptimalsalinitylevels,ultralowIFTvalues
of 0.035 mN/m and 0.033 mN/m against toluene and hexane were obtained
(Nguyenetal.,2008).TheRASandURextractmixturesdidnotreachultralowIFTs
atatotalconcentrationof1gTOC/L.

39
However,when40%FORSUDmixturewas increased to10gTOC/L, aspresented in
Figure 2‐4, an ultra low interfacial tension of 0.019mN/m was achieved against
hexane. This is lower than the Rhamnolipidmixtures prepared by Nguyen et al.
(2008).ItisalsomuchlowerthantheIFTof0.26mN/machievedbyFORSUD‐AOT
mixtures at 10g/L in previous work by Montoneri et al. (2010), which uses a
FORSUDextractproducedfromaslightlydifferentextractionprocessperformedat
a lab scale. However, caution must be taken in comparing the concentrations
directly. The concentration of 10g/L reported by Monteri et al. (2010) was
measured in termsofmassofdriedextractsolids,whichwerere‐dispersed in the
aqueoussolution.ThismaynotdirectlytranslatetothemassunitsofTotalOrganic
Carbon(gTOC)reportedinthiswork,asTOConlyaccountsforaportionofthetotal
solid mass. Nonetheless, the differences in IFT performance could suggest
differences in the chemicalmake up of the UR extracts produced in a pilot plant
facility(versuslabscale),andpotentialadvantagesusingthescaledupprocess. It
has been suggested that changes in the chemical nature of UR extracts can have
opposite effects on surface and interfacial tension, where a more hydrophilic
substancecanyieldlowerIFT,buthigherST(Montonerietal.,2010).
An IFTcomparisonwasdonewithFORSUDandash‐freeFORSUD,againsthexane.
ThehigherIFToftheash‐freemixturewithAOTdemonstratedthatfurthermineral
(ash) separationmay be detrimental to the IFT. This could be beneficial from a
processingpointofview,aslessprocessingstepscanresultinabetterperforming
surfactant.Onemajordifferencebetweenthetwosamplesisthecalciumcontent,as
40
showninelementalanalysisinTable2‐2.TheunfilteredFORSUDcontainsover10
timesmore calcium in proportion to the amount of organic carbonpresent. This
excessinCa2+ionscouldplayaroleinneutralizinganyanionicgroupspresentinthe
solution,makingthesurfactantmorehydrophobic,whichwouldreducetheIFTwith
hydrophobicoils. TheCa2+content, inrelationtotheorganiccarboncontent,was
highest for CV365, which could be an explanation for that surfactant mixture
reachingthelowestIFTwithhexane,atatotalsurfactantconcentrationof1gTOC/L.
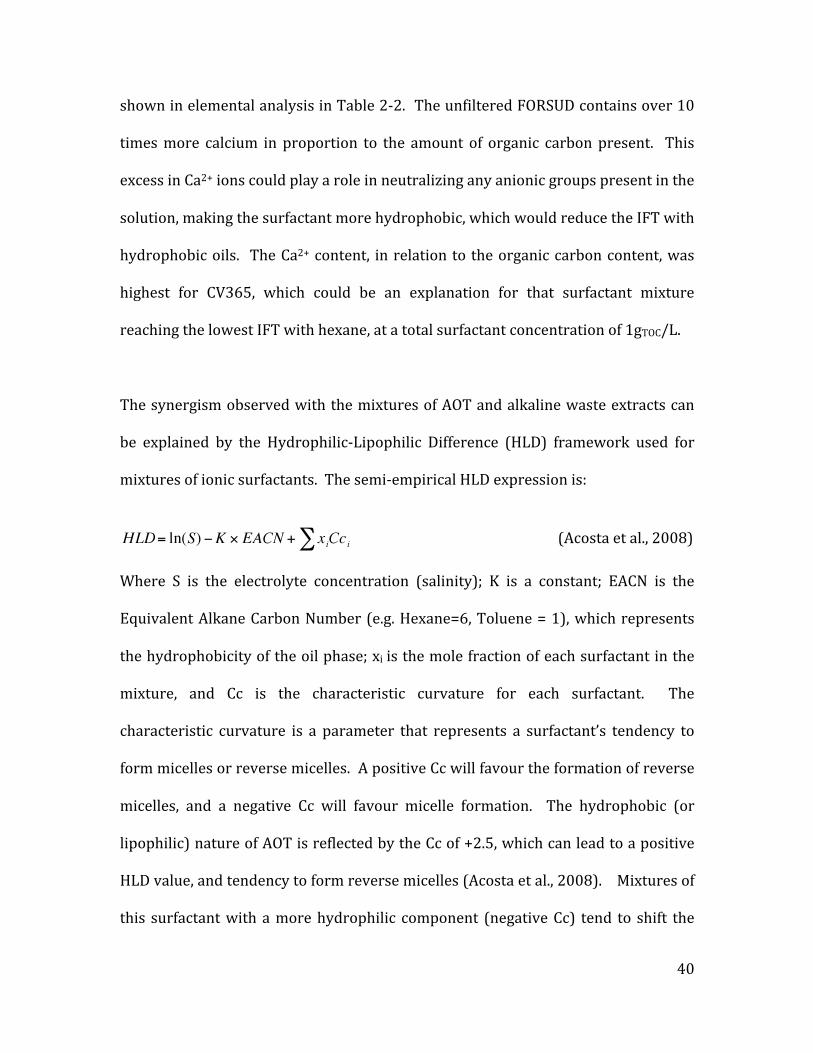
ThesynergismobservedwiththemixturesofAOTandalkalinewasteextractscan
be explained by the Hydrophilic‐Lipophilic Difference (HLD) framework used for
mixturesofionicsurfactants.Thesemi‐empiricalHLDexpressionis:
(Acostaetal.,2008)
Where S is the electrolyte concentration (salinity); K is a constant; EACN is the
EquivalentAlkaneCarbonNumber(e.g.Hexane=6,Toluene=1),whichrepresents
thehydrophobicityoftheoilphase;xi isthemolefractionofeachsurfactantinthe
mixture, and Cc is the characteristic curvature for each surfactant. The
characteristic curvature is a parameter that represents a surfactant’s tendency to
formmicellesorreversemicelles.ApositiveCcwillfavourtheformationofreverse
micelles, and a negative Cc will favour micelle formation. The hydrophobic (or
lipophilic)natureofAOTisreflectedbytheCcof+2.5,whichcanleadtoapositive
HLDvalue,andtendencytoformreversemicelles(Acostaetal.,2008).Mixturesof
this surfactantwithamorehydrophilic component (negativeCc) tend to shift the

41
valueofHLDofthemixturetowardszero,whichleadstolowerinterfacialtensions
(Acosta et al., 2003, 2012). Therefore, the synergisms observed in the IFTswith
mixtures indicate that the alkaline extracts of RAS and UR are more hydrophilic
(negativeCc),andhelpproduceanHLDthatapproacheszerowhenmixedwithAOT.
BitumenRemovalfromContaminatedSand:Theoil removal tests presented in Figure2‐5andFigure2‐6 show somepositive
results for the surfactant mixtures of waste bio‐surfactants and AOT. All tests
consistently produced improved oil removal in comparison to deionized water,
which is indicative of the performance benefits from lower interfacial tensions.
UndertheconditionsofFigure2‐5a(1monthofsoilaging,20µLtoluene,30seconds
ofmixing),40%RASwasabletoremovemorebitumenthan40%FORSUDandAOT.
Thiscouldbereflectiveofthefactthatthe40%RASmixturereachedthelowestIFT
against toluene. At a longer mixing time of 60 seconds, the 40% RAS and 40%
FORSUD formulations performed better than AOT on its own, suggesting the
potentialbenefitsofmixturesincomparisontopureAOT.
Increases in the toluene to bitumen ratio (T:B) resulted in improved oil removal,
which is consistent with previous work by Quraishi et al. (2012). This can be
explainedbyareductioninbitumenviscosity.Theteststhatusedahighertoluene
content of 60µL did not showmuch variation among the RAS and UR surfactant
mixtures,buttheydidshowbenefitscomparedtowatercleaning,especiallyatthe
lowestmixing time. This could prove to be useful in industrial processes,where
42
shorterresidencetimescanleadtoreducedcosts. Thebitumenwasmoredifficult
toremovefromsoilthatwasagedforayearaftercontamination,asdemonstrated
by loweroil removalofwater. However, theRASandURsurfactant formulations
stillperformedwellwiththeaidofaT:Bratioof1.2(60µLToluene).Althoughthe
oilrecoveryusinghigheraT:Bratiodoesnotvarysignificantlyamongthevarious
surfactantformulations,theredoesappeartobearelationshipbetweenthelowered
IFTs and the enhanced ability to remove heavy oil from sand in comparison to
water.
Althoughitwouldbeidealtonotrequireanysolvent,thereareindustrialprocesses
thatusesolventoilrecovery,suchassolvent‐aidedsteamassistedgravitydrainage
(SAGD) (Gates & Chakrabarty, 2008; El Naggar et al., 2010). SAGD uses thermal
energytoreducetheviscosityofheavyoiltoimproveitsrecovery,whichisasimilar
purpose to toluene used in these experiments. The RAS and UR surfactant
formulations could potentially be useful in reducing the amount solvent or steam
requiredfortheseindustrialoilrecoveryprocesses.
2.5 ConclusionAlkaline extracts from various waste biomass sources were used to produce
effectivebio‐basedsurfactants. Theextracts thatcontainedorganicmaterial from
Return Activated Sludge (RAS) and Urban Refuse (UR) solid waste were surface
active, and when combined with a hydrophobic commercial surfactant, AOT,
produced low interfacial tensions against toluene, hexane, and hexadecane.

43
Although this had been observed at higher surfactant concentrationswith similar
URextractsobtainedfromalabscaleprocess,similarbehaviourwasobservedwith
URsamplesobtainedfromapilotscaleprocess.ThealkalineRASextractshoweda
similar synergywithAOT, as demonstrated bymixtures that could be reduced to
lowIFTs(<1mN/m).Whenthetotalsurfactantconcentrationwasincreased,oneof
the UR surfactantmixtures reached ultra‐low IFTs against hexanewithout added
electrolyte. SynergismbetweenRASandAOTwasalso suggestedby thenegative
value of the mixed surfactant interaction parameter, β, which indicates the
formationofmixedmicelles.
The RAS and URwaste extracts inmixtureswith AOTmixtureswere effective in
bitumenremovalfromcontaminatedsand,possiblyaresultoflowIFTs. Thistype
ofbehaviorcanbeusefulforapplicationssuchassurfactantenhancedoilrecovery
andenvironmentalremediation.Furtherworkcanbedonetofurtheroptimizethe
surface activity of the extracts through the additionof salt, or by findingbiomass
sourceswithahigherlipidcontent.Thereisalsoanopportunitytotrymixingthese
wastebiomassextractswithdifferentsyntheticsurfactants,orotherbiosurfactants.
44
ReferencesAcosta,E.J.,Kiran,S.K.,Hammond,C.E.(2012).TheHLD‐NACmodelforextended
surfactantmicroemulsions.JSurfactantsDeterg.,15(4),495‐504.Acosta,E.J.,Yuan,J.S.,Bhakta,A.S.(2008).Thecharacteristiccurvatureofionic
surfactants.J.SurfactantsDeterg.,11(2),145‐158.Acosta,E.J.,Szekeres,E.,Sabatini,D.A.,Harwell,J.H.(2003).Net‐averagecurvature
modelofsolubilizationandsupersolubilizationinsurfactantmicroemulsions.Langmuir,19(1),186‐195.
Akbarzadeh,K.,Alboudwarej,H.,Svrek,W.Y.,Yarranton,H.W.(2005).AGeneralized
RegularSolutionModelforthePredictionofAsphaltenePrecipitationfromn‐AlkaneDilutedHeavyOilsandBitumens.FluidPhaseEquilibria,232,159‐170
AlbertaResearchCouncilOilSandsResearchDepartment.Somephysicalproperties
ofbitumenandoilsand,Edmonton,AB,1983.Askvik,K.M.,AreGundersen,S.,Sjoblom,J.,Merta,J.,&Stenius,P.(1999).
Complexationbetweenlignosulfonatesandcationicsurfactantsanditsinfluenceonemulsionandfoamstability.ColloidsSurf.,A,159(1),89‐101.
Chen,M.L.,Penfold,J.,Thomas,R.L.,Smyth,T.J.P.,Perfumo,A.,Marchant,R.,Banat,
I.M.,Stevenson,P.,Parry,A.,Tucker,I.,&Grillo,I.(2010).Mixingbehaviorofthebiosurfactant,rhamnolipid,withaconventionalanionicsurfactant,sodiumdodecylbenzenesulfonate.Langmuir,26(23),17958‐17968
ElNaggar,A.Y.,Saad,E.A.,Kandil,A.T.,&Elmoher,H.O.(2010).Petrolemcutsas
solventextractorforoilrecoveryfrompetroleumsludge.JournalofPetroleumTechnologyandAlternativeFuels,1(1),10‐19.
Frolund,B.,Palmgren,R.,Keiding,K.,&Nielsen,P.H.(1996).Extractionof
extracellularpolymersfromactivatedsludgeusingacationexchangeresin.WaterRes.,30(8),1749‐1758.
GarciaBecerra,F.Y.,Allen,D.G.,&Acosta,E.J.(2010a).Surfactantsfromwaste
biomass.InM.Kjellin,&I.Johansson(Eds.),Surfactantsfromrenewableresources(pp.167‐189).Chichester,UnitedKingdom:JohnWiley&Sons,Ltd.
GarciaBecerra,F.Y.,Acosta,E.J.,&Allen,D.G.(2010b).Alkalineextractionof
wastewateractivatedsludgebiosolids.Bioresour.Technol.,101(18),6983‐91.

45
GarciaBecerra,F.Y.,Allen,D.G.,&Acosta,E.J.(2010c).Surfactant‐likepropertiesofalkalineextractsfromwastewaterbiosolids.J.SurfactantsDeterg.,13,261‐271.
Gates,I.D.,&Chakrabarty,N.(2008).Designofthesteamandsolventinjection
strategyinexpandingsolventsteam‐assistedgravitydrainage.J.Can.Pet.Technol.,47(9),
Guetzloff,T.F.,&Rice,J.A.(1994).Doeshumicacidformamicelle?TheScienceof
theTotalEnvironment,152(1),31‐35. Joshi,T.,Mata,J.,Bahadur,P.(2005).Micellizationandinteractionofanionicand
nonionicmixedsurfactantsystemsinwater.ColloidsSurf.,A,260(1),209‐215.Kiran,S.L.,Acosta,E.J.,&Moran,K.(2009).Evaluatingthehydrophilic‐lipophilic
natureofasphaltenicoilsandnaphthenicamphiphilesusingmicroemulsionmodels.J.ColloidInterfaceSci.,336(1),304‐313.
Kroiss,H.(2004).Whatisthepotentialforutilizingtheresourcesinsludge?Water
Sci.Technol.,49(10),1‐10.Lin,S.C.(1996).Biosurfactants:recentadvances.J.Chem.Technol.Biotechnol..66(2),
109‐120.Montoneri,E.,Boffa,V.,Savarino,P.,Perrone,D.G.,Musso,G.,Mendichi,R.,Chierotti,
M.R.,&Gobetto,R.(2009).Biosurfactantsfromurbangreenwaste.ChemSusChem,2(3),239‐247.
Montoneri,E.,Boffa,V.,Savarino,P.,Perrone,D.G.,Montoneri,C.,Mendichi,R.,
Acosta,E.J.,&Kiran,S.(2010).Behaviourandpropertiesinaqueoussolutionofbiopolymersisolatedfromurbanrefuse.Biomacromolecules,11,3036‐3042.
Nguyen,T.T.,&Sabatini,D.A.(2011).Characterizationandemulsification
propertiesofrhamnolipidandsophorolipidbiosurfactantsandtheirapplications.Int.J.Mol.Sci.,12(2),1232‐1244.
Nguyen,T.T.,Youssef,N.H.,McInerney,M.J.,&Sabatini,D.A.(2008).Rhamnolipid
biosurfactantmixturesforenvironmentalremediation.WaterRes.,42,1735‐1743.
Nitschke,M;Costa,S.G.,&Contiero,J.(2005).Rhamnolipidsurfactants:Anupdate
onthegeneralaspectsoftheseremarkablebiomolecules.Biotechnol.Progr.,21(6),1593‐600.
46
Odegaard,H.,Paulsrud,B.,&Karlsson,I.(2002).Wastewatersludgeasaresource:
Sludgedisposalstrategiesandcorrespondingtreatmenttechnologiesaimedatsustainablehandlingofwastewatersludge.WaterSci.Technol.,46(10),295‐303.
Quagliotto,P.,Montoneri,E.,Tambone,F.,Adani,F.,Gobetto,R.,&Viscardi,G.
(2006).Chemicalsfromwastes:compost‐derivedhumicacid‐likematterassurfactant.Environ.Sci.Technol.,40(5),1686‐1692.
Quraishi,S.,Bussmann,M.,&Acosta,E.(2012).Capillarycurvesforex‐situwashing
ofoil‐coatedparticles.SubmittedtoEnergyandFuels,October2012.Rahman,P.,Gakpe,E.(2008).Production,characterisationandapplicationsof
biosurfactants‐Review.Biotechnology,7(2),360‐370.Rosen,M.J.(2004).Surfactantsandinterfacialphenomena.(3rded.,pp.379‐414).
Hoboken,N.J.:Wiley‐Interscience.Rubingh,D.N.(1979).InK.L.Mittal(Ed.)SolutionChemistryofSurfactants:Volume
1(pp.337)NewYork:PlenumPress.Schramm,L.L.,Stasiuk,E.N.,&Maragoni,D.G.(2003).2Surfactantsandtheir
applications.Annu.Rep.Prog.Chem.,Sect.C:Phys.Chem.,99,348.Singh,A.,VanHamme,J.D.,&Ward,O.P.(2007).Surfactantsinmicrobiologyand
biotechnology:Part2.Applicationaspects.Biotechnol.Adv.,25(1),99‐121.VanHamme,J.D.,Singh,A.,&Ward,O.P.(2006).Physiologicalaspects:Part1ina
seriesofpapersdevotedtosurfactantsinmicrobiologyandbiotechnology.Biotechnol.Adv.,24(6),604‐620.

47
CHAPTER3 Woodadhesiveformulationusingalkalineextractsfromreturn
activatedsludgeandmustardprotein
3.1 AbstractIn this work, the strength of adhesives formulated with protein‐rich alkaline
biomassextractswereoptimizedusingstrategiesthattookadvantageoftheprotein
cross‐linking capability of glutaraldehyde. The renewable biological resources
exploredwereReturnActivateSludge(RAS)andmustardprotein(MP),whichwere
both extracted using alkaline solutions. In one strategy,mixtures of extracts and
cross‐linking agent, glutaraldehyde, in solution were heat treated prior to their
application on wood, which resulted in modest adhesive strength improvements
overpreviouslyreported formulations. In thesecondstrategy, theglutaraldehyde
wasapplieddirectlyontothewoodseparatelyfromtheMPandRASsolutions(in‐
situmixing). Ahighshearstrengthof2.3MPawasreachedforMPadhesivewhen
glutaraldehydewasmixedinsituuponwoodapplication.RASadhesivesachieveda
high shear strength of 0.88MPa. These bond strengthswere achieved under low
pressure(8.6kPa)andambienttemperaturepressingconditions, ina60%relative
humidity environment, and showed improvements to previous RAS and MP
adhesive work under similar conditions. This work showed the potential for
protein‐basedadhesivesforwoodworkingapplicationsatambientconditions.

48
3.2 IntroductionTheneedforthedevelopmentofwoodadhesivesfromenvironmentallyfriendlyand
renewable resources continues to grow. Current commercialwoodadhesives are
primarilyderived frompetrochemical resourcesbecause theyare relatively cheap
andprovidesuperiorbondstrengthandwaterresistance(W.H.Wang,Li,&Zhang,
2008). However, concerns over the depletion of petroleum resources,
environmental issuesfromtheirextraction,healthissues,andincreasingcosts,are
leading to a growing need to develop products from inexpensive, renewable
resources with competitive adhesive performance. (Park et al., 2000; Lin &
Gunasekaran,2010).
Adhesives have been produced from awide variety of biological sources, such as
proteins from agricultural by‐products like bone meal, cow blood, soy, and red
onion skin, peanut hull, andwattle bark (Odozi & Agiri, 1986; Chen, 1982; Pizzi,
1978; Park et al., 2000; Lin & Gunasekaran, 2010; Kalapathy et al., 1995).
Polysaccharides have been used in the formulation of adhesives, as well as
microbially producedbiopolymermixtures from fermentationwastes. (Weimer et
al., 2003; Haag et al., 2004). Soy protein isolates have been heavily explored
because soybean protein adhesives were extensively used in the interior grade
plywoodproductionintheearly1900s.Theyhavesincebeensubstantiallyreplaced
bypetroleumbasedadhesives, suchasphenol‐formaldehyderesins,due tohigher
strengths and lower costs. However, with renewed interest in using sustainable
resources, protein modifications have been studied to enhance performance and

49
compete with synthetic adhesives (Frihart, 2005; Kalapathy et al., 1995,
Hettiarachchyetal.,1995).
There are some limitations with biopolymer based adhesives, such as moisture
sensitivity, thermal instability, and processing difficulties (Haag et al., 2006). In
order to address these issues, a variety of physical, chemical, and enzymatic
methods have been used to modify hydrophobicity, molecular weight, and
biopolymer conformation (Wang et al., 2008). Protein denaturing is a common
methodforenhancedperformanceofproteinbasedadhesives.Methodsusingheat
exposure,alkali/acid treatment,organicsolvents,andureahavebeen investigated
tobreakthestronginternalbondsofcoiledproteinmoleculestoallowforunfolding
and better exposure of polar groups for adhesion to wood (Wu & Inglet, 1974,
Lambuth,1994).Crosslinkingischemicalmodificationthatinvolvestwomolecular
components being joined together by a covalent bond to form a larger molecule
(Wong,1993).
Severalchemicals, suchassimpledialdehydes,haveshowntheability tocrosslink
proteins. Glutaraldehyde isoneof themostextensivelyusedcross‐linkingagents,
and it has beenused to improve themechanical properties andwater stability of
various protein basedmaterials for use in food, textile, andmedical applications
(Reddy et al., 2008; Wong, 1993). The crosslinking reaction mechanism of
glutaraldehyde is not completely understood, but the reaction results in the
connection of proteins to form a larger molecule and a more stabilized network
(Reddy et al., 2008). It has been proposed that glutaraldehyde polymerizes the

50
protein molecules through a Schiff base, whereby glutaraldehyde forms an
unsaturatedpolymerthatcross‐linkstheaminogroupsoftheproteins,asshownin
Figure3‐1. Glutaraldehydecan formpolymers in solution, inaneutralor slightly
alkalineenvironment(Wong,1993).Itisbelievedthattheaminogroupsassociated
with the amino acid, lysine, are the most reactive to aldehydes that promote
crosslinking(Lundblad,2005;Quiocho&Richards,1966). Mustardprotein,oneof
thesourcesconsideredinthiswork,isrichinlysine(Aideretal.,2012).Theuseof
glutaraldehdyehasbeenshowntoenhancetheadhesionandmoistureresistanceof
soyprotein isolate (SPI)basedadhesives, and foradhesivesbasedon thealkaline
extraction of Return Activated Sludge (Wang et al., 2007; Garcia‐Becerra et al.,
2012).
Figure31Reactionbetweenglutaraldehydeandprotein(Wong,1993)
Two biological resources were explored for adhesion optimization in this work;
ReturnActivatedSludge(RAS)andsolublemustardseedproteinisolate,whichwill
bereferredtoasmustardprotein(MP). Alkalineextractionmethodswereusedto
extractbothsources.ReturnActivatedSludgeisaby‐productofbiologicallytreated

51
municipalwastewater.Thisisanabundantsourceoforganicmaterialthatcontains
extracullar and intracellular biopolymeric substances with surface‐active
capabilities (Garcia‐Becerra et al., 2010b).Themain constituents inRAS are cells,
proteins,polysaccharides,lipids,andhumicsubstances(Frolund,Keiding,&Nielsen,
1996). Therehasbeenother adhesivework involvingheterogeneousbiopolymer
mixes (Weimer et al., 2003). Previous characterization of RAS alkaline extract
indicates that proteins and polysaccharides account for approximately 20% and
12% of the organic content, respectively (Garcia‐Becerra et al., 2010). Alkaline
extraction induces cell lysis to occur, and the liberation of organic content of the
cellsgivesthesurface‐activecharacteristicsofthefinalaqueoussolution.
The other biomass source of interest for adhesive production ismustard protein
(MP).Proteinextractedfrommustardseedhasbeenstudiedasapotentiallyuseful
source for human nutrition due to its abundance and well balanced amino acid
composition (Xu et al., 2003; Aider et al., 2012). Mustard seed ismainly used to
produce edible oil, but can contain 23‐30% protein (Alireza‐Sadeghi et al., 2006;
Newkirketal.,1997).Mustardproteinisrichinlysine,whichisimportantforcross‐
linkingwith glutaraldehyde (Aider et al., 2012;Lundblad, 2005). The isolationof
mustardproteinfromtheseedcanbecarriedoutusinganalkalineextraction.
RAS andMPwere assessed for adhesive capabilities for the first time by Garcia‐
Becerraetal.(2012).MPwasofinterestbecauseproteins,primarilysoy,havebeen
usedascommercialadhesives.RASisnotapureproteinmaterial,asitismadeup
52
ofavarietyofbiopolymers.However,itwasapparentthattheproteincomposition
withintheorganicsolidscontentplayedakeyroleinadhesiveperformance(Garcia‐
Becerraetal.,2012).Bothbiopolymersourcesshowedpotentialaswoodadhesives,
and incorporated theuseofglutaraldehydeasa cross‐linker. Glutaraldehydewas
abletointeractwithbothRASandMP.However,thehighestbondstrengthsforRAS
andMPcamefromhotpressconditions(260kPa,150°C),restrictingtheapplication
potential of these formulations to limited bonding processes such as plywood
production.
The goal of this research was to develop formulations of RAS and MP based
adhesives that could form a strong bond with wood when applied under low
pressure and ambient temperature pressing conditions. This was done through
adjustments in the RAS and MP concentrations, and cross‐linking. The idea of
encouraging the cross‐linking reaction with the use of a heat treatment on the
adhesive formulation, containing cross‐linker, before being applied to wood was
explored. Anewmethodofapplicationwasalso investigated,whereby theMPor
RAS solution was added to the wood separately from the cross‐linker,
glutaraldehyde,toallowforin‐situmixingofproteinandcross‐linker. Thegoalof
the in‐situapplicationmethodwas to formastrongcross‐linkedproteinnetwork,
whileallowingforwoodpenetration,whichisessentialforbondformation. Shear
testswereperformedtodeterminetheeffectivenessofthesetreatments.

53
3.3 MaterialsandMethods
3.3.1 MaterialsNaOHsolution(50%w/w,reagentgrade)foralkalineextractionofReturnActivate
Sludge (RAS) and glutaraldehyde solution (50% w/w, reagent grade) were
purchased from Sigma‐Aldrich (Oakville, Canada). Lyophilized mustard seed
soluble protein isolate, which will be referred to as mustard protein (MP) was
providedbyProfessorDiosady,UniversityofToronto. Maplewoodchips,cut into
2.54x10.16x0.32cmpieces,werepreparedbytheUniversityofTorontoCarpenter
Shop(UofTFacilitiesandServices,Toronto).
3.3.2 MethodsProductionofRASExtract:The procedure used for the extraction of Return Activated Sludge follows that
developed by Garcia‐Becerra et al. (2010). The aerobic return activated sludge
(RAS)wascollectedfromthemetropolitanAshrbidgesBayWastewaterTreatment
Plant (1400 population equivalent; average capacity: 725,000m3/day; sludge
retentiontime:2.5days;aerateiontime:6‐8h).TheRASsamplingandextractionfor
theseparticularstudiestookplace inMayof2011. TheRASwascollected,placed
into an ice bath, transported to the lab, and was left to settle for 2 hours. This
allowed for thebio‐solids to settle. Theclear, supernatantwater sittingon topof
the bio‐solidswas then removed. Thiswas done to reduce the amount of NaOH
required to raise the solution to the appropriate pH, andwould allow for amore
54
concentratedextract.ThepHoftheconcentratedRASwasraisedto12.6,using50%
NaOH solution, and mixed for four hours at 500rpm at room temperature. The
alkalineextract solutionwas thenstoredat4°C. Theextractwas then frozenat ‐
80°C, and lyophilized at 0.012mBar and ‐80°C, to obtain a dried powder of the
extractedRASsolids,storedatroomtemperature.
PreparationofalkalimodifiedMustardProtein:MP was produced from yellow mustard seed using a technique developed by
MarnochandDiosady(Marnoch&Diosady,2006).Theproteinwasextractedfrom
defattedyellowmustardseedatpH11,ultrafiltered,diafiltered,precipitatedatpH
5,andlyophilized.TheMPunderwentanalkalimodificationbyadjustingthepHof
a suspendedMPsolution to12,usingNaOH,and incubating it at40°C for1hour.
Thissolutionwasfrozen,lyophilized,andthenstoredatroomtemperature.
AdhesiveSamplePreparation:MPwaspreparedin15,25,and40%(allweightbasisunlessotherwisespecified).
solutionsindeionizedwater.RASwaspreparedsimilarly,butwith30%,45%,and
60%freeze‐driedsolids.TheRASandMPsolidpowderweremixedwithwaterfor
30minutes. For testswhereglutaraldehydewasadded to the formulationbefore
adhesive application, the glutaraldehyde was mixed with the solution for 30
minutes. Formulations thatwere pre‐treated before being applied towoodwere
placed inanovenat80°C(Fisher IsotempVacuumOven,Model281) in the20mL
scintillation vials the formulations were initially prepared in. All heat‐treated

55
samplescontained2gofformulation,andwereheatedbetween1and18hours.For
thetestsperformedusingthein‐situapplicationstrategy,theMPandRASsolutions
were added to one wood piece, and glutaraldehyde was added separately and
quicklymixedwiththeproteinsolutionbeforethesecondwoodpiecewaspressed
ontop.
Theadhesiveformulationswereappliedtothewoodbyplacing120mgofadhesive
toa2.54x2.54cmareaononeendofthewoodpiece(pre‐conditionedat25°Cand
60%relativehumidity(RH).Asecondpieceofwoodwasplacedontopofthearea
whereadhesivewasapplied.Thegluedpiecesweresubjectto8.6kPafor1houror
18hoursatroomtemperatureand60%RH.Thegluedpieceswereequilibratedat
roomtemperature(23‐25°C)and60%RHfor5daysbeforesheartesting.
Soakingtestswereperformedtotestmoistureresistance.Thegluedwoodsamples
weresubmergedintapwaterat23°Cfor24h. Thespecimenswerethendriedat
25°C and 60% relative humidity for 5 days before shear strength tests. This
procedure is consistent with water resistance procedure used by Wang et al.,
(2007),whichwasperformedaccordingtoASTMStandardMethodD1151‐00.
ShearStrength:The shear strength was measure from a lap shear test method, using a Sintech
Computerizedsystemfortensiletesting(Sintech20,withMTSSintechTestWorks
V2.1 Software). This equipmentmeasured the force required to break the glued

56
jointbypullingapart the twoedgesata loadingrateof1.00mm/min. Theshear
strengthatmaximumloadwasrecorded,andreportedvaluewas themeanof4‐5
specimens.
RheologicalProperties:TheviscosityofadhesiveformulationswasmeasuredusingaTAInstrumentsCarri‐
Med Rheometer (Model CSL2 500, TA Instruments Rheology Solutions Software
DataV1.2.2)usinga2cmdiameterconegeometryandvariousshearrates.
ThermalProperties:The phase transitions of cross‐linked MP was evaluated through differential
scanningcalorimetry(DSC),usingaDSCQ100(TAInstruments). Thecross‐linked
formulationswere freeze‐dried, and4‐6mgofdriedpowderwasplaced in aDSC
pan, and capped. Samples were scanned from 20 to 230°C at a heating rate of
10°C/minute.
3.4 ResultsandDiscussion
3.4.1 ResultsRheologicalPropertiesFigure 3‐2 presents the viscosity of mustard protein (MP) and RAS based
formulations, at various shear rates. The results help indicate whether or not
protein cross‐linking occurredwith addition of glutaraldehyde or heat treatment.

57
Figure3‐2showstheviscosityofMPandRASsolutionswithincreasingamountsof
glutaraldehyde, and solutions containing glutaraldehyde that were heat‐treated.
TheMPformulationsmeasuredforviscositycontained7.5%mustardprotein.
Figure 32 – Viscosity versus shear rate curves for MP and RAS solutions that were treated withglutaraldehyde (GL) and heat treatment (HT). GL1 indicates 1%wt. glutaraldehyde. a)MP solutionsweremadewith7.5%MustardProtein,andb)RASwith45%solidRAScontent.
0
50
100
150
200
250
300
350
400
0.1 1 10 100
Viscosity(Pa.s)
ShearRate(1/s)
a)MustardProteinAdhesives
MP7.5GL1
MP7.5GL2
MP7.5GL0.5HT
0102030405060708090100
0.1 1 10 100 1000
Viscosity(Pa.s)
ShearRate(1/s)
b)RASAdhesives
RAS45
RAS45GL1
RAS45GL2
RAS45GL6
RAS45GL1HT

58
At low shear rates, the viscosity of MP formulations increased by one order of
magnitude as the glutaraldehyde composition doubled from 1% to 2%. It is
apparentthatheattreatmentincreasedtheviscosityofthesolutioncontaining0.5%
glutaraldehyde. MPformulationswithnoglutaraldehdyeand0.5%glutaraldehyde
(noheat treatment) resembled the consistencyofwater, andwere too fluid tobe
accuratelymeasured by the rheometer. Although therewere no values obtained,
this in itselfwas an indication that viscosity increasedwith the addition ofmore
glutaraldehydeandheattreatment.
Althoughhigherconcentrationswereused foradhesivestrength tests (15%,25%,
45%), the addition of glutaraldehyde to these formulations formed a solid‐like
materialthatcouldnotbeappliedtothegeometryoftherheometer.However,this
anecdotaldescriptionisconsistentwiththeideathattheadditionofglutaraldehyde
increasedtheviscosityoftheMPsolutions.
TheRASformulationresultspresented inFigure3‐2balsoshowhigherviscosities
with glutaraldehyde addition andheat treatment. This trend ismore apparent at
low shear rates. However, the viscosity was not affected until a much higher
amountofglutaraldehyde,6%,wasaddedtotheformulation.
Theseresults indicatethepossibilityofproteincross‐linkingtakingplacewiththe
addition of glutaraldehyde, and the ability for heat treatment to encourage the
cross‐linking reaction with the presence of glutaraldehyde. The relationship of
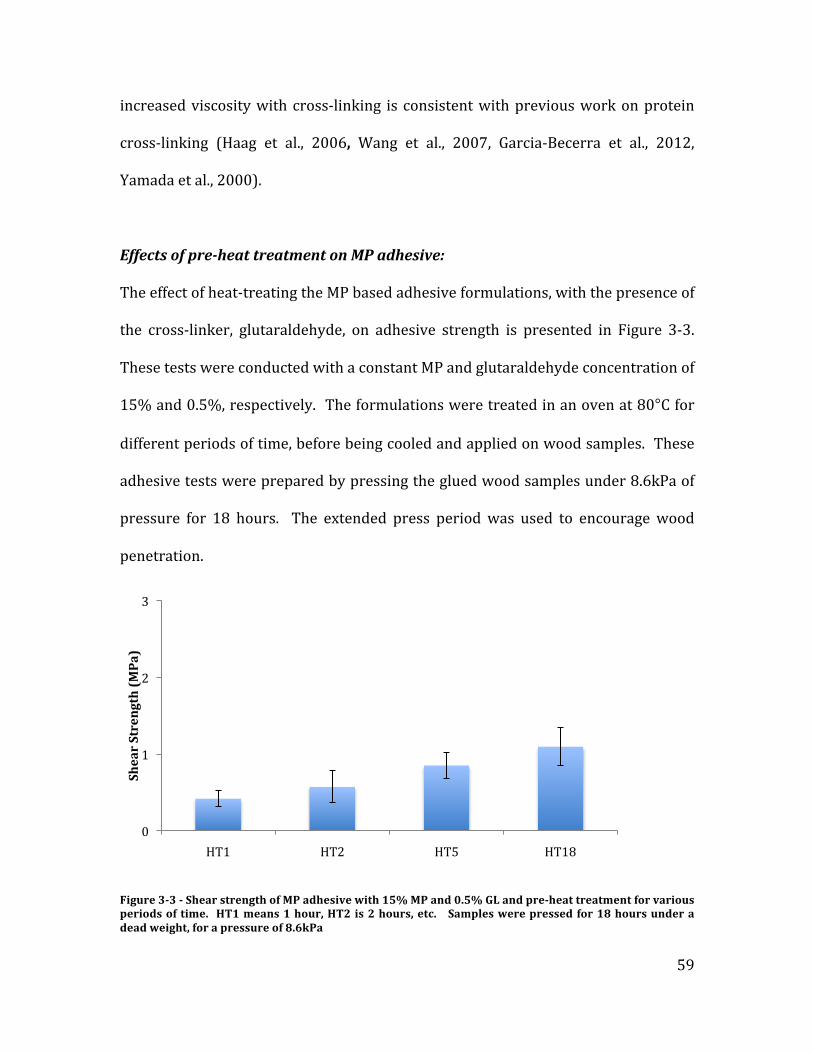
59
increasedviscositywithcross‐linking is consistentwithpreviousworkonprotein
cross‐linking (Haag et al., 2006,Wang et al., 2007, Garcia‐Becerra et al., 2012,
Yamadaetal.,2000).
EffectsofpreheattreatmentonMPadhesive:Theeffectofheat‐treatingtheMPbasedadhesiveformulations,withthepresenceof
the cross‐linker, glutaraldehyde, on adhesive strength is presented in Figure 3‐3.
ThesetestswereconductedwithaconstantMPandglutaraldehydeconcentrationof
15%and0.5%,respectively.Theformulationsweretreatedinanovenat80°Cfor
differentperiodsoftime,beforebeingcooledandappliedonwoodsamples.These
adhesivetestswerepreparedbypressingthegluedwoodsamplesunder8.6kPaof
pressure for 18 hours. The extended press periodwas used to encouragewood
penetration.
Figure33ShearstrengthofMPadhesivewith15%MPand0.5%GLandpreheattreatmentforvariousperiodsof time. HT1means1hour,HT2is2hours,etc. Sampleswerepressedfor18hoursunderadeadweight,forapressureof8.6kPa
0
1
2
3
HT1 HT2 HT5 HT18
ShearStrength(MPa)

60
The results inFigure3‐3 indicate that exposing these formulations toheatwitha
glutaraldehyde can be advantageous to adhesive strength. When the adhesive
formulation of 15%MP, 0.5% GL was not exposed to heat, a bond could not be
maintained. Whenexposedtoheat,therewasanobservablechangeinthetexture
towardsamoregel‐likeconsistency.Theamountoftimeexposedtoheatappearsto
improvethestrength.Thelowestshearstrengthof0.42MPawasobtainedwiththe
formulation exposed toheat for the shortest periodof time. Thehighest average
shear strength reached for these tests was 1.10MPa, and this was for the
formulation exposed to heat for the longest period of time, 18 hours. The shear
strength for 15%MP samples that was heated for 18 hours was not statistically
greaterthantheformulationheattreatedfor5hours. Howeverthe18hourand5
hour tests had stronger shear strengths than the formulations treated for 1 hour
and2hours(P<0.05).
MustardProteinConcentration,GlutaraldehydeAddition,andInsituMixing:Increases inMP and glutaraldehyde concentrations led to significant increases in
theviscosityofadhesive, to thepoint that it formedasolidmaterial. Therefore,a
suitable adhesive could not be formulated with higher MP and glutaraldehyde
concentrationsbecausetheycouldnotpenetratethewoodsurfacetoformabond.

61
Inordertotakeadvantageofthepotentiallystrongbondsofthecross‐linkedMP,a
newapplicationstrategywasdevelopedwherebythemustardproteinsolutionand
glutaraldehydewereappliedontothewoodseparatelyforin‐situmixing,resulting
inin‐situcross‐linking.Theshearstrengthresultsfromin‐situmixingwithvarying
MPandglutaraldehydeconcentrationsarepresentedinFigure3‐4.
Figure 34 – Shear strength for MP adhesives containing 15%, 25%, and 40% (labeledMP15, MP25,MP40),withglutarldehyde (GL)mixed insitu. Sampleswerepressed for1hourunderadeadweightwithapressureof8.6kPa.
Figure3‐4showstheshearstrengthresultsofMPadhesiveformulationscontaining
15%,25%,and40%mustardprotein. These solutionsweremixedwithdifferent
amountsofglutaraldehyde,rangingfrom1.2‐7.2µL,whichasapercentofthe120mg
appliedtoeachpieceofwoodtranslatesto1‐6%GL.BoththeMPconcentrationand
GLcontentappearedtoaffecttheadhesivestrength.
At15%MP,theadhesionstrengthimprovedastheGLcontentincreasedfrom1%to
4%,whereahighstrengthof0.84MPawasachieved.Thestrengthdidnotimprove
0
1
2
3
GL1% GL2% GL4% GL5% GL6%
ShearStrenght(MPa)
MP15
MP25
MP40

62
astheGLcontentincreasesbeyond4%(P<0.05).Thiswasasimilartrendfor25%
and40%MPformulations,butwithhighershearstrengths.At4%glutaraldehyde,
25% MP formulation achieved a strength of 1.71MPa, and 40% MP reached
2.31MPa.
Asoaking testwasperformedon thebestperforming formulation,MP40GL4%, to
testforwaterresistance. Theaveragebondstrengthaftersoakinganddryingwas
slightly less than the dry sample at 2.07MPa, but this result was not statistically
lower when considering the variance in the results (P>0.05). Therefore, the MP
formulationwasabletomaintainmostofitsbondstrengthaftersoaking.
Oneissuewiththisin‐situapplicationmethodisthatitcanbesensitivetoexecution
andtiming. Theproteinsolutioncangetsoakedinthewoodif it is leftsittingtoo
longbeforetheglutaraldehydeisadded, leavingnothingforglutaraldehydetomix
andformabondwith.Also,theglutaraldehydemustbeproperlymixedbeforethe
secondpiece ofwood is pressedon top. However, if leftmixing for too long, the
solution can quickly cross‐link and harden,which can prevent penetration to the
secondpieceofwood.
RASExtractAdhesion:Although RAS is made up of multiple constituents, previous work indicated that
RAS’s adhesive capabilitywas correlated to protein content (Garcia‐Becerra et al,
2012). Therefore,theconcepts learnedfromtheMPmodificationsweretestedon

63
RAS to examine if this would translate to enhanced adhesive performance. The
shear strength results are presented in Figure 3‐5. The graph shows RAS
concentrationsof45%and60%,intermsofweightpercentageoffreezedriedRAS
powder. Themodifications to the samples included glutaraldehyde addition, pre‐
heattreatment,andin‐situmixingwithglutaraldehyde.RASconcentrationsof30%
werealsotested,butdidnotyieldmeasureableadhesivestrengths.
Figure35–Shear testresults forRAS formulations. The formulationsunderwentpreheat treatment(HT),additionofglutaraldehyde(GL),orweremixed insituwithglutaraldehyde(IM). Sampleswerepresseddownfor18hoursunder8.6kPa.
Themodifications involvingpre‐heat treatment, glutaraldehyde content, or in situ
applicationmethod,wereperformedonadhesiveformulationscontaining45%RAS.
Formulationscontaining30%RASweretestedforglutaraldehydeaddition(1%GL),
and pre‐heat treatmentwith 1% GL for 18 hours. The pre‐heat treated samples
weretheonlyonestomaintainabond,butthebondswerenotstrongenoughtobe
0
0.2
0.4
0.6
0.8
1
1.2
ShearStrength(MPa)

64
measurewithinthelimitsofthesheartestingequipment(0.25MPawasthelowest
measurablestrengthrecordedbytheequipmentforthesetests).
RAS45%formulationshowedashearstrengthof0.63MPa.RAS45%with2%GL
reached a strength of 0.76MPa, andwas the only formulationwith the sameRAS
concentration that showed a statistical improvement to the RAS 45% solution
(P<0.05).IncreasedRASconcentrationalsoresultedinastatisticalimprovementto
RAS45. The formulation containing 60%RAS (RAS60)with 6%GLmixed in situ
showed the highest average strength of the RAS adhesive tests, with 0.88MPa
(58.9kg).
RASadhesiveswerenotabletomaintainabondaftersoaking.
ThermalPropertiesDSC can determine thermal transition points ofmaterials through the amount of
energyreleasedorabsorbedbyasampleataparticulartemperature.Thethermal
transition properties of the MP adhesives can be detected, and variations in the
structureduetocross‐linkingwiththeadditionofglutaraldehydecanbereflected
by changes in the thermal behaviour. The temperatures and heat flow associated
withthetransitionwererecordedbyDSC.Figure3‐6showsaDSCthermogramfor
MP protein that has no been modified, MP that has been cross‐linked with
glutaraldehyde,andMPtreatedwithglutaraldehydeandpre‐heattreatment.

65
Figure36DSCthermogramofunmodifiedMustardSeedProteinIsolate(MP)andMPcrosslinkedbywith2%glutaraldehydew/w(MPGL2),andwith0.5%glutaraldehydeand18hoursofheattreatmentat80°C(MPGL0.5HT18)
TheDSC thermograms indicate thepossibilityof structuralvariations takingplace
due to cross‐linking. The key thermal transition points are represented by the
peaks,whichwerepresumablyduetothethermaldenaturingofthenativeprotein
structure.Eachsampleshowskeythermal transitionbehaviourat89‐95°C,andat
around 200°C, that could represent glass transition (Tg) or melting temperature
(Tm).UnmodifiedMPshowstwoseparatepeaksthroughoutthehighertemperature
transition points between 198 and 210°C, whereas the cross‐linked proteins
showedonepeak,apossibleindicationofconformationalchangestakingplace.The
denaturingenthalpy,representedbytheareaunderthepeak,appearstobehigher
fortheproteinstreatedwithglutaraldehydeandheattreatment(withthepresence
of 0.5% glutaraldehyde). The lower heat flow peaks indicate possible
conformational changes due to cross‐linking, resulting in new structures that
requiremore thermal energy for denaturation. These results are consistentwith

66
previousworkusingDSCanalysis todetectcross‐linkingofproteins(Wang etal.,
2007,Lanttoetal.,2007).
3.4.2 DiscussionHeattreatment:
ThefirstmodificationtestedontheMPadhesiveswasthepre‐heattreatmentwith
thepresenceof theglutaraldehyde(GL)proteincross‐linker. The ideaof thepre‐
heat treatment of adhesive formulations was to encourage the cross‐linking
reaction, andpossibly simulate any other curing that occurs during heat pressing
usedfortheproductionofplywood.Thisisanassumptionbasedonthebeneficial
effectsofheatpressingonbondstrength forbothRASandMPadhesives (Garcia‐
Becerra,2012).Thishelpedimprovethestrengthoftheadhesivewithoutrequiring
theenergyintensiveprocessofheatpressing.
It is possible that heat encouraged the cross‐linking reaction. There is also the
possibility of some thermally aideduncoilingof theprotein structure, denaturing,
thatcouldhelptheproteinsflowbetterwithinthesolution,butitisverydifficultto
knowif this ishappening.Theheat‐treated formulation formedagel‐likenetwork
thatcouldindicatefurthercross‐linkingthatdidnotoccurwithoutheattreatment.
This anecdotal observation is consistent with the viscosity results from heat
treatment. Thisformationofasolid‐likematerialhasbeenobservedtobearesult
ofcross‐linkinginsoyproteinadhesiveworkaswell(Wangetal.,2007).

67
Also,theDSCthermogramspresentedFigure3‐6showthattheheat‐treatedprotein
absorbedmoreenergy, incomparisontounmodifiedmustardprotein. Thehigher
denaturing enthalpy is a possible indication of larger molecules being formed
through cross‐linking, and intertwining of those largermolecules to form amore
stable protein network. These findings are consistent with enthalpy changes
observedfromDSCanalysisinotherproteincross‐linkingwork(Wangetal.,2007,
Lanttoetal.,2007).
These tests have indicated that both the glutaraldehyde and heat treatment
contributedtoimprovedadhesiveperformance. Adhesiveformulationscontaining
15%MPand0.5%Glutaraldehydethatwerenotheattreatedwerenotabletohold
the bond to the wood in humid ambient conditions (60% RH). Also, a 15%MP
formulationwith no glutaraldehyde that underwent pre‐heat treatment could not
maintainabond,anddidnotshowanyvisiblephysicalchangesinthetexture.
Althoughthemainobjectivewastoimprovetheadhesivestrengthbycross‐linking
of the proteins before being applied to the wood, too much cross‐linking can be
detrimental.Excesscross‐linkingcanleadtotheformationofasolid‐likematerial,
whichwould inhibit theability topenetratethewood. If theproteinsbecometoo
large,thentheycannotinterlockwiththewood.Thispenetrationandinterlocking
withthewoodiskeytoastrongbond(Wangetal.,2007).Itisveryimportantfor
theproteinstobeabletohavepolargroupsexposedtoformhydrogenbondswith
thewoodstructure.Thiscanbedifficulttoachievewithlarger,cross‐linkproteins.

68
Afterbondingwith thewood,abondstrengthcanbeestablished, inpart, through
thereformationofhydrogenbondsbetweenproteinchains(Frihart,2005).
Fortunately,thepre‐heattreatedsolutionsof15%MPand0.5%GLprovidedagood
balance of mechanical strength enhancement while still allowing for wood
penetration. However, when further cross‐linking was encouraged by increasing
glutaraladehydecontentinthe15%MPsolutions,theformulationsformedastrong
gel‐likenetworkthatcouldnotpenetratethewoodandformabond.Theissuealso
occurredforformulationscontaining25%MP,asexpected. Excessglutaraldehyde
has also been shown to be detrimental to the adhesive strength of soy protein
adhesiveformulations(Wangetal.,2007).
InSituCrosslinkerMixing:A newmethod of applicationwas explored to overcome the limitations of excess
cross‐linkingpriortowoodapplication. Thein‐situmixingofproteinsolutionand
glutaraldehyde allowed for improvedwood penetration, and cross‐linking to take
place between the wood pieces, forming a strong bond. Using this application
method, strongbondswere formedwithmuchhigherprotein and glutaraldehyde
concentrations.
TheMP concentration had a strong impact on the adhesive strength. This could
simply be due to an increased abundance of interactions that could take place,
allowing more opportunity for hydrogen bonding to the wood, and within the

69
formulation.Theadditionofglutaraldehydealsocontributedtoenhancedadhesion
strengthforthein‐situmethodofapplication.
With the in‐situmixing procedure, theMP solutionwas given a chance to spread
andpenetrate intotheporousstructureof thewoodinterfacebeforecross‐linking
tookplace.Aftertheglutaraldehydewasintroduced,thewoodpieceswerequickly
pressedontoeachother, togiveachanceforMPandglutaraldehydetopenetrate
thewoodbefore reacting, and create amechanical interlockwith thewood. This
allowedfortheformationofastrongproteinnetworkbetweenthewoodpieces.An
understanding of the cross‐linking kinetics would be useful, as it could help
understandhowquicklythebondcanform,andpotentiallyposeanadvantageover
the setting times of synthetic adhesives. The viscosity and DSC results are an
indicationofthecross‐linkingthatcantakeplacebetweenthewoodpieceswiththe
additionofglutaraldehyde. Itisalsopossiblethatglutaraldehydepromotedcross‐
linkingofproteinwiththecellwallpolymersofthewood,acapabilitythathasbeen
suggestedbyXiaoetal.(2010).
Thebond strengthappeared to reachamaximumat4%GL, insteadof improving
with increased GL content. It is possible that the glutaraldehydewas present in
excess,andthereforedidnotcontinuetocontributetocross‐linkingwhenmoreGL
added. Insomecases, thebondstrengthevendecreasedwith increasedGLabove
4%.Asmentioned,glutaraldehydehasbeenshowntopromotecross‐linkingofcell
wall polymers of wood (Xiao et al., 2010). Perhaps the excess glutaraldehyde

70
encouraged cross‐linking between wood cells, forming a stronger wood network
thatismoredifficulttopenetrate.
ThemaximumstrengthofMPbasedadhesives(2.31MPa)wasstillnotquiteashigh
as the 4.40MPa achieved for commercial white glue, produced with polyvinyl
acetate(PVAc),pressedundersimilarconditions.However,theMPbasedadhesives
may have an advantage over PVAc when it comes to thermal stability. The DSC
analysisformustardproteinindicatesaglasstransitiontemperature(Tg)ofaround
90°C,whereasaTgof40°ChasbeenreportedforthePVAcpolymer(Crispimetal.,
1999).PerhapsMPbasedadhesivescanbeadvantageousinmaintainingabondin
hightemperatureenvironments.
AlthoughtheMPadhesivemaynotbeasstrongascommercialwhiteglue,thisnew
methodofapplicationhasresultedin improvementsfrompreviousadhesivework
withMPunder similarpressing conditions. WorkbyGarcia‐Becerra et al. (2012)
reportedastrengthofapproximately1MPaforMPadhesive,pressedunderadead
weight in ambient conditions. It is also important to note that those tests were
pressed under favourable pressing conditions of a higher pressure (47kPa) and
lower relative humidity curing environment of 30%RH. In thiswork, a bond of
more than double the strength was achieved under 8.6kPa in a 60% RH curing
environment.

71
The MP adhesives also demonstrated good water resistance. After soaking, the
bondstrengthoftheformulationcontaining40%MPand4%GLmixedin‐situwas
notstatisticallydifferentformthedrystrength.Themoistureresistancesuggestsa
potential performance advantage over soy protein based adhesives, which have
shownreducedadhesivestrength,andevencompletebondfailure,withsoakingor
exposure tohighhumidity environments (Hettiarachchyet al., 1995;Kalapathyet
al.,1995;Zhongetal.,2001)
RASAdhesion:
The modifications to RAS based adhesives did not result in the same kind of
adhesives enhancements as for MP, but improvements were still realized. The
viscosity measurements in Figure 3‐2 did show increased viscosities for
formulationswithglutaraldehyde,andforthosepre‐heattreatedwiththepresence
ofglutaraldehyde.Thissuggeststheabilityfortheglutaraldehydetoreactwiththe
biopolymers inRAStoencouragesomecross‐linking,andfortheheatexposureto
enhance this reaction. However, this did not necessarily translate to adhesive
strength,which is consistentwith the findings in previousRAS adhesivework by
Garcia‐Becerra et al. (2012), suggesting an unclear relationship between viscosity
and adhesive strength. The concentration of the extract appeared to have the
strongesteffectonadhesivestrength.

72
There was some indication on the ability for the pre‐heat treatment to aid in
bondingability,whichwasnotreflectedinthesheartestresults.Thereweretests
prepared for formulations containing 30% RAS extract were prepared with no
glutaraldehyde,1%GL,and1%GLwithheattreatment.Theformulationwithheat
treatment was the only one that maintained a bond after five days of curing.
Althoughbondwasnotstrongenoughtobemeasuredwithinthelimitsoftheshear
testingequipment, thiscouldbean indicationof improvedmoistureresistance,as
thebondwasmaintainedinahumid,60%RHenvironment.
Glutaraldehydeadditiondidnothavethesameimpactontheadhesivestrengthasit
did forMP. With such a heterogeneousmixture of biopolymers inRAS, it can be
expected that glutaraldehyde would not react the same as it would for a pure
proteinsolutionsuchasMP.Theproteincontentonlymakesupabout23%ofthe
organiccontentintheRAS,ascharacterizedbyGarcia‐Becceraetal.(2010),which
was the reason for trying suchahighconcentrationof60%RAS. Inaddition, the
proteins in RAS are not well characterized, and may not contain the free amino
groups,suchaslysine,thatarefavourableinglutaraldehydeaidedcross‐linking.
ImportantimprovementswerestillmadeincomparisontopreviousworkwithRAS
basedadhesives.PreviousRASextractformulationscouldonlyformabondundera
hot press (0.26MPa, 150°C). No bond was formed when pressed at room
temperatureundera lowerpressureof47kPa (Garcia‐Becceraet al., 2012). With
the modifications in this work, reasonably strong bonds were achieved when
73
pressedundera lowerpressure (8.6kPa)at room temperature, and thebondwas
maintainedinahigherhumidityenvironment(60%RH).
Crosslinkingagent:
Glutaraldehyde is one of themost extensively used protein cross‐linkers, and has
shown to be effective in thiswork, especiallywithmustard protein. However, it
wouldbe interesting toexplore theeffectsofalternativecross‐linkingagentswith
similarstructurestoglutaraldehyde,suchassimpledialdehydesthatonlydiffer in
the carbon chain lengthbetween aldehyde groups. For example,malondialdehyde
and adipaldehyde are simple dialdehydes known to form protein cross‐links.
Glutaraldehyde has a three carbon chain between aldehydes to form the
COH(CH2)3COHstructurethatcanbeseeninFigure3‐1,whereasMalondialdehyde
hasonlyoneCH2group,andadipaldehydehasfour(Wong,1993).Itispossiblethat
variations in the chain length can have an impact on cross‐linking and bond
strength.
Aconcernwiththeuseofglutaraldehydeistoxicity.Althoughitiscommonlyused
asadisinfectantatlevelsofupto2%insolution,itsvaporscanbetoxicatlowlevels
(legalexposurelimitof0.2ppm),sotheliquidformmustbehandledwithcareina
well ventilated environment (California Department of Public Health, 1995).
Therefore,alongwiththebenefitstowoodworkingapplications,theabilitytoform
a bond under low temperature conditions when incorporating glutaraldehyde is
veryimportantfortoxicityreasons. Apotentialalternativecross‐linkertoaddress

74
this issue is genepin. Genipin is a naturally occurring substance that has been
shown to cross‐link proteins. It has beenused in biomedical andpharmaceutical
applications,andhasbeenexploredasanalternativetoglutaraldehydeduetolower
toxicityandincreasedbiocompatibility(Muzzarelli,2009).
3.5 ConclusionModifications to mustard protein (MP) and Return Activate Sludge (RAS) extract
adhesive formulations led to improvedadhesivecapabilities.Theuseof thecross‐
linkingagent,glutarldehyde,andheattreatment,weremodificationsmadetoinduce
conformationalandstructuralchangestobenefitadhesiveperformance.Thein‐situ
methodofapplyingtheadhesivesolutionandcross‐linkerhadthemostsignificant
impact on the adhesive strength of MP formulations. This application method
allowedforwoodpenetration,andthe formationofastrongcross‐linkednetwork
betweenwoodpieces.
TheeffectsofthesemodificationswerenotaspronouncedforRASbasedadhesives.
However, with increased concentrations, bonds could be formed with RAS
formulations under low pressure and ambient temperature pressing conditions,
which cannotbe said forpreviousRASadhesivework. Theability to formbonds
underlowpressureandambienttemperaturesexpandstheapplicabilityofMPand
RAS based adhesives to uses such as cabinetry,musical instrument building, arts
andcrafts,andothergeneralinteriorwoodassembly.

75
3.6 ReferencesAider,M.,Djenane,D.,&Ounis,W.B.(2012).Aminoacidcomposition,foaming,
emulsifyingpropertiesandsurfacehydrophobicityofmustardproteinisolateasaffectedbypHandNaCl. Int.J.FoodSci.Technol.,47(5),1028‐1036.
Alireza‐Sadeghi,M.,Appu‐Rao,A.G.,&Bhagya,S.(2006).Evaluationofmustard
(Brassicajuncea)proteinisolatepreparedbysteaminjectionheatingforreductionofantinutritionalfactors.LWTFoodSci.Technol.,39(8),911‐917.
CaliforniaDepartmentofPublicHealth(1995,November).Factsheet:
Glutaraldehyde.RetrievedSeptember27,2012,fromhttp://www.cdph.ca.gov/programs/hesis/Documents/glutaral.pdf
Chen,C.M.(1982).Effectsofformaldehydeconcentrationonthebondquality ofpeanuthullextractcopolymerresins.Ind.Eng.Chem.Prod.Res.Dev., 21(3),450‐454.Crispim,E.G.,Rubira,A.F.,&Muniz,E.C.(1999).Solventeffectsonthemiscibility
ofpoly(methylmethacrylate)/poly(vinylacetate)blendsI:Usingdifferentialscanningcalorimetryandviscometrytechniques.Polymer,40(18),5129‐5135.
Frihart,C.R.(2005).Woodadhesionandadhesives.InR.M.Rowell(Ed),Handbook
ofwoodchemistryandwoodcomposites(pp.15‐273).BocaRaton,FL:CRCPress,Inc.
GarciaBecerra,F.Y.,Acosta,E.J.,Allen,D.G.(2010).Alkalineextractionof
wastewateractivatedsludgebiosolids. Bioresour.Technol.,101(18),6983‐6991.
Garcia‐Becerra,F.Y.,Acosta,E.J.,Allen,D.G.(2012).Woodadhesivesonalkaline
extractsfromwastewaterbiosolidsandmustardprotein.J.Am.OilChem.Soc.,89(7).1315‐1323.
Haag,A.P.(2006).Mechanicalpropertiesofbacterialexopolymeric adhesivesandtheircommercialdevelopment.InA.M.Smith,&J.A.Callow
(Eds.),Biologicaladhesives(pp.1‐19).Berlin:Springer.Haag,A.P.,Maier,R.M.,Combie,J.,&Geesey,G.G.(2004).Bacteriallyderived
biopolymersaswoodadhesives.Int.J.Adhes.Adhes.,24(6),495‐502.Hettiarachchy,N.S.,Kalapathy,U.,&Myers,D.J.(1995).Alkali‐modifiedsoyprotein
withimprovedadhesivesandhydrophobicproperties.J.Am.OilChem.Soc.,72(12),1461‐1464.

76
Kalapathy,U.,Hettiarachchy,N.S.,Myers,D.,&Hanna,M.A.(1995).Modificationof
soyproteinsandtheiradhesivepropertiesonwoods.J.Am.OilChem.Soc.,72(5),507‐510.
Lambuth,A.L.(1994).Proteinadhesivesforwood.InA.Pizzi,&K.J.Mittal(Eds.),
Handbookofadhesivetechnology(pp.259‐281).NewYork:MarcelDekker,Inc.Lantto,R.,Puolanne,E.,Kruus,K.,Buchert,J.,&Autio,K.(2000).Tyrosinase‐aided
proteincross‐linking:Effectsongelformationofchickenbreastmyofibrilsandtextureandwater‐holdingofchickenbreastmeathomogenategels.J.Agric.FoodChem.,55(4),1248‐1255.
Lin,H.,&Gunasekaran,S.(2010).Cowbloodadhesive:Characterizationof
physicochemicalandadhesionproperties.Int.J.Adhes.Adhes.,30(3),139‐144.Lundblad,R.L.(2005).Chemicalreagentsforproteinmodification.BocaRaton,FL:
CRCPress,Inc.Marnoch,R.,&Diosady,L.L.(2006).Productionofmustardproteinisolatesfrom
orientalmustardseed(BrassicajunceaL.).J.Am.OilChem.Soc.,83(1),65‐69.
Muzzarelli,R.A.A.(2009).Genipin‐crosslinkedchitosanhydrogelsasbiomedicalandpharmaceuticalaids.Carbohydr.Polym.,77(1).1‐7.
Newkirk,R.W.,Classen,H.L.,Tyler,R.T.(1997).Nutritionalevaluationoflow
glucosinolatemustardmeals(Brassicajuncea)inbroilerdiets.Poult.Sci.,76(9),1272‐1277.
Odozi,T.O.,&Agiri,G.O.(1986).Woodadhesivesfrommodifiedredonionskin
tanninextract.AgriculturalWastes,17(1)59‐65.Park,S.K.,Bae,D.H.,&Hettiarachchy,N.S.(2000).Proteinconcentrateand
adhesivesfrommeatandbonemeal. J.Am.OilChem.Soc.,77(11),1223‐1227.Pizzi,A.(1978).Wattlebasedadhesivesforexteriorgradeparticleboards,For. Prod.J.,28(12),43‐47.Quiocho,F.A.,&Richards,F.M.(1964).Intermolecularcrosslinkingofaproteinin
thecrystallinestate:Carboxypeptidase‐A.Proc.Natl.Acad.Sci.U.S.A.,52(3),833‐839.
Reddy,N.,Tan,Y.,Li,Y.,&Yang,Y.(2008).Effectofglutaraldehydecrosslinking
conditionsonthestrengthandwaterstabilityofwheatglutenfibers.Macromol.Mater.Eng.,293(7),614‐620.
77
Wang,W.H.,Li,X.P.,&Zhang,X.Q.(2008).Asoy‐basedadhesivefrombasic
modification.PigmentandResinTechnology,37(2),93‐97.Wang,Y.,Mo,X.,Sun,S.,Wang,D.(2007).Soyproteinadhesionenhanceby
glutaraldehydecrosslink.J.Appl.Polym.Sci.,104(1),130‐136.Weimer,P.J.,Conner,A.H.,&Lorenz,L.F.(2003).SolidresiduesfromRuminococcus
cellulosefermentationsascomponentsofwoodadhesiveformulations.Appl.Microbiol.Biotechnol.,63(1),29‐34.
Wong.S.S.(1993).Chemistryofproteinconjugationandcrosslinking.BocaRaton,
FL:CRCPress,Inc.Wu,Y.V.,&Inglet,G.E.(1974).Denaturingofplantproteinsrelatedtofunctionality
andfoodapplications.Areview.J.FoodSci.,39(2),218‐225.Xiao,Z.,Xie,Yanjun,X.,Militz,H.,Mai,C.(2010).Effectofglutaraldehydeonwater
relatedpropertiesofsolidwood.Holzforschung,64,483‐488. Xu,L.,Lui,F.,Luo,H.,&Diosady,L.L.(2003).Productionofproteinisolatesfrom
yellowmustardmealsbymembraneprocesses.FoodRes.Int.,36(8),849‐856.
Yamada,K.,Chen,T.,Kumar,G.,Vesnovsky,O.,Topoleski,L.D.T.,&Payne,G.F.(2000).Chitosanbasedwater‐resistantadhesive.Analogytomusselglue.Biomacromeolecules,1(2),252‐258.
Zhong,Z.,Sun,X.S.,Fang,X.,&Ratto,J.A.(2001).Adhesionpropertiesofsoy
proteinwithfibercardboard.J.Am.OilChem.Soc.,78(1),37‐41.

78
CHAPTER4 ConclusionandRecommendations
4.1 ConclusionIt was very encouraging to see the hydrophilic RAS and UR extracts show
synergisms in mixtures with AOT, a relatively hydrophobic surfactant. A small
amount of AOT was required to reduce the IFTs by an order of magnitude in
comparisontothewasteextractsurfactantsalone.FurtheradditionofAOTresulted
inoptimalmixturesreachinglowIFTs(<1mN/m)thatwerewellbelowthatofAOT
alone, and approached levels that are relevant to industrial applications.
Furthermore,ultralowIFTs(<0.1mN/m)werereachforamixtureofaURalkaline
extractandAOTwithincreasedconcentrationsandnoadditionofsalt. Thisultra‐
low IFT was reached against hexane, indicating relevance to heavy crude oil
extractionprocesses. The surface tension andCMC results forRAS‐AOTmixtures
alsohadimplicationsforsynergismsbetweenthewastealkalineextractsandAOT.
This was reflected by a negative interaction parameter, β, for mixed surfactants,
indicating surfactant interactions and the formation of mixed micelles. The
synergismwithAOTwas very encouraging for the potential applicability of these
waste biomass extracts as surfactants. Mixtures of RAS and UR alkaline extracts
withAOTwerethenshowntobeeffective inbitumenremoval fromcontaminated
sand.

79
These results have very positive implications for waste sources to be used to
produceeffectivesurfactants. RASandURareabundantsourcesof surface‐active
organicmatterthatcanbeextractedusingverysimplealkalineextractionmethods,
buttheseextractsmaynotperformcompetitivelyontheirown.Withtheabilityto
interactinasynergisticmannerwithanothersurfactant,thewasteextractsbecome
an important component in a commercially competitive surfactant formulation.
Thiscanalsoencouragefurtherexplorationofdifferentwastebiomasssourcesfor
useassurfactants.
Theworkonformulationsofadhesives fromalkalineextractsofRASandmustard
protein(MP)revealedthattheimportantfactorsencouragingbondstrengthunder
low pressure, ambient pressing conditions were solids content, cross‐linking of
proteins,andtheabilitytoachievewoodpenetration.FortheMPbasedadhesives,
the in‐situmixingmethodallowedforgoodwoodpenetrationtobeachievedwith
theuseofhigherproteinandcross‐linkercontents,resultingingreatimprovements
tobond strength.The applicationmethodhelped achieve a bond strengthof over
doublethatachieved inpreviousworkwithMPundersimilarpressingconditions.
ImprovementsforRASadhesiveswereprimarilymadethroughtheincreaseinRAS
solidscontent. TheRASadhesivebondstrengthswerenotashighas formustard
protein,butimportantimprovementsweremadeonpreviouswork,wherenobond
couldbeformedforRASundersimilarpressingconditions.
80
The success of the in‐situ cross‐linking method was very encouraging for new
applications of protein based adhesives. The primary commercial application for
protein based adhesives has been interior grade plywood production, which
requireshotpressing. Thisworkshowedanewway to take fulladvantageof the
cross‐linking reaction tohelpmaximizewoodpenetrationandbond strength, and
couldpotentiallybeeffectiveforotherproteins.Thestrongbondstrengthachieved
under low pressure and temperature pressing conditions shows potential for
expanding the applicability of protein based adhesives to new interior wood
workingapplicationsthatdonotrequirehotpressing,suchascabinetryandgeneral
artsandcrafts.
4.2 RecommendationsforFutureworkBiobasedSurfactants
o Mixturesandsustainability:giventheability for thewastealkalineextracts
to form synergisms with a hydrophobic synthetic surfactant, it would be
worth examining their ability to form a synergy with more hydrophobic
biosurfactants, further maintaining the theme of sustainability and
improvingtheperformanceofbio‐basedproducts
o New sludge sources: apply alkaline extraction to different industrialwaste
watersourcesthatmaybericherinproteinsandlipids,possiblyresultingin
moresurfaceactiveextracts

81
o Performbitumenremoval testunderconditions thatmaybemorerelevant
toindustrialapplications
o Modeling: the CMC and surface tension data formixtureswas applied to a
simplemodeltoexploresynergisms.Furthermodelingcouldbeusedtohelp
characterize the waste extracts, and the interfacial tension behaviour of
mixtures with AOT, using frameworks such as HLD‐NAC (Hydrophilic‐
LipophilicDifference–NetAverageCurvature)
BiobasedAdhesives
o ProteinfromWasteSources:thebondstrengthofRASappearstobestrongly
correlatedtoproteincontent.Toimprovethestrengthofadhesivesbasedon
RAS, future work should explore extracting out the proteins, possibly
through acid precipitation. Also, other sludge sources that may be more
proteinrichthanRASshouldbeexplored
o Cross‐linking agents: Glutaraldehyde was effective, but other cross‐linking
agentsmaybeevenmoreeffective in forminga strongbond. Tests canbe
conducted with other dialdehydes with varying structures between the
aldhehydeendgroups.Also,alesstoxiccross‐linkingagent,suchasgenipin,
should be investigated to address health concerns associated with using
glutaraldehyde
o Other proteins: Given the success of the in‐situ mixing method, other
proteins that are commercially available and have been used for adhesive

82
production,suchassoyprotein,shouldbetestedusingthisnewapplication
method
o Applications: Given the encouraging results for wood bonding, MP or RAS
basedadhesivescouldbetestedinotheradhesiveapplications,suchaspaper
orcardboardbinding

83
NomenclatureAOT–SodiumDioctylSulfosuccinate(AerosolOT)
β‐Aninteractionparameterformixedsurfactantsystemsandmixedmicellization
CMC–CriticalMicelleConcentration(gTOC/L)
CV365–UrbanRefuseextractfrommixofpublicgreenparktrimmingandfood
residuesaerobicallycompostedfor365days
DSC–DifferentialScanningCalorimetry
FORSUD–UrbanRefuseextractfromanaerobicdigestateofsolidurbanwaste
GL–Glutaraldehyde
HLD–Hydrophilic‐LipophilicDifference
HT–HeatTreatment
IFT–InterfacialTension(mN/m)
MP–MustardProtein
RAS–ReturnActivatedSludge
ST–SurfaceTension(mN/m)
TOC–TotalOrganicCarbon
UR–UrbanRefuse

84
APPENDIXCalculationsandDiagrams
CriticalMicelleConcentrationCalculation
InChapter2, thecriticalmicelleconcentration(CMC)wascalculatedbasedon the
typical surface tension vs. log(concentration) graph. The Gibbs adsorption
relationship was used to calculate a precise CMC for the bio‐based surfactant
formulations.Itisbasedonalinearrelationshipbetweensurfacetensionandlogof
concentration (logC), until the breaking point where surface tension remains
constant. The linearrelationshipwas firstdetermined,andtheCMCoccursat the
intersection between the linear equation and the surface tension after the CMC.
FigureA‐1demonstratesthegeneralrelationship(Rosen,2004).
FigureA1(Rosen,2004)
SampleCalculation:
The following sample calculation is for Return Activated Sludge (RAS). The
followingfigure,whichcanbeseeninFigure2‐1presentedintheChapter2results,
shows the relationship between surface tension and concentration of RAS. The
concentrationisintermsofTotalOrganicCarbon(gTOC/L).

85
FigureA2
Step1:AlinearrelationshipwasestablishedbetweensurfacetensionandLog(C)untilwhat
appears to be the breaking point, inwhich the surface tension becomes constant.
Thesurfacetensionisrepresentedbythesymbol,γ.
(1)
Whichinthisexamplecameoutto:
Step2:FindtheaveragesurfacetensionbeyondtheCMC,asitappearstoremainconstant:

86
Step3:Usethatsurfacetensionvaluetosolveforconcentrationintheequationobtainedin
Step1.ThisconcentrationisthemreportsastheCMC.
SolveforCMC:

87
BitumenRemovalAnalysis
InChapter2,theabilityforsurfactantformulationstoremovebitumenfrom
contaminatedsandwasinvestigated.Therearetwokeycomponentstocalculating
theoilrecovery(%)forthebitumenremovalexperiments.
1)Surfactantwashing–Residualoilremoval(ROR)The contaminated sand is first washed with the surfactant formulations. The
amountofoilthatwasremovedbythesurfactant isdeterminedbycalculatingthe
amount of oil that was not removed, residual oil, in terms of absorbance. The
residualoil iscompletelyremovedbytolueneandtheabsorbancereadingistaken
for Residual Oil Removal (AROR). The absorbance reading is taken by diluting the
washingfluidexperimentinthecuvette(20µLin1.5mLoftoluene).RefertoFigure
A‐3belowforaschematicofthisprocedure.
FigureA3–Soilwashingandresidualoilreadings
2)Referenceabsorbance–Positivecontrolfor100%Recovery
A reference absorbance reading must be obtained to represent 100% bitumen
removal(AR).Thisisobtainedbywashingcontaminatedsand(5wt%bitumen)with
4mLofToluene.Thetoluenecontainingallofthebitumenisdilutedinacuvettefor
absorbancereadings.Thefollowingdiagramhelpsdemonstratethisprocess
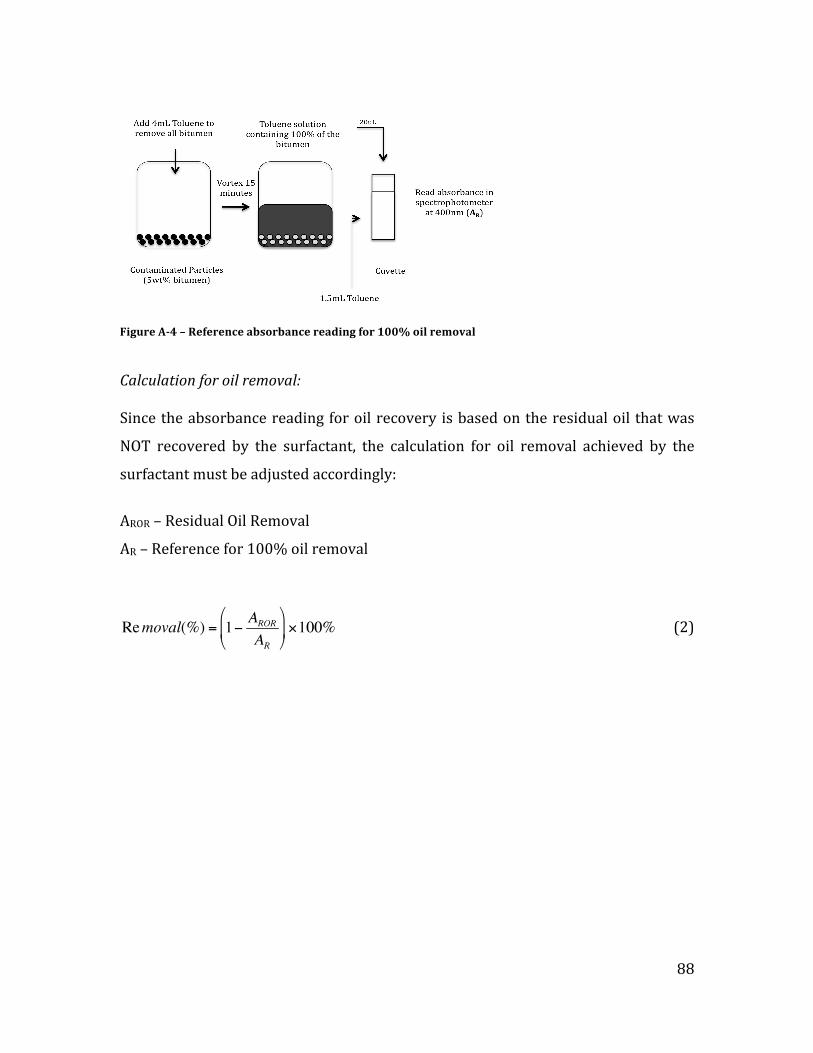
88
FigureA4–Referenceabsorbancereadingfor100%oilremoval
Calculationforoilremoval:Sincetheabsorbancereadingforoilrecoveryisbasedontheresidualoil thatwas
NOT recovered by the surfactant, the calculation for oil removal achieved by the
surfactantmustbeadjustedaccordingly:
AROR–ResidualOilRemoval
AR–Referencefor100%oilremoval
(2)

89
ElementalAnalysisConcentrationsInChapter2,anelementalanalysiswasperformedandnormalizedtomassoforganiccarboninTable2‐2.Thefollowingtableshowstheelementalconcentrationsin(mg/L).TableA1
Concentration(mg/L)
Constituent RAS FORSUD FORSUDashfree
CV365
TOC 3,214.7 25,453.3 22,153.3 32,196.7TN 845.8 4847.0 3327.0 4088.0Na 2,201.0 3,590.0 2,100.0 3,480.0S 83.8 537.2 329.3 914.7K 70.9 248.0 12.2 918.0Si 52.4 522.0 460.0 2,050.0Fe 52.3 216.0 1.9 1,180.0Al 51.0 280.0 7.7 732.0Ca 31.5 554.0 24.5 3,380.0B 17.8 296.0 299.0 292.0Mg 6.5 76.8 7.7 655.0Cu 4.1 7.0 2.4 30.0Zn 2.3 17.6 0.8 65.3Ti 2.0 8.2 1.5 56.5Ba 0.4 33.0 0.3 18.6Ni 0.3 2.2 0.0 7.7Mn 0.3 9.3 0.0 87.3Cr 0.1 1.3 0.4 6.4

90
CalculationofBeta(β)ParameterforRAS‐AOTMixtureAsimplephaseseparationmodel formixedmicellizationwasusedincombination
withregularsolutiontheorybyRubingh(1979).ThepaperbyHassanetal.(1995)
was used as a guide for the calculations. The calculations are based on
approximationsformolecularweightofRASmadetoconvertalloftheparameters
on a molar basis. The molecular weight of RAS was based on the chemical
characterizationbyGarcia‐Becerra(2010).
Fornon‐idealmixtures,thecmc*,theharmonicmeanoftheCMCsoftheindividual
components could be calculated using an activity coefficient (fi), representing the
degreeofinteractionbetweenspeciesinthemicelle.
(3)
Where:
(4)
αI–Bulkphasemolefractionxi‐molefractionofthecomponentinthemicelleWithβbeingthekeyparameterweareinterestedincalculating.UsingasequenceofequationsinHassanetal.(2005).
(5)
Theseequationsworkonamolarbasis,sothefirststepistoconverteverything.

91
Step1:ConverttoMolarBasisConcentration:RAS:Convertmassintermsoforganiccarbon(gTOC)tototalmassofsolids(gsolids)Basedonelementalformulafororganicmatter:C4H7O2NWherecarbonmakesupfor47.5%ofthetotalmass:MolecularweightofRAS:
BasedonanalysisfromGarcie‐Becerraetal(2010):56,000Da(g/L)
ConversionFactorofgTOCtomolesofRAS:
Therefore:
CMCofRAS:CMCRAS=1.34gTOC/Lx
AOT:Molecularformula:C20H37NaO7S:Carbonmakesupfor58.8%ofthetotalsolidsMolecularWeight:444.56g/mol
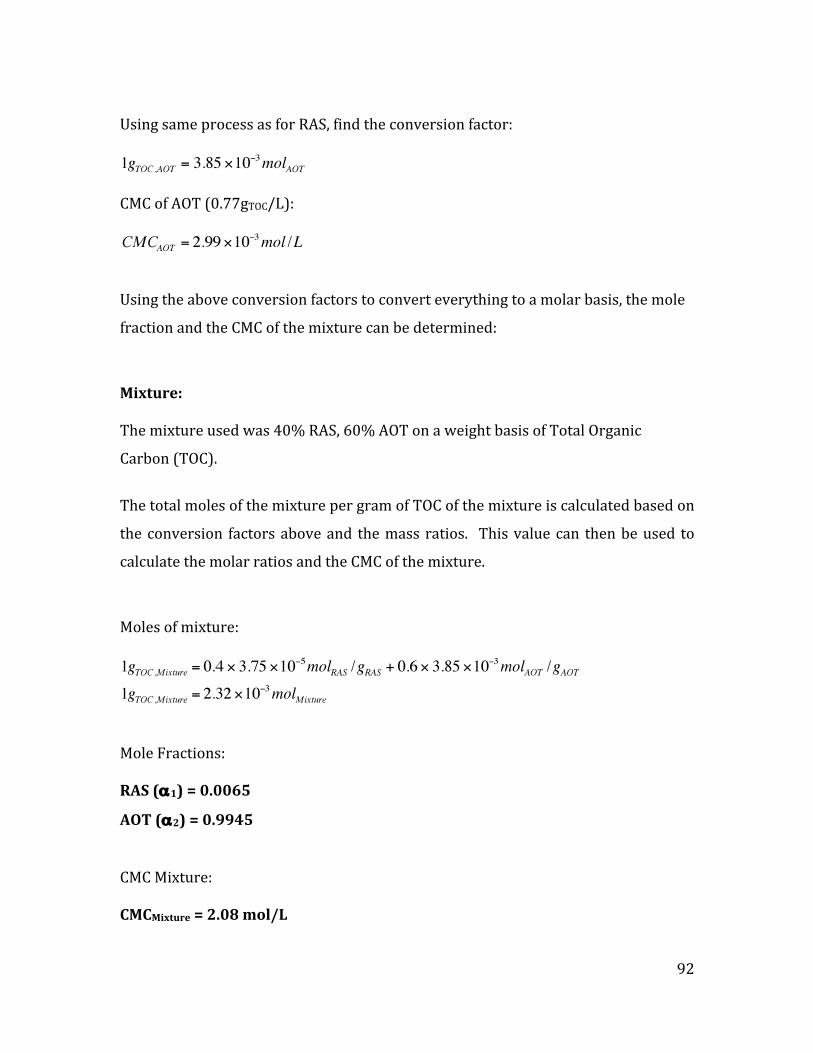
92
UsingsameprocessasforRAS,findtheconversionfactor:
CMCofAOT(0.77gTOC/L):
Usingtheaboveconversionfactorstoconverteverythingtoamolarbasis,themole
fractionandtheCMCofthemixturecanbedetermined:
Mixture:Themixtureusedwas40%RAS,60%AOTonaweightbasisofTotalOrganic
Carbon(TOC).
ThetotalmolesofthemixturepergramofTOCofthemixtureiscalculatedbasedon
theconversion factorsaboveand themass ratios. Thisvaluecan thenbeused to
calculatethemolarratiosandtheCMCofthemixture.
Molesofmixture:
MoleFractions:RAS(α1)=0.0065
AOT(α2)=0.9945CMCMixture:CMCMixture=2.08mol/L
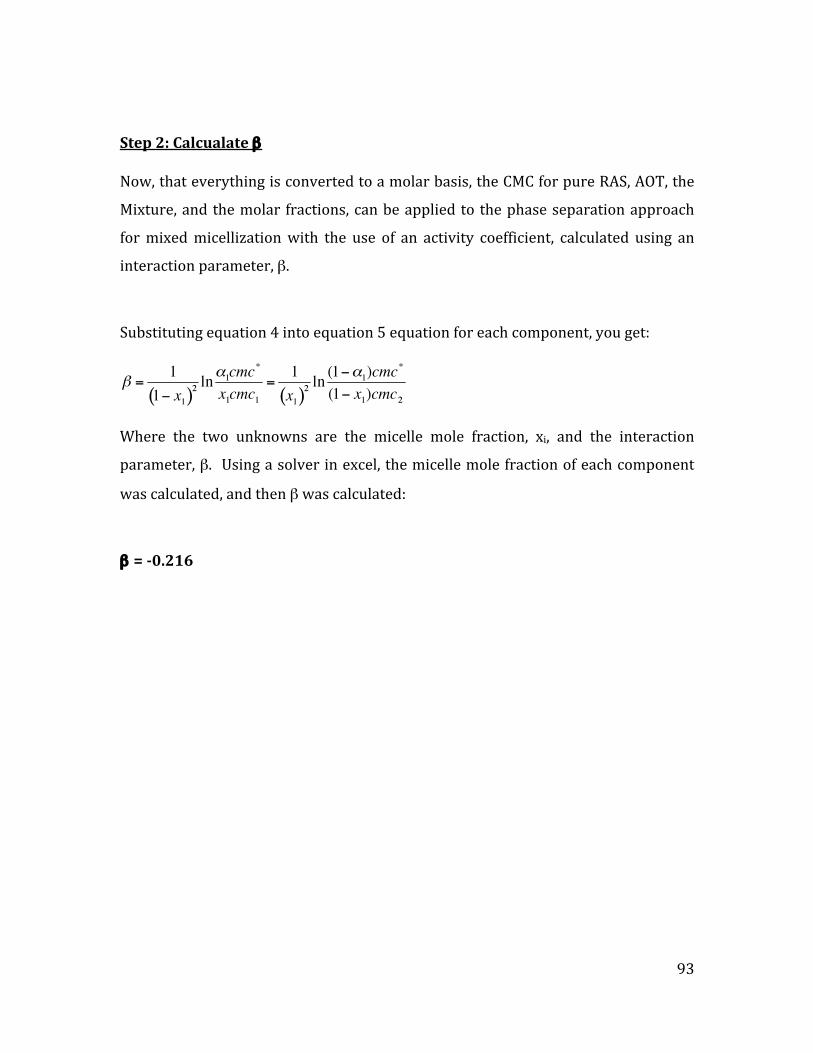
93
Step2:Calcualateβ Now,thateverythingisconvertedtoamolarbasis,theCMCforpureRAS,AOT,the
Mixture,andthemolar fractions,canbeappliedto thephaseseparationapproach
formixedmicellizationwith the use of an activity coefficient, calculated using an
interactionparameter,β.
Substitutingequation4intoequation5equationforeachcomponent,youget:
Where the two unknowns are the micelle mole fraction, xi, and the interaction
parameter,β. Usingasolverinexcel,themicellemolefractionofeachcomponent
wascalculated,andthenβwascalculated:
β =0.216

94
ReferencesGarciaBecerra,F.Y.,Acosta,E.J.,&Allen,D.G.(2010).Alkalineextractionof
wastewateractivatedsludgebiosolids.Bioresour.Technol.,101(18),6983‐91.Hassan,P.A.,Bhagwat,S.S.,&Manohar,C.(1995).Micellizationandadsorption
behaviorofbinarysurfactantmixtures.Langmuir,11(2),470‐473.Rosen,M.J.(2004).Surfactantsandinterfacialphenomena.(3rded.,pp.379‐414).
Hoboken,N.J.:Wiley‐Interscience.Rubingh,D.N.(1979).InK.L.Mittal(Ed.)SolutionChemistryofSurfactants:Volume
1(pp.337)NewYork:PlenumPress.