Surface water components of New Zealand’s National Water … water/surface-water... · 4 Surface...
18
13 May 2015 4.06 p.m. Surface water components of New Zealand’s National Water Accounts, 1995-2014 Prepared for Prepared for Prepared for Prepared for Ministry for the Environment Ministry for the Environment Ministry for the Environment Ministry for the Environment May 2015 May 2015 May 2015 May 2015
-
Upload
nguyendung -
Category
Documents
-
view
221 -
download
0
Transcript of Surface water components of New Zealand’s National Water … water/surface-water... · 4 Surface...

13 May 2015 4.06 p.m.
Surface water components of New
Zealand’s National Water
Accounts, 1995-2014
Prepared for Prepared for Prepared for Prepared for Ministry for the EnvironmentMinistry for the EnvironmentMinistry for the EnvironmentMinistry for the Environment
May 2015May 2015May 2015May 2015

© All rights reserved. This publication may not be reproduced or copied in any form without the permission of
the copyright owner(s). Such permission is only to be given in accordance with the terms of the client’s
contract with NIWA. This copyright extends to all forms of copying and any storage of material in any kind of
information retrieval system.
Whilst NIWA has used all reasonable endeavours to ensure that the information contained in this document is
accurate, NIWA does not give any express or implied warranty as to the completeness of the information
contained herein, or that it will be suitable for any purpose(s) other than those specifically contemplated
during the Project or agreed by NIWA and the Client.
13 May 2015 4.06 p.m.
Prepared by:
Daniel Collins
Christian Zammit
Andrew Willsman
Roddy Henderson
For any information regarding this report please contact:
Roddy Henderson
Group Manager
Applied Hydrology
+64-3-343 7873
National Institute of Water & Atmospheric Research Ltd
PO Box 8602
Riccarton
Christchurch 8011
Phone +64 3 348 8987
NIWA CLIENT REPORT No: CHC2015-013-v2
Report date: May 2015
NIWA Project: MFE15501
Quality Assurance Statement
Reviewed by:
Graeme Horrell
Approved for release by:
Charles Pearson

Surface water components of New Zealand’s National Water Accounts, 1995-2014
13 May 2015 4.06 p.m.
Contents
Executive summary ............................................................................................................. 4
1 Introduction .............................................................................................................. 5
2 Results ...................................................................................................................... 8
2.1 National Perspective ................................................................................................. 8
2.2 Regional Perspective ................................................................................................. 9
2.3 Year-to-year Variability ........................................................................................... 12
3 Discussion ............................................................................................................... 13
3.1 Uncertainty ............................................................................................................. 13
3.2 Validation ................................................................................................................ 13
4 Conclusions ............................................................................................................. 16
5 Acknowledgements ................................................................................................. 17
5.1 Hydro-generation data ........................................................................................... 17
5.2 Lake level data ........................................................................................................ 17
6 References ............................................................................................................... 18
Tables
Table 1. Names and land areas for regional accounting. 6
Table 2. The components of the water accounts covered by this report 7
Table 3: Water balance estimates for New Zealand. 13
Figures
Figure 1. Annual average water fluxes and changes in storage for nine of the 11 variables
nationally. 8
Figure 2. Percentage of the total national precipitation that falls on each region. 9
Figure 3. Percentage of the freshwater flows that occur within each region. 10
Figure 4. Average annual water fluxes and storage changes by region. 11
Figure 5. Annual variations in national water fluxes. 12
Figure 6: Comparison of annual rainfall at city raingauges with regional rainfall from
VCSN. 14
Figure 7: Runoff from Tasman District to the West Coast Region. 15
4 Surface water components of New Zealand’s National Water Accounts, 1995-2014
13 May 2015 4.06 p.m.
Executive summary
The Ministry for the Environment requires data, modelling and analysis of the surface water and
glacier ice components of the Water Physical Stock Account (WPSA) for inclusion in the 2015
Synthesis Report. This work will be used for reporting the impacts of the Atmosphere and Climate
domain on the state of water and land, under the new Environmental Reporting Framework. The
work is to include data up to the end of December 2013, subsequently extended to mid-2014. To
supply these requirements we have re-run the national TopNet model from July 1994 to June 2014,
extended records of lake volume change and hydro-electric generation water use from recording
authorities, and extended the national ice and glacier accounts. This report summarises the water
stock accounts of New Zealand and the 16 regions administered by regional councils or unitary
authorities, and is derived from a combination of directly measurement and modelled data.
The average annual precipitation across the country was 550,000 m3/year (equal to over nine times
the volume of Lake Taupo), a reduction from the previous water account calculations. Roughly 20%
of this evaporates before reaching the coast, leaving an average freshwater flow of 440,000 million
m3/year. There is substantial variation in this water flux from year to year due to a range of climatic
factors. Changes in storage – lakes, soil moisture, snow, and ice – represent very small components
of the annual water balance. Use of water for hydroelectric power generation represents a significant
portion of the nation’s freshwater resource, equating to 36% of the total freshwater flows, but this
figure includes multiple use of water within the same catchment.
Water fluxes at the regional scale vary depending on the region’s size as well as the spatial variability
in the delivery and movement of water. The West Coast receives the largest portion of precipitation
– 26% of the national total – and possesses 30% of the nation’s freshwater flow. Nelson City, due to
its small size, accounts for the smallest portion in both cases. Canterbury accounts for the greatest
portion of hydro-generation water use (mainly for the Waitaki scheme), followed by Waikato.
There is uncertainty in all aspects of the water accounts procedures, but validation checks of some of
the dominant input and output data allows confidence in the process and results.

Surface water components of New Zealand’s National Water Accounts, 1995-2014 5
13 May 2015 4.06 p.m.
1 Introduction
The National Institute of Water and Atmospheric Research Ltd (NIWA) has been commissioned by
Ministry for the Environment to estimate eleven components of the national and regional water
balance of New Zealand to update the previous accounts to 30 June 2014. To do this we have re-run
the national TopNet model from July 1994 to June 2014, extended records of lake volume change
and hydro-electric generation water use from recording authorities, and extended the national ice
and glacier accounts. We report on the full set of accounts from July 1994 to June 2014. Each year
runs from 1 July to 30 June, and is referred to by the year at the end of the period (e.g. the 1995 year
runs from 1 July 1994 to 30 June 1995). This report is a revision and update of three previous reports
on surface water information: Woods and Henderson (2003), Henderson et al. (2007), and
Henderson et al. (2011) This information is intended for use by the Ministry for the Environment and
Statistics New Zealand to assist them in updating the Water Physical Stock Accounts, as part of the
set of environmental accounts1.
The accounts are presented at two levels of spatial detail: national and regional. The regional
boundaries are defined by the 16 areas administered by regional councils and unitary authorities
(Table 1). Most of the region boundaries used in this study are essentially the same as those used in
the previous edition of the water accounts (Henderson et al., 2011) with the exception of Auckland
which reflects changes in Auckland Council’s area of jurisdiction.
1 http://www.stats.govt.nz/browse_for_stats/environment/natural_resources/environmental-accounts.aspx

6 Surface water components of New Zealand’s National Water Accounts, 1995-2014
13 May 2015 4.06 p.m.
Table 1. Names and land areas for regional accounting.
Region Name Region Area (km2)
Auckland 4,354
Bay of Plenty 11,939
Canterbury 44,915
Gisborne 8,452
Hawke’s Bay 14,090
Manawatu-Wanganui 22,198
Marlborough 10,126
Nelson 393
Northland 11,838
Otago 31,828
Southland 29,529
Taranaki 7,196
Tasman 9,548
Waikato 24,320
Wellington 8,012
West Coast 23,204
New Zealand 261,944
The 11 components of the accounts developed in this report and their derivation are listed in Table
2. Unless noted otherwise, all components are reported at both national and regional scales. The
components are estimated by a combination of direct calculation from measurements, spatial
mapping/modelling, and hydrological modelling. For a full description of how each component is
estimated, refer to Henderson et al. (2011).

Surface water components of New Zealand’s National Water Accounts, 1995-2014 7
13 May 2015 4.06 p.m.
Table 2. The components of the water accounts covered by this report
Component Name Description Derivation
1. Precipitation The total volume of rain/hail/snow/sleet during an
accounting period, before evapotranspiration is
taken into account.
National TopNet model rainfall
input derived from the Virtual
Climate Station Network (VCSN).
2. Inflows from rivers
(regional scale only)
The volume of water that enters each region from
rivers outside that region (regional accounts only).
GIS analysis of river networks
and regional boundaries.
3. Evapotranspiration The total volume of water lost by evapotranspiration
during an accounting period (actual
evapotranspiration, as opposed to potential).
Calculated in the national
TopNet model based on
potential evapotranspiration and
water availability.
4. Abstraction by hydro-
generation companies
The total volume of water abstracted from surface
water for electricity production by hydro-generation
companies during an accounting period.
Derived from power station
machine flows, and does not
include spill flows.
5. Discharges by hydro-
generation companies
The total of water discharged by hydro-generation
companies during an accounting period.
Equivalent to abstraction above.
6. Outflows to sea from
surface water
The total volume of water that flows to the sea
during an accounting period, before any abstractions
are removed (does not include any river flow to other
regions).
Output of national TopNet
model.
7. Outflows to other
regions (regional scale
only)
The total quantity of surface water that leaves a
region and flows to another region during an
accounting period (regional accounts only).
GIS analysis of river networks
and regional boundaries.
8. Net change in lakes
and reservoirs
The change in volumes of lakes and reservoirs during
an accounting period.
Derived from recorded lake level
data.
9. Net change in soil
moisture
The change in volume of water stored in land and soil
during an accounting period.
Derived from national TopNet
model.
10. Net change in snow The change in quantity of water stored in snow
during an accounting period.
Derived from national TopNet
model.
11. Net change in ice The change in quantity of water stored in ice during
an accounting period.
Derived from end-of-summer-
snowline survey (EOSS), and
observations of pro-glacial lake
development and down-wasting.

8 Surface water components of New Zealand’s National Water Accounts, 1995-2014
13 May 2015 4.06 p.m.
2 Results
The water accounts in this report comprise eleven component values (measured in m3), for 16
regions plus the whole of New Zealand, for each of 20 years. These were provided to Ministry for the
Environment in spreadsheet form, and will be summarised on their web site when the accounts are
published there.
In general one should expect any imbalances between inputs and exports of water to be balanced by
changes in storage (lake, soil moisture, snow and ice). This applies at both national and regional
scales. Because the lake and ice volumes presented are derived from different data sources to the
other variables, slight imbalances remain. If an exact balance is sought, it is recommended that the
outflow to sea component be adjusted.
2.1 National Perspective
Over the 20 year study period, 550,000 million m3 of water fell on New Zealand during an average
year. This equates to over 9 times the volume of Lake Taupo. Nearly 20% of this evaporates before
reaching the coast, leaving a freshwater resource of 440,000 million m3. Changes in lake, soil
moisture, ice, and snow storages are an extremely small portion of the water budget. Flow between
regions is accounted for by the other water fluxes. The total water use for hydro-generation
purposes equates to 36% of the total freshwater flows, though much of this water is used multiple
times (e.g., the cascade of eight power stations on the Waitaki and Waikato hydro-generation
schemes).
Figure 1. Annual average water fluxes and changes in storage for nine of the 11 variables nationally. Inflow
to and outflows from regions must be equal nationally, as are hydro-generation abstraction and returns.
Changes in lake and ice storage (marked with *) are negative but too small to resolve on the figure, as are the
positive soil moisture and snow storage changes.

Surface water components of New Zealand’s National Water Accounts, 1995-2014 9
13 May 2015 4.06 p.m.
2.2 Regional Perspective
Precipitation does not fall uniformly across New Zealand, and combined with the fact that regions
have different sizes, some regions are endowed with more or less water than others. Over the
extended water account period (1994 to 2014), the West Coast received 26% of national
precipitation input, followed by Southland’s 14% and Canterbury’s 12% (Figure 2). Because
evapotranspiration is also non-uniform, the proportion of the nation’s freshwater flows (outflows
minus inflows) is slightly different, with West Coast accounting for 30%, Southland 15%, and
Canterbury 11% (Figure 3).
Figure 2. Percentage of the total national precipitation that falls on each region.

10 Surface water components of New Zealand’s National Water Accounts, 1995-2014
13 May 2015 4.06 p.m.
Figure 3. Percentage of the freshwater flows that occur within each region. Sectors of the plot correspond
to the legend labels starting left of top centre and proceeding clockwise.

Surface water components of New Zealand’s National Water Accounts, 1995-2014 11
13 May 2015 4.06 p.m.
Regional fluxes (1994 to 2014) are dissected further in Figure 4, showing that inflows on average
balance outflows and changes in storage. Hydro-generation use can exceed total freshwater
availability because of re-use within the same catchment.
Figure 4. Average annual water fluxes and storage changes by region. Each region is represented by three
columns: inflows, outflows, and hydro-generation use (left to right). Negative changes in storage are added to
the inflows, and positive to the outflows.
0
20,000
40,000
60,000
80,000
100,000
120,000
140,000
160,000
An
nu
al
vo
lum
e (
mil
lio
ns
of
m3/y
ea
r)
Precipitation Inflow from other regions Outflow to seaEvapotranspiration Outflow to other regions Change in lakesChange in soil moisture Change in ice Change snowHydrogeneration use

12 Surface water components of New Zealand’s National Water Accounts, 1995-2014
13 May 2015 4.06 p.m.
2.3 Year-to-year Variability
The amount of precipitation that falls on New Zealand varies substantially from year to year, as a
result of various climatic factors (e.g., El Niño-Southern Oscillation; Southern Annular Mode;
Interdecadal Pacific Oscillation), and therefore so do other fluxes (Figure 5). While the long-term
average annual precipitation is 550,000 million m3, this has varied between a low of 470,000 and a
high of 640,000 million m3 – a range that equals 30% of the average. The proportion of the
precipitation that evaporates in any one year ranges from 17%-22%.
Figure 5. Annual variations in national water fluxes. Each year is represented by three columns: inflows,
outflows, and hydro-generation use (left to right). Negative changes in storage are added to the inflows, and
positive to the outflows.
Surface water components of New Zealand’s National Water Accounts, 1995-2014 13
13 May 2015 4.06 p.m.
3 Discussion
3.1 Uncertainty
The above estimates of water fluxes within New Zealand are based on the best available data and
modelling. That said, they are not without uncertainties. The rainfall data that drives the modelling is
an estimated data field based on scattered measurements. The model, too, is based on the best
available, yet imperfect, data.
These uncertainties can be gauged to some degree by comparing the national estimates reported
here to those from earlier studies, using a range of methods and data, including earlier water
accounts reports (Table 3). It is difficult to say which study is the most accurate, although it is fair to
say that of the four water accounts studies, the present one is indeed the most accurate.
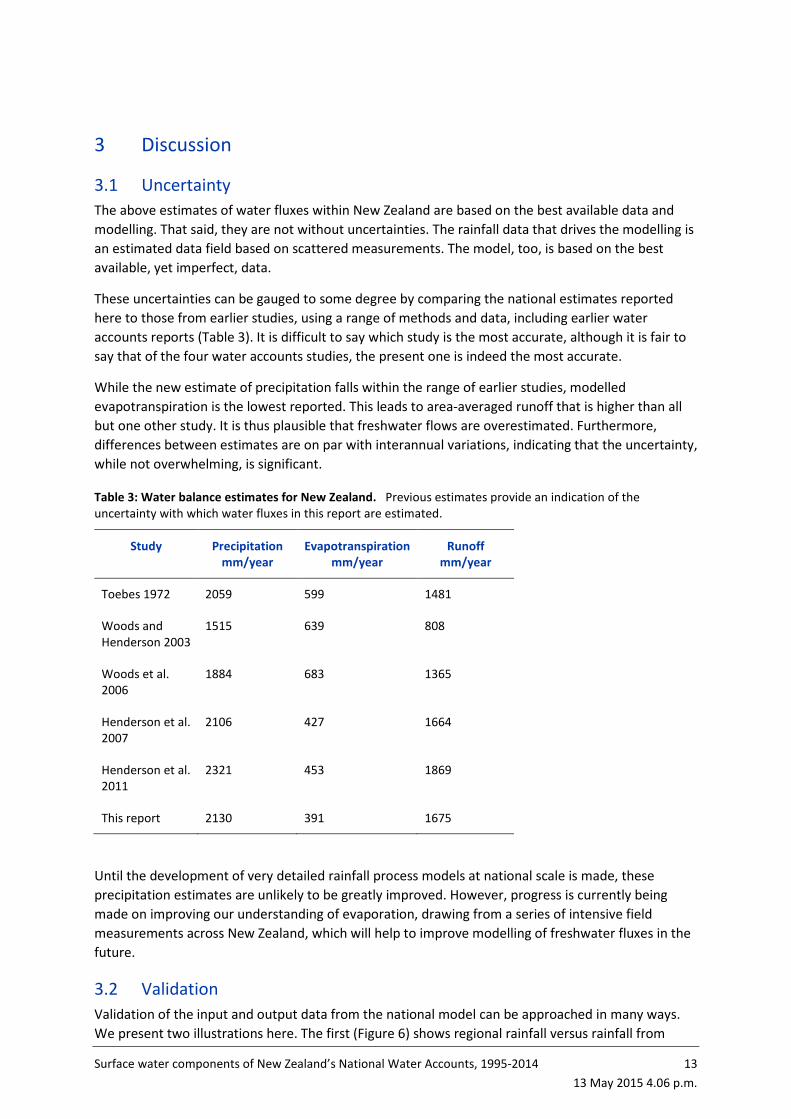
While the new estimate of precipitation falls within the range of earlier studies, modelled
evapotranspiration is the lowest reported. This leads to area-averaged runoff that is higher than all
but one other study. It is thus plausible that freshwater flows are overestimated. Furthermore,
differences between estimates are on par with interannual variations, indicating that the uncertainty,
while not overwhelming, is significant.
Table 3: Water balance estimates for New Zealand. Previous estimates provide an indication of the
uncertainty with which water fluxes in this report are estimated.
Study Precipitation
mm/year
Evapotranspiration
mm/year
Runoff
mm/year
Toebes 1972 2059 599 1481
Woods and
Henderson 2003
1515 639 808
Woods et al.
2006
1884 683 1365
Henderson et al.
2007
2106 427 1664
Henderson et al.
2011
2321 453 1869
This report 2130 391 1675
Until the development of very detailed rainfall process models at national scale is made, these
precipitation estimates are unlikely to be greatly improved. However, progress is currently being
made on improving our understanding of evaporation, drawing from a series of intensive field
measurements across New Zealand, which will help to improve modelling of freshwater fluxes in the
future.
3.2 Validation
Validation of the input and output data from the national model can be approached in many ways.
We present two illustrations here. The first (Figure 6) shows regional rainfall versus rainfall from

14 Surface water components of New Zealand’s National Water Accounts, 1995-2014
13 May 2015 4.06 p.m.
long-term raingauges in cities within four North Island regions. Cities are not generally in the wettest
part of a region and so the relationships are biased but reasonably consistent.
Figure 6: Comparison of annual rainfall at city raingauges with regional rainfall from VCSN. Rain gauges
at Auckland, Hamilton, Wellington and New Plymouth.

Surface water components of New Zealand’s National Water Accounts, 1995-2014 15
13 May 2015 4.06 p.m.
The second (Figure 7) shows the comparison between water crossing the regional boundary between
Tasman and West Coast, compared to the flow record from Buller at Longford, which represents
about one third of the area involved. The relationship between annual flows is strong, and the
multiplier is of the right order.
Figure 7: Runoff from Tasman District to the West Coast Region.

16 Surface water components of New Zealand’s National Water Accounts, 1995-2014
13 May 2015 4.06 p.m.
4 Conclusions
A set of 11 surface water components for the first set of national and regional water accounts has
been developed for New Zealand, for the period 1995-2014. The accounts capture the broad
temporal and regional variability of water movement and storage. They show that precipitation, river
flow to the sea, and evapotranspiration are the major components, and that abstraction/discharge
by hydro-generation is a substantial non-consumptive use.
There is uncertainty in all aspects of the water accounts procedures, but validation checks of some of
the dominant input and output data allows confidence in the process and results.

Surface water components of New Zealand’s National Water Accounts, 1995-2014 17
13 May 2015 4.06 p.m.
5 Acknowledgements
We acknowledge the following sources of information used in the preparation of these accounts:
they gave permission to use the data, and/or helped make it available:
5.1 Hydro-generation data
Contact Energy Ltd
Genesis Power Ltd
King Country Energy
Meridian Energy
Mighty River Power
NIWA (funded by NIWA under Environmental Information Programme 1 (2014/15 SCI))
Opus International Consultants
5.2 Lake level data
Auckland Council
Alpine Energy & ECS
Bay of Plenty Regional Council
Canterbury Regional Council
Contact Energy
NIWA (funded by NIWA under Environmental Information Programme 1 (2014/15 SCI))
NZX
Genesis Energy
King Country Energy
Meridian Energy
Mighty River Power
Opus International Consultants
Otago Regional Council
TrustPower
Waikato Regional Council
Greater Wellington Regional Council

18 Surface water components of New Zealand’s National Water Accounts, 1995-2014
13 May 2015 4.06 p.m.
6 References Henderson, R., Woods, R., Singh, S., Zammit, C. (2011) Surface water components of New Zealand's
National Water Accounts, 1995-2010. NIWA Client Report CHC2011-051: 45.
Henderson, R. D., Woods, R.A. and Tait, A.B. (2007) Surface water components of New Zealand's
National Water Accounts. NIWA Client Report CHC2007-046: 40.
Toebes, C. (1972). "The Water Balance of New Zealand." J Hyd (NZ) 11(2): 127-139.
Woods, R.A., Henderson, R.D. (2003) Surface water components of New Zealand’s National Water
Accounts, 1995-2001. NIWA Client Report No. CHC2003-074: 50.
Woods, R. A., J. Hendrikx, R. D. Henderson and A. B. Tait (2006). "Mean Flow Hydrology of New
Zealand Rivers." J Hyd (NZ) 45(2): 95-110.