Surface Water Assessment of Three Louisiana Watersheds · 1 Surface Water Assessment of Three...
8
Watershed Update Vol. 3, No. 2 March - April 2005 AWRA Hydrology & Watershed Management Technical Committee <[email protected]> 1 Surface Water Assessment of Three Louisiana Watersheds Y. Jun Xu and Adrienne Viosca School of Renewable Natural Resources Louisiana State University AgCenter Baton Rouge, LA 70803 Email: [email protected] http://hydrology.lsu.edu/ Louisiana has acquired the title as Sportsman’s Paradise due to the available hunting and fishing opportunities provided by the many rivers, lakes, and bayous. In addition to these water resources, aquifers are also abundant and benefit agricultural and forestry industries. While the state has more surface water available (84 percent) than many other states, rapid urbanization and intensive agricultural and forestry practices have increased the potential for deteriorating the quality of the state’s surface waters. Figure 1: Louisiana’s river basins and watersheds Watersheds are increasingly becoming the primary planning unit for natural resource management. Currently, Louisiana uses a set of 475 sub-segment watersheds in 12 river basins (Figure 1) as a spatial framework for its surface water quality assessment. The Louisiana Department of Environmental Quality (LDEQ) maintains a statewide water quality database that compiles discrete sample data collected from over 600 monitoring locations across the state. The state agency continues to collect water samples from Louisiana’s bayous, streams, rivers, and lakes for chemical and physical property analyses. Atchafalaya Barataria Calcasieu Mermentau Mississippi Ouachita Pearl Pontchartrain Red Sabine Terrebonne Vermilian-Teche Louisiana’s 12 Basins
-
Upload
nguyenmien -
Category
Documents
-
view
215 -
download
0
Transcript of Surface Water Assessment of Three Louisiana Watersheds · 1 Surface Water Assessment of Three...

Watershed Update Vol. 3, No. 2 March - April 2005
AWRA Hydrology & Watershed Management Technical Committee <[email protected]>
1
Surface Water Assessment of Three Louisiana Watersheds
Y. Jun Xu and Adrienne Viosca School of Renewable Natural Resources
Louisiana State University AgCenter Baton Rouge, LA 70803
Email: [email protected] http://hydrology.lsu.edu/
Louisiana has acquired the title as Sportsman’s Paradise due to the available hunting and fishing opportunities provided by the many rivers, lakes, and bayous. In addition to these water resources, aquifers are also abundant and benefit agricultural and forestry industries. While the state has more surface water available (84 percent) than many other states, rapid urbanization and intensive agricultural and forestry practices have increased the potential for deteriorating the quality of the state’s surface waters.
Figure 1: Louisiana’s river basins and watersheds
Watersheds are increasingly becoming the primary planning unit for natural resource management. Currently, Louisiana uses a set of 475 sub-segment watersheds in 12 river basins (Figure 1) as a spatial framework for its surface water quality assessment. The Louisiana Department of Environmental Quality (LDEQ) maintains a statewide water quality database that compiles discrete sample data collected from over 600 monitoring locations across the state. The state agency continues to collect water samples from Louisiana’s bayous, streams, rivers, and lakes for chemical and physical property analyses.
AtchafalayaBaratariaCalcasieuMermentauMississippiOuachitaPearlPontchartrainRedSabineTerrebonneVermilian-Teche
Louisiana’s 12 Basins

Watershed Update Vol. 3, No. 2 March - April 2005
AWRA Hydrology & Watershed Management Technical Committee <[email protected]>
2
In addition to the LDEQ’s surface water surveillance, the United States Geological Survey (USGS) collects water quality samples at many locations across the state. Most importantly, the federal agency maintains a statewide streamflow monitoring network that ensures continuous measurements of river stage and discharge of hundreds of bayous, streams, and rivers. Utilizing the large datasets provided by both agencies, water quality assessments are being conducted in three river basins located across the state’s northern upland and southern coastal plain regions. These basins are the Ouachita, Pontchartrain, and Atchafalaya (Figure 1). Forest BMP Effectiveness at the Watershed Scale Forest Best Management Practices (BMPs) are designed to reduce the impacts of forestry operations on water quality. Over the past two decades, many studies have been conducted in assessing the beneficial effects of BMPs in various geographical locations and under different forest types. Most of these studies have focused on the plot-scale effects and little is known of the effects BMPs have within a larger scale, such as a drainage network or a watershed. It is being increasingly recognized that knowledge of forest BMP impacts on water quality at a spatial magnitude is crucial for refining and improving the current management practices. A new project designed to address this issue is being conducted in a medium-size watershed called Flat Creek, located in the Ouachita Basin of northern Louisiana (Figure 2).
The research is specifically designed to quantify the initial impact and the extent of BMP timber harvesting activities on water quality by monitoring twelve locations throughout the watershed for two years (Figure 2). Three study plots have been selected in the watershed, two sites will be harvested implementing forestry BMPs and one site will remain undisturbed and serve as the control site. One pair of ISCO automatic water samplers will be stationed in all three areas, one upstream of the site and one downstream, for a total of six intensive monitoring sites. Water samples will be collected during storm events for a period of two years and analyzed for nutrient and sediment runoff.
In addition, six water quality monitoring sites have been established downstream of the harvested areas to serve as the extensive monitoring locations. Water samples will be manually collected on a monthly basis for the two year duration and analyzed for nutrient and sediment concentrations. During the first year no harvesting or forest management practices will occur at the sites and water collected will serve as a baseline for the study.

Watershed Update Vol. 3, No. 2 March - April 2005
AWRA Hydrology & Watershed Management Technical Committee <[email protected]>
3
Figure 2: Flat Creek watershed with monitoring locations It is expected that a change in water quality at the intensive sites will occur, but it is not clear if a change will be detected downstream at the extensive sites. The goal of the project is to develop a modeling system that is able to predict the effects of forest practices on water quality within an entire watershed. Freshwater Resources in the Lake Pontchartrain Basin
Lake Pontchartrain is a large oligohaline estuary along the northern coast of the Gulf
of Mexico. The entire lake drainage basin is a 12,170 square kilometer watershed encompassing 16 parishes in southeast Louisiana and four counties in Mississippi. Nearly 1.5 million people directly live around the 1,619 square kilometer lake that supports various species of fish, birds, mammals, and plants. As with many estuary ecosystems in the world, Lake Pontchartrain has been subjected to numerous anthropogenic impacts over the past half century including urban and agricultural runoff, shell dredging,

Watershed Update Vol. 3, No. 2 March - April 2005
AWRA Hydrology & Watershed Management Technical Committee <[email protected]>
4
artificial saltwater input, shoreline alteration, and industrial discharge. There is a concern that the combination of climate and land use changes may have dramatic impacts on the freshwater input and that the changes may pose a threat to the stability of ecosystems in southeast Louisiana. Freshwater inflow and sediment from upland tributaries are critical to the development of the diverse wetland, marsh, and aquatic ecosystems in the Lake Pontchartrain Basin. A study is currently being conducted in three watersheds, the Amite, Tickfaw, and Tangipahoa river watersheds (Figure 3), on the seasonality and interannual variability of freshwater inflow to Lake Pontchartrain. The goal of this research is to determine the extent a potential change in temperature and precipitation will affect water and sediment yields from the tributaries to Lake Pontchartrain and how these changes will be modified by urbanization and land use changes in the basin areas.
Figure 3: The Amite, Tickfaw and Tangipahoa River watersheds (from left to right) and Lake
Maurepas and Lake Pontchartrain in Southeastern Louisiana The Amite, Tichfaw, and Tangipahoa river watersheds contribute 70% of the
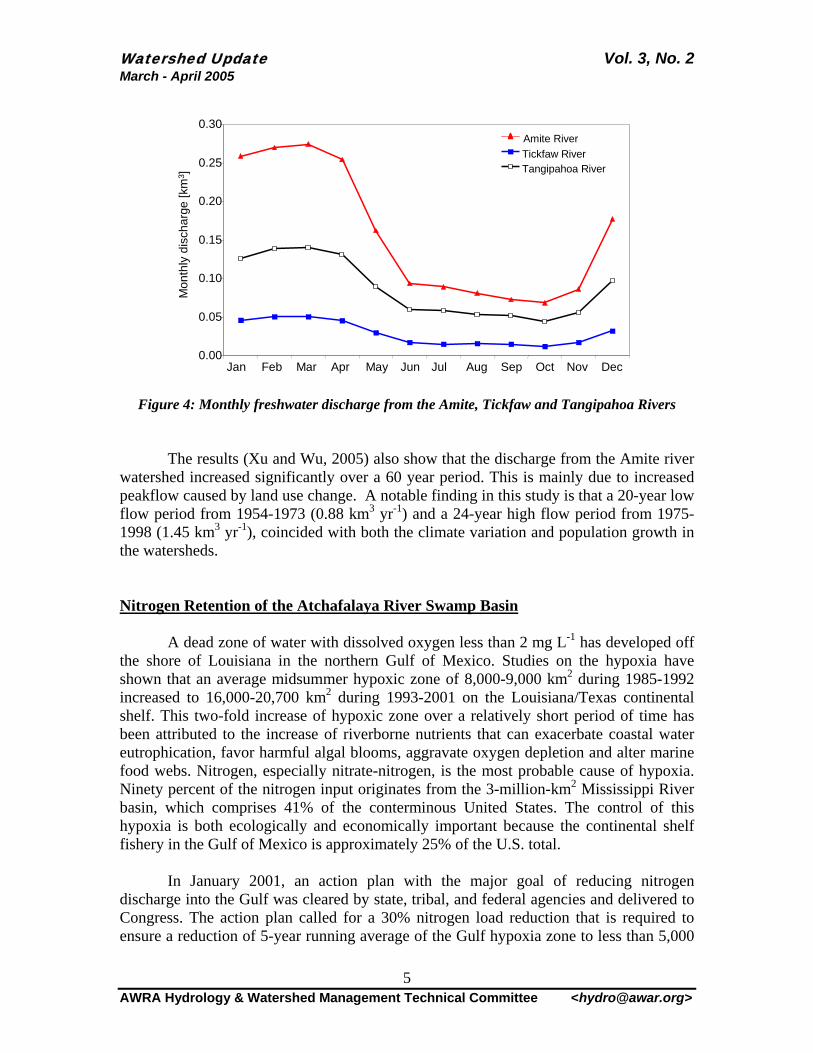
freshwater inflow to Lake Pontchartrain. Sixty years of river discharge and climatic data are being analyzed for trends in seasonal, annual and decadal changes. The preliminary results (Wu and Xu, 2005) show that, on average, the three watersheds delivered 5 km3 of fresh water each year to Lake Pontchartrain, with a large variation from 1 to 9 km3 yr-1. The discharge in these watersheds was highest from January to May and lowest from July to October (Figure 4), indicating a potential threat of high nutrient runoff into Lake Pontchartrain during the springtime. Additionally, the monthly inflow during the wet months was positively correlated with the monthly precipitation, while the monthly inflow during the dry months was subject to evapotranspiration.
#0#0 #0
#S
#S
Lake Maurepas
Lake Pontchartrain
Baton Rouge
New Orleans
#
Amite
#
Tickfaw
#
Tangipahoa
#
7378500 #
7376000#
7375500
Watershed Update Vol. 3, No. 2 March - April 2005
AWRA Hydrology & Watershed Management Technical Committee <[email protected]>
5
0.00
0.05
0.10
0.15
0.20
0.25
0.30
Mon
thly
dis
char
ge [k
m3 ]
Amite RiverTickfaw RiverTangipahoa River
Jan Feb Mar Apr May Jun Jul Aug Sep Oct Nov Dec
Figure 4: Monthly freshwater discharge from the Amite, Tickfaw and Tangipahoa Rivers
The results (Xu and Wu, 2005) also show that the discharge from the Amite river watershed increased significantly over a 60 year period. This is mainly due to increased peakflow caused by land use change. A notable finding in this study is that a 20-year low flow period from 1954-1973 (0.88 km3 yr-1) and a 24-year high flow period from 1975-1998 (1.45 km3 yr-1), coincided with both the climate variation and population growth in the watersheds. Nitrogen Retention of the Atchafalaya River Swamp Basin
A dead zone of water with dissolved oxygen less than 2 mg L-1 has developed off the shore of Louisiana in the northern Gulf of Mexico. Studies on the hypoxia have shown that an average midsummer hypoxic zone of 8,000-9,000 km2 during 1985-1992 increased to 16,000-20,700 km2 during 1993-2001 on the Louisiana/Texas continental shelf. This two-fold increase of hypoxic zone over a relatively short period of time has been attributed to the increase of riverborne nutrients that can exacerbate coastal water eutrophication, favor harmful algal blooms, aggravate oxygen depletion and alter marine food webs. Nitrogen, especially nitrate-nitrogen, is the most probable cause of hypoxia. Ninety percent of the nitrogen input originates from the 3-million-km2 Mississippi River basin, which comprises 41% of the conterminous United States. The control of this hypoxia is both ecologically and economically important because the continental shelf fishery in the Gulf of Mexico is approximately 25% of the U.S. total.
In January 2001, an action plan with the major goal of reducing nitrogen
discharge into the Gulf was cleared by state, tribal, and federal agencies and delivered to Congress. The action plan called for a 30% nitrogen load reduction that is required to ensure a reduction of 5-year running average of the Gulf hypoxia zone to less than 5,000

Watershed Update Vol. 3, No. 2 March - April 2005
AWRA Hydrology & Watershed Management Technical Committee <[email protected]>
6
km2 by 2015. A number of options are being considered for controlling nitrogen flow into the Gulf. Fresh water diversion from the lower Mississippi River into the region’s wetlands has been considered as one of the options. However, it is largely uncertain how much nitrogen can actually be retained from overflowing waters in these natural wetlands. Overall, there is a knowledge gap in what tools are available for accurate assessment of nitrogen inflow and outflow, and removal potential for the complex and diverse coastal floodplain systems.
An ongoing study is being conducted in the Atchafalaya River Swamp, a large
river swamp basin, which conveys 30% of the Mississippi River’s water into the Gulf of Mexico (Figure 6). The research seeks answers to three critical questions: (1) Does a natural swamp in this region remove a significant amount of nitrogen from the overflowing water or does it release more nitrogen into the Gulf rather than removing it? (2) How seasonally and annually do the nitrogen removal or release rates fluctuate? (3) What are the relationships between the nitrogen removal capacity and the basin’s hydrologic conditions such as river stage and discharge?
Figure 5: The Old River Control Structure where 30% of the Mississippi River’s water is
diverted into the Atchafalaya

Watershed Update Vol. 3, No. 2 March - April 2005
AWRA Hydrology & Watershed Management Technical Committee <[email protected]>
7
Monthly and annual nitrogen fluxes were quantified by utilizing the river’s long-term discharge and water quality data and their relationships with the basin’s hydrologic conditions were investigated. Long-term nitrogen inflow at Simmesport and outflows at Wax Lake Outlet and Morgan City (Figure 6) were analyzed. Nitrogen input – output budgets were established to assess total nitrogen mass removal rates of the Atchafalaya River Basin under different hydrologic regimes. Discharge data were obtained from the New Orleans District Office of the U.S. Army Corps of Engineers and the Louisiana District Office of the U.S. Geologic Survey in Baton Rouge. Water quality data was obtained from the Louisiana Department of Environmental Quality. The water quality data included monthly measurements on a series of chemical and physical parameters, of which monthly Total Kjeldahl Nitrogen (TKN) and nitrate plus nitrite nitrogen concentrations were used in this study.
Figure 6: Atchafalya River Basin with inflow and outflow locations
Wax Lake Outlet
Morgan City
Simmesport

Watershed Update Vol. 3, No. 2 March - April 2005
AWRA Hydrology & Watershed Management Technical Committee <[email protected]>
8
The preliminary results (Xu, 2005) show that on average, TKN input into the Atchafalaya was 200,323 tons/year and TKN output from the basin was 145,917 tons/year, resulting in a 27% removal rate of organic nitrogen. Monthly TKN input and output in the basin were highest from March to June (input vs. output: 25,000 vs. 18,000 tons/month) and lowest from August to November (8,000 vs. 6,000 tons/month) (Figure 7). There was a large variation in both annual and inter-annual organic nitrogen removals. The variability was positively correlated with the amount of inflow water at Simmesport, suggesting that regulating the river’s inflow may help reduce nitrogen loading of the Mississippi River to the Gulf of Mexico. Furthermore, the in-stream loss of organic nitrogen indicates that previous studies may have overestimated nitrogen discharge from the Mississippi-Atchafalaya River system.
Figure 7: Seasonal TKN mass input, output, and removal of the Atchafalaya River Swamp Basin
References Wu, K. and Y.J. Xu. 2005. Long-term freshwater inflow and sediment loading to Lake Pontchartrain. Hydrological Sciences Journal. (in review) Xu, Y.J., and K. Wu. 2005. Seasonality and interannual variability of freshwater inflow to a large oligohaline estuary in the Northern Gulf of Mexico. Estuarine, Coastal, and Shelf Science. (in review) Xu, Y.J. 2005. Nitrogen Retention of the Largest River Swamp in North America. In Proceedings: The 3rd Conference on Watershed Management to Meet Water Quality Standards and Emerging TMDL, March 5-9, 2005, Atlanta, Georgia, American Society of Agricultural Engineers: 14-23.
0
10000
20000
30000
0
5000
10000
15000
20000
Jan Feb Mar Apr May Jun Jul Aug Sep Oct Nov Dec
OutputInput
Flux (tons) Removal (tons)
Removal Rate
0
10000
20000
30000
0
5000
10000
15000
20000
Jan Feb Mar Apr May Jun Jul Aug Sep Oct Nov Dec
OutputInput
Flux (tons) Removal (tons)
Removal Rate