Enzyme-Catalyzed Modification of Poly(ethersulfone) Membranes

Surface modification of polyamide composite membranes by corona air plasma for gas separation applications
Journal: RSC Advances
Manuscript ID: RA-ART-12-2014-015547.R1
Article Type: Paper
Date Submitted by the Author: 25-Jan-2015
Complete List of Authors: Zarshenas, Kiyoumars; Amirkabir University of Technology (Tehran Polytechnic), Department of Chemical Engineering Raisi , Ahmadreza ; Amirkabir University of Technology (Tehran Polytechnic), Department of Chemical Engineering Aroujalian, A.; Amirkabir University of Technology (Tehran Polytechnic), Department of Chemical Engineering
RSC Advances

Journal Name RSCPublishing
ARTICLE
This journal is © The Royal Society of Chemistry 2014 J. Name., 2014, 00, 1-3 | 1
Cite this: DOI: 10.1039/x0xx00000x
Received 00th January 2014,
Accepted 00th January 2014
DOI: 10.1039/x0xx00000x
www.rsc.org/
Surface modification of polyamide composite
membranes by corona air plasma for gas separation
applications
Kiyoumars Zarshenas,a Ahmadreza Raisi
a,b, * Abdolreza Aroujalian
a,b
In this study, dual-layer polyamide 6/polyethersulfone (PA6/PES) composite membranes were
prepared via the phase inversion technique and corona air plasma was employed to modify the
membrane surface in order to improve the gas separation performance. The effect of corona
treatment parameters like exposure time and input power on the membrane surface properties,
morphology and separation performance was investigated. The gas separation performance of
the membranes before and after the corona treatment was evaluated by permeation
measurement for CO2, O2 and N2 gases. The FTIR-ATR, SEM, AFM and contact angle
analysis were used to characterize the untreated and corona treated membranes. The FTIR-
ATR and contact angle results indicated that the corona treatment introduced polar groups on
the membrane surface and led to significant enhancement in the membrane polarity,
hydrophilicity and wettability. The gas permeation results revealed that the permeability and
selectivity of the modified membranes strongly changed due to surface ablation and formation
of polar groups depending on the corona treatment conditions. An increase in corona treatment
time and input power resulted in higher gas permeability, however corona modification at high
power and longer exposure time led to a membrane with low gas selectivity.
Introduction
The membrane gas separation technology due to a number
advantages in terms of low energy requirements, modular
design, low capital investment, low maintenance cost, low labor
intensity, environmental safety as well as easy to operate and
compact equipments has been extensively investigated for
various gas separation applications including air separation,
hydrogen recovery and purification, flue gas separation and
natural gas processing.1-3 Both inorganic and polymeric
materials have been employed to prepare membranes for the
gas separation process. Various rubbery and glassy polymers
like polydimethylsiloxane (PDMS), polyacetylene, poly(1-
trimethylsilyl-1-propyne) (PTMSP), polyimide (PI), polyamide
(PA), polyarylate, polycarbonate (PC), polyethersulfone (PES),
a Department of Chemical Engineering, Amirkabir University of
Technology (Tehran Polytechnic), Hafez Ave., P.O. Box 15875-4413,
Tehran, Iran. b Food Process Engineering and Biotechnology Research Center,
Amirkabir University of Technology (Tehran Polytechnic), Hafez Ave.,
P.O. Box 15875-4413, Tehran, Iran. * Author for correspondence: Phone: (9821) 64543125, Fax: (9821)
66405847, E-mail: [email protected]
polysulfone (PSf), polyolefins, cellulose acetate (CA) and
polyphenylene oxide (PEO) have been employed for the gas
separations.4, 5 Among these polymers, polyimides have been
extensively used to fabricate membrane for the gas separation
applications because of high gas selectivity, excellent thermal
and chemical stability, mechanical strength and good film
forming properties. Polyamides are semi-crystalline polymers
which have properties similar to polyimides.6 Despite the
outstanding chemical and physical properties of polyamides,
this polymer was not explored much as membrane material for
use in the gas separation.
Generally, despite the excellent processability, the polymeric
membranes often have low separation performance. In order to
improve the separation performance and properties of the
polymeric membranes for the gas separation applications,
various techniques such as blending, incorporation of inorganic
fillers, surface modification and copolymerization have been
applied. Among these methods, the surface modification
method has the advantages of improving the surface
characteristics including wettability and polarity without
significant changes on the bulk properties of the membrane.7
The surface modification techniques involve coating, graft
Page 1 of 13 RSC Advances
Journal Name ARTICLE
This journal is © The Royal Society of Chemistry 2014 J. Name., 2014, 00, 1-3 | 2
polymerization, covalent attachment of functional monomers
and cold plasma treatment.8 Cold plasma techniques like glow
discharge,9, 10 radio frequency (RF)11, 12 and corona discharge13,
14 have been employed to modify the membrane surface to
improve the hydrophilicity, wettability, fouling resistance and
separation performance of the membrane.
Plasma techniques are very effective in polarity modification
accompanied by extensive etching on the surface.15 Generally,
the cold plasma has been used as a pretreatment in the graft
polymerization for surface modification of various membranes.
For instance, Weibel et al.16 employed RF plasma containing
oxygen, nitrogen or acrylic acid to modify the surface of
polyurethane membranes for use in the pervaporation process.
Zhu et al.17 employed the corona discharge plasma for the graft
polymerization of acrylic acid onto polyethersulfone
membranes to increase the fouling resistance for protein
solutions. Guo et al.18 also used the corona-induced graft
polymerization for coating acrylic acid onto the high-density
polyethylene microfiltration membrane to increase the
hydrophilicity of the membrane. Furthermore, some researchers
applied the cold plasma methods to directly modify different
polymeric membranes for use in the membrane processes such
as microfiltration, ultrafiltration and membrane distillation. For
example, oxygen, H2O and NH3 plasma techniques were used
by Steen et al.11, Kim et al.19 and Bryjak et al.20, respectively,
for modification of the polysulfone membranes to minimize the
fouling phenomena in the ultrafiltration process. Also, Sadeghi
et al.14 applied the corona air plasma to modify the surface of
the PES ultrafiltration membrane to enhance the surface
hydrophilicity and permeation properties of the membrane.
Moghimifar et al.21 used the corona discharge treatment to alter
the surface of the PES membrane for coating TiO2
nanoparticles on the membrane surface. In addition, various
cold plasma techniques were employed to alter the polymeric
membranes like polyimide7 ,polyethylene22 , polypropylene23 ,
poly(phenylenoxide)24 , polyamide 625 and PSf26, 27 in order to
improve their permeation performance for use in the gas
separation process. A search in the literature reveals that the use
of corona air plasma for the modification of the gas separation
membranes has not been previously reported.
In this work, dual-layer polyamide 6/polyethersulfone
composite membranes were fabricated by the phase inversion
technique and modified by corona air plasma to improve the
separation performance for use in the gas separation process.
The effect of the corona treatment parameters including
exposure time and discharge power on the membrane surface
properties and separation performance was studied. Fourier
transform infrared-attenuated total reflection (FTIR-ATR)
spectroscopy, scanning electron microscopy (SEM), atomic
force microscopy (AFM) and contact angle analysis were used
to characterize the surface properties of the modification
membranes.
Experimental
Materials
The commercial PES with molecular weight of 58000 g/mol
(ultrason E 6020P) and polyamide 6 (PA6) (Akulon F136-C1)
purchased from BASF (Ludwigshafen, Germany) and DSM
(Heerlen, Netherlands) were utilized as membrane material,
respectively. Formic acid and N,N-dimethyl-formamide (DMF)
as organic solvents received from Merck Co. Ltd. (Darmstadt,
Germany) were used for membrane preparation. Moreover, O2,
N2 and CO2 gases with purity of 99.99% were utilized as feed
gas in this work.
Membrane preparation
The porous PES membrane, used as a support layer for
preparation of PA6/PES composite membranes were prepared
by the non-solvent induced phase-inversion method. In this
procedure, 16 %wt. PES was dissolved into the DMF solvent
and then underwent vigorous stirring until a clear homogeneous
solution was obtained. The PES solution was de-aerated by a
vacuum process for 2 h and then cast on a glass plate with a
casting knife. The glass plate was immediately immersed into a
bath containing de-ionized water as non-solvent at room
temperature. After coagulation, the formed PES membrane was
separated from the glass plate. The obtained membranes were
stored in a soaking bath containing de-ionized water for 24 h
for complete removal of the residual solvent. Finally, the PES
membranes were dried for 24 h at room temperature.
The active dense layer of the composite membrane was
prepared by the solvent evaporation induced phase-inversion
method. For this purpose, 15 %wt. of PA6 was dissolved in
formic acid and then the prepared solution was stirred
vigorously at room temperature over night to obtain a clear
homogenous solution. Afterwards, the polymer solution was
de-aerated by a vacuum process for 2 h. Afterwards, the
bubble-free PA6 solution was cast on the porous PES support
membrane which was placed on a glass plate with a casting
knife. The dual-layer PA6/PES composite membrane was
formed by solvent evaporation in an oven at 35 °C for 24 h. The
thickness of the obtained dual-layer membranes was found to
be about 100±5 µm.
Membrane modification
To modify the surface of the dual-layer PA6/PES membranes,
the membrane was treated by the corona air plasma. The corona
treatment of the membranes was carried out in the air at
atmospheric pressure using a commercial device (Naaj Corona,
Naaj Plastic, Tehran, Iran). The membrane samples with a
uniform size of 5 cm × 5 cm were placed on the backing roller
covered with the silicon coating and rotating at a given speed.
The distance between the aluminum electrode and the backing
roller was adjusted to a specific value. Corona plasma was
generated within the air gap between the electrode and backing
roller. The membrane samples were treated when they came
into contact with the produced corona. To investigate the effect
of time and power of corona treatment on the membrane
modification, the corona input powers were varied within 240-
Page 2 of 13RSC Advances

Journal Name ARTICLE
This journal is © The Royal Society of Chemistry 2014 J. Name., 2014, 00, 1-3 | 3
600 W and the time period of 2-8 min. The prepared
membranes are named as presented in Table 1.
Gas permeation measurement
A pre-calibration cross flow flat sheet permeation cell with
constant volume and variable pressure was employed for the
permeation measurements. Pure gas permeation was tested in
the sequence of O2, N2 and CO2. The permeation experiments
were conducted at constant feed temperature and pressure of
25°C and 3 bar, respectively. The pressure of the permeate was
recorded at each 0.3 seconds and the rate of pressure
enhancement (��/��) was imported to Eq. (1) for the
permeation measurements. The gas permeability of the
prepared membranes was determined using the following
equation:
� =��.��������
�����(������.�
)(
��
��) (1)
where P is the permeation coefficient of gas (Barrer), V is
downstream volume (cm3), A is the effective area of membrane
(cm2), T is temperature (K), po is feed pressure (psia) and l is
membrane thickness (µm).
Also, the ideal selectivity of the membrane (αA/B) was
calculated from the pure gas permeation experiments as
follows:
J =!
".# (2)
Membrane characterization
FTIR-ATR spectroscopy was used to characterize the
functional groups on the membrane surface and detect the
chemical changes after the corona treatment. The FTIR-ATR
instrument used consisted of a Nicolet Nexus 670 spectrometer
(Nicolet Instrument Co., Madison, WI, USA) with 4 cm-1
resolution over a wave number range of 4000–600 cm-1. To
observe the difference between treated and untreated
membranes, for each test a 1 cm × 4 cm sample without further
treatment as used and the corona treated membranes were
tested right after being exposed to the corona. The morphology
of the membranes was analyzed by SEM images from the top
surface and cross section of the membranes with a SEM device
(KYKY-EM3200 SEM, China) at an accelerated voltage of 20
KV. To observe the image of the membrane cross section,
hydrate membrane samples were fractured by immersing them
into liquid nitrogen. Then all virgin and treated membranes
were stuck on a sample holder and the samples were coated
with a thin layer of gold layer by a sputtering system before
analysis.
Table 1: The corona treatment conditions of the membranes.
Membrane
sample
Corona input power
(w)
Corona time
(min)
M1 - -
M2 240 4
M3 320 4
M4 400 2
M5 400 4
M6 400 6
M7 400 8
M8 500 4
M9 600 4
membranes surface at room temperature with de-ionized water.
The CA of four different locations on the membrane surface
was measured and the average values were reported as CA for a
membrane sample.
The AFM analysis was used to measure the changes of the
membrane surface roughness before and after the corona
treatment. The AFM tests were performed using a microscope
(NanoEducator, NTMDT Co., Zelenograd, Russia) with a
spatial resolution of approximately 2nm in z direction. The
instrument was calibrated by standard samples (TGG1 and
TGX1, NT-MDT Co., Zelenograd, Russia). The membrane
samples were fixed on a holder double-sided tape and 5 µm × 5
µm areas were scanned by semi-contact mode in the air. Three
different locations were tested and the average values of
roughness were reported. The roughness was expressed as RMS
(root mean square) and RA (average roughness) values.
Results and discussion
FTIR-ATR spectroscopy
A particular increase in the membrane surface polarity after
modification by the corona treatment can be related to changes
in the functional groups on the membrane surface. The FTIR-
ATR spectrum of the untreated PA6/PES composite membrane
is shown in Fig. 1. In this spectrum, the amide bands of the PA6
layer appear at 1631 and 1533 cm-1 and N-H, CH2 (asymmetric
stretching) and CH2 (symmetric stretching) groups reveal at
wave number of 3288, 2921 and 2850 cm-1, respectively. Also,
the peaks between 1200 and 900 cm-1 can be ascribed to the
skeletal aliphatic C-C and aliphatic C-H rocking of the
polyamide.
To recognize the changes in the functional groups of the
membrane surface after the corona treatment, the FTIR-ATR
spectra of the untreated membrane and corona treated PA6/PES
sample at the corona power of 400 W and treatment time of 4
min are indicated in Fig. 2. Also, the ratio of absorbance
intensity of different functional groups with respect to that of
the C-C group in these spectra is given in Table 2.
Page 3 of 13 RSC Advances

Journal Name ARTICLE
This journal is © The Royal Society of Chemistry 2014 J. Name., 2014, 00, 1-3 | 4
Fig. 1: The FTIR-ATR spectrum of the untreated PA6/PES membrane.
Fig. 2: The FTIR-ATR spectra of the untreated and corona treated membrane (M5 membrane sample).
It can obviously observed from Table 2 that the relative ratio of
functional groups like C-N, C=O and amide bands to the C-C
group increases by the corona treatment of the polyamide layer
of the composite membrane. In the corona air plasma, the
corona ionizes the oxygen and nitrogen molecules in the
atmosphere and produces the ionized species and radicals.
These charged compounds attack the membrane surface leading
to C-C and C-H bond scission and formation of polar groups
like C-O, C=O and C-N. Table 2 also shows that the value of
normalized peak intensity for amide groups enhances for the
corona treated membrane. This indicates the formation of
additional amide groups due to the presence of oxygen in the
plasma zone. Similar results were reported for the O2 plasma
treatment of nylon fabrics.28
Besides, the influence of the corona treatment conditions on the
surface changes of the PA6/PES composite membranes was
investigated. The effect of corona input power at constant
treatment time on the surface modification of the membranes is
indicated in Fig. 3. The FTIR-ATR spectra in this figure reveal
that the absorbance intensity of C=O, C-N, amide I, amide II
and amide III groups at the corona power of 400 W is greater
than other corona powers. As discussed by Sadeghi et al.14 and
Moghimifar et al.21 , the effect of corona treatment conditions
on the surface modification can be related to the building effect
and damaging effect during corona treatment. These possible
Page 4 of 13RSC Advances

Journal Name ARTICLE
This journal is © The Royal Society of Chemistry 2014 J. Name., 2014, 00, 1-3 | 5
phenomena may counteract one another or overtake the other;
therefore depending on the power and time of the corona
treatment, different effects can be seen at different stages.
When the corona input power increases from 240 to 400 W, the
building effect is dominated, i.e. the corona treatment at these
input powers leads to formation of more functional groups on
the membrane surface due to creation of more radical sites
through the bond opening and reaction with the ionized species
in the corona gas. However, at high corona input power (600
W), the formation of active sites on the membrane surface
slows down and the damaging effect eventually dominates. At
this stage, the damaging effect of the corona treatment leads to
a decrease in the absorbance intensity of the functional groups
such as amides as well as C=O and C-N groups.
Table 2: The ratio of absorbance intensity of different
functional groups to C-C group in the FTIR-ATR spectra of the
M1 and M5 membranes.
Ratio of functional group M1 M5
C-N stretching/C-C stretching 0.989 1.117
Amide III/C-C stretching 0.925 1.525
Amide II/C-C stretching 1.193 1.242
Amide I/C-C stretching 1.494 1.542
C=O stretching/C-C stretching 0.387 0.783
N-H stretching/C-C stretching 0.774 0.742
Fig. 3: The effect of corona input power on the surface modification of PA6/PES membrane for treatment time of 4min: (a) the
FTIR-ATR spectra and (b) the peaks absorbance.
Page 5 of 13 RSC Advances

Journal Name ARTICLE
This journal is © The Royal Society of Chemistry 2014 J. Name., 2014, 00, 1-3 | 6
Fig. 4: The effect of corona treatment time at constant power 400 W on the surface modification of PA6/PES membrane: (a) the ATR-FTIR
spectra and (b) the peaks absorbance.
The influence of the corona treatment time on the absorbance
intensity of peaks and the functional group composition is
shown in Fig. 4. By comparing the FTIR-ATR spectra of the
untreated membrane and corona treated samples, it can be seen
that at short exposure to corona (2 min), initial degradation of
all bonds occurs, and during this stage, new bonds are not yet
formed so a little lowering in the absorbance intensity of all
bonds is discernible. At exposure time of 4 min, the absorbance
of amide I, amide II, amide III, C=O and C-N groups as polar
functional groups arrive at their maximum intensity and at
corona treatment times higher than 4min, a continues decline in
all bonds is observed. This trend can be attributed to the
damaging effect of the corona air plasma.
12, 20
Page 6 of 13RSC Advances
Journal Name ARTICLE
This journal is © The Royal Society of Chemistry 2014 J. Name., 2014, 00, 1-3 | 7
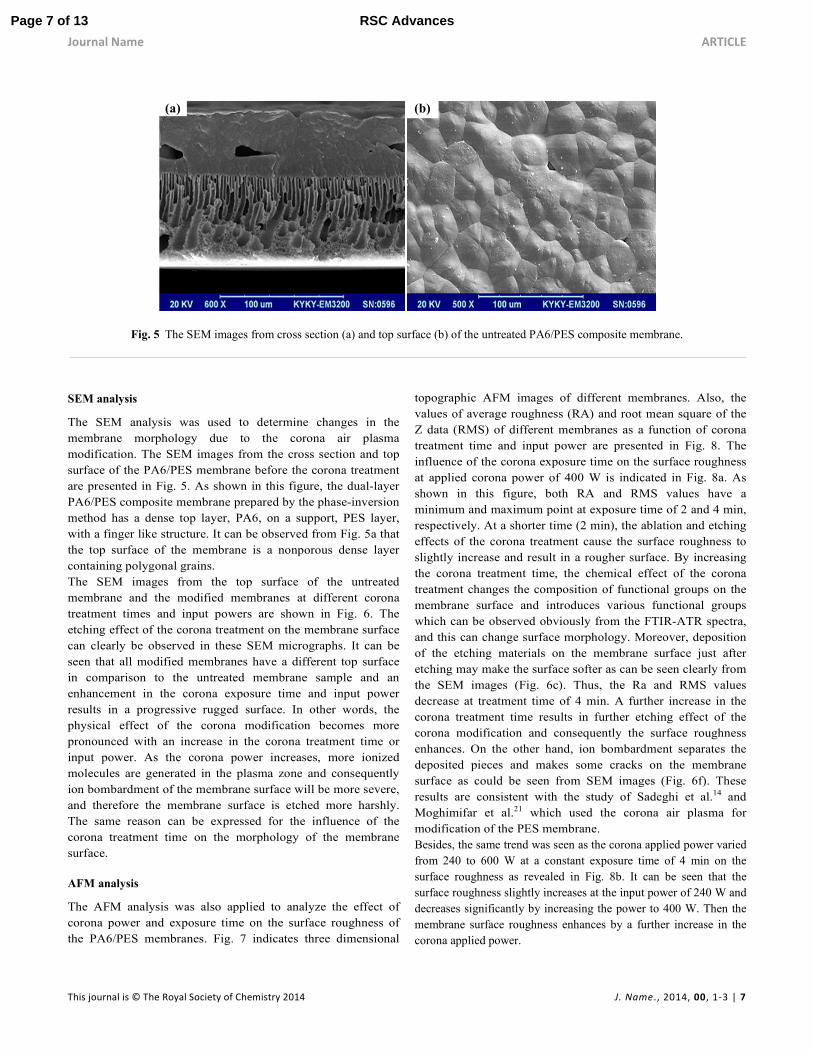
Fig. 5 The SEM images from cross section (a) and top surface (b) of the untreated PA6/PES composite membrane.
SEM analysis
The SEM analysis was used to determine changes in the
membrane morphology due to the corona air plasma
modification. The SEM images from the cross section and top
surface of the PA6/PES membrane before the corona treatment
are presented in Fig. 5. As shown in this figure, the dual-layer
PA6/PES composite membrane prepared by the phase-inversion
method has a dense top layer, PA6, on a support, PES layer,
with a finger like structure. It can be observed from Fig. 5a that
the top surface of the membrane is a nonporous dense layer
containing polygonal grains.
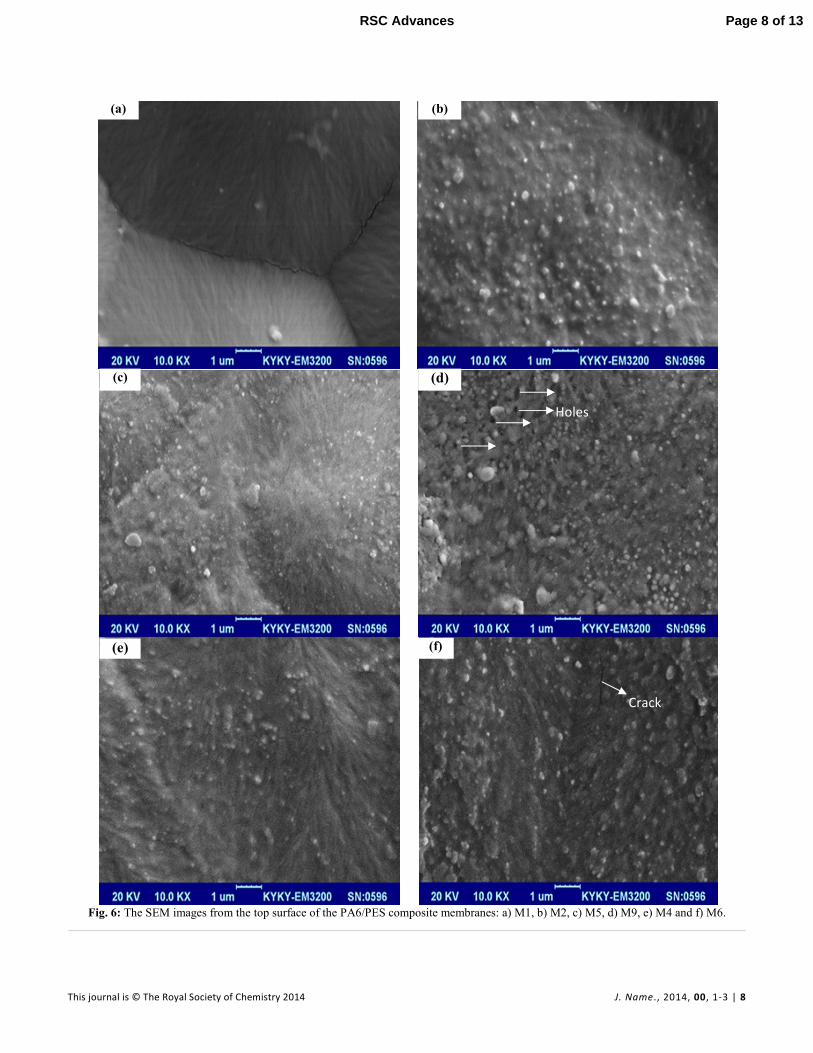
The SEM images from the top surface of the untreated
membrane and the modified membranes at different corona
treatment times and input powers are shown in Fig. 6. The
etching effect of the corona treatment on the membrane surface
can clearly be observed in these SEM micrographs. It can be
seen that all modified membranes have a different top surface
in comparison to the untreated membrane sample and an
enhancement in the corona exposure time and input power
results in a progressive rugged surface. In other words, the
physical effect of the corona modification becomes more
pronounced with an increase in the corona treatment time or
input power. As the corona power increases, more ionized
molecules are generated in the plasma zone and consequently
ion bombardment of the membrane surface will be more severe,
and therefore the membrane surface is etched more harshly.
The same reason can be expressed for the influence of the
corona treatment time on the morphology of the membrane
surface.
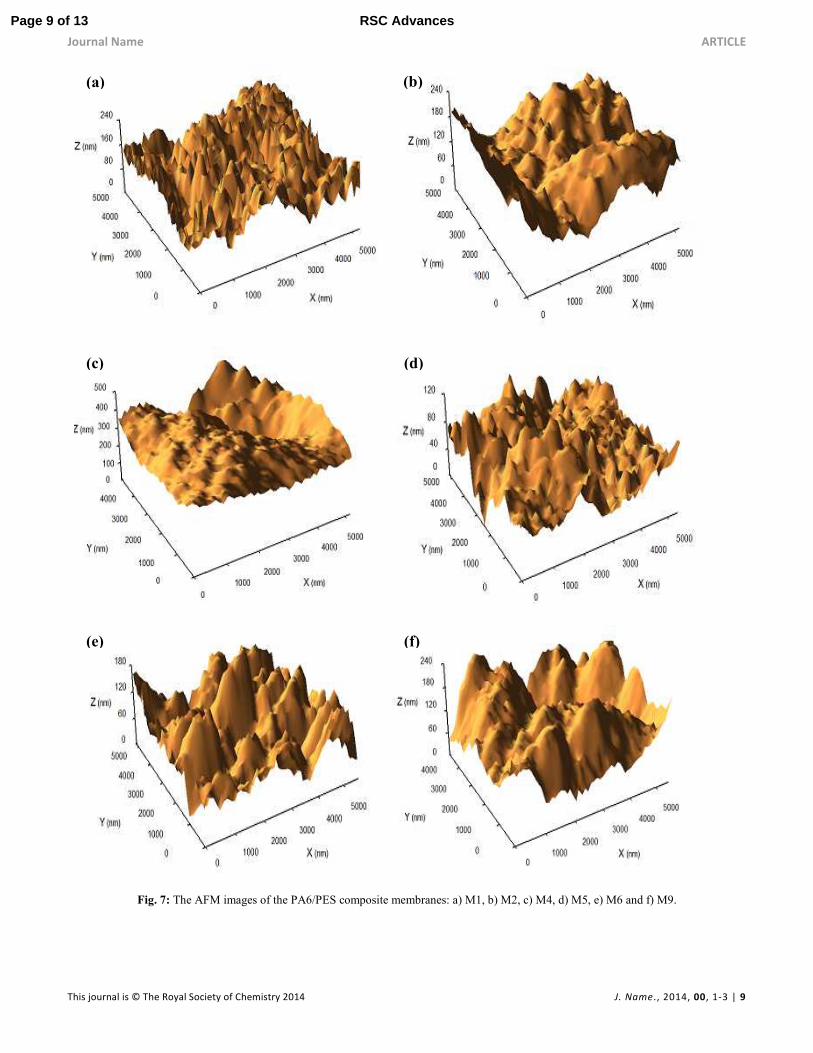
AFM analysis
The AFM analysis was also applied to analyze the effect of
corona power and exposure time on the surface roughness of
the PA6/PES membranes. Fig. 7 indicates three dimensional
topographic AFM images of different membranes. Also, the
values of average roughness (RA) and root mean square of the
Z data (RMS) of different membranes as a function of corona
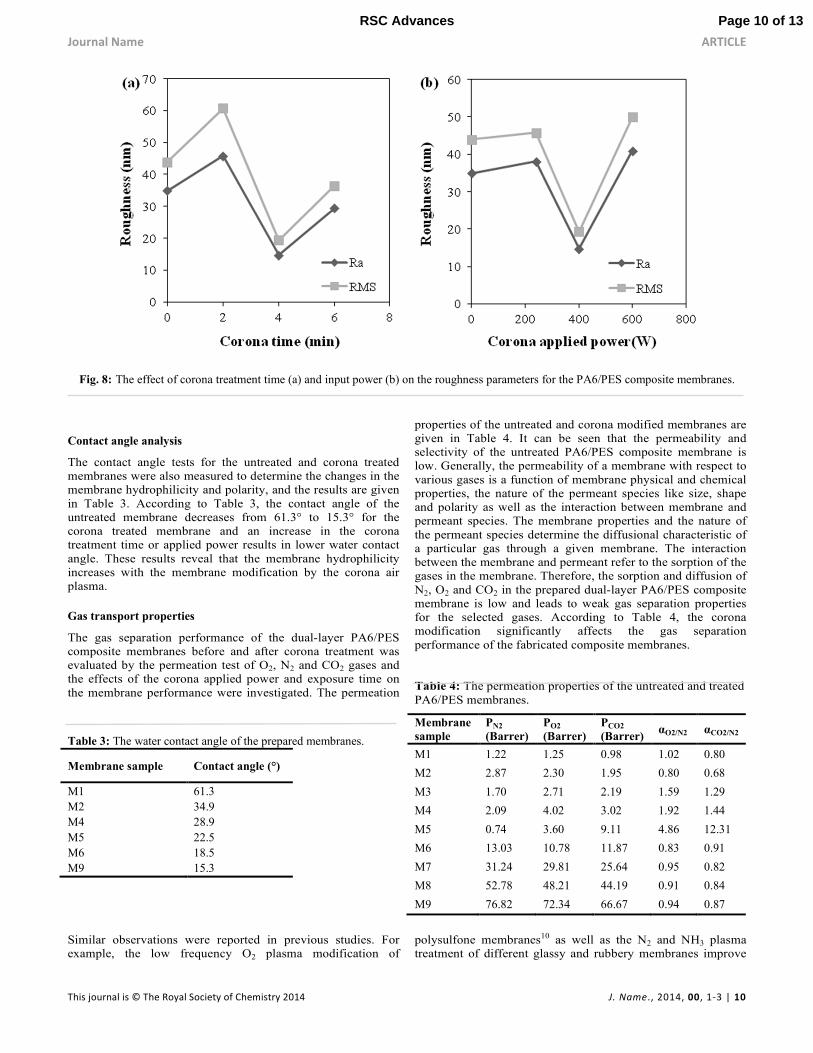
treatment time and input power are presented in Fig. 8. The
influence of the corona exposure time on the surface roughness
at applied corona power of 400 W is indicated in Fig. 8a. As
shown in this figure, both RA and RMS values have a
minimum and maximum point at exposure time of 2 and 4 min,
respectively. At a shorter time (2 min), the ablation and etching
effects of the corona treatment cause the surface roughness to
slightly increase and result in a rougher surface. By increasing
the corona treatment time, the chemical effect of the corona
treatment changes the composition of functional groups on the
membrane surface and introduces various functional groups
which can be observed obviously from the FTIR-ATR spectra,
and this can change surface morphology. Moreover, deposition
of the etching materials on the membrane surface just after
etching may make the surface softer as can be seen clearly from
the SEM images (Fig. 6c). Thus, the Ra and RMS values
decrease at treatment time of 4 min. A further increase in the
corona treatment time results in further etching effect of the
corona modification and consequently the surface roughness
enhances. On the other hand, ion bombardment separates the
deposited pieces and makes some cracks on the membrane
surface as could be seen from SEM images (Fig. 6f). These
results are consistent with the study of Sadeghi et al.14 and
Moghimifar et al.21 which used the corona air plasma for
modification of the PES membrane.
Besides, the same trend was seen as the corona applied power varied
from 240 to 600 W at a constant exposure time of 4 min on the
surface roughness as revealed in Fig. 8b. It can be seen that the
surface roughness slightly increases at the input power of 240 W and
decreases significantly by increasing the power to 400 W. Then the
membrane surface roughness enhances by a further increase in the
corona applied power.
(a) (b)
Page 7 of 13 RSC Advances
This journal is © The Royal Society of Chemistry 2014 J. Name., 2014, 00, 1-3 | 8
Fig. 6: The SEM images from the top surface of the PA6/PES composite membranes: a) M1, b) M2, c) M5, d) M9, e) M4 and f) M6.
(a) (b)
(c) (d)
(e) (f)
Crack
Holes
Page 8 of 13RSC Advances
Journal Name ARTICLE
This journal is © The Royal Society of Chemistry 2014 J. Name., 2014, 00, 1-3 | 9
Fig. 7: The AFM images of the PA6/PES composite membranes: a) M1, b) M2, c) M4, d) M5, e) M6 and f) M9.
(a) (b)
(c) (d)
(e) (f)
Page 9 of 13 RSC Advances
Journal Name ARTICLE
This journal is © The Royal Society of Chemistry 2014 J. Name., 2014, 00, 1-3 | 10
Fig. 8: The effect of corona treatment time (a) and input power (b) on the roughness parameters for the PA6/PES composite membranes.
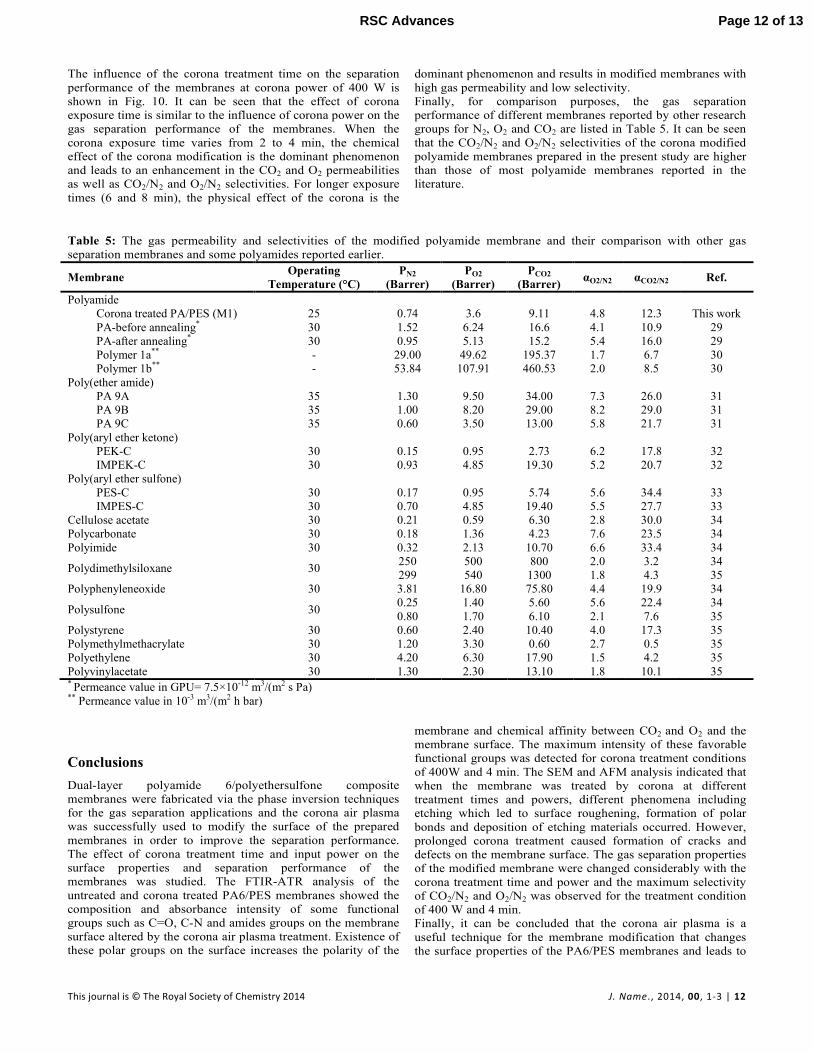
Contact angle analysis
The contact angle tests for the untreated and corona treated
membranes were also measured to determine the changes in the
membrane hydrophilicity and polarity, and the results are given
in Table 3. According to Table 3, the contact angle of the
untreated membrane decreases from 61.3° to 15.3° for the
corona treated membrane and an increase in the corona
treatment time or applied power results in lower water contact
angle. These results reveal that the membrane hydrophilicity
increases with the membrane modification by the corona air
plasma.
Gas transport properties
The gas separation performance of the dual-layer PA6/PES
composite membranes before and after corona treatment was
evaluated by the permeation test of O2, N2 and CO2 gases and
the effects of the corona applied power and exposure time on
the membrane performance were investigated. The permeation
properties of the untreated and corona modified membranes are
given in Table 4. It can be seen that the permeability and
selectivity of the untreated PA6/PES composite membrane is
low. Generally, the permeability of a membrane with respect to
various gases is a function of membrane physical and chemical
properties, the nature of the permeant species like size, shape
and polarity as well as the interaction between membrane and
permeant species. The membrane properties and the nature of
the permeant species determine the diffusional characteristic of
a particular gas through a given membrane. The interaction
between the membrane and permeant refer to the sorption of the
gases in the membrane. Therefore, the sorption and diffusion of
N2, O2 and CO2 in the prepared dual-layer PA6/PES composite
membrane is low and leads to weak gas separation properties
for the selected gases. According to Table 4, the corona
modification significantly affects the gas separation
performance of the fabricated composite membranes.
Table 4: The permeation properties of the untreated and treated
PA6/PES membranes.
Table 3: The water contact angle of the prepared membranes.
Membrane sample Contact angle (°)
M1 61.3
M2 34.9
M4 28.9
M5 22.5
M6 18.5
M9 15.3
Similar observations were reported in previous studies. For
example, the low frequency O2 plasma modification of
polysulfone membranes10 as well as the N2 and NH3 plasma
treatment of different glassy and rubbery membranes improve
Membrane
sample
PN2
(Barrer)
PO2
(Barrer)
PCO2
(Barrer) αO2/N2 αCO2/N2
M1 1.22 1.25 0.98 1.02 0.80
M2 2.87 2.30 1.95 0.80 0.68
M3 1.70 2.71 2.19 1.59 1.29
M4 2.09 4.02 3.02 1.92 1.44
M5 0.74 3.60 9.11 4.86 12.31
M6 13.03 10.78 11.87 0.83 0.91
M7 31.24 29.81 25.64 0.95 0.82
M8 52.78 48.21 44.19 0.91 0.84
M9 76.82 72.34 66.67 0.94 0.87
Page 10 of 13RSC Advances

Journal Name ARTICLE
This journal is © The Royal Society of Chemistry 2014 J. Name., 2014, 00, 1-3 | 11
the gas separation performance. Two phenomena are
impressive for the gas transport properties of the membrane
during corona air plasma treatment. One of them is the
chemical effect that introduces polar functional groups on the
membrane surface. The interaction between these functional
groups and permeant causes an increase in the affinity between
the membrane surface and permeant and enhances the solubility
of gases like CO2 and O2 over N2. Another phenomenon is a
physical effect that is the competitive effect between ablation of
the membrane surface due to etching and deposition of etching
materials and polymer fragments on the surface. These two
phenomena can affect the gas separation performance of the
corona modified membranes depending on the power and time
of the corona treatment. The effect of corona power and
exposure time on the gas permeability and selectivity are shown
in Fig. 9 and 10, respectively. As indicated in Fig. 9a, when
corona applied power from is varied from 240 to 400 W, the
CO2 and O2 permeabilities increase, while the N2 permeability
slightly decreases. This behavior can be attributed to
introducing functional polar groups on the membrane surface
and increasing the interaction between the O2 and CO2 gas
molecules with the membrane surface that leads to improving
the sorption of the O2 and CO2 gas molecules into the
membrane. An increase in the CO2 and O2 permeabilities leads
to an enhancement in the CO2/N2 and O2/N2 selectivities up to
12.31 and 4.86, respectively. As the corona input power
increases from 400 to 600 W, the CO2, O2 and N2
permeabilities significantly enhance, and this is followed by a
decrease in CO2/N2 and O2/N2 selectivities. This drastic
increase in the CO2, O2 and N2 permeabilities is the
consequence of the creation of pinholes and cracks on the
membrane surface due to the etching effect of the corona
modification. These defects are highlighted on the SEM image
of the M6 and M9 membrane samples (Figs. 6d and 6f).
Therefore, the corona modification of the prepared PA6/PES
membranes at input powers of 500 and 600 W results in
membranes with low gas separation performance.
Fig. 9: The effect of corona applied power on the gas permeability (a) and selectivity (b).
Fig. 10: The effect of corona treatment time on the gas permeability (a) and selectivity (b).
Page 11 of 13 RSC Advances
This journal is © The Royal Society of Chemistry 2014 J. Name., 2014, 00, 1-3 | 12
The influence of the corona treatment time on the separation
performance of the membranes at corona power of 400 W is
shown in Fig. 10. It can be seen that the effect of corona
exposure time is similar to the influence of corona power on the
gas separation performance of the membranes. When the
corona exposure time varies from 2 to 4 min, the chemical
effect of the corona modification is the dominant phenomenon
and leads to an enhancement in the CO2 and O2 permeabilities
as well as CO2/N2 and O2/N2 selectivities. For longer exposure
times (6 and 8 min), the physical effect of the corona is the
dominant phenomenon and results in modified membranes with
high gas permeability and low selectivity.
Finally, for comparison purposes, the gas separation
performance of different membranes reported by other research
groups for N2, O2 and CO2 are listed in Table 5. It can be seen
that the CO2/N2 and O2/N2 selectivities of the corona modified
polyamide membranes prepared in the present study are higher
than those of most polyamide membranes reported in the
literature.
Table 5: The gas permeability and selectivities of the modified polyamide membrane and their comparison with other gas
separation membranes and some polyamides reported earlier.
Membrane Operating
Temperature (°C)
PN2
(Barrer)
PO2
(Barrer)
PCO2
(Barrer) αO2/N2 αCO2/N2 Ref.
Polyamide
Corona treated PA/PES (M1) 25 0.74 3.6 9.11 4.8 12.3 This work
PA-before annealing* 30 1.52 6.24 16.6 4.1 10.9 29
PA-after annealing* 30 0.95 5.13 15.2 5.4 16.0 29
Polymer 1a** - 29.00 49.62 195.37 1.7 6.7 30
Polymer 1b** - 53.84 107.91 460.53 2.0 8.5 30
Poly(ether amide)
PA 9A 35 1.30 9.50 34.00 7.3 26.0 31
PA 9B 35 1.00 8.20 29.00 8.2 29.0 31
PA 9C 35 0.60 3.50 13.00 5.8 21.7 31
Poly(aryl ether ketone)
PEK-C 30 0.15 0.95 2.73 6.2 17.8 32
IMPEK-C 30 0.93 4.85 19.30 5.2 20.7 32
Poly(aryl ether sulfone)
PES-C 30 0.17 0.95 5.74 5.6 34.4 33
IMPES-C 30 0.70 4.85 19.40 5.5 27.7 33
Cellulose acetate 30 0.21 0.59 6.30 2.8 30.0 34
Polycarbonate 30 0.18 1.36 4.23 7.6 23.5 34
Polyimide 30 0.32 2.13 10.70 6.6 33.4 34
Polydimethylsiloxane 30 250
299
500
540
800
1300
2.0
1.8
3.2
4.3
34
35
Polyphenyleneoxide 30 3.81 16.80 75.80 4.4 19.9 34
Polysulfone 30 0.25
0.80
1.40
1.70
5.60
6.10
5.6
2.1
22.4
7.6
34
35
Polystyrene 30 0.60 2.40 10.40 4.0 17.3 35
Polymethylmethacrylate 30 1.20 3.30 0.60 2.7 0.5 35
Polyethylene 30 4.20 6.30 17.90 1.5 4.2 35
Polyvinylacetate 30 1.30 2.30 13.10 1.8 10.1 35 * Permeance value in GPU= 7.5×10⁻¹² m3/(m2 s Pa) ** Permeance value in 10-3 m3/(m2 h bar)
Conclusions
Dual-layer polyamide 6/polyethersulfone composite
membranes were fabricated via the phase inversion techniques
for the gas separation applications and the corona air plasma
was successfully used to modify the surface of the prepared
membranes in order to improve the separation performance.
The effect of corona treatment time and input power on the
surface properties and separation performance of the
membranes was studied. The FTIR-ATR analysis of the
untreated and corona treated PA6/PES membranes showed the
composition and absorbance intensity of some functional
groups such as C=O, C-N and amides groups on the membrane
surface altered by the corona air plasma treatment. Existence of
these polar groups on the surface increases the polarity of the
membrane and chemical affinity between CO2 and O2 and the
membrane surface. The maximum intensity of these favorable
functional groups was detected for corona treatment conditions
of 400W and 4 min. The SEM and AFM analysis indicated that
when the membrane was treated by corona at different
treatment times and powers, different phenomena including
etching which led to surface roughening, formation of polar
bonds and deposition of etching materials occurred. However,
prolonged corona treatment caused formation of cracks and
defects on the membrane surface. The gas separation properties
of the modified membrane were changed considerably with the
corona treatment time and power and the maximum selectivity
of CO2/N2 and O2/N2 was observed for the treatment condition
of 400 W and 4 min.
Finally, it can be concluded that the corona air plasma is a
useful technique for the membrane modification that changes
the surface properties of the PA6/PES membranes and leads to
Page 12 of 13RSC Advances

Journal Name ARTICLE
This journal is © The Royal Society of Chemistry 2014 J. Name., 2014, 00, 1-3 | 13
improvement of the gas separation properties of the membrane
without damaging the selective layer of the membrane at
optimum treatment conditions.
References 1. R. W. Baker, Industrial & Engineering Chemistry Research, 2002, 41,
1393. 2. C. A. Scholes, G. W. Stevens and S. E. Kentish, Fuel, 2012, 96, 15.
3. S. D. Kenarsari, D. Yang, G. Jiang, S. Zhang, J. Wang, A. G. Russell, Q.
Wei and M. Fan, RSC Advances, 2013, 3, 22739. 4. D. Bastani, N. Esmaeili and M. Asadollahi, Journal of Industrial and
Engineering Chemistry, 2013, 19, 375.
5. D. F. Sanders, Z. P. Smith, R. Guo, L. M. Robeson, J. E. McGrath, D. R. Paul and B. D. Freeman, Polymer, 2013, 54, 4729.
6. D. Bera, P. Bandyopadhyay, S. Ghosh and S. Banerjee, Journal of
Membrane Science, 2014, 453, 175. 7. K. Fatyeyeva, A. Dahi, C. Chappey, D. Langevin, J.-M. Valleton, F.
Poncin-Epaillard and S. Marais, RSC Advances, 2014, 4, 31036.
8. P. Attri, B. Arora and E. H. Choi, RSC Advances, 2013, 3, 12540. 9. A. Lin, S. Shao, H. Li, D. Yang and Y. Kong, Journal of Membrane
Science, 2011, 371, 286.
10. X. Wei, B. Zhao, X.-M. Li, Z. Wang, B.-Q. He, T. He and B. Jiang, Journal of Membrane Science, 2012, 407–408, 164.
11. M. L. Steen, L. Hymas, E. D. Havey, N. E. Capps, D. G. Castner and E.
R. Fisher, Journal of Membrane Science, 2001, 188, 97. 12. B. Jaleh, P. Parvin, P. Wanichapichart, A. P. Saffar and A. Reyhani,
Applied Surface Science, 2010, 257, 1655. 13. D. Tyszler, R. G. Zytner, A. Batsch, A. Brügger, S. Geissler, H. Zhou, D.
Klee and T. Melin, Desalination, 2006, 189, 119.
14. I. Sadeghi, A. Aroujalian, A. Raisi, B. Dabir and M. Fathizadeh, Journal of Membrane Science, 2013, 430, 24.
15. N. Hilal, M. Khayet ,C.J. Wright, Membrane Modification: Technology
and Applications, CRC Press, United State of America, 2012. 16. D. E. Weibel, C. Vilani, A. C. Habert and C. A. Achete, Surface and
Coatings Technology, 2006, 201, 4190.
17. L.P. Zhu, B.K. Zhu, L. Xu, Y.X. Feng, F. Liu and Y.Y. Xu, Applied Surface Science, 2007, 253, 6052.
18. H. Guo, C. Geng, Z. qin and C. Chen, Desalination and Water Treatment,
2013, 51, 3810.
19. K. S. Kim, K. H. Lee, K. Cho and C. E. Park, Journal of Membrane
Science, 2002, 199, 135. 20. M. Bryjak, I. Gancarz, G. Poźniak and W. Tylus, European Polymer
Journal, 2002, 38, 717.
21. V. Moghimifar, A. Raisi and A. Aroujalian, Journal of Membrane Science, 2014, 461, 69.
22. M. Nakata and H. Kumazawa, Journal of Applied Polymer Science, 2006,
101, 383. 23. T. Teramae and H. Kumazawa, Journal of Applied Polymer Science,
2007, 104, 3236.
24. H. Kumazawa and M. Yoshida, Journal of Applied Polymer Science, 2000, 78, 1845.
25. R. K. Y. Fu, I. T. L. Cheung, Y. F. Mei, C. H. Shek, G. G. Siu, P. K. Chu,
W. M. Yang, Y. X. Leng, Y. X. Huang, X. B. Tian and S. Q. Yang, Nuclear Instruments and Methods in Physics Research Section B: Beam
Interactions with Materials and Atoms, 2005, 237, 417.
26. S. Modarresi, M. Soltanieh, S. A. Mousavi and I. Shabani, Journal of Applied Polymer Science, 2012, 124, E199-E204.
27. E. F. Castro Vidaurre, C. A. Achete, F. Gallo, D. Garcia, R. Simao and A.
C. Habert, Materials Research, 2002, 5, 37. 28. K. K. Samanta, M. Jassal and A. K. Agrawal, Surface and Coatings
Technology, 2009, 203, 1336.
29. S. Sridhar, B. Smitha, S. Mayor, B. Prathab and T. M. Aminabhavi, Journal of Materials Science, 2007, 42, 9392-9401.
30. J. Petersen and K.V. Peinemann, Journal of Applied Polymer Science,
1997, 63, 1557-1563. 31. D. Bera, P. Bandyopadhyay, S. Ghosh and S. Banerjee, Journal of
Membrane Science, 2014, 453, 175-191. 32. Z. Wang, T. Chen and J. Xu, Macromolecules, 2000, 33, 5672-5679.
33. Z. Wang, T. Chen and J. Xu, Macromolecules, 2001, 34, 9015-9022.
34. V. Abetz, T. Brinkmann, M. Dijkstra, K. Ebert, D. Fritsch, K. Ohlrogge, D. Paul, K.-V. Peinemann, S.P. Nunes, N. Scharnagk and M. Schossig,
Advanced Engineering Materials, 2006, 8, 328-358.
35. C.J. Orme, M.L. Stone, M.T. Benson and E.S. Peterson, Separation Science Technology, 2003, 38, 3225-3238.
Page 13 of 13 RSC Advances