Surface modification of ASTM F-1537 Co-Cr alloy by …etheses.bham.ac.uk/4580/1/Liu13MRes.pdf ·...
108
Surface Modification of ASTM F-1537 Co-Cr Alloy by Low Temperature Plasma Surface Alloying A thesis submitted for the degree of Master of Research (MRes) By Ran Liu School of Metallurgy and Materials College of Engineering and Physical Science The University of Birmingham Oct 2013
-
Upload
nguyenphuc -
Category
Documents
-
view
215 -
download
0
Transcript of Surface modification of ASTM F-1537 Co-Cr alloy by …etheses.bham.ac.uk/4580/1/Liu13MRes.pdf ·...

Surface Modification of ASTM F-1537 Co-Cr Alloy by
Low Temperature Plasma Surface Alloying
A thesis submitted for the degree of
Master of Research (MRes)
By
Ran Liu
School of Metallurgy and Materials
College of Engineering and Physical Science
The University of Birmingham
Oct 2013

University of Birmingham Research Archive
e-theses repository This unpublished thesis/dissertation is copyright of the author and/or third parties. The intellectual property rights of the author or third parties in respect of this work are as defined by The Copyright Designs and Patents Act 1988 or as modified by any successor legislation. Any use made of information contained in this thesis/dissertation must be in accordance with that legislation and must be properly acknowledged. Further distribution or reproduction in any format is prohibited without the permission of the copyright holder.

ii
Surface modification of ASTM F-1537 Co-Cr alloy by low temperature
plasma surface alloying
Abstract
Cobalt-chromium (Co-Cr) alloys are one of the most suitable metallic biomaterials especially
for high load body implants owing to their fairly good wear resistance, high mechanical
properties, adequate corrosion resistance and acceptable biocompatibility. However, recently,
there are concerns over the wear of metal-on-metal artificial hip joints. The formation of
numerical nano-sized wear debris from the articulating Co-Cr surfaces could release chromium
and cobalt ions into the host body and cause potential toxicity. Therefore, how to improve the
wear resistance of Co-Cr alloys is a scientifically interesting and clinically important research
topic.
In this work, medical grade ASTM F-1537 Co-Cr alloy has been plasma nitrided (PN) and
plasma carbonitrided (PCN) at low temperature (between 300-400 °C) for 10-30 hours in order
to improve its surface hardness, wear, corrosion and corrosion-wear properties. The
microstructure and the mechanical, chemical and tribological properties of the modified
surfaces were fully characterised.
The results demonstrate that a carbon S-phase layer and a dual S-phase case can be generated
by PN and PCN respectively. When treated under the same conditions, a thicker hardened case
can be produced by PCN than by PN. The hardness and unlubricated wear resistance against a
WC ball can be increased respectively by more than 100% and two orders of magnitude by the
low temperature plasma treatments. The corrosion resistance of the low-temperature (≤350 C)
plasma surface nitrided Co-Cr-Mo alloy is similar to the untreated material and the plasma
carbonitrided samples possess better corrosion behaviour than the plasma nitrided samples.
Corrosion-wear resistance in a simulated body fluid (Ringer’s solution) can be increased by
5-10 times by some of the plasma treatments. Judging by the corrosion-wear performance, the
optimal plasma treatment for ASTM F-1537 Co-Cr-Mo alloy could be 350 C /20 h for plasma
nitriding and 375 C /20 h for plasma carbonitriding.

iii
ACKNOWLEDGEMENTS
I would like to express my gratitude to my supervisors, Professor Hanshan Dong and Dr
Xiaoying Li, for their invaluable help and thoughtful kindness throughout this project.
I also want to express my sincere thanks to all members of the Surface Engineering Group and
other staff from the School of Metallurgy and Materials who have helped me in my MRes
research.
Finally, I would like to express my deepest gratitude to my family and friends for their support
and understanding during my master study.

iv
Publication
R. Liu, X.Y. Li, X. Hu, H. Dong: Surface modification of a medical grade Co‐Cr‐Mo alloy
by low-temperature plasma surface alloying with nitrogen and carbon, Surface and Coating
Technology, 232(2013), 906-911.

v
Contents
CHAPTER 1 INTRODUCTION ....................................................................................................... 1
CHAPTER 2 LITERATURE REVIEW ............................................................................................... 3
2.1 Co-Cr Alloys ........................................................................................................................... 3
2.1.1 Metallic Biomaterials .................................................................................................................. 3
2.1.2 Cobalt and Co-Cr alloys .............................................................................................................. 4
2.1.2.1 A Historic Note on Cobalt ............................................................................................................ 4
2.1.2.2 Cobalt (Co) .................................................................................................................................. 5
2.1.2.3 Medical Grade Co-Cr-Mo alloys ................................................................................................. 6
2.1.3 Medical Applications & Problems .............................................................................................. 7
2.1.3.1 Applications ................................................................................................................................. 7
2.1.3.2 Problems ...................................................................................................................................... 8
2.2 Surface Engineering of Co-Cr Alloys ...................................................................................... 9
2.2.1 Surface Engineering .................................................................................................................... 9
2.2.2 Surface Engineering of Co-Cr Alloys ....................................................................................... 11
2.2.3 Plasma Treatment of Co-Cr ...................................................................................................... 13
2.2.4 S-phase Surface Modification of Co-Cr Alloys ........................................................................ 14
CHAPTER 3 EXPERIMENTAL ..................................................................................................... 16
3.1 Experimental Material ......................................................................................................... 16
3.2 Plasma Treatment ................................................................................................................ 16
3.2 Materials Characterisation ................................................................................................... 17
3.2.1 Hardness Measurement ............................................................................................................. 17
3.2.2 Scanning Electron Microscopy (SEM) ..................................................................................... 18
3.2.3 Glow Discharge Optical Emission Spectroscopy (GDOES)..................................................... 18
3.2.5 X-ray Diffraction....................................................................................................................... 19
3.2.6 Transmission Electron Microscopy (TEM) .............................................................................. 19
3.3 Corrosion Test ...................................................................................................................... 20
3.4 Tribological Test ................................................................................................................... 20
3.4.1 Reciprocating Wear Test ........................................................................................................... 20

vi
3.4.2 Wear Loss Evaluation ............................................................................................................... 21
CHAPTER 4 RESULTS ................................................................................................................ 22
4.1 Microstructure ..................................................................................................................... 22
4.1.1 Microstructure of As-received Material .................................................................................... 22
4.1.2 Surface Layer Structures ........................................................................................................... 23
4.1.2.1 Surface Layer Structure of PN Samples .................................................................................... 23
4.1.2.2 Surface Layer Structure of PCN Samples .................................................................................. 23
4.2 Hardness and Thickness of the Surface Treated Layers ....................................................... 24
4.2.1 Surface Hardness....................................................................................................................... 24
4.2.2 Thickness .................................................................................................................................. 25
4.2.3 Load Bearing Capacity.............................................................................................................. 26
4.2.4 Nano-indentation Hardness Test ............................................................................................... 27
4.3 Chemical Compositions of the Surface Layers ...................................................................... 28
4.3.1 PN Samples ............................................................................................................................... 28
4.3.2 PCN Samples ............................................................................................................................ 29
4.4 Phase Compositions of the Surface Layers ........................................................................... 31
4.4.1 XRD Analysis ........................................................................................................................... 31
4.4.2 TEM Study ................................................................................................................................ 33
4.4.2.1 Microstructure of the Substrate .................................................................................................. 33
4.4.2.2 PCN350/20 Sample .................................................................................................................... 33
4.4.2.3 PN350/20 Sample ...................................................................................................................... 34
4.5 Corrosion Resistance of Surface Treated Samples ................................................................ 35
4.5.1 Corrosion Behaviours of PN Samples....................................................................................... 35
4.5.2 Corrosion Behaviours of PCN Samples .................................................................................... 37
4.6 Tribological Properties ......................................................................................................... 38
4.6.1 Dry Wear Test ........................................................................................................................... 38
4.6.1.1 Plasma Nitrided Samples ........................................................................................................... 38
4.6.1.2 Plasma Carbonitrided Samples .................................................................................................. 41
4.6.2 Corrosion Wear Test ................................................................................................................. 41

vii
4.6.2.1 Plasma Nitrided Samples ........................................................................................................... 41
4.6.2.2 Plasma Carbonitrided Samples .................................................................................................. 42
CHAPTER 5 DISCUSSION .......................................................................................................... 44
5.1 Formation of S-phase............................................................................................................ 44
5.2 Lattice Expansion ................................................................................................................. 46
5.3 Micro- and Nano-Hardness .................................................................................................. 47
5.4 Corrosion Behaviour ............................................................................................................ 50
5.5 Wear Properties ................................................................................................................... 51
CHAPTER 6 CONCLUSIONS .......................................................................................................... 54
References ...................................................................................................................................... 56
Tables ............................................................................................................................................. 59
Figures ............................................................................................................................................ 62

1
CHAPTER 1 INTRODUCTION
Cobalt-chromium (Co-Cr) alloys have been considered as one of the most suitable metallic
materials for biomedical applications because these alloys feature fairly good wear resistance,
high mechanical properties, adequate corrosion resistance and acceptable biocompatibility [1,
2]. For instance, they have been used for metal-on-metal hip joints in recent years [3, 4].
However, both clinical and laboratory research has reported that very fine wear debris from
metal-on-metal hip joints bearing surfaces is the main constraint for the longevity of
metal-on-metal hip joints made of Co-Cr alloys [5]. The release of chromium and cobalt ions
into the host bodies has been a major concern because of their potential toxicity [6-8].
Low temperature plasma nitriding and carburizing can improve the surface hardness and
tribological properties of austenitic stainless steel without losing its corrosion by forming
carbon (C) or nitrogen (N) super-saturated face-centred cubic (fcc) expanded austenite phase,
so-called S-phase [9, 10]. More recently, Dong et al.[11, 12] have discovered that S-phase could
be generated in Co-Cr alloys by low temperature plasma surface alloying with carbon (i.e.
carburizing) to improve their wear resistance in air and corrosion-wear resistance in Ringers’
solution. However, to date, little work has been reported on low temperature surface alloying
with nitrogen (i.e. plasma nitriding) and no research has been reported on low temperature
plasma surface alloying with both nitrogen and carbon (i.e. carbonitriding) to improve the
corrosion-wear resistance of medical grade Co-Cr alloys.

2
Hence, the aim of this project was to explore the possibility of generating S-phase in medical
grade ASTM F-1537 wrought Co-Cr alloy by nitriding and carbonitriding to improve the wear
and corrosion-wear properties of the medical grade Co-Cr alloy. Specifically, the scientific and
technological objectives are as follows:
To investigate the potential of enhancing the wear and corrosion resistance of medical
grade Co-Cr alloys by low-temperature plasma surface alloying with N (nitriding) and
both N and C (carbonitriding);
To characterize the microstructure, phase constituent and chemical composition of the
low-temperature plasma surface engineered Co-Cr alloy; and
To evaluate the hardness, wear behaviour, corrosion resistance and corrosion-wear
properties of the plasma surface treated Co-Cr alloy.
In this thesis, a comprehensive state-of-the-art review is given in Chapter 2, followed by the
experimental method (Chapter 3). The experimental results are presented in Chapter 4 and their
interpretation and discussion are provided in Chapter 5. Finally, conclusions from the MRes
project and suggested future work are presented in Chapter 6.

3
CHAPTER 2 LITERATURE REVIEW
2.1 Co-Cr Alloys
2.1.1 Metallic Biomaterials
Metallic materials have been used for medical devices and surgical tools for many years. This is
mainly because, compared to polymeric and ceramic materials, metallic materials have a
desirable combination of strength, ductility, toughness and fatigue properties in conjunction with
easy fabrication using developed manufacturing methods, such as casting, forging.
The metallic biomaterial family consists mainly of austenitic stainless steels (ASSs), Co-Cr
alloys and titanium and its alloys. For the metallic biomaterials used as implants, there are
several requirements, which can be divided into three sections[13].
1. Biocompatibility [14];
2. Mechanical properties: strength [15, 16], toughness, Young’ modulus [17, 18], and
fatigue strength [19];
3. Surface properties: wear [15, 20] and corrosion [21] resistance.
Because the materials used for surgical implants require adequate biocompatibility, sufficient
corrosion resistance, high strength and fracture resistance, ASSs, Ti alloys and Co-Cr alloys are
currently used in clinical practice.
In general, austenitic stainless steels can meet most of the above requirements. However,
austenitic stainless steel implants are susceptible to pitting and crevice corrosion especially for
long-term (>10 years) application. On the other hand, Ti and Ti-based alloys have excellent

4
biocompatibility and corrosion resistance but their poor wear resistance has restricted their use
for the articulating surface of such high-load hip and knees joint prostheses [22, 23].
Co-Cr alloys are highly resistant to corrosion and fatigue and have better wear resistance than
ASSs and Ti alloys. Hence Co-Cr alloys have been considered as one of the best metallic
biomaterials for metal-on-metal hip joint prostheses [22, 24].
2.1.2 Cobalt and Co-Cr alloys
2.1.2.1 A Historic Note on Cobalt
Cobalt compounds had been used in glass and glazes for at least 4000 years before people
isolated metallic cobalt in later 18th
century. Cobalt was used as catalyst to synthesise methane
in 1902. And in 1905, some researchers found that high-speed steel with adding some cobalt
could improve its hot hardness.
In 1907, an automobile producer, E. Haynes was granted a USA patent on cobalt-chromium
(Co-Cr) alloys containing from 40 to 90 per cent cobalt, which was named Stellites. The largest
usage of cobalt is in high-temperature alloys since cobalt-base materials can remain their
hardness even at high temperature.
The USA patent of Co-Cr alloys owned by E. Haynes included cobalt-chromium and
cobalt-chromium-tungsten systems. These two are the compositional roots of contemporary
Co-Cr alloys. He discovered the high strength and stainless nature of the Co-Cr alloys and
suggested their applications such as cutting tools, cutlery and surgical instruments. Then the

5
cast cobalt-chromium-molybdenum alloys were developed as dental materials.
2.1.2.2 Cobalt (Co)
The density of cobalt is 8.85 and 8.80 g/cm3 for hcp and fcc structured Co, respectively. The
hardness of cobalt ranges from 140 HV to 250 HV depending on how the samples were
prepared. Fig.2.1.1 shows the equilibrium diagram of Co-Cr. There are two crystal structures of
cobalt: a close-packed hexagonal (hcp) form (ε) at temperatures below 417 C and a
face-centered-cubic (fcc) form (α) at temperatures above 417 C and below the melting point
(1495 C). The mechanism of the phase transformation is martensitic, involving dislocation
movements on the octahedral planes of the cubic lattice. The lattice parameters of the two
allotropes at the ambient temperature are given in Table 2.1.[1, 2]
The temperature of the allotropic transformation depends on the purity and on the rate of
temperature change. The free-energy for phase transformation from hcp to fcc is 500 Jmol-1
and
for fcc to hcp is 360 Jmol-1
, and so the experimental conditions can easily affect the crystal
structure [1, 2]. In practice, the stability of the crystal structure is sensitive to the grain size: the
finer grain size is the more likely for fcc to form. Therefore cobalt powders and sponge, or
evaporated thin films or fibres, may retain fcc structure at room temperature. Even in bulk form,
cobalt will not be entirely hexagonal due to some hot or cold deformation. In practice, the
structure of Co-Cr alloys at room temperature is normally dominated by the fcc form since the
rate of transformation from fcc phase to hcp phase is very slow[1, 2].
6
2.1.2.3 Medical Grade Co-Cr-Mo alloys
Cast Co-Cr-Mo (ASTM F-75) alloys, commonly known by their commercial names Vitallium
and Haynes 21, are one of very important materials for implants and their chemical
compositions are shown in Table 2.2. Cast CoCrMo (ASTM F-75) alloys can be made by
investment casting procedures. The high content of carbon makes the alloy highly wear
resistant mainly due to the M23C6, M7C3, and M6C carbides (where M represents cobalt,
chromium or molybdenum) that form throughout their structure during solidification [25]. The
major disadvantage of cast Co-Cr-Mo is the relatively low mechanical properties in terms of
yield strength and ductility. However, this alloy is corrosion resistance in chloride environments
due to the high chromium content and surface oxide [26].
Wrought Co-Cr-Mo is another important material for implants, which includes low and high
carbon versions, namely ASTM F-799 and F-1537 respectively. The chemical compositions are
shown in Table 2.2. Hot forging can be applied to low carbon alloys with relatively good
formability since they contain fewer and smaller carbides as compared with the high carbon
alloys. The hot forged alloys have desirable mechanical properties and the yield, ultimate and
fatigue strengths are significantly increased, even twice of as-cast F-75[27]. However,
comparing with cast high carbon Co-Cr-Mo, the wear resistance of the wrought low carbon
Co-Cr-Mo is much lower[25].
The procedures for wrought high carbon Co-Cr-Mo are more difficult and very close control on
forging and re-annealing stages is necessary. After all the process, the alloys not only gets fine

7
grains and strain hardened, but also break-up of the larger carbides formed during solidification.
The alloy gets higher strength as well as good wear resistance due to the finely distributed
carbides throughout the structure. The strengthening mechanisms for the Co-Cr-Mo alloys
include solid solution strengthening, carbide phase reinforcement, strain hardening, dispersion
strengthening, and dislocation-grain boundary interactions. The ultimate and yield strengths for
coarse grained cast structures is 860 MPa and 550 MPa with fatigue strengths being up to 450
MPa. However, the wrought alloys show much higher ultimate tensile strengths (1330-1450
MPa), yield strengths (960-1000 MPa) and fatigue strengths (690-930 MPa)[25]. The material
used in this project, ASTM F-1537, is a high-carbon wrought Co-Cr-Mo alloy (see Table 3.1 in
Chapter 3).
Table 2.2 also includes some other alloys such as ASTM F-562 known as MP35N [25, 26],
F-1058, F-90 and F-563 [25].
2.1.3 Medical Applications & Problems
2.1.3.1 Applications
Because Co-based alloys have very different properties, they have been used in many fields
especially in the biomedical industry. For example, due to the high carbon of F-1537 and F-75,
they are usually used for femoral ball or other surface bearing components. Instead, F-799 has
relatively poor wear resistance because of the low carbon, which make it unsuitable for the
components need bearing wear.

8
Most popular use of F-562 is for fracture fixation implants and conducting leads of cardiac
pacing systems; however, its high Ni content has limited its use with Ni-sensitive people.
Another Co-based alloy which has been used for fracture fixation implants is F-563, but it has
worse corrosion resistance than other Mo-containing Co-based alloys.
Due to the spring back quality of the F-1058, it has been used for neurosurgical and vascular
implants as well as conducting leads for pacemakers. F-1058 is also used for making
orthodontic wires in dentistry. F1058 Co-Cr usually use to make dental bridges, crowns, inlays
etc [2, 25, 26].
2.1.3.2 Problems
Recently, there are concerns over the wear of Co-Cr against Co-Cr articulating surfaces in
metal-on-metal joint replacements. Although the wear volume of metal-on-metal joint
replacements is much lower than that for metal-on-polymer joint replacements, the number of
wear debris has not been reduced but indeed increased due to the formation of nano-sized wear
particles [5].
These nano wear particles are believed to lead to rapid release of the ions, which will cause
immeasurable harm to the human body. The metal ions such as Cr and Co can produce
carcinogenic effect which cannot be tolerated in large quantities in human body and will cause
harmful reactions, which may result in foreign body reaction, and finally cause aseptic
loosening[6]. Therefore, how to increase the wear resistance of Co-Cr alloys and in turn reduce
the release of metal ions is technological important for biomedical implant manufacturers.

9
2.2 Surface Engineering of Co-Cr Alloys
2.2.1 Surface Engineering
Surface engineering involves a number of effective technologies to alter or improve the surface
properties of the materials. They can be divided into two categories: (1) surface coatings, in
which a layer of material with a different composition and microstructure is added onto a surface;
(2) surface modifications in which the composition and/or microstructure of surface is altered or
modified.
It should be pointed out that the bonding between a coating and the substrate is a potential
problem. For example, the delamination of hard TiN coating led to early failure of TiN coated
Ti-6Al-4V hip joints[28]. Therefore, surface modification is a more promising surface
engineering technology for body implants since there is no appreciable interface and hence no
delamination between the modified case and the substrate.
Surface modification includes several surface engineering technologies: (i) localized surface
hardening; (2) ion implantation and (iii) thermochemical treatments amongst others.
Localized surface hardening is a kind of technology of surface modification to improve wear
resistance through the development of a hard martensitic surface using flame, induction, laser or
electron beam [29]. However, such surface hardening technique is not applicable to such
non-ferrous alloys as Co-Cr. Ion implantation is another important surface modification
technology to enhance the friction and wear resistance of a variety of substrate. In ion
implantation, ions are injected into the surface of materials to modify the surface composition,

10
structure and hence properties [30]. However, the modified layer is extremely thin (<1 m) and
hence it could only offer limited hardening to Co-Cr surfaces. Thermochemical treatments
involve introducing alloying elements into the substrate, such as nitrogen, carbon, or boron. The
most common thermochemical treatments are nitriding and carburizing.
Carburizing is the addition of carbon into the surface of steel normally with low carbon. The
temperatures of the treatment are generally between 850 °C and 950 °C; at these temperatures
the austenite is the stable crystal structure, which has a high solubility for carbon. Based on the
different methods, carburizing can be divided into five groups: (1) pack carburizing, (2) salt bath
carburizing, (3) gas carburizing, (4) vacuum carburizing, and (5) plasma carburizing. In pack
carburizing, the component is put into a container covered with carbon powder. As long as
Co-Cr alloys are concerned, plasma carburising is potentially most effective thermochemical
treatment. This is because plasma carburizing impinges positive carbon ions on the surface of
the sample (cathode); the ion sputtering can effective remove the surface oxide film formed on
Co-Cr alloys. In addition, plasma can effectively reduce the treatment time and obtain very
uniform case depths even in parts with irregular surfaces [31].
Nitriding is a thermochemical treatment method to harden materials surface by introducing
nitrogen into the surface at a temperature between 500 and 550 °C. The treatment temperature is
much lower than carburizing, and so nitriding is carried out in the ferritic condition for steel. The
treatment time for nitriding usually is much longer and the nitrided case is much shallower than
carburizing[31]. Plasma nitriding is one of the most suitable nitriding methods for Co-Cr alloys
since ion sputtering can effectively remove their surface oxide films.

11
There are some hybrid thermochemical treatments, such as carbonitriding, in which both carbon
and nitrogen are diffused into the substrate at the same time. There are some other surface
hardening with carbon and nitrogen including nitrocarburizing. Carbonitriding is mainly focused
on carbon diffusion, whilst nitrocarburizing is concentrated on introducing nitrogen into the
materials. Carbonitriding usually carry out at a lower temperature than carburizing, which
produces a shallower layer than carburizing, but the nitrogen diffused into the materials
increases the hardening effect.
2.2.2 Surface Engineering of Co-Cr Alloys
Yang et al. [32] used severe plastic deformation processes to modify the surface of Co-Cr-Mo
alloys to generate ultrafine or even nanometer-sized grains. The reduction of grain size from 80
µm to 300 nm was obtained by cryogenic burnishing, and the microhardness of the materials
increased 87% comparing to bulk value.
Diamond films and composites have been investigated by Godbole et al. [33] to enhance the
surface physical and chemical properties of Co-Cr alloys. Owing to the catalytic effects of cobalt
in promoting nucleation and growth of graphitic phase and the thermal expansion coefficient
mismatch between substrate and diamond coatings, they designed a buffer layer consisting of
titanium carbide to act as diffusion barriers for cobalt. Since a single layer of TiC is not
sufficient to help to form a continuous layer of diamond film due to thermal stresses,
AlN-diamond and TiC-diamond composite coatings were synthesized, which addressed the
problems of the thermal stresses.

12
A hard diamond-like carbon (DLC) coating was deposited on Co-Cr alloy by Roy et al. [34] to
enhance the hardness and resilience of bearing surfaces for use in joint arthorplasty. Co-Cr
alloys were deposited by an amorphous DLC coating about 3µm thick using a proprietary radio
frequency plasma chemical vapour deposition process. The microhardness of the specimens
was evaluated by Vickers microhardness tests under 0.3 kg and 0.5 kg. The results showed that
the nano-hardness of DLC-coated Co-Cr alloy was up to 24.5 GPa with the non-coated Co-Cr
alloy being only 6.71 GPa.
In orthopaedic prostheses, both metal-on-metal and metal-on-polymer bearing surfaces are used.
The metallic component is usually made from Co-Cr or titanium alloy, and the polymer
component is made of ultrahigh molecular weight polyethylene (UHMWPE). Ion implantation
of Co-Cr can increase the surface energy and hardness, and the increased surface energy allows
better retention of a lubricating fluid film, resulting in less wear on the UHMWPE component.
Onate et al. [35] have studied the wear of Co-Cr alloy with and without nitrogen ion
implantation against UHMWPE. Up to 5 million wear cycles that represent about 3 years of
implant life, the results showed that wear of UHMWPE was reduced approximately five times
when against ion implanted Co-Cr reduces than against untreated Co-Cr. However, it is difficult
to evenly implant joint components with 3D shapes due to the line-of-sight nature of
conventional ion implantation technique.

13
2.2.3 Plasma Treatment of Co-Cr
Plasma immersion ion implantation (PIII) can effectively solve some the disadvantages of
conventional ion implantation. Nitrogen PIII of Co-Cr was conducted by Eichentopf et al.[36]
using negative high voltage pulses of 25 kV with an incident fluence of up to 3×10¹⁸
nitrogen
atoms·cm-2
. The treatments were carried at temperatures between 300 and 600 °C for 3 hours
and the corresponding treated depths between 500 to 5000 nm. The phase composition was
studied using XRD and the fcc substrate material can still be visible at 300 °C. With the
increased treatment temperature, the depth of the nitrogen diffusion grew up but the XRD
results showed CrN and Cr2N when treated at temperatures above 300 °C.
Moreover, two new fcc peaks corresponding to a lattice expansion were found. The hardness of
the base materials is between 3 and 5 GPa. After the nitrogen PIII treatment, with increasing
temperature, the surface hardness increased with the maximum values being between 20 and 25
GPa. With the increased surface hardness, after the nitrogen PIII treatment, the linear wear rate
reduced up to a factor of ten. However, no corrosion-wear results were reported, which are very
important for body implants.
High-intensity plasma ion nitriding of forged Co-Cr-Mo and cast Co-Cr-Mo at temperatures
ranging from 300 to 800 °C have been investigated by Wei et al [37, 38]. This technology
combined the advantages of immersed plasma technique and plasma enhanced thermal
diffusion. The results from forged Co-Cr-Mo have indicated a wear reduction of 30-60 times
over the untreated samples. However, it is expected that the corrosion and corrosion-wear
properties of the samples would be impaired due to the relatively high temperatures were used.

14
Some researchers conducted plasma nitriding of wrought Co-Cr-Mo alloys at temperatures
between 600 and 800 °C. For example, Celik et al. [39] plasma nitrided wrought Co-Cr-Mo
alloys at 600, 700 and 800 °C for 1 to 4 hours with a gas mixture of 75% N2 and 25% Ar. They
found that CrN, CrN and Cr2O3 phases were formed from every condition, and Cr2N increased
as the time and temperature increased. The hardness and wear resistance rose with increasing
treatment time and temperatures. Baybak et al[40] studied the fatigue life of high-temperature
(600 to 800 °C) plasma nitrided Co-Cr-Mo, and the results showed that whilst the hardness and
elastic modulus increased, on the other hand the fatigue lives of the nitrided samples reduced by
7-23%. Plasma nitriding of forged Co-Cr-Mo alloy were also performed by Wang et al. [41] at
temperatures between 600 to 800 °C for 9 hours. The results indicated that a thick, hard and
wear resistance layer with hard CrN and Cr2N phases was produced, which can effectively
reduce wear of the materials. However, these high-temperature plasma nitriding treatments will
reduce the corrosion resistance of Co-Cr alloys due to the precipitation of chromium nitrides
and are not useful for the surface modification of medical grade Co-Cr alloys for body implants.
2.2.4 S-phase Surface Modification of Co-Cr Alloys
As briefly discussed above, thermochemical treatments such as nitriding and carburizing can
significantly enhance the hardness and wear resistance of most ferrous materials. However,
when applied to such corrosion resistant alloys as stainless steel and Co-Cr alloys, the
enhancement of hardness, wear resistance and fatigue properties is traded off significantly with
corrosion resistance due to the depletion of Cr in the materials.
15
In the mid of 1980s, Zhang and Bell[42] found that low temperature nitriding can effectively
improve the hardness of austenitic stainless steel without losing its corrosion resistance due to
the formation of so-called S-phase, an interstitial (such as C and N) super-saturated solid
solution. Inspired by the success of S-phase in austenitic stainless steels, Dong et al. [11, 12]
have generated S-phase in Co-Cr alloys by plasma surface alloying with carbon at
low-temperature although they are not fully fcc structured.
Plasma carburising of Co-Cr was conducted by X.Y.Li et al. [12] at temperatures ranging from
400 to 600 °C with a pressure of 500 Pa for 10 and 20 hours. A modified layer can be seen from
the cross-sections of all the treated samples and the hardness of the plasma carburised samples
are twice or three times that of untreated material. Judging by the XRD and TEM results, a
carbon supersaturated solid solution called ‘S-phase’ was formed during the plasma treatment.
The corrosion and corrosion-wear properties of low temperature plasma carburised Co-Cr have
been studied by Chen et al.[43]. The treatments were conducted at temperatures from 400 to
500 °C for 15 hours in a gas mixture of 98% H2 and 2% CH4. The results demonstrated that low
temperature plasma carburising can effectively improve the corrosion and corrosion-wear
properties of Co-Cr alloy. .
However, no systematic work has been conducted to enhance the surface properties of Co-Cr
alloys using low-temperature plasma alloying with nitrogen (i.e. plasma nitriding) or with both
nitrogen and carbon (i.e. plasma carbonitriding), which formed the theme of this MRes research
project.

16
CHAPTER 3 EXPERIMENTAL
3.1 Experimental Material
The material used was ASTM F-1537 Co-Cr-Mo alloy (Midland Medical Technology, now
Smith & Nephew) and its chemical compositions are shown in Table.3.1. Coupon samples were
cut from a 29 mm diameter bar into discs of 6.5 mm thick by a Struers Accutom-5 cutting
machine with an abrasive silicon carbide blade were ground from 240 down to 1200 grit SiC
papers. All the samples were mirror polished using ½ µm diamond paste followed by colloidal
silica, cleaned in soapy water and then in an acetone ultrasonic bath and finally dried using hot
air .
3.2 Plasma Treatment
Plasma nitriding and plasma carbonitriding were carried out in a 60 kW Klöckner DC plasma
unit (Fig.3.1.1). The treatment temperatures were between 300 and 400 C and the pressure for
all the experiments was 4 mbar (400 Pa). The treatment conditions and designated codes are
detailed in Table 3.2. The treatment procedures are described below.
First, the samples to be treated were cleaned using an ultrasonic cleaning machine prior to
loading them on the work table. After the samples were placed on the work table, a vacuum
cleaner was used to remove the dust particles on the work table which may cause arcing during
treatment.

17
Then the furnace was closed by lowering the bell, the ventilation valve was shut and the cooling
water valve was turned on. The vacuum pump was turned on to evacuate until the vacuum level
reached 10-1
Pa. After this pure hydrogen was introduced into the furnace, the main power was
supplied and the plasma started.
The current, voltage and the gas pressure increased gradually during the initial stage to clean
and remove surface oxide film by sputtering. Usually from 300 °C, a selected gas mixture
instead of pure hydrogen was fed into the furnace to initiate plasma treatment.
When the treatment finished, the valve for feeding gas was closed and the furnace was
evacuated. When the temperature reached 60 °C or below, the furnace was then ventilated and
opened to remove the samples.
3.2 Materials Characterisation
3.2.1 Hardness Measurement
A Mitutoyo MVK-H1 hardness testing machine with a Vickers indenter was used for
microhardness measurements. The load was ranged from 10 g to 1000 g and a calibration block
of #EP9716400 (757.3 HMV0.3) was used to check the condition of the equipment. Load
bearing capacity tests were conducted with this machine under the load ranging from 25 g to
1000 g. To avoid interference among neighbouring indentations, the distance of any two
neighbouring indentations was at least 3 times of the diagonal length of the indentation. At each
load, the test was repeated at least five times and the average value was reported.

18
The surface hardness and elastic modulus of all the samples were also probed by a Nano Test
600 machine (Micro Materials Ltd, Wrexham, UK). All the tests were carried out using a depth
control method with a fixed penetration depth of 200 nm. On each sample, 8 points were tested,
the data were processed by computer, and the average and errors were presented.
3.2.2 Scanning Electron Microscopy (SEM)
Both a Philips XL30 and a Jeol-7000 SEM machines were used for the observation of
microstructural features of the plasma treated samples and for post-test examination of tested
surfaces. The Oxford Instruments Inca EDX detectors were also used in this project for
chemical element analysis.
In order to get high-quality cross-section samples for SEM observation, plasma treated samples
were first cut with the Struers Accutom-5 machine at a slow feed rate, which were then
mounted in conductive Bakelite using the MET-PREP PA 30 machine. The grinding and
polishing procedures described in Section 3.1 for bulk sample preparation were used. Because
of the high corrosion resistance of Co-Cr alloy, electrolytic etching was conducted under 3 V,
0.15 A in a 10% nitric acid to reveal the microstructure for SEM examination.
3.2.3 Glow Discharge Optical Emission Spectroscopy (GDOES)
A LECO GDS-750 QDP Glow Discharge Optical Emission Spectrometry was used to probe the
depth distribution of alloying elements in the plasma treated surfaces. Glow discharge creates a
sputter spot on the surface of the samples, and the bombardment makes the atom excitation and

19
emissions. The photons emitted during the excitation-de-excitation processes were analysed by
an optical spectrometer, and the results can be calculated by comparing with the standard
spectra. Careful calibration was conducted to ensure accurate quantitative results.
3.2.5 X-ray Diffraction
A Philips X’Pert diffractometer with Cu-Kα radiation was used to obtain X-ray diffraction
(XRD) spectra for all treated and untreated samples with 2θ range of 20-100 ° at a scanning rate
of 1 °/min. The X’Pert Highscore software with XRD database was used to analysis the
diffraction patterns for the identification of the phase compositions of plasma surface treated
samples and the untreated samples for comparison.
3.2.6 Transmission Electron Microscopy (TEM)
PN350/20 and PCN350/20 samples were studied by a JEOL JEM-2100 LaB6 TEM and FEI
TECNAI F20. The samples were prepared in cross-section way, as shown in Fig.3.2.1[44].
Firstly, two 2.5X1.7X1 mm3 slabs were cut from the treated surfaces. They were glued together
with the treated surfaces facing each other like a ‘sandwich’. Then it was hand ground from
800# to 1200# to a thickness of 80 to 100 µm. This sandwich was then separated using tweezers.
After this pre-thinning, the sample was transferred to a Quanta 3D FEG focused ion beam
miller for final thinning to less than 100 nm. A JEOL JEM-2100 LaB6 TEM and FEI TECNAI
F20 with the operating voltage of 200 kV were used to characterise the phase constituent and
microstructure of the modified layers.

20
3.3 Corrosion Test
Polarization potential corrosion tests were carried out to investigate the electrochemical
corrosion behavior of all treated and untreated samples. The Ringer’s solution used in the
polarization potential corrosion test was made by solving eight tablets in one liter distilled water,
which is full strength and was slightly alkaline (approximately PH7.4). As shown in Fig.3.3.1,
the flat cell had three electrode systems, a saturated calomel reference electrode (SCE), a
platinum auxiliary electrode and a working electrode (sample). The sample was placed against a
Teflon ring at the end of the flat cell, and the working electrode area was 1 cm2. Prior to
corrosion tests all the samples went through a light polishing with 1 µm diamond paste and
cleaning with acetone to ensure that the surface roughness of all the samples is almost the same.
Cathodic polarization was conducted for 3min to remove the oxidation on the surface. A 2 min
open circuit potential (OCP) was monitored at which point a stable value was obtained, and a
potentiodynamic sweep from -200 mV versus OCP to 1200 mV versus reference with a scan rate
of 1 mV/s. The software used to record and analysis the data was Sequencer v4.
3.4 Tribological Test
3.4.1 Reciprocating Wear Test
Reciprocating wear tests were carried out using a reciprocating tribometer, the schematic
diagram of which is shown in Fig.3.4.1. The specimens were held vertically in the sample
holder reciprocating against a WC ball (φ=12 mm) with a frequency of 1.12 Hz and a

21
displacement amplitude of 4 mm, so the total sliding distance is 12.857 m. Specimens were
tested at room temperature both in air (unlubricated dry wear) and in full strength Ringer’s
solution to simulate corrosion wear in body fluid.
3.4.2 Wear Loss Evaluation
The wear tracks were measured using an Ambios Technology XP-200 machine to obtain the
cross-sectional profiles of wear tracks. The wear volume loss (Vlost) was calculated by
multiplying the cross-sectional area (A) by the length (L) of the wear track (Fig.3.4.2).
V *lost A L
All the wear tracks were examined by Philips XL30 SEM and the chemical composition of
some surface features and wear debris were analysed by EDX.

22
CHAPTER 4 RESULTS
4.1 Microstructure
4.1.1 Microstructure of As-received Material
For comparisons, as-received medical grade Co-Cr material was characterised by SEM and
EDX. Fig.4.1.1 (a) shows the SEM microstructure of the as-received or untreated Co-Cr
material. It can be seen that the microstructure of the untreated material contains equiaxed
grains in the size of 3 to 6 µm and some small carbides in the size of less than 1 to 2 µm, which
are brighter than the matrix grains as shown in Fig.4.1.1 (a). EDX was used to analyse the
chemical compositions of the carbides and the matrix grains (A in Fig.4.1.1 b). The results
shown in Fig.4.1.1 (b) indicate that the carbides contain high Cr, Mo and carbon, while the
matrix grain (B in Fig.4.1.1 b) contains mainly Co together with Cr and a small amount of Mo.
The XRD pattern of the as-received material is shown in Fig.4.1.1 (c). It can be seen that the
untreated microstructure is dominated by α-phase (fcc), together with a small amount of ε-phase
(hcp). This reveals that the phase transformation from α to ε was only partially completed and
meta-stable fcc phase was retained to room temperature due to the sluggish α to ε transformation
after forming [45].

23
4.1.2 Surface Layer Structures
4.1.2.1 Surface Layer Structure of PN Samples
SEM observations were carried out on the cross-sections of plasma nitrided samples. It was
found that a surface modified layer was formed on all samples during the plasma treatments.
Fig.4.1.2 shows the cross-sectional SEM microstructures of the plasma nitrided samples under
different treatment conditions in terms of treatment temperature and time. It can be seen that
there is a boundary between the surface modified layer and the substrate. When treated at 350
C, the thickness of the nitrided surface layers increased with the increase of the treatment time
(Fig.4.1.2 a & c); when treated for the same period of 20 h, the surface layer thickness rapidly
increased with the treatment temperature (Fig.4.1.2 b-d).
In Fig.4.1.2 (c) and (d), white contrast needles along the surface slip planes were observed, the
length and the quantity of which increased with the treatment temperature. It can also be seen
from all the SEM images that grain boundaries continue from the modified layer to the
substrate, which indicates a diffusion process without formation of new grains. It is also noted
that the PN400/20 sample showed a much lower resistance to the etching as evidenced by some
etching pits within the etched surface layer (Fig.4.1.2 d).
4.1.2.2 Surface Layer Structure of PCN Samples
Fig.4.1.3 depicts the cross-sectional SEM pictures of plasma carbonitrided (PCN) Co-Cr
samples under different treatment temperatures for 20 hours. It can be seen from Fig.4.1.3 that

24
two sublayers were formed on the surface after the PCN treatments. The top sublayer appears
thinner than the bottom sublayer although both increased with the increase of the treatment
temperature; the bottom sublayer shows similar feature as the substrate but with improved
corrosion resistance as evidenced by less corrosion along the grain boundaries in the bottom
sublayer than in the substrate.
4.2 Hardness and Thickness of the Surface Treated Layers
4.2.1 Surface Hardness
The microhardness measured with 50 grams for the treated and untreated samples are
summarized in Fig.4.2.1. It can be seen that comparing with the untreated sample all the plasma
treated samples showed significantly increased surface hardness. As depicts in Fig.4.2.1 (a),
when treated for 20 hours, the surface hardness of the plasma nitrided samples increased
significantly with increasing temperature from 325 to 350 °C but no further increase was
observed when further increasing the treatment temperature to 400 °C; when treated at 350 °C,
the surface hardness of the plasma nitrided samples first increased with time and then decreased
after it peaked at 25 hours (Fig.4.2.1 b). Clearly, significant improvement in surface hardness
can be achieved when the treatment temperature is above 325 °C for more than 15 hours;
however, a high treatment temperature of 400 °C for 20 hours or a long treatment period of time
of 30 hours at 350 °C cannot further increase but rather slightly decreased the surface hardness
of the treated samples.

25
The hardness of plasma carbonitrided samples are summarized in Fig.4.2.1 (b). It can be seen
that all plasma carbonitrided samples show higher surface hardness than the untreated sample.
The surface hardness increased gradually with the increase of the treatment temperature from
300 to 375 °C with the PCN375/20 sample displaying the highest hardness of about 800
HV0.05. It is of interest to note that when treated at 325 C for 20 hours, the PCN treated
surface (725 HV0.05) is much harder than the PC treated one (625 HV0.05; however, when
treated at 350 C for 20 hours, the PCN treated surface is indeed slightly lower than the PN
treated one.
4.2.2 Thickness
The thicknesses of the surface modified layers were measured from the cross-sectional SEM
images of the treated samples and the results are summarized in Fig.4.2.2. The following
observations could be made from Fig.4.2.2 regarding the effect of treatment temperature and
the type of the treatments (PN and PCN).
Firstly, for both plasma nitriding and plasma carbonitriding for 20 hours, with the increase of
the treatment temperatures the thickness of the modified layers increased. Secondly, the surface
hardness of PN325/20 is higher than that of PN350/10. This implied that the effect of the
treatment temperature could have a more important effect than the treatment time on the
thickness of PN treated Co-Cr surface, which is supported by Fick’s diffusion theory[46].
Thirdly, when treated at low temperature of 325 °C for 20 hours, the thickness of the modified
layers is almost the same for the plasma nitrided and the carbonitrided treated samples; however,

26
when the treatment temperature is over 350 °C, the surface layers generated by plasma
carbonitriding are much thicker than the layers produced by plasma nitriding. The layer
formation kinetics and the diffusion activation energy for the PN and PCN will be discussed in
Chapter 5.
4.2.3 Load Bearing Capacity
The hardness of PN and PCN treated as well as the untreated materials were measured under
different loads were carried out in order to measure the load bearing capacity (LBC) of samples
after plasma treatments. Fig.4.2.3 (a) depicts the treatment time effect on the load bearing
capacity of plasma nitrided samples and untreated one. It can be seen that when treated at
350 °C, plasma nitriding can increase the LBC of the plasma nitrided Co-Cr especially for
medium (20 h) and long (30 h) time treated samples. It is interesting to note that the LCB
curves for the PN350/20 and PN350/30 samples crossed at a load between 100 and 200 g: the
former revealed a slightly higher LCB than the latter when the applied loads are 100 g but the
opposite occurred (although marginally) when the applied loads are 200 g.
It can see from Fig.4.2.3 (a) under the load of 100 g, PN350/20 and PN350/30 still maintain the
hardness of more than 700 HV. On the other hand, because of the thinner modified layer of
PN350/10, the results are relatively lower compared to the other two treated samples.
Fig.4.2.3 (b) presents the load bearing capacity of some plasma carbonitrided samples,
compared with the untreated one. It can be seen that the PCN375/20 sample has the highest
surface hardness under 25 g and 50 g when compared to the PCN350/20 and PCN300/20

27
samples. With increasing of the load, the hardness dropped faster than the PN treated samples
as shown in Fig.4.2.3 (b) although the plasma carbonitrided samples possess a thicker layer
than the plasma nitrided samples, which may be caused by the low hardness of the carbon
S-phase sublayer within the plasma carbonitrided surface case.
4.2.4 Nano-indentation Hardness Test
In order to eliminate the effect of the substrate, nano-indentation was carried out to measure the
hardness and elastic modulus of the surface layer of all treated and untreated samples. The
method used for the measurement was a depth control procedure, which only allowed the indent
goes into the maximum depth of 200 nm during loading process. Fig.4.2.4 shows typical
loading-unloading curves, and based on these curves, hardness and modulus were calculated
and the results are summarised in Fig.4.2.5.
It can be seen that the measured nano-hardness (Fig. 4.2.5) of all treated samples is higher than
that measured microhardness (Fig.4.2.1), which will be discussed in Chapter 5. For example,
the nanohardness of the plasma nitrided samples is about 13.5, 18.5 and 14. 5 GPa for
PN325/20, 350/20 and PN400/20 samples, respectively whilst their microhardness is 620(6.8
MPa), 780 (7.8 MPa) and 770 HV0.05 (7.7 MPa), respectively.
For the samples plasma nitrided with the same treatment time of 20 hours (Fig.4.2.5 a), their
average hardness first increased with the increase of treatment temperature, peaked at 350 C
and then decreased. The time effect on the surface hardness of 350 C plasma nitrided samples
is charted in Fig.4.2.5 (b). It can be seen that the hardness increased with increasing treatment

28
time from 10 to 20 hours. When further increasing the treatment time, the hardness decreased.
The effect of treatment temperature on the hardness of the PCN treated samples is shown in
Fig.4.2.5 c, which followed similar trend for the PN treated samples (Fig.4.2.5 a). Judging by
the hardening effect, 350 C/ 20h would be the optimal treatment conditions.
It is found that although both micro- and nano-indentation hardness followed similar trend with
the treatment temperature and time, the nano-hardness of the high temperature treated
PN400/20 (Fig.4.2.5 a) and the long-time treated PN350/30 (Fig.4.2.5 b) samples dropped more
rapidly when compared with the corresponding micro-hardness (Fig.4.2.1).
It is noted from Fig.4.2.5 that in view of the experimental errors shown on the figures, plasma
treatments including PN and PCN had limited, if any, effect on the modulus of the plasma
treated Co-Cr samples as compared with the untreated material although their average values
are marginally lower than that for the untreated material.
4.3 Chemical Compositions of the Surface Layers
4.3.1 PN Samples
The element depth distribution of plasma nitrided samples was measured by GDOES and the
typical element depth profiles are shown in Fig.4.3.1. It was found that above 12 wt% nitrogen
was diffused into the surface and the elements of Cr and Mo were kept high with the alloying
elements N, while element Co was low at the surface, which may indicate Cr, Mo migration to
surface caused by the strong affinity of Cr and Mo to N.

29
Fig.4.3.2 shows the nitrogen depth profiles of three samples treated at different temperatures for
20 hours. It can be seen that with increasing the treatment temperature, nitrogen can diffuse
deeper into the substrate. And about 12 wt% nitrogen was introduced into the surface when
treated at highest temperature (400 °C); by contrast, only less than 6 wt% nitrogen can diffuse
into the sample surface when treated at the lowest temperature (325 °C).
Fig.4.3.3 shows the nitrogen depth profiles of the 350 °C plasma nitrided samples as a function
of the treatment time. These curves indicate that the depth of the nitrogen diffusion zone
increased with increasing treatment time but in a small extent.
Clearly, the treatment temperature has a more significant effect than the treatment time on the
nitrogen diffusion depth and the nitrogen content in the plasma treated surfaces. This could be
explained by Fick’s diffusion theory since increasing treatment temperature can significantly
increase the diffusivity of nitrogen.
4.3.2 PCN Samples
Typical GDOES profiles of the element distribution along the depth for PCN treated sample is
shown in Fig.4.3.4. It can see that for the PCN sample, both N and C were introduced into the
surface, with a high concentration of nitrogen in the top part of the layer and a carbon rich layer
in the adjacent part of the PCN treated case. Therefore, it can be derived by referring the SEM
cross-sectional microstructure (Fig.4.1.3) to the GDOES depth profiles (Fig.4.3.4) that the
surface case formed during the plasma carbonitriding consisted of two sublayers: a
nitrogen-rich sublayer followed by a carbon-rich sublayer. Elements of Cr and Mo were kept

30
high with the alloying elements N and C, while element Co was low at the surface.
It can be seen from Fig.4.3.4 (b) that at first the nitrogen diffusion curve reached the highest
level at the leading edge of the nitrogen diffusion curve. However, a carbon peak appeared at a
depth about 0.2 m below the surface. This ‘up-hill’ [47]phenomenon was also found in PCN
treated austenitic stainless steel. This could be explained by Williamson’s trapping and
detrapping mode [48]. Nitrogen will be preferably trapped to chromium because the trap
binding energy of Cr to nitrogen is higher than to carbon[48]. Therefore, when nitrogen diffused
in, carbon was detrapped from chromium and diffused further into the substrate.
The nitrogen depth profiles of all the plasma carbonitrided samples are plotted in Fig.4.3.5. As
for plasma nitrided Co-Cr, the nitrogen diffusion depths increased with increasing the treatment
temperature.
The carbon depth profiles of the 20h plasma carbonitrided samples are shown in Fig.4.3.6. It
indicates that the carbon-diffusion depth increased with the increase of the treatment
temperatures. It can also be seen that the maximum carbon concentration in the PCN treated
surface decreased with the increase of the treatment temperatures. However, the total amount of
carbon introduced into the PCN treated case as measured by the areas below the carbon depth
profiles increased with increasing the treatment temperature.

31
4.4 Phase Compositions of the Surface Layers
4.4.1 XRD Analysis
As has been discussed in 4.1.1, the untreated sample contained mainly meta-stable α-phase (fcc)
together with trace of ε-phase (hcp). Fig.4.4.1 shows the typical XRD patterns of plasma nitrided
and untreated samples. It can be seen that the peaks of ε phase presented in the untreated samples
disappeared from the plasma nitrided samples, which may indicate ε→α phase transformation
during plasma nitriding.
For the samples plasma nitrided below 400 °C, a set of fcc peaks at the left side of the
corresponding substrate fcc peaks can be detected, indicating the formation of a nitrogen
supersaturated solid solution of fcc phase with expanded lattice parameters. This is the
characteristic of S-phase and nitrogen S-phase, SN, was indexed to the peaks in Fig.4.4.1. As can
be seen, the degree of the left shift of the SN-phase peaks increased with increasing the treatment
temperatures; also in addition, the peak intensity and broadness of the S-phase was increased
when the treatment temperature rose. These characters are resulted from the increased thickness
of the modified layer, the varying alloying elements content and the different levels of lattice
expansion throughout the layer. When the treatment temperature reached 400 °C, two newly
formed phases could be indexed to CrN and CrO2. These phases may be related to the needles
observed at the top of the surface layer (Fig.4.1.2). It seems that 400 °C is the threshold
temperature to form CrN for plasma nitriding of Co-Cr alloy. The formation of CrO2 is most
probably due to the residual oxygen in the plasma furnace.

32
The XRD patterns for 350 °C plasma nitrided samples with the treatment time ranging from 10
to 30 hours are shown in Fig.4.4.2. It can be seen that SN-phase was formed for all three plasma
treated samples. When treated at 350 °C for less than 30 hours, the intensity, broadness and left
shift of the SN-phase peaks increased with the treatment time. However, further increase in the
treatment time to 30 hours led to back shift and reduced intensity of the SN-phase peaks. This
phenomenon may be related to the decomposition of the SN-phase and possible formation of
chromium nitrides, as evidenced by the weak peak at 2θ 36.7°and 63.5°, which reduced the
nitrogen content in the SN-phase.
Fig.4.4.3 shows XRD patterns of all plasma carbonitrided (PCN) treated samples with untreated
sample for comparison. It can be seen that a set of fcc peaks were detected from the plasma
carbonitrided samples, which shifted to the left side of the corresponding fcc peaks from the
untreated sample, indicating of forming S-phase on the PCN treated surfaces. The extent of the
left shift of the S-phase peaks (especially SN (111)) increased with the rise of the treatment
temperature from 300 to 350 °C. When further increasing the treatment temperature to 375 °C,
the S-phase peaks were slightly shifted backwards.
It can be deduced by cross-referencing the cross-sectional SEM pictures (Fig.4.1.3) with the
GDOES data (Fig.4.3.4) that the PCN modified layers consisted of two sublayers with the
carbon rich sublayers being much thicker than the nitrogen rich sublayers.
33
4.4.2 TEM Study
As described in Chapter 3, two cross-section TEM samples were prepared to study the
microstructure of plasma treated material in terms of layer structure, phase constitute and fine
structures.
4.4.2.1 Microstructure of the Substrate
Fig.4.4.4 (a) and (b) are typical TEM microstructures taken from substrate of surface treated
sample. It can be seen that the microstructure of the substrate consists of equiaxed grains with
annealing and micro-twins, as denoted by “T” in Fig.4.4.4 (a). A few thin plates were also
found within the equiaxed grains. Indexing of SAD patterns from the substrate area revealed
that the dominant equiaxed grains are fcc structured and the thin plats are hcp (ε-Co) structured.
These two phases are in a related crystal orientation as evidenced in Fig.4.4.4 (c), which shows
fcc (α-Co) [-1 2 3], and its twin pattern, superimposed with hcp (ε-Co) [-12-16] pattern with a
relationship of (121) fcc// (-101) hcp.
4.4.2.2 PCN350/20 Sample
Cross-section TEM microstructure of PCN350/20 sample is shown in Fig.4.4.5. Except for a
superficial thin layer, no other interfaces can be seen even at the hardened layer/substrate
interface, as indicated in Fig.4.4.5 based on the SEM image of Fig.4.1.3 (c) for this sample.
Indexing SAD pattern from the superficial layer (Fig.4.4.6 a) led to the identification of
CrN-like Cr(CN) fcc phase from the sharp diffraction rings (Fig.4.4.6 b), resulting from the

34
nano-crystalline nature of the CrN-like phase. It can also be found that there is a faint halo ring
superimposed with the sharp CrN-like phase rings, indicating of amorphous structure in the
superficial layer. This kind of super-facial layer was also observed in plasma carburised
austenitic stainless steel[49], which was the deposition layer formed during the plasma
treatment.
Detailed TEM observation and SAD pattern analysis proved that no other phase but S-phase, or
N/C supersaturated α–Co (Cr) phase, was formed after PCN treatment. Fig.4.4.7 (a) and (b)
show a typical crystal grain and corresponding SAD pattern of [110] fcc in the S-phase layer.
Trace of hcp ε–phase was also formed within the surface layer, but its quantity was significantly
reduced after the PCN treatment.
Extensive crystal defects, such as dislocations and twins, were observed within the S-phase
layer (Figs.4.4.6-Fig.4.4.8). Evidences are presented in Fig.4.4.8 (a), (b) and (c), showing bright,
dark filed surface twining microstructure and corresponding SAD patterns of [0 1 3] and [013]T.
4.4.2.3 PN350/20 Sample
TEM observation on PN350/20 sample revealed a similar layer structure as to PCN350/20
sample. As shown in Fig.4.4.9 (a), no interface can be seen from the hardened layer down to the
substrate, although it was shown in SEM image (Fig.4.1.2 c).
A thin (30 nm) superficial layer, much thinner than PCN350/20 sample, was observed and
corresponding SAD ring patterns can be indexed as CrN phase (Fig.4.4.9 b). A superimposed
faint (1 1 1) S-phase ring can also be assigned. Underneath this superficial layer, nitrogen

35
S-phase was identified (Figs.4.4.10 a & b) and the diffraction spots show stronger distortion
than plasma carbonitrided S-phase patterns (Fig.4.4.9 b vs Fig.4.4.10 b) consistent with the
much broaden peaks observed in XRD patterns (Fig.4.4.1 vs Fig.4.4.3).
Micro-twins, slip planes and hcp thin plates were also observed in the S-phase layer (Fig.4.4.10
b), which contributed to the needles observed in SEM image of Fig.4.1.2. Fig.4.4.11 shows
carbide on the top of the S-phase layer and no microstructure change was found after plasma
nitriding for the carbide as the SAD pattern analysis indicated Cr23C6 carbide (Fig.4.4.11 b),
similar to the carbide observed in the substrate.
4.5 Corrosion Resistance of Surface Treated Samples
It is well-known that medical grade Co-Cr (ASTM F-1537) alloy has good corrosion resistance,
which is essential for many biomedical applications. Therefore, in order to investigate the effect
of plasma treatment on the corrosion resistance of the Co-Cr alloy, electrochemical corrosion
tests were conducted in full strength Ringer’s solution for all surface treated samples.
4.5.1 Corrosion Behaviours of PN Samples
Fig.4.5.1 depicts typical anodic polarization curves for untreated and plasma nitrided samples
with different treatment conditions. It can be seen from Fig.4.5.1 (a) that the open-circuit
corrosion potential (Ecorr) of the untreated alloys is about -150 mV (SCE), and pitting may have
occurred at about 600 mV (SCE) as evidenced by the change of the current curve slope.
Compared with the untreated material, all surface treated samples increased their corrosion

36
potential, which indicates the enhancement of corrosion resistance.
As indicated in Fig.4.5.1 (a), PN325/20 and PN350/20 samples show a clear passivation stage
and the corrosion current density is lower than that of the untreated material when the applied
voltage is over about 400mV(SCE). Pitting potential of PN350/20 increased from 600 mV
(SCE) for the untreated material to about 800 mV (SCE). Some current fluctuation occurred
between 200 mV (SCE) and 600 mV (SCE) was recorded for PN400/20 sample. Fig.4.5.1 (b)
depicts the polarization curves for the plasma nitrided PN350/10 and PN350/20 samples and for
the untreated sample for comparison. It can be seen that the short time treated PN350/10 sample
showed slightly better corrosion resistance than the longer time treated PN350/20 sample, as
evidenced by the relatively higher corrosion potential and lower corrosion current density of
PN350/10 sample than PN350/20 sample.
In order to further investigate the corrosion mechanism involved, post corrosion test SEM
observation was carried out on all corroded samples. As shown in Figs.4.5.2-4.5.5, different
features of the corroded surfaces were observed. For the untreated sample, comparing with the
surface feature before the test, corrosion occurred mainly around boundaries Fig.4.5.2 (a),
especially around the boundaries between the α-fcc grains and the carbides Fig.4.5.2 (b). These
corrosion features can be better seen from the magnified SEM image in Fig.4.5.2 (c).
Fig.4.5.3 shows some typical surface morphology of plasma nitrided samples before and after
the polarization tests. It can be seen that intergranular corrosion progressed along grain
boundaries and slip lines were observed for corroded PN325/20 (Fig.4.5.3 b) and PN350/20
(Fig.4.5.3 d) samples. Some fine pits can also be seen from these two samples, which may be

37
related to the needles formed during plasma nitriding process (Fig.4.1.2).
The 400 C treated PN400/20 sample showed different forms of corrosion. As can be seen from
Fig.4.5.3 f), severe pitting occurred as evidenced by many pits across the corroded surface. .
This indicates that CrN may have precipitated along these areas during plasma nitriding at
400 °C. This severe localized corrosion and metastable pitting reflected the poor corrosion
resistance of the PN400/20 sample.
Good corrosion resistance was observed for PN350/10 sample as evidenced in Fig.4.5.3 (h) that
neither intergranular corrosion nor pitting progressed during the test. Compared with the
corroded untested sample (Fig.4.5.3 g), the tested PN350/10 sample only showed mild uniform
corrosion and mild localized attack could be seen (Fig.4.5.3 h).
4.5.2 Corrosion Behaviours of PCN Samples
Electrochemical corrosion tests for untreated and all plasma carbonitrided samples revealed that
all plasma carbonitrided samples, except PCN300/20, showed similar corrosion behaviour as
evidence by their superimposed polarization curves (Fig.4.5.4). Their corrosion potentials
shifted to higher values than that of the untreated one. Their corrosion current density is slightly
higher than that of the untreated sample when applied potential is below 600 mV. However,
their pitting potential increased from 600 mV (SCE) for the untreated material to 800 mV
(SCE). PCN300/20 showed the best corrosion resistance among the PCN treated and the
untreated samples. Its corrosion potential change from -270 mV (SCE) for the untreated sample
to -130 mV (SCE), the corrosion current density was lower than that for the untreated sample.

38
Visual observation found no appreciable changes on the surface of the corroded area before and
after electrochemical corrosion tests for all PCN samples. SEM observes also found no
localised corrosion attack on the PCN treated surfaces after the corrosion tests. However, it was
noted that the surface of the PCN300/20 sample (Fig.4.5.5 b) is smoother than other samples
(Fig.4.5.5 d). Very fine deposition particles, as shown in Fig.4.5.5 (d), were observed
for >300 °C plasma carbonitrided samples.
4.6 Tribological Properties
4.6.1 Dry Wear Test
4.6.1.1 Plasma Nitrided Samples
Reciprocating wear tests were carried out to study the wear resistance of untreated and plasma
treated samples under dry conditions and the results are shown in Fig.4.6.1. All the treated
samples showed lower wear loss compared to the untreated sample, except for few samples
when tested under a high load. It can be seen that under the load of 10 N, all plasma treated
samples exhibited dramatically reduced wear loss compared to the untreated sample. For
example, the wear of PN400/20 is about 2 orders of magnitudes lower than that for the
untreated material (Fig.4.6.1 a). When tested under 30 N, some low temperature and short time
plasma treated samples, such as PN325/20 and PN350/10 (Fig.4.6.1 a & b), showed almost the
same wear loss as the untreated one. This is mainly because the low temperature and short time
treatments produced a thin (< 1 m) surface modified layer (Fig. 4.2.2). When a high load was

39
applied to this thin layer surface, the tungsten carbide ball can easily wear through the modified
layer into the substrate; this will accelerate the wear since the wear debris from the hardened
surface will act as third body particles, thus resulting in reduced wear resistance of these
samples. This is in particular supported by the large difference in wear loss of PN350/10 sample
when tested under the load of 10 and 30 N.
It is of interest to find that when tested under both 10 and 30 N, the wear loss of 350 °C plasma
nitrided samples was first reduced with increasing the treatment time from 10 to 20 hours
(Fig.4.6.1 b). This can be explained by the increased in hardness and thickness when increasing
treatment time. However, further increasing the treatment time to 25 and 30 hours resulted in
increased wear. This could be attributed to the reduced surface hardness of these samples
(Fig.4.2.5 b).
The results of SEM observations and EDX analysis on the surface morphology and
compositions of the wear tracks are shown in Fig.4.6.2. It can be seen that the width of the wear
track of untreated sample is about 600 µm with many grooves parallel to the sliding direction,
indicating feature of abrasive wear. EDX analysis on the wear debris within the track indicated
high oxygen content. This implies that at the beginning of the wear, the untreated sample
suffered from the adhesive wear, which transferred some materials to the WC ball. Due to the
high temperature causing by the friction during sliding movement, the wear debris were easily
changed to oxides. A high content of oxygen from the debris was detected by EDX, as shown in
Fig.4.6.2 (c). These formed oxide debris are much harder than the untreated material and acted
as third body, thus resulting in the deep grooves observed in the wear track (Fig. 4.6.2).
40
SEM observation on the samples plasma nitrided below 400 °C revealed very mild abrasive
wear morphology. Typical SEM images of the wear tested PN350/20 sample under different
magnifications are shown in Fig.4.6.3. It can be seen that only a few shallow scratches were
formed during the wear test, indicating a good abrasive wear resistance against WC ball under
10 N.
In addition to mild abrasive wear, the wear tracks for all plasma nitrided samples, except for
PN400/20, also revealed oxidation wear features. As exemplified in Fig.4.6.4, along with the
find and shallow wear grooves, patches of ripped layer covered some grooves. EDX analysis on
the layer detected a higher content of oxygen than on the bear groove surface.
The wear track of PN400/20 sample showed different wear morphologies. As can be seen from
Fig.4.6.5 (a), the wear track produced under the load of 10 N appeared in dark contrast and only
very few, shallow grooves can be observed. The higher magnification SEM image (Fig.4.6.5 b)
shows clearly grain boundaries. EDX detected a higher content of oxygen from the dark
contrast zone (Fig.4.6.5 e) than from the as-treated zone (denoted as B in Fig.4.6.5 a),
indicating that a thin layer of oxides was formed during wear test under the load of 10 N. After
tested under 30 N load, oxide layer was only formed on a small part of the wear track (Fig.4.6.5
c and d) and some deep grooves were produced at the bottom of the wear track. All above
observations implies that the wear of PN400/20 sample under 10N was dominated by oxidation
wear but abrasive wear prevailed when the load increased to 30 N.

41
4.6.1.2 Plasma Carbonitrided Samples
The wear loss of plasma carbonitrided samples are summarised in Fig.4.6.1. It can be seen that
after treatment for 20 hours, the wear loss of the plasma carbonitrided under both 10 and 30 N
decreased with the increase of the treatment temperatures. This is largely related to the higher
hardness and load bearing capacity of the higher temperature treated samples than the lower
temperature treated ones.
The SEM images of the wear morphology of PN300/20, PCN350/20 and PCN375/20 samples
after wear under 30 N are shown in Fig.4.6.6. It can be seen that the width of the wear tracks
and the grooves within the tracks reduced when the treatment temperatures increased. In
addition, the coverage of the oxide layer/patches on the wear tracks increased with the plasma
carbonitriding temperatures.
4.6.2 Corrosion-Wear Test
4.6.2.1 Plasma Nitrided Samples
Corrosion wear tests were conducted in full strength Ringer’s solution under the normal load of
30 N for all the samples, and the results are shown in Fig.4.6.7 and Fig.4.6.9. It can be seen that
all the treated samples showed better corrosion wear resistance than the untreated sample. For
20 hour plasma nitrided samples (Fig.4.6.7 a), it can be seen that the corrosion-wear increased
gently with the treatment temperatures. This is opposite to the treatment temperature
dependence of dry wear, which decreased with increasing the treatment temperature (Fig.4.6.1

42
a). For 350 °C plasma nitrided samples, their corrosion-wear reduced first with treatment time
and then increased after reached the minimum for 20 hour treated sample (Fig.4.6.7 b).
Compared with the wear loss under dry conditions, wear in Ringer’s solution was decreased for
all tested samples (Fig.4.6.7 c), which implies that under current wear conditions, Ringer’s
solution acted not only as a corrosion solution but also as a lubricant for the corrosion-wear
tests.
SEM observations did not find the oxide patches with special wave-like features which were
observed within the dry wear tracks (Fig.4.6.5) in corrosion wear conditions. As shown in
Fig.4.6.8 (a) & (b), the untreated material was severely by combined mechanical and chemical
attacks as evidenced by many abrasive grooves and some dark craters. By contrast, the wear
track formed in plasma treated PN350/20 is much narrower and smoother with limited black
pits. However, many small corrosion pits, as denoted by arrows in Fig.4.6.8 (f), was observed
within the wear track of tested PN400/20 sample, which may have contributed to the decreased
wear resistance as compared to the low temperature treated PN325/20 and PN350/20 samples
(Fig.4.6.7 a).
4.6.2.2 Plasma Carbonitrided Samples
Similar to dry wear results, the corrosion wear loss of plasma carbonitrided samples decreased
with the increase of treatment temperatures (Fig.4.6.9 a). As for plasma carbonitrided samples,
the wear loss in the Ringer’s solution during corrosion wear is less than that under dry
conditions when tested under otherwise the same conditions (Fig.4.6.9 b).

43
SEM observation revealed similar oxide trib-films and some abrasive grooves as for the
corrosion wear tested plasma nitrided samples (Fig.4.6.10). However, some characteristic
features were observed within in the wear tracks of the tested PCN samples. The wear track
formed in the low-temperature treated PN300/20 sample (Figs.4.6.10 a & b) was featured
mainly by many abrasive grooves with a certain degree of oxidation. The magnified picture
(Fig.4.6.10 b) revealed that some surface areas were partially worn off. This feature might relate
to c the dual-layer structure of the plasma carbonitrided samples (Fig.4.1.3). Less abrasive
grooves and partially worn off wears were found in the wear track formed in PCN350/20
sample (Fig.4.6.10 d) than in PCN300/20 sample. This is probably because the top SN layer for
PCN350/20 sample is thicker than PCN300/20 sample. Few abrasive grooves and no partially
removed layer were identified from the wear track formed in PCN375/20 sample (Fig.4.6.10 e)
largely due to the thick SN layer. However, some corrosion pits were found to present within the
grooves (Fig.4.6.10 f).

44
CHAPTER 5 DISCUSSION
5.1 Formation of S-phase
As has been reviewed in Chapter 2, although it has been reported that S-phase can be generated
in Co-Cr alloys by low-temperature plasma carburizing[12, 50], these is no or limited research
work has been done to explore the feasibility of forming S-phase in Co-Cr by low-temperature
plasma nitriding or plasma carbonitriding.
As reported in Chapter 4, nitrogen-containing S-phase has been successfully generated on the
surface of a medical grade Co-Cr alloy by both low-temperature plasma nitriding and
carbonitriding. It is also noted that when treated at the same temperature, the S-phase layer
generated by plasma carbonitriding is thicker than the S-phase layer formed by plasma nitriding.
As evidenced in Fig. 4.2.2, the S-phase surface formed on the plasma carbonitrided PCN350/20
is about 47% thicker than that formed on the plasma nitrided PN350/20. This is might be
related to the fact that Cr has a stronger affinity to N than to C. Similar phenomenon was also
found by Thaiwatthana [51] for plasma treated austenitic stainless steels. This is mainly because
the higher affinity of chromium to nitrogen than to carbon makes diffusion relatively easier for
carbon than for nitrogen in Co-Cr alloys.
Moreover, it can be found by comparing the present work with the work by Thaiwatthana [51]
that the S-phase layer formed in Co-Cr is much thinner than S-phase layer formed in austenitic
stainless steels when plasma nitrided under very similar conditions. This could be partially
attributed to the difference in the diffusivity of N in Co-Cr and in austenitic stainless steels. It

45
has been reported that the diffusivity of N about one order of magnitude lower in Co-Cr alloys
than in austenitic stainless steels[52].
It is widely accepted based on the theory of generating S-phase in austenitic stainless that,
S-phase can only form in fcc structured material. However, unlike fcc structured austenitic
stainless steels the Co-Cr alloy used in this study has both fcc structured alpha phase and hcp
structured epsilon phase, as shown in the Fig.5.1.1 for the untreated sample. This is mainly
because the phase transformation from alpha phase to epsilon phase is very sluggish such that
some alpha phase is retained to room temperature after hot forming[2, 10].
The reason why S-phase can be formed in dual phased Co-Cr alloys is that nitrogen and carbon
are strong austenite stabilizers in Co-Cr alloys[1]. Therefore, during the plasma treatments, the
hcp structured epsilon phase could be first converted to fcc structured alpha phase due to the
inward diffusion of N, C or both; then the fcc structured alpha phase becomes S-phase when it
is supersaturated by N, C or both. Therefore, as shown in Fig.5.1.1, no peaks for the hcp
structured epsilon phase could be identified from the XRD pattern collected from the treated
surface of PCN350/20 sample. This formation mechanism is further supported by the XRD
pattern of the backside of the PCN350/20 sample after the plasma carbonitriding treatment. As
evidenced by the clear XRD peaks (Fig.5.1.1), the hcp structured epsilon phase still exists in the
backside of the treated PCN350/20 sample. This clearly indicates that the thermal cycle used in
the plasma treatment will not change the phase composition in the Co-Cr substrate but rather it
is the alloying of fcc stabilisers of N and C that has converted the hcp structured epsilon phase
into the fcc structured alpha phase and eventually to S-phase.

46
5.2 Lattice Expansion
From the GDEOS results shown in Fig.4.3.1-Fig.4.3.3, it can be seen that nitrogen can
effectively diffuse into the medical grade Co-Cr alloy used in this study and the surface layer is
supersaturated with N. Fig.4.4.1 shows the XRD patterns of PN325/20, PN350/20 and untreated
samples. No precipitates can be found after plasma nitriding and only S-phase has been
generated on the surface of the plasma nitrided Co-Cr alloy. Therefore, it is expected that the
super-saturation of the nitrogen without precipitation of any nitrides would cause large lattice
expansion. This is evidenced by the observation (Fig.4.4.1) that a set of fcc peaks shifted to left
side of the substrate.
In order to calculate the lattice parameter (ahkl), the following relationship between the lattice
parameter and the d-spacing (dhkl) for fcc structure is used (assuming an fcc structure for
S-phase):
2 2 2
hklhkl
ad
h k l
Equation 5.1
Applying the Bragg equation
2 sinhkl hkld Equation 5.2
Hence, the lattice parameter can be obtained as follows.
2 2 2*
2*sinhkl
hkl
h k la
Equation 5.3

47
The angles (2θ) of S-phase peaks of plasma nitrided samples are listed in Table.5.1 and the
results calculated by equation 5.3 are summarized in Fig.5.2.1.
It can be seen that for the untreated sample, the results present almost a straight line through all
these points with no large scatter. On the contrary, the data for the plasma nitrided samples
show a large scatter, which means that the nitrogen diffused into the substrate caused different
levels of lattice expansion in different directions. It can be seen from Fig.5.2.1 that (200) shows
the most large lattice expansion of all the directions: 0.3753 nm for PN325/20 and 0.3783 nm
for PN350/20. This phenomenon has also been found in austenite stainless steels[53, 54]. It thus
can conclude that a111<a200 .
5.3 Micro- and Nano-Hardness
As shown in Fig.4.2.1, the surface microhardness of plasma treated Co-Cr alloy can reach about
800 HV0.05. However, the hardness obtained by nano-indentation can reach up to 20 GPa
(Fig.4.2.5), which is much higher than the hardness measured by micro-indentation. Clearly, it
can be seen that there is a big difference between the hardness measured by nano-indentation
(i.e. nanohardness) and by micro-indentation (i.e. microhardness). In addition, the
microhardness increased with the increase of the treatment temperature (Fig. 4.2.1) whist the
corresponding nanohardness first increased and then decreased with the increase of treatment
temperature (Fig. 4.2.5).
Such differences could be related to the different shapes of the indenters used in
micro-indentation (Vickers pyramid indenter) and nano-indentation (Berkwich indenter). The

48
relationship between Vickers hardness (HV) and nano-hardness (HN) given by Mayo et al. [55]
is as follows:
0.927HV HN Equation 5.4
Where HV is Vickers hardness and HN is nano-indentation hardness. It can be deduced from
the above relationship that the measure Vickers hardness is about 92.7% of the nanohardness;
however, as indicated above the real measured Vickers hardness is less than 50% of the
measured nano-hardness. For example, the microhardness of PN350/20 is about 800 HV0.05
(Fig.4.4.1 a) but its nanohardness is about 18 GPa (equivalent 1800 HV). Clearly, there is still a
deviation between microhardness and nanohardness even if taking account of the above
relationship between Vickers hardness (HV) and nano-hardness (HN).
Therefore, there should be some other factors which caused the large deviation between
measured microhardness and nanohardness values. From Fig.4.2.1 and Fig.4.2.4, the load used
for the Vickers microhardness tests is 50 g, which is equal to 490 mN while the max load for
nano-indentation is 18 mN. Clearly, the load for micro–indentation is much higher than that for
nano-indentation. The corresponding penetration depth of the nano-indentation indenter is only
about 200 nm (Fig.4.2.4). The depth d for Vickers hardness testing can be calculated from the
equation below:
2
1.8544F FHV
A d Equation 5.5
Where F is in kgf and d is the average length of the diagonal in millimetres. For example, the

49
average length of the diagonal of the indentation formed in PN350/20 with a Vickers hardness
of 800 HV0.05 can be estimated to be 0.0108 mm (10.8 µm). The indent depth can be
calculated to be 1.54 µm according to:
7.00062 2 tan
2
d dh
Equation 5.6
For this thin layer indentation depth there can be an issue due to substrate effects. As a general
rule of thumb the sample thickness should be kept greater than 10 times the indent depth in
order to minimise the substrate effect.
It can be seen from Fig.4.2.2 that the thickness of the S-phase layer formed on PN350/20 is
1500 nm, which is slightly smaller than the minimum layer thickness of 10 x 200=2000 nm for
the nano-indentation to avoid the substrate effect. However, for the Vickers hardness test, the
minimum layer thickness required should be 10 x 1540 = 15400 nm (15.4 µm), which is about
10 times that of the real S-phase layer formed in PN350/20 sample.
Accordingly, the hardness measured by Vickers microhardness test is a composite hardness
contributed both from the thin and hard surface S-phase layer and the soft substrate (<550
HV0.05). This is fully supported by the load bearing capacity test results shown in Fig.4.2.3 in
which the surface hardness measured decreased with increasing the load used, indicating the
increased substrate effect. For example, the hardness of PN350/20 is above 900 HV0.025,
which reduced to below 800 HV0.05, around 700 HV0.1 and just above 520 HV0.5.
In short, nano-indentation is a more suitable indentation method for the hardness test of thin and
hard surface layer on relatively soft substrate.

50
5.4 Corrosion Behaviour
As discussed in Chapter 2, it is well known that Co-Cr (ASTM F-1537) has excellent corrosion
resistance. Although conventional plasma treatment can improve the mechanical properties of
Co-Cr alloys, due to the relatively high temperature used, precipitates will form during
conventional plasma treatment, which can reduce the corrosion resistance of Co-Cr alloys[56].
It is known that the S-phase formed in austenitic stainless steel at low-temperatures (<450 C)
can improved or at least retain the good corrosion resistance of the substrate materials [9, 57].
In order to achieve improvement in mechanical properties without or with limited degree of loss
of corrosion properties, low temperature plasma nitriding and carbonitriding of Co-Cr alloy
have been explored in this study. The corrosion behaviour of the low-temperature plasma
treated Co-Cr were tested in Ringer’s solution by electrochemical corrosion tests.
The results indicated that the corrosion potential of all plasma nitrided samples has been
increased, which means that the start of corrosion has been delayed. In addition, the pitting
potential of most low-temperature plasma nitrided and carbonitrided samples has also increased.
These can be attributed to the beneficial effect of nitrogen introduced into the substrate.
However, higher treatment temperature (e.g. 400 C) and longer treatment time maybe cause
some fine grain boundary precipitates, which can be seen from SEM pictures of the corroded
area (Fig.4.5.3).
The results indicate that the maximum plasma nitriding treatment temperature for Co-Cr to
generate precipitate free S-phase is about 350 °C, which is lower than that (about 450 C) for
austenitic stainless steels. The possibility of forming CrN is believed to be determined by the

51
diffusion distance of Cr[12]. The Cr content of typical austenitic stainless steels is usually about
18 wt%; however Co-Cr alloys contain about 30 wt% Cr, nearly 1.5 times that of stainless
steels. This means that Co-Cr alloys have a short distance between the Cr atoms than austenitic
stainless steels. Hence, a lower plasma treatment temperature needed for Co-Cr alloys than for
austenitic stainless steels to avoid the precipitation of chromium nitrides and loss of corrosion
resistance.
5.5 Wear Properties
The results of dry reciprocating wear have indicated that the wear resistance of the Co-Cr alloy
has been significantly improved after plasma treatment (Fig.4.6.1). As reported in Chapter 4,
the wear of untreated samples was dominated by abrasive wear and adhesive wear. The severe
abrasive wear (Fig.4.6.2) can be attributed to the big difference in hardness between the
substrate material and tungsten carbide ball slider. The hardness of the tungsten carbide can
reach 2400 HV0.05, but the hardness of the untreated samples is only about 500 HV0.05. The
hard asperities of the tungsten ball can press into and cut the relative softer substrate, thus
forming parallel grooves in the wear track (Fig.4.6.2 a).
From the nano-indentation results (Fig.4.2.5), it can be seen that the elastic modulus (E) to
hardness (H) ratio (i.e. E/H) is quiet high and hence high plastic deformation tendency for the
untreated material, which may be the reason for the observed adhesive wear. Some adhesive
craters can be found in the wear track formed in the untreated material (Fig.4.6.2 b), and the
material was transferred to the tungsten carbide ball surface. Due to work hardening of the

52
transferred Co-Cr and roughening of the ball surface, the hard debris can cause three body
abrasive wear, which leads to more severe abrasive wear.
After plasma treatment, the wear loss of the treated samples showed striking wear reduction
especially under small load. The SEM pictures of the wear track formed in the plasma treated
sample illustrate that the wear track became much narrower and shallower (Fig.4.6.3-6).
Judging by the SEM pictures and EDX results of the wear tracks, the wear mechanism of the
plasma treated samples changed to mild abrasive wear and oxidation wear. According to the
adhesive wear theory, the adhesive wear is closely related to the E/H ratio. As shown in
Fig.4.2.5, although there is no significant effect on E, the hardness of the plasma treated
samples increased effectively after plasma treatment, thus the ratio of E/H reduced from 31.6
for the untreated samples to 13-21 for the plasma treated samples. Therefore the adhesive wear
resistance is expected to improve after the plasma treatments due to the reduced plastic
deformation tendency. This is evidenced by the SEM pictures of the wear tracks formed in the
plasma treated samples showing no evidence of adhesive wear.
The abrasive wear of the plasma treated samples is determined by the hardness difference
between the samples and the tungsten carbide ball. Since the hardness of the material has been
significantly improved, as evidenced in the SEM pictures of the wear track of plasma treated
samples, the abrasive wear has also been reduced after the plasma treatment.
It is of great interest to note from Fig.4.6.7 that while the dry wear of 20 h plasma nitrided
samples decreases with increasing the treatment temperature from 325 to 400 C, the wear of
plasma nitrided PN400/20 sample in corrosive Ringers solution (i.e. corrosion-wear) is higher

53
than PN325/20 and PN350/20 samples. This is mainly because PN400/20 sample is not so hard
and corrosion resistant as PN325/20 and PN350/20 samples (Fig.4.2.5 a). It is the synergy of
wear and corrosion that determine the corrosion-wear resistance of a material.

54
CHAPTER 6 CONCLUSIONS
Plasma surface alloying of ASTM F-1537 with nitrogen (i.e. plasma nitriding, PN) and with
both nitrogen and carbon (i.e. plasma carbonitriding, PCN) has been conducted at temperatures
ranging from 325 to 400 C for 10-30 hours. Based on the experimental results obtained from
this study, the following conclusions can be drawn:
It is feasible to form a carbon S-phase layer about 0.8-1.5 microns in thickness in ASTM
F-1537 Co-Cr-Mo alloy by low temperature (325 to 350 C) DC glow discharge plasma
surface alloying with nitrogen (plasma nitriding) for 10-30 hours.
A dual layer S-phase case about 0.6-2.7 micron in thickness consisting of a surface
nitrogen S-phase layer followed by a subsurface carbon S-phase layer can be formed in
ASTM F-1537 Co-Cr-Mo alloy by low temperature (300 to 375 C) DC glow discharge
plasma surface alloying with both nitrogen and carbon (plasma carbonitriding) for 20h.
Cross-sectional TEM examination reveals that a thin (30 nm for PN and 100 nm for
PCN) amorphous layer embedded with nano-crystalline CrN was formed on the top of
PN and PCN treated material due to back-deposition during the plasma treatments.
The thickness of the S-phase layer formed during PN and PCN treatments increases with
treatment temperature and time; when treated at the same temperature for the same time
period, plasma carbonitriding can produce a thicker hardened layer than plasma
nitriding.

55
Both plasma nitriding and plasma carbonitriding can effectively increase the hardness of
ASTM F-1537 Co-Cr-Mo alloy with a maximum improvement of about 100% the
optimal treatment of PN350/20 and PCN350/20.
The corrosion resistance of the low-temperature (≤350 C) plasma nitrided Co-Cr-Mo
alloy is similar to the untreated material and the plasma carbonitrided
PCN300/20samples show better corrosion resistance than plasma nitrided samples.
When reciprocated against a WC/Co ball under 10 N and in dry conditions, the wear
resistance of Co-Cr alloy can be improved by about 1 and 2 orders of magnitude by
plasma nitriding and plasma carbonitriding respectively mainly due to improved
hardness and enhanced load bearing capacity.
For 20 h plasma nitrided ASTM F-1537 Co-Cr-Mo alloy, whilst the dry wear resistance
increases with increasing the treatment temperature from 325 to 400 C, the opposite
occurs for the corrosion-wear in Ringers solution due to the synergetic effect of
corrosion and wear.
Judging by the corrosion wear performance, the optimal plasma treatment for ASTM F-1537
Co-Cr-Mo alloy could be 350 C/20 h for plasma nitriding and 375 C/20 h for plasma
carbonitriding.

56
References
[1] C. Monograph, "Centre d'information du Cobalt," Brussels, Belgium, vol. 185, 1960.
[2] W. Belteridge, "COBALT AND ITS ALLOYS"," by W. Belteridge, John Wiley & Sons, 159 pages, 1982, 1982.
[3] J. J. Jacobs, A. K. Skipor, P. F. Doorn, P. Campbell, T. P. Schmalzried, J. Black, and H. C. Amstutz, "Cobalt and
Chromium Concentrations in Patients With Metal on Metal Total Hip Replacements," Clinical
Orthopaedics and Related Research, vol. 329, pp. S256-S263, 1996.
[4] A. Marti, "Cobalt-base alloys used in bone surgery," Injury, vol. 31, Supplement 4, pp. D18-D21, 2000.
[5] W. Brodner, P. Bitzan, V. Meisinger, A. Kaider, F. Gottsauner-Wolf, and R. Kotz, "Serum Cobalt Levels After
Metal-on-Metal Total Hip Arthroplasty," The Journal of Bone & Joint Surgery, vol. 85, pp. 2168-2173,
2003.
[6] F. W. Sunderman Jr, "Carcinogenicity of metal alloys in orthopedic prostheses: Clinical and experimental
studies," Fundamental and Applied Toxicology, vol. 13, pp. 205-216, 1989.
[7] T. Visuri, E. Pukkala, P. Paavolainen, P. Pulkkinen, and E. B. Riska, "Cancer Risk After Metal on Metal and
Polyethylene on Metal Total Hip Arthroplasty," Clinical Orthopaedics and Related Research, vol. 329, pp.
S280-S289, 1996.
[8] E. Ingham and J. Fisher, "Biological reactions to wear debris in total joint replacement," Proceedings of
the Institution of Mechanical Engineers, Part H: Journal of Engineering in Medicine, vol. 214, pp. 21-37,
2000.
[9] Z. Zhang and T. Bell, "Structure and corrosion resistance of plasma nitrided stainless steel," Surface
Engineering, vol. 1, pp. 131-136, 1985.
[10] H. Dong, "S-phase surface engineering of Fe-Cr, Co-Cr and Ni-Cr alloys," International Materials Reviews,
vol. 55, pp. 65-98, 2010.
[11] H. Dong, T. Bell, and C. LI, "Surface treatment of co-cr based alloys using plasma carburization," ed: EP
Patent 1,499,755, 2008.
[12] X. Y. Li, N. Habibi, T. Bell, and H. Dong, "Microstructural characterisation of a plasma carburised low
carbon Co-Cr alloy," Surface Engineering, vol. 23, pp. 45-51, 2007.
[13] M. B. Nasab and M. R. Hassan, "Metallic Biomaterials of Knee and Hip-A Review," Trends in Biomaterials
and Artificial Organs, vol. 24, pp. 69-82, 2010.
[14] M. Navarro, A. Michiardi, O. Castano, and J. Planell, "Biomaterials in orthopaedics," Journal of the Royal
Society Interface, vol. 5, pp. 1137-1158, 2008.
[15] J. Alvarado, R. Maldonado, J. Marxuach, and R. Otero, "Biomechanics of hip and knee prostheses1,"
2003.
[16] M. Geetha, A. Singh, R. Asokamani, and A. Gogia, "Ti based biomaterials, the ultimate choice for
orthopaedic implants–A review," Progress in Materials Science, vol. 54, pp. 397-425, 2009.
[17] M. Long and H. Rack, "Titanium alloys in total joint replacement—a materials science perspective,"
Biomaterials, vol. 19, pp. 1621-1639, 1998.
[18] A. G. Au, V. James Raso, A. Liggins, and A. Amirfazli, "Contribution of loading conditions and material
properties to stress shielding near the tibial component of total knee replacements," Journal of
biomechanics, vol. 40, pp. 1410-1416, 2007.
[19] S. Teoh, "Fatigue of biomaterials: a review," International Journal of Fatigue, vol. 22, pp. 825-837, 2000.

57
[20] J. J. Ramsden, D. M. Allen, D. J. Stephenson, J. R. Alcock, G. Peggs, G. Fuller, and G. Goch, "The design and
manufacture of biomedical surfaces," CIRP Annals-Manufacturing Technology, vol. 56, pp. 687-711, 2007.
[21] R. Singh and N. B. Dahotre, "Corrosion degradation and prevention by surface modification of biometallic
materials," Journal of Materials Science: Materials in Medicine, vol. 18, pp. 725-751, 2007.
[22] D. Mears, "Metals in medicine and surgery," International Metals Reviews, vol. 22, pp. 119-155, 1977.
[23] W. C. Head, D. J. Bauk, and R. H. Emerson Jr, "Titanium as the material of choice for cementless femoral
components in total hip arthroplasty," Clinical Orthopaedics and Related Research, vol. 311, pp. 85-90,
1995.
[24] T. M. Wright, S. B. Goodman, and H. C. Amstutz, Implant wear: the future of total joint replacement:
symposium, Oakbrook, Illinois, September 1995: Amer Academy of Orthopaedic, 1996.
[25] R. Narayan, Biomedical materials: Springer, 2009.
[26] J. R. Davis, Handbook of materials for medical devices: ASM international, 2003.
[27] J. B. Brunski, "Chapter i.2.3 - Metals: Basic Principles," in Biomaterials Science (Third Edition), D. R. Buddy,
et al., Eds., ed: Academic Press, 2013, pp. 111-119.
[28] M. K. Harman, S. A. Banks, and W. A. Hodge, "Wear analysis of a retrieved hip implant with titanium
nitride coating," The Journal of Arthroplasty, vol. 12, pp. 938-945, 1997.
[29] M. F. Ashby and K. E. Easterling, "The transformation hardening of steel surfaces by laser beams—I.
Hypo-eutectoid steels," Acta Metallurgica, vol. 32, pp. 1935-1948, 1984.
[30] M. Ueda, M. M. Silva, C. Otani, H. Reuther, M. Yatsuzuka, C. M. Lepienski, and L. A. Berni, "Improvement
of tribological properties of Ti6Al4V by nitrogen plasma immersion ion implantation," Surface and
Coatings Technology, vol. 169–170, pp. 408-410, 2003.
[31] A. S. M. Handbook, "Vol. 4," Heat Treating, vol. 847, 1991.
[32] S. Yang, D. A. Puleo, O. W. Dillon, and I. S. Jawahir, "Surface Layer Modifications in Co-Cr-Mo Biomedical
Alloy from Cryogenic Burnishing," Procedia Engineering, vol. 19, pp. 383-388, 2011.
[33] V. P. Godbole, R. Narayan, Z. Xu, J. Narayan, and J. Sankar, "Diamond films and composites on
cobalt–chromium alloys," Materials Science and Engineering: B, vol. 58, pp. 251-257, 1999.
[34] M. E. Roy, L. A. Whiteside, J. Xu, and B. J. Katerberg, "Diamond-like carbon coatings enhance the
hardness and resilience of bearing surfaces for use in joint arthroplasty," Acta Biomaterialia, vol. 6, pp.
1619-1624, 2010.
[35] J. I. Oñate, M. Comin, I. Braceras, A. Garcia, J. L. Viviente, M. Brizuela, N. Garagorri, J. L. Peris, and J. I.
Alava, "Wear reduction effect on ultra-high-molecular-weight polyethylene by application of hard
coatings and ion implantation on cobalt chromium alloy, as measured in a knee wear simulation
machine," Surface and Coatings Technology, vol. 142–144, pp. 1056-1062, 2001.
[36] I.-M. Eichentopf, A. Lehmann, J. Lutz, J. W. Gerlach, and S. Mändl, "Mechanical Surface Properties of CoCr
Alloys After Nitrogen PIII," Plasma Processes and Polymers, vol. 4, pp. S44-S48, 2007.
[37] B. R. Lanning and R. Wei, "High intensity plasma ion nitriding of orthopedic materials: Part II.
Microstructural analysis," Surface and Coatings Technology, vol. 186, pp. 314-319, 2004.
[38] R. Wei, T. Booker, C. Rincon, and J. Arps, "High-intensity plasma ion nitriding of orthopedic materials: Part
I. Tribological study," Surface and Coatings Technology, vol. 186, pp. 305-313, 2004.
[39] A. Çelik, Ö. Bayrak, A. Alsaran, İ. Kaymaz, and A. F. Yetim, "Effects of plasma nitriding on mechanical and
tribological properties of CoCrMo alloy," Surface and Coatings Technology, vol. 202, pp. 2433-2438, 2008.
[40] Ö. Bayrak, A. F. YetİM, A. Alsaran, and A. ÇElİK, "Fatigue life determination of plasma nitrided medical
grade CoCrMo alloy," Fatigue & Fracture of Engineering Materials & Structures, vol. 33, pp. 303-309,

58
2010.
[41] Q. Wang, L. Zhang, and J. Dong, "Effects of Plasma Nitriding on Microstructure and Tribological
Properties of CoCrMo Alloy Implant Materials," Journal of Bionic Engineering, vol. 7, pp. 337-344, 2010.
[42] Z. L. Zhang and T. Bell, "Structure and corrosion resistance of plasma nitrided stainless steel," Surface
Engineering, vol. 1, pp. 131-136, 1985.
[43] J. Chen and H. Dong, "Corrosion and corrosion wear behaviour of plasma carburised Stellite 21 Co-Cr
alloy," Tribology - Materials, Surfaces & Interfaces, vol. 3, pp. 24-30, 2009.
[44] X. Li, Y. Sun, and T. Bell, "XTEM characterisation of low temperature plasma nitrided AISI 316 austenitic
stainless steel," Electron Microscopy and Analysis 1997, pp. 633-636, 1997.
[45] J. R. Davis, Nickel, cobalt, and their alloys: ASM International, 2000.
[46] Y. Sun, "Kinetics of low temperature plasma carburizing of austenitic stainless steels," Journal of
Materials Processing Technology, vol. 168, pp. 189-194, 2005.
[47] M. Tsujikawa, N. Yamauchi, N. Ueda, T. Sone, and Y. Hirose, "Behavior of carbon in low temperature
plasma nitriding layer of austenitic stainless steel," Surface and Coatings Technology, vol. 193, pp.
309-313, 2005.
[48] D. Williamson, P. Wilbur, F. Fickett, and S. Parascandola, "Role of ion-beam processing time in the
formation and growth of the high-nitrogen phase in austenitic stainless steel," BOOK-INSTITUTE OF
MATERIALS, vol. 752, pp. 333-352, 2001.
[49] W. Wu, X. Li, J. Chen, and H. Dong, "Design and characterisation of an advanced duplex system based on
carbon S-phase case and GiC coatings for 316LVM austenitic stainless steel," Surface and Coatings
Technology, vol. 203, pp. 1273-1280, 2009.
[50] H. Dong, T. Bell, and C. X. Li, European patent no. EP1499755, 21 May 2008.
[51] S. Thaiwatthana, "Mechanical and chemical characterisation of low-temperature plasma alloyed
austenitic stainless steels," PhD thesis, The University of Birmingham,, 2005.
[52] J. Lutz, "Diffusion behaviour and phase formation for ion implanted austenitic metal alloys," PhD thesis,
University of Leipzig, 2010.
[53] Y. Sun, X. Li, and T. Bell, "X-ray diffraction characterisation of low temperature plasma nitrided austenitic
stainless steels," Journal of Materials Science, vol. 34, pp. 4793-4802, 1999.
[54] Y. Sun, X. Li, and T. Bell, "Structural characteristics of low temperature plasma carburised austenitic
stainless steel," Materials Science and Technology, vol. 15, pp. 1171-1178, 1999.
[55] M. Mayo, R. Siegel, A. Narayanasamy, and W. Nix, "Mechanical properties of nanophase TiO 2 as
determined by nanoindentation," Journal of Materials Research, vol. 5, pp. 1073-1082, 1990.
[56] J. Lutz, C. Díaz, J. A. García, C. Blawert, and S. Mändl, "Corrosion behaviour of medical CoCr alloy after
nitrogen plasma immersion ion implantation," Surface and Coatings Technology, vol. 205, pp. 3043-3049,
2011.
[57] K. Ichii, K. Fujimura, and T. Takase, "Structure of the ion-nitrided layer of 18-8 stainless steel," Technol.
Rep. Kansai Univ., pp. 135-144, 1986.

59
Tables
Table 2.1 Lattice parameters of cobalt phases (nm)
ε-Co α-Co
a c a/c a
0.25071 0.40695 1.6233 0.35446
±0.00005 ±0.00005 ±0.00005
Table 2.2 Chemical compositions (in wt%) of Co-Cr-Mo

60
Table 3.1 Chemical composition of ASTM F-1537 Co-Cr-Mo alloy
element C Cr Mo Mn Ni Fe Co
wt% 0.210 29.22 6.06 0.243 0.02 0.185 bal
Table 3.2 Sample codes and surface treatment conditions
Code Gas composition Temperature Time
PN325/20 25%N2+75%H2 325°C 20h
PN400/20 25%N2+75%H2 400°C 20h
PN350/10 25%N2+75%H2 350°C 10h
PN350/15 25%N2+75%H2 350°C 15h
PN350/20 25%N2+75%H2 350°C 20h
PN350/25 25%N2+75%H2 350°C 25h
PN350/30 25%N2+75%H2 350°C 30h
PCN300/20 2%CH4+25%N2+73%H2 300°C 20h
PCN325/20 2%CH4+25%N2+73%H2 325°C 20h
PCN350/20 2%CH4+25%N2+73%H2 350°C 20h
PCN375/20 2%CH4+25%N2+73%H2 375°C 20h

61
Table 5.1 Summary of XRD peak angles (2θ) for plasma nitrided and UNT samples
hkl 111 200 220 311
UNT 43.73 50.81 74.89 90.83
PN325/20 42.09 48.47 72.03 86.71
PN350/20 41.99 48.07 71.93 86.57

62
Figures
Figure.2.1.1 Co-Cr alloys phase diagram[2]

63
Figure.3.1.1 60kw Klöckner DC plasma unit
Figure.3.2.1 Schematic of cross-section TEM sample preparation

64
Figure.3.3.1 Schematic diagram of corrosion test machine
Figure.3.4.1 Schematic diagram of the reciprocating wear machine

65
Figure.3.4.2 Schematic diagram of the wear track

66
(a)
(b)
Figure.4.1.1 (a) Microstructure (b) EDX results and (c) XRD of untreated sample.
0
10
20
30
40
50
60
70
C Si Cr Co Mo
wt%
Elements
A B
35 40 45 50 55 60 65 70 75 802θ
UNT α(111)
α(200)
ε(100) ε(101)
Cr23C6(420) α(220)
A
B

67
(a) (b)
(c)
(d)
Figure.4.1.2 Cross-sectional SEM images of PN treated samples (a) PN350/10, (b) PN325/20,
(c) PN350/20 and (d) PN400/20
Substrate
SN

68
(a)
(b)
(c)
Figure.4.1.3 Cross-sectional SEM microstructures of PCN treated samples (a) PCN300/20, (b)
PCN325/20 and (c) PCN350/20
SSNN
SSCC
SSuubbssttrraattee

69
(a)
(b)
(c)
Figure.4.2.1 Surface hardness of PN treated samples (a) temperature effect and (b) time effect
and (c) PCN treated samples
300
400
500
600
700
800
900
UNT PN325/20 PN350/20 PN400/20
Har
dn
ess,
Hv0
.05
Sample Code
300
400
500
600
700
800
UNT PN350/10 PN350/15 PN350/25 PN350/30
Har
dn
ess,
Hv0
.05
Sample Code
300
400
500
600
700
800
900
UNT PCN300/20 PCN325/20 PCN350/20 PCN375/20
Har
dn
ess,
Hv0
.05
Sample Code

70
Figure.4.2.2 Modified surface layer thickness of plasma treated samples
0
500
1000
1500
2000
2500
3000
Thic
knes
s,n
m
Sample Code

71
(a)
(b)
Figure.4.2.3 Load bearing capacity of (a) plasma nitrided samples and (b) plasma carbonitrided
samples.
400
500
600
700
800
900
1000
25g 50g 100g 200g 300g 500g 1000g
Surf
ace
har
dn
ess,
Hv
Load
PN350/10 PN350/20 PN350/30 unt
400
500
600
700
800
900
1000
1100
1200
25g 50g 100g 200g 300g 500g 1000g
Surf
ace
har
dn
ess,
Hv
Load
PCN300/20 PCN350/20 PCN375/20 UNT

72
Figure.4.2.4 Loading and un-loading curves of nano-indentation
0
2
4
6
8
10
12
14
16
18
20
0 50 100 150 200 250
Load
,mN
Depth,nm
unt
PN325/20
PN350/20
PCN325/20
PCN350/20

73
(a)
(b)
(c)
Figure.4.2.5 Nano-indentation hardness of plasma treated samples (a) temperature effect of
plasma nitriding, (b) time effect of plasma nitriding and (c) plasma carbonitriding
0
50
100
150
200
250
300
350
400
0
5
10
15
20
25
UNT PN325/20 PN350/20 PN400/20
Elas
tic
Mo
du
lus,
GP
a
Har
dn
ess
,GP
a
Sample Code
H E
0
50
100
150
200
250
300
350
400
0
5
10
15
20
25
UNT PN350/10 PN350/15 PN350/20 PN350/25 PN350/30El
asti
c m
od
ulu
s,G
Pa
Har
dn
ess,
GP
a
Sample Code
H E
0
50
100
150
200
250
300
350
400
0
5
10
15
20
25
UNT PCN300/20 PCN325/20 PCN350/20 PCN375/20
Elas
tic
Mo
du
lus,
GP
a
Har
dn
ess,
GP
a
Sample Code
H E

74
Figure.4.3.1 Typical elements depth profiles of PN400/20 sample
Figure.4.3.2 Temperature effect of nitrogen depth profiles of PN325/20, PN350/30 and
PN400/20
Figure.4.3.3 Time effect of nitrogen depth profile of PN350/10, PN350/20 and PN350/30
0
10
20
30
40
50
60
70
0 1 2 3 4 5 6
Co
,Cr,
Mo
,N,%
Distance from surface, µm
N Co Cr Mo
0
2
4
6
8
10
12
14
0.0 0.5 1.0 1.5 2.0
N%
Distance from surface, µm
PN325/20 PN350/20 PN400/20
0
2
4
6
8
10
12
14
0.0 0.5 1.0 1.5 2.0
N%
Distance from surface, µm
PN350/10 PN350/20 PN350/30

75
(a)
(b)
Figure.4.3.4 GDOES depth profiles of (a) PCN325/20 for all elements and (b) for elements N
and C only.
0
10
20
30
40
50
60
70
80
0.0 0.2 0.4 0.6 0.8 1.0
Co
,Cr,
Mo
,C,N
%
Distance from surface, µm
CO N CR MO C
0
1
2
3
4
5
6
7
8
0 0.1 0.2 0.3 0.4 0.5 0.6 0.7 0.8
N,C
%
Distance from surface, µm
N C

76
Figure.4.3.5 Temperature effect of nitrogen depth profiles of PCN300/20, PCN325/20,
PCN350/20 and PCN375/20
Figure.4.3.6 Temperature effect of carbon depth profiles of PCN300/20, PCN325/20,
PCN350/20 and PCN375/20
0
5
10
15
20
25
0.0 0.2 0.4 0.6 0.8 1.0
N%
Distance from surface, µm
PCN300 N% PCN325 N% PCN375 N%
0
1
2
3
4
5
6
7
8
9
10
0 0.5 1 1.5 2
C%
Distance from surface, µm
PCN300 C% PCN350 C% PCN375 C%

77
Figure.4.4.1 Temperature effect of XRD patterns of untreated sample, PN325/20, PN350/20 and
PN400/20
Figure.4.4.2 Time effect of XRD patterns of untreated sample, PN350/10, PN350/20 and
PN350/30
35 37 39 41 43 45 47 49 51 53 55
Re
lati
ve I
nte
nsi
ty
2θ
UNT
PN325/20
PN350/20
PN400/20
α(111)
α(200)
ε(100) ε(101)
SN (111) SN (200)
SN (111) SN (200)
SN(111)
SN (200)
CrO2(111 CrO2(210CrN(111)
CrN(200)
35 37 39 41 43 45 47 49 51 53 55
Re
lati
ve I
nte
nsi
ty
2θ
UNT
pn350/10
pn350/20
pn350/30
α(111) α(200)
ε(100) ε(101)
SN (111)
SN (111)
SN (111)
SN (200)
SN (200)
SN (200)
CrN(111)
CrN(200)

78
Figure.4.4.3 XRD patterns of PCN300/20, PCN325/20, PCN350/20 and PCN375/20 samples
compared with untreated sample
35 37 39 41 43 45 47 49 51 53 55
Re
lati
ve I
nte
nsi
ty
2θ
α(111) α(200) SC+SN (111)
SC+SN (200)
SC+SN (111)
SC+SN (111)
SC+SN (111)
SC+SN (200)
SC+SN (200)
SC+SN (200)
ε(100) ε(101) UNT
PCN300/20
PCN325/20
PCN350/20
PCN375/20

79
(a) (b)
(c)
Figure.4.4.4 TEM microstructures taken from substrate of surface treated sample, (a) bright
filed (BF); (b) dark filed (DF) images showing equiaxed grains with annealing and micro-twins;
and (c) corresponding SAD patterns of (a).

80
Figure.4.4.5 Cross-section TEM microstructure of PCN350/20 sample

81
Figure.4.4.6 TEM microstructure of a super-facial thin layer and corresponding SAD pattern of
PCN350/20 sample.
(a) (b)
Figure.4.4.7 TEM microstructure of a typical crystal grain (a) and corresponding SAD pattern
of [110] fcc, (b) in S-phase layer.

82
(a) (b)
(c)
Figure.4.4.8 (a) BF, (b) DF images showing twining microstructures and (c) corresponding
SAD patterns of [0 1 3] and [013]T.

83
(a)
(b)
Figure.4.4.9 TEM microstructure of PN350/20 sample showing a) layer structure and b) SAD
patterns from top area.

84
(a) (b)
(c)
Figure.4.4.10 (a) BF and (b) DF TEM microstructures of nitrogen S-phase and micro-twins; (c)
corresponding SAD pattern from (a).

85
(a) (b)
Figure.4.4.11 TEM microstructure of a carbide on the top of the S-phase layer, (a) sample
PN350/20, and (b) corresponding SAD pattern of B=[-112] Cr23C6 carbide.

86
(a)
(b)
Figure.4.5.1 Anodic polarization curves for untreated and plasma nitrided samples (a)
Temperature effect and (b) Time effect
1.E-08
1.E-07
1.E-06
1.E-05
1.E-04
1.E-03
1.E-02
1.E-01
1.E+00
1.E+01
-400 -200 0 200 400 600 800 1000 1200 1400
Cu
rre
nt
De
nsi
ty(m
A*c
m-2
)
Potential(mV/SCE)
UNT
PN325/20
PN350/20
PN400/20
1.E-08
1.E-07
1.E-06
1.E-05
1.E-04
1.E-03
1.E-02
1.E-01
1.E+00
1.E+01
-400 -200 0 200 400 600 800 1000 1200 1400
Cu
rre
nt
De
nsi
ty(m
A*c
m-2
)
Potential(mV/SCE)
UNT
PN350/10
PN350/20

87
(a)
(b)
(c)
Figure.4.5.2 SEM images of (a) untreated surface (b) corroded area of untreated sample
overview and (c) higher magnification picture
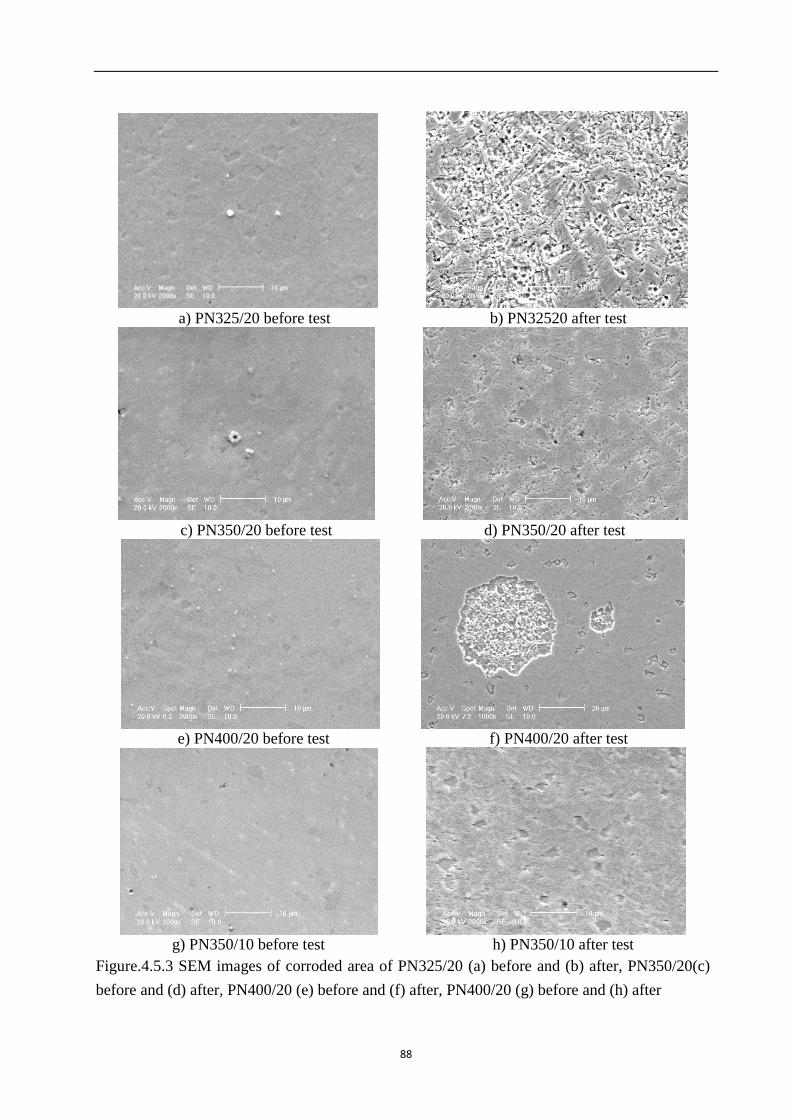
88
a) PN325/20 before test b) PN32520 after test
c) PN350/20 before test d) PN350/20 after test
e) PN400/20 before test f) PN400/20 after test
g) PN350/10 before test h) PN350/10 after test
Figure.4.5.3 SEM images of corroded area of PN325/20 (a) before and (b) after, PN350/20(c)
before and (d) after, PN400/20 (e) before and (f) after, PN400/20 (g) before and (h) after

89
Figure.4.5.4 Anodic polarization curves for untreated and plasma carbonitrided samples
(a) (b)
(c) (d)
Figure.4.5.5 SEM images of PCN300/20 of (a) corroded area and (b) outside of corroded area
and PCN375/20 of (c) corroded area and (d) outside of corroded area
1.E-06
1.E-05
1.E-04
1.E-03
1.E-02
1.E-01
1.E+00
-600 -400 -200 0 200 400 600 800 1000 1200
Cu
rre
nt
De
nsi
ty(m
A*
cm-2
)
Potential (mV/SCE)
UNT
PCN300/20
PCN325/20
PCN350/20
PCN375/20
5 µm

90
(a)
(b)
(c)
Figure.4.6.1 Reciprocating dry wear results of (a) Time effect of plasma nitriding, (b)
Temperature effect of plasma nitriding and (c) Temperature effect of plasma carbonitriding
1.E+06
1.E+07
1.E+08
1.E+09
1.E+10
UNT PN325/20 PN350/20 PN400/20
Wea
r Lo
ss,n
m2
Sample Code
10N
30N
1.E+06
1.E+07
1.E+08
1.E+09
1.E+10
UNT PN350/10 PN350/15 PN350/20 PN350/25 PN350/30
We
ar L
oss
,nm
2
Sample Code
10N 30N
1.E+06
1.E+07
1.E+08
1.E+09
1.E+10
UNT PCN300/20 PCN325/20 PCN350/20 PCN375/20
Wea
r Lo
ss,n
m2
Sample Code
10N 30N

91
(a)
(b)
(c)
Figure.4.6.2 Wear morphologies and EDX results of untreated sample under 30N (a) wear track
of untreated sample, (b) high magnification and (c) EDX of A and B
C MoMoSi
Cr Co
Mo
Co
Cr
Cr
OCo
0.5 1 1.5 2 2.5 3 3.5 4 4.5 5 5.5 6 6.5 7 7.5
keVFull Scale 1153 cts Cursor: 7.871 (14 cts)
Spectrum 2
Spectrum 4
A
B

92
(a)
(b)
(c)
Figure.4.6.3 Wear morphologies of PN350/20 under 10N (a) overview, (b) medium
magnification and (c) higher magnification of (a).

93
(a)
(b)
C O Si Cr Co Mo
A 2.24 38.26 0.58 18.08 37.06 3.78
B 2.28 1.15 28.31 59.96 8.30
(c)
Figure.4.6.4 Wear morphology and EDX results of PN350/20 under 30N (a) overview, (b)
higher magnification picture and (c) EDX results of A and B.
C MoSi Cr CoMoCo
CrCo
Cr
O
0.5 1 1.5 2 2.5 3 3.5 4 4.5 5 5.5 6 6.5 7 7.5
keVFull Scale 2952 cts Cursor: 7.831 (20 cts)
Spectrum 1Spectrum 5
A
B

94
(a) (b)
(c) (d)
(e)
Figure.4.6.5 Wear morphology of PN400/20 under 10N (a) overview and (b) higher
magnification, and wear morphology of PN400/20 under 30N (c) overview and (d) higher
magnification, (e) EDX results of A and B.
C MoMoMo
Si
Mo
Mo
Co
O
N
0.5 1 1.5 2 2.5 3 3.5 4
keVFull Scale 1817 cts Cursor: 4.442 (120 cts)
Spectrum 1
Spectrum 4
A
B

95
(a) (b)
(c) (d)
(e) (f)
Figure.4.6.6 Wear morphology with dry conditions of (a) PCN300/20 under 30N overview, (b)
higher magnification, (c) PCN350/20 under 30N overview, (d) higher magnification and (e)
PCN375/20 under 30N overview, (f) higher magnification.
Oxide
s
Oxides

96
(a)
(b)
(c)
Figure.4.6.7 Reciprocating wear results of plasma nitrided samples in full strength Ringer’s
solution (a) time effect, (b) temperature effect and (c) compare with the results in dry condition
and in full strength Ringer’s solution
0.0E+00
1.0E+07
2.0E+07
3.0E+07
4.0E+07
5.0E+07
6.0E+07
7.0E+07
8.0E+07
9.0E+07
1.0E+08
UNT PN325/20 PN350/20 PN400/20
We
ar lo
ss, n
m2
Sample Code
0.0E+00
1.0E+07
2.0E+07
3.0E+07
4.0E+07
5.0E+07
6.0E+07
7.0E+07
8.0E+07
9.0E+07
1.0E+08
UNT PN350/10 PN350/15 PN350/20 PN350/25 PN350/30
Wea
r lo
ss, n
m2
Sample Code
1.E+06
1.E+07
1.E+08
1.E+09
1.E+10
UNT PN325/20 PN350/20 PN400/20
Wea
r lo
ss, n
m2
Sample Code
dry wearcorrosive wear

97
(a) (b)
(c) (d)
(e) (f)
Figure.4.6.8 Wear morphology with Ringer’s solution of (a) untreated sample under 30N
overview, (b) higher magnification, (c) PN350/20 under 30N overview, (d) higher
magnification and (e) PN400/20 under 30N overview, (f) higher magnification.

98
(a)
(b)
Figure.4.6.9 (a) Reciprocating wear results of plasma nitrided samples in full strength Ringer’s
solution and (b) compare with the results in dry condition and in full strength Ringer’s solution
0.0E+00
1.0E+07
2.0E+07
3.0E+07
4.0E+07
5.0E+07
6.0E+07
7.0E+07
8.0E+07
9.0E+07
1.0E+08
UNT PCN300/20 PCN325/20 PCN350/20 PCN375/20
Wea
r lo
ss, n
m2
Sample Code
1.E+06
1.E+07
1.E+08
1.E+09
1.E+10
UNT PCN300/20 PCN325/20 pcn350/20 pcn375/20
Wea
r lo
ss, n
m2
Sample Code
dry wear
corrosive wear

99
(a) (b)
(c) (d)
(e) (f)
Figure.4.6.10 Wear morphology with Ringer’s solution of (a) PCN300/20 under 30N overview,
(b) higher magnification, (c) PCN350/20 under 30N overview, (d) higher magnification and (e)
PCN375/20 under 30N overview, (f) higher magnification.

100
Figure.5.1.1 XRD Charts for untreated, the surface of PCN350/20 and the backside of the
PCN350/20 sample
Figure.5.2.1 Lattice parameter as a function of direction
35 40 45 50 55
UNT PCN350/20 backside PCN350/20α--Co(alpha) ε--Co(epsilon)
ε(100)
ε(101)
Sn+Sc(111)
α(111) Sn+Sc(200 α(200)
α(111
α(200)
0.3500
0.3550
0.3600
0.3650
0.3700
0.3750
0.3800
S(111) S(200) S(220) S(311)
a hkl
,nm
Direction
UNT PN325/20 PN350/20