
Surface depression with double-angle geometry during the ... · PDF filereveals that high...
7
PHYSICAL REVIEW E 96, 022901 (2017) Surface depression with double-angle geometry during the discharge of grains from a silo F. Pacheco-Vázquez, * A. Y. Ramos-Reyes, and S. Hidalgo-Caballero Instituto de Física, Benemérita Universidad Autónoma de Puebla, Apartado Postal J-48, Puebla 72570, Mexico (Received 29 March 2017; revised manuscript received 25 June 2017; published 8 August 2017) When rough grains in loose packing conditions are discharged from a silo, a conical depression with a single slope is formed at the surface. We observed that the increase of volume fraction generates a more complex depression, characterized by two angles of discharge: one at the bottom similar to the angle of repose and a considerably larger upper angle. The change in slope appears at the boundary between a dense stagnant region at the periphery and the central flowing channel formed over the aperture. Since the material in the latter zone is always fluidized, the flow rate is unaffected by the initial packing of the bed. On the other hand, the contrast between both angles is markedly smaller when smooth particles of the same size and density are used, which reveals that high packing fraction and friction must combine to produce the observed geometry. Our results show that the surface profile helps to identify by simple visual inspection the packing conditions of a granular bed, being useful to prevent undesirable collapses during silo discharge in industry. DOI: 10.1103/PhysRevE.96.022901 I. INTRODUCTION The discharge of dry grains from a container reveals several features of a granular material depending on the observation zone: If we look at the bottom, the discharged material accumulates, forming a conical heap, and the grains roll and slide in continuous or intermittent avalanches until the lateral face reaches the angle of repose θ R [1]; if we look at the aperture, we observe a constant flow of grains Q independent of the height of the granular column [2], but we can also observe jamming if the opening is only a few times larger than the grain size [3,4]. Inside the container, on the other hand, the motion of the material towards the aperture can develop three different patterns: mass flow, funnel flow, or intermediate flow [5–8]. In the first case, typically observed in hoppers with very inclined walls, the material moves toward the outlet in a uniform manner, producing a continuous descent of the surface level; in the funnel flow, which is observed in silos with an opening through the horizontal bottom wall, an active flow channel forms above the outlet with stagnant material at the periphery; the third case of flow occurs when there is a combination of funnel flow in the lower part and mass flow in the higher part of the granular column. Flow pattern is fundamental to any understanding of stresses acting on the granular material, and modern techniques have been applied to visualize it, including particle image velocimetry, electrical capacitance tomography, and x-ray tomography [7–9]). Now, if we finally observe at the upper surface of the column, a conical depression may appear, with a slope slightly larger than the one corresponding to the maximum angle of stability θ M , namely, the angle at which the material starts to flow [10,11]. Flow rate, flow patterns, and the angles θ M and θ R depend on different factors such as particle shape and size [12–14], rolling and sliding friction coefficients [15], roughness [16] wall separation [17], container and aperture size [2,18], polydispersity [19], volume fraction [9,20–22], and other complex parameters such as liquid content [23–25] and the * [email protected] acceleration of gravity [26,27]. It is well known that Q is mainly determined by the outlet-diameter-to-grain-size ratio and the kind of grains. Since the pioneering expression reported by Beverloo in that regard [2], more accurate models were lately proposed to include intermittent flow produced by jamming [4,18]. More recently, the discharge of granular materials has been investigated using submerged silos [28,29] or particles with repulsive magnetic interactions [30,31]. Although several investigations concerning silo discharge have been focused on the flow rate, the pile formation and the features of the flow pattern, the description of the upper depression, and its evolution during the discharge have gone unnoticed. Here, we report that, if a silo filled with sand is vibrated or tapped before the discharge, the flow rate is not affected by the increase of packing fraction but the surface depression suffers an important change in geometry. The most remarkable effect is the observation of two external angles that contrast with the constant slope of conical depressions typically reported in the literature for loose packing conditions [11,28,32]. The different dynamics can be appreciated in the snapshots shown in Fig. 1 and in a video in the Supplemental Material [33]. We found that the two surface angles appear because of the existence of two regions with distinct packing fractions: a peripheral stagnant zone and a less dense central zone flowing towards the aperture. Experiments in three-dimensional (3D) and two-dimensional (2D) silos were developed and the depression profile during the whole discharge was analyzed. On the other hand, a less pronounced change in slope was observed when spherical and smooth glass beads of the same size were used. This indicates that friction increases markedly due to the greater contact area among amorphous particles at high volume fractions, and such a combination produces the double-angle geometry. II. EXPERIMENTAL SETUP A. 3D system A brass cylindrical container of 29 cm inner diameter and 30 cm height was used as a silo with a circular aperture of 0.65 ± 0.02 cm radius at the bottom face. The silo was filled 2470-0045/2017/96(2)/022901(7) 022901-1 ©2017 American Physical Society
Transcript of Surface depression with double-angle geometry during the ... · PDF filereveals that high...
PHYSICAL REVIEW E 96, 022901 (2017)
Surface depression with double-angle geometry during the discharge of grains from a silo
F. Pacheco-Vázquez,* A. Y. Ramos-Reyes, and S. Hidalgo-CaballeroInstituto de Física, Benemérita Universidad Autónoma de Puebla, Apartado Postal J-48, Puebla 72570, Mexico
(Received 29 March 2017; revised manuscript received 25 June 2017; published 8 August 2017)
When rough grains in loose packing conditions are discharged from a silo, a conical depression with a singleslope is formed at the surface. We observed that the increase of volume fraction generates a more complexdepression, characterized by two angles of discharge: one at the bottom similar to the angle of repose and aconsiderably larger upper angle. The change in slope appears at the boundary between a dense stagnant regionat the periphery and the central flowing channel formed over the aperture. Since the material in the latter zoneis always fluidized, the flow rate is unaffected by the initial packing of the bed. On the other hand, the contrastbetween both angles is markedly smaller when smooth particles of the same size and density are used, whichreveals that high packing fraction and friction must combine to produce the observed geometry. Our results showthat the surface profile helps to identify by simple visual inspection the packing conditions of a granular bed,being useful to prevent undesirable collapses during silo discharge in industry.
DOI: 10.1103/PhysRevE.96.022901
I. INTRODUCTION
The discharge of dry grains from a container reveals severalfeatures of a granular material depending on the observationzone: If we look at the bottom, the discharged materialaccumulates, forming a conical heap, and the grains roll andslide in continuous or intermittent avalanches until the lateralface reaches the angle of repose θR [1]; if we look at theaperture, we observe a constant flow of grains Q independentof the height of the granular column [2], but we can alsoobserve jamming if the opening is only a few times larger thanthe grain size [3,4]. Inside the container, on the other hand,the motion of the material towards the aperture can developthree different patterns: mass flow, funnel flow, or intermediateflow [5–8]. In the first case, typically observed in hopperswith very inclined walls, the material moves toward the outletin a uniform manner, producing a continuous descent of thesurface level; in the funnel flow, which is observed in siloswith an opening through the horizontal bottom wall, an activeflow channel forms above the outlet with stagnant materialat the periphery; the third case of flow occurs when thereis a combination of funnel flow in the lower part and massflow in the higher part of the granular column. Flow patternis fundamental to any understanding of stresses acting on thegranular material, and modern techniques have been appliedto visualize it, including particle image velocimetry, electricalcapacitance tomography, and x-ray tomography [7–9]). Now,if we finally observe at the upper surface of the column, aconical depression may appear, with a slope slightly largerthan the one corresponding to the maximum angle of stabilityθM , namely, the angle at which the material starts to flow[10,11].
Flow rate, flow patterns, and the angles θM and θR dependon different factors such as particle shape and size [12–14],rolling and sliding friction coefficients [15], roughness [16]wall separation [17], container and aperture size [2,18],polydispersity [19], volume fraction [9,20–22], and othercomplex parameters such as liquid content [23–25] and the
acceleration of gravity [26,27]. It is well known that Q ismainly determined by the outlet-diameter-to-grain-size ratioand the kind of grains. Since the pioneering expressionreported by Beverloo in that regard [2], more accurate modelswere lately proposed to include intermittent flow producedby jamming [4,18]. More recently, the discharge of granularmaterials has been investigated using submerged silos [28,29]or particles with repulsive magnetic interactions [30,31].
Although several investigations concerning silo dischargehave been focused on the flow rate, the pile formationand the features of the flow pattern, the description of theupper depression, and its evolution during the dischargehave gone unnoticed. Here, we report that, if a silo filledwith sand is vibrated or tapped before the discharge, theflow rate is not affected by the increase of packing fractionbut the surface depression suffers an important change ingeometry. The most remarkable effect is the observation oftwo external angles that contrast with the constant slope ofconical depressions typically reported in the literature for loosepacking conditions [11,28,32]. The different dynamics can beappreciated in the snapshots shown in Fig. 1 and in a videoin the Supplemental Material [33]. We found that the twosurface angles appear because of the existence of two regionswith distinct packing fractions: a peripheral stagnant zoneand a less dense central zone flowing towards the aperture.Experiments in three-dimensional (3D) and two-dimensional(2D) silos were developed and the depression profile duringthe whole discharge was analyzed. On the other hand, a lesspronounced change in slope was observed when spherical andsmooth glass beads of the same size were used. This indicatesthat friction increases markedly due to the greater contact areaamong amorphous particles at high volume fractions, and sucha combination produces the double-angle geometry.
II. EXPERIMENTAL SETUP
A. 3D system
A brass cylindrical container of 29 cm inner diameter and30 cm height was used as a silo with a circular aperture of0.65 ± 0.02 cm radius at the bottom face. The silo was filled
2470-0045/2017/96(2)/022901(7) 022901-1 ©2017 American Physical Society
F. PACHECO-VÁZQUEZ et al. PHYSICAL REVIEW E 96, 022901 (2017)
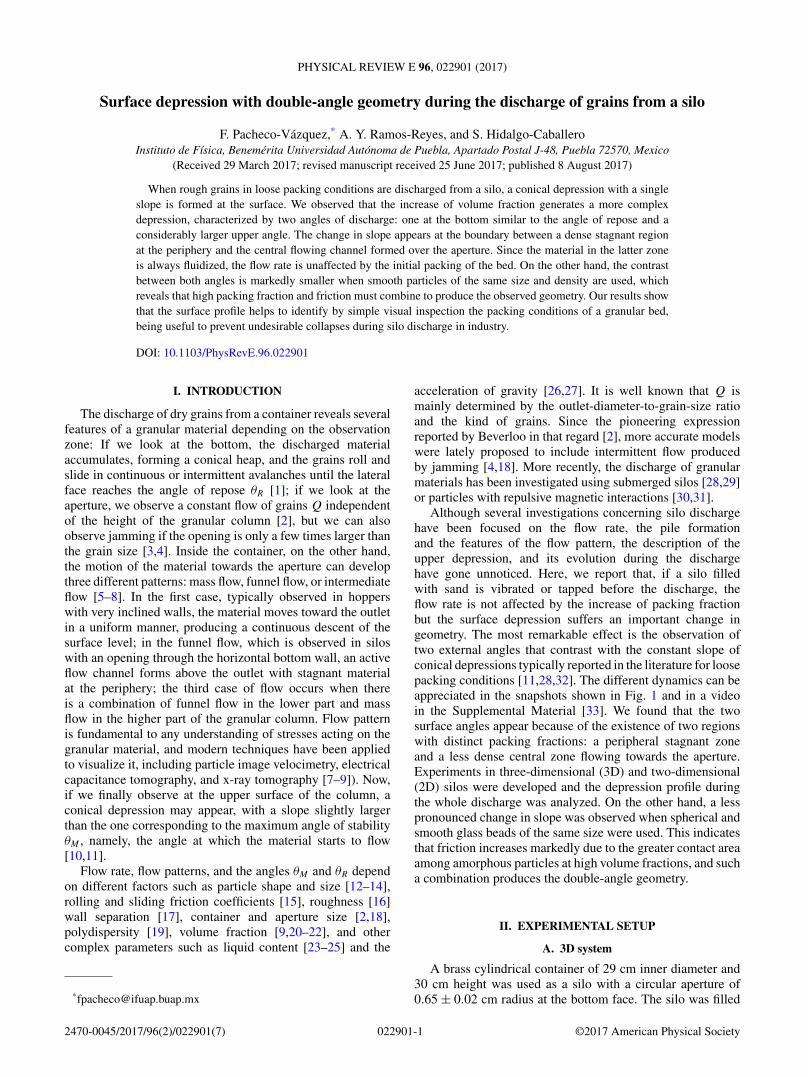
FIG. 1. Three-dimensional experiment: (a) Conical depression observed during the discharge of sand with loose packing fraction ϕl . (b)Depression with two surface angles observed when the same material is discharged with packing fraction ϕp > ϕl . In the last two snapshots, alaser line was used to better visualize the surface profile. The error bar corresponds to 5 cm.
with 31.5 kg of dry sand (density ρ = 2.65 ± 0.01 g/cm3 andsize distribution of 150–250 μm). Then, the container wastapped laterally with a rubber hammer to increase the packingfraction. To measure the depression profile, a laser line wasprojected centrally on the sand surface during the dischargeand it was recorded at 60 Hz with a lateral view at 45◦. Thisprocedure allowed us to observe the double-angle geometry asit is shown in Fig. 1(b).
B. 2D system
A quasi-two-dimensional cell was made of transparent glasswalls of 0.5 cm thickness separated by an aluminum frame ofinner dimensions L = 28.00 × H = 10.05 × w = 0.31 cm3
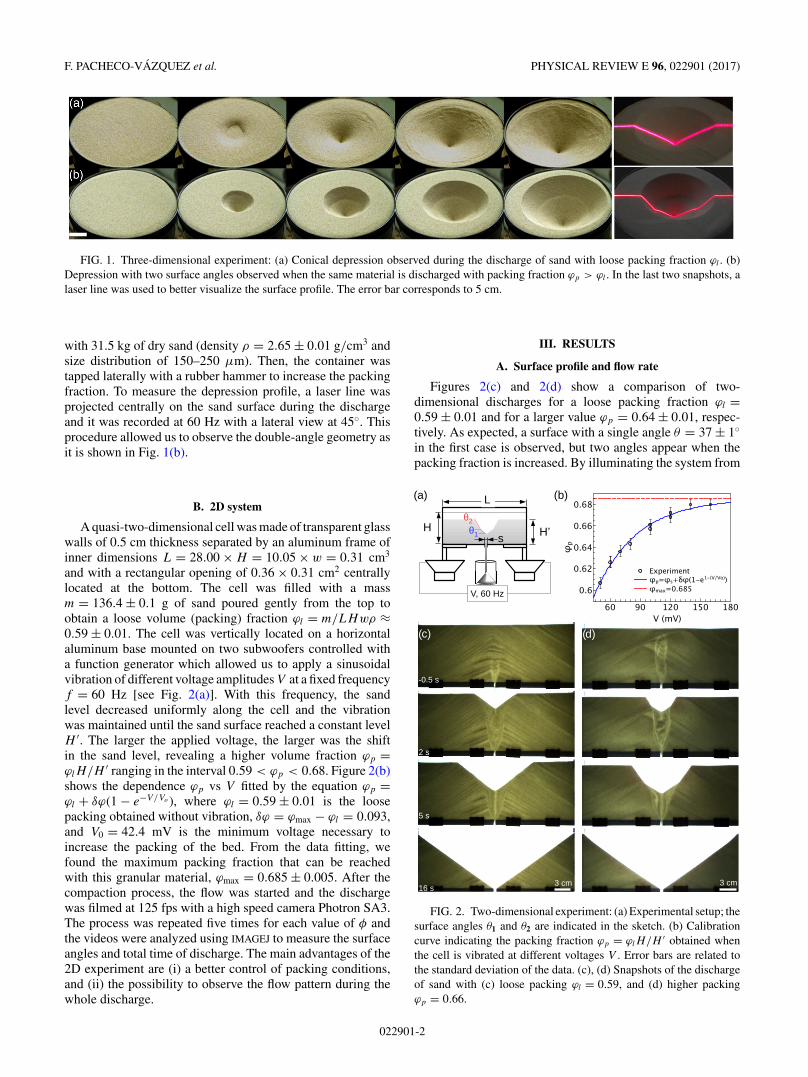
and with a rectangular opening of 0.36 × 0.31 cm2 centrallylocated at the bottom. The cell was filled with a massm = 136.4 ± 0.1 g of sand poured gently from the top toobtain a loose volume (packing) fraction ϕl = m/LHwρ ≈0.59 ± 0.01. The cell was vertically located on a horizontalaluminum base mounted on two subwoofers controlled witha function generator which allowed us to apply a sinusoidalvibration of different voltage amplitudes V at a fixed frequencyf = 60 Hz [see Fig. 2(a)]. With this frequency, the sandlevel decreased uniformly along the cell and the vibrationwas maintained until the sand surface reached a constant levelH ′. The larger the applied voltage, the larger was the shiftin the sand level, revealing a higher volume fraction ϕp =ϕlH/H ′ ranging in the interval 0.59 < ϕp < 0.68. Figure 2(b)shows the dependence ϕp vs V fitted by the equation ϕp =ϕl + δϕ(1 − e−V/Vo ), where ϕl = 0.59 ± 0.01 is the loosepacking obtained without vibration, δϕ = ϕmax − ϕl = 0.093,and V0 = 42.4 mV is the minimum voltage necessary toincrease the packing of the bed. From the data fitting, wefound the maximum packing fraction that can be reachedwith this granular material, ϕmax = 0.685 ± 0.005. After thecompaction process, the flow was started and the dischargewas filmed at 125 fps with a high speed camera Photron SA3.The process was repeated five times for each value of φ andthe videos were analyzed using IMAGEJ to measure the surfaceangles and total time of discharge. The main advantages of the2D experiment are (i) a better control of packing conditions,and (ii) the possibility to observe the flow pattern during thewhole discharge.
III. RESULTS
A. Surface profile and flow rate
Figures 2(c) and 2(d) show a comparison of two-dimensional discharges for a loose packing fraction ϕl =0.59 ± 0.01 and for a larger value ϕp = 0.64 ± 0.01, respec-tively. As expected, a surface with a single angle θ = 37 ± 1◦in the first case is observed, but two angles appear when thepacking fraction is increased. By illuminating the system from
FIG. 2. Two-dimensional experiment: (a) Experimental setup; thesurface angles θ1 and θ2 are indicated in the sketch. (b) Calibrationcurve indicating the packing fraction ϕp = ϕlH/H ′ obtained whenthe cell is vibrated at different voltages V . Error bars are related tothe standard deviation of the data. (c), (d) Snapshots of the dischargeof sand with (c) loose packing ϕl = 0.59, and (d) higher packingϕp = 0.66.
022901-2

SURFACE DEPRESSION WITH DOUBLE-ANGLE GEOMETRY . . . PHYSICAL REVIEW E 96, 022901 (2017)
FIG. 3. Flow rate and time dependence of the two surface angles during the discharge: (a) θ vs t for ϕl = 0.59 (–�–) and ϕp = 0.66 [(–)θ1; (×) θ2]. (b) θ vs t for different values of ϕp . Lines with dots and dashed lines of the same color correspond to θ2 and θ1, respectively. Thegray line indicates the angle of repose. The angle error due to image analysis was of the order of one pixel, corresponding to ±1◦. (c) The flowrate Q = 3.82 ± 0.05 g/s is constant during the discharge and independent of the initial packing fraction of the bed (each point represents theaverage of five repetitions and error bars the standard deviation).
behind it is possible to observe the transition from a centralzone where the material is flowing and the static lateral zones.The difference in packing produces a sharp contrast in lightintensity which allows one to define clearly the funnel flowprofile. Noteworthy, the transition coincides at the surface levelwith the point at which the slope changes, indicating an angledependence on the volume fraction: The inferior angle θ1 isrelated to a lower volume fraction in the fluidized zone and theupper angle θ2 to the larger packing in the static zones. Duringthe discharge, θ2 decreases until it reaches the same value asθ1 when the process ends.
Figures 3(a) and 3(b) show the values of θ1 and θ2 as afunction of time t for different volume fractions ϕp. In the firstplot only the cases ϕl = 0.59 and ϕp = 0.66 are compared forclarity. Two repetitions exemplify the reproducibility of theprocess observed in all the events. For the loose packing case(�), the slope fluctuates around the angle of stability θ ≈ 37.5◦and then falls at the end of the discharge to θR = 35.5◦ (grayline), the angle of repose for this granular material. On theother hand, for the highly packed bed, θ2 (×) reaches up to 60◦at the beginning of the discharge while θ1 (–) falls below theangle of repose, and then both angles converge at the end of theprocess in θ = θR . In general, the same dynamics is observedfor different values of ϕp > ϕl [see Fig. 3(b)]: θ2 increaseswith ϕp (line+symbol) while θ1 decreases (dashed lines),and always θ1 < θR < θ2. Note that in all cases the dischargefinishes practically at the same time τ . Accordingly, Fig. 3(c)shows that the flow rate Q = �m/�t (where �m is the massof grains discharged during a time �t) measured throughthe aperture for different values of ϕp is constant. Equivalentmeasurements in the 3D case give Q = 63.7 ± 0.9 g/s forloose packing (ϕl ≈ 0.60 ± 0.01) and Q = 64.8 ± 0.7 g/s forhigh packing (ϕp ≈ 0.64 ± 0.01). Therefore, Q is independentof the initial packing of the bed in both 2D and 3D systems.
Figure 4(a) shows the radius of the 2D depression R2D asa function of time for different values of ϕp. The log-log plotin the inset reveals a nearly linear relation indicating a power-law dependence R(t) = C(ϕp)tn(ϕp). The maximum growthrate is observed for the loose packing case (�), and the bestfit of the data gives R(t)2D = (3.32 ± 0.02)t0.521±0.003 (blackline). For higher packing values, the radius grows more slowlyover time and is well fitted by a power law with coefficients
C(ϕp) and exponents n whose dependence on ϕp is derived inthe following section. Figure 4(b) shows a similar dynamicsfor the 3D case, with the best fit given by R(t)3D = (3.59 ±0.01)t0.333±0.005 (black line) for ϕl , and a slower cavity growthfor ϕp (red line). It can be also notice that R3D has stepwiseincrements for t > 20 s in the latter case, in contrast to thesmooth increase of R3D for loose packing. Videos reveal thatthis is due to abrupt avalanches of material produced at largevalues of θ2, when the surface becomes unstable at one pointwhere the weight of the material above it surpasses friction.
FIG. 4. Cavity radius as a function of time for (a) 2D and (b) 3Ddischarges of loosely (black dots) and densely (red squares) packedgrains. Insets: Corresponding log-log plots indicate a nearly-power-law growth.
022901-3
F. PACHECO-VÁZQUEZ et al. PHYSICAL REVIEW E 96, 022901 (2017)
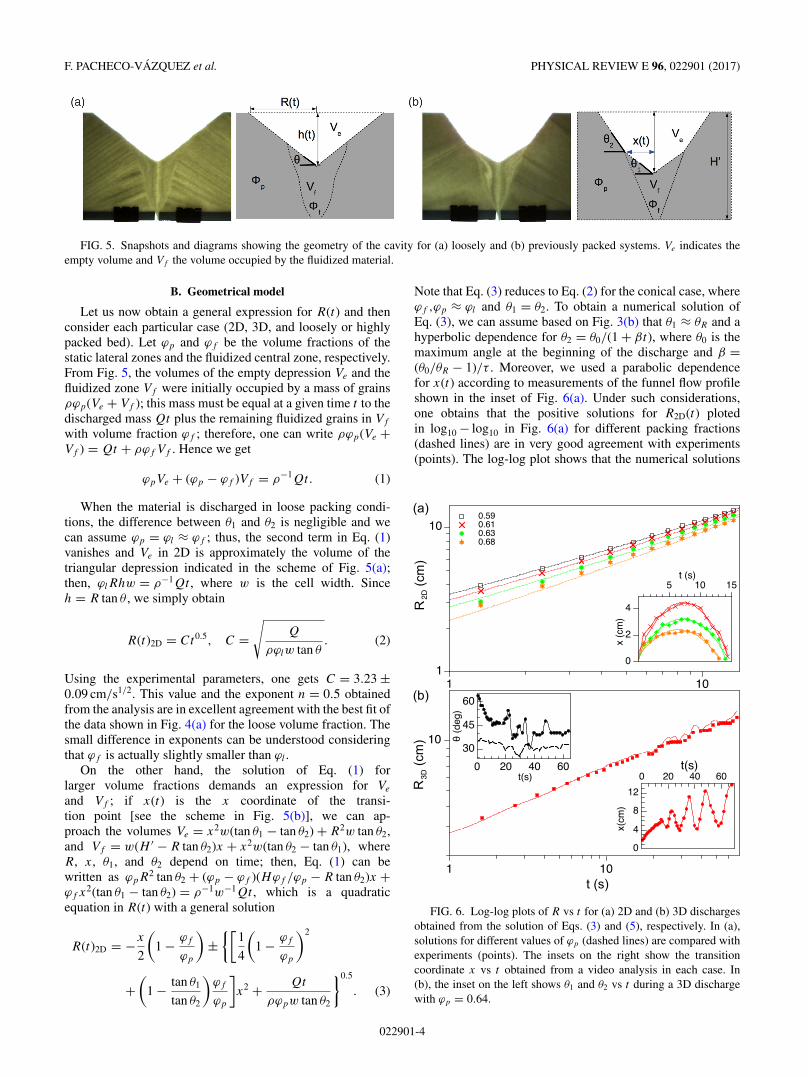
FIG. 5. Snapshots and diagrams showing the geometry of the cavity for (a) loosely and (b) previously packed systems. Ve indicates theempty volume and Vf the volume occupied by the fluidized material.
B. Geometrical model
Let us now obtain a general expression for R(t) and thenconsider each particular case (2D, 3D, and loosely or highlypacked bed). Let ϕp and ϕf be the volume fractions of thestatic lateral zones and the fluidized central zone, respectively.From Fig. 5, the volumes of the empty depression Ve and thefluidized zone Vf were initially occupied by a mass of grainsρϕp(Ve + Vf ); this mass must be equal at a given time t to thedischarged mass Qt plus the remaining fluidized grains in Vf
with volume fraction ϕf ; therefore, one can write ρϕp(Ve +Vf ) = Qt + ρϕf Vf . Hence we get
ϕpVe + (ϕp − ϕf )Vf = ρ−1Qt. (1)
When the material is discharged in loose packing condi-tions, the difference between θ1 and θ2 is negligible and wecan assume ϕp = ϕl ≈ ϕf ; thus, the second term in Eq. (1)vanishes and Ve in 2D is approximately the volume of thetriangular depression indicated in the scheme of Fig. 5(a);then, ϕlRhw = ρ−1Qt , where w is the cell width. Sinceh = R tan θ , we simply obtain
R(t)2D = Ct0.5, C =√
Q
ρϕlw tan θ. (2)
Using the experimental parameters, one gets C = 3.23 ±0.09 cm/s1/2. This value and the exponent n = 0.5 obtainedfrom the analysis are in excellent agreement with the best fit ofthe data shown in Fig. 4(a) for the loose volume fraction. Thesmall difference in exponents can be understood consideringthat ϕf is actually slightly smaller than ϕl .
On the other hand, the solution of Eq. (1) forlarger volume fractions demands an expression for Ve
and Vf ; if x(t) is the x coordinate of the transi-tion point [see the scheme in Fig. 5(b)], we can ap-proach the volumes Ve = x2w(tan θ1 − tan θ2) + R2w tan θ2,and Vf = w(H ′ − R tan θ2)x + x2w(tan θ2 − tan θ1), whereR, x, θ1, and θ2 depend on time; then, Eq. (1) can bewritten as ϕpR2 tan θ2 + (ϕp − ϕf )(Hϕf /ϕp − R tan θ2)x +ϕf x2(tan θ1 − tan θ2) = ρ−1w−1Qt , which is a quadraticequation in R(t) with a general solution
R(t)2D = −x
2
(1 − ϕf
ϕp
)±
{[1
4
(1 − ϕf
ϕp
)2
+(
1 − tan θ1
tan θ2
)ϕf
ϕp
]x2 + Qt
ρϕpw tan θ2
}0.5
. (3)
Note that Eq. (3) reduces to Eq. (2) for the conical case, whereϕf ,ϕp ≈ ϕl and θ1 = θ2. To obtain a numerical solution ofEq. (3), we can assume based on Fig. 3(b) that θ1 ≈ θR and ahyperbolic dependence for θ2 = θ0/(1 + βt), where θ0 is themaximum angle at the beginning of the discharge and β =(θ0/θR − 1)/τ . Moreover, we used a parabolic dependencefor x(t) according to measurements of the funnel flow profileshown in the inset of Fig. 6(a). Under such considerations,one obtains that the positive solutions for R2D(t) plotedin log10 − log10 in Fig. 6(a) for different packing fractions(dashed lines) are in very good agreement with experiments(points). The log-log plot shows that the numerical solutions
FIG. 6. Log-log plots of R vs t for (a) 2D and (b) 3D dischargesobtained from the solution of Eqs. (3) and (5), respectively. In (a),solutions for different values of ϕp (dashed lines) are compared withexperiments (points). The insets on the right show the transitioncoordinate x vs t obtained from a video analysis in each case. In(b), the inset on the left shows θ1 and θ2 vs t during a 3D dischargewith ϕp = 0.64.
022901-4
SURFACE DEPRESSION WITH DOUBLE-ANGLE GEOMETRY . . . PHYSICAL REVIEW E 96, 022901 (2017)
predict the slight deviation from a power law observed in theexperimental data.
Regarding the 3D case, Eq. (1) remains valid with a depres-sion described by a conical shape of volume Ve = 1
3πR2h forthe discharge of loosely packed material. Considering againϕf ≈ ϕl and h = R tan θ for this trivial case, one obtains
R(t)3D = C ′t1/3, C ′ =(
3Q
ρϕlπ tan θ
)1/3
. (4)
Using the experimental values one finds C ′ = 3.67 ±0.05 cm/s1/3, again in very good agreement with the 3D datafitting reported above. As in the 2D analysis, an expression forlarger ϕp can be derived based on Fig. 5(b). In this case, Eq. (1)can be written as ϕp tan θ2R
3 + ϕf x3(tan θ1 − tan θ2) + (ϕp −ϕf )x2(Hϕf /ϕp − R tan θ2) = 3Qt/πρ. The third term of theleft-hand side is one order of magnitude smaller than the others,therefore, one finds
R(t)3D ≈[
3Qt
ρϕpπ tan θ2+ ϕf
ϕp
(1 − tan θ1
tan θ2
)x3
]1/3
. (5)
As it is to be expected, the latter expression is reducedto Eq. (4) when θ1 = θ2. To solve Eq. (5) for the packedcase (ϕp = 0.64), we measured θ1, θ2, and x as a functionof t using laser profilometry. The resulting data shown inthe insets of Fig. 6(b) reveal a very complex dependence ontime after t = 20 s, related to abrupt avalanches of slidingmaterial. It is worth mentioning that the avalanches appearperiodically, as in the stick slip motion of granular layers. Wemust also consider that the tapping compaction method couldproduce a nonhomogeneous packing inside the 3D silo, whichgenerates large fluctuations in the values of θ2. Since it was notfeasible to establish analytical expressions for x and θ2, datawere substituted directly in Eq. (5), and one gets a very goodagreement between the solution (–) and the experiment (�) inFig. 6(b). Thus, R(t) is well described by one-half and one-third power laws with dependence on de packing fraction givenby Eqs. (3) and (5) for 2D and 3D discharges, respectively.
C. Rough grains versus smooth grains
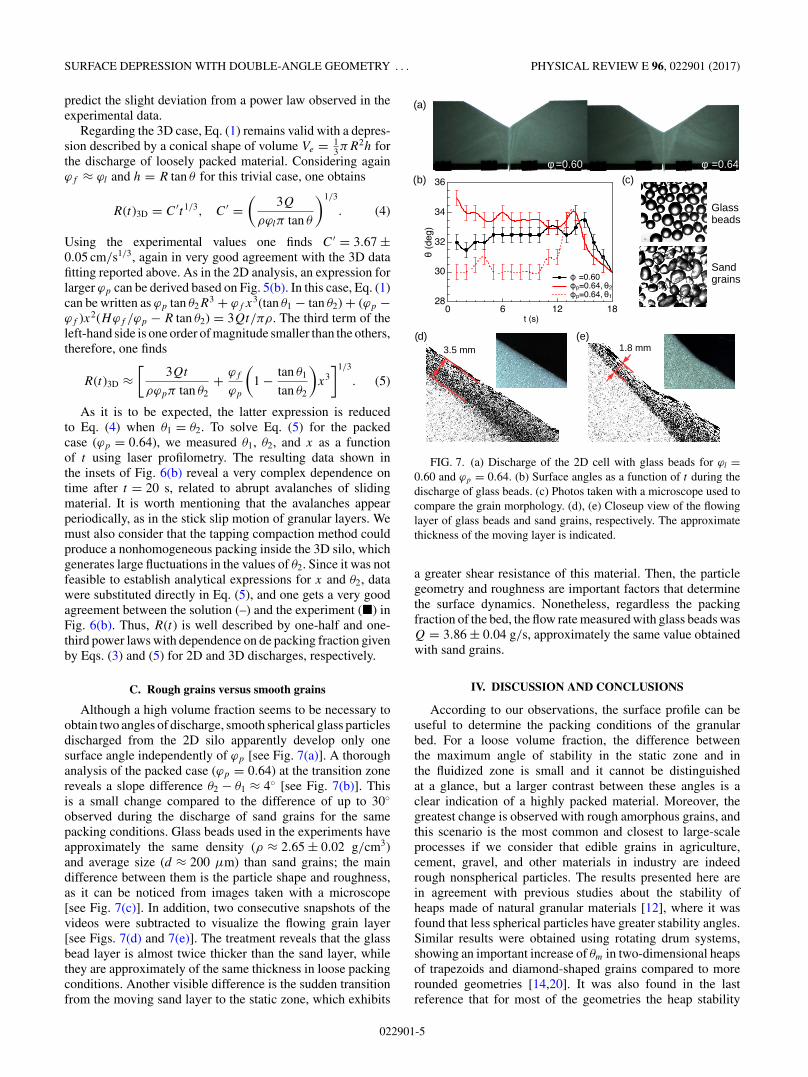
Although a high volume fraction seems to be necessary toobtain two angles of discharge, smooth spherical glass particlesdischarged from the 2D silo apparently develop only onesurface angle independently of ϕp [see Fig. 7(a)]. A thoroughanalysis of the packed case (ϕp = 0.64) at the transition zonereveals a slope difference θ2 − θ1 ≈ 4◦ [see Fig. 7(b)]. Thisis a small change compared to the difference of up to 30◦observed during the discharge of sand grains for the samepacking conditions. Glass beads used in the experiments haveapproximately the same density (ρ ≈ 2.65 ± 0.02 g/cm3)and average size (d ≈ 200 μm) than sand grains; the maindifference between them is the particle shape and roughness,as it can be noticed from images taken with a microscope[see Fig. 7(c)]. In addition, two consecutive snapshots of thevideos were subtracted to visualize the flowing grain layer[see Figs. 7(d) and 7(e)]. The treatment reveals that the glassbead layer is almost twice thicker than the sand layer, whilethey are approximately of the same thickness in loose packingconditions. Another visible difference is the sudden transitionfrom the moving sand layer to the static zone, which exhibits
FIG. 7. (a) Discharge of the 2D cell with glass beads for ϕl =0.60 and ϕp = 0.64. (b) Surface angles as a function of t during thedischarge of glass beads. (c) Photos taken with a microscope used tocompare the grain morphology. (d), (e) Closeup view of the flowinglayer of glass beads and sand grains, respectively. The approximatethickness of the moving layer is indicated.
a greater shear resistance of this material. Then, the particlegeometry and roughness are important factors that determinethe surface dynamics. Nonetheless, regardless the packingfraction of the bed, the flow rate measured with glass beads wasQ = 3.86 ± 0.04 g/s, approximately the same value obtainedwith sand grains.
IV. DISCUSSION AND CONCLUSIONS
According to our observations, the surface profile can beuseful to determine the packing conditions of the granularbed. For a loose volume fraction, the difference betweenthe maximum angle of stability in the static zone and inthe fluidized zone is small and it cannot be distinguishedat a glance, but a larger contrast between these angles is aclear indication of a highly packed material. Moreover, thegreatest change is observed with rough amorphous grains, andthis scenario is the most common and closest to large-scaleprocesses if we consider that edible grains in agriculture,cement, gravel, and other materials in industry are indeedrough nonspherical particles. The results presented here arein agreement with previous studies about the stability ofheaps made of natural granular materials [12], where it wasfound that less spherical particles have greater stability angles.Similar results were obtained using rotating drum systems,showing an important increase of θm in two-dimensional heapsof trapezoids and diamond-shaped grains compared to morerounded geometries [14,20]. It was also found in the lastreference that for most of the geometries the heap stability
022901-5

F. PACHECO-VÁZQUEZ et al. PHYSICAL REVIEW E 96, 022901 (2017)
increases with packing fraction, which is also consistent withour findings.
Two external angles of stability have also been recentlyreported in numerical investigations of very large three-dimensional heaps of particles produced by ballistic deposition[34]. In that research, it was found that distinct density zonesproduced during the deposition have a remarkable implicationin the angle of repose, and the angle change was associatedwith an increase in the number of contacts among beads.This coincides with our explanation of the notable increaseof angle for nonspherical particles: Amorphous grains can berearranged under vibration to maximize the contact area, incontrast to glass beads whose contact is reduced to a surfacepoint; therefore, a grain of sand experiences more friction withthe surrounding particles and needs on average a greater angleof inclination to start moving.
Another aspect to notice is that the relation θ1 < θR < θ2
is always satisfied. Since θ1 is the angle corresponding to thefluidized zone with volume fraction ϕf , its value should beindependent on ϕp; nevertheless, θ1 slightly decreases whenthe initial packing of the bed is augmented. To explain thisfact, let us remember that the fluidized zone is fed by the thinlayers of grains flowing over the static zones. Considering anaverage friction coefficient μ, these grains have an accelerationa ∼ g(sin θ2 − μ cos θ2), where g is the acceleration of gravity.Thus, the velocity at which they arrive to the fluidized zoneis greater for higher values of θ2 and they can move furtherto be accumulated near the central zone. The accumulationof particles generates a slope with θ1 < θR and it allows theavalanche to stop. Furthermore, in Fig. 3 we showed that θ2
decreases over time. This is also related to the accumulationof grains in the central zone and only happens if the flowfrom the lateral zones is greater than the flow through theoutlet. As the discharge time t increases, the distance fromthe cavity rim to the fluidized zone augments and the upperangle must diminish from geometrical requirements. Thus,θ2 would not change if such a distance were constant. Totest this point, we performed experiments in a tall cell withH > (L/2) tan θR [see Fig. 8(a)]. By comparing the snapshotswith the analysis shown in Fig. 8(b) we can notice that indeedθ2 remains constant during a considerable part of the discharge(stage II) because the length of the flowing layer over thestagnant zone is practically the same in such an interval. Thesame dynamics was observed in an even larger silo [Fig. 8(c)]and in all cases a funnel flow is developed.
It is interesting to note that the loose packing fractionϕl handled here coincides with the critical packing value(ϕcps ∼ 0.59) reported in Refs. [35,36] for which densityfluctuations are minimized, and shear does not cause eitherdilation or compaction of the granular bed. This supports ourassumption about the negligible difference in volume fractionbetween flowing and stagnant regions for this packing value,and it helps to clarify why there are no changes in the surfaceslope or sudden avalanches, as it occurs for higher packingvalues.
Finally, let us argue about the independence of Q on thevolume fraction shown in Fig. 3(c). This can be understoodif we observe from snapshots in Figs. 2(c) and 2(d) that thematerial from the stagnant zone must pass through the fluidizedzone before reaching the aperture; therefore, the initial volume
FIG. 8. (a) Snapshots of the discharge of a 2D tall silo. (b) θ1 andθ2 as a function of t . Three regimes are observed and each one endswhen (I) the cavity reaches the side walls, (II) the cavity reaches theoutlet, and (III) the flow stops at the angle of repose. In (II) the surfaceangles remain almost constant. (c) θ1 and θ2 vs t in a considerablylarger quasi-2D silo filled with 1.5 kg of sand.
fraction of the bed is irrelevant. To support our conclusion, weplot in Fig. 9(a) the velocity field in the x-z plane obtainedfrom particle trajectories tracked in the fluidized zone duringthe discharge of loose and packed beds. In Figs. 9(b) and 9(c)we can notice that the velocity values ν are very similar forboth packings, with a maximum in (x,z) ∼ (0,10), i.e., in the
FIG. 9. (a) Velocity field obtained from particle tracking duringthe discharge of loosely and highly packed grains. (b) ν as a functionof the x coordinate. (c) ν at different z coordinates. The velocityis almost constant along the funnel and increases abruptly near theoutlet.
022901-6
SURFACE DEPRESSION WITH DOUBLE-ANGLE GEOMETRY . . . PHYSICAL REVIEW E 96, 022901 (2017)
outlet, and it decreases symmetrically as we move away fromthe central zone. The notable increase of ν when the materialpasses through the outlet is because the funnel flow suddenlynarrows and it must obey mass conservation. In this lowerpoint, the grains reach similar speeds in both discharges (ν ≈8 cm/s), which explains the constant flow rate independentlyof the initial packing of the bed. In the literature, even thoughthe flow rate in vertical silos filled under different conditionshas been investigated [37], small flow-rate variations wererelated to changes in pressure and not to the packing fractionitself, and little effect on the flow was expected in vertical silospacked by the influence of gravity [22]. A dependence of Q
on the value of ϕ only was found to be important in vertical[38] and horizontal silos [22] in a regime of dilute flows ofparticles, where a higher concentration at the outlet produces alarger amount of grains leaving the system. Then, it could be ofinterest for future research to explore the flow-rate transitionfrom dilute to dense flows of granular materials.
In summary, this research shows that the depression profileduring the discharge of grains from a silo develops a richerdynamics if the material is previously compacted. The timedependence of the depression radius in 2D and 3D silosfollows respectively one-half and one-third power laws thatare functions of the packing fraction. In all cases, the flowrate is independent of the initial packing of the bed becausethe grains enter in a fluidized zone before reaching the siloaperture. The observation of two angles in the surface profileis clear indication of a highly packed material, and it can helpto prevent abrupt avalanches that could produce silo damage.
ACKNOWLEDGMENTS
This research was supported by the following projects:CONACyT Mexico No. 242085 of the Sectoral ResearchFund for Education, PRODEP-SEP No. DSA/103.5/14/10819,PROFOCIE-SEP 2015-2016, and VIEP 2016-2017.
[1] J. Duran, Sands, Powders, and Grains: An Introduction to thePhysics of Granular Materials (Springer, New York, 2000).
[2] W. A. Beverloo, H. A. Leniger, and J. van de Velde, Chem. Eng.Sci. 15, 260 (1961).
[3] I. Zuriguel, A. Garcimartín, D. Maza, L. A. Pugnaloni, and J. M.Pastor, Phys. Rev. E 71, 051303 (2005).
[4] I. Zuriguel et al., Sci. Rep. 4, 7324 (2014).[5] T. V. Nguyen, C. E. Brennen, and R. H. Sabersky, J. Appl. Mech.
47, 729 (1980).[6] A. Drescher, Powder Technol. 73, 251 (1992).[7] J. Tejchman, Confined Granular Flow in Silos: Experimental
and Numerical Investigations (Springer, Berlin, 2013).[8] K. Grudzien, Image Process. Commun. 19, 107 (2015).[9] L. Babout, K. Grudzien, E. Maire, and P. J. Withers, Chem. Eng.
Sci. 97, 210 (2013).[10] R. Albert, I. Albert, D. Hornbaker, P. Schiffer, and A.-L.
Barabasi, Phys. Rev. E 56, R6271(R) (1997).[11] G. Boumans, Grain Handling and Storage (Elsevier,
Amsterdam, 2012).[12] P. A. Arias-García, R. O. Uñac, A. M. Vidales, and A. Lizcano,
Physica A 390, 4095 (2011).[13] D. A. Robinson and S. P. Friedman, Physica A 311, 97 (2002).[14] C. J. Olson, C. Reichhardt, M. McCloskey, and R. J. Zieve,
Europhys. Lett. 57, 904 (2002).[15] Y. C. Zhou, B. H. Xu, A. B. Yu, and P. Zulli, Powder Technol.
125, 45 (2002).[16] N. A. Pohlman, B. L. Severson, J. M. Ottino, and R. M. Lueptow,
Phys. Rev. E 73, 031304 (2006).[17] S. Courrech du Pont, P. Gondret, B. Perrin, and M. Rabaud,
Europhys. Lett. 61, 492 (2003).[18] C. Mankoc et al., Granular Matter 9, 407 (2007).[19] L. Pournin, M. Ramaioli, P. Folly, and Th. M. Liebling,
Eur. Phys. J. E 23, 229 (2007).[20] J. Olson, M. Priester, J. Luo, S. Chopra, and R. J. Zieve,
Phys. Rev. E 72, 031302 (2005).
[21] R. O. Uñaca, A. M. Vidales, and L. A. Pugnaloni, J. Stat. Mech.(2012) P04008.
[22] M. A. Aguirre, R. De Schant, and J.-C. Geminard, Phys. Rev. E90, 012203 (2014).
[23] S. Nowak, A. Samadani, and A. Kudrolli, Nat. Phys. 1, 50(2005).
[24] M. Scheel et al., Nat. Mater. 7, 189 (2008).[25] F. Pacheco-Vázquez, F. Moreau, N. Vandewalle, and S. Dorbolo,
Phys. Rev. E 86, 051303 (2012).[26] M. G. Kleinhans, H. Markies, S. J. de Vet, A. C. in ’t Veld, and
F. N. Postema, J. Geophys. Res. 116, E11004 (2011).[27] S. Dorbolo et al., Granular Matter 15, 263 (2013).[28] T. Wilson, C. Pfeifer, N. Mesyngier, and D. Durian, Pap. Phys.
6, 060009 (2014).[29] J. Koivisto and D. J. Durian, Nat. Commun. 8, 15551 (2017).[30] G. Lumay et al., Pap. Phys. 7, 070013 (2015).[31] D. Hernández-Enríquez, G. Lumay, and F. Pacheco-Vázquez,
EPJ Web Conf. 140, 03089 (2017).[32] F. E. Loranca-Ramos, J. L. Carrillo-Estrada, and F. Pacheco-
Vázquez, Phys. Rev. Lett. 115, 028001 (2015).[33] See Supplemental Material at http://link.aps.org/supplemental/
10.1103/PhysRevE.96.022901 for the discharge of loosely andhighly packed grains from three dimensional and two dimen-sional systems. Note the appearance of two angles of dischargeon the surface of the highly packed bed.
[34] N. Topic, J. A. C. Gallas, and T. Pöschel, Phys. Rev. Lett. 109,128001 (2012).
[35] M. Schröter, D. I. Goldman, and H. L. Swinney, Phys. Rev. E71, 030301(R) (2005)
[36] P. Umbanhowar and D. I. Goldman, Phys. Rev. E 82, 010301(R)(2010).
[37] H. Ahn, Z. Basaranoglu, M. Yilmaz, A. Bugutekin, and M. ZaferGül, Powder Technol. 186, 65 (2008).
[38] D. Huang, G. Sun, and K. Lu, Phys. Rev. E 74, 061306(2006).
022901-7