Surface Characteristics - rmaces
29
Field Evaluation of Thin 4.75-mm Hot Mix Asphalt Dense-Graded RMAC 40th Annual Conference, February 27-March 1, 2013, Denver, Colorado Overlay: Surface Characteristics Disclaimer: This presentation reflects the views of the authors, who are responsible for the facts and the accuracy of the data contained herein. This presentation does not necessarily represent the official views or policies of the Indiana Department of Transportation, the Joint Transportation Research Program or Federal Highway Administration. This report does not constitute a standard, specification or regulation. Neither the authors nor any their employers, nor any agency thereof endorses products or manufacturers. Shuo Li, Yanna Sun, Yi Jiang, Samy Noureldin, and Todd Shields
Transcript of Surface Characteristics - rmaces
Field Evaluation of Thin 4.75-mm Hot Mix Asphalt Dense-Graded
RMAC 40th Annual Conference, February 27-March 1, 2013, Denver, Colorado
Hot Mix Asphalt Dense-Graded Overlay: Surface Characteristics
Disclaimer: This presentation reflects the views of the authors, who are responsible for the facts and the accuracy of the data contained herein. This presentation does not necessarily represent the official views or policies of the Indiana Department of Transportation, the Joint Transportation Research Program or Federal Highway Administration. This report does not constitute a standard, specification or regulation. Neither the authors nor any their employers, nor any agency thereof endorses products or manufacturers.
Shuo Li, Yanna Sun, Yi Jiang, Samy Noureldin, and Todd Shields

Acknowledgements
This project was sponsored by INDOT in cooperation with FHWAthrough the Joint Transportation Research Program (JTRP). Theauthors would like to thank David Andrewski, Mike Prather, JeffreyJames, Jewell Stone, Shakeel Baig, and Tom Duncan for theirguidance. The assistance from Tony Johnson, Kyle Long, BrittneyGick, Patrick Weaver and Ayesha Shah is also acknowledged.Gick, Patrick Weaver and Ayesha Shah is also acknowledged.
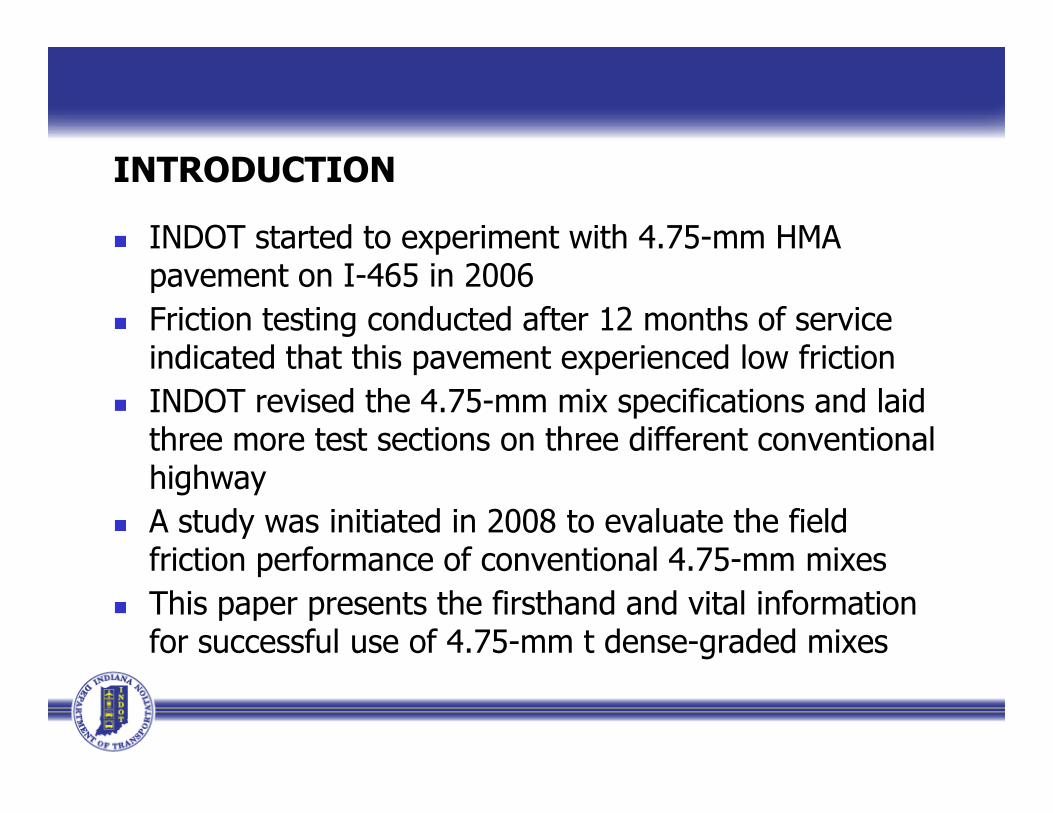
INTRODUCTION
INDOT started to experiment with 4.75-mm HMA pavement on I-465 in 2006
Friction testing conducted after 12 months of service indicated that this pavement experienced low friction
INDOT revised the 4.75-mm mix specifications and laid INDOT revised the 4.75-mm mix specifications and laid three more test sections on three different conventional highway
A study was initiated in 2008 to evaluate the field friction performance of conventional 4.75-mm mixes
This paper presents the firsthand and vital information for successful use of 4.75-mm t dense-graded mixes
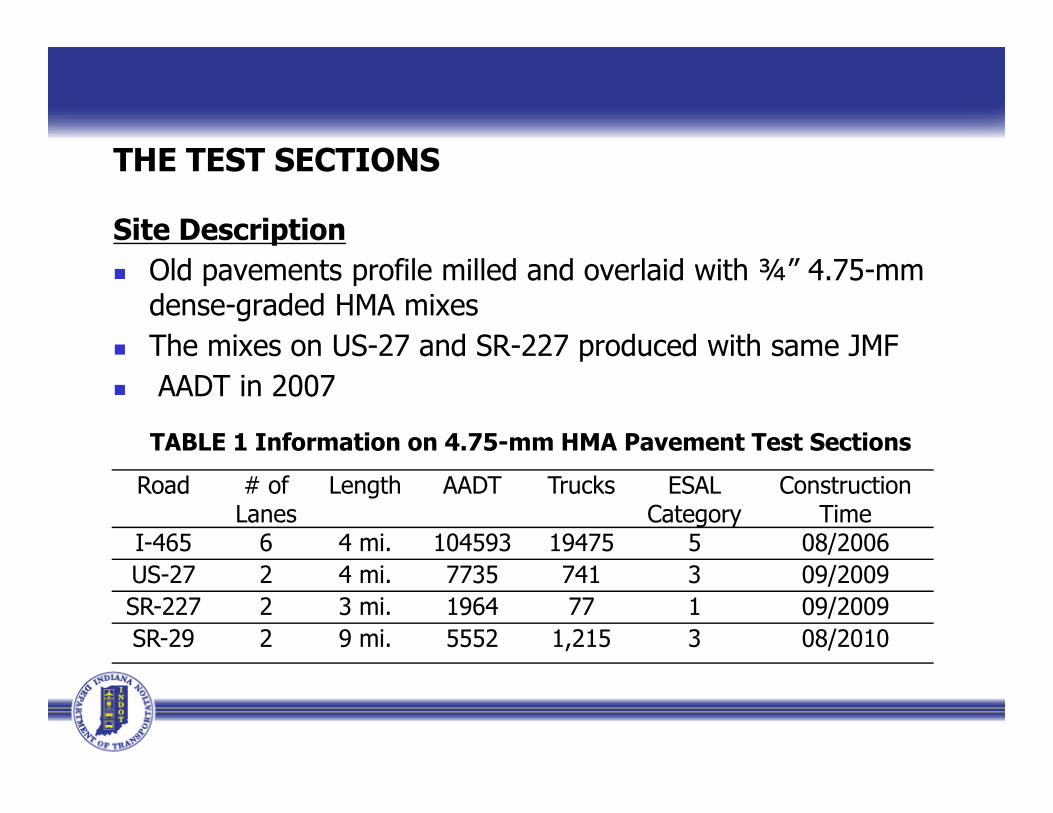
THE TEST SECTIONS
Site Description Old pavements profile milled and overlaid with ¾” 4.75-mm
dense-graded HMA mixes The mixes on US-27 and SR-227 produced with same JMF AADT in 2007
Road # of Lanes
Length AADT Trucks ESAL Category
Construction Time
I-465 6 4 mi. 104593 19475 5 08/2006US-27 2 4 mi. 7735 741 3 09/2009SR-227 2 3 mi. 1964 77 1 09/2009SR-29 2 9 mi. 5552 1,215 3 08/2010
TABLE 1 Information on 4.75-mm HMA Pavement Test Sections

Materials and Mixes For the 1st 4.75-mm pavement on I-465, no experience
available and the mix design relied on the practice with coarse aggregate size mixes
Binder selection: PG system (temperature, ESAL category) Recycled materials, such as RAP and ARS might be used Aggregate selection: ESAL category Aggregate selection: ESAL category
Natural: sandstone, dolomite, crushed stone, crushed gravel,and natural sand
Synthetic: blast furnace slag (BFS) and steel furnace slag (SF)INDOT polish resistant aggregates (PRA)
For other sections, specifications were revised (aggregate type, gradation)

ESALBinder
Recycled MaterialsAggregate TypeCategory Numbers (106) RAP ARS
1 <0.3 PG 64-22 ≤25% ≤5% BFS, SF, sandstone, dolomite, PRA, crushed stone, crushed gravel, natural sand
2 0.3 to <3 PG 64-22 ≤25% ≤5%
TABLE 2 Summaries of Material Selection for 4.75-mm HMA Mixes
natural sand3 3 to <10 PG 64-22,
70-22≤15% ≤3% BFS, SF, sandstone,
dolomite, PRA4 10 to <30 PG 70-22,
76-22≤15% ≤3% BFS, SF, sandstone,
dolomite1, PRA1
5 ≥30 PG 76-22 ≤15% ≤3%1Dolomite and PRA may be used but cannot exceed 50% of the aggregate by weight when blended with BFS or sandstone, and 40% of the aggregate when blended with SF.

Test Section Aggregate Components Binder RAP
I-465BFS sand (39%), #24 dolomite sand (39%), #24 sand (20%), and Baghouse PG 70-22 0%
TABLE 3 Summaries of Materials, Gradations and Mixes for Experimental Pavements
(a) Mix Materials
I-465 (39%), #24 sand (20%), and Baghousefines (2%)
PG 70-22 0%
US-27/SR-227#12 dolomite (34%), #24 dolomite sand (34%), dolomite sand (30%), and Baghouse fines (2%)
PG 64-22 0%
SR-29#12 dolomite (27%), #24 QA sand (48%), QA fine sand (23%), and Baghouse fines (2%)
PG 64-22 0%

Test Section % Passing through Sieve Sizes (sieve size unit: mm)9.5 4.75 2.36 1.18 0.60 0.30 0.15 0.075
I-465 100 96.1 78.6 52.3 34.8 17.5 9.6 6.3US-27/SR-227 100 90.1 67.2 47.8 32.7 22.6 14.7 7.8SR-29 100 90.0 68.4 42.4 25.4 15.8 11.0 6.7
(b) Aggregate Gradations
Test Section FAA SE AC Va (%) VMA (%) VFA (%) DBRTotal Eff.I-465 45.9 92.1 7.8 5.9 4 17.7 76.9 1.0US-27/SR-227 47.0 80.0 6.9 5.2 4 16.0 75.0 1.5SR-29 47.1 88.3 6.8 5.7 4 17.3 76.9 1.2
(c) Aggregate and Mix Volumetric Properties

TEST AND RESULTS
The Test Section on I-465
FIGURE 1 Friction test results in the test section on I-465

Test Section MPD (mm)Friction
DFT20 FN (smooth tire) FN (Rib tire)I-465 0.24 0.43 16.7 44.4
TABLE 4 Summary of Surface Characteristics in I-465 Test Section
Friction testing with ASTM E 274 trailer started 2007 DF-Tester and CTM testing in 2009 Poor friction numbers varied between 8 and 20 Friction variations in both directions followed a similar trend Friction numbers fluctuated significantly over time FN by rib tire much greater than FN by smooth tire Poor macrotexture MPD: 0.24 mm

The Test Sections on US-27 and SR-227
FIGURE 2 Friction test results in the test sections on US-27/SR-227

TABLE 5 Summaries of Surface Characteristics in US-27 and SR-227 Test Sections
Items US-27 SR-227SB NB SB NB
MPD (mm), 18 months 0.24 0.30 0.18 0.20DFT20, 18 months 0.25 0.27 0.30 0.27FN (smooth tire), 18 months 19.7 28.6 20.1 19.8
Fresh 4.75-mm surfaces might produce good friction performance
Dramatic friction reduction overt time, 47% on US-27 and 36% on SR-227 after 12 months in service
Macrotexture MPD range: 0.18-0.30 mm Good correlation between FN and MPD

The Test Section on SR-29
Items LocationSB NB
FN (smooth tire), fresh surface 32.9 36.6FN (smooth tire), 6 months 21.6 27.6MPD (mm), 6 months 0.21 (Scanner) 0.22 (CTM)DFT , 6 months 0.23
TABLE 6 Summary of Surface Characteristics in SR-29 Test Section
DFT20, 6 months 0.23
Due to site conditions, MPD measured with CTM and Scanner, respectively
Observations similar to those from the test sections on US-27 and SR-227
MPD: 0.21mm (SB), 0.22mm (NB) FN: 21.6 (SB), 27.6 (NB)

HMA SURFACE FRICTION PERFORMANCE
Mix Type and Surface Characteristics
TABLE 7 Frictional Characteristics of Various Pavement Surfaces
Surface Type Friction MPD (mm)4.75-mm HMA on I-465, 36 months 16.7, smooth tire 0.24, CTM4.75-mm HMA on US-27, 18 months 19.7/28.6, smooth tire 0.24/0.30, CTM4.75-mm HMA on US-27, 18 months 19.7/28.6, smooth tire 0.24/0.30, CTM4.75-mm HMA on SR-227, 18 months 20.1/19.8, smooth tire 0.18/0.20, CTM4.75-mm HMA on SR-29, 6 months 21.6/27.6, smooth tire 0.21/0.22, CTM4.75-mm HMA, new (1) 62.5, rib tire 0.21, CTM4.75-mm HMA, 15 months (1) 63.8, rib tire 0.26, CTM12.5-mm HMA, new (1) 65.5, rib tire 0.39, CTM12.5-mm HMA, 15 months (1) 45.9, rib tire 0.39, CTM4.75-mm HMA, new, MODOT (2) - 0.17-0.22, CTM4.75-mm HMA, new, TNDOT (virgin mix) (2) 0.25-0.35, DFT20 0.16-0.33, CTM4.75-mm HMA, new, TNDOT (15% RAP) (2) 0.28-0.33, DFT20 0.19-0.33, CTM4.75-mm HMA, new, MNDOT (2) 0.34-0.49, DFT20 0.13-0.18, CTM
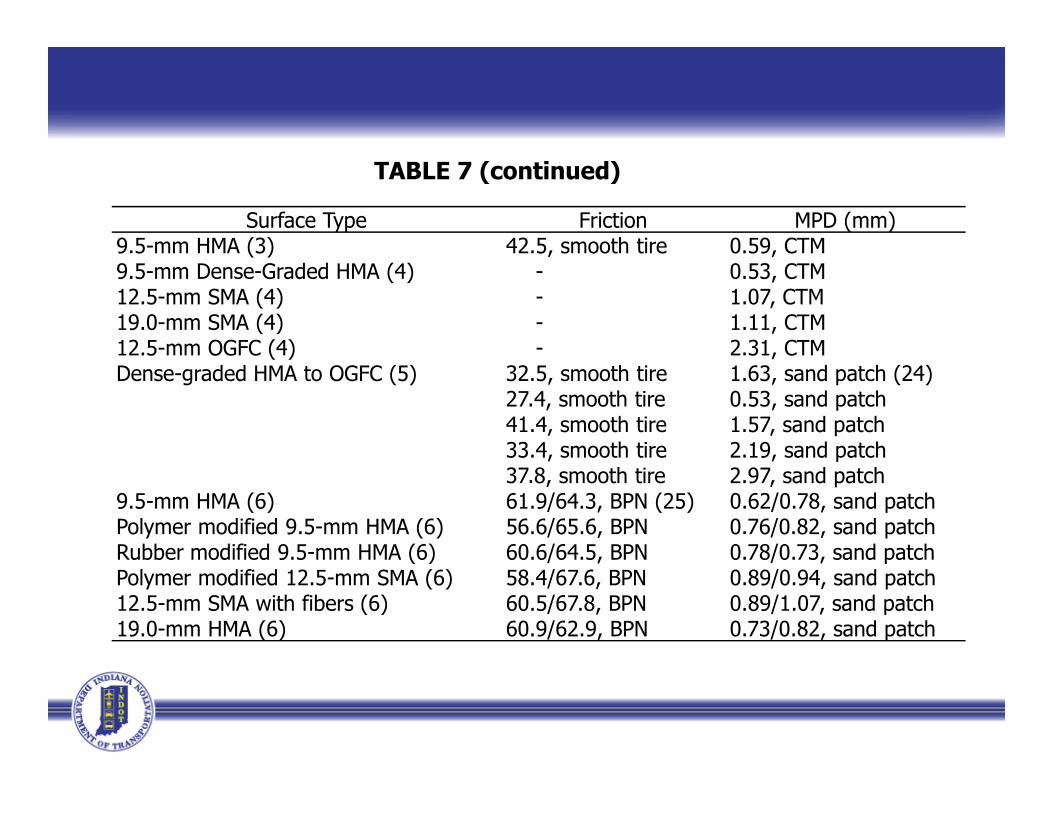
TABLE 7 (continued)
Surface Type Friction MPD (mm)9.5-mm HMA (3) 42.5, smooth tire 0.59, CTM9.5-mm Dense-Graded HMA (4) - 0.53, CTM12.5-mm SMA (4) - 1.07, CTM19.0-mm SMA (4) - 1.11, CTM12.5-mm OGFC (4) - 2.31, CTMDense-graded HMA to OGFC (5) 32.5, smooth tire 1.63, sand patch (24)
27.4, smooth tire 0.53, sand patch27.4, smooth tire 0.53, sand patch41.4, smooth tire 1.57, sand patch33.4, smooth tire 2.19, sand patch37.8, smooth tire 2.97, sand patch
9.5-mm HMA (6) 61.9/64.3, BPN (25) 0.62/0.78, sand patchPolymer modified 9.5-mm HMA (6) 56.6/65.6, BPN 0.76/0.82, sand patchRubber modified 9.5-mm HMA (6) 60.6/64.5, BPN 0.78/0.73, sand patchPolymer modified 12.5-mm SMA (6) 58.4/67.6, BPN 0.89/0.94, sand patch12.5-mm SMA with fibers (6) 60.5/67.8, BPN 0.89/1.07, sand patch19.0-mm HMA (6) 60.9/62.9, BPN 0.73/0.82, sand patch

TABLE 7 (continued)Surface Type Friction MPD (mm)
9.5-mm PFC, new (7) 0.51, DFT20 1.37, CTM9.5-mm PFC, 36 months (7) 0.52, DFT20 1.37, CTM9.5-mm PFC, 60 months (7) 0.42, DFT20 1.48, CTM9.5-mm SMA, newly constructed (7) 0.37, DFT20 1.17, CTM9.5-mm SMA, 36 months (7) 0.61, DFT20 1.03, CTM9.5-mm SMA, 60 months (7) 0.69, DFT20 0.93, CTM9.5-mm HMA, newly constructed (7) 0.52, DFT20 0.30, CTM9.5-mm HMA, 36 months (7) 0.39, DFT20 0.55, CTM9.5-mm HMA, 60 months (7) 0.41, DFT 0.63, CTM9.5-mm HMA, 60 months (7) 0.41, DFT20 0.63, CTM
4.75-mm mixes demonstrated the smallest MPD, 0.20mm-0.35 mm Surface friction and MPD increased as NMAS increased Surface friction increased as MPD increased SMA, OGFC and PFC showed better friction than conventional mixes Modified asphalt binders might improve friction performance Poor friction might be the inherent nature of 4.75-mm HMA mixes

Surface Characteristics of 4.75-mm Mixes
FIGURE 3 Friction variations in all test sections
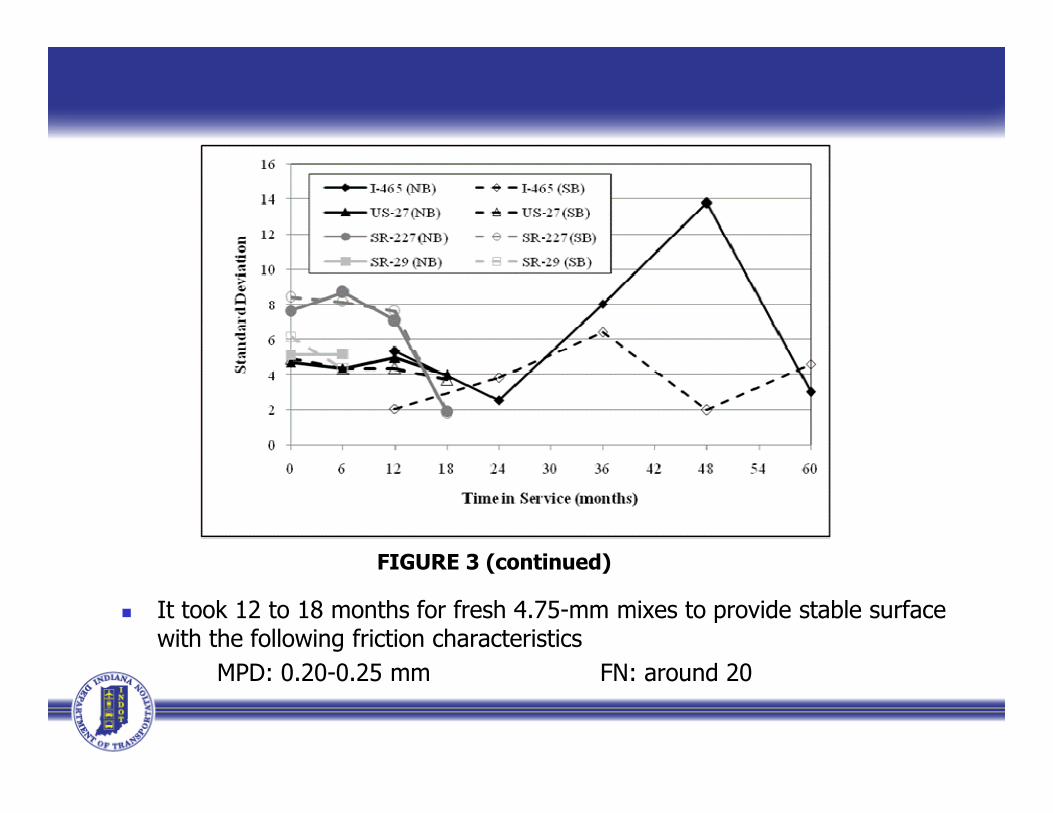
FIGURE 3 (continued)
It took 12 to 18 months for fresh 4.75-mm mixes to provide stable surface with the following friction characteristics
MPD: 0.20-0.25 mm FN: around 20

EFFECT OF AGGREGATE PROPERTIES
Gradation Limits Superpave gradation limits:
Control points: Max. size, NMAS, PCS, 2.36-mm sieve and 0.075-mm sieve
PCS sieve: 1.18-mmPCS sieve: 1.18-mmRestricted zone: between 0.30-mm sieve and 2.36-mm sieve
Removed by NCHRP Report 4642.36-mm sieve: 53.4%1.18-mm sieve: 36.1%-42.1%0.60-mm sieve: 26.8%-30.8%0.30-mm sieve: 21.1%
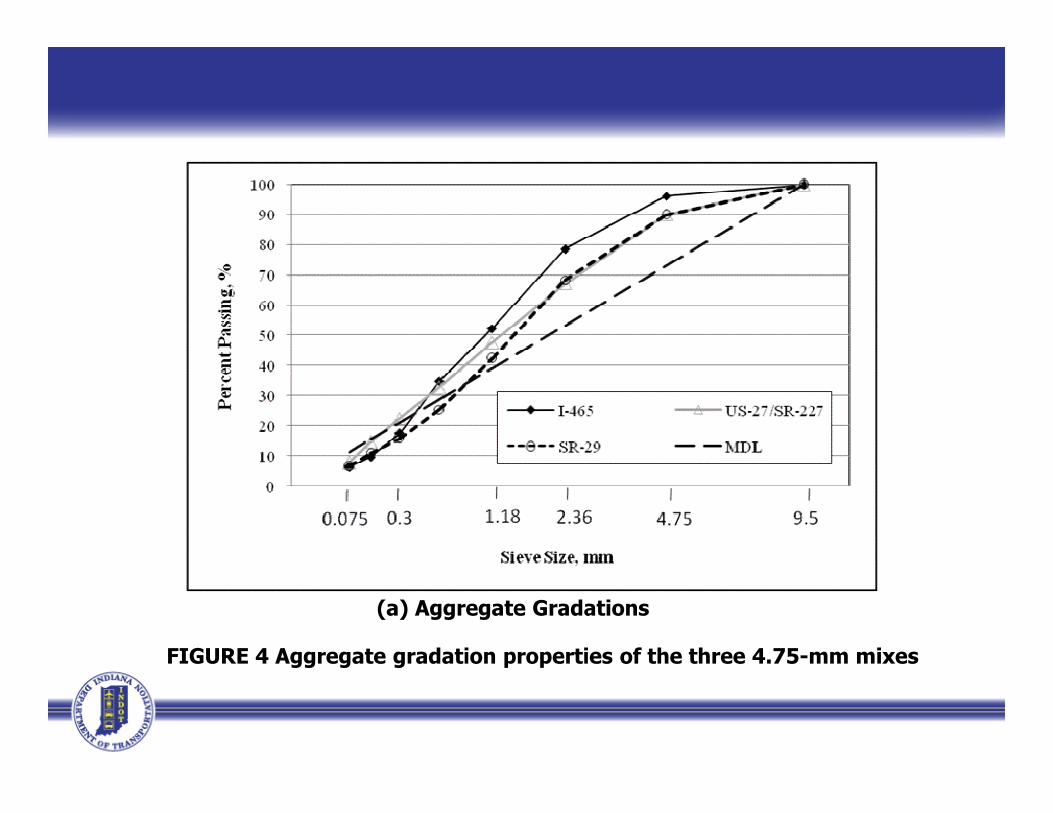
FIGURE 4 Aggregate gradation properties of the three 4.75-mm mixes
(a) Aggregate Gradations

(b) Gradation LimitsFIGURE 4 (continued)

Aggregate gradations all lying far above the MDL on 0.6-mm and larger sieves, few coarse particles
Aggregate gradations all passing above the PCS control point, all fined-graded mixesGradations on I-465 and SR-29: CRZGradations on US-27 and SR-227: ARZ
All 4.75-mm mixes contained too much fine sand All 4.75-mm mixes contained too much fine sandPoor macrotexture properties, leading to low frictionWeak skeleton/poor stabilities: significant friction fluctuation
To improve surface frictionProvide a BRZ aggregate gradationProvide a aggregate gradation passing below the PCS control point (more realistic when restricted zone removed)

Packing Properties
Experimental Section I-465 US-27/SR-227 SR-29% Half Sieve (2.36-mm) 78.6 67.2 68.4% Primary control sieve (1.18-mm) 52.3 47.8 42.4% Secondary Control Sieve (0.3-mm) 17.5 22.6 15.8% Tertiary Control Sieve (0.075-mm) 6.3 7.8 6.7
TABLE 8 Fractions of Coarse and Fine Aggregates
% Tertiary Control Sieve (0.075-mm) 6.3 7.8 6.7Coarse aggregate (CA) ratio 1.23 0.59 0.82Fine aggregate coarse (FAc) ratio 0.33 0.47 0.37Fine aggregate fine (FAf) ratio 0.36 0.35 0.42MPD (mm) 0.24 0.21-0.30/0.18-0.20 0.21-0.22
When computed in terms of fine-graded mixes, the new CA ratios areI-465: 0.27 US-27/SR-227: 0.15 SR-29: 0.13

FAc and FAf all inside the desired range (0.35-0.50) CA ratios for all mixes outside the desired range (0.30-0.45)
CA=1.23 (>1.0) on I-465: coarse aggregates no control on aggregate skeleton, difficult to compact and tendency to move under traffic application
If computed in terms of fine-graded mixes, new CA ratios still outside the desired rangeoutside the desired rangeI-465: 0.27 US-27/SR-227: 0.15 SR-29: 0.13
For 4.75-mm mixes, difficult to provide CA inside the desired range
Larger CA may create greater texture, but unbalanced coarse aggregate structure, a CA approaching 1.0 sound reasonable
Possible ways to improve friction: larger %HS, non-continuous gradation between 0.60-mm and 2.36-mm sieves
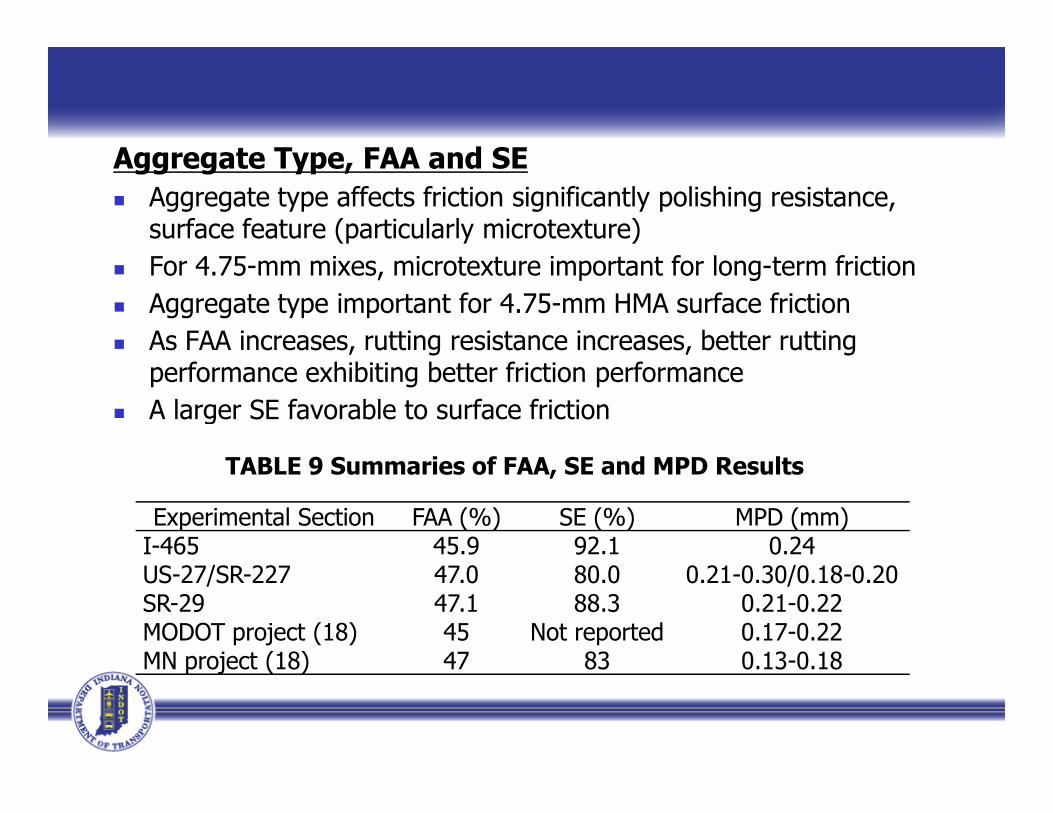
Aggregate Type, FAA and SE Aggregate type affects friction significantly polishing resistance,
surface feature (particularly microtexture) For 4.75-mm mixes, microtexture important for long-term friction Aggregate type important for 4.75-mm HMA surface friction As FAA increases, rutting resistance increases, better rutting
performance exhibiting better friction performance A larger SE favorable to surface friction
Experimental Section FAA (%) SE (%) MPD (mm)I-465 45.9 92.1 0.24US-27/SR-227 47.0 80.0 0.21-0.30/0.18-0.20SR-29 47.1 88.3 0.21-0.22MODOT project (18) 45 Not reported 0.17-0.22MN project (18) 47 83 0.13-0.18
TABLE 9 Summaries of FAA, SE and MPD Results
A larger SE favorable to surface friction

CONCLUSIONS
A fresh 4.75-mm mix may produce good surface friction. However, the friction will decrease dramatically over time. A reduction >35% can be anticipated after 12 months of service.
The greater the traffic volume the greater the friction reduction, which is sensitive to truck traffic.It takes 12-18 months for a fresh 4.75-mm mix to produce It takes 12-18 months for a fresh 4.75-mm mix to produce true surface characteristics, the true FN is around 20 and the true MPD is around 0.20-0.25mm.
Typical gradations for 4.75-mm mixes are ARZ or CRZ gradations, it becomes important for the gradation to pass below the PCS control point, particularly when the restricted zone is removed.

CA ratios for 4.75-mm mixes are commonly out of the desired range. A greater CA ratio may produce larger macrotexture, but also unbalanced coarse aggregate structure. A CA ratio approaching but less than 1.0 sounds reasonable. Increasing the % Half Sieve and providing a non continuous gradation between 0.6-mm and 2.36-mm sieves may improve surface macrotexture properties.
Larger FAA or SE leads to better friction performance For 4.75-mm mixes, realistic and effective approaches to
enhance surface friction includeUse of polishing resistant aggregatesUse of a gradation passing below PCS control pointsUse of polymer modified asphalt binders

References1) Stacy G. Williams, Nathan L. Becknell, and Kevin D. Hall (2009). “Comparison of the
Frictional Properties of 4.75 and 12.5 mm HMA Surface Mixes,” Proceedings of the Fifty-Fourth Annual Conference of Canadian Technical Asphalt Association (CTAA), Moncton, NB, November, 2009, 191-211.
2) Randy C. West, Michael A. Heitzman, David M. Rausch, and Grant Julian (2011). Laboratory Refinement and Field Validation of 4.75 mm Superpave Designed Asphalt Mixtures, Final Report, NCAT Report 11-01, National Center for Asphalt Technology, Auburn, AL 36830.
3) Shuo Li, Samy Noureldin, and Karen Zhu (2011). “Characterization of Microtextures on Typical Pavement Surfaces: A Pilot Study,” Presented at the TRB 90th Annual meeting, January 23-27, 2011, Washington D. C. January 23-27, 2011, Washington D. C.
4) Kevin K. McGhee, and Gerardo W. Flintsch (2003). High-Speed Texture Measurement of Pavements, Final Report, VTRC 03-R9, Virginia Transportation Research Council, Charlottersville, Virginia.
5) N. Mike Jackson, Bouzid Choubane, Charles Holzschuher, and Salil Gokhale (2007). “Measuring Pavement Friction Characteristics at Variable Speeds for Added Safety,” ASTM STP 1486, Pavement Surface Condition/Performance Assessment: Reliability and Relevancy of Procedures and Technologies, 59-72.
6) Judith B. Corley-Lay (1998). “Friction and Surface Texture Characterization of 14 Pavement Sections in Greenville, North Carolina,” Journal of the Transportation Research Board, TRR No. 1639, 155-161.
7) R. S. McDaniel, K. J. Kowalski, A. Shah, J. Olek, and R. J. Bernhard (2009). Long Term Performance of a Porous Friction Course, Final Report, FHWA/IN/JTRP-2009/22, Joint Transportation Research Program, 1284 Civil Engineering Building, Purdue University.

Questions and Comments
?S huo L i , P h .D ., P. E .S huo L i , P h .D ., P. E .I n d i a n a D e p a r t m e n t o f Tr a n s p o r t a t i o n1 0 0 N o r t h S e n a t e A v e .I n d i a n a p o l i s , I N 4 6 2 0 4Te l : 7 6 5 . 4 6 3 . 1 5 2 1 e x t . 2 4 7E m a i l : i n d o t . i n . g o v