
SURFACE AND SUBSURFACE WATER QUALITY … · Balochistan is the largest of the four provinces of...
17
Global NEST Journal, Vol 16, No 5, pp 938-954, 2014 Copyright© 2014 Global NEST Printed in Greece. All rights reserved Umar M., Waseem A., Kassi A.M., Farooq M., Sabir M.A. and Faridullah (2014), Surface and subsurface water quality assessment in semi-arid region: a case study from Quetta and Sorange Intermontane Valleys, Pakistan, Global NEST Journal, 16(5), 938-954. SURFACE AND SUBSURFACE WATER QUALITY ASSESSMENT IN SEMI-ARID REGION: A CASE STUDY FROM QUETTA AND SORANGE INTERMONTANE VALLEYS, PAKISTAN UMAR M. 1,2 1 Department of Earth Sciences WASEEM A. 3,* COMSATS Institute of Information Technology, Abbottabad, Pakistan KASSI A.M. 2 2 Department of Geology University of Balochistan Quetta, Pakistan FAROOQ M. 1 3 Department of Chemistry, Quid-i-Azam University, Islamabad, Pakistan SABIR M.A. 1 4 Department of Environmental Sciences FARIDULLAH 4 COMSATS Institute of Information Technology, Abbottabad, Pakistan Received: 13/02/2014 Accepted: 23/06/2014 *to whom all correspondence should be addressed: Available online: 19/11/2014 e-mail: [email protected] ABSTRACT Present investigation is an exertion to explore safe means of water for the community in the water scare region. In order to accomplish such goal origin of springs as well as chemical analyses of groundwater samples from different locations were carried out. Four zones are discovered on the basis of nature of water points, rock types and water chemistry. These zones are Hard Rocks Springs (HRS), Valley Springs (VS), Recharge Areas Aquifers (RAA) and Central Valley Aquifers (CVA). HRS are originated from thick successions of limestone (Kirthar Limestone) and thick packages of channelized sandstone and conglomerates of the Siwalik Group. It is recommended that Chiltan, Parh, Kirthar, Dhok Pathan and Soan formations may be focused for future needs of safe water supply in the Quetta valley. This study includes the analysis of different physico-chemical parameters such as Total dissolved solids (TDS), pH, turbidity, Electrical conductivity (EC), hydrochemical facies, Sodium Adsorption Ration (SAR), Sodium Percent (Na%), Kelleys Index (KI), Permeability Index (PI), major cations and anions to assess the quality of groundwater sources. The outcomes of groundwater analyses were equated with various drinking water standards e.g., NSDWQ-Pak, USEPA, and EU. The results are plotted for determination of lateral variations and to empathize the reasons of these variations. The affects of rock types, geological structures as well as anthropogenic causes on origin and results are discussed systematically. The hydrochemical facies identified show that the alkaline earth exceeds alkalies, strong acids exceeds weak acids, mixed type (no cation, anion exceeds 50%), no dominant cation and anion types but water of VS is calcium chloride and sulfate type. The water is classified as C2-S1 (HRS), C3-S1 (CVA & RAA) and C3-S2 (VS) based on SAR and EC values, which intend that most water samples can be used for irrigation safely except water samples collected from VS. Based on the Na% the water samples are categorized as excellent to good and good to permissible limits. The water is suitable for irrigation as all samples bear KI less than 1. The PI values in the water samples studied (less than 40) also contemplate that the water is desirable for irrigation use, although caution is needed of VS water. Keywords: hydrochemistry, semi-arid region, springs, Quetta, water quality. 1. Introduction Approach to safe drinking water is not only a basic need and requisite for healthy life; but a human right as well. The scarcity of water resource and its dearth normally effects in economic and health problems.
-
Upload
nguyenlien -
Category
Documents
-
view
215 -
download
0
Transcript of SURFACE AND SUBSURFACE WATER QUALITY … · Balochistan is the largest of the four provinces of...

Global NEST Journal, Vol 16, No 5, pp 938-954, 2014 Copyright© 2014 Global NEST
Printed in Greece. All rights reserved
Umar M., Waseem A., Kassi A.M., Farooq M., Sabir M.A. and Faridullah (2014), Surface and subsurface water quality assessment in semi-arid region: a case study from Quetta and Sorange Intermontane Valleys, Pakistan, Global NEST Journal, 16(5), 938-954.
SURFACE AND SUBSURFACE WATER QUALITY ASSESSMENT IN SEMI-ARID REGION: A CASE STUDY FROM QUETTA AND SORANGE INTERMONTANE
VALLEYS, PAKISTAN
UMAR M.1,2 1Department of Earth Sciences
WASEEM A.3,* COMSATS Institute of Information Technology, Abbottabad, Pakistan
KASSI A.M.2 2Department of Geology University of Balochistan Quetta, Pakistan
FAROOQ M.1 3Department of Chemistry, Quid-i-Azam University, Islamabad, Pakistan
SABIR M.A.1 4Department of Environmental Sciences
FARIDULLAH4 COMSATS Institute of Information Technology, Abbottabad, Pakistan
Received: 13/02/2014
Accepted: 23/06/2014 *to whom all correspondence should be addressed:
Available online: 19/11/2014 e-mail: [email protected]
ABSTRACT
Present investigation is an exertion to explore safe means of water for the community in the water scare region. In order to accomplish such goal origin of springs as well as chemical analyses of groundwater samples from different locations were carried out. Four zones are discovered on the basis of nature of water points, rock types and water chemistry. These zones are Hard Rocks Springs (HRS), Valley Springs (VS), Recharge Areas Aquifers (RAA) and Central Valley Aquifers (CVA). HRS are originated from thick successions of limestone (Kirthar Limestone) and thick packages of channelized sandstone and conglomerates of the Siwalik Group. It is recommended that Chiltan, Parh, Kirthar, Dhok Pathan and Soan formations may be focused for future needs of safe water supply in the Quetta valley. This study includes the analysis of different physico-chemical parameters such as Total dissolved solids (TDS), pH, turbidity, Electrical conductivity (EC), hydrochemical facies, Sodium Adsorption Ration (SAR), Sodium Percent (Na%), Kelleys Index (KI), Permeability Index (PI), major cations and anions to assess the quality of groundwater sources. The outcomes of groundwater analyses were equated with various drinking water standards e.g., NSDWQ-Pak, USEPA, and EU. The results are plotted for determination of lateral variations and to empathize the reasons of these variations. The affects of rock types, geological structures as well as anthropogenic causes on origin and results are discussed systematically. The hydrochemical facies identified show that the alkaline earth exceeds alkalies, strong acids exceeds weak acids, mixed type (no cation, anion exceeds 50%), no dominant cation and anion types but water of VS is calcium chloride and sulfate type. The water is classified as C2-S1 (HRS), C3-S1 (CVA & RAA) and C3-S2 (VS) based on SAR and EC values, which intend that most water samples can be used for irrigation safely except water samples collected from VS. Based on the Na% the water samples are categorized as excellent to good and good to permissible limits. The water is suitable for irrigation as all samples bear KI less than 1. The PI values in the water samples studied (less than 40) also contemplate that the water is desirable for irrigation use, although caution is needed of VS water.
Keywords: hydrochemistry, semi-arid region, springs, Quetta, water quality. 1. Introduction
Approach to safe drinking water is not only a basic need and requisite for healthy life; but a human right as well. The scarcity of water resource and its dearth normally effects in economic and health problems.
SURFACE AND SUBSURFACE WATER QUALITY ASSESSMENT IN SEMI-ARID REGION 939
It is estimated that water associated diseases induce an annual national income loss of Rs. 112 billion and over 250,000 children in Pakistan die every year due to diarrheal diseases alone and 20-40% of the hospital beds in Pakistan are occupied by patients suffering from water-related diseases, which are creditworthy for one third of all deaths (WWF, 2007). It is estimated that 70% of the population of Pakistan is residing in the rural areas of the country, where the chief drinking water source is groundwater. Groundwater is conceived to be safe source of water; nevertheless, some recent studies show that this reservoir is polluted with biological and chemical contaminants (Umar et al., 2013). Groundwater in rural areas is contaminated by the discharge of domestic sewage directly or indirectly into water bodies, open defecation, agricultural run-off containing fertilizers and pesticides. Most of the groundwater sources in rural setup are shallow wells which are also contaminated with the vessel for water fetch.
Balochistan is the largest of the four provinces of Pakistan, which constitutes of 44% of the entire area of Pakistan. The provincial plateau represents mostly hilly terrain. Balochistan has spacious agro-ecological diversity and is divided into four agro-climatic zones – uplands, coastal, planes and desert (PARC, 1980). In Balochistan, because of utmost aridity and deficit of perpetual sources of surface water, the groundwater has been conceived the only reliable source of water to encounter the growing demands. Historically, water has been extracted from dug wells and springs. Increased dependence on groundwater sources ensued in large scale drilling of tubewells which has played a key role in extraordinary groundwater depletion. Groundwater level declined appreciably in the valley and up to a meter per year decline has been recorded, and it is predicted that aquifer storage will be consumed in the next 20 years (PCRWR 2002). An integrated geophysical survey was conducted in year 2000-2003 in the valley to explore hard rock aquifers and Chiltan limestone was found to be a good target for future demands.
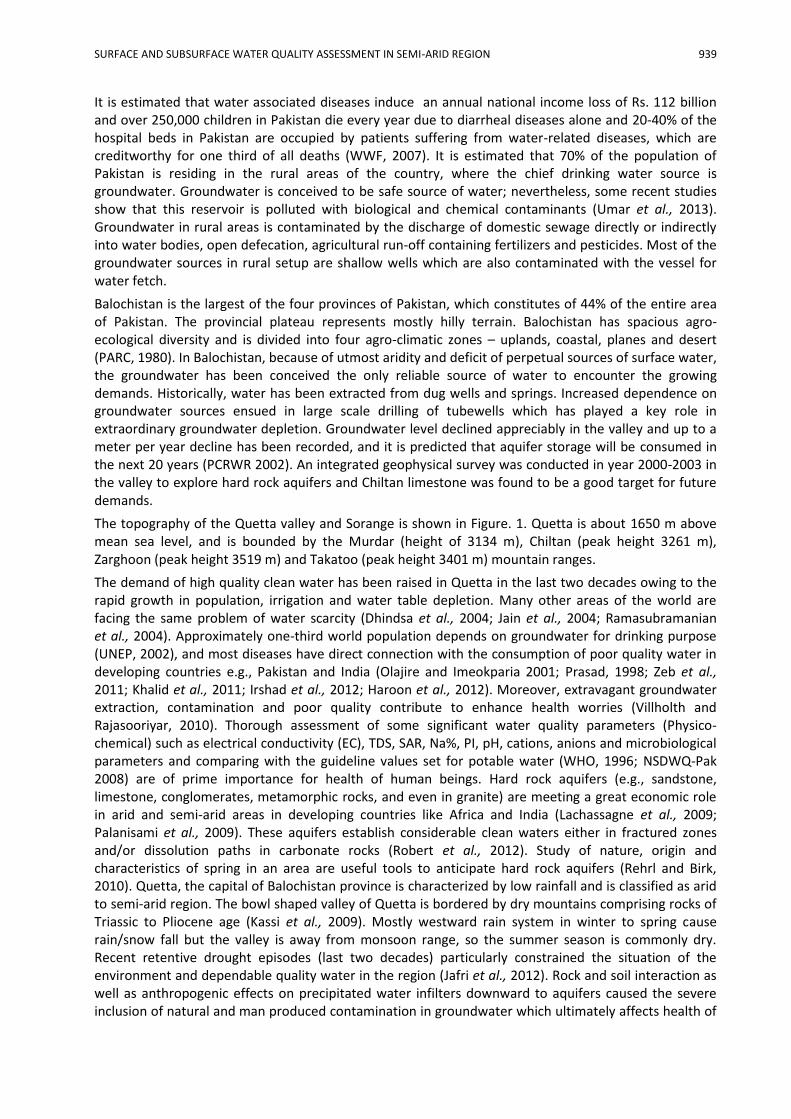
The topography of the Quetta valley and Sorange is shown in Figure. 1. Quetta is about 1650 m above mean sea level, and is bounded by the Murdar (height of 3134 m), Chiltan (peak height 3261 m), Zarghoon (peak height 3519 m) and Takatoo (peak height 3401 m) mountain ranges.
The demand of high quality clean water has been raised in Quetta in the last two decades owing to the rapid growth in population, irrigation and water table depletion. Many other areas of the world are facing the same problem of water scarcity (Dhindsa et al., 2004; Jain et al., 2004; Ramasubramanian et al., 2004). Approximately one-third world population depends on groundwater for drinking purpose (UNEP, 2002), and most diseases have direct connection with the consumption of poor quality water in developing countries e.g., Pakistan and India (Olajire and Imeokparia 2001; Prasad, 1998; Zeb et al., 2011; Khalid et al., 2011; Irshad et al., 2012; Haroon et al., 2012). Moreover, extravagant groundwater extraction, contamination and poor quality contribute to enhance health worries (Villholth and Rajasooriyar, 2010). Thorough assessment of some significant water quality parameters (Physico-chemical) such as electrical conductivity (EC), TDS, SAR, Na%, PI, pH, cations, anions and microbiological parameters and comparing with the guideline values set for potable water (WHO, 1996; NSDWQ-Pak 2008) are of prime importance for health of human beings. Hard rock aquifers (e.g., sandstone, limestone, conglomerates, metamorphic rocks, and even in granite) are meeting a great economic role in arid and semi-arid areas in developing countries like Africa and India (Lachassagne et al., 2009; Palanisami et al., 2009). These aquifers establish considerable clean waters either in fractured zones and/or dissolution paths in carbonate rocks (Robert et al., 2012). Study of nature, origin and characteristics of spring in an area are useful tools to anticipate hard rock aquifers (Rehrl and Birk, 2010). Quetta, the capital of Balochistan province is characterized by low rainfall and is classified as arid to semi-arid region. The bowl shaped valley of Quetta is bordered by dry mountains comprising rocks of Triassic to Pliocene age (Kassi et al., 2009). Mostly westward rain system in winter to spring cause rain/snow fall but the valley is away from monsoon range, so the summer season is commonly dry. Recent retentive drought episodes (last two decades) particularly constrained the situation of the environment and dependable quality water in the region (Jafri et al., 2012). Rock and soil interaction as well as anthropogenic effects on precipitated water infilters downward to aquifers caused the severe inclusion of natural and man produced contamination in groundwater which ultimately affects health of

940 UMAR et al.
humans. Government and the private sector carried research on different aspects of water resources of the valley, including hydrochemistry and groundwater quality (Khan et al., 2009; 2010), but to explore various resources with better quality water is still severely required. The present study is an effort to seek means for safe water for the local population.
Figure 1. Map depicts topography and location of Quetta and Sorange valleys Source: http://www.lib.utexas.edu/maps/jog/pakistan/txu-oclc-224096150-nh42-5.jpg
2. Materials and Methods
2.1 Water Sampling and Chemical Analysis
All reagents used were of analytical grade and ultra high purity deionized water was used in all experiments. Water samples were collected from the scattered locations from sampling sites i.e., 8 springs and 60 deep tubewells (Figure. 2). Water samples (1500 mL each) were collected manually using acid-washed (10%, v/v HCl) HDPE bottles. Water samples from deep tube wells were collected after 30 mins of the water running process. The pre-washed bottles were rinsed thrice with water samples on the site before sample collection. Water samples were stored and sent to the laboratory for analysis. Temperature, pH and EC were measured onsite using portable meter (Hanna, USA) and for turbidity (Lovibond, Dortmund, Germany) were used. Chemical oxygen demand (COD) concentration, an ion analysis was performed using Standard methods for water and wastewater treatment (APHA 2005). For metal ion analysis, atomic absorption method was used using Perkin-Elmer spectrometer (AAnalyst 700). Sampling was always done in clear weather condition to prevent any abrupt changes in measurements to avoid unsteady conditions.

SURFACE AND SUBSURFACE WATER QUALITY ASSESSMENT IN SEMI-ARID REGION 941
Figure 2. Geological and location map of water samples points; different zones RAA, HRS, RAA, CVA and VS etc are indicated for comparison.
3. General Results
Rapid population growth (0.2 to 2.5 million in last 35 years (Khan et al., 2010) in Quetta particularly due to the massive migration of Afghan refugees in early eighties and rural areas of Balochistan province have badly increased the requirement of safe water for domestic as well as for the irrigation purposes. Intimately 24 meters water table fall has been recorded in the Quetta valley during the last 30 years by Water and Sanitation Authority. The chemical quality appraisal of such water bodies may widely excogitate the anthropogenic pressure on water systems (Umar et al., 2013). This study includes the analysis of different physico-chemical parameters such as TDS, pH, turbidity, EC, SAR, KI, Na%, PI, Na, K, Ca, Mg, As, B, Fe, Cu, Mn, Zn, Pb, HCO3
-, Cl-, SO42-, NO3
- and PO43- to evaluate the quality of groundwater
sources. The results of groundwater analyses were compared with various drinking water standards e.g., NSDWQ-Pak, USEPA, and EU (Radojevic and Bashkin, 2010). The results are plotted for determination of lateral variations and to interpret the reasons of these variations. Water samples from tubewells and springs were collected from different locations of Quetta and Sorange valleys. Four zones are identified on the basis of nature of water points, rock types and water chemistry and named here as Hard Rock Springs (HRS), Valley Springs (VS), Recharge Areas Aquifers (RAA) and Central Valley aquifers (CVA) (Figure 2). The impacts of rock types, geological structures as well as anthropogenic causes on origin and consequences are discussed systematically.
3.1 Hydrogeology of the area
Rock units of the Sorange and Quetta valleys comprise from Jurassic Chiltan Limestone to Soan formation of Pleistocene age. The hydrogeologic attributes e.g., porosity and permeability of limestone, sandstone and conglomerate beds of Eocene-Pliocene strata are more significant. Lithology and hydrologic characteristics of all rock units exposed in the area are presented in Table 1.

942 UMAR et al.
Table 1. Stratigraphy of the study area (modified)
Age Group/ Formation Lithology Hydrolgeologic characteristics
Holocene Recent-Subrecent Mixture of clay, sand and
gravel.
Porous and permeable, bears groundwater as unconfined aquifers
Unconformity
Miocene-Pliocene Siwalik Group Sandstone, conglomerate with interbedded shale.
Porous and permeable, fractured and bear
intergranular porosity
Unconformity
Eocene Kirthar Formation
Fossilifereous limestone interbedded with shale and
marl.
Fractured and faulted bear secondary porosity
Ghazij Formation Dominantly shale with minor
sandstone No porosity / NA
Paleocene Dungan Formation Limestone dominant and
contain shale in basal part. Not investigated
Late Cretaceous Pab Formation Sandstone intercalated with
marl and mudstone
Thin and may not capable for groundwater in the
study area
Late Cretaceous Fortmunru Formation
Marl, arenaceous limestone, mudstone and sandstone.
Not investigated
Unconformity
Late Cretaceous Hanna Lake Limestone
Grey dull limestone. Not investigated
Unconformity
Early – Late Cretaceous
Parh Group
Biomicritc limestone, Micritic limestone with shale,
siltstone and sandstone, Shale, siltstone and marl.
Limestone rich part is fractured and porous
Disconformity
Middle Jurassic Chiltan Limestone Micritic and oolitic limestone Thick limestone jointed
and bear secondary porosity
Keeping in mind the dearth of water in the realm, it is necessitated to dig into new aquifers beside the subsisting groundwater resources on account of increase in water usage in domestic and agricultural activities. Therefore this work is chiefly established to consider some springs and water seepage sites, which observed in hard rocks such as limestone, sandstone and conglomerates and are of prime importance in order to anticipate water rich zones within these rocks (Figure 2). Furthermore, these small but crucial water sources (springs) are useful to empathize the effects of lithostratigraphic units and geological structures on their origin as well as to extrapolate the groundwater resources within hard rock’s of the area. This approach is enormously crucial to discover the aquifers in hard rock in recently populated valley. Springs in Kirthar, Dhok Pathan and Soan formations (Figure. 2, 3A & B) exhibit their porous and permeable nature. A spring within limestone of the Kirthar Formation has been used long for domestic water supply by nearby small villages. The formation contains cream to light grey color, highly fossilifereous limestone and is transitionally rests over impervious shale of the Ghazij Formation. The limestone is highly jointed, fractured and faulted (Figure 4A) as well as endures dissolution cavities. These characters are indicative of adequate secondary porosity of the limestone due to which springs appeared in it. The discharge of the spring has direct relation seasonal recharge conditions. The authors

SURFACE AND SUBSURFACE WATER QUALITY ASSESSMENT IN SEMI-ARID REGION 943
observed that precipitation rate increases the discharge of this spring, whereas, a dry season only brings small discharge.
Figure 3. A and B geological cross sections along line A-B and C-D (see Figure 1 for location)
Sandstone and conglomerate thick packages of Dhok Pathan and Soan formations (4000m thick) bear an appreciable water seepage and springs which are in use of local populations. Highly fractured sandstone (Figure 4B) and conglomerates of Moicene-Pliocene ages have not been subjected to severe diagenesis which commonly reduces primary porosity of rocks by means of compaction and cementation.
Figure 4. (A) Field photograph showing an imbricated faults zone within Kirthar Limestone (B) Field photograph of highly jointed/fractured sandstone strata in Dhok Pathan Formation created
secondary porosity.
These formations are commonly overlies the older strata. During the field work we observed that sufficient water rushed out when mining for coal seam was in progress. The conglomerate of Ghazij

944 UMAR et al.
formation within a mine bears plenty water under confined conditions. The water found was highly turbid and cannot be used for drinking and irrigation. But it confirmed that the conglomerate has high secondary porosity. Chiltan Limestone is very thick stratified, hard, brittle, highly jointed limestone which is also capable to produce cavities by dissolution. Similarly, Parh limestone is softer, thin bedded, light grey, cream and white colored, thin bedded and severely fractured limestone.
NW-SE trending Sorange valley is characterized by some spectacular structural features such as Sorange Anticline (SA), Zharai Syncline (ZS) and an imbrication zone of small strike slip faults (Figures 2, 3A, B & 4A). SA is asymmetrical, open plunging anticline and its plunge at 160 WNW. ZS is asymmetrical, gentle, plunging syncline and it plunges at 20-250 SSE. The vivid folding and faulting weakens the rocks forming large, small, regular, close and open joints which induced fractures in respective rock units such as limestone (Kirthar Formation), sandstone and conglomerate (Dhok Pathan and Soan formations) which developed a secondary porosity in these rocks. On the other hand imbricated zone of strike slip faults near Maidadzai serve as a passage way for precipitation water into limestone of the Kirthar Formation.
3.2 Chemical Analyses of groundwater
The rapid economic growth, human settlements and industrial development in both urban and rural areas have produced terrible pollution masses in inland surface water bodies. A water quality feature of aquatic environment originates from a multitude of physical, chemical and biological interactions. During the present study various physico-chemical parameters such as TDS, pH, turbidity, EC, SAR, Na%, PI, KI, Na, K, Ca, Mg, As, B, Fe, Cu, Mn, Zn, Pb, HCO3
-, Cl-, SO42-, NO3
- and PO43- were examined and posed
as average values (Figures. 5–9; Table-2). The values were compared with NSDWQ-Pak, USEPA, and EU (Radojevic and Bashkin, 2010) for drinking and irrigation waters.
Figure 5. Histograms of TDS and EC concentrations of groundwater and springs for comparison of their quality
The measurement of EC is direct related to the concentration of different ions exist in water. EC measured at 25 °C ranges between 675.07–1650 µS cm-1, least for HRS zone to the highest VS zone respectively. There is no rule of thumb of NSDWQ for EC in drinking water, however, US irrigation water quality guideline conceives the EC of <700 µS cm-1 to be the safe, beyond this value slight to moderate confinement has been inflicted for use in agriculture. Figure 5 depicts that zone HRS and RAA has lower average conductivity than two other zones. Highest values of EC in VS may be owing to mining activities for coal exploration.
As inorganic salts of alkali metals (Na, K), alkaline earth metals (Ca, Mg), anions (HCO3-, Cl-, SO4
2-, NO3-,
PO43-) and iron principally comprise dissolved solids in naturally occurring waters, so the appraisal of

SURFACE AND SUBSURFACE WATER QUALITY ASSESSMENT IN SEMI-ARID REGION 945
TDS, dependant hydrochemical attributes of water turns significant for its degree of aptness for all virtual intentions (Alam et al., 2011; Pant, 2011). TDS examined for samples collected ranges from 442.61 to 1105 mg l-1. HRS and RAA zones depict relatively lower TDS values than VS and CVA zones. According to the USA irrigation water quality specification, TDS less than 450 mg l-1 is desirable, whereas NSDWQ-Pak sets 1000 mg l-1 to be the upper limit for TDS for drinking water quality. Figure 5 expresses the TDS values for VS is over the upper limit set by NSDWQ-Pak, whereas the samples of HRS, CVA and RAA zones are such limit.
Figure 6. Major cations concentrations within water samples in study area
Pot-ability of water for drinking and irrigation use, cations like Na, K, Ca and Mg were also analyzed. Average values of analyzed cations in groundwater of all zones have been presented in Figure 6 and Table 2. There are no guidelines value exists for these metal ions in NSDWQ, WHO or the USA in drinking water quality; nevertheless the higher concentration of these ions can induce health troubles. Carbonates, sulfates, and chlorides of calcium and magnesium make the water hard which preclude its long term use as a drinking purpose and in industrial processes. The long term use of water with higher sodium content can engender heart concerned problems and its use in agriculture is also leads to more eminent sodicity of the soil. Sodium content of groundwater is varying from 50.5–241.5 mg l-1 being lowest for HRS to higher contents for VS respectively. The EU drinking water standards sets sodium as an indicant parameter of 200 mg l-1. Sodium introduced in aquifers by reactions of saline rich sediments-soils with precipitation water. Magnesium is highly soluble in water and thus is dissolved from dolomite and dolomitic limestone exposed in recharge area. Magnesium in groundwater samples ranges from 28 to 86.19 mg l-1. Less abundant potassium may the result of K-feldspar.
Among anions (HCO3–, Cl–, NO3
–, SO42–, PO4
3–) tested (Figure 7), sulfate and chloride are predominant. While HCO3
– is the most dominant in CVA and least in VS. Carbonates such as limestone, dolomite and calcite were dissolved to form bicarbonates by the action of CO2 on these basic materials and is regarded as the major cause of alkalinity, whereas, sulfate and chloride were sourced from weathering and dissolution of gypsum and saline soil-sediments (Ritzi et al., 1993) respectively. NSDWQ provides no guideline values for sulfate, bicarbonate, and phosphate, whereas chloride and nitrate <250 mg l-1 and <50 mg l-1 respectively are acceptable. Nitrate is significant component in water and its higher quantity negatively affects the human health. Figure 7 designates the average values of these ions in HRS & RAA zones and are well below the guideline values set by NSDWQ and EU drinking water standards, however, US irrigation water quality guideline consider the chloride content of <140 mg l-1, total nitrogen of <5 mg l-1, and bicarbonate of <90 mg l-1 to be the safe, beyond this value slight to moderate restriction has been imposed for use in agriculture.

Table-2. Average chemical composition of groundwater and springs in the study area.
Parameters (units)
Locations
HRS = 5 VS = 3 CVA = 250 RAA = 225
Mean Min Max SD Mean Min Max SD Mean Min Max SD Mean Min Max SD
Ca2+ (mg l-1) 35.50 32.6 46.1 2.7 242.42 228.7 254.2 8.76 150.5 140.7 174.3 9.3 51.65 42.7 72.3 10.7
Mg2+ (mg l-1) 32.15 28.6 41.9 2.25 50 43.27 76.2 9.18 86.1 56.4 98.2 10.9 28 17.5 49.2 12.5
Na1+ (mg l-1) 50.5 33.6 53.72 3.26 241.5 231.8 267.81 10.42 120.5 89.3 132.4 12.53 51.6 43.16 73.9 11.39
K1+ (mg l-1) 3.50 1.17 4.8 2.29 2.73 2.17 2.93 0.39 2.03 1.79 3.7 0.95 3.20 2.9 7.6 2.07
HCO31- (mg l-1) 79 73.28 92.15 5.18 53 46.2 63.7 8.81 328 319.1 367.5 14.8 170 183.7 142.5 16.8
Cl1- (mg l-1) 59.00 52.11 68.61 6.76 290 285.04 316.8 12.41 156 167.9 139.5 10.16 72.72 47.2 83.7 13.2
CO32- (mg l-1) 2.3 1.6 2.9 1.68 3.5 2.6 4.5 1.27 4.6 3.2 6.4 1.6 6.2 3.3 9.2 2.1
SO42- (mg l-1) 120 102.7 147.9 10.63 670 647.3 683.2 13.95 333 323.8 364.1 10.5 152 143.5 182.4 7.26
NO31- (mg l-1) 3.50 2.95 6.02 1.53 31 28.5 41.8 4.17 18 10.1 24.8 5.9 6 5.6 9.57 1.6
PO44- (µg l-1) 245 226.4 278.9 9.16 550 539.2 583.2 10.21 450 422.5 471.3 13.1 113 117.8 136.2 7.87
pH 7.60 6.8 8.2 0.56 6.3 6.2 7.5 1.1 8.10 7.86 8.3 0.34 7.50 7.1 8.08 0.42
TDS (mg l-1) 442.61 425.4 971.29 24.92 1105 1087 1247 21.36 820.05 792.9 1176.7 21.91 568.72 419.39 766 21.5
EC (µS cm-1) 675.07 635 1094 23.3 1650 1638 1779 20.1 1223.96 1164.3 1467.04 20.1 848.83 577.5 1143.6 24.8
Turbidity (NTU) 1.5 1.3 3.4 1.05 8 6.5 9.1 1.33 6.00 5.2 11.4 2.23 2.50 1.5 4.7 1.34
As (µg l-1) 2.50 1.94 4.7 1.38 60 54.7 67.1 4.26 52.00 47.9 59.4 4.5 3.50 2.3 6.7 1.86
Mn (µg l-1) 230 174 243 11.5 450 438.2 462.8 10.3 350 327.3 359.7 9.02 250 219.8 283.4 7.14
Pb (µg l-1) 3 2.1 4.72 1.34 26 23.5 32.8 4.57 14 11.2 18.5 2.95 6 4.89 11.2 2.34
Cr (µg l-1) 9 7.2 10.42 1.65 120 118.4 131.6 6.7 45 41.2 57.5 6.32 23 14.6 31.5 5.95
Fe (mg l-1) 0.3 0.18 2.5 0.51 2.2 1.8 3.1 0.65 1.50 1.1 3.4 0.96 0.80 0.54 2.8 0.88
Cu (mg l-1) 0.1 0.06 1.65 0.88 0.8 0.5 1.7 0.6 0.50 0.17 1.86 0.69 0.20 0.15 1.9 0.65
Zn (mg l-1) 0.4 0.27 1.92 0.82 1.5 1.2 2.5 0.65 1.10 1.3 3.94 1.13 0.70 0.4 2.9 1.08
B (mg l-1) 0.1 0.05 0.4 0.18 0.5 0.7 1.8 0.58 0.40 0.28 4.2 1.64 0.10 0.13 1.6 0.57
SAR 2.07 1.25 6.68 1.71 5.21 4.83 12.31 5.3 2.73 1.05 7.65 2.5 2.02 2.03 8.6 2.75
Na (%) 32.54 28.3 39.5 4.71 39.1 26.5 42.8 6.59 26.1 20.6 38.3 5.92 30.9 22.7 32.9 4.8
PI 19.2 15.3 28.6 5.72 13.93 13.4 23.6 4.22 16.8 15.3 31.9 6.49 25.4 20.5 32.03 4.94
KI 0.49 0.32 0.73 0.2 0.64 0.5 1.1 0.32 0.35 0.36 0.9 0.19 0.45 0.21 0.87 0.32

SURFACE AND SUBSURFACE WATER QUALITY ASSESSMENT IN SEMI-ARID REGION 947
Figure 7. Concentration of major anions
Heavy metal contamination in groundwater resulted from addition of different minerals because of rock weathering, discharge of waste effluents and attains importance due to their toxic as well as accumulative nature. The growing awareness about the health risks related with chemicals has brought a major shift in global concern towards prevention of heavy metal accumulation in the soil, water and vegetables. The relationship between the trace element concentration in soil and plants may not be a strong, but it always exists between their concentrations in irrigational water and plants (Ahmad and Goni, 2009; Sharma et al., 2007). Thus, the heavy metal deposition in natural waters can raise the human consumption through the food chain as well as through drinking water. Figure 8 & 9 illustrates heavy metal distribution in the studied area. Manganese, copper, zinc and boron are essential trace elements for human beings; their desirable limits in water are set by NSDWQ as 0.5, 2.0, 5.0 & 0.3 mg l-1 respectively. Figure 8 & 9 shows that the concentration of these elements in the present study, which were found below these set standards except for boron in CVA and VS zones.
Figure 8. Arsenic, manganese, lead and chromium concentrations

948 UMAR et al.
Figure 9. Fe, Cu, Zn and B concentrations in water samples
Arsenic and lead are the most studied element and lot of information is present on its toxicity. Arsenic contamination is considered to be a universal issue due to its toxicity and widespread availability in water sources. Arsenic contamination in groundwater resources is detected in many countries including Asian countries like Bangladesh, India, Nepal, Myanmar, and Pakistan. The tentative guidelines of 0.01 mg l−1 set by WHO has been adopted by number of countries as the standard for drinking water. However, many countries including Pakistan have retained the earlier WHO guideline of 0.05 mg l−1 as the national standard or as a provisional target. Groundwater of VS and CVA show values of 60 & 52 µg l-1, which is higher than NSDWQ; nevertheless, the groundwater of HRS and RAA expresses a negligible amount of arsenic (Figure 8). Lead has been established to cause neurological disorders, reproductive problems, and diminished intelligence. The guideline value of lead in water should be less than 0.05 mg l-1 as set by NSDWQ which is higher than those set by WHO & EU of 0.01 mg l-1. Figure 8 indicates that in all zones, lead is under the permissible limits of NSDWQ.
The presence of iron in water contributes scaling of containers, an irritating inky odour, discoloration of clothes and it is chiefly sourced from rock weathering and discharge of waste effluents. There is no set guideline for iron in drinking water by NSDWQ, however, 0.2 mg l-1 is set by EU drinking water directives. The value of iron varies from 0.3 to 2.2 mg l-1 for HRS & VS zones respectively. All four zones show higher iron content than 0.2 mg l-1 set by EU drinking water directives. 4. Discussion
Majority of the aquifers in recharge (RAA) and central valley (CVA) areas are unconfined in nature characterizing by Holocene porous and permeable clean sand and gravels. These sediments preserve primary porosity. Different chemical constituents present in groundwater were sourced from the soil and unconsolidated rocks through which precipitated water percolated toward the zone of saturation. Miocene-Pliocene Siwalik Group (Dhok Pathan and Soan formations in particular) is characterized by sandstone, conglomerate and fines holding primary as well as secondary porosities. The conglomerates exhibit grain and matrix supported. The void spaces among framework grains were filled with medium to very coarse grained sand. Such texture in conglomerates contains primary porosity because the filled sand contains intergranular pore spaces. The porosity further elicited in sandstone beds owing to fracturing and jointing induced by intense folding and faulting in the region linked to Main Himalayan Orogeny (Umar et al., 2014 a; b). The ancient rock units for instance Kirthar, Parh and Chiltan (Table-1) formation have been underwent pre and post Siwalik tectonic episodes. Therefore secondary porosity were created in the form of joints and played significant role as conduit for rain water. The interaction of these rocks during percolation of rain water is reflected in chemistry of spring waters, for instance the concentration of TDS, EC and other constituents are rather low as equated to RAA and CVA. But the

SURFACE AND SUBSURFACE WATER QUALITY ASSESSMENT IN SEMI-ARID REGION 949
water of valley spring (VS) is highly polluted with calcium, sodium, chloride, sulphate and phosphate etc (Table-2) and depict diverse consequence on the crops as well as unsuitable for drinking. Another horrifying situation can be faced by the local community in near future is the deterioration of water quality in CVA and RAA due to depletion of water level as well as anthropogeic activities like abandonment of natural drainage, increasing population and lacking proper sewage system in the Quetta Valley.
These chemical results demonstrate interesting and significant natural and anthropogenic anomalies in the study area. The outcomes alert the local community in near future to face the deficit of dependable water supply for domestic and agriculture purposes and ultimately influence the economy of the society. High concentration of cations, anions and other chemical components (Figures 6, 7) in waters of valley springs (VS) and Central valley (CVA) were caused due to saline rich soil and alluvium. For instance, the water of valley spring near Pakistan Mineral Development Corporation (PMDC) is likely polluted by number of constituents. The spring emerges from alluvium and sandstone thin beds of the coal rich Ghazij Formation. The formation contains 15.9-18.7% moisture contents, 33.5-39.6% volatiles, 36.42% fixed carbon, 3.0-13.0% ash and 0.5-5.6% sulfur, which is common harmful impurity in the coal. Sulfate-bearing water originates from the dissolution of sulfate minerals, oxidation of sulfides and organic sulfur (Lewicka-Szczebak et al., 2008). Poor vegetation near valley springs has also been discovered and it may be probably because of the high contents of sulfate, chloride and sodium. On the other hand, water of springs in limestone and sandstone (HRS) within the same valley (Figures 2; 3A, B) are characterized by excellent quality water. This notion highlights further influence of rocks on the groundwater quality. So the presented results were owing to the natural causes (water-rock interaction) and there is no industrial, agricultural or anthropogenic affects. This fact can be depicted by higher values of standard deviation of TDS and EC which exhibit considerable contrast (Table-2) of water points. Rather scattered standard deviation values of these constituents were induced by variations of geology for instance low TDS and EC were recorded in springs emerged through sandstone but values are high in case of limestone springs.
Figure 10. Hydrochemical facies of water samples plotted in Piper Trilinear diagram

950 UMAR et al.
The hydrochemical facies identified in this study using piper plot (Piper, 1953) (Figure. 10) are given as under:
1. Alkaline earth (Ca+Mg) exceed alkalies (Na+K).
4. Strong acids exceed weak acids.
6. Only water collected from VS is of Calcium chloride type.
9. Mixed type (no cation-anion exceeds 50%) except VS.
B. No dominant type of anions and cations except VS
F. Water of VS is categorized as sulfate type.
Figure 11. Sodium percent and EC diagram of water samples of four zones and their suitability for irrigation purpose
For domestic and agriculture water demands the groundwater has crucial role (Voudouris et al., 2005) and to overcome these issues different studies have been carried out by the number of authors (e.g., Kontis and Gaganis, 2012; Mattas et al., 2007). The indices such as Permeability Index (PI; Doneen, 1964), Na% (Wilcox, 1955) and SAR (Richard, 1954) are calculated to investigate the suitableness of water for irrigation and drinking uses. High sodium concentration in irrigation water dispersed calcium and magnesium ions on account of absorption of sodium ion by clay minerals and thus reduces the permeability of the soil and ultimately caused poor internal drainage (Tiri and Boudoukha, 2010). Sodium percent of water samples ranges from 26.17 to 39.1 and lies in a good category. The diagram of sodium percent-EC (Figure 11) designates that HRS water is excellent to good and water of other points (like CVA, VS & RAA) are good to permissible.
Sodium Adsorption Ratio can be computed by using the following formula (Hem, 1985):
SA Na
√Ca2 Mg2
2

SURFACE AND SUBSURFACE WATER QUALITY ASSESSMENT IN SEMI-ARID REGION 951
Where the ion concentrations are expressed in milliequivalents per liter. Average values of SAR are ranging from 2.02 (RAA) to 5.21 (VS). Plots such as salinity-alkalinity hazards and sodium percent-EC (Richard, 1954 and Wilcox, 1955) the water is classified as C2-S1, C3-S1, C3-S2 and excellent to good, good to permissible (Figure 11 & 12) for irrigation use. The water samples taken from Valley Springs may be used after careful selection of crops and soil conditions.
Sodium percent is one of the criteria used for irrigation of water and is expressed as:
Sodium% (Na%) =Na+ + K+ × 100/Ca2+ + Mg2+ + Na+ + K+
Where, all ionic concentrations are expressed in milliequivalents per liter. Mean Na% of the water samples ranges from 26.17 to 39.1 and is categorized as good for irrigation use. The diagram of Na% and EC signals that the water falls in excellent to good and good to permissible limits (Figure 11). The permeability Index is expressed (Doneen, 1964) below is a measure of soil permeability for evaluating its usage for irrigation.
Figure 12. SAR-EC Plot of water samples and their suitability for irrigation use
Na √ C
Ca Mg Na 100
The mean values of water samples of the studied area lies up to 25.45, well below 75 and is categorized as class-I, which is suitable for irrigation.
Another way to evaluate the suitability of water for irrigation use is Kelly,s Index (Kelly 1940, and Paliwal, 1967) which can be calculated as:
KI =Na+/(Ca2++ Mg2+)
Where, all ionic concentrations are expressed in milliequivalents per liter. KI of water samples ranges from 0.35 to 0.64 and is conceived suitable for irrigation use. In General based on the above interpretation of various parameters, most water samples studied are suitable for irrigation except VS water, where care should be taken during the selection of crops which are sensitive to alkalinity or sodium hazards.

952 UMAR et al.
5. Conclusions Keeping the objective to supply the safe water to the community, geological and anthropogenic factors are discussed. It is encountered that water of springs in limestone and sandstone (HRS) are safe for different uses. So it is suggested that more detail research investigations should be imparted on a broad level to explore groundwater in hard rock exposed around the valley. Chiiltan, Parh, Dungan and Kirthar formations in the region could be better hard rock aquifers because of secondary fracturing, week zones along bedding planed and dissolution of cavities in limestone. Sandstone of Siwalk Group exposed in the eastern part of the study area (Fig. 2) is suggested here as excellent aquifers with better quality waters. Thick sandstone and conglomerate channels may yield water as indicated by water springs and seepage in various parts of the study area. It is needed to explore major aquifers either by geological or geophysical methods.
Chemical analyses of water samples collected are compared with different standard parameters for its suitability for drinking and irrigation uses. TDS, EC, SAR, Na% and PI calculations manifested that most of the water is safe for irrigation but care is suggested for using VS water. Various classes defined on the basis of SAR-EC plot are C2-S1, C3-S1 and C3-S2 (VS). These values lie under usable limits for irrigation except VS water. Water is categorized as excellent to good and good to permissible limits for irrigation based on Na% values. Both KI and PI also attest most of the water points are under usable limits for irrigation. The identified hydrochemical facies are 1, 4, 6, 9, B and F. Which reflect that alkaline earth exceeds alkalies, strong acids exceeds weak acids, mixed type (no cation, anion exceeds 50%), no dominant cation, anion types but water of VS is calcium chloride and sulfate type. This study suggests the need of scientific research in hard rocks exposed in the area e.g., Chiltan, Parh, Dungan, Dhok Pathan and Soan formations to overcome the future demand of water. Furthermore, modern sewage system is needed to reduce the anthropogenic affects peculiarly in the central part of Quetta city which is extremely populated. References Ahmad J.U. and Goni M.A. (2009), Heavy metal contamination in water, soil and vegetables of the industrial areas
in Dhaka, Bangladesh, Environmental Monitoring and Assessment, 166, 347-357.
Alam M., Rais S. and Aslam M. (2011), Hydrochemical investigation and quality assessment of groundwater in rural areas of Delhi, India, Environmental Earth Sciences, 66, 97-110.
APHA (2005), Standard methods for the examination of water and wastewater analysis, (21st
ed.).
Dhindsa S.S., Bheel P. and Musturia Y. (2004), Hydrochemical study of ground water quality variation in Tonk District, Rajasthan, Indian Journal of Environment and Ecoplanning, 8(1), 129-136.
Doneen L.D. (1964), Notes on water quality in agriculture. Published as a Water Science and Engineering Paper 4001, Department of Water Science and Engineering, University of California.
Haroon H., Waseem A. and Mahmood Q. (2012), Treatment and reuse of wastewater from beverage industry,
Journal of The Chemical Society of Pakistan, 35, 5-10.
Hem J.D. (1985), Study and interpretation of the chemical characteristics of natural water. USGS Water Supply Paper, 2254, 117-120.
Irshad M., Anwar Z., Faridullah Pervez A. and Waseem A. (2012), Water use efficiency and accumulation of trace elements in spinach (Spinacia oleracea L.) irrigated with municipal wastewater, Journal of Medicinal Plants Research, 6(22), 3882-3888.
Jafri Y.Z., Sami M., Waseem A., Murtaza G. and Akbar S. (2012), Stochastic approaches for time series forecasting of
rate of dust fall: a case study of North West of Balochistan, Pakistan, International Journal of Physical Sciences, 7(4), 676-686.
Jain C.K., Kumar S. and Rao Y.R.S. (2004), Trace element contamination in a coastal aquifer of Andhra Pradesh, Pollution Research, 23(1), 13-23.
Kassi A.M., Kelling G., Kassi A.K., Umar M. and Khan A.S. (2009), Contrasting Late Cretaceous-Palaeocene lithostratigraphic successions across the Bibai Thrust, western Sulaiman Thrust Belt, Pakistan: their

SURFACE AND SUBSURFACE WATER QUALITY ASSESSMENT IN SEMI-ARID REGION 953
significance in deciphering the early-collisional history of the NW Indian Plate margin, Journal of Asian Earth Sciences, 35, 435-444.
Kelley W.P, Permissible composition and concentration of irrigation waters, Proc. ASCE, 1940, 66, 607.
Khalid A., Malik A.H., Waseem A., Zahra S. and Murtaza G. (2011), Qualitative and quantitative analysis of drinking water samples of different localities in District Abbottabad, Pakistan, International Journal of Physical Sciences, 6(33), 7480-7489.
Khan S., Khan A.S., Sultan M. and Mehmood K. 2010, Urbanization effects on water resources in Quetta valley Pakistan. 2010 GSA Denver Annual Meeting (31 October –3 November 2010), paper No. 254-3.
Khan S.D., Xiong Y., Mahmood K., Khan A.S. and Sultan M. (2009), Groundwater contamination with arsenic, Selenium and other trace elements in Quetta Valley, Pakistan, American Geophysical Union, Fall Meeting 2009, abstract #NH43B-1327.
Kontis E.E. and Gaganis P. (2012), Hydrochemical characteristics and groundwater quality in the Island of Lesvos, Greece, Global NEST Journal, 14(4), 422-430.
Lachassagne P., Ahmed Sh., Dewandel B., Courtois N., Maréchal J.C., errin, J. and Wyns R. (2009), Recent improvements in the conceptual model of hard rock aquifers and its application to the survey, management, modelling and protection of groundwater (Conference Paper). IAHS-AISH Publication, 334, pp, 250-256. Groundwater and Climate in Africa Conference; Kampala; 24-28 June 2008; Code 83574.
Lewicka-Szczebak D., Trojanowska A., Gorka M. and Jedrysek M. (2008), Sulphur isotope mass balance of dissolved sulphate ion in a freshwater dam reservoir, Environmental Chemistry Letters, 6, 169-173.
Mattas C., Soulios G., Panagopoulos A., Voudouris K. and Panoras A. (2007), Hydrochemical characteristics of the Gallikos River water, prefectureof Kilkis, Greece. Global NEST Journal, 9(3), 251-258.
NSDWQ-Pak, (2008), 'National Standards for Drinking Water Quality', Health Services Academy, Ministry of Health, Government of Pakistan.
Olajire A.A. and Imeokparia F.E. (2001), Water quality assessment of Osun River: Studies on inorganic nutrients, Environmental Monitoring Assessment, 69(1), 17-28.
Palanisami K., Umetsu C. and Ranganathan C.R. (2009), Why farmers still invest in wells in hard-rock regions when the water-table is fast declining? International Conference on Hydrological Changes and Management from Headwaters to the Ocean, HYDROCHANGE 2008; Kyoto; 1-3 October 2008; Code 83667, pp, 503-508.
Paliwal K.V. (1967), Effect of Gypsum Application on the Quality of Irrigation Waters, Madras Agricultural Journal, 54, 646-647.
Pant B.J. (2011), Groundwater quality in the Kathmandu valley of Nepal, Environmental Monitoring and Assessment, 178, 477-485.
PARC, 1980. Agro-ecological Zones of Pakistan. Pakistan Agriculture Research Council, Islamabad.
PCRWR (2002), Water quality status in Pakistan, 1st
report 2001-2002, Pakistan Council of Research in Water Resources.
Piper A.M. (1995), A graphic procedure I the geo-chemical interpretation of water analysis, USGS Groundwater Note no, 12.
Prasad R. (1998), Fertilizer urea, food security, health and the environments, Current Science, 75, 667-683.
Radojevic M. and Bashkin V.N. (2010), Practical Environmental Analysis, (2nd
Ed) RSC Publishing, UK.
Ramasubramanian V., Jeyaprakash R., Ruby M.D.A., Ramasubbu R. and Mariappan V. (2004), Analysis of physico-chemical characteristics of ground water quality and quality index in and around Sivakasi Town, Indian Journal of Environment and Ecoplanning, 8(1), 171-176.
Rehrl C. and Birk S. (2010), Hydrogeological characterisation and modelling of spring catchments in a changing environment, Austrian Journal of Earth Sciences, 103(2), 106-117.
Richard L.A. (1954), Diagnosis and improvement of saline and alkali soils, Agric Handbook 60, USDA, Washington D.C., pp160.
Ritzi R.W., Wright S.L., Mann B. and Chen M. (1993), Analysis of temporal variability in hydro-geochemical data used for multivariate analysis, Groundwater, 31(2), 221-229.

954 UMAR et al.
Robert T., Caterina D., Deceuster J., Kaufmann O. and Nguyen F. (2012), A salt tracer test monitored with surface ERT to detect preferential flow and transport paths in fractured/karstified limestones, Geophysics, 77(2), B55-B67.
Sharma R.K., Agrawal M. and Marshall F. (2007), Heavy metal contamination of soil and vegetables in suburban areas of Varanasi, India, Ecotoxicology and Environmental Safety, 66, 258-266.
Tiri A. and Boudoukha H. (2010), Hydrochemical Analysis and Assessment of Surface Water Quality in Koudiat Medouar Reservoir, Algeria, European Journal of Scientific Research, 41(2), 273-285.
Umar M., Friis H., Khan A.S., Kassi A.M., Kelling G., Sabir M.A., Farooq M. (2014), Sediment composition and provenance of Pab Formation, Kirthar Fold Belt, Pakistan: Signatures of hot spot volcanism, source area weathering and paleogeography on western passive margin of Indian Plate during late cretaceous, Arabian Journal of Science and Engineering, 39, 311–324.
Umar M., Sabir M.A., Farooq M., Khan M.M.S.S., Faridullah F., Jadoon U.K., Khan A.S. (2014), Stratigraphic and sedimentological attributes in Hazara basin lesser Himalya, North Pakistan: their role in deciphering minerals potential, Arabian Journal of Geosciences, DOI: 10.1007/s12517-014-1322-1.
Umar M., Waseem A., Sabir M.A., Kassi A.M. and Khan A.S. (2013), The Impact of Geology of Recharge Areas on Groundwater Quality: A Case Study of Zhob River Basin, Pakistan, CLEAN-Soil, air, water, 41(2), 119-127.
UNEP, (2002), United Nations Environment Program, Global environment outlook 3: Past, present and future perspectives. UK: Earthscan Publications Ltd, UK.
Villholth K.G. and Rajasooriyar L.D. (2010), Groundwater Resources and Management Challenges in Sri Lanka: an Overview, Water Resources Management, 24(8), 1489-1513.
Voudouris K.S., Daskalaki P. and Antonaka A. (2005), Water Resources and groundwater quality in North Peloponnesus (Greece), Global NEST Journal, 7(3), 340-353.
WHO (1996), Guidelines for drinking water quality: Geneva, 1 pp. 53–73.
Wilcox L.V. (1955), Classification and use of irrigation water, Agric circ 969, USDA, Washington D.C., pp 19.
WWF (2007), akistan’s Waters at risk: Freshwater & Toxics Programme, WWF–Pakistan.
Zeb S., Malik A.H. Waseem A. and Mahmood Q. (2011), Water quality assessment of Siran River, Pakistan, International Journal of Physical Sciences, 6(34), 7789-7798.


