
Sure Retirement - Sure Dividend
61
2,546 Sure Retirement HIGH-YIELD, HIGH-QUALITY SECURITIES May 2021 Edition By Ben Reynolds, Bob Ciura, Josh Arnold, and Eli Inkrot Edited by Brad Beams Published on May 9 th , 2021
Transcript of Sure Retirement - Sure Dividend

2,546
Sure Retirement
HIGH-YIELD, HIGH-QUALITY SECURITIES
May 2021 Edition
By Ben Reynolds, Bob Ciura, Josh Arnold, and Eli Inkrot
Edited by Brad Beams
Published on May 9th, 2021
Table of Contents
Opening Thoughts - Update On Zoom Versus Altria - ............................................................. 3
The Sure Retirement Top 10 – May 2021 ................................................................................... 4
Analysis of Top 10 Securities ....................................................................................................... 5
Gilead Sciences Inc. (GILD)....................................................................................................... 5
Magellan Midstream Partners LP (MMP) .................................................................................. 8
National Health Investors Inc. (NHI)........................................................................................ 11
Sunoco LP (SUN) ..................................................................................................................... 14
MPLX LP (MPLX) ................................................................................................................... 17
OGE Energy Corp. (OGE) ........................................................................................................ 20
AT&T Inc. (T) .......................................................................................................................... 23
Verizon Communications Inc. (VZ) ......................................................................................... 26
AbbVie Inc. (ABBV) ................................................................................................................ 29
Altria Group Inc. (MO) ............................................................................................................. 32
Closing Thoughts - Understanding Cost Basis - ...................................................................... 35
List of Securities by Retirement Suitability Score ................................................................... 36
List of Securities by Sector ......................................................................................................... 42
Sell Rules, Past Recommendations, Pending Sells, & Past Sells ............................................. 50
Sell Rules .................................................................................................................................. 50
Unsold Past Recommendations................................................................................................. 51
Sold Positions............................................................................................................................ 52
Pending Sells ............................................................................................................................. 53
Buying & Ranking Criteria ....................................................................................................... 54
Portfolio Building Guide ............................................................................................................ 55
Examples ................................................................................................................................... 55
Tax Guide .................................................................................................................................... 56
Corporations .............................................................................................................................. 57
Master Limited Partnerships (MLPs)........................................................................................ 58
Real Estate Investment Trusts (REITs)..................................................................................... 59
Business Development Companies (BDCs) ............................................................................. 60
Glossary of Common Terms & Acronyms ............................................................................... 61
3
Opening Thoughts - Update On Zoom Versus Altria -
In the November 2020 edition of The Sure Retirement Newsletter, the Closing Thoughts compared
an investment in Altria (MO) versus an investment in Zoom (ZM).
The idea is to contrast an extremely popular security with an incredibly high price-to-sales ratio
with an out-of-favor security that rewards shareholders with sizeable dividends. The valuation
discrepancy between the two is shown in a quote from the November 2020 Sure Retirement
Newsletter below:
“Zoom (ZM) is a good example – it’s currently trading for a price to sales (not earnings, but sales)
ratio of 109… The market cap of Zoom is $146 billion. The market cap of Altria is $72 billion,
about half of Zoom’s. Altria has paid out $6.3 billion in dividends over the last four quarters.
Zoom has generated sales (not earnings, and not dividends) of only $1.3 billion over the last four
quarters. Despite paying out more than 4x the amount in dividends as Zoom has even generated in
sales, Altria is worth around half of what Zoom is on the stock market.”
Since writing these Closing Thoughts in November 2020, Zoom stock has generated total returns1
of -27.5% while Altria has generated total returns of 31.1%. Zoom’s decline occurred in a bull
market – the S&P 500 ETF (SPY) is up 18.5% over the same time period. This makes the decline
more troubling, and points to the reason many investors likely had a position in Zoom.
With such an elevated price-to-sales ratio, Zoom’s valuation was (and still is) based in large part on
what the next person will pay for it rather than on the underlying business’ ability to generate cash
flows for shareholders. This works out great when positive news continues and more investors
flock to the popular security.
But when sentiment turns – even slightly – there’s no reason to own the stock if it’s going down.
And that’s the big contrast between dividend investing and investing in whatever the current hottest
stock or trend is.
With dividend investing, you are investing for the income the security produces. If the situation
were reversed and Altria were down and Zoom were up further, a dividend investor would not be
nearly so pressed to sell. That’s because the reason to own Altria (income) would still be just as
valid as ever despite the price decline.
One of the biggest mistakes an investor can make is selling for no other reason than because the
price is going down. Investing for income makes it easier to hold through price declines because
the reason you purchased wasn’t only to see the price increase.
Please continue reading this edition of The Sure Retirement Newsletter to see our current Top 10
securities with yields over 4% analyzed in detail. Altria makes the list again this month.
1 Total return data from market close 11/9/20, the day after The November 2020 Sure Retirement Newsletter was published, through
midday 5/5/21.

4
The Sure Retirement Top 10 – May 2021
Name & Ticker Div. Risk
Score Price
Fair Value
Exp. Value Ret.
Div. or Dist. Yield
Payout Ratio2
Exp. Growth
ETR
Gilead (GILD) B $67 $78 3.0% 4.2% 40% 5.0% 11.7%
Magellan Midstream (MMP)3 C $48 $60 4.7% 8.6% 82% 3.0% 13.9%
National Health Inv. (NHI)4 C $71 $76 1.3% 6.2% 80% 5.5% 11.9%
Sunoco (SUN) C $36 $41 2.6% 9.2% 53% 1.5% 11.0%
MPLX (MPLX) C $28 $29 0.5% 9.7% 67% 2.0% 10.5%
OGE Energy (OGE) C $34 $37 1.7% 4.8% 76% 5.0% 10.8%
AT&T (T) B $32 $35 1.6% 6.4% 65% 3.0% 9.8%
Verizon (VZ) B $59 $66 2.3% 4.3% 49% 4.0% 9.7%
AbbVie (ABBV) A $116 $125 1.4% 4.5% 42% 3.0% 8.5%
Altria (MO) B $50 $50 0.1% 7.2% 78% 2.3% 8.6%
Notes: Data for the table above is from the 5/7/21 Sure Analysis Research Database spreadsheet and other sources.
‘Div.’ stands for ‘Dividend.’ ‘Dist.’ stands for ‘Distribution.’ ‘Exp. Value Ret.’ means expected returns from valuation
changes. ‘Exp. Growth’ means expected annualized growth rate over the next five years. ‘ETR’ stands for expected total
returns. Data in the table above might be slightly different than individual company analysis pages due to writing the
company reports throughout the past week.
Top 10 Disclosures: Ben Reynolds is long T & MO. Bob Ciura is long ABBV & MO. Eli Inkrot is long T & VZ.
Lazard (LAZ) was replaced by Altria (MO) in this month’s Top 10. There tends to be more volatility
in the Top 10 around earnings season, but we only saw one change in this month’s Top 10 despite it
being earnings season. As a reminder, securities that are no longer in the Top 10 are holds, not sells.
An equally weighted portfolio of the Top 10 has the following future expected total returns estimate
characteristics:
Top 10 S&P 500
Dividend Yield: 6.5% 1.4%
Growth Rate: 3.4% 5.5%
Valuation Expansion: 1.9% -9.9%
Expected Annual Total Returns: 10.6% -3.0%
Notes: Data for this newsletter is from 5/4/21 through 5/7/21. We use the simplified method of calculating expected total
returns for the S&P 500 above, which is the sum of dividend yield, growth rate, and valuation multiple
expansion/contraction.
2 The payout ratio for MLPs and REITs uses distributable cash flows (DCFs) and funds from operations (FFO), respectively. 3 MMP, SUN, & MPLX are MLPs. These three all have different tax consequences versus common stocks. Please see the MLP
portion of our Tax Guide in this newsletter, as well as the MLP Tax Consequences and the advantages & disadvantages of investing in
MLPs portions of our primary MLP article on Sure Dividend. 4 NHI is a REIT and has different tax consequences. Please see the REITs tax guide in this newsletter for more information.
5
Return to Top 10 List
Analysis of Top 10 Securities
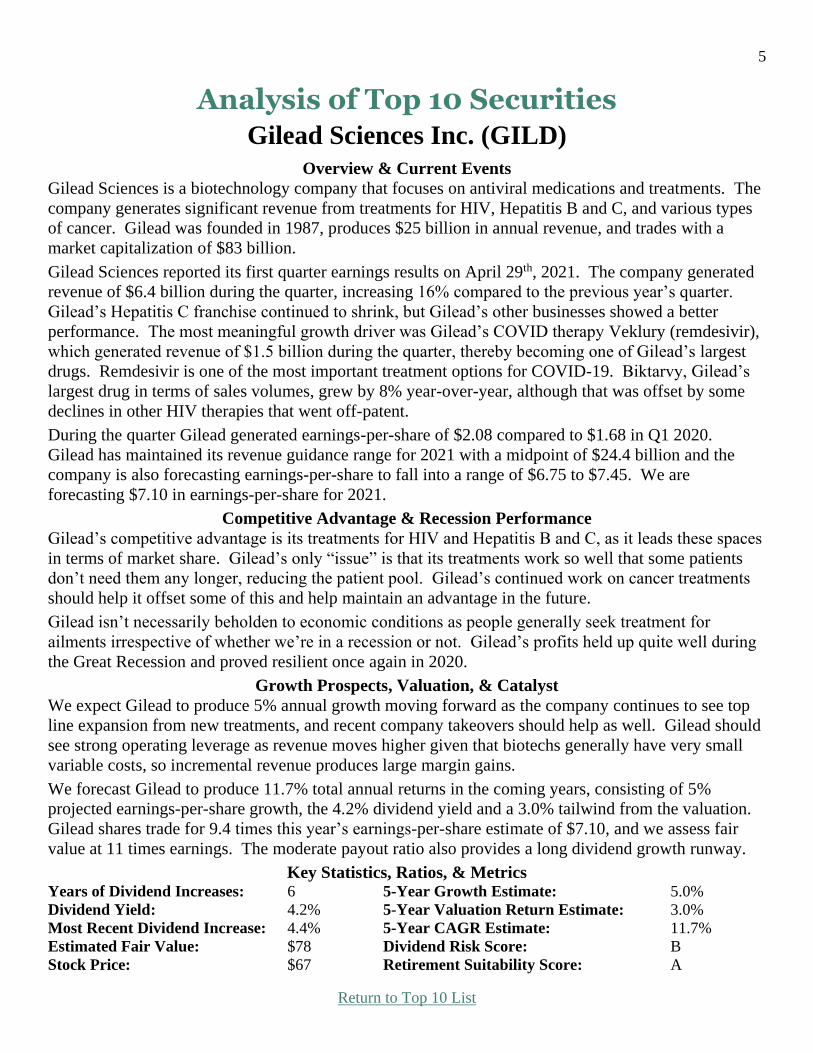
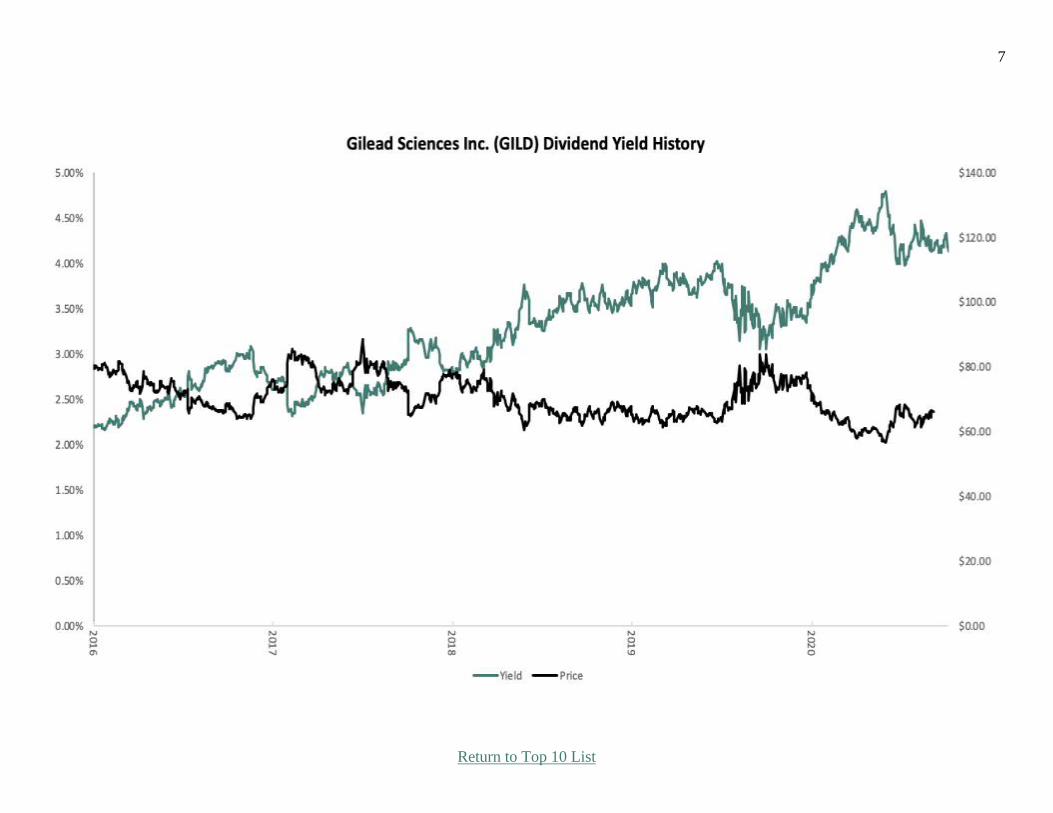
Gilead Sciences Inc. (GILD)
Overview & Current Events
Gilead Sciences is a biotechnology company that focuses on antiviral medications and treatments. The
company generates significant revenue from treatments for HIV, Hepatitis B and C, and various types
of cancer. Gilead was founded in 1987, produces $25 billion in annual revenue, and trades with a
market capitalization of $83 billion.
Gilead Sciences reported its first quarter earnings results on April 29th, 2021. The company generated
revenue of $6.4 billion during the quarter, increasing 16% compared to the previous year’s quarter.
Gilead’s Hepatitis C franchise continued to shrink, but Gilead’s other businesses showed a better
performance. The most meaningful growth driver was Gilead’s COVID therapy Veklury (remdesivir),
which generated revenue of $1.5 billion during the quarter, thereby becoming one of Gilead’s largest
drugs. Remdesivir is one of the most important treatment options for COVID-19. Biktarvy, Gilead’s
largest drug in terms of sales volumes, grew by 8% year-over-year, although that was offset by some
declines in other HIV therapies that went off-patent.
During the quarter Gilead generated earnings-per-share of $2.08 compared to $1.68 in Q1 2020.
Gilead has maintained its revenue guidance range for 2021 with a midpoint of $24.4 billion and the
company is also forecasting earnings-per-share to fall into a range of $6.75 to $7.45. We are
forecasting $7.10 in earnings-per-share for 2021.
Competitive Advantage & Recession Performance
Gilead’s competitive advantage is its treatments for HIV and Hepatitis B and C, as it leads these spaces
in terms of market share. Gilead’s only “issue” is that its treatments work so well that some patients
don’t need them any longer, reducing the patient pool. Gilead’s continued work on cancer treatments
should help it offset some of this and help maintain an advantage in the future.
Gilead isn’t necessarily beholden to economic conditions as people generally seek treatment for
ailments irrespective of whether we’re in a recession or not. Gilead’s profits held up quite well during
the Great Recession and proved resilient once again in 2020.
Growth Prospects, Valuation, & Catalyst
We expect Gilead to produce 5% annual growth moving forward as the company continues to see top
line expansion from new treatments, and recent company takeovers should help as well. Gilead should
see strong operating leverage as revenue moves higher given that biotechs generally have very small
variable costs, so incremental revenue produces large margin gains.
We forecast Gilead to produce 11.7% total annual returns in the coming years, consisting of 5%
projected earnings-per-share growth, the 4.2% dividend yield and a 3.0% tailwind from the valuation.
Gilead shares trade for 9.4 times this year’s earnings-per-share estimate of $7.10, and we assess fair
value at 11 times earnings. The moderate payout ratio also provides a long dividend growth runway.
Key Statistics, Ratios, & Metrics Years of Dividend Increases: 6 5-Year Growth Estimate: 5.0%
Dividend Yield: 4.2% 5-Year Valuation Return Estimate: 3.0%
Most Recent Dividend Increase: 4.4% 5-Year CAGR Estimate: 11.7%
Estimated Fair Value: $78 Dividend Risk Score: B
Stock Price: $67 Retirement Suitability Score: A
6
Return to Top 10 List
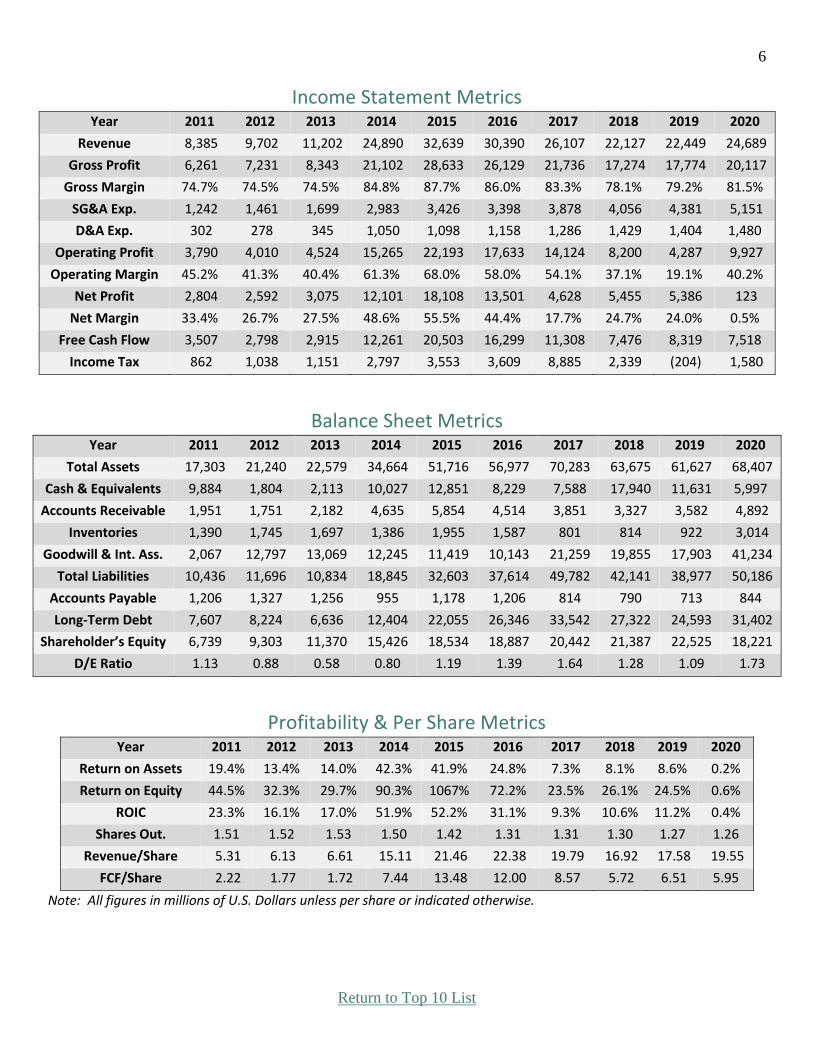
Income Statement Metrics Year 2011 2012 2013 2014 2015 2016 2017 2018 2019 2020
Revenue 8,385 9,702 11,202 24,890 32,639 30,390 26,107 22,127 22,449 24,689
Gross Profit 6,261 7,231 8,343 21,102 28,633 26,129 21,736 17,274 17,774 20,117
Gross Margin 74.7% 74.5% 74.5% 84.8% 87.7% 86.0% 83.3% 78.1% 79.2% 81.5%
SG&A Exp. 1,242 1,461 1,699 2,983 3,426 3,398 3,878 4,056 4,381 5,151
D&A Exp. 302 278 345 1,050 1,098 1,158 1,286 1,429 1,404 1,480
Operating Profit 3,790 4,010 4,524 15,265 22,193 17,633 14,124 8,200 4,287 9,927
Operating Margin 45.2% 41.3% 40.4% 61.3% 68.0% 58.0% 54.1% 37.1% 19.1% 40.2%
Net Profit 2,804 2,592 3,075 12,101 18,108 13,501 4,628 5,455 5,386 123
Net Margin 33.4% 26.7% 27.5% 48.6% 55.5% 44.4% 17.7% 24.7% 24.0% 0.5%
Free Cash Flow 3,507 2,798 2,915 12,261 20,503 16,299 11,308 7,476 8,319 7,518
Income Tax 862 1,038 1,151 2,797 3,553 3,609 8,885 2,339 (204) 1,580
Balance Sheet Metrics Year 2011 2012 2013 2014 2015 2016 2017 2018 2019 2020
Total Assets 17,303 21,240 22,579 34,664 51,716 56,977 70,283 63,675 61,627 68,407
Cash & Equivalents 9,884 1,804 2,113 10,027 12,851 8,229 7,588 17,940 11,631 5,997
Accounts Receivable 1,951 1,751 2,182 4,635 5,854 4,514 3,851 3,327 3,582 4,892
Inventories 1,390 1,745 1,697 1,386 1,955 1,587 801 814 922 3,014
Goodwill & Int. Ass. 2,067 12,797 13,069 12,245 11,419 10,143 21,259 19,855 17,903 41,234
Total Liabilities 10,436 11,696 10,834 18,845 32,603 37,614 49,782 42,141 38,977 50,186
Accounts Payable 1,206 1,327 1,256 955 1,178 1,206 814 790 713 844
Long-Term Debt 7,607 8,224 6,636 12,404 22,055 26,346 33,542 27,322 24,593 31,402
Shareholder’s Equity 6,739 9,303 11,370 15,426 18,534 18,887 20,442 21,387 22,525 18,221
D/E Ratio 1.13 0.88 0.58 0.80 1.19 1.39 1.64 1.28 1.09 1.73
Profitability & Per Share Metrics Year 2011 2012 2013 2014 2015 2016 2017 2018 2019 2020
Return on Assets 19.4% 13.4% 14.0% 42.3% 41.9% 24.8% 7.3% 8.1% 8.6% 0.2%
Return on Equity 44.5% 32.3% 29.7% 90.3% 1067% 72.2% 23.5% 26.1% 24.5% 0.6%
ROIC 23.3% 16.1% 17.0% 51.9% 52.2% 31.1% 9.3% 10.6% 11.2% 0.4%
Shares Out. 1.51 1.52 1.53 1.50 1.42 1.31 1.31 1.30 1.27 1.26
Revenue/Share 5.31 6.13 6.61 15.11 21.46 22.38 19.79 16.92 17.58 19.55
FCF/Share 2.22 1.77 1.72 7.44 13.48 12.00 8.57 5.72 6.51 5.95
Note: All figures in millions of U.S. Dollars unless per share or indicated otherwise.
7
Return to Top 10 List

8
Return to Top 10 List
Magellan Midstream Partners LP (MMP)
Overview & Current Events
Magellan Midstream Partners is a master limited partnership (MLP) that engages in the transportation,
storage, and distribution of refined petroleum products in the United States. The partnership operates
through three segments: Refined Products, Crude Oil, and Marine Storage. Magellan’s model is fee-
based, meaning it has very small exposure to commodity prices, making it attractive during commodity
bear markets. Magellan was founded in 2000, produces about $2.5 billion in annual revenue, and is
valued at a market capitalization of $10.7 billion.
In late April, MMP reported (4/29/21) financial results for the first quarter of 2021. The MLP
recovered from the pandemic thanks to improved demand for refined products, while it also benefited
from the winter storms. As a result, distributable cash flow per unit fell only 9% over last year’s first
quarter, from $1.36 per unit to $1.24 per unit. The distribution coverage ratio improved sequentially
from 1.13 to 1.21. MMP also raised its guidance for its annual distributable cash flow by 5%, from
$1.02 billion to $1.07 billion.
We see distributable cash flow (DCF) of $5.00 for 2021. Magellan did note that it expects distributable
cash flow to increase over the coming years. In addition, the company expects spring fuel demand to
rise past 2019 levels. With 2021 likely being the bottom of the cycle for Magellan, units are
attractively priced, as is the high distribution yield.
Competitive Advantages & Recession Performance
Magellan’s competitive advantage is its fee-based model, which means it is far less exposed to
commodity prices than some other commodity-based MLPs. In addition, Magellan has sizable scale in
an industry where scale means better margins. However, as was made clear in 2020, Magellan’s model
is not immune to recessions as lower demand for crude oil and petroleum products can significantly
impact results. Fortunately, Magellan’s balance sheet is in healthy shape. It has strong credit ratings of
BBB+/Baa1 from Standard & Poor’s and Moody’s, respectively. Magellan had a 3.5x leverage ratio at
the end of 2020, below its target limit of 4.0.
Growth Prospects, Valuation, & Catalyst
We see growth for Magellan coming from new projects. The company invested $355 million in growth
projects last year, with more than $500 million of potential growth projects under consideration.
Buybacks are an additional DCF-per-unit growth catalyst. Magellan is in the midst of a $750 million
unit repurchase program, and repurchased $277 million of its units in 2020. We project 3% annual
growth in DCF-per-unit for Magellan over the next five years.
We estimate fair value at 12 times DCF-per-unit, but the valuation is currently only at 9.5 times this
year’s estimated DCF-per-unit of $5.00. We see outstanding projected total returns of 13.9% annually
over the next five years, the result of cash flow growth, the 8.6% distribution yield, and a 4.7% tailwind
from valuation gains.
Key Statistics, Ratios, & Metrics Years of Distribution Increases: 20 5-Year Growth Estimate: 3.0%
Distribution Yield: 8.6% 5-Year Valuation Return Estimate: 4.7%
Most Recent Distrib. Increase: 0.7% 5-Year CAGR Estimate: 13.9%
Estimated Fair Value: $60 Distribution Risk Score: C
Security Price: $48 Retirement Suitability Score: A

9
Return to Top 10 List
Income Statement Metrics Year 2011 2012 2013 2014 2015 2016 2017 2018 2019 2020
Revenue 1,749 1,772 1,948 2,360 2,188 2,205 2,508 2,827 2,728 2,428
Gross Profit 921 987 1,227 1,604 1,574 1,534 1,675 1,857 1,862 1,655
Gross Margin 52.7% 55.7% 63.0% 68.0% 71.9% 69.6% 66.8% 65.7% 68.3% 68.2%
SG&A Exp. 99 109 132 148 150 147 166 194 197 173
D&A Exp. 121 128 142 162 167 178 197 265 246 259
Operating Profit 516 549 699 955 901 858 932 1,013 1,035 881
Operating Margin 29.5% 31.0% 35.9% 40.5% 41.2% 38.9% 37.2% 35.9% 37.9% 36.3%
Net Profit 414 436 582 840 819 803 870 1,334 1,021 817
Net Margin 23.7% 24.6% 29.9% 35.6% 37.4% 36.4% 34.7% 47.2% 37.4% 33.7%
Free Cash Flow 378 292 352 744 449 299 573 801 377 668
Income Tax 2 3 5 5 2 3 4 0 1 3
Balance Sheet Metrics Year 2011 2012 2013 2014 2015 2016 2017 2018 2019 2020
Total Assets 4,045 4,420 4,821 5,501 6,042 6,772 7,394 7,748 8,438 8,197
Cash & Equivalents 210 328 25 17 29 15 161 218 58 13
Accounts Receivable 82 91 116 84 84 106 139 104 125 109
Inventories 259 222 187 158 131 134 182 186 184 167
Goodwill & Int. Ass. 68 67 61 58 55 105 106 104 101 98
Total Liabilities 2,582 2,904 3,173 3,633 4,020 4,680 5,265 5,104 5,723 5,893
Accounts Payable 66 112 76 97 104 77 105 139 151 100
Long-Term Debt 2,152 2,393 2,685 2,967 3,440 4,087 4,524 4,271 4,706 4,979
Shareholder’s Equity 1,463 1,516 1,647 1,868 2,022 2,092 2,130 2,643 2,715 2,304
Profitability & Per Share Metrics Year 2011 2012 2013 2014 2015 2016 2017 2018 2019 2020
Return on Assets 10.7% 10.3% 12.6% 16.3% 14.2% 12.5% 12.3% 17.6% 12.6% 9.8%
Return on Equity 28.3% 29.2% 36.8% 47.8% 42.1% 39.0% 41.2% 55.9% 38.1% 32.6%
Units Out. 225.4 226.2 226.7 226.7 227.4 227.8 228.0 229.1 228.7 16.9%
Revenue/Share 7.74 7.82 8.58 10.37 9.60 9.67 10.98 12.37 11.92 225.5
FCF/Share 1.67 1.29 1.55 3.27 1.97 1.31 2.51 3.50 1.65 10.76
Note: All figures in millions of U.S. Dollars unless per share or indicated otherwise.

10
Return to Top 10 List
11
Return to Top 10 List
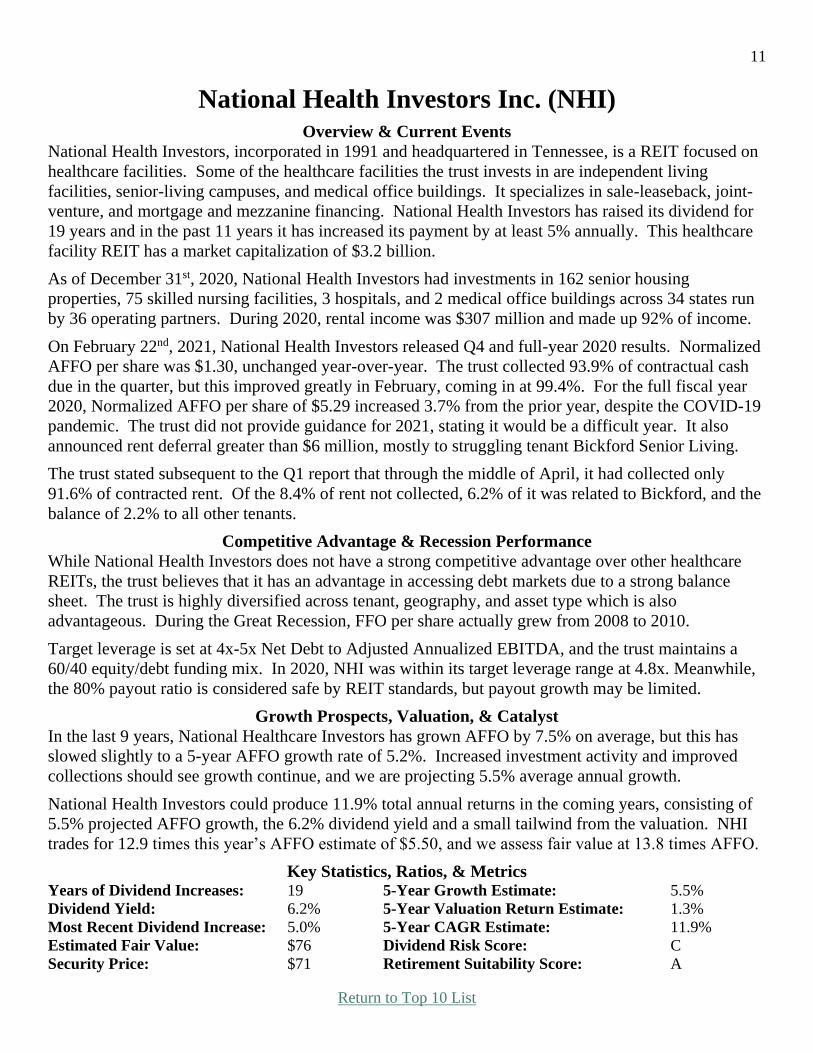
National Health Investors Inc. (NHI) Overview & Current Events
National Health Investors, incorporated in 1991 and headquartered in Tennessee, is a REIT focused on
healthcare facilities. Some of the healthcare facilities the trust invests in are independent living
facilities, senior-living campuses, and medical office buildings. It specializes in sale-leaseback, joint-
venture, and mortgage and mezzanine financing. National Health Investors has raised its dividend for
19 years and in the past 11 years it has increased its payment by at least 5% annually. This healthcare
facility REIT has a market capitalization of $3.2 billion.
As of December 31st, 2020, National Health Investors had investments in 162 senior housing
properties, 75 skilled nursing facilities, 3 hospitals, and 2 medical office buildings across 34 states run
by 36 operating partners. During 2020, rental income was $307 million and made up 92% of income.
On February 22nd, 2021, National Health Investors released Q4 and full-year 2020 results. Normalized
AFFO per share was $1.30, unchanged year-over-year. The trust collected 93.9% of contractual cash
due in the quarter, but this improved greatly in February, coming in at 99.4%. For the full fiscal year
2020, Normalized AFFO per share of $5.29 increased 3.7% from the prior year, despite the COVID-19
pandemic. The trust did not provide guidance for 2021, stating it would be a difficult year. It also
announced rent deferral greater than $6 million, mostly to struggling tenant Bickford Senior Living.
The trust stated subsequent to the Q1 report that through the middle of April, it had collected only
91.6% of contracted rent. Of the 8.4% of rent not collected, 6.2% of it was related to Bickford, and the
balance of 2.2% to all other tenants.
Competitive Advantage & Recession Performance
While National Health Investors does not have a strong competitive advantage over other healthcare
REITs, the trust believes that it has an advantage in accessing debt markets due to a strong balance
sheet. The trust is highly diversified across tenant, geography, and asset type which is also
advantageous. During the Great Recession, FFO per share actually grew from 2008 to 2010.
Target leverage is set at 4x-5x Net Debt to Adjusted Annualized EBITDA, and the trust maintains a
60/40 equity/debt funding mix. In 2020, NHI was within its target leverage range at 4.8x. Meanwhile,
the 80% payout ratio is considered safe by REIT standards, but payout growth may be limited.
Growth Prospects, Valuation, & Catalyst
In the last 9 years, National Healthcare Investors has grown AFFO by 7.5% on average, but this has
slowed slightly to a 5-year AFFO growth rate of 5.2%. Increased investment activity and improved
collections should see growth continue, and we are projecting 5.5% average annual growth.
National Health Investors could produce 11.9% total annual returns in the coming years, consisting of
5.5% projected AFFO growth, the 6.2% dividend yield and a small tailwind from the valuation. NHI
trades for 12.9 times this year’s AFFO estimate of $5.50, and we assess fair value at 13.8 times AFFO.
Key Statistics, Ratios, & Metrics Years of Dividend Increases: 19 5-Year Growth Estimate: 5.5%
Dividend Yield: 6.2% 5-Year Valuation Return Estimate: 1.3%
Most Recent Dividend Increase: 5.0% 5-Year CAGR Estimate: 11.9%
Estimated Fair Value: $76 Dividend Risk Score: C
Security Price: $71 Retirement Suitability Score: A

12
Return to Top 10 List
Income Statement Metrics Year 2011 2012 2013 2014 2015 2016 2017 2018 2019 2020
Revenue 84 93 118 178 229 248 279 295 318 333
Gross Profit 83 93 117 177 228 247 278 293 311 323
Gross Margin 99.0% 99.2% 99.6% 99.7% 99.6% 99.6% 99.7% 99.6% 97.7% 96.9%
SG&A Exp. 8 9 10 9 11 10 13 13 14 15
D&A Exp. 13 17 21 41 57 63 67 71 77 83
Operating Profit 63 69 87 130 164 178 198 209 220 225
Operating Margin 75.6% 74.2% 74.0% 73.0% 71.6% 71.5% 71.0% 71.0% 69.2% 67.6%
Net Profit 81 91 106 102 149 152 159 154 160 185
Net Margin 96.9% 97.2% 90.1% 57.2% 65.0% 61.0% 57.2% 52.4% 50.4% 55.6%
Free Cash Flow 77 86 104 126 164 177 198 208 241 232
Balance Sheet Metrics Year 2011 2012 2013 2014 2015 2016 2017 2018 2019 2020
Total Assets 580 706 1,456 1,983 2,133 2,404 2,546 2,751 3,042 3,120
Cash & Equivalents 16 9 11 3 13 5 3 5 5 43
Accounts Receivable 9 14 21 39 63 82 100 112 89 98
Total Liabilities 136 238 679 933 991 1,194 1,224 1,361 1,544 1,598
Long-Term Debt 97 203 617 863 914 1,116 1,145 1,282 1,440 1,499
Shareholder’s Equity 443 457 767 1,040 1,133 1,210 1,322 1,390 1,498 1,512
D/E Ratio 0.22 0.44 0.81 0.83 0.81 0.92 0.87 0.92 0.96 0.99
Profitability & Per Share Metrics Year 2011 2012 2013 2014 2015 2016 2017 2018 2019 2020
Return on Assets 14.9% 14.1% 9.8% 5.9% 7.2% 6.7% 6.4% 5.8% 5.5% 6.0%
Return on Equity 18.3% 20.1% 17.4% 11.2% 13.7% 12.9% 12.6% 11.4% 11.1% 12.3%
ROIC 15.9% 15.0% 10.3% 6.1% 7.5% 6.9% 6.6% 6.0% 5.7% 6.2%
Shares Out. 27.8 27.8 28.4 33.4 37.6 39.2 41.2 42.1 43.7 44.7
Revenue/Share 3.01 3.35 4.15 5.31 6.08 6.35 6.77 7.00 7.28 7.45
FCF/Share 2.77 3.10 3.67 3.77 4.37 4.51 4.81 4.94 5.51 5.19
Note: All figures in millions of U.S. Dollars unless per share or indicated otherwise.

13
Return to Top 10 List

14
Return to Top 10 List
Sunoco LP (SUN) Overview & Current Events
Sunoco is a Master Limited Partnership (MLP) that distributes fuel products through its wholesale and
retail business units. The wholesale unit purchases fuel products from refiners and sells those products
to both its own and independently-owned dealers. Sunoco was founded in 1886 and is headquartered
in Dallas, Texas. Sunoco is the largest fuel distributor in the U.S, but also operates a small number of
retail stores, and a terminal facility in Hawaii. Sunoco should produce about $14 billion in revenue this
year, and trades with a market capitalization of $3.6 billion. Shares have increased 25% year-to-date,
as Oil and Gas MLPs continue their steady recovery from the coronavirus pandemic.
Sunoco reported Q1 earnings on May 6th, and results were better than expectations on the top and
bottom lines. The partnership sold 1.76 billion gallons of fuel in the first quarter, which was down
from 1.90 billion year-over-year, a 7% decline. Fuel margin was 10.3 cents per gallon, down from 13.1
cents in last year’s Q1. Management said volumes should improve throughout the year with stronger
economic activity. Distributable cash flow (DCF) was $108 million in Q1, down from $159 million a
year ago. The company reaffirmed its EBITDA guidance for the year, so we have done the same with
our DCF-per-share estimate, which remains at $6.25.
Competitive Advantages & Recession Performance
Sunoco is the largest fuel wholesaler in the U.S., which provides competitive advantages in terms of
size and scale. It is also a key distributor for Exxon and Chevron branded fuels. Sunoco could increase
its scale advantage further through tuck-in acquisitions as the industry consolidates.
Sunoco’s dividend payout ratio has moved in a wide range throughout its existence, as EBITDA has
seen steep peaks and troughs. The company has never cut its dividend, but there have not been any
dividend increases since 2017, either. The current yield of 9.2% provides more than ample income and
Sunoco has easily covered its dividend payout in recent quarters. That said, the partnership could be
forced to cut its distribution if economic and energy market disruptions become prolonged, causing its
EBITDA to plunge. We do not expect the need for a distribution cut anytime soon, as the payout ratio
is only ~53%, so it is very well-covered.
Growth Prospects, Valuation, & Catalyst
We do not expect much growth from Sunoco on a per unit basis given the facts that the energy market
is significantly challenged, its units trade at a suppressed level (thereby making equity issuance to fund
accretive acquisitions impractical), and it allocates virtually all of its cash flows to capital expenditures
and distributions. That said, we do expect continuing improving efficiencies in its operations and
rising prices to generate 1.5% annualized growth for the foreseeable future.
Based on expected 2021 DCF-per-share of $6.25, Sunoco trades for a price-to-DCF ratio of 5.8. Our
fair value estimate for Sunoco is a multiple of 6.5. An expanding valuation multiple could boost
shareholder returns by 2.6% per year over the next five years. Given this, the 1.5% growth forecast,
and the 9.2% yield, we expect total annual returns of 11.0% per year over the next five years.
Key Statistics, Ratios, & Metrics Years of Distribution Increases: 0 5-Year Growth Estimate: 1.5%
Distribution Yield: 9.2% 5-Year Valuation Return Estimate: 2.6%
Most Recent Distrib. Increase: NA 5-Year CAGR Estimate: 11.0%
Estimated Fair Value: $41 Distribution Risk Score: C
Security Price: $36 Retirement Suitability Score: A
15
Return to Top 10 List
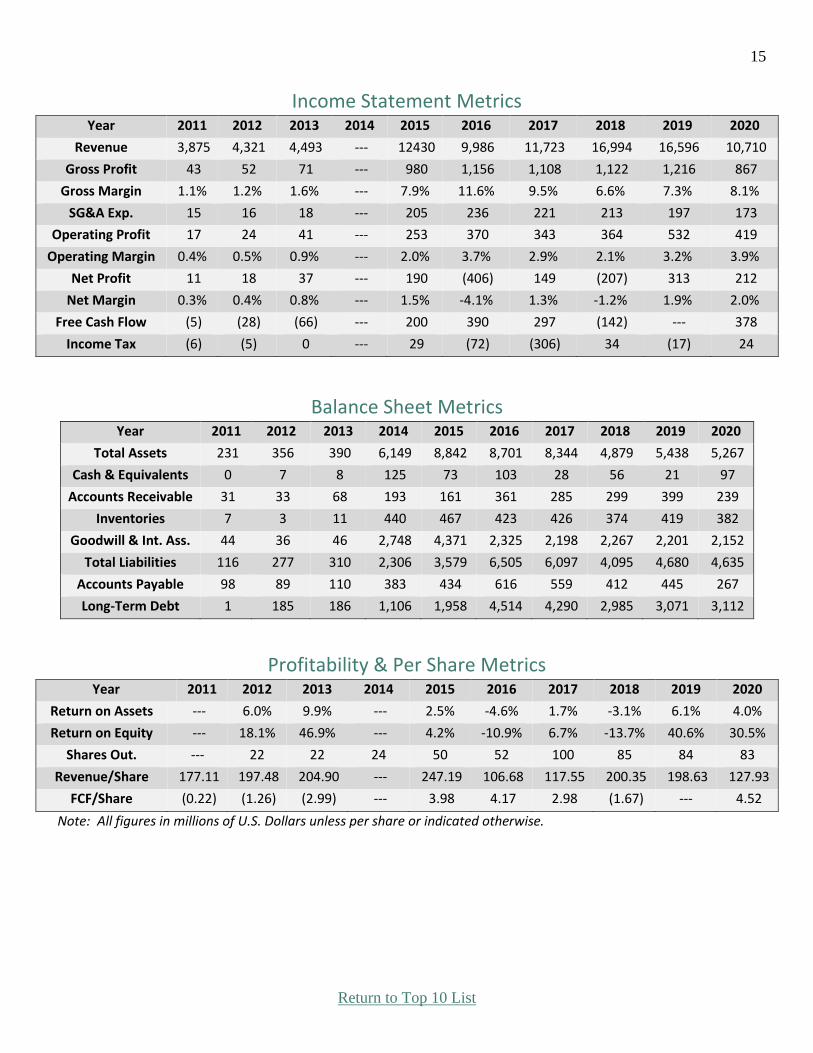
Income Statement Metrics Year 2011 2012 2013 2014 2015 2016 2017 2018 2019 2020
Revenue 3,875 4,321 4,493 --- 12430 9,986 11,723 16,994 16,596 10,710
Gross Profit 43 52 71 --- 980 1,156 1,108 1,122 1,216 867
Gross Margin 1.1% 1.2% 1.6% --- 7.9% 11.6% 9.5% 6.6% 7.3% 8.1%
SG&A Exp. 15 16 18 --- 205 236 221 213 197 173
Operating Profit 17 24 41 --- 253 370 343 364 532 419
Operating Margin 0.4% 0.5% 0.9% --- 2.0% 3.7% 2.9% 2.1% 3.2% 3.9%
Net Profit 11 18 37 --- 190 (406) 149 (207) 313 212
Net Margin 0.3% 0.4% 0.8% --- 1.5% -4.1% 1.3% -1.2% 1.9% 2.0%
Free Cash Flow (5) (28) (66) --- 200 390 297 (142) --- 378
Income Tax (6) (5) 0 --- 29 (72) (306) 34 (17) 24
Balance Sheet Metrics Year 2011 2012 2013 2014 2015 2016 2017 2018 2019 2020
Total Assets 231 356 390 6,149 8,842 8,701 8,344 4,879 5,438 5,267
Cash & Equivalents 0 7 8 125 73 103 28 56 21 97
Accounts Receivable 31 33 68 193 161 361 285 299 399 239
Inventories 7 3 11 440 467 423 426 374 419 382
Goodwill & Int. Ass. 44 36 46 2,748 4,371 2,325 2,198 2,267 2,201 2,152
Total Liabilities 116 277 310 2,306 3,579 6,505 6,097 4,095 4,680 4,635
Accounts Payable 98 89 110 383 434 616 559 412 445 267
Long-Term Debt 1 185 186 1,106 1,958 4,514 4,290 2,985 3,071 3,112
Profitability & Per Share Metrics Year 2011 2012 2013 2014 2015 2016 2017 2018 2019 2020
Return on Assets --- 6.0% 9.9% --- 2.5% -4.6% 1.7% -3.1% 6.1% 4.0%
Return on Equity --- 18.1% 46.9% --- 4.2% -10.9% 6.7% -13.7% 40.6% 30.5%
Shares Out. --- 22 22 24 50 52 100 85 84 83
Revenue/Share 177.11 197.48 204.90 --- 247.19 106.68 117.55 200.35 198.63 127.93
FCF/Share (0.22) (1.26) (2.99) --- 3.98 4.17 2.98 (1.67) --- 4.52
Note: All figures in millions of U.S. Dollars unless per share or indicated otherwise.

16
Return to Top 10 List
17
Return to Top 10 List
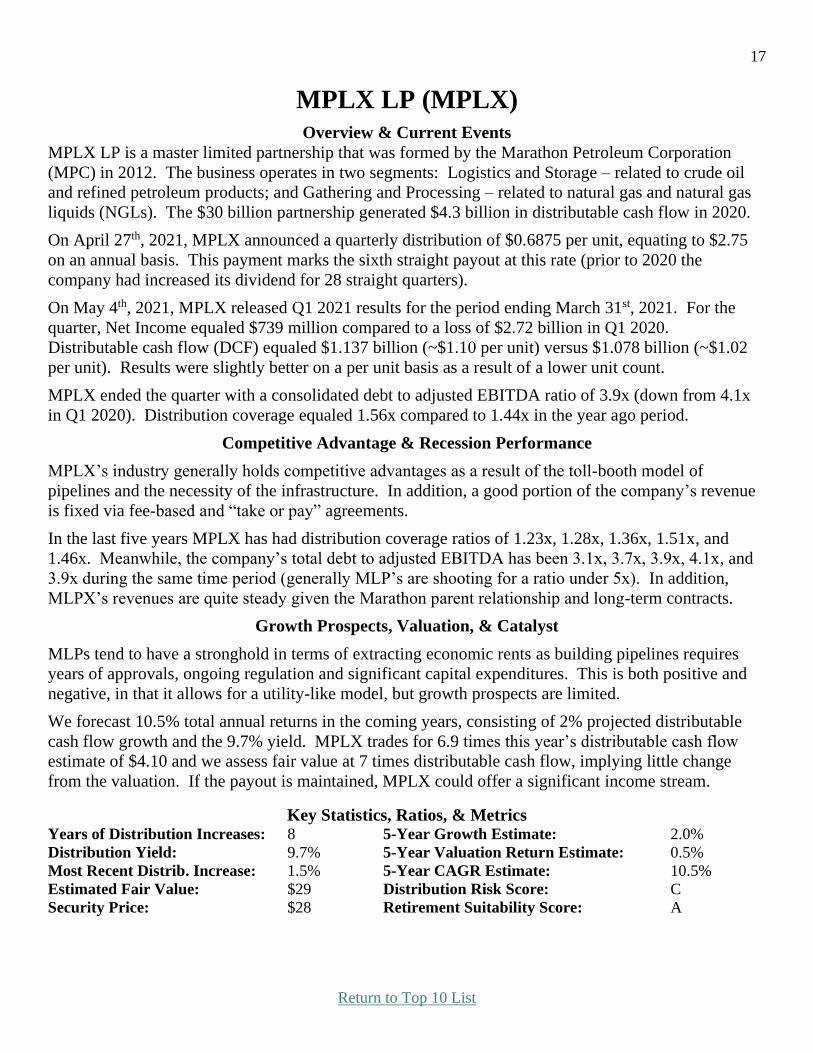
MPLX LP (MPLX)
Overview & Current Events
MPLX LP is a master limited partnership that was formed by the Marathon Petroleum Corporation
(MPC) in 2012. The business operates in two segments: Logistics and Storage – related to crude oil
and refined petroleum products; and Gathering and Processing – related to natural gas and natural gas
liquids (NGLs). The $30 billion partnership generated $4.3 billion in distributable cash flow in 2020.
On April 27th, 2021, MPLX announced a quarterly distribution of $0.6875 per unit, equating to $2.75
on an annual basis. This payment marks the sixth straight payout at this rate (prior to 2020 the
company had increased its dividend for 28 straight quarters).
On May 4th, 2021, MPLX released Q1 2021 results for the period ending March 31st, 2021. For the
quarter, Net Income equaled $739 million compared to a loss of $2.72 billion in Q1 2020.
Distributable cash flow (DCF) equaled $1.137 billion (~$1.10 per unit) versus $1.078 billion (~$1.02
per unit). Results were slightly better on a per unit basis as a result of a lower unit count.
MPLX ended the quarter with a consolidated debt to adjusted EBITDA ratio of 3.9x (down from 4.1x
in Q1 2020). Distribution coverage equaled 1.56x compared to 1.44x in the year ago period.
Competitive Advantage & Recession Performance
MPLX’s industry generally holds competitive advantages as a result of the toll-booth model of
pipelines and the necessity of the infrastructure. In addition, a good portion of the company’s revenue
is fixed via fee-based and “take or pay” agreements.
In the last five years MPLX has had distribution coverage ratios of 1.23x, 1.28x, 1.36x, 1.51x, and
1.46x. Meanwhile, the company’s total debt to adjusted EBITDA has been 3.1x, 3.7x, 3.9x, 4.1x, and
3.9x during the same time period (generally MLP’s are shooting for a ratio under 5x). In addition,
MLPX’s revenues are quite steady given the Marathon parent relationship and long-term contracts.
Growth Prospects, Valuation, & Catalyst
MLPs tend to have a stronghold in terms of extracting economic rents as building pipelines requires
years of approvals, ongoing regulation and significant capital expenditures. This is both positive and
negative, in that it allows for a utility-like model, but growth prospects are limited.
We forecast 10.5% total annual returns in the coming years, consisting of 2% projected distributable
cash flow growth and the 9.7% yield. MPLX trades for 6.9 times this year’s distributable cash flow
estimate of $4.10 and we assess fair value at 7 times distributable cash flow, implying little change
from the valuation. If the payout is maintained, MPLX could offer a significant income stream.
Key Statistics, Ratios, & Metrics Years of Distribution Increases: 8 5-Year Growth Estimate: 2.0%
Distribution Yield: 9.7% 5-Year Valuation Return Estimate: 0.5%
Most Recent Distrib. Increase: 1.5% 5-Year CAGR Estimate: 10.5%
Estimated Fair Value: $29 Distribution Risk Score: C
Security Price: $28 Retirement Suitability Score: A
18
Return to Top 10 List
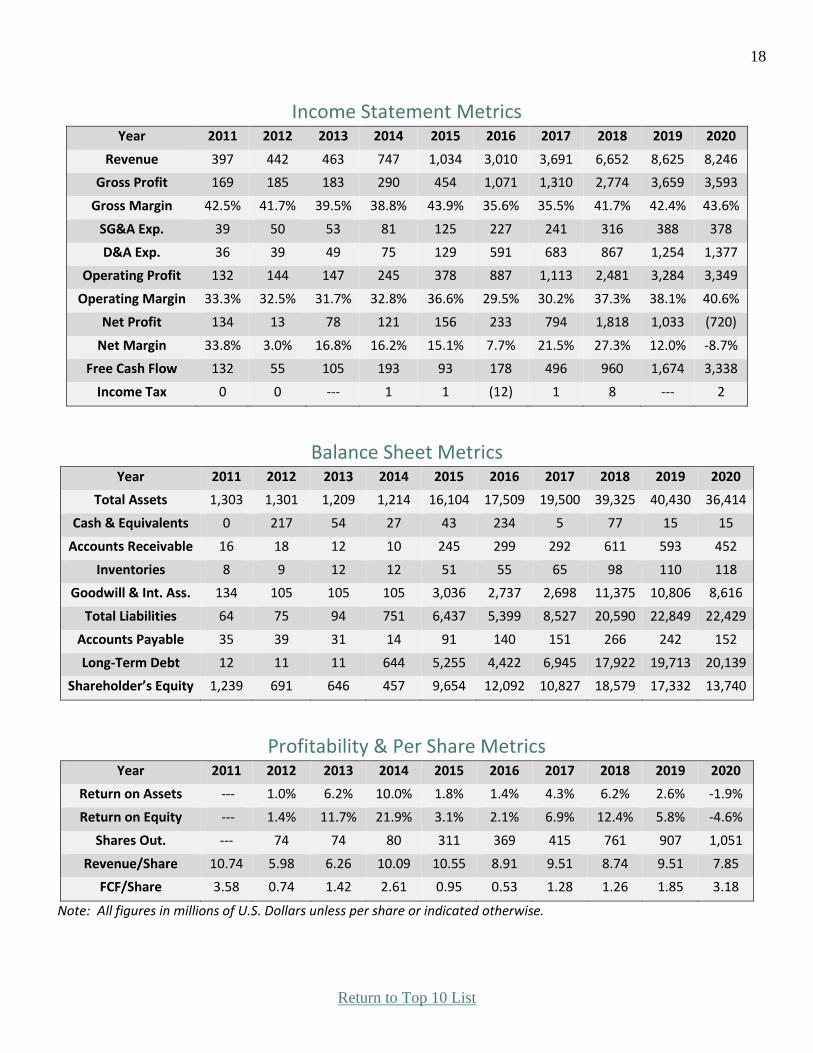
Income Statement Metrics Year 2011 2012 2013 2014 2015 2016 2017 2018 2019 2020
Revenue 397 442 463 747 1,034 3,010 3,691 6,652 8,625 8,246
Gross Profit 169 185 183 290 454 1,071 1,310 2,774 3,659 3,593
Gross Margin 42.5% 41.7% 39.5% 38.8% 43.9% 35.6% 35.5% 41.7% 42.4% 43.6%
SG&A Exp. 39 50 53 81 125 227 241 316 388 378
D&A Exp. 36 39 49 75 129 591 683 867 1,254 1,377
Operating Profit 132 144 147 245 378 887 1,113 2,481 3,284 3,349
Operating Margin 33.3% 32.5% 31.7% 32.8% 36.6% 29.5% 30.2% 37.3% 38.1% 40.6%
Net Profit 134 13 78 121 156 233 794 1,818 1,033 (720)
Net Margin 33.8% 3.0% 16.8% 16.2% 15.1% 7.7% 21.5% 27.3% 12.0% -8.7%
Free Cash Flow 132 55 105 193 93 178 496 960 1,674 3,338
Income Tax 0 0 --- 1 1 (12) 1 8 --- 2
Balance Sheet Metrics Year 2011 2012 2013 2014 2015 2016 2017 2018 2019 2020
Total Assets 1,303 1,301 1,209 1,214 16,104 17,509 19,500 39,325 40,430 36,414
Cash & Equivalents 0 217 54 27 43 234 5 77 15 15
Accounts Receivable 16 18 12 10 245 299 292 611 593 452
Inventories 8 9 12 12 51 55 65 98 110 118
Goodwill & Int. Ass. 134 105 105 105 3,036 2,737 2,698 11,375 10,806 8,616
Total Liabilities 64 75 94 751 6,437 5,399 8,527 20,590 22,849 22,429
Accounts Payable 35 39 31 14 91 140 151 266 242 152
Long-Term Debt 12 11 11 644 5,255 4,422 6,945 17,922 19,713 20,139
Shareholder’s Equity 1,239 691 646 457 9,654 12,092 10,827 18,579 17,332 13,740
Profitability & Per Share Metrics Year 2011 2012 2013 2014 2015 2016 2017 2018 2019 2020
Return on Assets --- 1.0% 6.2% 10.0% 1.8% 1.4% 4.3% 6.2% 2.6% -1.9%
Return on Equity --- 1.4% 11.7% 21.9% 3.1% 2.1% 6.9% 12.4% 5.8% -4.6%
Shares Out. --- 74 74 80 311 369 415 761 907 1,051
Revenue/Share 10.74 5.98 6.26 10.09 10.55 8.91 9.51 8.74 9.51 7.85
FCF/Share 3.58 0.74 1.42 2.61 0.95 0.53 1.28 1.26 1.85 3.18
Note: All figures in millions of U.S. Dollars unless per share or indicated otherwise.

19
Return to Top 10 List
20
Return to Top 10 List
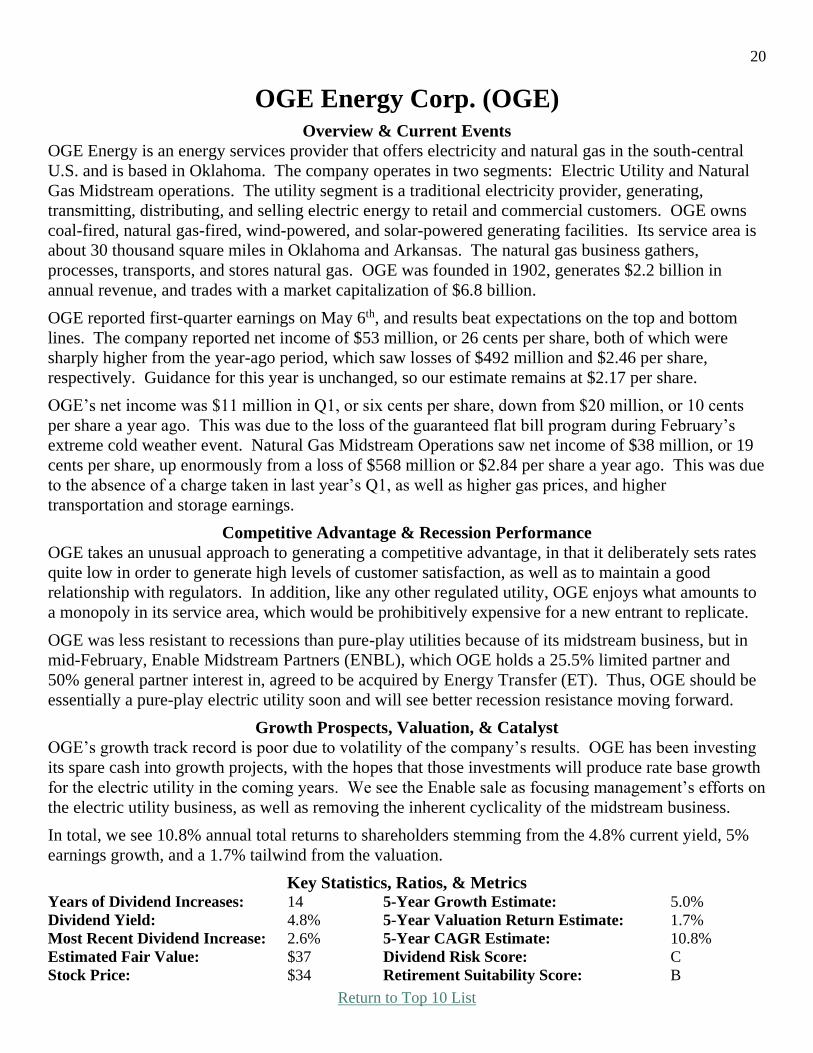
OGE Energy Corp. (OGE) Overview & Current Events
OGE Energy is an energy services provider that offers electricity and natural gas in the south-central
U.S. and is based in Oklahoma. The company operates in two segments: Electric Utility and Natural
Gas Midstream operations. The utility segment is a traditional electricity provider, generating,
transmitting, distributing, and selling electric energy to retail and commercial customers. OGE owns
coal-fired, natural gas-fired, wind-powered, and solar-powered generating facilities. Its service area is
about 30 thousand square miles in Oklahoma and Arkansas. The natural gas business gathers,
processes, transports, and stores natural gas. OGE was founded in 1902, generates $2.2 billion in
annual revenue, and trades with a market capitalization of $6.8 billion.
OGE reported first-quarter earnings on May 6th, and results beat expectations on the top and bottom
lines. The company reported net income of $53 million, or 26 cents per share, both of which were
sharply higher from the year-ago period, which saw losses of $492 million and $2.46 per share,
respectively. Guidance for this year is unchanged, so our estimate remains at $2.17 per share.
OGE’s net income was $11 million in Q1, or six cents per share, down from $20 million, or 10 cents
per share a year ago. This was due to the loss of the guaranteed flat bill program during February’s
extreme cold weather event. Natural Gas Midstream Operations saw net income of $38 million, or 19
cents per share, up enormously from a loss of $568 million or $2.84 per share a year ago. This was due
to the absence of a charge taken in last year’s Q1, as well as higher gas prices, and higher
transportation and storage earnings.
Competitive Advantage & Recession Performance
OGE takes an unusual approach to generating a competitive advantage, in that it deliberately sets rates
quite low in order to generate high levels of customer satisfaction, as well as to maintain a good
relationship with regulators. In addition, like any other regulated utility, OGE enjoys what amounts to
a monopoly in its service area, which would be prohibitively expensive for a new entrant to replicate.
OGE was less resistant to recessions than pure-play utilities because of its midstream business, but in
mid-February, Enable Midstream Partners (ENBL), which OGE holds a 25.5% limited partner and
50% general partner interest in, agreed to be acquired by Energy Transfer (ET). Thus, OGE should be
essentially a pure-play electric utility soon and will see better recession resistance moving forward.
Growth Prospects, Valuation, & Catalyst
OGE’s growth track record is poor due to volatility of the company’s results. OGE has been investing
its spare cash into growth projects, with the hopes that those investments will produce rate base growth
for the electric utility in the coming years. We see the Enable sale as focusing management’s efforts on
the electric utility business, as well as removing the inherent cyclicality of the midstream business.
In total, we see 10.8% annual total returns to shareholders stemming from the 4.8% current yield, 5%
earnings growth, and a 1.7% tailwind from the valuation.
Key Statistics, Ratios, & Metrics Years of Dividend Increases: 14 5-Year Growth Estimate: 5.0%
Dividend Yield: 4.8% 5-Year Valuation Return Estimate: 1.7%
Most Recent Dividend Increase: 2.6% 5-Year CAGR Estimate: 10.8%
Estimated Fair Value: $37 Dividend Risk Score: C
Stock Price: $34 Retirement Suitability Score: B

21
Return to Top 10 List
Income Statement Metrics Year 2011 2012 2013 2014 2015 2016 2017 2018 2019 2020
Revenue 3,916 3,671 2,868 2,453 2,197 2,259 2,261 2,270 2,232 2,122
Gross Profit 1,057 1,151 950 907 880 941 905 903 953 1,015
Gross Margin 27.0% 31.4% 33.1% 37.0% 40.1% 41.7% 40.0% 39.8% 42.7% 47.8%
D&A Exp. 308 375 299 281 308 323 284 322 355 391
Operating Profit 650 669 554 537 481 531 532 490 504 522
Operating Margin 16.6% 18.2% 19.3% 21.9% 21.9% 23.5% 23.5% 21.6% 22.6% 24.6%
Net Profit 343 355 388 396 271 338 619 426 434 (174)
Net Margin 8.8% 9.7% 13.5% 16.1% 12.3% 15.0% 27.4% 18.7% 19.4% -8.2%
Free Cash Flow (437) (105) (367) 152 319 (15) (40) 378 46 62
Income Tax 161 135 130 173 97 148 (49) 72 30 (127)
Balance Sheet Metrics Year 2011 2012 2013 2014 2015 2016 2017 2018 2019 2020
Total Assets 8,906 9,922 9,135 9,528 9,581 9,940 10,413 10,749 11,024 10,719
Cash & Equivalents 5 2 7 6 75 0 14 94 --- 1
Acc. Receivable 323 295 192 194 175 176 191 175 154 158
Inventories 188 174 155 137 194 162 165 184 137 153
Goodwill & Int. 176 167 --- --- --- --- --- --- --- ---
Total Liabilities 6,087 6,850 6,098 6,283 6,255 6,496 6,562 6,744 6,885 7,087
Accounts Payable 388 397 251 179 263 205 230 239 195 252
Long-Term Debt 3,014 3,280 2,840 2,853 2,739 2,867 3,168 3,147 3,307 3,589
Total Equity 2,563 2,767 3,037 3,244 3,326 3,444 3,851 4,005 4,140 3,632
D/E Ratio 1.18 1.19 0.94 0.88 0.82 0.83 0.82 0.79 0.80 0.99
Profitability & Per Share Metrics Year 2011 2012 2013 2014 2015 2016 2017 2018 2019 2020
Return on Assets 4.1% 3.8% 4.1% 4.2% 2.8% 3.5% 6.1% 4.0% 4.0% -1.6%
Return on Equity 14.1% 13.3% 13.4% 12.6% 8.3% 10.0% 17.0% 10.8% 10.6% -4.5%
ROIC 6.4% 5.8% 6.3% 6.6% 4.5% 5.5% 9.3% 6.0% 5.9% -2.4%
Shares Out. 198.5 198.1 199.4 199.9 199.6 199.9 200.0 200.5 200.7 200.1
Revenue/Share 19.73 18.53 14.38 12.27 11.01 11.30 11.31 11.32 11.12 10.61
FCF/Share (2.20) (0.53) (1.84) 0.76 1.60 (0.08) (0.20) 1.88 0.23 0.31
Note: All figures in millions of U.S. Dollars unless per share or indicated otherwise.

22
Return to Top 10 List
23
Return to Top 10 List
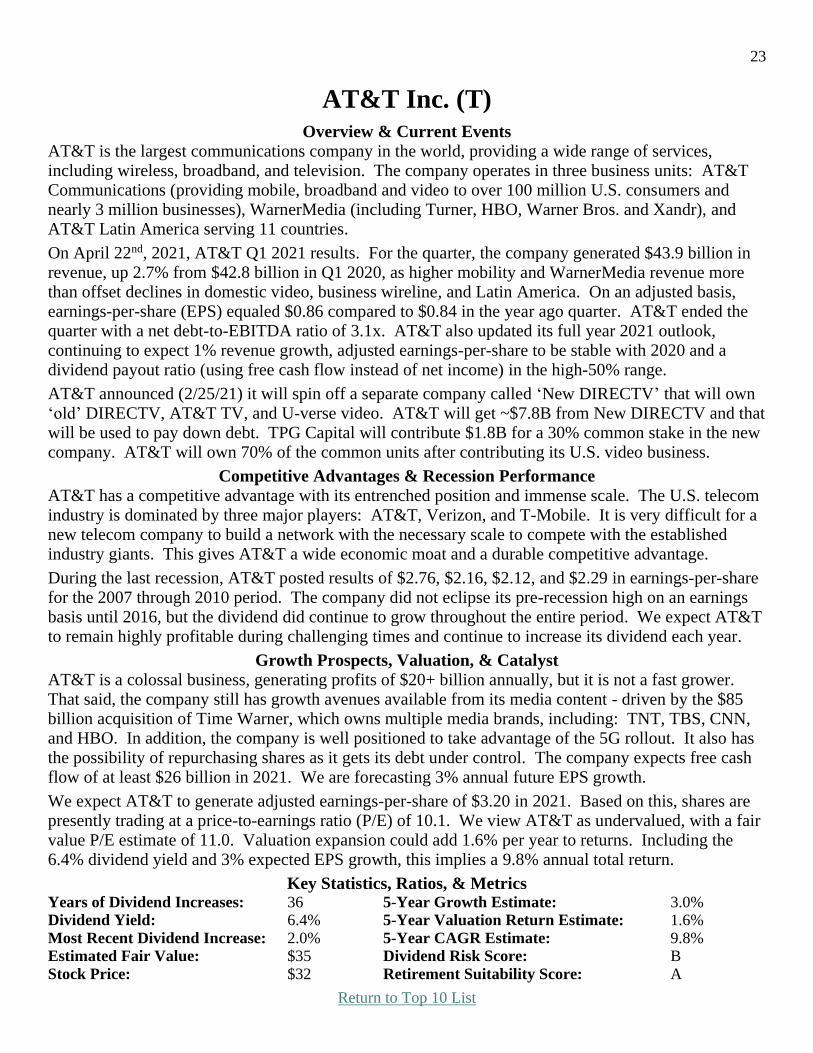
AT&T Inc. (T) Overview & Current Events
AT&T is the largest communications company in the world, providing a wide range of services, including wireless, broadband, and television. The company operates in three business units: AT&T Communications (providing mobile, broadband and video to over 100 million U.S. consumers and nearly 3 million businesses), WarnerMedia (including Turner, HBO, Warner Bros. and Xandr), and AT&T Latin America serving 11 countries.
On April 22nd, 2021, AT&T Q1 2021 results. For the quarter, the company generated $43.9 billion in revenue, up 2.7% from $42.8 billion in Q1 2020, as higher mobility and WarnerMedia revenue more than offset declines in domestic video, business wireline, and Latin America. On an adjusted basis, earnings-per-share (EPS) equaled $0.86 compared to $0.84 in the year ago quarter. AT&T ended the quarter with a net debt-to-EBITDA ratio of 3.1x. AT&T also updated its full year 2021 outlook, continuing to expect 1% revenue growth, adjusted earnings-per-share to be stable with 2020 and a dividend payout ratio (using free cash flow instead of net income) in the high-50% range.
AT&T announced (2/25/21) it will spin off a separate company called ‘New DIRECTV’ that will own ‘old’ DIRECTV, AT&T TV, and U-verse video. AT&T will get ~$7.8B from New DIRECTV and that will be used to pay down debt. TPG Capital will contribute $1.8B for a 30% common stake in the new company. AT&T will own 70% of the common units after contributing its U.S. video business.
Competitive Advantages & Recession Performance
AT&T has a competitive advantage with its entrenched position and immense scale. The U.S. telecom industry is dominated by three major players: AT&T, Verizon, and T-Mobile. It is very difficult for a new telecom company to build a network with the necessary scale to compete with the established industry giants. This gives AT&T a wide economic moat and a durable competitive advantage.
During the last recession, AT&T posted results of $2.76, $2.16, $2.12, and $2.29 in earnings-per-share for the 2007 through 2010 period. The company did not eclipse its pre-recession high on an earnings basis until 2016, but the dividend did continue to grow throughout the entire period. We expect AT&T to remain highly profitable during challenging times and continue to increase its dividend each year.
Growth Prospects, Valuation, & Catalyst
AT&T is a colossal business, generating profits of $20+ billion annually, but it is not a fast grower. That said, the company still has growth avenues available from its media content - driven by the $85 billion acquisition of Time Warner, which owns multiple media brands, including: TNT, TBS, CNN, and HBO. In addition, the company is well positioned to take advantage of the 5G rollout. It also has the possibility of repurchasing shares as it gets its debt under control. The company expects free cash flow of at least $26 billion in 2021. We are forecasting 3% annual future EPS growth.
We expect AT&T to generate adjusted earnings-per-share of $3.20 in 2021. Based on this, shares are presently trading at a price-to-earnings ratio (P/E) of 10.1. We view AT&T as undervalued, with a fair value P/E estimate of 11.0. Valuation expansion could add 1.6% per year to returns. Including the 6.4% dividend yield and 3% expected EPS growth, this implies a 9.8% annual total return.
Key Statistics, Ratios, & Metrics Years of Dividend Increases: 36 5-Year Growth Estimate: 3.0%
Dividend Yield: 6.4% 5-Year Valuation Return Estimate: 1.6%
Most Recent Dividend Increase: 2.0% 5-Year CAGR Estimate: 9.8% Estimated Fair Value: $35 Dividend Risk Score: B Stock Price: $32 Retirement Suitability Score: A

24
Return to Top 10 List
Income Statement Metrics Year 2011 2012 2013 2014 2015 2016 2017 2018 2019 2020
Revenue ($B) 126.7 127.4 128.8 132.4 146.8 163.8 160.5 170.8 181.2 171.8
Gross Profit 71819 72206 77561 72302 79755 86596 82736 91337 97052 91840
Gross Margin 56.7% 56.7% 60.2% 54.6% 54.3% 52.9% 51.5% 53.5% 53.6% 53.5%
SG&A Exp. 41314 41066 28414 39697 32919 36845 35465 36765 39422 38039
D&A Exp. 18377 18143 18395 18273 22016 25847 24387 28430 28217 28516
Operating Profit 12128 12997 30752 14332 24820 23904 22884 26142 29413 25285
Op. Margin 9.6% 10.2% 23.9% 10.8% 16.9% 14.6% 14.3% 15.3% 16.2% 14.7%
Net Profit 3944 7264 18418 6442 13345 12976 29450 19370 13903 -5176
Net Margin 3.1% 5.7% 14.3% 4.9% 9.1% 7.9% 18.3% 11.3% 7.7% -3.0%
Free Cash Flow 14633 19711 13852 10139 16662 16926 17363 22844 29233 27455
Income Tax 2532 2900 9328 3619 7005 6479 -14708 4920 3493 965
Balance Sheet Metrics
Year 2011 2012 2013 2014 2015 2016 2017 2018 2019 2020
Total Assets ($B) 270.4 272.3 277.8 296.8 402.7 403.8 444.1 531.9 551.7 525.8
Cash & Equivalents 3045 4868 3339 8603 5121 5788 50498 5204 12130 9740
Acc. Receivable 13231 12657 12918 14527 16532 16794 16522 26472 22636 20215
Goodwill/Int. ($B) 130.2 128.5 131.5 136.7 225.3 222.1 219.7 310.2 303.9 281.6
Total Liab. ($B) 164.6 179.6 186.3 206.6 279.0 279.7 302.1 338.0 349.7 346.5
Accounts Payable 10485 12076 11561 14984 21047 22027 24439 27018 29640 49032
LT Debt ($B) 64.8 69.8 74.8 81.8 126.2 123.5 164.3 176.5 161.1 157.2
Total Equity ($B) 105.5 92.4 91.0 89.7 122.7 123.1 140.9 184.1 184.2 161.7
D/E Ratio 0.61 0.76 0.82 0.91 1.03 1.00 1.17 0.96 0.87 0.97
Profitability & Per Share Metrics
Year 2011 2012 2013 2014 2015 2016 2017 2018 2019 2020
Return on Assets 1.5% 2.7% 6.7% 2.2% 3.8% 3.2% 6.9% 4.0% 2.6% -1.0%
Return on Equity 3.6% 7.3% 20.1% 7.1% 12.6% 10.6% 22.3% 11.9% 7.5% -3.0%
ROIC 2.3% 4.4% 11.2% 3.8% 6.3% 5.2% 10.6% 5.7% 3.8% -1.5%
Shares Out. 5950 5821 5385 5221 5646 6189 6183 6806 7348 7183
Revenue/Share 21.30 21.89 23.91 25.37 26.00 26.46 25.97 25.09 24.66 23.91
FCF/Share 2.46 3.39 2.57 1.94 2.95 2.73 2.81 3.36 3.98 3.82
Note: All relevant figures in millions of U.S. Dollars unless per share or indicated otherwise.

25
Return to Top 10 List

26
Return to Top 10 List
Verizon Communications Inc. (VZ) Overview & Current Events
Verizon Communications was created by a merger between Bell Atlantic Corp and GTE Corp in June
2000. Verizon is one of the largest wireless carriers in the country. Wireless contributes three-quarters
of all revenues, while broadband and cable services account for about a quarter of sales. The
company’s network covers ~300 million people and 98% of the U.S, as it continues 5G service rollout.
Verizon reported first-quarter earnings results on April 21st. Revenue grew 4.1% to $32.9 billion,
beating expectations by $440 million. Adjusted earnings-per-share (EPS) of $1.31 grew 4% from the
prior year and beat estimates by $0.02 per share. The company had postpaid phone net losses of 178K
versus estimates of 41.8K, and wireless postpaid net losses of 170K versus estimates of 82.1K. Still,
revenue for the consumer segment grew 4.7% to $22.8 billion, primarily due to Fios net additions of
98K. Business revenue returned to growth, up 1.3% to $7.8 billion due to strong postpaid net
additions. Free cash flow increased 44% to $5.2 billion due to a combination of lower capital
expenditures and higher cash flow from operations.
Verizon reaffirmed its guidance for adjusted earnings-per-share of $5.00 to $5.15 for the year.
Competitive Advantages & Recession Performance
One of Verizon’s key competitive advantages is that it is often considered the best wireless carrier in
the U.S. This is evidenced by the company’s wireless net additions and very low churn rate. This
reliable service allows Verizon to maintain its customer base as well as give the company an
opportunity to move customers to higher-priced plans. Verizon is also in the early stages of rolling out
5G service, which will give it an advantage over other carriers. Another advantage for Verizon is the
stock’s ability to withstand a downturn in the market.
During the last recession Verizon posted earnings-per-share of $2.54, $2.40, $2.21, $2.15, and $2.32
during the 2008 through 2012 stretch. Meanwhile, the dividend continued increasing. Verizon
remained highly profitable in 2020 and raised its dividend, even in the coronavirus pandemic.
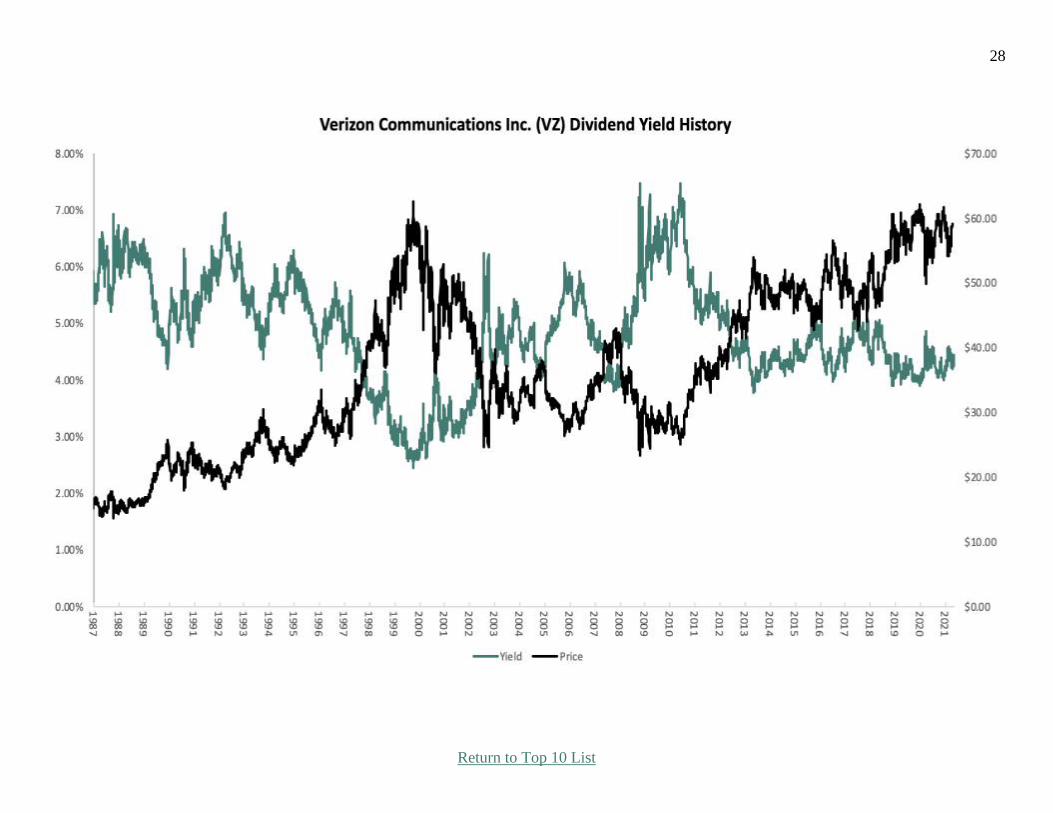
Growth Prospects, Valuation, & Catalyst
Verizon grew its adjusted earnings-per-share by an annual compound growth rate of 9.6% from 2011
through 2021; however, the rate has slowed significantly since 2013. Much of this improvement has
come from an increasing net profit margin, as the top line has advanced at a slow rate and the share
count remains stable. In addition, recent tax reform has resulted in a materially lower tax rate since
2018. Moving forward we are projecting 4% annual EPS growth over the next five years.
We expect Verizon to generate adjusted earnings-per-share of $5.08 for 2021. Based on this, the stock
is presently trading at a price-to-earnings ratio (P/E) of 11.6. Our fair value estimate is a P/E of 13.0,
which means expansion of the P/E multiple could add 2.3% annually to returns. When combined with
the 4.0% expected EPS growth rate and the 4.3% dividend yield, this implies the potential for 9.7%
total annual returns over the next five years.
Key Statistics, Ratios, & Metrics Years of Dividend Increases: 14 5-Year Growth Estimate: 4.0%
Dividend Yield: 4.3% 5-Year Valuation Return Estimate: 2.3%
Most Recent Dividend Increase: 2.0% 5-Year CAGR Estimate: 9.7%
Estimated Fair Value: $66 Dividend Risk Score: B
Stock Price: $59 Retirement Suitability Score: A

27
Return to Top 10 List
Income Statement Metrics Year 2011 2012 2013 2014 2015 2016 2017 2018 2019 2020
Revenue ($B) 110.9 115.8 120.6 127.1 131.6 126.0 126.0 130.9 131.9 128.3
Gross Profit 65000 69571 75663 77148 79063 73279 72971 75355 77142 77091
Gross Margin 58.6% 60.1% 62.8% 60.7% 60.1% 58.2% 57.9% 57.6% 58.5% 60.1%
SG&A Exp. 35624 39951 27089 41016 29986 27095 26818 31083 29990 31573
D&A Exp. 16496 16460 16606 16533 16017 15928 16954 17403 16682 16720
Op. Profit 12880 13160 31968 19599 33060 30256 29199 26869 30470 28798
Op. Margin 11.6% 11.4% 26.5% 15.4% 25.1% 24.0% 23.2% 20.5% 23.1% 22.4%
Net Profit 2404 875 11497 9625 17879 13127 30101 15528 19265 17801
Net Margin 2.2% 0.8% 9.5% 7.6% 13.6% 10.4% 23.9% 11.9% 14.6% 13.9%
Free Cash Flow 13315 11013 21634 13086 11310 4096 6488 16252 16909 21450
Income Tax 285 -660 5730 3314 9865 7378 -9956 3584 2945 5619
Balance Sheet Metrics Year 2011 2012 2013 2014 2015 2016 2017 2018 2019 2020
Total Assets ($B) 230.5 225.2 274.1 232.6 244.2 244.2 257.1 264.8 291.7 316.5
Cash & Equiv. 13362 3093 53528 10598 4470 2880 2079 2745 2594 22171
Acc. Receivable 11776 12576 12439 13993 13457 17513 23493 25102 25429 23917
Inventories 940 1075 1020 1153 1252 1202 1034 1336 1422 1796
Goodwill ($B) 102.5 107.8 106.2 105.7 119.5 122.8 127.8 128.5 128.9 130.3
Total Liab. ($B) 144.6 139.7 178.7 218.9 226.3 220.1 212.5 210.1 228.9 247.2
Accts Payable 4194 4454 4954 5598 5700 7084 7063 7232 7725 6667
LT Debt ($B) 55.2 52.0 93.6 113.3 109.7 108.1 117.1 113.1 110.4 129.1
Total Equity 35970 33157 38836 12298 16428 22524 43096 53145 61395 67842
D/E Ratio 1.5 1.6 2.4 9.2 6.7 4.8 2.7 2.1 1.8 1.9
Profitability & Per Share Metrics Year 2011 2012 2013 2014 2015 2016 2017 2018 2019 2020
Return on Assets 1.1% 0.4% 4.6% 3.8% 7.5% 5.4% 12.0% 5.9% 6.9% 5.9%
Return on Equity 6.5% 2.5% 31.9% 37.6% 124% 67.4% 91.7% 32.3% 33.6% 27.5%
ROIC 1.7% 0.6% 7.0% 6.1% 14.0% 10.1% 20.5% 9.4% 11.3% 9.6%
Shares Out. 2839 2862 2874 3981 4093 4086 4089 4132 4140 4142
Revenue/Share 39.05 40.48 41.95 31.92 32.16 30.83 30.82 31.67 31.85 30.97
FCF/Share 4.69 3.85 7.53 3.29 2.76 1.00 1.59 3.93 4.08 5.18
Note: All figures in millions of U.S. Dollars unless per share or indicated otherwise.
28
Return to Top 10 List
29
Return to Top 10 List
AbbVie Inc. (ABBV) Overview & Current Events
AbbVie is a pharmaceutical company spun off by Abbott Laboratories (ABT) in 2013. Its most
important product is Humira which is a multi-purpose pharmaceutical product and was the top-selling
drug in the world. Humira is now facing biosimilar competition in Europe, which has had a noticeable
impact on the company. It will lose patent protection in the U.S. in 2023.
AbbVie reported its first-quarter earnings results on April 30th. Revenue of $13 billion increased 51%
from the same quarter last year. Revenue beat analyst estimates by $230 million. The Allergan
acquisition was the major driver of growth. Earnings-per-share (EPS) of $2.95 increased 22% year-
over-year, and also beat analyst estimates by $0.12 per share. The company also raised guidance for
the remainder of the year. AbbVie now expects adjusted earnings-per-share in a range of $12.37 to
$12.57. At the midpoint of guidance, adjusted EPS would increase 18% for 2021.
Competitive Advantages & Recession Performance
AbbVie’s major risk is loss of exclusivity for Humira. Fortunately, the company’s massive research
and development platform is a competitive advantage. Research and development expenses totaled
$6.5 billion in 2020. AbbVie has multiple growth opportunities to replace Humira, particularly in the
therapeutic areas of immunology, hematology, and neuroscience.
AbbVie was not a standalone company during the last financial crisis, so there is no recession track
record, but since sick people require treatment whether the economy is strong or not, it is highly likely
that AbbVie would continue to perform well during a recession. AbbVie’s earnings are likely to
decline somewhat in a recession, but the dividend should remain secure. AbbVie has a projected
dividend payout ratio of 42% for 2021.
Growth Prospects, Valuation, & Catalyst
Despite the challenge posed by loss of exclusivity on Humira, we believe AbbVie has long-term
growth potential. First, it has invested heavily in building its pipeline of new products. For example,
AbbVie has seen strong growth from Skyrizi which grew sales by 89% last quarter, while Rinvoq
revenue more than doubled year-over-year. AbbVie also completed the $63 billion acquisition of
Allergan. Allergan’s flagship product, Botox, diversifies AbbVie’s portfolio into aesthetics. AbbVie’s
aesthetics portfolio generated revenue of $1.1 billion in the first quarter, up 35% year-over-year.
Based on expected 2021 earnings-per-share of $12.47, AbbVie trades for a price-to-earnings ratio (P/E)
of 9.3. Our fair value estimate for AbbVie is a P/E of 10. An expanding P/E multiple could boost
shareholder returns by approximately 1.4% per year over the next five years. In addition, we expect
annual earnings growth of 3.0%, while the stock has a 4.5% dividend yield. We expect total annual
returns of 8.5% per year over the next five years.
Key Statistics, Ratios, & Metrics Years of Dividend Increases: 495 5-Year Growth Estimate: 3.0%
Dividend Yield: 4.5% 5-Year Valuation Return Estimate: 1.4%
Most Recent Dividend Increase: 10.2% 5-Year CAGR Estimate: 8.5%
Estimated Fair Value: $125 Dividend Risk Score: A
Stock Price: $116 Retirement Suitability Score: A
5 Including years as a wholly-owned subsidiary of Abbott Laboratories (ABT)
30
Return to Top 10 List
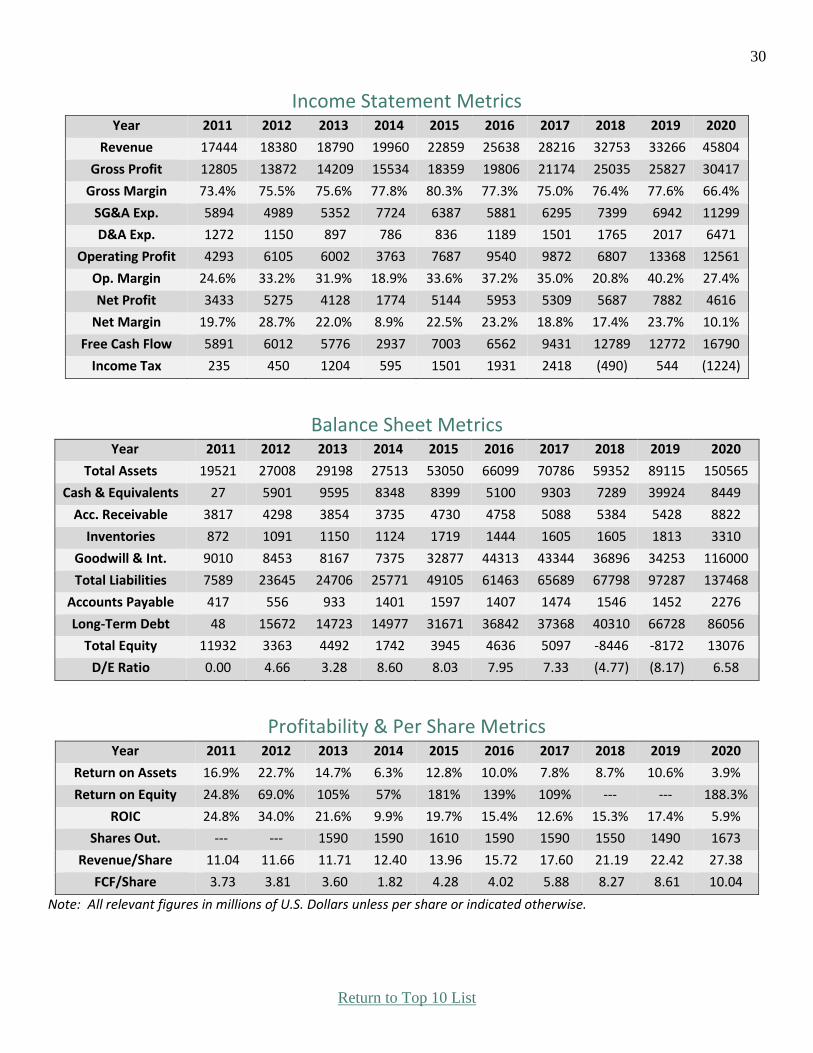
Income Statement Metrics Year 2011 2012 2013 2014 2015 2016 2017 2018 2019 2020
Revenue 17444 18380 18790 19960 22859 25638 28216 32753 33266 45804
Gross Profit 12805 13872 14209 15534 18359 19806 21174 25035 25827 30417
Gross Margin 73.4% 75.5% 75.6% 77.8% 80.3% 77.3% 75.0% 76.4% 77.6% 66.4%
SG&A Exp. 5894 4989 5352 7724 6387 5881 6295 7399 6942 11299
D&A Exp. 1272 1150 897 786 836 1189 1501 1765 2017 6471
Operating Profit 4293 6105 6002 3763 7687 9540 9872 6807 13368 12561
Op. Margin 24.6% 33.2% 31.9% 18.9% 33.6% 37.2% 35.0% 20.8% 40.2% 27.4%
Net Profit 3433 5275 4128 1774 5144 5953 5309 5687 7882 4616
Net Margin 19.7% 28.7% 22.0% 8.9% 22.5% 23.2% 18.8% 17.4% 23.7% 10.1%
Free Cash Flow 5891 6012 5776 2937 7003 6562 9431 12789 12772 16790
Income Tax 235 450 1204 595 1501 1931 2418 (490) 544 (1224)
Balance Sheet Metrics Year 2011 2012 2013 2014 2015 2016 2017 2018 2019 2020
Total Assets 19521 27008 29198 27513 53050 66099 70786 59352 89115 150565
Cash & Equivalents 27 5901 9595 8348 8399 5100 9303 7289 39924 8449
Acc. Receivable 3817 4298 3854 3735 4730 4758 5088 5384 5428 8822
Inventories 872 1091 1150 1124 1719 1444 1605 1605 1813 3310
Goodwill & Int. 9010 8453 8167 7375 32877 44313 43344 36896 34253 116000
Total Liabilities 7589 23645 24706 25771 49105 61463 65689 67798 97287 137468
Accounts Payable 417 556 933 1401 1597 1407 1474 1546 1452 2276
Long-Term Debt 48 15672 14723 14977 31671 36842 37368 40310 66728 86056
Total Equity 11932 3363 4492 1742 3945 4636 5097 -8446 -8172 13076
D/E Ratio 0.00 4.66 3.28 8.60 8.03 7.95 7.33 (4.77) (8.17) 6.58
Profitability & Per Share Metrics Year 2011 2012 2013 2014 2015 2016 2017 2018 2019 2020
Return on Assets 16.9% 22.7% 14.7% 6.3% 12.8% 10.0% 7.8% 8.7% 10.6% 3.9%
Return on Equity 24.8% 69.0% 105% 57% 181% 139% 109% --- --- 188.3%
ROIC 24.8% 34.0% 21.6% 9.9% 19.7% 15.4% 12.6% 15.3% 17.4% 5.9%
Shares Out. --- --- 1590 1590 1610 1590 1590 1550 1490 1673
Revenue/Share 11.04 11.66 11.71 12.40 13.96 15.72 17.60 21.19 22.42 27.38
FCF/Share 3.73 3.81 3.60 1.82 4.28 4.02 5.88 8.27 8.61 10.04
Note: All relevant figures in millions of U.S. Dollars unless per share or indicated otherwise.

31
Return to Top 10 List

32
Return to Top 10 List
Altria Group Inc. (MO) Overview & Current Events
Altria sells cigarettes, chewing tobacco, cigars, e-cigarettes and wine under the Marlboro, Skoal,
Copenhagen, and St. Michelle brands, among others. The company also has a 10% equity stake in
Anheuser-Busch InBev (BUD), a 35% stake in e-cigarette maker Juul, and a 45% stake in the
marijuana company Cronos Group (CRON).
On 4/29/21, Altria reported first quarter FY21 results. Smokeable volumes declined by 11.6% year-
over-year while cigarette volumes declined by 12% year-over-year. That said, cigar volumes increased
by 11.1% and smokeless volumes increased by 0.6%, while wine volumes were up 1.7%. Management
also continued investing in ancillary non-smokeable businesses by acquiring the remaining 20% of on!
oral nicotine packages to give it full global ownership. Overall, the results were good enough for
management to reaffirm full-year earnings-per-share (EPS) guidance of $4.49-$4.62.
Competitive Advantages & Recession Performance
Altria has tremendous competitive advantages. It has the most valuable cigarette brand in the U.S.,
Marlboro, which commands greater than a 40% domestic retail share. This gives Altria the ability to
raise prices to drive revenue growth, as it has done for many years. Thanks to Altria’s stable growth,
the company increased its dividend for the 51st consecutive year in 2020. With a target dividend
payout ratio of 80% of annual adjusted EPS, we view the dividend as safe.
Another benefit of Altria’s business model is that it is highly resistant to recessions. Cigarette and
alcohol sales hold up very well during recessions, which keep Altria’s profitability and dividend
growth intact. Given Altria’s own exposure to cigarettes and now, e-cigarette products, in addition to
its sizable investment stake in AB-InBev, it should hold up very well during the next downturn.
Growth Prospects, Valuation, & Catalyst
Altria’s biggest risk is the declining U.S. smoking rate. In response, Altria has invested heavily in non-
combustible products, such as its $13 billion investment in e-cigarette leader Juul and its $1.8 billion
investment in Cronos. Altria also now fully owns Swiss company, Burger Söhne Group, for its tobacco
leaf-free on! oral nicotine pouches. Altria’s first-quarter retail share for oral nicotine pouches doubled
to ~13% versus a year ago, while the company estimates the oral nicotine pouch category volume in the
U.S. will grow at about a 25% CAGR through 2025. Altria is also aggressively expanding its own e-
cigarette brand IQOS. Lastly, share buybacks will be another catalyst for earnings-per-share growth.
Altria utilized $325 million for share repurchases in the first quarter and has $1.7 billion remaining on
its current repurchase program which it expects to complete by June 30th, 2022.
Based on expected 2021 earnings-per-share of $4.59, Altria stock trades for a price-to-earnings ratio of
10.8, compared with our fair value estimate of 11.0. Altria stock appears to be very slightly
undervalued, which could result in positive returns of 0.1% per year over the next five years. In
addition, we expect 2.3% annual EPS growth through 2026, and the stock has a high dividend yield of
7.2%. Taken together, Altria stock has total expected returns of 8.6% per year over the next five years.
Key Statistics, Ratios, & Metrics Years of Dividend Increases: 51 5-Year Growth Estimate: 2.3%
Dividend Yield: 7.2% 5-Year Valuation Return Estimate: 0.1%
Most Recent Dividend Increase: 2.4% 5-Year CAGR Estimate: 8.6%
Estimated Fair Value: $50 Dividend Risk Score: B
Stock Price: $50 Retirement Suitability Score: A

33
Return to Top 10 List
Income Statement Metrics Year 2011 2012 2013 2014 2015 2016 2017 2018 2019 2020
Revenue 16619 17500 17663 17945 18854 19337 19494 19627 19796 20841
Gross Profit 8939 9563 10457 10160 11114 11572 11963 12254 12711 13023
Gross Margin 53.8% 54.6% 59.2% 56.6% 58.9% 59.8% 61.4% 62.4% 64.2% 62.5%
SG&A Exp. 2643 2301 2340 2539 2708 2662 2338 2756 2226 2154
D&A Exp. 253 225 212 208 225 204 209 227 226 257
Operating Profit 6290 7314 8095 7619 8365 8910 9625 9498 10485 10869
Op. Margin 37.8% 41.8% 45.8% 42.5% 44.4% 46.1% 49.4% 48.4% 53.0% 52.2%
Net Profit 3390 4180 4535 5070 5241 14239 10222 6963 -1293 4467
Net Margin 20.4% 23.9% 25.7% 28.3% 27.8% 73.6% 52.4% 35.5% -6.5% 21.4%
Free Cash Flow 3476 3761 4244 4500 5614 3637 4702 8153 7591 8154
Income Tax 2189 2294 2407 2704 2835 7608 (399) 2374 2064 2436
Balance Sheet Metrics Year 2011 2012 2013 2014 2015 2016 2017 2018 2019 2020
Total Assets 36751 35329 34859 34475 31459 45932 43202 55459 49271 47414
Cash & Equivalents 3270 2900 3175 3321 2369 4569 1253 1333 2117 4945
Acc. Receivable 268 193 115 124 124 151 142 142 152 137
Inventories 1779 1746 1879 2040 2031 2051 2225 2331 2293 1966
Goodwill & Int. 17272 17252 17232 17334 17313 17321 17707 17475 17864 17792
Total Liabilities 33068 32159 30741 31465 28586 33159 27822 40670 42952 44489
Accounts Payable 503 451 409 416 400 425 374 399 325 380
Long-Term Debt 13689 13878 14517 14693 12847 13881 13894 25746 28042 29471
Total Equity 3680 3168 4119 3014 2880 12770 15377 14787 6222 2839
D/E Ratio 3.72 4.38 3.52 4.87 4.46 1.09 0.90 1.74 4.51 10.38
Profitability & Per Share Metrics Year 2011 2012 2013 2014 2015 2016 2017 2018 2019 2020
Return on Assets 9.1% 11.6% 12.9% 14.6% 15.9% 36.8% 22.9% 14.1% -2.5% 9.2%
Return on Equity 76.4% 122% 125% 142% 178% 182% 72.6% 46.2% -12.3% 98.6%
ROIC 19.5% 24.3% 25.4% 27.9% 31.4% 67.2% 36.6% 19.9% -3.5% 13.4%
Shares Out. 2044 2010 1994 1969 1960 1943 1901 1888 1860 1860
Revenue/Share 8.05 8.65 8.84 9.07 9.61 9.91 10.15 10.40 10.59 11.21
FCF/Share 1.68 1.86 2.12 2.28 2.86 1.86 2.45 4.32 4.06 4.39
Note: All figures in millions of U.S. Dollars unless per share or indicated otherwise.

34
Return to Top 10 List

35
Closing Thoughts - Understanding Cost Basis -
The cost basis is used to determine capital gains taxes. At its most basic level, the cost basis (also called tax basis) is the purchase price of a security. Cost basis is further adjusted for stock splits, returns of capital, and additional purchases including dividend reinvestment.
The purpose of cost basis is to see your total security cost so you can find your profit when you sell. Capital gains taxes are levied only on your profits. It’s worth emphasizing that capital gains taxes are only due when you sell. This has the advantage of allowing investors to choose the tax year in which they pay capital gains taxes based on the year in which they sell.
Distributions from BDCs, MLPs, and REITs often pay their distributions in part as returns of capital. Returns of capital are tax advantaged ways to pay distributions because they do not trigger a regular dividend tax. Instead, they reduce your cost basis.
Imagine your cost basis for an MLP is $10.00 per unit and that the company pays $0.80 of its $1.00 distribution as capital gains. The remaining $0.20 of the distribution would be taxed as ordinary income. The $0.80 in annual returns of capital would reduce your cost basis but not trigger a taxable event when the income is received6. After 5 years your cost basis would be down to $6.00 because you would’ve received $0.80 x 5 = $4.00 in return of capital distributions per unit which is subtracted from your original cost basis of $10.00 per unit to reduce it to $6.00 per unit.
Note that with a lower cost basis, your capital gains and therefore capital gains taxes would be higher when you sold. This makes MLPs attractive long-term investments from a tax minimization standpoint as they often pay 80% or so of their distributions as returns of capital. See our Tax Guide for more on the tax benefits and complications of MLPs
Cost basis is also closely linked with the idea of yield on cost. Yield on cost is calculated as an investment’s current dividend or distribution divided by its cost basis. Our Polaris (PII) recommendation is a good example of yield on cost.
Polaris has a current dividend yield of ~1.8% and a share price of ~$1417. When we recommended Polaris in the April 2020 edition of The Sure Retirement Newsletter it had a dividend yield of 4.3% and investors could buy it around $55/share shortly after the newsletter was published. With a current dividend of $2.52 per share, investors who purchased at $55/share would have a $2.52 / $55 = 4.6% yield on cost today because Polaris has slightly increased its dividend since our recommendation. The Polaris example highlights the difference between current yield and yield on cost when share price rises dramatically. The opposite occurs (current yield is greater than yield on cost) when share prices fall below your cost basis.
Thanks, Ben Reynolds
The next Sure Retirement Newsletter publishes on Sunday, June 13th, 2021
6 The exception to this rule is in the event that the return on capital would reduce your cost basis below 0. For returns on capital when
your cost basis is already 0, you would owe long-term capital gains taxes on the return on capital portion of the distribution in that tax
year, assuming a long-term holding (which would virtually always be the case to have accrued that much return on capital). 7 Prices from market close 5/5/21
36
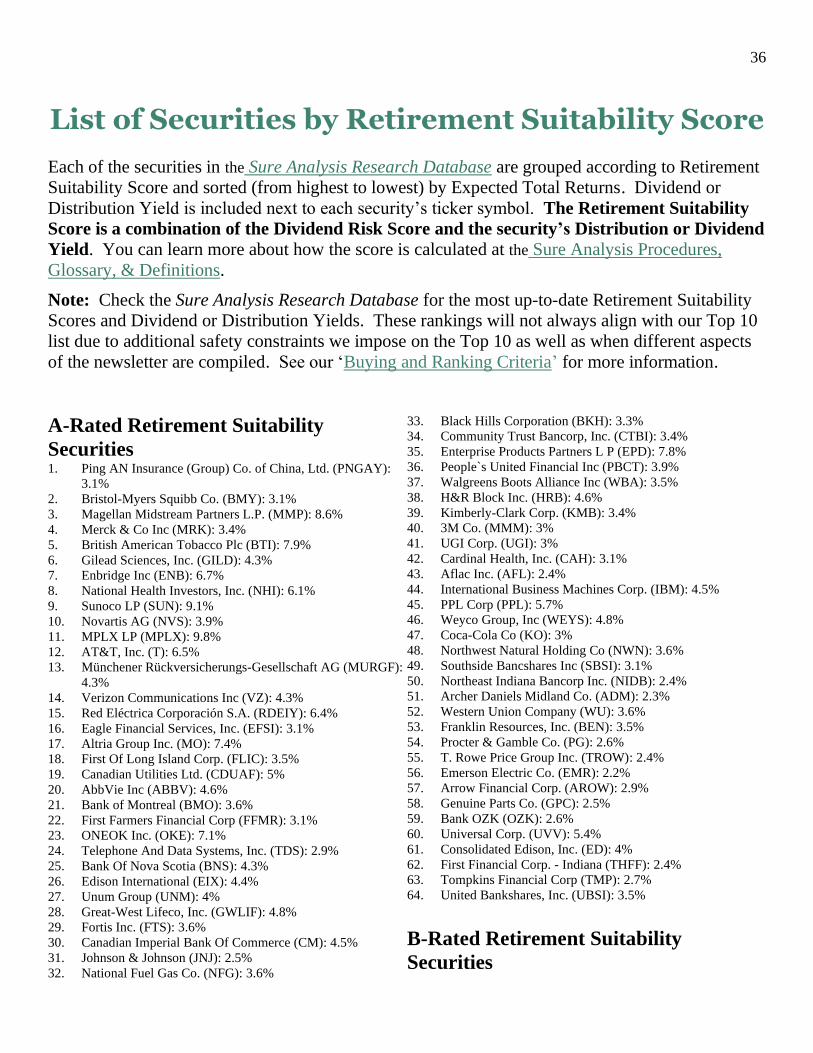
List of Securities by Retirement Suitability Score
Each of the securities in the Sure Analysis Research Database are grouped according to Retirement
Suitability Score and sorted (from highest to lowest) by Expected Total Returns. Dividend or
Distribution Yield is included next to each security’s ticker symbol. The Retirement Suitability
Score is a combination of the Dividend Risk Score and the security’s Distribution or Dividend
Yield. You can learn more about how the score is calculated at the Sure Analysis Procedures,
Glossary, & Definitions.
Note: Check the Sure Analysis Research Database for the most up-to-date Retirement Suitability
Scores and Dividend or Distribution Yields. These rankings will not always align with our Top 10
list due to additional safety constraints we impose on the Top 10 as well as when different aspects
of the newsletter are compiled. See our ‘Buying and Ranking Criteria’ for more information.
A-Rated Retirement Suitability
Securities 1. Ping AN Insurance (Group) Co. of China, Ltd. (PNGAY):
3.1%
2. Bristol-Myers Squibb Co. (BMY): 3.1%
3. Magellan Midstream Partners L.P. (MMP): 8.6%
4. Merck & Co Inc (MRK): 3.4%
5. British American Tobacco Plc (BTI): 7.9%
6. Gilead Sciences, Inc. (GILD): 4.3%
7. Enbridge Inc (ENB): 6.7%
8. National Health Investors, Inc. (NHI): 6.1%
9. Sunoco LP (SUN): 9.1%
10. Novartis AG (NVS): 3.9%
11. MPLX LP (MPLX): 9.8%
12. AT&T, Inc. (T): 6.5%
13. Münchener Rückversicherungs-Gesellschaft AG (MURGF):
4.3%
14. Verizon Communications Inc (VZ): 4.3%
15. Red Eléctrica Corporación S.A. (RDEIY): 6.4%
16. Eagle Financial Services, Inc. (EFSI): 3.1%
17. Altria Group Inc. (MO): 7.4%
18. First Of Long Island Corp. (FLIC): 3.5%
19. Canadian Utilities Ltd. (CDUAF): 5%
20. AbbVie Inc (ABBV): 4.6%
21. Bank of Montreal (BMO): 3.6%
22. First Farmers Financial Corp (FFMR): 3.1%
23. ONEOK Inc. (OKE): 7.1%
24. Telephone And Data Systems, Inc. (TDS): 2.9%
25. Bank Of Nova Scotia (BNS): 4.3%
26. Edison International (EIX): 4.4%
27. Unum Group (UNM): 4%
28. Great-West Lifeco, Inc. (GWLIF): 4.8%
29. Fortis Inc. (FTS): 3.6%
30. Canadian Imperial Bank Of Commerce (CM): 4.5%
31. Johnson & Johnson (JNJ): 2.5%
32. National Fuel Gas Co. (NFG): 3.6%
33. Black Hills Corporation (BKH): 3.3%
34. Community Trust Bancorp, Inc. (CTBI): 3.4%
35. Enterprise Products Partners L P (EPD): 7.8%
36. People`s United Financial Inc (PBCT): 3.9%
37. Walgreens Boots Alliance Inc (WBA): 3.5%
38. H&R Block Inc. (HRB): 4.6%
39. Kimberly-Clark Corp. (KMB): 3.4%
40. 3M Co. (MMM): 3%
41. UGI Corp. (UGI): 3%
42. Cardinal Health, Inc. (CAH): 3.1%
43. Aflac Inc. (AFL): 2.4%
44. International Business Machines Corp. (IBM): 4.5%
45. PPL Corp (PPL): 5.7%
46. Weyco Group, Inc (WEYS): 4.8%
47. Coca-Cola Co (KO): 3%
48. Northwest Natural Holding Co (NWN): 3.6%
49. Southside Bancshares Inc (SBSI): 3.1%
50. Northeast Indiana Bancorp Inc. (NIDB): 2.4%
51. Archer Daniels Midland Co. (ADM): 2.3%
52. Western Union Company (WU): 3.6%
53. Franklin Resources, Inc. (BEN): 3.5%
54. Procter & Gamble Co. (PG): 2.6%
55. T. Rowe Price Group Inc. (TROW): 2.4%
56. Emerson Electric Co. (EMR): 2.2%
57. Arrow Financial Corp. (AROW): 2.9%
58. Genuine Parts Co. (GPC): 2.5%
59. Bank OZK (OZK): 2.6%
60. Universal Corp. (UVV): 5.4%
61. Consolidated Edison, Inc. (ED): 4%
62. First Financial Corp. - Indiana (THFF): 2.4%
63. Tompkins Financial Corp (TMP): 2.7%
64. United Bankshares, Inc. (UBSI): 3.5%
B-Rated Retirement Suitability
Securities
37
1. Interpublic Group Of Cos., Inc. (IPG): 3.3%
2. Geo Group, Inc. (GEO): 17.5%
3. Perrigo Company plc (PRGO): 2.3%
4. Triton International Ltd (TRTN): 4.4%
5. Suburban Propane Partners LP (SPH): 8.1%
6. Phillips 66 Partners LP (PSXP): 10.2%
7. Energy Transfer LP (ET): 6.9%
8. Lockheed Martin Corp. (LMT): 2.7%
9. Brookfield Infrastructure Partners L.P (BIP): 3.9%
10. Holly Energy Partners L.P. (HEP): 6.8%
11. Oge Energy Corp. (OGE): 4.9%
12. New Residential Investment Corp (NRZ): 7.5%
13. Monroe Capital Corp (MRCC): 9.5%
14. L3Harris Technologies Inc (LHX): 1.9%
15. Total SE (TOT): 6.8%
16. Navient Corp (NAVI): 3.8%
17. Lazard Ltd. (LAZ): 4.2%
18. America Móvil S.A.B.DE C.V. (AMX): 2.5%
19. KNOT Offshore Partners LP (KNOP): 11%
20. Becton, Dickinson And Co. (BDX): 1.3%
21. Enterprise Bancorp, Inc. (EBTC): 2.1%
22. Sempra Energy (SRE): 3.2%
23. CyrusOne Inc (CONE): 3%
24. Fresenius Medical Care AG & Co. KGaA (FMS): 1.8%
25. Office Properties Income Trust (OPI): 7.9%
26. AMGEN Inc. (AMGN): 2.8%
27. Royal Bank Of Canada (RY): 3.6%
28. Southwest Gas Holdings Inc (SWX): 3.4%
29. Northrop Grumman Corp. (NOC): 1.6%
30. Pinnacle West Capital Corp. (PNW): 4%
31. Campbell Soup Co. (CPB): 3.1%
32. Farmers & Merchants Bancorp (FMCB): 1.8%
33. Evergy Inc (EVRG): 3.4%
34. Huntington Ingalls Industries Inc (HII): 2.1%
35. Williams Cos Inc (WMB): 6.7%
36. CVS Health Corp (CVS): 2.5%
37. NextEra Energy Partners LP (NEP): 3.4%
38. Imperial Brands Plc (IMBBY): 5%
39. Cisco Systems, Inc. (CSCO): 2.9%
40. Kinder Morgan Inc (KMI): 6.3%
41. ABM Industries Inc. (ABM): 1.4%
42. SEI Investments Co. (SEIC): 1.2%
43. Atmos Energy Corp. (ATO): 2.4%
44. Unilever plc (UL): 3.5%
45. Polaris Inc (PII): 1.8%
46. National Bank of Canada (NTIOF): 3.1%
47. Prosperity Bancshares Inc. (PB): 2.6%
48. Ameriprise Financial Inc (AMP): 1.8%
49. Alliant Energy Corp. (LNT): 2.8%
50. Rogers Communications Inc. (RCI): 3.3%
51. Sampo Plc (SAXPY): 3.6%
52. Macerich Co. (MAC): 4.4%
53. Lowe`s Cos., Inc. (LOW): 1.2%
54. Orchid Island Capital Inc (ORC): 14.4%
55. Mercury General Corp. (MCY): 3.9%
56. Philip Morris International Inc (PM): 5.1%
57. Intel Corp. (INTC): 2.4%
58. BASF SE (BASFY): 4.6%
59. Sun Life Financial, Inc. (SLF): 3.2%
60. Alliance Resource Partners, LP (ARLP): 10.5%
61. National Grid Plc (NGG): 4.9%
62. Otter Tail Corporation (OTTR): 3.2%
63. Tyson Foods, Inc. (TSN): 2.3%
64. Prudential Financial Inc. (PRU): 4.5%
65. Flowers Foods, Inc. (FLO): 3.3%
66. Old Republic International Corp. (ORI): 3.4%
67. Eastman Chemical Co (EMN): 2.3%
68. Qualcomm, Inc. (QCOM): 2%
69. General Mills, Inc. (GIS): 3.3%
70. Stanley Black & Decker Inc (SWK): 1.3%
71. Tennant Co. (TNC): 1.1%
72. American Electric Power Company Inc. (AEP): 3.4%
73. Roche Holding AG (RHHBY): 2.9%
74. Genesis Energy L.P. (GEL): 6.5%
75. Realty Income Corp. (O): 4.1%
76. Colgate-Palmolive Co. (CL): 2.2%
77. M & T Bank Corp (MTB): 2.8%
78. Best Buy Co. Inc. (BBY): 2.4%
79. Clorox Co. (CLX): 2.4%
80. DTE Energy Co. (DTE): 3.1%
81. Automatic Data Processing Inc. (ADP): 1.9%
82. Federal Realty Investment Trust (FRT): 3.8%
83. Southern Company (SO): 4%
84. Essex Property Trust, Inc. (ESS): 2.9%
85. Assurant Inc (AIZ): 1.7%
86. Kellogg Co (K): 3.7%
87. Carlisle Companies Inc. (CSL): 1.1%
88. Omnicom Group, Inc. (OMC): 3.4%
89. W. P. Carey Inc (WPC): 5.6%
90. SK Telecom Co Ltd (SKM): 3.3%
91. H.B. Fuller Company (FUL): 1%
92. PPG Industries, Inc. (PPG): 1.2%
93. Artesian Resources Corp. (ARTNA): 2.7%
94. Universal Health Realty Income Trust (UHT): 4.2%
95. Chesapeake Financial Shares Inc (CPKF): 2%
96. Travelers Companies Inc. (TRV): 2.2%
97. Sonoco Products Co. (SON): 2.7%
98. PepsiCo Inc (PEP): 3%
99. Kroger Co. (KR): 2%
100. SJW Group (SJW): 2.1%
101. J.M. Smucker Co. (SJM): 2.7%
102. General Dynamics Corp. (GD): 2.5%
103. Pentair plc (PNR): 1.2%
104. MSC Industrial Direct Co., Inc. (MSM): 3.2%
105. AGNC Investment Corp (AGNC): 8%
106. PSB Holdings Inc (WI) (PSBQ): 1.6%
107. Chubb Limited (CB): 1.8%
108. Antero Midstream Corp (AM): 10%
109. Walmart Inc (WMT): 1.6%
110. Physicians Realty Trust (DOC): 5%
111. Parker-Hannifin Corp. (PH): 1.3%
112. Cummins Inc. (CMI): 2.1%
113. Entergy Corp. (ETR): 3.5%
114. Hormel Foods Corp. (HRL): 2.1%
115. McGrath RentCorp (MGRC): 2.1%
116. MDU Resources Group Inc (MDU): 2.5%
117. Lancaster Colony Corp. (LANC): 1.6%
118. Axis Capital Holdings Ltd (AXS): 2.9%

38
119. Duke Energy Corp. (DUK): 3.9%
120. Brady Corp. (BRC): 1.6%
121. Abbott Laboratories (ABT): 1.5%
122. Ingredion Inc (INGR): 2.7%
123. Dover Corp. (DOV): 1.3%
124. Hanesbrands Inc (HBI): 2.8%
125. BancFirst Corp. (BANF): 1.9%
126. Stepan Co. (SCL): 0.9%
127. HNI Corp. (HNI): 2.8%
128. Raytheon Technologies Corporation (RTX): 2.4%
129. Matthews International Corp. (MATW): 2.1%
130. Public Service Enterprise Group Inc. (PEG): 3.2%
131. Sysco Corp. (SYY): 2.2%
132. MetLife Inc (MET): 3%
133. National Retail Properties Inc (NNN): 4.3%
134. Gorman-Rupp Co. (GRC): 1.8%
135. Whirlpool Corp. (WHR): 2.3%
136. McDonald`s Corp (MCD): 2.2%
137. Tootsie Roll Industries, Inc. (TR): 1.1%
138. RPM International, Inc. (RPM): 1.6%
139. Target Corp (TGT): 1.3%
140. Everest Re Group Ltd (RE): 2.3%
141. Westamerica Bancorporation (WABC): 2.6%
142. Leggett & Platt, Inc. (LEG): 3%
143. John Wiley & Sons Inc. (JW.A): 2.3%
144. W.W. Grainger Inc. (GWW): 1.3%
145. Computer Services, Inc. (CSVI): 1.6%
146. Cincinnati Financial Corp. (CINF): 2.2%
147. Tanger Factory Outlet Centers, Inc. (SKT): 4.2%
148. TransAlta Renewables, Inc. (TRSWF): 4.5%
149. Illinois Tool Works, Inc. (ITW): 1.9%
150. Medtronic Plc (MDT): 1.8%
151. American States Water Co. (AWR): 1.7%
152. Cullen Frost Bankers Inc. (CFR): 2.3%
153. MSA Safety Inc (MSA): 1.1%
154. MGE Energy, Inc. (MGEE): 2%
155. California Water Service Group (CWT): 1.6%
156. Middlesex Water Co. (MSEX): 1.4%
157. Nucor Corp. (NUE): 1.8%
158. Community Bank System, Inc. (CBU): 2.1%
C-Rated Retirement Suitability
Securities 1. Tencent Holdings Ltd. (TCEHY): 0.3%
2. Thermo Fisher Scientific Inc. (TMO): 0.2%
3. Great Elm Capital Corp (GECC): 12.2%
4. China Petroleum & Chemical Corp (SNP): 7.2%
5. Progressive Corp. (PGR): 4.8%
6. Brookfield Property Partners L.P. (BPY): 7.4%
7. Shell Midstream Partners L.P. (SHLX): 12.6%
8. Landmark Infrastructure Partners LP (LMRK): 6.4%
9. DHT Holdings Inc (DHT): 3.3%
10. New York Community Bancorp Inc. (NYCB): 5.7%
11. Grupo Aval Acciones y Valores S.A. (AVAL): 4.6%
12. Icahn Enterprises L P (IEP): 13.9%
13. SL Green Realty Corp. (SLG): 4.9%
14. SFL Corporation Ltd (SFL): 7.6%
15. USA Compression Partners LP (USAC): 13.9%
16. Preferred Apartment Communities Inc (APTS): 6.9%
17. PetroChina Co. Ltd. (PTR): 3.5%
18. BP plc (BP): 4.9%
19. Bayer AG (BAYRY): 3.8%
20. Sixth Street Specialty Lending Inc (TSLX): 9.5%
21. Telefonica S.A (TEF): 9.6%
22. Silgan Holdings Inc. (SLGN): 1.3%
23. Stryker Corp. (SYK): 1%
24. Alaris Equity Partners Income Trust (ALARF): 10.2%
25. TC Energy Corporation (TRP): 5.5%
26. Orange. (ORAN): 5.6%
27. Sanofi (SNY): 3.8%
28. Newtek Business Services Corp (NEWT): 9.3%
29. PennyMac Mortgage Investment Trust (PMT): 9.4%
30. Pfizer Inc. (PFE): 3.9%
31. Comcast Corp (CMCSA): 1.8%
32. Principal Financial Group Inc (PFG): 3.8%
33. Blackrock Inc. (BLK): 2%
34. Artisan Partners Asset Management Inc (APAM): 5.9%
35. Anthem Inc (ANTM): 1.2%
36. LTC Properties, Inc. (LTC): 5.5%
37. Omega Healthcare Investors, Inc. (OHI): 7.2%
38. Lumen Technologies Inc (LUMN): 7.6%
39. Capital Southwest Corp. (CSWC): 8.5%
40. Höegh LNG Partners LP (HMLP): 10.1%
41. Exchange Income Corp. (EIFZF): 5.8%
42. Skyworks Solutions, Inc. (SWKS): 1.2%
43. RELX Plc (RELX): 2.7%
44. Citigroup Inc (C): 2.8%
45. B&G Foods, Inc (BGS): 6.5%
46. Sap SE (SAP): 1.6%
47. Fidus Investment Corp (FDUS): 9.1%
48. Two Harbors Investment Corp (TWO): 9.5%
49. Goldman Sachs BDC Inc (GSBD): 9.3%
50. Healthcare Trust of America Inc (HTA): 4.4%
51. HSBC Holdings plc (HSBC): 4.9%
52. MGM Growth Properties LLC (MGP): 5.6%
53. Swiss Re Ltd (SSREY): 6.9%
54. Spark Energy Inc (SPKE): 6.9%
55. Calvin b. Taylor Bankshares, Inc. (TYCB): 3.2%
56. New York Mortgage Trust Inc (NYMT): 8.8%
57. FirstEnergy Corp. (FE): 4.1%
58. New Jersey Resources Corporation (NJR): 3.1%
59. Mondelez International Inc. (MDLZ): 2.1%
60. Donaldson Co. Inc. (DCI): 1.3%
61. TriplePoint Venture Growth BDC Corp (TPVG): 9.1%
62. CorEnergy Infrastructure Trust Inc (CORR): 3.3%
63. Mckesson Corporation (MCK): 0.9%
64. UnitedHealth Group Inc (UNH): 1.2%
65. Republic Services, Inc. (RSG): 1.6%
66. Hewlett Packard Enterprise Co (HPE): 3.2%
67. Annaly Capital Management Inc (NLY): 10%
68. Medical Properties Trust Inc (MPW): 5.2%
69. Banco Bradesco S.A. (BBD): 4.6%
70. Texas Instruments Inc. (TXN): 2.3%
71. Whitestone REIT (WSR): 4.3%
72. Keurig Dr Pepper Inc (KDP): 2%
73. Home Depot, Inc. (HD): 2%

39
74. Oracle Corp. (ORCL): 1.6%
75. Sabra Healthcare REIT Inc (SBRA): 6.7%
76. Cross Timbers Royalty Trust (CRT): 8.2%
77. Simon Property Group, Inc. (SPG): 4.3%
78. Broadmark Realty Capital Inc (BRMK): 7.9%
79. Easterly Government Properties Inc (DEA): 4.9%
80. Comerica, Inc. (CMA): 3.6%
81. Exxon Mobil Corp. (XOM): 5.9%
82. Reckitt Benckiser Group Plc (RBGLY): 2.4%
83. Golub Capital BDC Inc (GBDC): 7.4%
84. CoreSite Realty Corporation (COR): 4.1%
85. PennantPark Floating Rate Capital Ltd (PFLT): 9.1%
86. Xerox Holdings Corp (XRX): 4.2%
87. New Mountain Finance Corp (NMFC): 9.4%
88. Huntington Bancshares, Inc. (HBAN): 3.9%
89. RenaissanceRe Holdings Ltd (RNR): 0.9%
90. S&P Global Inc (SPGI): 0.8%
91. Chimera Investment Corp (CIM): 9.3%
92. TELUS Corp. (TU): 4.5%
93. Spirit Realty Capital Inc (SRC): 5.3%
94. Ares Capital Corp (ARCC): 8.4%
95. Fairfax Financial Holdings Ltd. (FRFHF): 2.2%
96. Oxford Square Capital Corp (OXSQ): 8.5%
97. Booz Allen Hamilton Holding Corp (BAH): 1.7%
98. Iron Mountain Inc. (IRM): 6.2%
99. Starwood Property Trust Inc (STWD): 7.5%
100. Roper Technologies Inc (ROP): 0.5%
101. Chevron Corp. (CVX): 5.1%
102. Novo Nordisk (NVO): 2.1%
103. Canadian Natural Resources Ltd. (CNQ): 4.7%
104. Sienna Senior Living, Inc. (LWSCF): 6.1%
105. Eagle Point Income Company Inc (EIC): 6.5%
106. Solar Senior Capital Ltd (SUNS): 7.7%
107. McCormick & Co., Inc. (MKC): 1.5%
108. Global Net Lease Inc (GNL): 8.3%
109. Church & Dwight Co., Inc. (CHD): 1.1%
110. Gladstone Commercial Corp (GOOD): 7.2%
111. Patterson Companies Inc. (PDCO): 2.9%
112. American Tower Corp. (AMT): 2%
113. FBL Financial Group, Inc. (FFG): 3.5%
114. Gazprom (OGZPY): 6.6%
115. ARMOUR Residential REIT Inc (ARR): 9.8%
116. Ellington Financial Inc (EFC): 6.7%
117. Dream Office Real Estate Investment Trust (DRETF): 4.3%
118. Blackstone Mortgage Trust Inc (BXMT): 7.8%
119. Stellus Capital Investment Corp (SCM): 7.6%
120. Brown & Brown, Inc. (BRO): 0.7%
121. Keycorp (KEY): 3.3%
122. AvalonBay Communities Inc. (AVB): 3.3%
123. C.H. Robinson Worldwide, Inc. (CHRW): 2.1%
124. CSX Corp. (CSX): 1.1%
125. Public Storage (PSA): 2.9%
126. WEC Energy Group Inc (WEC): 2.8%
127. Hercules Capital Inc (HTGC): 7.3%
128. Horizon Technology Finance Corp (HRZN): 7.5%
129. Microsoft Corporation (MSFT): 0.9%
130. Canadian National Railway Co. (CNI): 1.8%
131. VEREIT Inc (VER): 4.1%
132. Amerisource Bergen Corp. (ABC): 1.4%
133. Fox Corporation (FOXA): 1.3%
134. Rio Tinto plc (RIO): 6.4%
135. Nestle SA (NSRGY): 2.6%
136. International Flavors & Fragrances Inc. (IFF): 2.1%
137. Union Pacific Corp. (UNP): 1.7%
138. Gaming and Leisure Properties Inc (GLPI): 5.6%
139. Dynex Capital, Inc. (DX): 8.1%
140. Brixmor Property Group Inc (BRX): 3.9%
141. Gladstone Capital Corp. (GLAD): 7.1%
142. Superior Plus Corp. (SUUIF): 4.4%
143. United Parcel Service, Inc. (UPS): 1.9%
144. Sherwin-Williams Co. (SHW): 0.8%
145. Hershey Company (HSY): 1.9%
146. Prospect Capital Corp (PSEC): 8.9%
147. Imperial Oil Ltd. (IMO): 2.3%
148. Franklin Electric Co., Inc. (FELE): 0.8%
149. Lincoln Electric Holdings, Inc. (LECO): 1.5%
150. NextEra Energy Inc (NEE): 2.1%
151. eBay Inc. (EBAY): 1.2%
152. Siemens AG (SIEGY): 2.6%
153. Apple Inc (AAPL): 0.7%
154. NACCO Industries Inc. (NC): 3.3%
155. Digital Realty Trust Inc (DLR): 3%
156. Xcel Energy, Inc. (XEL): 2.5%
157. 1st Source Corp. (SRCE): 2.5%
158. Fastenal Co. (FAST): 2.1%
159. Essential Utilities Inc (WTRG): 2.2%
160. Infosys Ltd (INFY): 2.2%
161. Arbor Realty Trust Inc. (ABR): 7.5%
162. Compass Diversified Holdings (CODI): 5.5%
163. Jack Henry & Associates, Inc. (JKHY): 1.1%
164. Cintas Corporation (CTAS): 0.9%
165. LyondellBasell Industries NV (LYB): 3.8%
166. Linde Plc (LIN): 1.5%
167. Snap-on, Inc. (SNA): 2%
168. American Express Co. (AXP): 1.1%
169. International Paper Co. (IP): 3.4%
170. Commerce Bancshares, Inc. (CBSH): 1.3%
171. Greif Inc (GEF): 2.7%
172. Choice Properties Real Estate Investment Trust (PPRQF):
4.9%
173. Textron Inc. (TXT): 0.1%
174. A.O. Smith Corp. (AOS): 1.5%
175. Nordson Corp. (NDSN): 0.7%
176. Erie Indemnity Co. (ERIE): 1.9%
177. Apollo Commercial Real Estate Finance Inc (ARI): 9.3%
178. Waste Management, Inc. (WM): 1.6%
179. Ecolab, Inc. (ECL): 0.8%
180. Yamana Gold Inc. (AUY): 2.3%
181. Lilly(Eli) & Co (LLY): 1.8%
182. Air Products & Chemicals Inc. (APD): 2.1%
183. Expeditors International Of Washington, Inc. (EXPD): 0.9%
184. Williams-Sonoma, Inc. (WSM): 1.4%
185. Brown-Forman Corp. (BF.B): 0.9%
186. Caterpillar Inc. (CAT): 1.8%
187. Brookfield Asset Management Inc. (BAM): 1.1%
188. AptarGroup Inc. (ATR): 1%
189. RLI Corp. (RLI): 0.8%
190. West Pharmaceutical Services, Inc. (WST): 0.2%

40
D-Rated Retirement Suitability
Securities 1. Innovative Industrial Properties Inc (IIPR): 3.1%
2. Morgan Stanley (MS): 1.8%
3. Synchrony Financial (SYF): 2%
4. Micro Focus International Plc (MFGP): 2.3%
5. Royal Gold, Inc. (RGLD): 1%
6. Hannon Armstrong Sustainable Infrastructure capital Inc
(HASI): 2.9%
7. Royal Dutch Shell Plc (RDS.B): 3.7%
8. Inter Pipeline Ltd. (IPPLF): 2.5%
9. Newmont Corp (NEM): 3.4%
10. Aegon N. V. (AEG): 1.5%
11. Petróleo Brasileiro S.A. Petrobras (PBR): 1.8%
12. AstraZeneca plc (AZN): 2.6%
13. Equinix Inc (EQIX): 1.6%
14. Franco-Nevada Corporation (FNV): 0.8%
15. Consolidated Water Co. Ltd. (CWCO): 2.9%
16. Yum Brands Inc. (YUM): 1.7%
17. Suncor Energy, Inc. (SU): 3%
18. CenterPoint Energy Inc. (CNP): 2.7%
19. Hasbro, Inc. (HAS): 2.8%
20. Permian Basin Royalty Trust (PBT): 6.2%
21. Broadcom Inc (AVGO): 3.2%
22. Equinor ASA (EQNR): 2.9%
23. Telefonaktiebolaget L M Ericsson (ERIC): 1.8%
24. Intercontinental Exchange Inc (ICE): 1.2%
25. Truist Financial Corporation (TFC): 3%
26. VICI Properties Inc (VICI): 4.4%
27. GlaxoSmithKline plc (GSK): 6.8%
28. Intuit Inc (INTU): 0.6%
29. Ally Financial Inc (ALLY): 1.5%
30. Dominion Energy Inc (D): 3.2%
31. FedEx Corp (FDX): 0.9%
32. HollyFrontier Corp (HFC): 3.9%
33. Phillips 66 (PSX): 4.3%
34. Bank Of New York Mellon Corp (BK): 2.5%
35. Allstate Corp (The) (ALL): 2.5%
36. Vale S.A. (VALE): 1.5%
37. Canadian Pacific Railway Ltd (CP): 0.8%
38. Boston Properties, Inc. (BXP): 3.6%
39. Deutsche Telekom AG (DTEGY): 3.7%
40. Algonquin Power & Utilities Corp (AQN): 4.1%
41. Ritchie Bros Auctioneers Inc (RBA): 1.5%
42. Discover Financial Services (DFS): 1.5%
43. Brookfield Renewable Partners LP (BEP): 3.3%
44. Amcor Plc (AMCR): 3.8%
45. Conagra Brands Inc (CAG): 2.9%
46. ViacomCBS Inc (VIAC): 2.4%
47. Bayerische Motoren Werke AG (BMWYY): 2.3%
48. Vector Group Ltd (VGR): 5.9%
49. Restaurant Brands International Inc (QSR): 3%
50. Agree Realty Corp. (ADC): 3.5%
51. Crown Castle International Corp (CCI): 2.9%
52. HP Inc (HPQ): 2.3%
53. UBS Group AG (UBS): 2.5%
54. Sabine Royalty Trust (SBR): 6.8%
55. Domino’s Pizza Inc (DPZ): 0.9%
56. Eni Spa (E): 4.1%
57. Ambev S.A. (ABEV): 2.9%
58. Paccar Inc. (PCAR): 1.5%
59. Dollar General Corp. (DG): 0.7%
60. Baker Hughes Co (BKR): 3.3%
61. JPMorgan Chase & Co. (JPM): 2.3%
62. Targa Resources Corp (TRGP): 1.1%
63. Invesco Ltd (IVZ): 2.5%
64. EOG Resources, Inc. (EOG): 2.2%
65. Pembina Pipeline Corporation (PBA): 6.3%
66. Goldman Sachs Group, Inc. (GS): 1.4%
67. Valero Energy Corp. (VLO): 5%
68. Costco Wholesale Corp (COST): 0.8%
69. CNA Financial Corp. (CNA): 3.2%
70. UDR Inc (UDR): 3.2%
71. Cognizant Technology Solutions Corp. (CTSH): 1.2%
72. STAG Industrial Inc (STAG): 4%
73. Bank Of America Corp. (BAC): 1.8%
74. Ventas Inc (VTR): 3.3%
75. Store Capital Corp (STOR): 4.1%
76. Magna International Inc. (MGA): 1.9%
77. NetApp Inc (NTAP): 2.5%
78. Posco (PKX): 2.1%
79. Chemours Company (CC): 3.2%
80. Toro Co. (TTC): 0.9%
81. Kraft Heinz Co (KHC): 3.8%
82. Alexandria Real Estate Equities Inc. (ARE): 2.4%
83. BCE Inc (BCE): 5.8%
84. Ladder Capital Corp (LADR): 6.9%
85. ResMed Inc. (RMD): 0.8%
86. Toyota Motor Corporation (TM): 2.7%
87. Danone (DANOY): 3.1%
88. Main Street Capital Corporation (MAIN): 5.8%
89. Vodafone Group plc (VOD): 5.6%
90. Carrier Global Corp (CARR): 1.1%
91. Exelon Corp. (EXC): 3.4%
92. Moody`s Corp. (MCO): 0.8%
93. Marathon Petroleum Corp (MPC): 4%
94. Apollo Global Management Inc (APO): 4.4%
95. Healthpeak Properties Inc (PEAK): 3.5%
96. U.S. Bancorp. (USB): 2.8%
97. Camden Property Trust (CPT): 2.8%
98. WPP Plc. (WPP): 1.9%
99. Urstadt Biddle Properties, Inc. (UBA): 3%
100. Ryder System, Inc. (R): 2.7%
101. Nutrien Ltd (NTR): 3.2%
102. Gladstone Investment Corporation (GAIN): 6.1%
103. Chorus Aviation, Inc. (CHRRF): 2.6%
104. Starbucks Corp. (SBUX): 1.6%
105. Visa Inc (V): 0.6%
106. L'Oréal SA (LRLCF): 1.2%
107. Equity Residential Properties Trust (EQR): 3.4%
108. Advance Auto Parts Inc (AAP): 0.5%
109. PNC Financial Services Group (PNC): 2.4%
110. Corning, Inc. (GLW): 2.1%
111. Honeywell International Inc (HON): 1.7%
112. Norfolk Southern Corp. (NSC): 1.4%

41
113. Mid-America Apartment Communities, Inc. (MAA): 2.6%
114. Nike, Inc. (NKE): 0.8%
115. PacWest Bancorp (PACW): 2.3%
116. Honda Motor (HMC): 2.6%
117. Otis Worldwide Corp (OTIS): 1.2%
118. Dow Inc (DOW): 4.2%
119. Welltower Inc (WELL): 3.3%
120. Shaw Communications Inc. (SJR): 3.2%
121. Paychex Inc. (PAYX): 2.5%
122. AllianceBernstein Holding LP (AB): 7.6%
123. Arthur J. Gallagher & Co. (AJG): 1.3%
124. ABB Ltd. (ABB): 2.7%
125. BHP Group Limited (BHP): 4%
126. Barrick Gold Corp. (GOLD): 1.6%
127. Applied Materials Inc. (AMAT): 0.7%
128. Rockwell Automation Inc (ROK): 1.6%
129. Dream Industrial Real Estate Investment Trust (DREUF):
5%
130. Lamar Advertising Co (LAMR): 2.9%
131. Daimler AG (DDAIF): 1.9%
132. Tractor Supply Co. (TSCO): 1.1%
133. Morningstar Inc (MORN): 0.5%
134. Helmerich & Payne, Inc. (HP): 3.7%
135. Newell Brands Inc (NWL): 3.3%
136. Kontoor Brands Inc (KTB): 2.5%
137. Enerplus Corporation (ERF): 1.6%
138. PermRock Royalty Trust (PRT): 6.1%
139. Seagate Technology Plc (STX): 3%
140. Diageo plc (DEO): 2%
141. Kimco Realty Corp. (KIM): 3.5%
142. Canon Inc (CAJ): 3.1%
143. UMB Financial Corp. (UMBF): 1.3%
144. Pearson plc (PSO): 2.4%
145. ING Groep N.V. (ING): 2.3%
146. Blackstone Group Inc (The) (BX): 3%
147. Thomson-Reuters Corp (TRI): 1.7%
148. Deere & Co. (DE): 0.9%
149. Trane Technologies plc (TT): 1.4%
150. Harvest Capital Credit Corp (HCAP): 5.1%
151. Olin Corp. (OLN): 1.8%
152. Steel Dynamics Inc. (STLD): 1.8%
153. Xylem Inc (XYL): 1%
154. Gap, Inc. (GPS): 2.8%
155. Compass Minerals International Inc (CMP): 4.1%
156. Badger Meter Inc. (BMI): 0.8%
157. Waddell & Reed Financial, Inc. (WDR): 4%
158. Albemarle Corp. (ALB): 1%
F-Rated Retirement Suitability
Securities 1. Tenaris S.A. (TS): 2.3%
2. Marvell Technology Inc (MRVL): 0.5%
3. Jack In The Box, Inc. (JACK): 1.3%
4. ASML Holding NV (ASML): 0.5%
5. Lam Research Corp. (LRCX): 0.9%
6. Prologis Inc (PLD): 2.2%
7. Aon plc. (AON): 0.8%
8. Service Properties Trust (SVC): 0.3%
9. Gold Resource Corporation (GORO): 1.5%
10. CF Industries Holdings Inc (CF): 2.4%
11. Darden Restaurants, Inc. (DRI): 1.1%
12. Wendy`s Co (WEN): 1.6%
13. Koninklijke Philips N.V. (PHG): 1.8%
14. Owens & Minor, Inc. (OMI): 0%
15. Halliburton Co. (HAL): 0.9%
16. Industria De Diseño Textil SA (IDEXY): 2.3%
17. Sony Group Corporation (SONY): 0.5%
18. Scotts Miracle-Gro Company (SMG): 1.1%
19. Foot Locker Inc (FL): 1.3%
20. Taiwan Semiconductor Manufacturing (TSM): 1.6%
21. Mastercard Incorporated (MA): 0.5%
22. NVIDIA Corp (NVDA): 0.1%
23. KLA Corp. (KLAC): 1.2%
24. Conoco Phillips (COP): 3.3%
25. Wells Fargo & Co. (WFC): 0.9%
26. Apple Hospitality REIT Inc (APLE): 0.8%
27. Ross Stores, Inc. (ROST): 0.9%
28. Itaú Unibanco Holding S.A. (ITUB): 1%
29. Freeport-McMoRan Inc (FCX): 0.8%
30. DuPont de Nemours Inc (DD): 1.5%
31. Schlumberger Ltd. (SLB): 1.8%
32. Weyerhaeuser Co. (WY): 1.7%
33. TJX Companies, Inc. (TJX): 1.5%
34. Garmin Ltd (GRMN): 2%
35. Global Water Resources Inc (GWRS): 1.8%
36. Constellation Brands Inc (STZ): 1.3%
37. Wheaton Precious Metals Corp (WPM): 1.2%
38. Oshkosh Corp (OSK): 1%
39. Kohl`s Corp. (KSS): 1.6%
40. Gladstone Land Corp (LAND): 2.6%
41. APA Corporation (APA): 0.5%
42. Nielsen Holdings plc (NLSN): 0.9%
43. Johnson Controls International plc (JCI): 1.7%
44. Occidental Petroleum Corp. (OXY): 0.2%
45. Anheuser-Busch In Bev SA/NV (BUD): 0.8%
46. VF Corp. (VFC): 2.2%
47. Kansas City Southern (KSU): 0.7%
48. CME Group Inc (CME): 1.8%
49. Accenture plc (ACN): 1.2%
50. Diversified Healthcare Trust (DHC): 0.9%
51. WestRock Co (WRK): 1.5%
52. Scholastic Corp. (SCHL): 1.9%
53. ArcelorMittal (MT): 1%
54. Ferrari N.V. (RACE): 0.6%
55. General Electric Co. (GE): 0.3%
56. Eaton Corporation plc (ETN): 2.1%
57. Logitech International SA (LOGI): 0.9%
58. Harley-Davidson, Inc. (HOG): 1.3%
59. Covanta Holding Corporation (CVA): 2.1%
60. Kulicke & Soffa Industries, Inc. (KLIC): 1%
61. Patterson-UTI Energy Inc (PTEN): 1.1%
62. U.S. Global Investors, Inc. (GROW): 0.8%
63. Dillard`s Inc. (DDS): 0.6%
64. MGM Resorts International (MGM): 0%
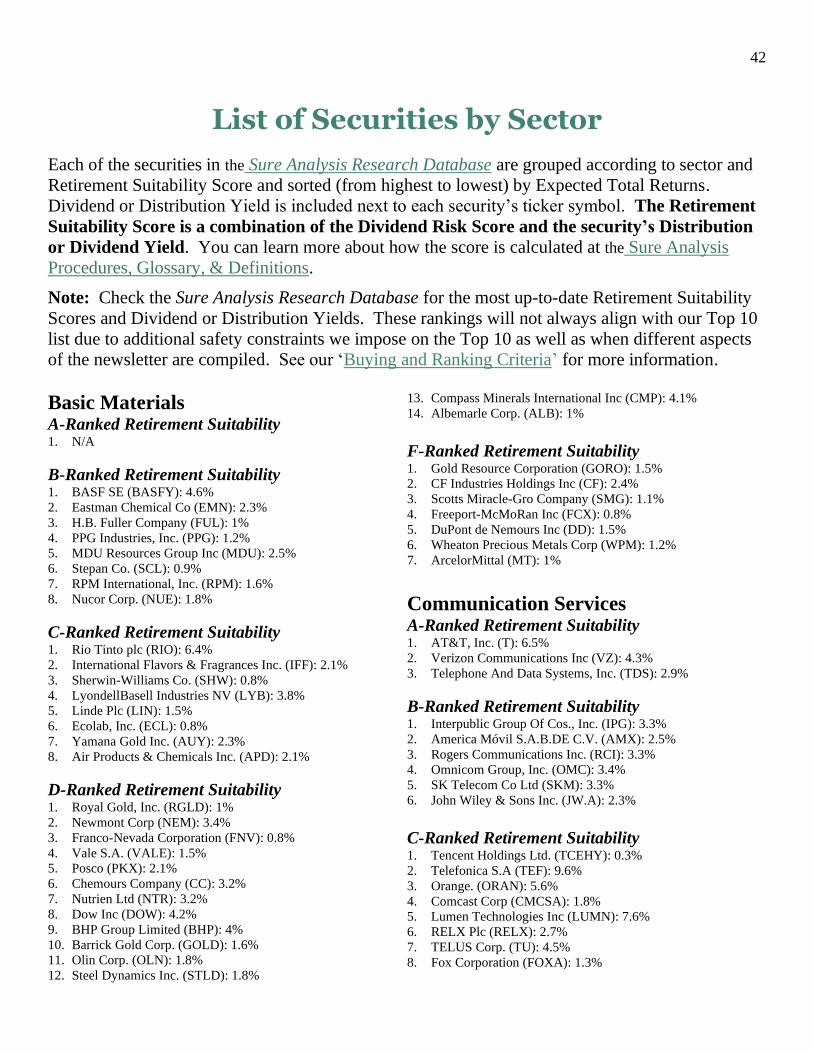
42
List of Securities by Sector
Each of the securities in the Sure Analysis Research Database are grouped according to sector and
Retirement Suitability Score and sorted (from highest to lowest) by Expected Total Returns.
Dividend or Distribution Yield is included next to each security’s ticker symbol. The Retirement
Suitability Score is a combination of the Dividend Risk Score and the security’s Distribution
or Dividend Yield. You can learn more about how the score is calculated at the Sure Analysis
Procedures, Glossary, & Definitions.
Note: Check the Sure Analysis Research Database for the most up-to-date Retirement Suitability
Scores and Dividend or Distribution Yields. These rankings will not always align with our Top 10
list due to additional safety constraints we impose on the Top 10 as well as when different aspects
of the newsletter are compiled. See our ‘Buying and Ranking Criteria’ for more information.
Basic Materials A-Ranked Retirement Suitability 1. N/A
B-Ranked Retirement Suitability 1. BASF SE (BASFY): 4.6%
2. Eastman Chemical Co (EMN): 2.3%
3. H.B. Fuller Company (FUL): 1%
4. PPG Industries, Inc. (PPG): 1.2%
5. MDU Resources Group Inc (MDU): 2.5%
6. Stepan Co. (SCL): 0.9%
7. RPM International, Inc. (RPM): 1.6%
8. Nucor Corp. (NUE): 1.8%
C-Ranked Retirement Suitability 1. Rio Tinto plc (RIO): 6.4%
2. International Flavors & Fragrances Inc. (IFF): 2.1%
3. Sherwin-Williams Co. (SHW): 0.8%
4. LyondellBasell Industries NV (LYB): 3.8%
5. Linde Plc (LIN): 1.5%
6. Ecolab, Inc. (ECL): 0.8%
7. Yamana Gold Inc. (AUY): 2.3%
8. Air Products & Chemicals Inc. (APD): 2.1%
D-Ranked Retirement Suitability 1. Royal Gold, Inc. (RGLD): 1%
2. Newmont Corp (NEM): 3.4%
3. Franco-Nevada Corporation (FNV): 0.8%
4. Vale S.A. (VALE): 1.5%
5. Posco (PKX): 2.1%
6. Chemours Company (CC): 3.2%
7. Nutrien Ltd (NTR): 3.2%
8. Dow Inc (DOW): 4.2%
9. BHP Group Limited (BHP): 4%
10. Barrick Gold Corp. (GOLD): 1.6%
11. Olin Corp. (OLN): 1.8%
12. Steel Dynamics Inc. (STLD): 1.8%
13. Compass Minerals International Inc (CMP): 4.1%
14. Albemarle Corp. (ALB): 1%
F-Ranked Retirement Suitability 1. Gold Resource Corporation (GORO): 1.5%
2. CF Industries Holdings Inc (CF): 2.4%
3. Scotts Miracle-Gro Company (SMG): 1.1%
4. Freeport-McMoRan Inc (FCX): 0.8%
5. DuPont de Nemours Inc (DD): 1.5%
6. Wheaton Precious Metals Corp (WPM): 1.2%
7. ArcelorMittal (MT): 1%
Communication Services A-Ranked Retirement Suitability 1. AT&T, Inc. (T): 6.5%
2. Verizon Communications Inc (VZ): 4.3%
3. Telephone And Data Systems, Inc. (TDS): 2.9%
B-Ranked Retirement Suitability 1. Interpublic Group Of Cos., Inc. (IPG): 3.3%
2. America Móvil S.A.B.DE C.V. (AMX): 2.5%
3. Rogers Communications Inc. (RCI): 3.3%
4. Omnicom Group, Inc. (OMC): 3.4%
5. SK Telecom Co Ltd (SKM): 3.3%
6. John Wiley & Sons Inc. (JW.A): 2.3%
C-Ranked Retirement Suitability 1. Tencent Holdings Ltd. (TCEHY): 0.3%
2. Telefonica S.A (TEF): 9.6%
3. Orange. (ORAN): 5.6%
4. Comcast Corp (CMCSA): 1.8%
5. Lumen Technologies Inc (LUMN): 7.6%
6. RELX Plc (RELX): 2.7%
7. TELUS Corp. (TU): 4.5%
8. Fox Corporation (FOXA): 1.3%
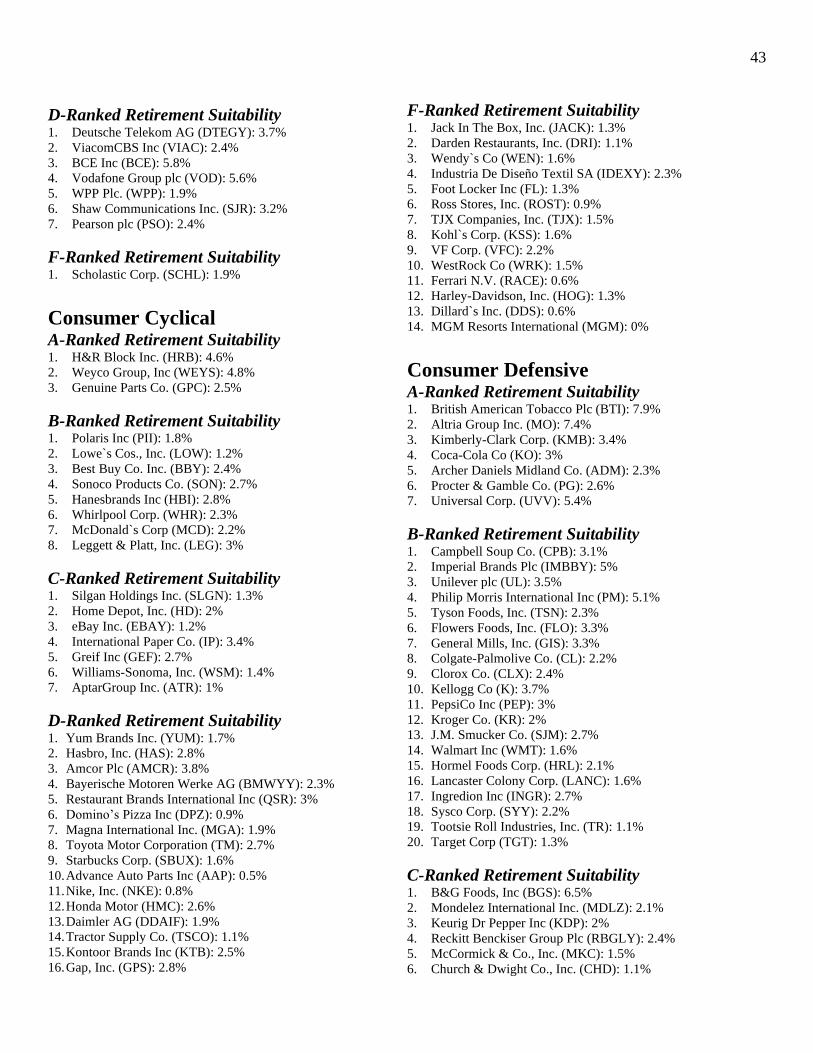
43
D-Ranked Retirement Suitability 1. Deutsche Telekom AG (DTEGY): 3.7%
2. ViacomCBS Inc (VIAC): 2.4%
3. BCE Inc (BCE): 5.8%
4. Vodafone Group plc (VOD): 5.6%
5. WPP Plc. (WPP): 1.9%
6. Shaw Communications Inc. (SJR): 3.2%
7. Pearson plc (PSO): 2.4%
F-Ranked Retirement Suitability 1. Scholastic Corp. (SCHL): 1.9%
Consumer Cyclical A-Ranked Retirement Suitability 1. H&R Block Inc. (HRB): 4.6%
2. Weyco Group, Inc (WEYS): 4.8%
3. Genuine Parts Co. (GPC): 2.5%
B-Ranked Retirement Suitability 1. Polaris Inc (PII): 1.8%
2. Lowe`s Cos., Inc. (LOW): 1.2%
3. Best Buy Co. Inc. (BBY): 2.4%
4. Sonoco Products Co. (SON): 2.7%
5. Hanesbrands Inc (HBI): 2.8%
6. Whirlpool Corp. (WHR): 2.3%
7. McDonald`s Corp (MCD): 2.2%
8. Leggett & Platt, Inc. (LEG): 3%
C-Ranked Retirement Suitability 1. Silgan Holdings Inc. (SLGN): 1.3%
2. Home Depot, Inc. (HD): 2%
3. eBay Inc. (EBAY): 1.2%
4. International Paper Co. (IP): 3.4%
5. Greif Inc (GEF): 2.7%
6. Williams-Sonoma, Inc. (WSM): 1.4%
7. AptarGroup Inc. (ATR): 1%
D-Ranked Retirement Suitability 1. Yum Brands Inc. (YUM): 1.7%
2. Hasbro, Inc. (HAS): 2.8%
3. Amcor Plc (AMCR): 3.8%
4. Bayerische Motoren Werke AG (BMWYY): 2.3%
5. Restaurant Brands International Inc (QSR): 3%
6. Domino’s Pizza Inc (DPZ): 0.9%
7. Magna International Inc. (MGA): 1.9%
8. Toyota Motor Corporation (TM): 2.7%
9. Starbucks Corp. (SBUX): 1.6%
10. Advance Auto Parts Inc (AAP): 0.5%
11. Nike, Inc. (NKE): 0.8%
12. Honda Motor (HMC): 2.6%
13. Daimler AG (DDAIF): 1.9%
14. Tractor Supply Co. (TSCO): 1.1%
15. Kontoor Brands Inc (KTB): 2.5%
16. Gap, Inc. (GPS): 2.8%
F-Ranked Retirement Suitability 1. Jack In The Box, Inc. (JACK): 1.3%
2. Darden Restaurants, Inc. (DRI): 1.1%
3. Wendy`s Co (WEN): 1.6%
4. Industria De Diseño Textil SA (IDEXY): 2.3%
5. Foot Locker Inc (FL): 1.3%
6. Ross Stores, Inc. (ROST): 0.9%
7. TJX Companies, Inc. (TJX): 1.5%
8. Kohl`s Corp. (KSS): 1.6%
9. VF Corp. (VFC): 2.2%
10. WestRock Co (WRK): 1.5%
11. Ferrari N.V. (RACE): 0.6%
12. Harley-Davidson, Inc. (HOG): 1.3%
13. Dillard`s Inc. (DDS): 0.6%
14. MGM Resorts International (MGM): 0%
Consumer Defensive A-Ranked Retirement Suitability 1. British American Tobacco Plc (BTI): 7.9%
2. Altria Group Inc. (MO): 7.4%
3. Kimberly-Clark Corp. (KMB): 3.4%
4. Coca-Cola Co (KO): 3%
5. Archer Daniels Midland Co. (ADM): 2.3%
6. Procter & Gamble Co. (PG): 2.6%
7. Universal Corp. (UVV): 5.4%
B-Ranked Retirement Suitability 1. Campbell Soup Co. (CPB): 3.1%
2. Imperial Brands Plc (IMBBY): 5%
3. Unilever plc (UL): 3.5%
4. Philip Morris International Inc (PM): 5.1%
5. Tyson Foods, Inc. (TSN): 2.3%
6. Flowers Foods, Inc. (FLO): 3.3%
7. General Mills, Inc. (GIS): 3.3%
8. Colgate-Palmolive Co. (CL): 2.2%
9. Clorox Co. (CLX): 2.4%
10. Kellogg Co (K): 3.7%
11. PepsiCo Inc (PEP): 3%
12. Kroger Co. (KR): 2%
13. J.M. Smucker Co. (SJM): 2.7%
14. Walmart Inc (WMT): 1.6%
15. Hormel Foods Corp. (HRL): 2.1%
16. Lancaster Colony Corp. (LANC): 1.6%
17. Ingredion Inc (INGR): 2.7%
18. Sysco Corp. (SYY): 2.2%
19. Tootsie Roll Industries, Inc. (TR): 1.1%
20. Target Corp (TGT): 1.3%
C-Ranked Retirement Suitability 1. B&G Foods, Inc (BGS): 6.5%
2. Mondelez International Inc. (MDLZ): 2.1%
3. Keurig Dr Pepper Inc (KDP): 2%
4. Reckitt Benckiser Group Plc (RBGLY): 2.4%
5. McCormick & Co., Inc. (MKC): 1.5%
6. Church & Dwight Co., Inc. (CHD): 1.1%
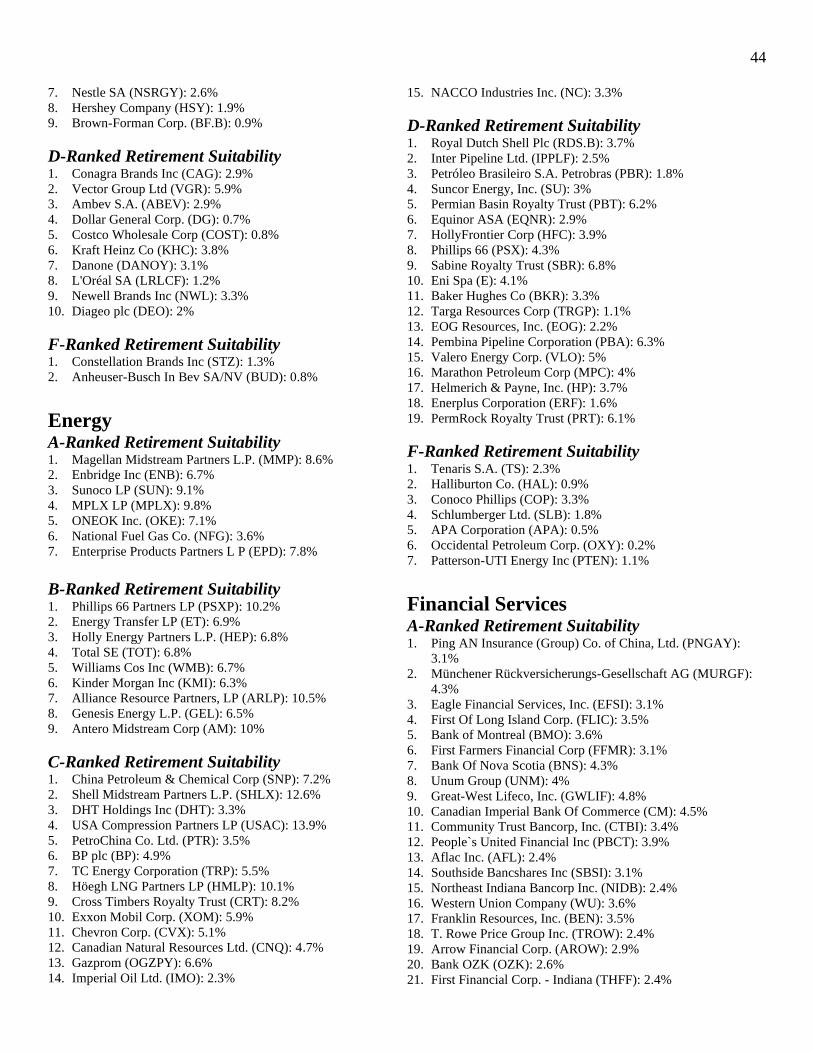
44
7. Nestle SA (NSRGY): 2.6%
8. Hershey Company (HSY): 1.9%
9. Brown-Forman Corp. (BF.B): 0.9%
D-Ranked Retirement Suitability 1. Conagra Brands Inc (CAG): 2.9%
2. Vector Group Ltd (VGR): 5.9%
3. Ambev S.A. (ABEV): 2.9%
4. Dollar General Corp. (DG): 0.7%
5. Costco Wholesale Corp (COST): 0.8%
6. Kraft Heinz Co (KHC): 3.8%
7. Danone (DANOY): 3.1%
8. L'Oréal SA (LRLCF): 1.2%
9. Newell Brands Inc (NWL): 3.3%
10. Diageo plc (DEO): 2%
F-Ranked Retirement Suitability 1. Constellation Brands Inc (STZ): 1.3%
2. Anheuser-Busch In Bev SA/NV (BUD): 0.8%
Energy A-Ranked Retirement Suitability 1. Magellan Midstream Partners L.P. (MMP): 8.6%
2. Enbridge Inc (ENB): 6.7%
3. Sunoco LP (SUN): 9.1%
4. MPLX LP (MPLX): 9.8%
5. ONEOK Inc. (OKE): 7.1%
6. National Fuel Gas Co. (NFG): 3.6%
7. Enterprise Products Partners L P (EPD): 7.8%
B-Ranked Retirement Suitability 1. Phillips 66 Partners LP (PSXP): 10.2%
2. Energy Transfer LP (ET): 6.9%
3. Holly Energy Partners L.P. (HEP): 6.8%
4. Total SE (TOT): 6.8%
5. Williams Cos Inc (WMB): 6.7%
6. Kinder Morgan Inc (KMI): 6.3%
7. Alliance Resource Partners, LP (ARLP): 10.5%
8. Genesis Energy L.P. (GEL): 6.5%
9. Antero Midstream Corp (AM): 10%
C-Ranked Retirement Suitability 1. China Petroleum & Chemical Corp (SNP): 7.2%
2. Shell Midstream Partners L.P. (SHLX): 12.6%
3. DHT Holdings Inc (DHT): 3.3%
4. USA Compression Partners LP (USAC): 13.9%
5. PetroChina Co. Ltd. (PTR): 3.5%
6. BP plc (BP): 4.9%
7. TC Energy Corporation (TRP): 5.5%
8. Höegh LNG Partners LP (HMLP): 10.1%
9. Cross Timbers Royalty Trust (CRT): 8.2%
10. Exxon Mobil Corp. (XOM): 5.9%
11. Chevron Corp. (CVX): 5.1%
12. Canadian Natural Resources Ltd. (CNQ): 4.7%
13. Gazprom (OGZPY): 6.6%
14. Imperial Oil Ltd. (IMO): 2.3%
15. NACCO Industries Inc. (NC): 3.3%
D-Ranked Retirement Suitability 1. Royal Dutch Shell Plc (RDS.B): 3.7%
2. Inter Pipeline Ltd. (IPPLF): 2.5%
3. Petróleo Brasileiro S.A. Petrobras (PBR): 1.8%
4. Suncor Energy, Inc. (SU): 3%
5. Permian Basin Royalty Trust (PBT): 6.2%
6. Equinor ASA (EQNR): 2.9%
7. HollyFrontier Corp (HFC): 3.9%
8. Phillips 66 (PSX): 4.3%
9. Sabine Royalty Trust (SBR): 6.8%
10. Eni Spa (E): 4.1%
11. Baker Hughes Co (BKR): 3.3%
12. Targa Resources Corp (TRGP): 1.1%
13. EOG Resources, Inc. (EOG): 2.2%
14. Pembina Pipeline Corporation (PBA): 6.3%
15. Valero Energy Corp. (VLO): 5%
16. Marathon Petroleum Corp (MPC): 4%
17. Helmerich & Payne, Inc. (HP): 3.7%
18. Enerplus Corporation (ERF): 1.6%
19. PermRock Royalty Trust (PRT): 6.1%
F-Ranked Retirement Suitability 1. Tenaris S.A. (TS): 2.3%
2. Halliburton Co. (HAL): 0.9%
3. Conoco Phillips (COP): 3.3%
4. Schlumberger Ltd. (SLB): 1.8%
5. APA Corporation (APA): 0.5%
6. Occidental Petroleum Corp. (OXY): 0.2%
7. Patterson-UTI Energy Inc (PTEN): 1.1%
Financial Services A-Ranked Retirement Suitability 1. Ping AN Insurance (Group) Co. of China, Ltd. (PNGAY):
3.1%
2. Münchener Rückversicherungs-Gesellschaft AG (MURGF):
4.3%
3. Eagle Financial Services, Inc. (EFSI): 3.1%
4. First Of Long Island Corp. (FLIC): 3.5%
5. Bank of Montreal (BMO): 3.6%
6. First Farmers Financial Corp (FFMR): 3.1%
7. Bank Of Nova Scotia (BNS): 4.3%
8. Unum Group (UNM): 4%
9. Great-West Lifeco, Inc. (GWLIF): 4.8%
10. Canadian Imperial Bank Of Commerce (CM): 4.5%
11. Community Trust Bancorp, Inc. (CTBI): 3.4%
12. People`s United Financial Inc (PBCT): 3.9%
13. Aflac Inc. (AFL): 2.4%
14. Southside Bancshares Inc (SBSI): 3.1%
15. Northeast Indiana Bancorp Inc. (NIDB): 2.4%
16. Western Union Company (WU): 3.6%
17. Franklin Resources, Inc. (BEN): 3.5%
18. T. Rowe Price Group Inc. (TROW): 2.4%
19. Arrow Financial Corp. (AROW): 2.9%
20. Bank OZK (OZK): 2.6%
21. First Financial Corp. - Indiana (THFF): 2.4%

45
22. Tompkins Financial Corp (TMP): 2.7%
23. United Bankshares, Inc. (UBSI): 3.5%
B-Ranked Retirement Suitability 1. Monroe Capital Corp (MRCC): 9.5%
2. Navient Corp (NAVI): 3.8%
3. Lazard Ltd. (LAZ): 4.2%
4. Enterprise Bancorp, Inc. (EBTC): 2.1%
5. Royal Bank Of Canada (RY): 3.6%
6. Farmers & Merchants Bancorp (FMCB): 1.8%
7. SEI Investments Co. (SEIC): 1.2%
8. National Bank of Canada (NTIOF): 3.1%
9. Prosperity Bancshares Inc. (PB): 2.6%
10. Ameriprise Financial Inc (AMP): 1.8%
11. Sampo Plc (SAXPY): 3.6%
12. Mercury General Corp. (MCY): 3.9%
13. Sun Life Financial, Inc. (SLF): 3.2%
14. Prudential Financial Inc. (PRU): 4.5%
15. Old Republic International Corp. (ORI): 3.4%
16. M & T Bank Corp (MTB): 2.8%
17. Assurant Inc (AIZ): 1.7%
18. Chesapeake Financial Shares Inc (CPKF): 2%
19. Travelers Companies Inc. (TRV): 2.2%
20. PSB Holdings Inc (WI) (PSBQ): 1.6%
21. Chubb Limited (CB): 1.8%
22. Axis Capital Holdings Ltd (AXS): 2.9%
23. BancFirst Corp. (BANF): 1.9%
24. MetLife Inc (MET): 3%
25. Everest Re Group Ltd (RE): 2.3%
26. Westamerica Bancorporation (WABC): 2.6%
27. Cincinnati Financial Corp. (CINF): 2.2%
28. Cullen Frost Bankers Inc. (CFR): 2.3%
29. Community Bank System, Inc. (CBU): 2.1%
C-Ranked Retirement Suitability 1. Great Elm Capital Corp (GECC): 12.2%
2. Progressive Corp. (PGR): 4.8%
3. New York Community Bancorp Inc. (NYCB): 5.7%
4. Grupo Aval Acciones y Valores S.A. (AVAL): 4.6%
5. Sixth Street Specialty Lending Inc (TSLX): 9.5%
6. Alaris Equity Partners Income Trust (ALARF): 10.2%
7. Newtek Business Services Corp (NEWT): 9.3%
8. PennyMac Mortgage Investment Trust (PMT): 9.4%
9. Principal Financial Group Inc (PFG): 3.8%
10. Blackrock Inc. (BLK): 2%
11. Artisan Partners Asset Management Inc (APAM): 5.9%
12. Capital Southwest Corp. (CSWC): 8.5%
13. Citigroup Inc (C): 2.8%
14. Fidus Investment Corp (FDUS): 9.1%
15. Goldman Sachs BDC Inc (GSBD): 9.3%
16. HSBC Holdings plc (HSBC): 4.9%
17. Swiss Re Ltd (SSREY): 6.9%
18. Calvin b. Taylor Bankshares, Inc. (TYCB): 3.2%
19. TriplePoint Venture Growth BDC Corp (TPVG): 9.1%
20. Banco Bradesco S.A. (BBD): 4.6%
21. Comerica, Inc. (CMA): 3.6%
22. Golub Capital BDC Inc (GBDC): 7.4%
23. PennantPark Floating Rate Capital Ltd (PFLT): 9.1%
24. New Mountain Finance Corp (NMFC): 9.4%
25. Huntington Bancshares, Inc. (HBAN): 3.9%
26. RenaissanceRe Holdings Ltd (RNR): 0.9%
27. S&P Global Inc (SPGI): 0.8%
28. Ares Capital Corp (ARCC): 8.4%
29. Fairfax Financial Holdings Ltd. (FRFHF): 2.2%
30. Oxford Square Capital Corp (OXSQ): 8.5%
31. Solar Senior Capital Ltd (SUNS): 7.7%
32. FBL Financial Group, Inc. (FFG): 3.5%
33. Ellington Financial Inc (EFC): 6.7%
34. Dream Office Real Estate Investment Trust (DRETF): 4.3%
35. Stellus Capital Investment Corp (SCM): 7.6%
36. Brown & Brown, Inc. (BRO): 0.7%
37. Keycorp (KEY): 3.3%
38. Hercules Capital Inc (HTGC): 7.3%
39. Horizon Technology Finance Corp (HRZN): 7.5%
40. Gladstone Capital Corp. (GLAD): 7.1%
41. Prospect Capital Corp (PSEC): 8.9%
42. 1st Source Corp. (SRCE): 2.5%
43. American Express Co. (AXP): 1.1%
44. Commerce Bancshares, Inc. (CBSH): 1.3%
45. Choice Properties Real Estate Investment Trust (PPRQF):
4.9%
46. Erie Indemnity Co. (ERIE): 1.9%
47. Brookfield Asset Management Inc. (BAM): 1.1%
48. RLI Corp. (RLI): 0.8%
D-Ranked Retirement Suitability 1. Morgan Stanley (MS): 1.8%
2. Synchrony Financial (SYF): 2%
3. Aegon N. V. (AEG): 1.5%
4. Intercontinental Exchange Inc (ICE): 1.2%
5. Truist Financial Corporation (TFC): 3%
6. Ally Financial Inc (ALLY): 1.5%
7. Bank Of New York Mellon Corp (BK): 2.5%
8. Allstate Corp (The) (ALL): 2.5%
9. Discover Financial Services (DFS): 1.5%
10. UBS Group AG (UBS): 2.5%
11. JPMorgan Chase & Co. (JPM): 2.3%
12. Invesco Ltd (IVZ): 2.5%
13. Goldman Sachs Group, Inc. (GS): 1.4%
14. CNA Financial Corp. (CNA): 3.2%
15. Bank Of America Corp. (BAC): 1.8%
16. Main Street Capital Corporation (MAIN): 5.8%
17. Moody`s Corp. (MCO): 0.8%
18. Apollo Global Management Inc (APO): 4.4%
19. U.S. Bancorp. (USB): 2.8%
20. Gladstone Investment Corporation (GAIN): 6.1%
21. Visa Inc (V): 0.6%
22. PNC Financial Services Group (PNC): 2.4%
23. PacWest Bancorp (PACW): 2.3%
24. AllianceBernstein Holding LP (AB): 7.6%
25. Arthur J. Gallagher & Co. (AJG): 1.3%
26. Dream Industrial Real Estate Investment Trust (DREUF): 5%
27. Morningstar Inc (MORN): 0.5%
28. UMB Financial Corp. (UMBF): 1.3%
29. ING Groep N.V. (ING): 2.3%
30. Blackstone Group Inc (The) (BX): 3%
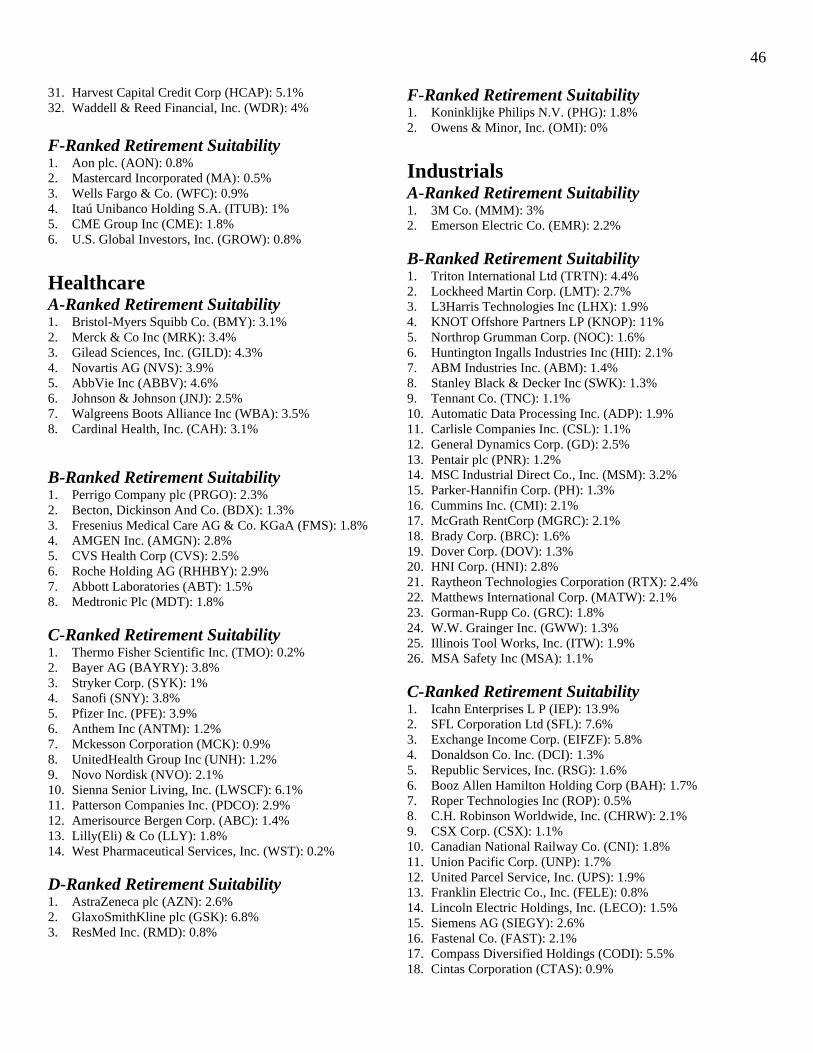
46
31. Harvest Capital Credit Corp (HCAP): 5.1%
32. Waddell & Reed Financial, Inc. (WDR): 4%
F-Ranked Retirement Suitability 1. Aon plc. (AON): 0.8%
2. Mastercard Incorporated (MA): 0.5%
3. Wells Fargo & Co. (WFC): 0.9%
4. Itaú Unibanco Holding S.A. (ITUB): 1%
5. CME Group Inc (CME): 1.8%
6. U.S. Global Investors, Inc. (GROW): 0.8%
Healthcare A-Ranked Retirement Suitability 1. Bristol-Myers Squibb Co. (BMY): 3.1%
2. Merck & Co Inc (MRK): 3.4%
3. Gilead Sciences, Inc. (GILD): 4.3%
4. Novartis AG (NVS): 3.9%
5. AbbVie Inc (ABBV): 4.6%
6. Johnson & Johnson (JNJ): 2.5%
7. Walgreens Boots Alliance Inc (WBA): 3.5%
8. Cardinal Health, Inc. (CAH): 3.1%
B-Ranked Retirement Suitability 1. Perrigo Company plc (PRGO): 2.3%
2. Becton, Dickinson And Co. (BDX): 1.3%
3. Fresenius Medical Care AG & Co. KGaA (FMS): 1.8%
4. AMGEN Inc. (AMGN): 2.8%
5. CVS Health Corp (CVS): 2.5%
6. Roche Holding AG (RHHBY): 2.9%
7. Abbott Laboratories (ABT): 1.5%
8. Medtronic Plc (MDT): 1.8%
C-Ranked Retirement Suitability 1. Thermo Fisher Scientific Inc. (TMO): 0.2%
2. Bayer AG (BAYRY): 3.8%
3. Stryker Corp. (SYK): 1%
4. Sanofi (SNY): 3.8%
5. Pfizer Inc. (PFE): 3.9%
6. Anthem Inc (ANTM): 1.2%
7. Mckesson Corporation (MCK): 0.9%
8. UnitedHealth Group Inc (UNH): 1.2%
9. Novo Nordisk (NVO): 2.1%
10. Sienna Senior Living, Inc. (LWSCF): 6.1%
11. Patterson Companies Inc. (PDCO): 2.9%
12. Amerisource Bergen Corp. (ABC): 1.4%
13. Lilly(Eli) & Co (LLY): 1.8%
14. West Pharmaceutical Services, Inc. (WST): 0.2%
D-Ranked Retirement Suitability 1. AstraZeneca plc (AZN): 2.6%
2. GlaxoSmithKline plc (GSK): 6.8%
3. ResMed Inc. (RMD): 0.8%
F-Ranked Retirement Suitability 1. Koninklijke Philips N.V. (PHG): 1.8%
2. Owens & Minor, Inc. (OMI): 0%
Industrials A-Ranked Retirement Suitability 1. 3M Co. (MMM): 3%
2. Emerson Electric Co. (EMR): 2.2%
B-Ranked Retirement Suitability 1. Triton International Ltd (TRTN): 4.4%
2. Lockheed Martin Corp. (LMT): 2.7%
3. L3Harris Technologies Inc (LHX): 1.9%
4. KNOT Offshore Partners LP (KNOP): 11%
5. Northrop Grumman Corp. (NOC): 1.6%
6. Huntington Ingalls Industries Inc (HII): 2.1%
7. ABM Industries Inc. (ABM): 1.4%
8. Stanley Black & Decker Inc (SWK): 1.3%
9. Tennant Co. (TNC): 1.1%
10. Automatic Data Processing Inc. (ADP): 1.9%
11. Carlisle Companies Inc. (CSL): 1.1%
12. General Dynamics Corp. (GD): 2.5%
13. Pentair plc (PNR): 1.2%
14. MSC Industrial Direct Co., Inc. (MSM): 3.2%
15. Parker-Hannifin Corp. (PH): 1.3%
16. Cummins Inc. (CMI): 2.1%
17. McGrath RentCorp (MGRC): 2.1%
18. Brady Corp. (BRC): 1.6%
19. Dover Corp. (DOV): 1.3%
20. HNI Corp. (HNI): 2.8%
21. Raytheon Technologies Corporation (RTX): 2.4%
22. Matthews International Corp. (MATW): 2.1%
23. Gorman-Rupp Co. (GRC): 1.8%
24. W.W. Grainger Inc. (GWW): 1.3%
25. Illinois Tool Works, Inc. (ITW): 1.9%
26. MSA Safety Inc (MSA): 1.1%
C-Ranked Retirement Suitability 1. Icahn Enterprises L P (IEP): 13.9%
2. SFL Corporation Ltd (SFL): 7.6%
3. Exchange Income Corp. (EIFZF): 5.8%
4. Donaldson Co. Inc. (DCI): 1.3%
5. Republic Services, Inc. (RSG): 1.6%
6. Booz Allen Hamilton Holding Corp (BAH): 1.7%
7. Roper Technologies Inc (ROP): 0.5%
8. C.H. Robinson Worldwide, Inc. (CHRW): 2.1%
9. CSX Corp. (CSX): 1.1%
10. Canadian National Railway Co. (CNI): 1.8%
11. Union Pacific Corp. (UNP): 1.7%
12. United Parcel Service, Inc. (UPS): 1.9%
13. Franklin Electric Co., Inc. (FELE): 0.8%
14. Lincoln Electric Holdings, Inc. (LECO): 1.5%
15. Siemens AG (SIEGY): 2.6%
16. Fastenal Co. (FAST): 2.1%
17. Compass Diversified Holdings (CODI): 5.5%
18. Cintas Corporation (CTAS): 0.9%

47
19. Snap-on, Inc. (SNA): 2%
20. Textron Inc. (TXT): 0.1%
21. A.O. Smith Corp. (AOS): 1.5%
22. Nordson Corp. (NDSN): 0.7%
23. Waste Management, Inc. (WM): 1.6%
24. Expeditors International Of Washington, Inc. (EXPD): 0.9%
25. Caterpillar Inc. (CAT): 1.8%
D-Ranked Retirement Suitability 1. FedEx Corp (FDX): 0.9%
2. Canadian Pacific Railway Ltd (CP): 0.8%
3. Ritchie Bros Auctioneers Inc (RBA): 1.5%
4. Paccar Inc. (PCAR): 1.5%
5. Toro Co. (TTC): 0.9%
6. Carrier Global Corp (CARR): 1.1%
7. Ryder System, Inc. (R): 2.7%
8. Chorus Aviation, Inc. (CHRRF): 2.6%
9. Honeywell International Inc (HON): 1.7%
10. Norfolk Southern Corp. (NSC): 1.4%
11. Otis Worldwide Corp (OTIS): 1.2%
12. Paychex Inc. (PAYX): 2.5%
13. ABB Ltd. (ABB): 2.7%
14. Rockwell Automation Inc (ROK): 1.6%
15. Thomson-Reuters Corp (TRI): 1.7%
16. Deere & Co. (DE): 0.9%
17. Trane Technologies plc (TT): 1.4%
18. Xylem Inc (XYL): 1%
19. Badger Meter Inc. (BMI): 0.8%
F-Ranked Retirement Suitability 1. Oshkosh Corp (OSK): 1%
2. Nielsen Holdings plc (NLSN): 0.9%
3. Johnson Controls International plc (JCI): 1.7%
4. Kansas City Southern (KSU): 0.7%
5. General Electric Co. (GE): 0.3%
6. Eaton Corporation plc (ETN): 2.1%
7. Covanta Holding Corporation (CVA): 2.1%
Real Estate A-Ranked Retirement Suitability 1. National Health Investors, Inc. (NHI): 6.1%
B-Ranked Retirement Suitability 1. Geo Group, Inc. (GEO): 17.5%
2. New Residential Investment Corp (NRZ): 7.5%
3. CyrusOne Inc (CONE): 3%
4. Office Properties Income Trust (OPI): 7.9%
5. Macerich Co. (MAC): 4.4%
6. Orchid Island Capital Inc (ORC): 14.4%
7. Realty Income Corp. (O): 4.1%
8. Federal Realty Investment Trust (FRT): 3.8%
9. Essex Property Trust, Inc. (ESS): 2.9%
10. W. P. Carey Inc (WPC): 5.6%
11. Universal Health Realty Income Trust (UHT): 4.2%
12. AGNC Investment Corp (AGNC): 8%
13. Physicians Realty Trust (DOC): 5%
14. National Retail Properties Inc (NNN): 4.3%
15. Tanger Factory Outlet Centers, Inc. (SKT): 4.2%
C-Ranked Retirement Suitability 1. Brookfield Property Partners L.P. (BPY): 7.4%
2. Landmark Infrastructure Partners LP (LMRK): 6.4%
3. SL Green Realty Corp. (SLG): 4.9%
4. Preferred Apartment Communities Inc (APTS): 6.9%
5. LTC Properties, Inc. (LTC): 5.5%
6. Omega Healthcare Investors, Inc. (OHI): 7.2%
7. Two Harbors Investment Corp (TWO): 9.5%
8. Healthcare Trust of America Inc (HTA): 4.4%
9. MGM Growth Properties LLC (MGP): 5.6%
10. New York Mortgage Trust Inc (NYMT): 8.8%
11. CorEnergy Infrastructure Trust Inc (CORR): 3.3%
12. Annaly Capital Management Inc (NLY): 10%
13. Medical Properties Trust Inc (MPW): 5.2%
14. Whitestone REIT (WSR): 4.3%
15. Sabra Healthcare REIT Inc (SBRA): 6.7%
16. Simon Property Group, Inc. (SPG): 4.3%
17. Broadmark Realty Capital Inc (BRMK): 7.9%
18. Easterly Government Properties Inc (DEA): 4.9%
19. CoreSite Realty Corporation (COR): 4.1%
20. Chimera Investment Corp (CIM): 9.3%
21. Spirit Realty Capital Inc (SRC): 5.3%
22. Iron Mountain Inc. (IRM): 6.2%
23. Starwood Property Trust Inc (STWD): 7.5%
24. Global Net Lease Inc (GNL): 8.3%
25. Gladstone Commercial Corp (GOOD): 7.2%
26. American Tower Corp. (AMT): 2%
27. ARMOUR Residential REIT Inc (ARR): 9.8%
28. Blackstone Mortgage Trust Inc (BXMT): 7.8%
29. AvalonBay Communities Inc. (AVB): 3.3%
30. Public Storage (PSA): 2.9%
31. VEREIT Inc (VER): 4.1%
32. Gaming and Leisure Properties Inc (GLPI): 5.6%
33. Dynex Capital, Inc. (DX): 8.1%
34. Brixmor Property Group Inc (BRX): 3.9%
35. Digital Realty Trust Inc (DLR): 3%
36. Arbor Realty Trust Inc. (ABR): 7.5%
37. Apollo Commercial Real Estate Finance Inc (ARI): 9.3%
D-Ranked Retirement Suitability 1. Innovative Industrial Properties Inc (IIPR): 3.1%
2. Hannon Armstrong Sustainable Infrastructure capital Inc
(HASI): 2.9%
3. Equinix Inc (EQIX): 1.6%
4. VICI Properties Inc (VICI): 4.4%
5. Boston Properties, Inc. (BXP): 3.6%
6. Agree Realty Corp. (ADC): 3.5%
7. Crown Castle International Corp (CCI): 2.9%
8. UDR Inc (UDR): 3.2%
9. STAG Industrial Inc (STAG): 4%
10. Ventas Inc (VTR): 3.3%
11. Store Capital Corp (STOR): 4.1%
12. Alexandria Real Estate Equities Inc. (ARE): 2.4%
13. Ladder Capital Corp (LADR): 6.9%
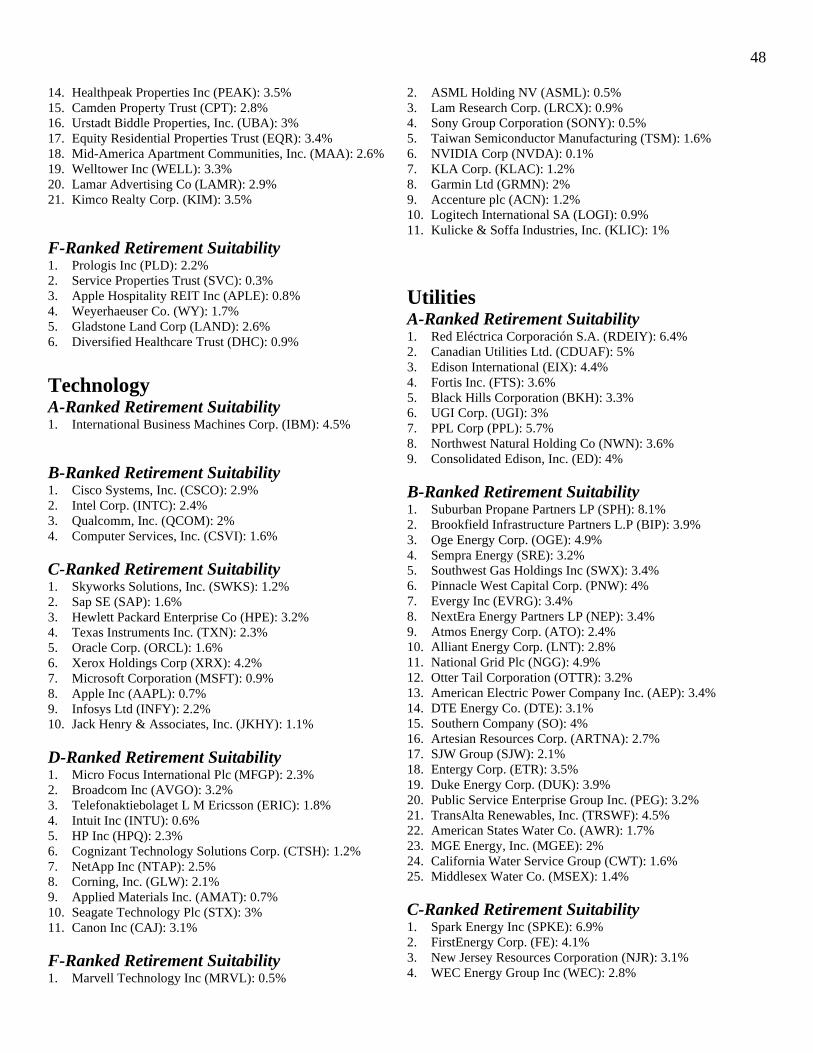
48
14. Healthpeak Properties Inc (PEAK): 3.5%
15. Camden Property Trust (CPT): 2.8%
16. Urstadt Biddle Properties, Inc. (UBA): 3%
17. Equity Residential Properties Trust (EQR): 3.4%
18. Mid-America Apartment Communities, Inc. (MAA): 2.6%
19. Welltower Inc (WELL): 3.3%
20. Lamar Advertising Co (LAMR): 2.9%
21. Kimco Realty Corp. (KIM): 3.5%
F-Ranked Retirement Suitability 1. Prologis Inc (PLD): 2.2%
2. Service Properties Trust (SVC): 0.3%
3. Apple Hospitality REIT Inc (APLE): 0.8%
4. Weyerhaeuser Co. (WY): 1.7%
5. Gladstone Land Corp (LAND): 2.6%
6. Diversified Healthcare Trust (DHC): 0.9%
Technology A-Ranked Retirement Suitability 1. International Business Machines Corp. (IBM): 4.5%
B-Ranked Retirement Suitability 1. Cisco Systems, Inc. (CSCO): 2.9%
2. Intel Corp. (INTC): 2.4%
3. Qualcomm, Inc. (QCOM): 2%
4. Computer Services, Inc. (CSVI): 1.6%
C-Ranked Retirement Suitability 1. Skyworks Solutions, Inc. (SWKS): 1.2%
2. Sap SE (SAP): 1.6%
3. Hewlett Packard Enterprise Co (HPE): 3.2%
4. Texas Instruments Inc. (TXN): 2.3%
5. Oracle Corp. (ORCL): 1.6%
6. Xerox Holdings Corp (XRX): 4.2%
7. Microsoft Corporation (MSFT): 0.9%
8. Apple Inc (AAPL): 0.7%
9. Infosys Ltd (INFY): 2.2%
10. Jack Henry & Associates, Inc. (JKHY): 1.1%
D-Ranked Retirement Suitability 1. Micro Focus International Plc (MFGP): 2.3%
2. Broadcom Inc (AVGO): 3.2%
3. Telefonaktiebolaget L M Ericsson (ERIC): 1.8%
4. Intuit Inc (INTU): 0.6%
5. HP Inc (HPQ): 2.3%
6. Cognizant Technology Solutions Corp. (CTSH): 1.2%
7. NetApp Inc (NTAP): 2.5%
8. Corning, Inc. (GLW): 2.1%
9. Applied Materials Inc. (AMAT): 0.7%
10. Seagate Technology Plc (STX): 3%
11. Canon Inc (CAJ): 3.1%
F-Ranked Retirement Suitability 1. Marvell Technology Inc (MRVL): 0.5%
2. ASML Holding NV (ASML): 0.5%
3. Lam Research Corp. (LRCX): 0.9%
4. Sony Group Corporation (SONY): 0.5%
5. Taiwan Semiconductor Manufacturing (TSM): 1.6%
6. NVIDIA Corp (NVDA): 0.1%
7. KLA Corp. (KLAC): 1.2%
8. Garmin Ltd (GRMN): 2%
9. Accenture plc (ACN): 1.2%
10. Logitech International SA (LOGI): 0.9%
11. Kulicke & Soffa Industries, Inc. (KLIC): 1%
Utilities A-Ranked Retirement Suitability 1. Red Eléctrica Corporación S.A. (RDEIY): 6.4%
2. Canadian Utilities Ltd. (CDUAF): 5%
3. Edison International (EIX): 4.4%
4. Fortis Inc. (FTS): 3.6%
5. Black Hills Corporation (BKH): 3.3%
6. UGI Corp. (UGI): 3%
7. PPL Corp (PPL): 5.7%
8. Northwest Natural Holding Co (NWN): 3.6%
9. Consolidated Edison, Inc. (ED): 4%
B-Ranked Retirement Suitability 1. Suburban Propane Partners LP (SPH): 8.1%
2. Brookfield Infrastructure Partners L.P (BIP): 3.9%
3. Oge Energy Corp. (OGE): 4.9%
4. Sempra Energy (SRE): 3.2%
5. Southwest Gas Holdings Inc (SWX): 3.4%
6. Pinnacle West Capital Corp. (PNW): 4%
7. Evergy Inc (EVRG): 3.4%
8. NextEra Energy Partners LP (NEP): 3.4%
9. Atmos Energy Corp. (ATO): 2.4%
10. Alliant Energy Corp. (LNT): 2.8%
11. National Grid Plc (NGG): 4.9%
12. Otter Tail Corporation (OTTR): 3.2%
13. American Electric Power Company Inc. (AEP): 3.4%
14. DTE Energy Co. (DTE): 3.1%
15. Southern Company (SO): 4%
16. Artesian Resources Corp. (ARTNA): 2.7%
17. SJW Group (SJW): 2.1%
18. Entergy Corp. (ETR): 3.5%
19. Duke Energy Corp. (DUK): 3.9%
20. Public Service Enterprise Group Inc. (PEG): 3.2%
21. TransAlta Renewables, Inc. (TRSWF): 4.5%
22. American States Water Co. (AWR): 1.7%
23. MGE Energy, Inc. (MGEE): 2%
24. California Water Service Group (CWT): 1.6%
25. Middlesex Water Co. (MSEX): 1.4%
C-Ranked Retirement Suitability 1. Spark Energy Inc (SPKE): 6.9%
2. FirstEnergy Corp. (FE): 4.1%
3. New Jersey Resources Corporation (NJR): 3.1%
4. WEC Energy Group Inc (WEC): 2.8%

49
5. Superior Plus Corp. (SUUIF): 4.4%
6. NextEra Energy Inc (NEE): 2.1%
7. Xcel Energy, Inc. (XEL): 2.5%
8. Essential Utilities Inc (WTRG): 2.2%
9. NextEra Energy Inc (NEE): 2.1%
10. Middlesex Water Co. (MSEX): 1.4%
D-Ranked Retirement Suitability 1. Consolidated Water Co. Ltd. (CWCO): 2.9%
2. CenterPoint Energy Inc. (CNP): 2.7%
3. Dominion Energy Inc (D): 3.2%
4. Algonquin Power & Utilities Corp (AQN): 4.1%
5. Brookfield Renewable Partners LP (BEP): 3.3%
6. Exelon Corp. (EXC): 3.4%
F-Ranked Retirement Suitability 1. Global Water Resources Inc (GWRS): 1.8%

50
This information is not personalized advice. It is for informational purposes only. Please see disclaimer at end of newsletter for more.
Sell Rules, Past Recommendations, Pending Sells, & Past Sells
Sell Rules Except in extreme circumstances, we will not issue sell recommendations – even if
the sell rules below are triggered – unless a security has been held for 1 year or
longer to qualify for lower long-term capital gains tax rates in taxable accounts.
Sell Rule #1 | Dividend-Based Sell Rules: Any past recommendation that
reduces or eliminates its dividend is automatically a pending sell. We review and
analyze these securities to determine when to initiate the final sale.
Secondly, any past recommendation that has an “F” Dividend Risk Score is
automatically reviewed for safety and a sell may be issued. We will only
recommend selling up to two securities a month so that the reinvestment of sale
proceeds is not concentrated in a short time frame.
Sell Rule #2 | Valuation-Based Sell Rules: Sell past recommendations with
expected total returns below the expected total returns of the greater of either the
S&P 500 over the next several years or the yield on the 20-year T-Bond. We
calculate our estimate of the long-term returns of the S&P 500 as the S&P 500’s
dividend yield plus nominal (not inflation-adjusted) GDP growth, less valuation
multiple mean reversion over 10 years.
We calculate our estimate of the long-term returns of the S&P 500 using the
simplified expected total returns method, which is the S&P 500’s dividend yield
plus nominal (not inflation-adjusted) GDP growth less valuation multiple mean
reversion over 10 years.
We currently estimate long-term U.S. nominal GDP growth at 5.5%, the S&P
500’s dividend yield at 1.4%, and valuation multiple mean reversion at -9.9%
(S&P 500 fair value P/E of 15.94 versus current P/E of 44.97) for an expected total
returns sell threshold of -3.0%. The 20-year T-Bond currently has a yield of 2.1%,
so our expected total returns sell threshold is 2.1%.
This expected total returns calculation uses the ‘approximate’ total return method
of simply adding expected total returns from dividend yield, growth rate, and
valuation multiple change.
Past recommendations at or below this sell threshold are in red in the Unsold Past
Recommendations table below. We will only recommend up to two valuation-
based sells a month; and fewer if there are sells based on the first sell rule.

51
This information is not personalized advice. It is for informational purposes only. Please see disclaimer at end of newsletter for more.
Unsold Past Recommendations8
Name Ticker Time Since 1st Rec. (Years)
DR Score
5-Year Expected
Total Returns
CAGR9 Total
Return
S&P 500 (SPY) Total
Return
Omega Healthcare OHI 4.5 F 9.3% 12.6% 70.7% 113.9%
Enterprise Product EPD 4.5 B 7.1% 6.0% 29.7% 113.9%
AT&T T 4.5 B 9.8% 3.2% 15.1% 113.9%
Magellan Midstream MMP 4.5 C 13.9% -0.2% -0.9% 113.9%
Sunoco SUN 4.0 C 11.0% 16.1% 81.8% 88.3%
ONEOK OKE 3.3 C 8.4% 6.0% 21.5% 62.3%
Altria MO 3.0 B 8.6% 3.6% 11.3% 62.3%
STAG Industrial STAG 2.6 F 4.2% 19.7% 58.5% 60.0%
Verizon VZ 2.6 B 9.7% 8.4% 22.9% 60.0%
Leggett & Platt LEG 2.5 B 1.2% 24.1% 70.8% 61.0%
General Mills GIS 2.5 C 5.4% 18.5% 52.6% 61.0%
AbbVie ABBV 2.5 A 8.5% 17.0% 47.8% 61.0%
IBM IBM 2.5 B 4.8% 13.6% 37.2% 61.0%
Hanesbrands HBI 2.3 B 2.1% 27.2% 74.3% 69.5%
Newell Brands NWL 2.3 D -2.8% 23.2% 61.9% 69.5%
Cardinal Health CAH 2.3 A 6.7% 12.2% 30.4% 69.5%
MSC Industrial Direct MSM 1.4 C 3.7% 35.2% 53.1% 37.1%
Chevron CVX 1.2 C 4.9% 5.1% 6.4% 28.0%
United Parcel Service UPS 1.2 B 1.4% 123.0% 153.7% 56.2%
Polaris PII 1.1 A 7.0% 156.0% 172.1% 54.5%
Bank OZK OZK 1.1 A 1.6% 133.6% 146.9% 54.5%
Franklin Resources BEN 1.1 A 2.2% 110.9% 121.4% 54.5%
Genuine Parts GPC 1.1 A 1.5% 84.3% 91.8% 54.5%
National Fuel Gas NFG 1.1 A 6.7% 36.0% 38.8% 54.5%
Walgreens Boots WBA 1.1 A 6.3% 27.0% 29.0% 54.5%
Weyco WEYS 1.1 B 4.6% 12.1% 12.9% 54.5%
Unum Group UNM 1.0 A 7.5% N/A 114.2% 45.6%
Archer-Daniels-Mid. ADM 1.0 A 3.0% N/A 94.4% 45.6%
Federal Realty FRT 1.0 B 4.3% N/A 58.8% 45.6%
Old Republic ORI 0.9 C 5.9% N/A 72.7% 38.7%
Mercury General MCY 0.9 C 5.9% N/A 68.7% 38.7%
Philip Morris PM 0.9 C 6.0% N/A 42.3% 38.7%
Realty Income O 0.9 C 6.0% N/A 12.6% 38.7%
8 This does not include our past “special recommendations” which aren’t part of the regular Sure Retirement.
Newsletter strategy. Total returns data is from morning 5/7/21 and Sure Analysis Research data is from the 5/7/21
spreadsheet. 9 Compound annual growth rate (CAGR) is only available for past recommendations with 1+ year holding periods.

52
This information is not personalized advice. It is for informational purposes only. Please see disclaimer at end of newsletter for more.
British American Tob. BTI 0.9 C 11.7% N/A 8.9% 38.7%
M&T Bank MTB 0.8 B 5.3% N/A 64.2% 34.6%
Edison International EIX 0.6 B 8.7% N/A 18.0% 25.3%
John Wiley & Sons JW.A 0.5 B -0.2% N/A 87.1% 19.1%
Gilead Sciences GILD 0.4 B 11.7% N/A 12.5% 15.8%
H&R Block HRB 0.3 B 5.4% N/A 46.2% 11.0%
Lazard LAZ 0.1 C 10.6% N/A 6.2% 6.1%
National Health Inv. NHI 0.1 C 11.9% N/A -7.4% 6.1%
MPLX MPLX 0.1 C 10.5% N/A 11.8% 1.8%
OGE Energy OGE 0.1 C 10.8% N/A 5.0% 1.8%
Sold Positions Name Ticker 1st Rec. Date Sell Date
Total Return
S&P 500 (SPY) Total Return
Waddell & Reed Financial WDR 11/7/2016 11/6/2017 34.4% 23.9%
Gladstone Financial GAIN 2/6/2017 7/9/2018 49.7% 24.8%
R.R. Donnelley & Sons RRD 6/11/2018 8/13/2018 -28.2% 1.7%
Vector Group VGR 8/7/2017 12/10/2018 -35.1% 9.0%
New Residential NRZ 10/15/2018 12/10/2018 -7.7% -3.8%
Spectra Energy SEP 11/7/2016 1/14/2019 9.6% 26.2%
Holly Energy HEP 12/5/2016 1/14/2019 6.9% 21.7%
Welltower WELL 1/8/2018 2/11/2019 31.1% 0.7%
W.P. Carey WPC 2/6/2017 3/11/2019 37.7% 26.4%
Senior Housing Properties SNH 2/5/2018 3/11/2019 -16.0% 7.5%
TC PipeLines TCP 12/5/2016 4/15/2019 -16.5% 37.7%
AmeriGas Partners APU 1/3/2017 4/15/2019 -8.3% 34.3%
Buckeye Partners BPL 11/7/2016 5/13/2019 -17.7% 38.3%
Owens & Minor OMI 11/6/2017 9/9/2019 -58.8% 19.1%
Urstadt Biddle UBA 11/7/2016 10/14/2019 31.2% 47.1%
Western Union WU 10/15/2018 11/11/2019 55.8% 17.1%
Target TGT 11/6/2017 12/9/2019 129.8% 25.9%
Qualcomm QCOM 12/10/2018 1/13/2020 64.8% 27.3%
Western Digital WDC 2/11/2019 2/12/2020 59.3% 27.0%
L Brands LB 8/13/2018 3/9/2020 -26.2% 0.1%
WestRock WRK 2/11/2019 11/9/2021 15.4% 35.4
Eaton Vance EV 4/13/2020 3/1/2021 142.1% 44.0%
People’s United Financial PBCT 11/12/2018 3/15/2021 30.1% 51.8%
Kohl’s KSS 5/8/2017 3/15/2021 88.3% 77.6%
Average sold position total return: 23.9%
S&P 500 (SPY) average position total return: 25.8%

53
This information is not personalized advice. It is for informational purposes only. Please see disclaimer at end of newsletter for more.
Pending Sells
Name & Ticker Recommend Date Total Return10
Genesis Energy (GEL) November 2016 -55.9%
Energy Transfer (ET) November 2016 2.3%
Macy’s (M) May 2017 -23.7%
Occidental Petroleum (OXY) June 2017 -45.6%
Suburban Propane (SPH) July 2017 -10.5%
Royal Dutch Shell (RDS.B) July 2017 -13.4%
Invesco (IVZ) May 2018 16.8%
Kraft Heinz (KHC) October 2018 -9.1%
Foot Locker (FL) November 2018 32.9%
Tanger Factory Outlet (SKT) April 2019 3.2%
We will initiate final sell recommendations for all of the above pending sells based on
valuation, momentum, and holding period. We are reviewing with every newsletter for
the final sell recommendation.
10 Total returns start with the market close price of the first trading day after the newsletter recommendation. Prior
to March 2018, this was the first trading day after the first Sunday of the month. As of March 2018, and later, this is
generally the first trading day after the second Sunday of the month. Closing price data is from market close 5/7/21.

54
This information is not personalized advice. It is for informational purposes only. Please see disclaimer at end of newsletter for more.
Buying & Ranking Criteria
The method we use to come up with the Top 10 buys for The Sure Retirement
Newsletter is as follows:
Note: Ranking data is from the most recent Sure Analysis report on the
Wednesday morning preceding the publication of the newsletter.
1. Filter our Sure Analysis Research Database universe of securities for:
- 10%+ Expected Total Returns
- Dividend Yield of 4%+
- Retirement Suitability Score of A
- Dividend Risk Score of A
- U.S. securities only
- Qualitative dividend safety check
2. Sort by Expected Total Returns (highest first)
3. If fewer than 10 securities, allow “B” ranked Dividend Risk Score securities. If
there are still fewer than 10 securities, allow “C” ranked Dividend Risk Score
securities. If still fewer than 10 securities, allow “B” ranked Retirement
Suitability Score securities. If still fewer than 10 securities, repeat the steps above
with a 1 percentage point lower expected total return threshold each time.
4. No more than 3 REITs and 3 MLPs in each newsletter
5. Veto any securities from the Top 10 as necessary after qualitative analysis
6. The Top 10 are the 10 highest Expected Total Returns securities from steps 1
through 4 above
Dividend Risk Scores are sorted into quintiles (A is top 20%, B is top 40%, C is top 60%,
and so on) based on the formula below:
Dividend Risk Score (Raw) = Payout Ratio x 100 – # Years of Steady or Rising
Dividends + 50 if deemed risky during a recession
Only the top 10% of securities in our Sure Analysis Research Database receive an “A”
Retirement Suitability Score. “B” ranked securities are the next 25% of securities. The
Retirement Suitability Score uses the following formula:
Retirement Suitability Score (Raw) = (1 – Dividend Risk Score Percentile) + Dividend
Yield Percentile
Our formula for Expected Total Returns is based on our expected growth returns,
valuation returns, and dividend returns.
The combination of a high Retirement Suitability Score with high Expected Total Returns
means The Sure Retirement Newsletter looks for high-yielding securities with strong total
returns potential and good or better safety scores.

55
This information is not personalized advice. It is for informational purposes only. Please see disclaimer at end of newsletter for more.
Portfolio Building Guide
The process of building a high-yield dividend portfolio is straightforward: Each month invest
in the top-ranked security in which you own the smallest dollar amount out of the Top 10.
Over time, you will build a well-diversified portfolio of quality businesses purchased when they
yield 4% or more. If your portfolio has 25% or more allocated to one sector, buy the highest
ranked security not in that sector. Alternatively, the Top 10 list is also useful as an idea
generation tool for those with a different portfolio allocation plan.
Examples Portfolio 1 Portfolio 2
Ticker Name Amount Ticker Name Amount
GILD Gilead Sciences $ 1,002 GILD Gilead Sciences $ 4,374
MMP Magellan Midstream $ - MMP Magellan Midstream $ 4,878
NHI National Health Investors $ - NHI National Health Investors $ 5,374
SUN Sunoco $ - SUN Sunoco $ 4,353
MPLX MPLX $ - MPLX MPLX $ 7,312
OGE OGE Energy $ - OGE OGE Energy $ 2,799
T AT&T $ - T AT&T $ 2,952
VZ Verizon $ - VZ Verizon $ 6,660
ABBV AbbVie $ - ABBV AbbVie $ 2,367
MO Altria $ - MO Altria $ 2,818
- If you had portfolio 1, you would buy MMP, the top-ranked security you own least.
- If you had portfolio 2, you would buy ABBV, the top-ranked security you own least.
If you have an existing portfolio or a large lump sum to invest, switch over to the Sure
Retirement Strategy over 20 months. Each month take 1/20 of your initial portfolio value and
buy the top-ranked security you own the least out of the Top 10 (if that sector makes up less than
25% of your portfolio). When you sell a security, use the proceeds to purchase the top-ranked
security you own the least.
This simple investing process will build a diversified portfolio of high-quality dividend or
distribution securities over a period of less than 2 years. There’s nothing magical about 20
months. A period of 15 months or 30 months will yield similar results.
If your portfolio grows too large to manage comfortably (for example, you are not comfortable
holding 40+ securities – which would happen after around 4 years of the Sure Dividend System),
you will need to sell holdings. We recommend eliminating positions that have the lowest yields.
You can combine recommendations from The Sure Retirement and Sure Dividend Newsletters by
targeting a specific yield for your overall portfolio. When you need your portfolio yield to
increase, invest from The Sure Retirement Newsletter. If less yield is required (and growth is
preferred), invest from The Sure Dividend Newsletter. The Sure Analysis Research Database
can also be used to supplement the newsletters.

56
This information is not personalized advice. It is for informational purposes only. Please see disclaimer at end of newsletter for more.
Tax Guide There are 4 broad types of investment vehicles covered in The Sure Retirement Newsletter:
1. Corporations
2. Master Limited Partnerships (MLPs)
3. Real Estate Investment Trusts (REITs)
4. Business Development Companies (BDCs)
The organization form is important for tax purposes because it determines how efficiently a
company can return money to unit or shareholders. An example is below.
Imagine a company makes $10, pre-tax, and distributes 100% to investors. The image below
shows how much of the $10 would go to investors using standard assumptions for the three
investment vehicles:
Notes: Tax treatment for BDCs and REITs is similar. BDCs have been omitted from the
images below because of this. The image below takes into account the pass-through entity
tax breaks from Trump’s Tax Act, which will expire in 2025. The tables below assume that
80% of MLP distributions are returns of capital, and 20% are ordinary income. It assumes
that 70% of REIT payments are ordinary income; and capital gains and return of capital
each make up 15% of REIT payments.
• $6.32 in after-tax income from a Corporation
• $7.45 in after-tax income from a REIT
• $8.13 in after-tax income from an MLP
The image below gives an overview of the different organizational forms:
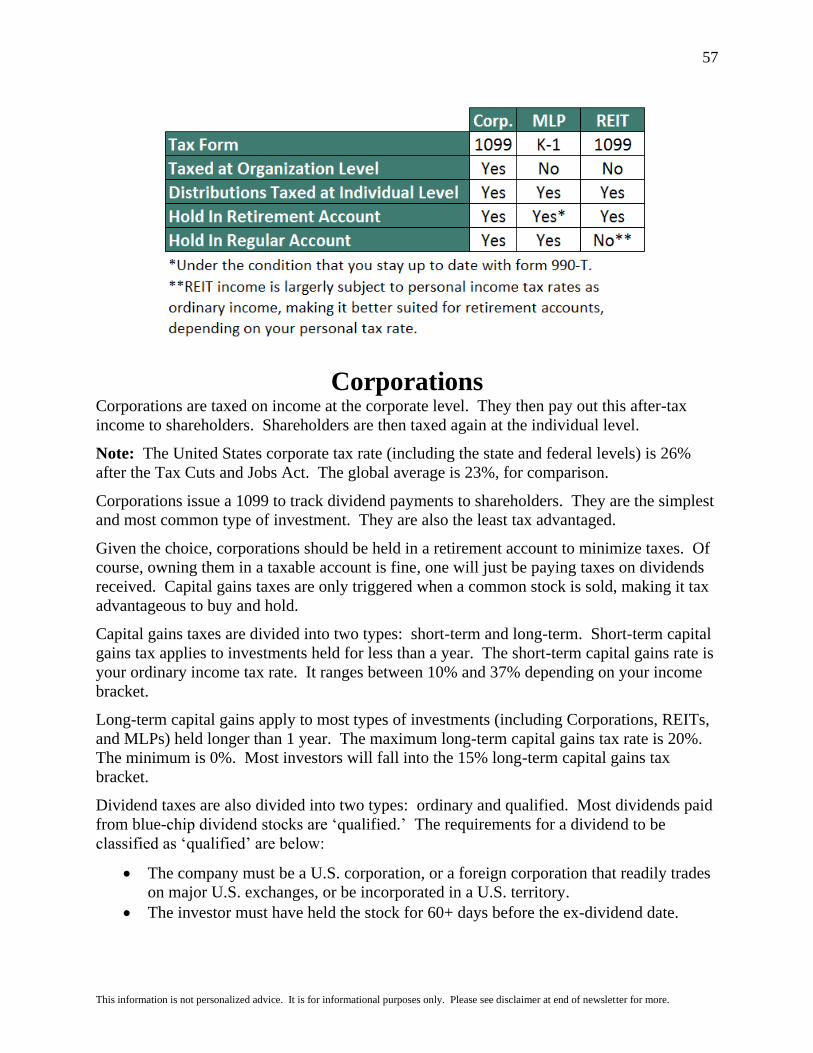
57
This information is not personalized advice. It is for informational purposes only. Please see disclaimer at end of newsletter for more.
Corporations Corporations are taxed on income at the corporate level. They then pay out this after-tax
income to shareholders. Shareholders are then taxed again at the individual level.
Note: The United States corporate tax rate (including the state and federal levels) is 26%
after the Tax Cuts and Jobs Act. The global average is 23%, for comparison.
Corporations issue a 1099 to track dividend payments to shareholders. They are the simplest
and most common type of investment. They are also the least tax advantaged.
Given the choice, corporations should be held in a retirement account to minimize taxes. Of
course, owning them in a taxable account is fine, one will just be paying taxes on dividends
received. Capital gains taxes are only triggered when a common stock is sold, making it tax
advantageous to buy and hold.
Capital gains taxes are divided into two types: short-term and long-term. Short-term capital
gains tax applies to investments held for less than a year. The short-term capital gains rate is
your ordinary income tax rate. It ranges between 10% and 37% depending on your income
bracket.
Long-term capital gains apply to most types of investments (including Corporations, REITs,
and MLPs) held longer than 1 year. The maximum long-term capital gains tax rate is 20%.
The minimum is 0%. Most investors will fall into the 15% long-term capital gains tax
bracket.
Dividend taxes are also divided into two types: ordinary and qualified. Most dividends paid
from blue-chip dividend stocks are ‘qualified.’ The requirements for a dividend to be
classified as ‘qualified’ are below:
• The company must be a U.S. corporation, or a foreign corporation that readily trades
on major U.S. exchanges, or be incorporated in a U.S. territory.
• The investor must have held the stock for 60+ days before the ex-dividend date.

58
This information is not personalized advice. It is for informational purposes only. Please see disclaimer at end of newsletter for more.
Qualified dividends are taxed at the same rate as long-term capital gains; between 0% and
20% (though most investors will be in the 15% bracket). Ordinary dividends are dividends
that do not meet the criteria to be ‘qualified.’ Ordinary dividends are taxed at the ordinary
income tax rate.
Master Limited Partnerships (MLPs) MLPs are the most tax efficient vehicle for returning money to investors. They avoid the
double taxation issues of Corporations. MLPs are not taxed at the organization level.
Unfortunately, MLPs are also the most complicated.
Typically, somewhere around 80% to 90% of MLP distributions are considered a ‘return
of capital’ because of depreciation. You don’t pay taxes immediately on ‘return of
capital’ distributions.
Returns of capital reduce your cost basis in the MLP. You are not taxed until you sell the
units.
For example, imagine you buy 10 units of an MLP at $100 a unit for a total investment of
$1,000. Now imagine you hold for 5 years.
The MLP unit price has increased to $120. Your investment is now worth $1,200. It also
paid out $37.50 per unit in distributions over this time, with 80% of that being a return of
capital ($37.50 x 80% = $30 return of capital).
The 20% of distributions that were not returns of capital would be taxed at your ordinary
income tax rate, which is up to 37%. These taxes would be due the year they are accrued.
Your cost basis would be $700 (initial investment amount of $1,000 less return of capital
of $30 per unit or $300 total). The amount of long-term capital gains tax you owe
(assuming you are in the 20% tax bracket) is $100.
Math Behind Example: Sale price of $1,200 less cost basis of $700 = $500 in capital
gains. $500 in capital gains x 20% tax bracket = $100.
As a caveat, if the cost basis ever falls below 0 (which will only happen after holding for
around a decade or more), you will owe long-term capital gains tax on the amount the
cost basis is below 0 every year.
Return of capital and other issues discussed above do not matter when MLPs are held in a
retirement account.
There is a different issue with holding MLPs in a retirement account, however. This
includes 401(k), IRA, and Roth IRA accounts, among others.
When retirement plans conduct or invest in a business activity, they must file separate tax
forms to report Unrelated Business Income (UBI) and may owe tax on Unrelated
Business Taxable Income (UBTI). UBTI tax brackets go up to 37% (the top personal
rate).
59
This information is not personalized advice. It is for informational purposes only. Please see disclaimer at end of newsletter for more.
MLPs issue K-1 forms for tax reporting. K-1s report business income, expense, and loss
to owners. Therefore, MLPs held in retirement accounts may still qualify to pay taxes.
If UBI for all holdings in your retirement account is over $1,000, you must have your
retirement account provider (typically, your brokerage) file Form 990-T. You will want
to file form 990-T as well if you have a UBI loss to get a loss carryforward for
subsequent tax years. Failure to file form 990-T and pay Unrelated Business Income Tax
(UBIT) can lead to severe penalties. Fortunately, UBIs are often negative. It is a fairly
rare occurrence to owe taxes on UBI.
The subject of MLP taxation can be complicated and confusing. Hiring a tax
professional to aid in preparing taxes is a viable option for dealing with the complexity.
The bottom line is this: MLPs are tax-advantaged vehicles that are suited for investors
looking for current income. It is fine to hold them in either taxable or non-taxable
(retirement) accounts. Since retirement accounts are already tax-deferred, holding MLPs
in taxable accounts allows you to ‘get credit’ for the full effects of their unique structure.
Real Estate Investment Trusts (REITs) Like MLPs, REITs avoid double taxation. REITs are not taxed at the organization level.
REITs are in between MLPs and Corporations in terms of both complexity and tax-
advantages. REITs are required to pay out 90%+ of their income.
REITs are organized as trusts. As a result, ‘shareholders’ are actually unit holders.
REITs issue 1099 forms (just like corporations) instead of K-1 forms (like MLPs do).
Unit holders receive distributions, not dividends (just like MLPs). REIT distributions fall
into three categories:
• Ordinary income
• Return of capital
• Capital gains
Ordinary income is taxed at your ordinary income tax rate; up to 37%. Return of capital
reduces your cost basis (just as it does with MLPs). Capital gains are taxed at either
short-term or long-term capital gains rates.
The percentage of distributions from these three sources varies by REIT. In general,
ordinary income tends to be the majority of the distribution. Expect around 70% of
distributions as ordinary income, 15% as a return of capital, and 15% as capital gains.
REITs are best suited for retirement accounts because the majority of their payments are
taxed as ordinary income. Retirement accounts remove this negative and make REITs
very tax advantageous.

60
This information is not personalized advice. It is for informational purposes only. Please see disclaimer at end of newsletter for more.
This doesn’t mean you should never own a REIT in a taxable account. A good
investment is a good investment, regardless of tax issues. If you have the choice, REITs
should definitely be placed in a retirement account such as an IRA or 401k.
Business Development Companies (BDCs) Much like REITs, business development companies must pay out 90%+ of their income
as distributions. Additionally, business development companies must derive 90% of their
gross income from interest, dividends, or capital gains on securities.
BDCs pay their distributions as a mix of:
• Ordinary income & non-qualified dividends
• Qualified dividends
• Return of capital
• Capital gains
Just as with MLPs, returns of capital reduce your tax basis. Qualified dividends and
long-term capital gains are taxed at lower rates, while ordinary income and non-qualified
dividends are taxed at your personal income tax bracket rate.
Unfortunately, 70% to 80% of BDC income is typically derived from ordinary income.
Because of this, they make excellent vehicles for tax-advantaged retirement accounts
such as an IRA or 401k.
Please email us at [email protected] with any questions you have on taxes
regarding retirement accounts, MLPs, REITs, and BDCs. Frequently asked questions
will be added to this tax guide.
As a newsletter provider, we can’t provide specific personal investment advice, only
general information.

61
Disclaimer
Nothing presented herein is, or is intended to constitute, specific investment advice. Nothing in this newsletter should be construed as a recommendation to follow any investment strategy or allocation. Any forward-looking statements or forecasts are based on assumptions and actual results are expected to vary from any such statements
or forecasts. No reliance should be placed on any such statements or forecasts when making any investment decision. While Sure Dividend has used reasonable efforts
to obtain information from reliable sources, we make no representations or warranties as to the accuracy, reliability or completeness of third-party information presented herein. No guarantee of investment performance is being provided and no inference to the contrary should be made. There is a risk of loss from an investment in
securities. Past performance is not a guarantee of future performance.
Glossary of Common Terms & Acronyms
Adjusted Funds From Operations (AFFO): A term used to describe Funds From Operations (FFO),
plus non-recurring items that do not impact the long-term fundamentals of the business. See FFO in
this glossary for more.
Cash Available for Distribution (CAD): This term is also referred to as funds available for
distribution (FAD). It is the cash available to be distributed to unitholders. It is most commonly seen
with REITs. CAD is calculated by subtracting recurring capital expenditures from funds from
operations.
Distributable Cash Flow (DCF): A non-GAAP (Generally Accepted Accounting Principles)
financial metric frequently utilized by Master Limited Partnerships as an alternative to earnings-per-
share. Expresses cash available for unitholder distributions, after payments to the General Partner.
Calculated by adding non-cash items, such as depreciation and one-time expenses, to net income.
Viewed as a better gauge of financial health than earnings-per-share, as MLPs operate asset-heavy
business models with significant depreciation expenses.
Dividend Yield: The annual dividend returns from an investment, expressed as a percentage. The
dividend yield is calculated from the annual dividend per share, divided by the stock price per share.
MLPs and REITs pay distributions, not dividends. Distribution yield is used for them instead of
dividend yield, though some companies (notably REITs) call it a dividend for ease of understanding by
the public.
Dividend Payout Ratio: The percentage of earnings paid to shareholders as a dividend. The payout
ratio is calculated from the annual dividend per share, divided by annual earnings-per-share. For MLPs
and REITs, this is typically expressed as the distribution coverage ratio.
EBITDA: Earnings before interest, taxes, depreciation, and amortization. Used by companies with
high levels of depreciation and interest costs, such as MLPs, to indicate the financial health of a
business. A similar metric to operating cash flow. Frequently used as part of leverage ratios such as
debt-to-EBITDA.
Funds From Operations (FFO): A non-GAAP financial metric frequently utilized by Real Estate
Investment Trusts, as an alternative to earnings-per-share. FFO is calculated by adding depreciation
and amortization expenses to net income, minus any gains on asset sales. REITs view FFO as a more
accurate gauge of financial health since earnings-per-share are heavily impacted by depreciation and
amortization expenses.
GAAP: Generally accepted accounting principles. These are legally required, standardized accounting
rules and procedures used when preparing financial statements.
If you read a term in The Sure Retirement Newsletter not on this list with which you are unfamiliar,
please email [email protected]. We will explain the term and add it to the glossary in next
month’s edition.