
Supramolecular Polymerization Provides Non-Equilibrium ...Supramolecular Polymerization Provides...
77
Supramolecular Polymerization Provides Non-Equilibrium Product Distributions of Imine-Linked Macrocycles Michael J. Strauss, Austin M. Evans, Ioannina Castano, Rebecca L. Li, and William R. Dichtel* Department of Chemistry, Northwestern University, Evanston, IL, 60208 USA Supplementary Information Table of Contents A. Materials and Instrumentation S-6 I. Materials II. Instrumentation B. Synthetic Procedures S-8 C. 1 H and 13 C NMR of Monomers S-17 D. Dilution Experiments: Macrocycle and Nanotube Characterization S-18 I. Characterization of MC 1 II. Characterization of MC 2 E. Kinetic Experiments: Macrocycle and Nanotube Characterization S-38 I. Characterization of MC 1 Kinetics II. Characterization of MC 2 Kinetics F. Scrambling Experiments: Macrocycle and Nanotube Characterization S-45 G. Competition Experiments: Macrocycle and Nanotube Characterization S-54 H. Monomer Exchange Experiments: Macrocycle and Nanotube Characterization S-63 I. Monomer Exchange of MC 2 II. Monomer Exchange of MC 1 III. Monomer Exchange of 5-Br-IDA MC I. Small Molecule 1 H NMR Studies S-73 I. Small Molecule Competition 1 H NMR Study II. Small Molecule ‘Scrambling’ 1 H NMR Study J. References S-77 Correspondence Address Professor William R. Dichtel Department of Chemistry Northwestern University 2145 Sheridan Road Evanston, IL 60208 United States [email protected] Electronic Supplementary Material (ESI) for Chemical Science. This journal is © The Royal Society of Chemistry 2020
Transcript of Supramolecular Polymerization Provides Non-Equilibrium ...Supramolecular Polymerization Provides...

Supramolecular Polymerization Provides Non-Equilibrium Product Distributions of Imine-Linked Macrocycles
Michael J. Strauss, Austin M. Evans, Ioannina Castano, Rebecca L. Li, and William R. Dichtel*
Department of Chemistry, Northwestern University, Evanston, IL, 60208 USA
Supplementary Information
Table of Contents A. Materials and Instrumentation S-6
I. Materials II. Instrumentation
B. Synthetic Procedures S-8 C. 1H and 13C NMR of Monomers S-17 D. Dilution Experiments: Macrocycle and Nanotube Characterization S-18
I. Characterization of MC 1 II. Characterization of MC 2
E. Kinetic Experiments: Macrocycle and Nanotube Characterization S-38 I. Characterization of MC 1 Kinetics
II. Characterization of MC 2 Kinetics F. Scrambling Experiments: Macrocycle and Nanotube Characterization S-45 G. Competition Experiments: Macrocycle and Nanotube Characterization S-54 H. Monomer Exchange Experiments: Macrocycle and Nanotube Characterization S-63
I. Monomer Exchange of MC 2 II. Monomer Exchange of MC 1
III. Monomer Exchange of 5-Br-IDA MC I. Small Molecule 1H NMR Studies S-73
I. Small Molecule Competition 1H NMR Study II. Small Molecule ‘Scrambling’ 1H NMR Study
J. References S-77
Correspondence Address Professor William R. Dichtel Department of Chemistry Northwestern University
2145 Sheridan Road Evanston, IL 60208 United States
Electronic Supplementary Material (ESI) for Chemical Science.This journal is © The Royal Society of Chemistry 2020
S-2
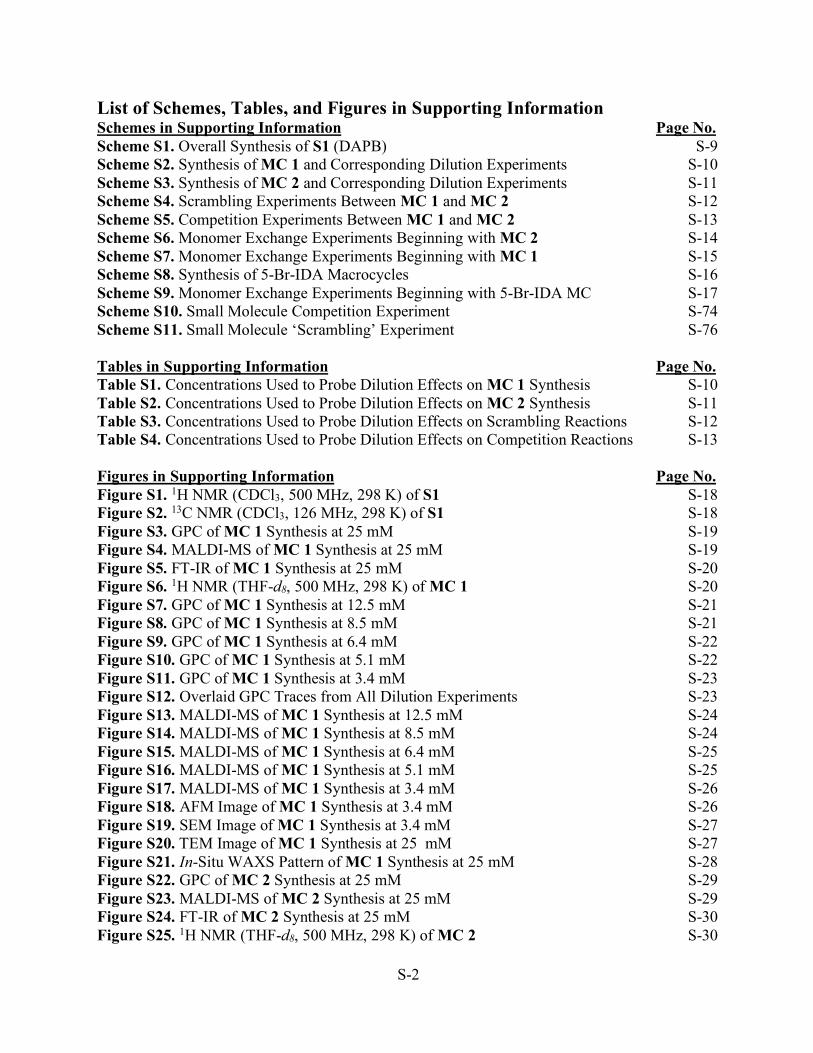
List of Schemes, Tables, and Figures in Supporting Information Schemes in Supporting Information Page No. Scheme S1. Overall Synthesis of S1 (DAPB) S-9 Scheme S2. Synthesis of MC 1 and Corresponding Dilution Experiments S-10 Scheme S3. Synthesis of MC 2 and Corresponding Dilution Experiments S-11 Scheme S4. Scrambling Experiments Between MC 1 and MC 2 S-12 Scheme S5. Competition Experiments Between MC 1 and MC 2 S-13 Scheme S6. Monomer Exchange Experiments Beginning with MC 2 S-14 Scheme S7. Monomer Exchange Experiments Beginning with MC 1 S-15 Scheme S8. Synthesis of 5-Br-IDA Macrocycles S-16 Scheme S9. Monomer Exchange Experiments Beginning with 5-Br-IDA MC S-17 Scheme S10. Small Molecule Competition Experiment S-74 Scheme S11. Small Molecule ‘Scrambling’ Experiment S-76 Tables in Supporting Information Page No. Table S1. Concentrations Used to Probe Dilution Effects on MC 1 Synthesis S-10 Table S2. Concentrations Used to Probe Dilution Effects on MC 2 Synthesis S-11 Table S3. Concentrations Used to Probe Dilution Effects on Scrambling Reactions S-12 Table S4. Concentrations Used to Probe Dilution Effects on Competition Reactions S-13 Figures in Supporting Information Page No. Figure S1. 1H NMR (CDCl3, 500 MHz, 298 K) of S1 S-18 Figure S2. 13C NMR (CDCl3, 126 MHz, 298 K) of S1 S-18 Figure S3. GPC of MC 1 Synthesis at 25 mM S-19 Figure S4. MALDI-MS of MC 1 Synthesis at 25 mM S-19 Figure S5. FT-IR of MC 1 Synthesis at 25 mM S-20 Figure S6. 1H NMR (THF-d8, 500 MHz, 298 K) of MC 1 S-20 Figure S7. GPC of MC 1 Synthesis at 12.5 mM S-21 Figure S8. GPC of MC 1 Synthesis at 8.5 mM S-21 Figure S9. GPC of MC 1 Synthesis at 6.4 mM S-22 Figure S10. GPC of MC 1 Synthesis at 5.1 mM S-22 Figure S11. GPC of MC 1 Synthesis at 3.4 mM S-23 Figure S12. Overlaid GPC Traces from All Dilution Experiments S-23 Figure S13. MALDI-MS of MC 1 Synthesis at 12.5 mM S-24 Figure S14. MALDI-MS of MC 1 Synthesis at 8.5 mM S-24 Figure S15. MALDI-MS of MC 1 Synthesis at 6.4 mM S-25 Figure S16. MALDI-MS of MC 1 Synthesis at 5.1 mM S-25 Figure S17. MALDI-MS of MC 1 Synthesis at 3.4 mM S-26 Figure S18. AFM Image of MC 1 Synthesis at 3.4 mM S-26 Figure S19. SEM Image of MC 1 Synthesis at 3.4 mM S-27 Figure S20. TEM Image of MC 1 Synthesis at 25 mM S-27 Figure S21. In-Situ WAXS Pattern of MC 1 Synthesis at 25 mM S-28 Figure S22. GPC of MC 2 Synthesis at 25 mM S-29 Figure S23. MALDI-MS of MC 2 Synthesis at 25 mM S-29 Figure S24. FT-IR of MC 2 Synthesis at 25 mM S-30 Figure S25. 1H NMR (THF-d8, 500 MHz, 298 K) of MC 2 S-30
S-3
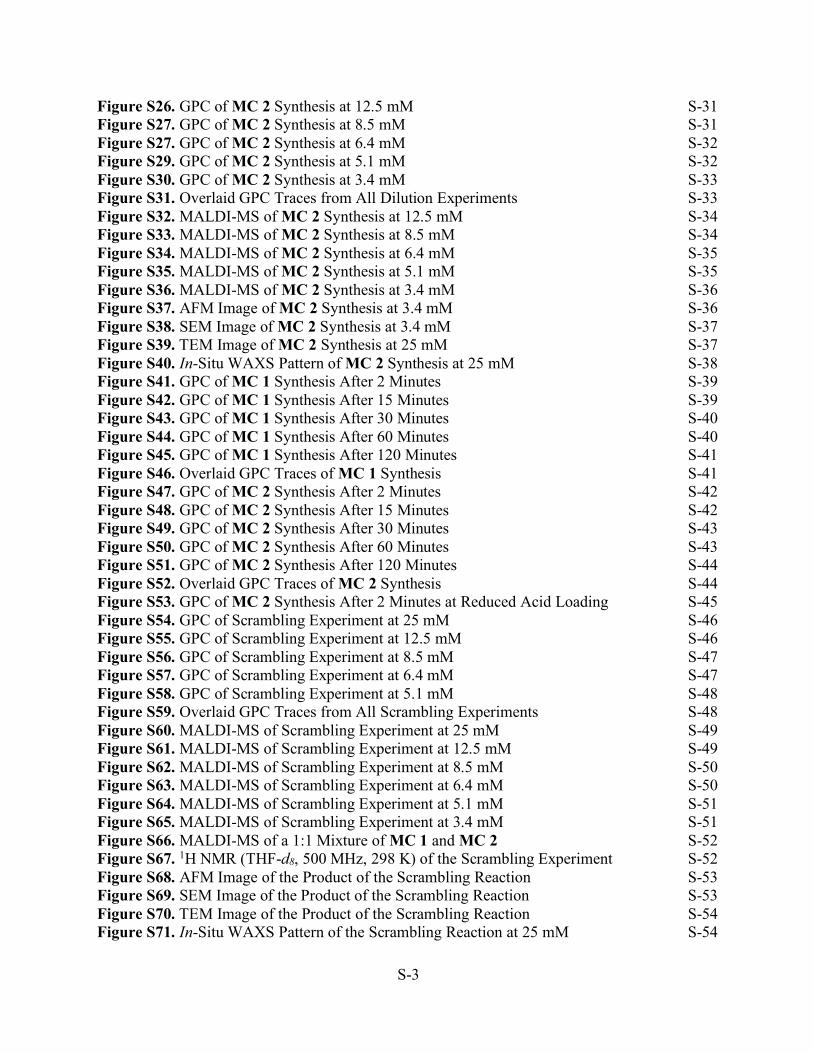
Figure S26. GPC of MC 2 Synthesis at 12.5 mM S-31 Figure S27. GPC of MC 2 Synthesis at 8.5 mM S-31 Figure S27. GPC of MC 2 Synthesis at 6.4 mM S-32 Figure S29. GPC of MC 2 Synthesis at 5.1 mM S-32 Figure S30. GPC of MC 2 Synthesis at 3.4 mM S-33 Figure S31. Overlaid GPC Traces from All Dilution Experiments S-33 Figure S32. MALDI-MS of MC 2 Synthesis at 12.5 mM S-34 Figure S33. MALDI-MS of MC 2 Synthesis at 8.5 mM S-34 Figure S34. MALDI-MS of MC 2 Synthesis at 6.4 mM S-35 Figure S35. MALDI-MS of MC 2 Synthesis at 5.1 mM S-35 Figure S36. MALDI-MS of MC 2 Synthesis at 3.4 mM S-36 Figure S37. AFM Image of MC 2 Synthesis at 3.4 mM S-36 Figure S38. SEM Image of MC 2 Synthesis at 3.4 mM S-37 Figure S39. TEM Image of MC 2 Synthesis at 25 mM S-37 Figure S40. In-Situ WAXS Pattern of MC 2 Synthesis at 25 mM S-38 Figure S41. GPC of MC 1 Synthesis After 2 Minutes S-39 Figure S42. GPC of MC 1 Synthesis After 15 Minutes S-39 Figure S43. GPC of MC 1 Synthesis After 30 Minutes S-40 Figure S44. GPC of MC 1 Synthesis After 60 Minutes S-40 Figure S45. GPC of MC 1 Synthesis After 120 Minutes S-41 Figure S46. Overlaid GPC Traces of MC 1 Synthesis S-41 Figure S47. GPC of MC 2 Synthesis After 2 Minutes S-42 Figure S48. GPC of MC 2 Synthesis After 15 Minutes S-42 Figure S49. GPC of MC 2 Synthesis After 30 Minutes S-43 Figure S50. GPC of MC 2 Synthesis After 60 Minutes S-43 Figure S51. GPC of MC 2 Synthesis After 120 Minutes S-44 Figure S52. Overlaid GPC Traces of MC 2 Synthesis S-44 Figure S53. GPC of MC 2 Synthesis After 2 Minutes at Reduced Acid Loading S-45 Figure S54. GPC of Scrambling Experiment at 25 mM S-46 Figure S55. GPC of Scrambling Experiment at 12.5 mM S-46 Figure S56. GPC of Scrambling Experiment at 8.5 mM S-47 Figure S57. GPC of Scrambling Experiment at 6.4 mM S-47 Figure S58. GPC of Scrambling Experiment at 5.1 mM S-48 Figure S59. Overlaid GPC Traces from All Scrambling Experiments S-48 Figure S60. MALDI-MS of Scrambling Experiment at 25 mM S-49 Figure S61. MALDI-MS of Scrambling Experiment at 12.5 mM S-49 Figure S62. MALDI-MS of Scrambling Experiment at 8.5 mM S-50 Figure S63. MALDI-MS of Scrambling Experiment at 6.4 mM S-50 Figure S64. MALDI-MS of Scrambling Experiment at 5.1 mM S-51 Figure S65. MALDI-MS of Scrambling Experiment at 3.4 mM S-51 Figure S66. MALDI-MS of a 1:1 Mixture of MC 1 and MC 2 S-52 Figure S67. 1H NMR (THF-d8, 500 MHz, 298 K) of the Scrambling Experiment S-52 Figure S68. AFM Image of the Product of the Scrambling Reaction S-53 Figure S69. SEM Image of the Product of the Scrambling Reaction S-53 Figure S70. TEM Image of the Product of the Scrambling Reaction S-54 Figure S71. In-Situ WAXS Pattern of the Scrambling Reaction at 25 mM S-54

S-4
Figure S72. GPC of Competition Experiment at 25 mM S-55 Figure S73. GPC of Competition Experiment at 12.5 mM S-55 Figure S74. GPC of Competition Experiment at 8.5 mM S-56 Figure S75. GPC of Competition Experiment at 6.4 mM S-56 Figure S76. GPC of Competition Experiment at 5.1 mM S-57 Figure S77. Overlaid GPC Traces from All Competition Experiments S-57 Figure S78. MALDI-MS of Competition Experiment at 25 mM S-58 Figure S79. MALDI-MS of Competition Experiment at 12.5 mM S-58 Figure S80. MALDI-MS of Competition Experiment at 8.5 mM S-59 Figure S81. MALDI-MS of Competition Experiment at 6.4 mM S-59 Figure S82. MALDI-MS of Competition Experiment at 5.1 mM S-60 Figure S83. 1H NMR (THF-d8, 500 MHz, 298 K) of the Competition Experiment S-60 Figure S84. AFM Image of the Product of the Competition Reaction S-61 Figure S85. SEM Image of the Product of the Competition Reaction S-61 Figure S86. TEM Image of the Product of the Competition Reaction S-62 Figure S87. In-Situ WAXS Pattern of the Competition Reaction at 25 mM S-62 Figure S88. GPC of the Monomer Exchange Reaction Beginning with MC 2 S-63 Figure S89. MALDI-MS of the Monomer Exchange Reaction Beginning with MC 2 S-63 Figure S90. FT-IR of the Monomer Exchange Reaction Beginning with MC 2 S-64 Figure S91. 1H NMR (THF-d8, 500 MHz, 298 K) of the Monomer Exchange Reaction S-64 Beginning with MC 2 Figure S92. AFM Image of the Monomer Exchange Beginning with MC 2 S-65 Figure S93. SEM Image of the Monomer Exchange Beginning with MC 2 S-65 Figure S94. TEM Image of the Monomer Exchange Beginning with MC 2 S-66 Figure S95. In-Situ WAXS Pattern of the Monomer Exchange Reaction Beginning S-66 with MC 2 Figure S96. GPC of the Monomer Exchange Reaction Beginning with MC 1 S-67 Figure S97. MALDI-MS of the Monomer Exchange Reaction Beginning with MC 1 S-67 Figure S98. FT-IR of the Monomer Exchange Reaction Beginning with MC 1 S-68 Figure S99. 1H NMR (THF-d8, 500 MHz, 298 K) of the Monomer Exchange Reaction S-68 Beginning with MC 1 Figure S100. Comparison of 1H NMR spectra of MC 1, MC 2, and the Product S-69 of Monomer Exchange Beginning with MC 1 Figure S101. 1H NMR Quantification of Monomer Exchange S-69 Figure S102. AFM Image of the Monomer Exchange Beginning with MC 1 S-70 Figure S103. SEM Image of the Monomer Exchange Beginning with MC 1 S-70 Figure S104. TEM Image of the Monomer Exchange Beginning with MC 1 S-71 Figure S105. In-Situ WAXS Pattern of the Monomer Exchange Reaction Beginning S-71 with MC 1 Figure S106. GPC of 5-Br-IDA Macrocycles S-72 Figure S107. MALDI-MS of 5-Br-IDA Macrocycles S-72 Figure S108. GPC of 5-Br-IDA Macrocycle Monomer Exchange S-73 Figure S109. MALDI-MS of 5-Br-IDA Macrocycle Monomer Exchange S-73 Figure S110. Stacked 1H NMR Spectra from Small Molecule Competition Reaction S-74 Figure S111. Normalized Integrations of Key Protons in Small Molecule Competition S-75 Reaction
S-5
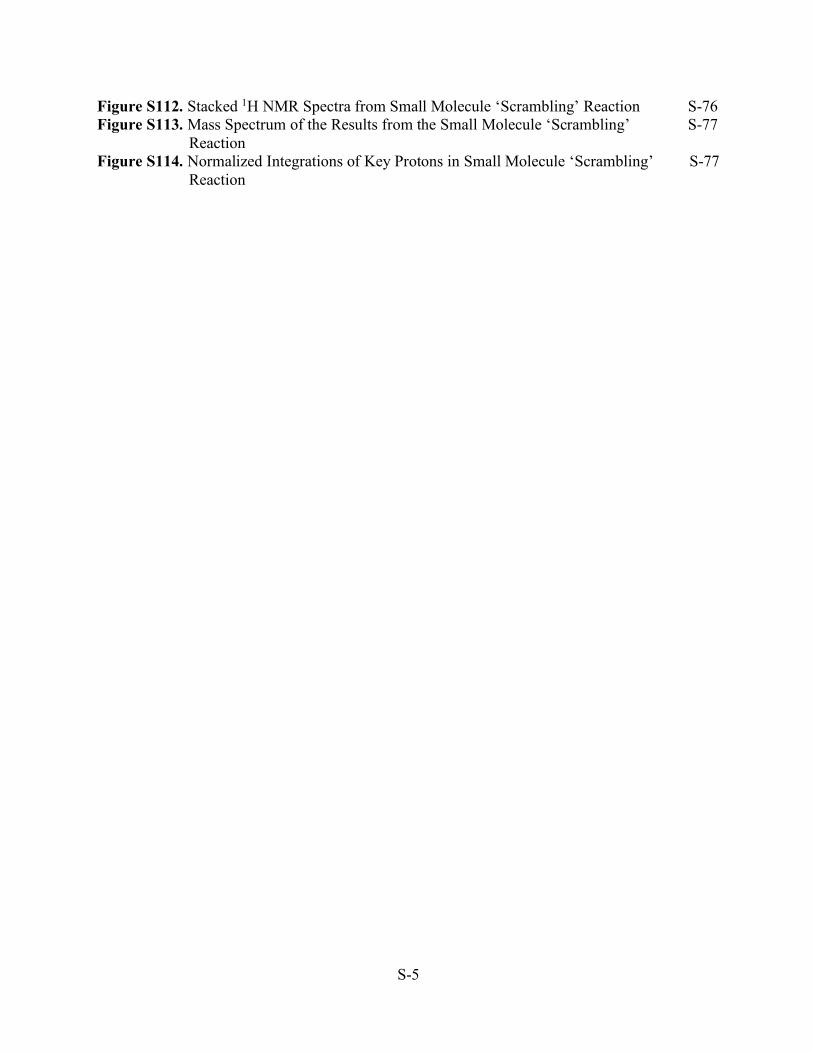
Figure S112. Stacked 1H NMR Spectra from Small Molecule ‘Scrambling’ Reaction S-76 Figure S113. Mass Spectrum of the Results from the Small Molecule ‘Scrambling’ S-77 Reaction Figure S114. Normalized Integrations of Key Protons in Small Molecule ‘Scrambling’ S-77 Reaction
S-6
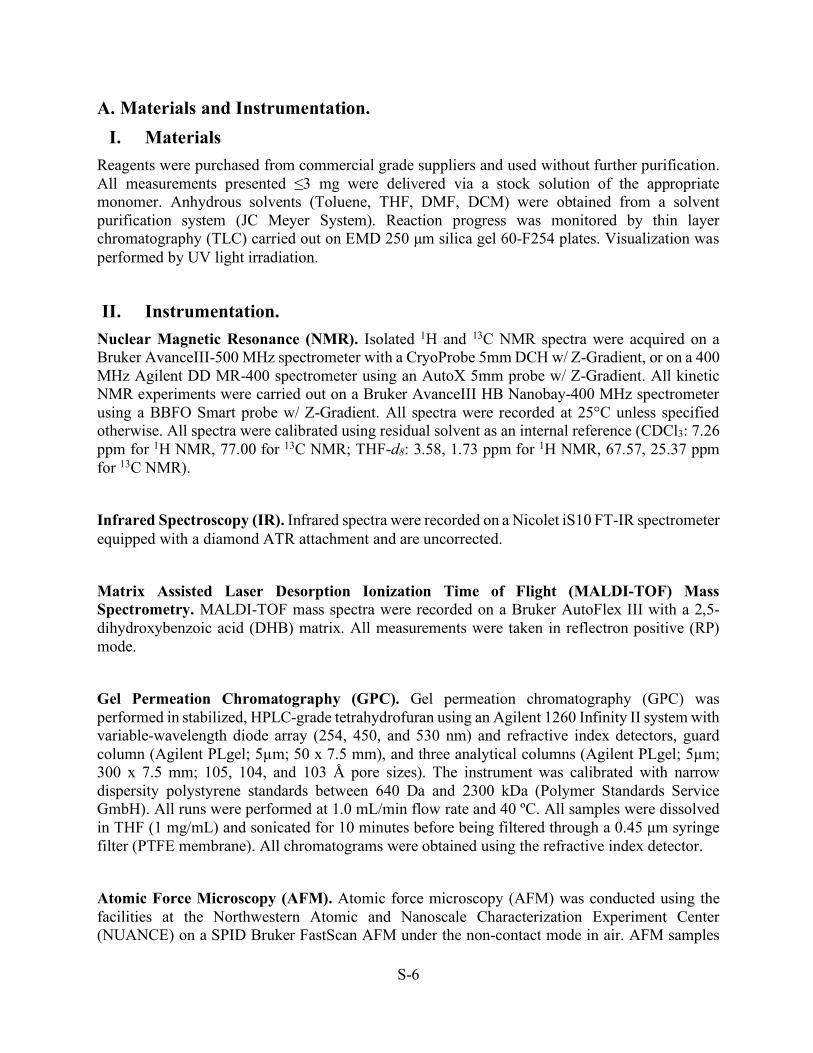
A. Materials and Instrumentation. I. Materials
Reagents were purchased from commercial grade suppliers and used without further purification. All measurements presented ≤3 mg were delivered via a stock solution of the appropriate monomer. Anhydrous solvents (Toluene, THF, DMF, DCM) were obtained from a solvent purification system (JC Meyer System). Reaction progress was monitored by thin layer chromatography (TLC) carried out on EMD 250 µm silica gel 60-F254 plates. Visualization was performed by UV light irradiation.
II. Instrumentation. Nuclear Magnetic Resonance (NMR). Isolated 1H and 13C NMR spectra were acquired on a Bruker AvanceIII-500 MHz spectrometer with a CryoProbe 5mm DCH w/ Z-Gradient, or on a 400 MHz Agilent DD MR-400 spectrometer using an AutoX 5mm probe w/ Z-Gradient. All kinetic NMR experiments were carried out on a Bruker AvanceIII HB Nanobay-400 MHz spectrometer using a BBFO Smart probe w/ Z-Gradient. All spectra were recorded at 25°C unless specified otherwise. All spectra were calibrated using residual solvent as an internal reference (CDCl3: 7.26 ppm for 1H NMR, 77.00 for 13C NMR; THF-d8: 3.58, 1.73 ppm for 1H NMR, 67.57, 25.37 ppm for 13C NMR).
Infrared Spectroscopy (IR). Infrared spectra were recorded on a Nicolet iS10 FT-IR spectrometer equipped with a diamond ATR attachment and are uncorrected. Matrix Assisted Laser Desorption Ionization Time of Flight (MALDI-TOF) Mass Spectrometry. MALDI-TOF mass spectra were recorded on a Bruker AutoFlex III with a 2,5-dihydroxybenzoic acid (DHB) matrix. All measurements were taken in reflectron positive (RP) mode.
Gel Permeation Chromatography (GPC). Gel permeation chromatography (GPC) was performed in stabilized, HPLC-grade tetrahydrofuran using an Agilent 1260 Infinity II system with variable-wavelength diode array (254, 450, and 530 nm) and refractive index detectors, guard column (Agilent PLgel; 5µm; 50 x 7.5 mm), and three analytical columns (Agilent PLgel; 5µm; 300 x 7.5 mm; 105, 104, and 103 Å pore sizes). The instrument was calibrated with narrow dispersity polystyrene standards between 640 Da and 2300 kDa (Polymer Standards Service GmbH). All runs were performed at 1.0 mL/min flow rate and 40 ºC. All samples were dissolved in THF (1 mg/mL) and sonicated for 10 minutes before being filtered through a 0.45 µm syringe filter (PTFE membrane). All chromatograms were obtained using the refractive index detector.
Atomic Force Microscopy (AFM). Atomic force microscopy (AFM) was conducted using the facilities at the Northwestern Atomic and Nanoscale Characterization Experiment Center (NUANCE) on a SPID Bruker FastScan AFM under the non-contact mode in air. AFM samples
S-7
were prepared by drop casting reaction mixtures onto silicon native oxide substrates and allowed to dry for 4 hours before imaging.
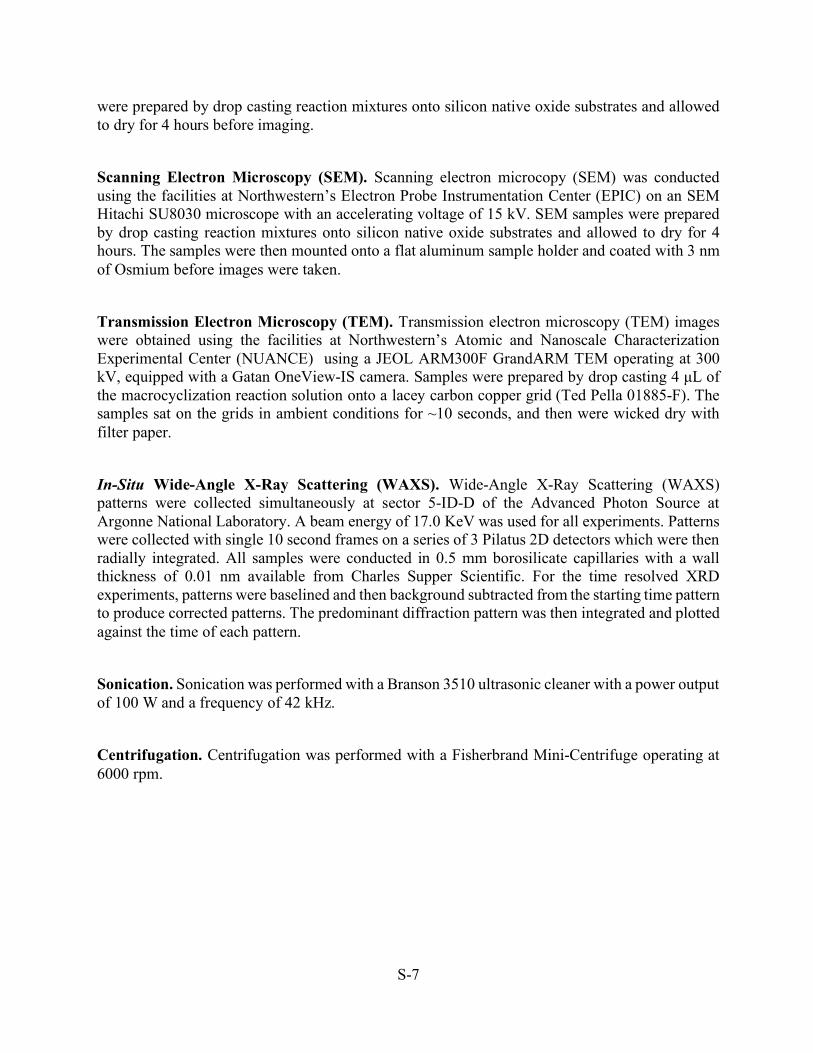
Scanning Electron Microscopy (SEM). Scanning electron microcopy (SEM) was conducted using the facilities at Northwestern’s Electron Probe Instrumentation Center (EPIC) on an SEM Hitachi SU8030 microscope with an accelerating voltage of 15 kV. SEM samples were prepared by drop casting reaction mixtures onto silicon native oxide substrates and allowed to dry for 4 hours. The samples were then mounted onto a flat aluminum sample holder and coated with 3 nm of Osmium before images were taken. Transmission Electron Microscopy (TEM). Transmission electron microscopy (TEM) images were obtained using the facilities at Northwestern’s Atomic and Nanoscale Characterization Experimental Center (NUANCE) using a JEOL ARM300F GrandARM TEM operating at 300 kV, equipped with a Gatan OneView-IS camera. Samples were prepared by drop casting 4 µL of the macrocyclization reaction solution onto a lacey carbon copper grid (Ted Pella 01885-F). The samples sat on the grids in ambient conditions for ~10 seconds, and then were wicked dry with filter paper. In-Situ Wide-Angle X-Ray Scattering (WAXS). Wide-Angle X-Ray Scattering (WAXS) patterns were collected simultaneously at sector 5-ID-D of the Advanced Photon Source at Argonne National Laboratory. A beam energy of 17.0 KeV was used for all experiments. Patterns were collected with single 10 second frames on a series of 3 Pilatus 2D detectors which were then radially integrated. All samples were conducted in 0.5 mm borosilicate capillaries with a wall thickness of 0.01 nm available from Charles Supper Scientific. For the time resolved XRD experiments, patterns were baselined and then background subtracted from the starting time pattern to produce corrected patterns. The predominant diffraction pattern was then integrated and plotted against the time of each pattern. Sonication. Sonication was performed with a Branson 3510 ultrasonic cleaner with a power output of 100 W and a frequency of 42 kHz.
Centrifugation. Centrifugation was performed with a Fisherbrand Mini-Centrifuge operating at 6000 rpm.
S-8
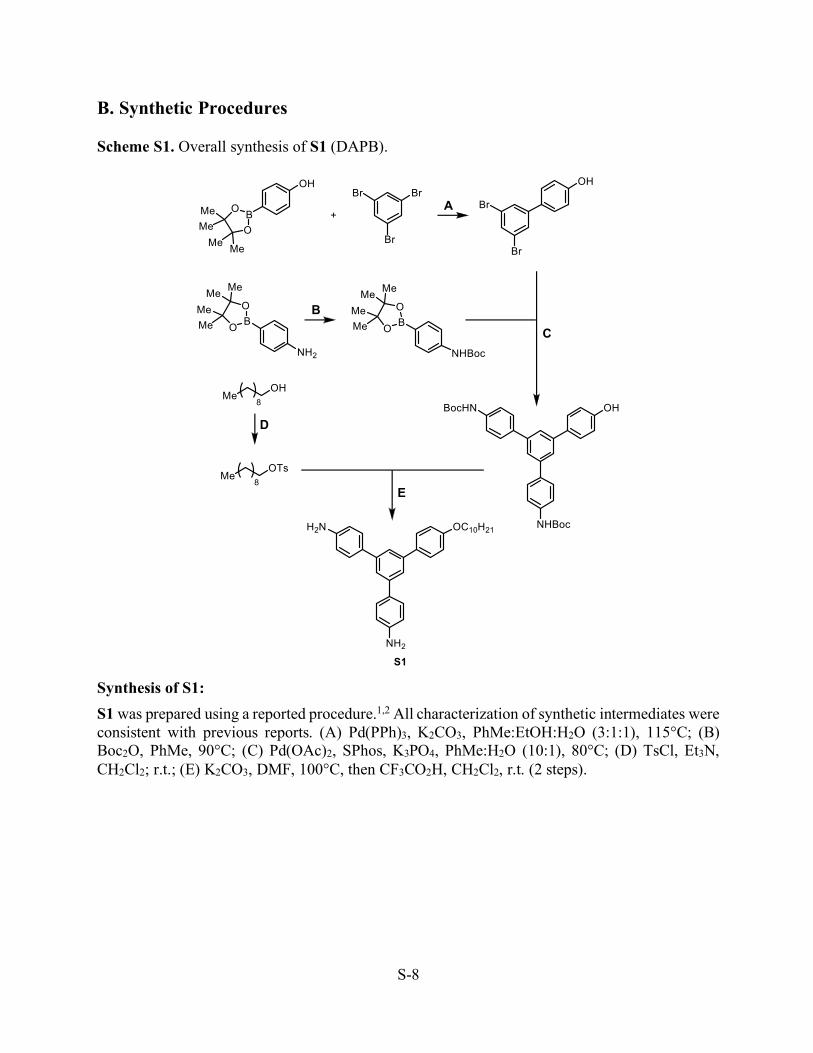
B. Synthetic Procedures Scheme S1. Overall synthesis of S1 (DAPB).
Synthesis of S1: S1 was prepared using a reported procedure.1,2 All characterization of synthetic intermediates were consistent with previous reports. (A) Pd(PPh)3, K2CO3, PhMe:EtOH:H2O (3:1:1), 115°C; (B) Boc2O, PhMe, 90°C; (C) Pd(OAc)2, SPhos, K3PO4, PhMe:H2O (10:1), 80°C; (D) TsCl, Et3N, CH2Cl2; r.t.; (E) K2CO3, DMF, 100°C, then CF3CO2H, CH2Cl2, r.t. (2 steps).
S-9
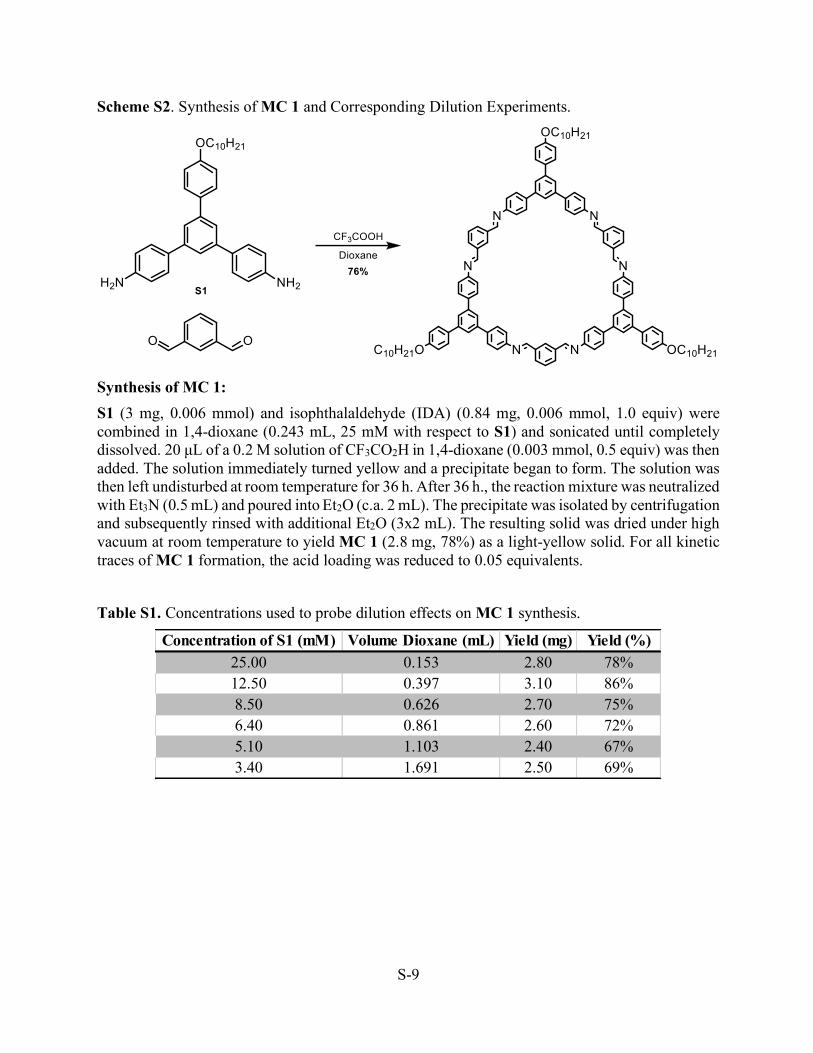
Scheme S2. Synthesis of MC 1 and Corresponding Dilution Experiments.
Synthesis of MC 1: S1 (3 mg, 0.006 mmol) and isophthalaldehyde (IDA) (0.84 mg, 0.006 mmol, 1.0 equiv) were combined in 1,4-dioxane (0.243 mL, 25 mM with respect to S1) and sonicated until completely dissolved. 20 µL of a 0.2 M solution of CF3CO2H in 1,4-dioxane (0.003 mmol, 0.5 equiv) was then added. The solution immediately turned yellow and a precipitate began to form. The solution was then left undisturbed at room temperature for 36 h. After 36 h., the reaction mixture was neutralized with Et3N (0.5 mL) and poured into Et2O (c.a. 2 mL). The precipitate was isolated by centrifugation and subsequently rinsed with additional Et2O (3x2 mL). The resulting solid was dried under high vacuum at room temperature to yield MC 1 (2.8 mg, 78%) as a light-yellow solid. For all kinetic traces of MC 1 formation, the acid loading was reduced to 0.05 equivalents.
Table S1. Concentrations used to probe dilution effects on MC 1 synthesis.
Concentration of S1 (mM) Volume Dioxane (mL) Yield (mg) Yield (%)25.00 0.153 2.80 78%12.50 0.397 3.10 86%8.50 0.626 2.70 75%6.40 0.861 2.60 72%5.10 1.103 2.40 67%3.40 1.691 2.50 69%

S-10
Scheme S3. Synthesis of MC 2 and Corresponding Dilution Experiments.
Synthesis of MC 2: S1 (3 mg, 0.006 mmol) and 2,6-pyridinedicarboxaldehyde (0.84 mg, 0.006 mmol, 1.0 equiv) were combined in 1,4-dioxane (0.243 mL, 25 mM with respect to S1) and sonicated until completely dissolved. 20 µL of a 0.2 M solution of CF3CO2H in 1,4-dioxane (0.003 mmol, 0.5 equiv) was then added. The solution immediately turned yellow and a precipitate began to form. The solution was then left undisturbed at room temperature for 36 h. After 36 h., the reaction mixture was neutralized with Et3N (0.5 mL) and poured into Et2O (c.a. 2 mL). The precipitate was isolated by centrifugation and subsequently rinsed with additional Et2O (3x2 mL). The resulting solid was dried under high vacuum at room temperature to yield the desired MC 2 (3.1 mg, 86%) as a light brown solid. For all kinetic traces of MC 2 formation, the acid loading was reduced to 0.05 equivalents.
Table S2. Concentrations used to probe dilution effects on MC 2 synthesis.
Concentration of S1 (mM) Volume Dioxane (mL) Yield (mg) Yield (%)25.00 0.153 3.10 86%12.50 0.397 3.40 94%8.50 0.626 3.00 83%6.40 0.861 3.10 86%5.10 1.103 3.10 86%3.40 1.691 3.10 86%
S-11
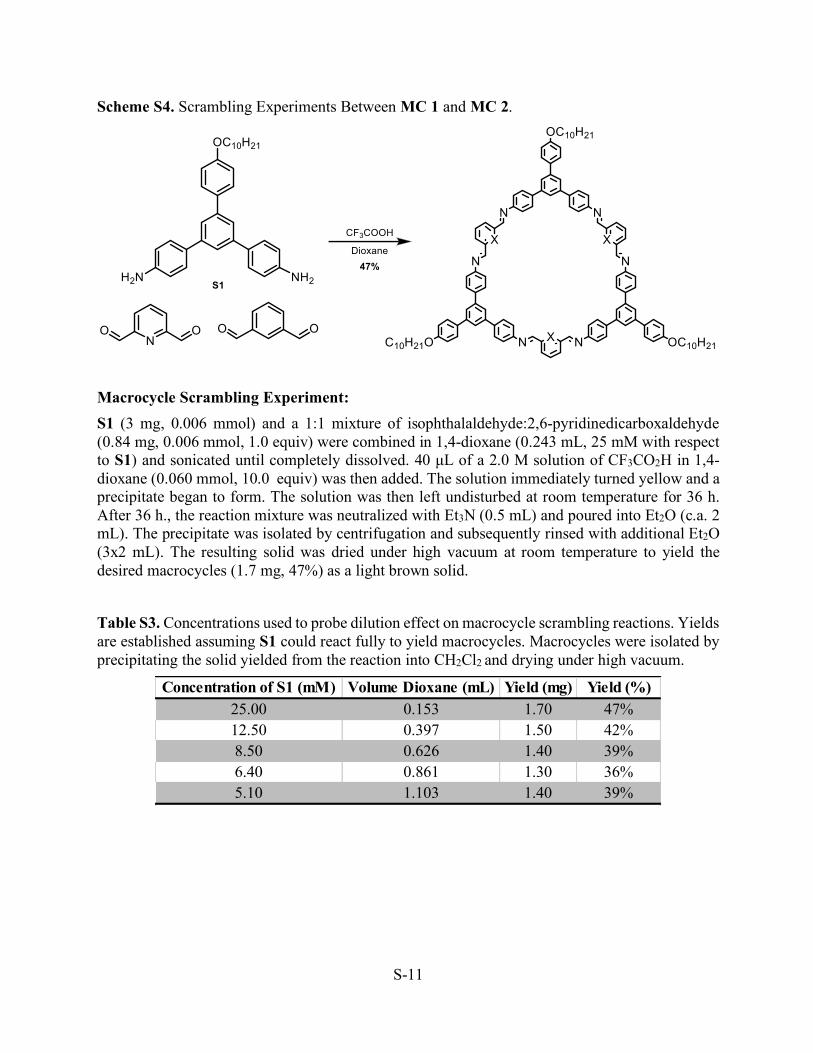
Scheme S4. Scrambling Experiments Between MC 1 and MC 2.
Macrocycle Scrambling Experiment: S1 (3 mg, 0.006 mmol) and a 1:1 mixture of isophthalaldehyde:2,6-pyridinedicarboxaldehyde (0.84 mg, 0.006 mmol, 1.0 equiv) were combined in 1,4-dioxane (0.243 mL, 25 mM with respect to S1) and sonicated until completely dissolved. 40 µL of a 2.0 M solution of CF3CO2H in 1,4-dioxane (0.060 mmol, 10.0 equiv) was then added. The solution immediately turned yellow and a precipitate began to form. The solution was then left undisturbed at room temperature for 36 h. After 36 h., the reaction mixture was neutralized with Et3N (0.5 mL) and poured into Et2O (c.a. 2 mL). The precipitate was isolated by centrifugation and subsequently rinsed with additional Et2O (3x2 mL). The resulting solid was dried under high vacuum at room temperature to yield the desired macrocycles (1.7 mg, 47%) as a light brown solid.
Table S3. Concentrations used to probe dilution effect on macrocycle scrambling reactions. Yields are established assuming S1 could react fully to yield macrocycles. Macrocycles were isolated by precipitating the solid yielded from the reaction into CH2Cl2 and drying under high vacuum.
Concentration of S1 (mM) Volume Dioxane (mL) Yield (mg) Yield (%)25.00 0.153 1.70 47%12.50 0.397 1.50 42%8.50 0.626 1.40 39%6.40 0.861 1.30 36%5.10 1.103 1.40 39%

S-12
Scheme S5. Competition Experiments Between MC 1 and MC 2.
Macrocycle Competition Experiment: S1 (3 mg, 0.006 mmol) and a 1:1 mixture of isophthalaldehyde:2,6-pyridinedicarboxaldehyde (1.68 mg, 0.012 mmol, 2.0 equiv) were combined in 1,4-dioxane (0.243 mL, 25 mM with respect to S1) and sonicated until completely dissolved. 40 µL of a 2.0 M solution of CF3CO2H in 1,4-dioxane (0.060 mmol, 10.0 equiv) was then added. The solution immediately turned yellow and a precipitate began to form. The solution was then left undisturbed at room temperature for 36 h. After 36 h., the reaction mixture was neutralized with Et3N (0.5 mL) and poured into Et2O (c.a. 2 mL). The precipitate was isolated by centrifugation and subsequently rinsed with additional Et2O (3x2 mL). The resulting solid was dried under high vacuum at room temperature to yield the desired macrocycles (3.1 mg, 86%) as a light brown solid.
Table S4. Concentrations used to probe dilution effect on macrocycle competition reactions.
Concentration of S1 (mM) Volume Dioxane (mL) Yield (mg) Yield (%)25.00 25.00 3.10 86%12.50 12.50 3.30 92%8.50 8.50 3.20 89%6.40 6.40 3.40 94%5.10 5.10 3.30 92%

S-13
Scheme S6. Monomer Exchange Experiments Beginning with MC 2.
Macrocycle Monomer Exchange Experiment:
MC 2 (15 mg, 0.008 mmol) was sonicated in 1,4-dioxane (4 mL) until completely dispersed. After dispersion of the original macrocycle, isopthalaldehyde (11.3 mg, 0.080 mmol, 10.0 equiv) and CF3CO2H (2.0 M in dioxane, 160 µL, 10 equiv) was then added. The solution was then allowed to sit undisturbed at room temperature for 3 days. After 3 days, the reaction mixture was neutralized with Et3N (2 mL) and poured into Et2O (c.a. 10 mL). The precipitate was isolated by centrifugation and subsequently rinsed with Et2O (3x10 mL). The resulting solid was dried under high vacuum at room temperature to yield the desired macrocycle (14.7 mg, 98%) as a light brown solid.
S-14
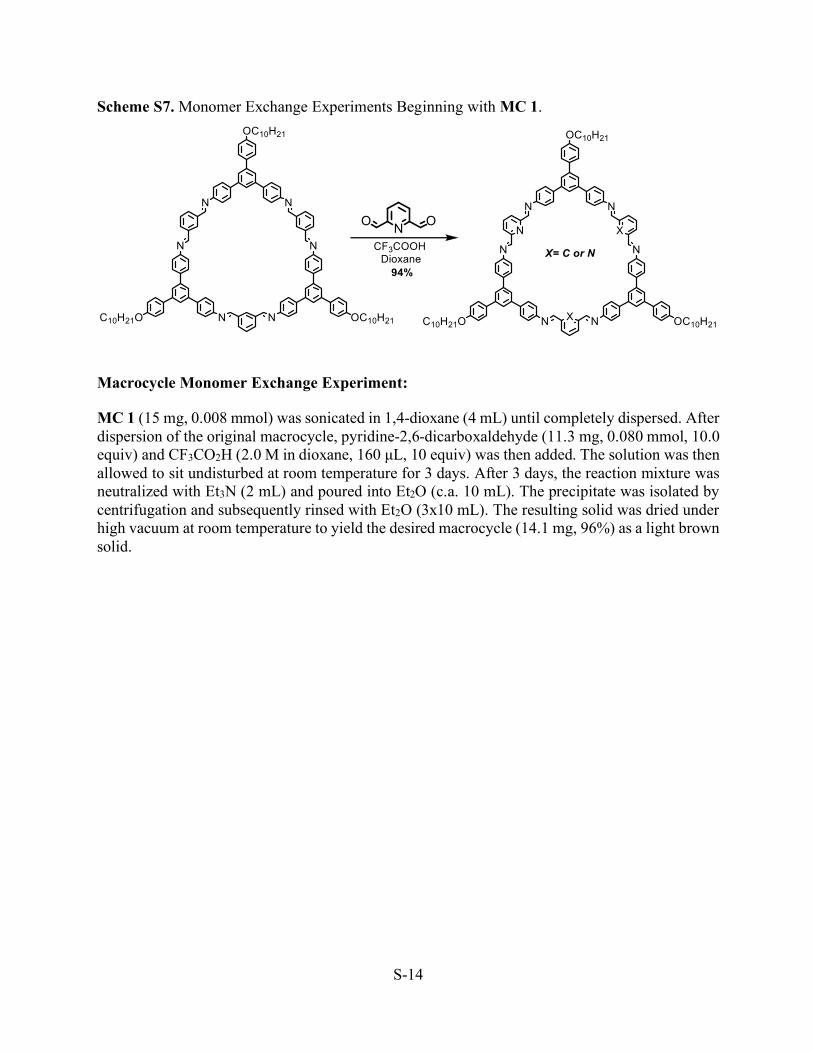
Scheme S7. Monomer Exchange Experiments Beginning with MC 1.
Macrocycle Monomer Exchange Experiment:
MC 1 (15 mg, 0.008 mmol) was sonicated in 1,4-dioxane (4 mL) until completely dispersed. After dispersion of the original macrocycle, pyridine-2,6-dicarboxaldehyde (11.3 mg, 0.080 mmol, 10.0 equiv) and CF3CO2H (2.0 M in dioxane, 160 µL, 10 equiv) was then added. The solution was then allowed to sit undisturbed at room temperature for 3 days. After 3 days, the reaction mixture was neutralized with Et3N (2 mL) and poured into Et2O (c.a. 10 mL). The precipitate was isolated by centrifugation and subsequently rinsed with Et2O (3x10 mL). The resulting solid was dried under high vacuum at room temperature to yield the desired macrocycle (14.1 mg, 96%) as a light brown solid.

S-15
Scheme S8. Synthesis of 5-Br-IDA Macrocycles.
Synthesis of 5-Br-IDA Macrocycles: S1 (25 mg, 0.055 mmol) and 5-bromoisophthalaldehyde (11 mg, 0.055 mmol, 1.0 equiv) were combined in 1,4-dioxane (2.2 mL, 25 mM with respect to S1) and sonicated until completely dissolved.12.5 µL of a 2 M solution of CF3CO2H in 1,4-dioxane (0.028 mmol, 0.5 equiv) was then added. The solution immediately turned yellow and a precipitate began to form. The solution was then left undisturbed at room temperature for 36 h. After 36 h., the reaction mixture was neutralized with Et3N (1.0 mL) and poured into Et2O (c.a. 5 mL). The precipitate was isolated by centrifugation and subsequently rinsed with additional Et2O (3x5 mL). The resulting solid was dried under high vacuum at room temperature to yield the desired 5-Br-IDA macrocycle (26 mg, 84%) as a light-yellow solid.
S-16
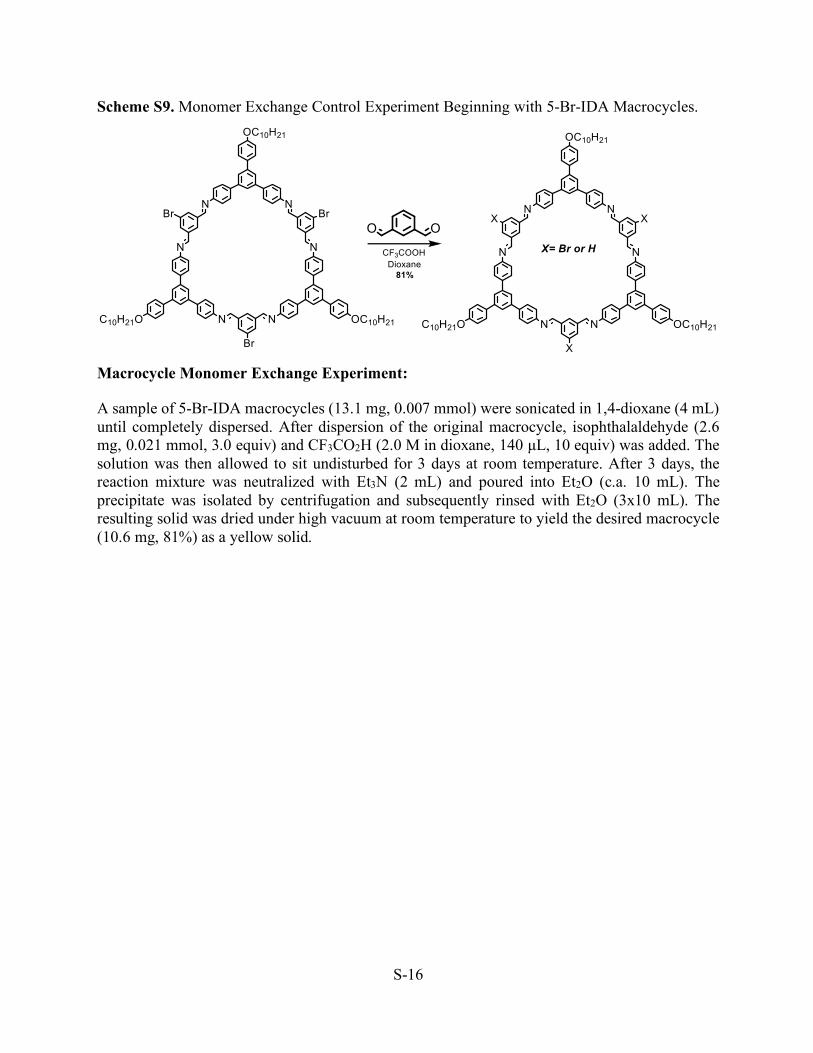
Scheme S9. Monomer Exchange Control Experiment Beginning with 5-Br-IDA Macrocycles.
Macrocycle Monomer Exchange Experiment:
A sample of 5-Br-IDA macrocycles (13.1 mg, 0.007 mmol) were sonicated in 1,4-dioxane (4 mL) until completely dispersed. After dispersion of the original macrocycle, isophthalaldehyde (2.6 mg, 0.021 mmol, 3.0 equiv) and CF3CO2H (2.0 M in dioxane, 140 µL, 10 equiv) was added. The solution was then allowed to sit undisturbed for 3 days at room temperature. After 3 days, the reaction mixture was neutralized with Et3N (2 mL) and poured into Et2O (c.a. 10 mL). The precipitate was isolated by centrifugation and subsequently rinsed with Et2O (3x10 mL). The resulting solid was dried under high vacuum at room temperature to yield the desired macrocycle (10.6 mg, 81%) as a yellow solid.
S-17
C. 1H and 13C NMR Spectra
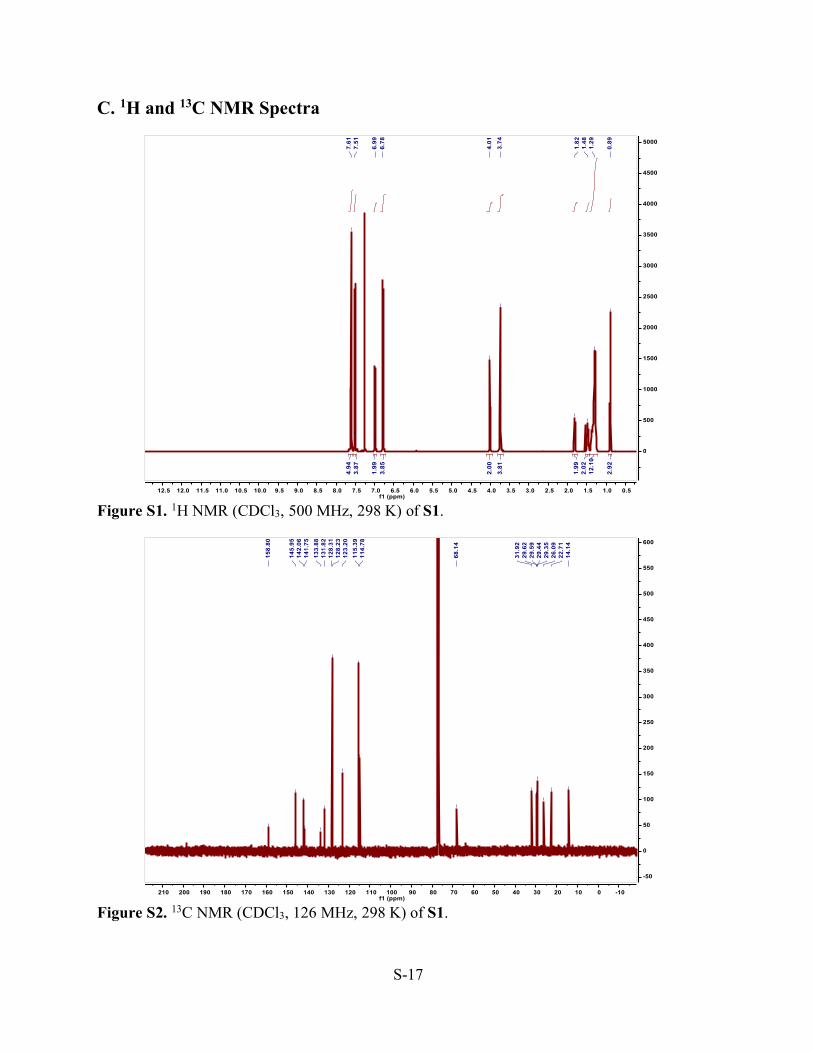
Figure S1. 1H NMR (CDCl3, 500 MHz, 298 K) of S1.
Figure S2. 13C NMR (CDCl3, 126 MHz, 298 K) of S1.
S-18
D. Dilution Experiments Macrocycle and Nanotube Characterization I. Characterization of MC 1
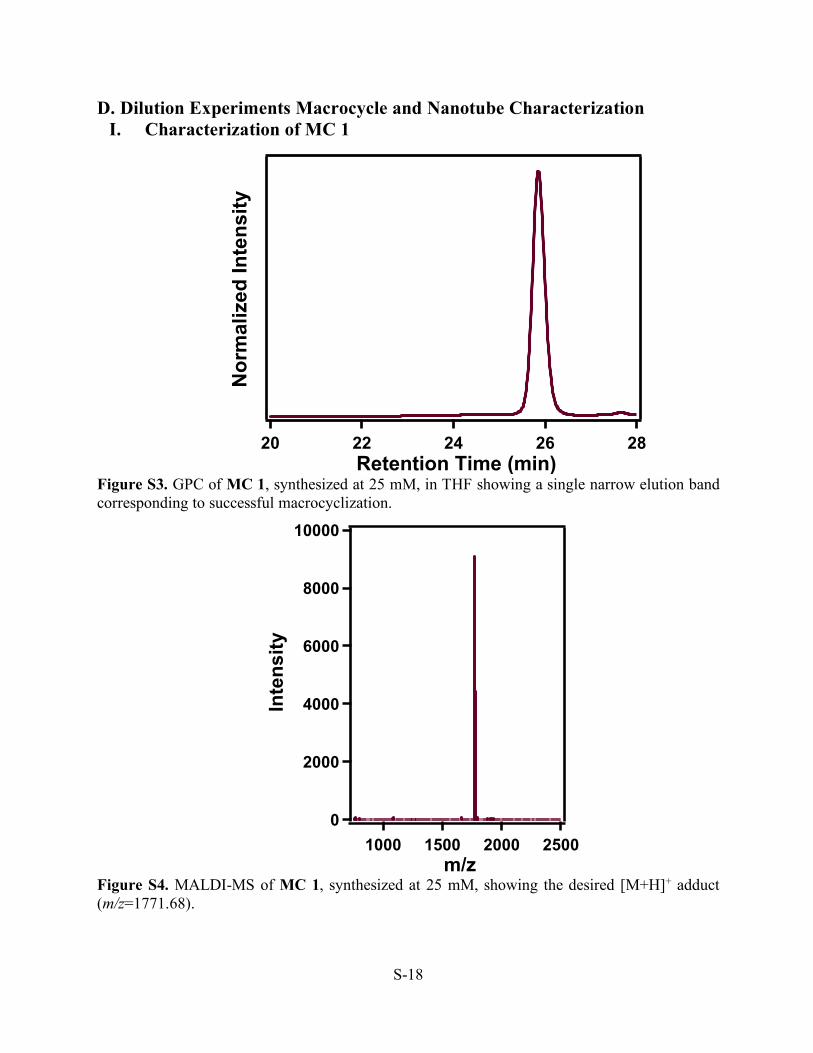
Figure S3. GPC of MC 1, synthesized at 25 mM, in THF showing a single narrow elution band corresponding to successful macrocyclization.
Figure S4. MALDI-MS of MC 1, synthesized at 25 mM, showing the desired [M+H]+ adduct (m/z=1771.68).
Nor
mal
ized
Inte
nsity
2826242220 Retention Time (min)
10000
8000
6000
4000
2000
0
Inte
nsity
2500200015001000 m/z
S-19
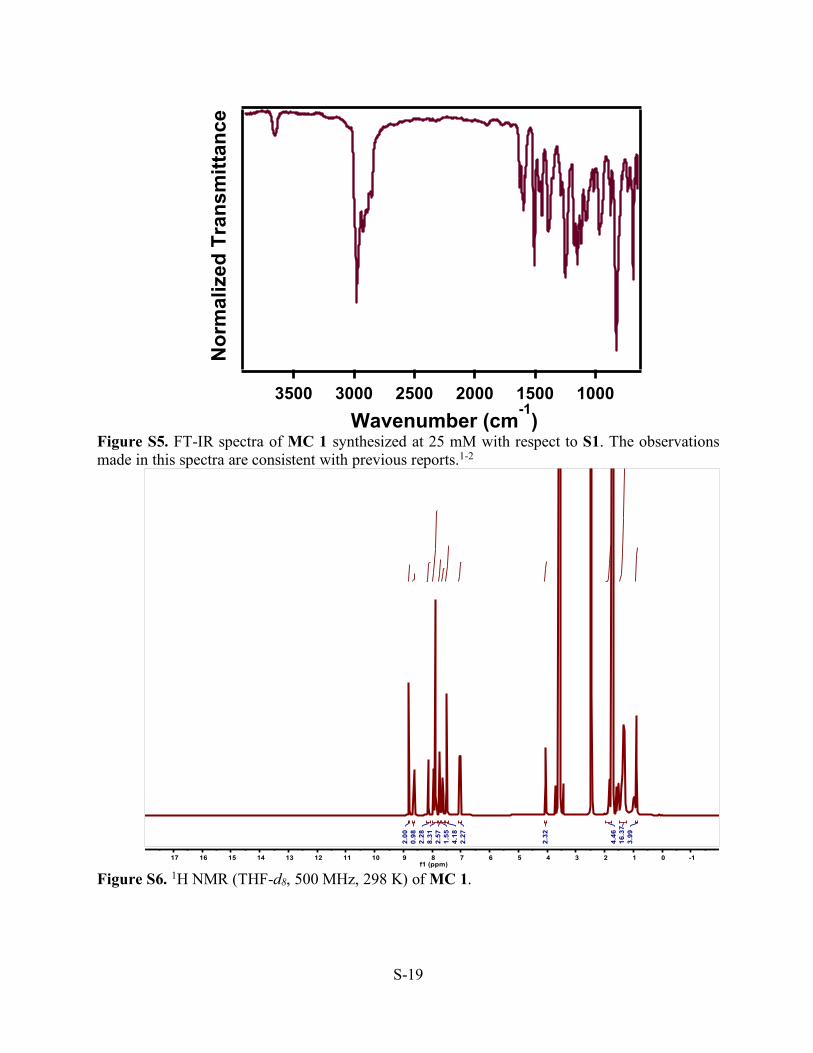
Figure S5. FT-IR spectra of MC 1 synthesized at 25 mM with respect to S1. The observations made in this spectra are consistent with previous reports.1-2
Figure S6. 1H NMR (THF-d8, 500 MHz, 298 K) of MC 1.
Nor
mal
ized
Tra
nsm
ittan
ce
3500 3000 2500 2000 1500 1000 Wavenumber (cm-1)
S-20
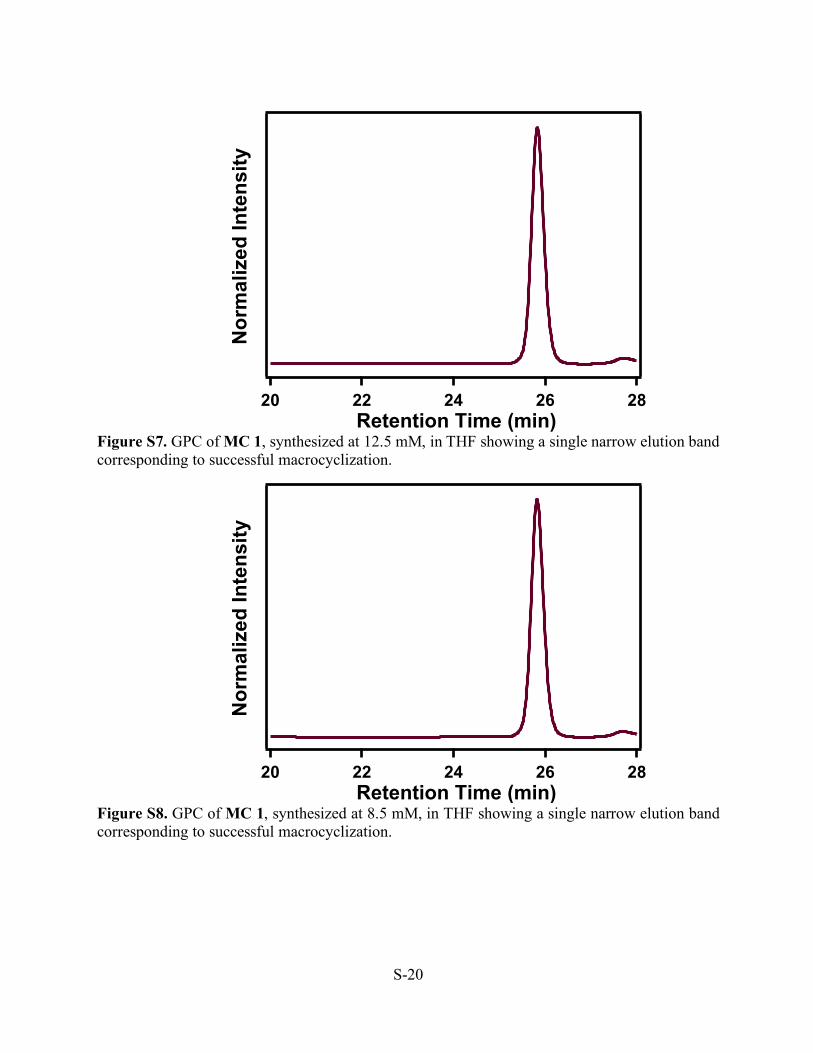
Figure S7. GPC of MC 1, synthesized at 12.5 mM, in THF showing a single narrow elution band corresponding to successful macrocyclization.
Figure S8. GPC of MC 1, synthesized at 8.5 mM, in THF showing a single narrow elution band corresponding to successful macrocyclization.
Nor
mal
ized
Inte
nsity
2826242220 Retention Time (min)
Nor
mal
ized
Inte
nsity
2826242220 Retention Time (min)

S-21
Figure S9. GPC of MC 1, synthesized at 6.4 mM, in THF showing a single narrow elution band corresponding to successful macrocyclization.
Figure S10. GPC of MC 1, synthesized at 5.1 mM, in THF showing a single narrow elution band corresponding to successful macrocyclization.
Nor
mal
ized
Inte
nsity
2826242220 Retention Time (min)
Nor
mal
ized
Inte
nsity
2826242220 Retention Time (min)

S-22
Figure S11. GPC of MC 1, synthesized at 3.4 mM, in THF showing a single narrow elution band corresponding to successful macrocyclization.
Figure S12. Overlaid GPC traces from all diluted syntheses of MC 1, showing no concentration dependence on macrocycle formation.
Nor
mal
ized
Inte
nsity
2826242220 Retention Time (min)
Nor
mal
ized
Inte
nsity
2826242220 Retention Time (min)
25.0 mM 6.4 mM 12.5 mM 5.1 mM 8.5 mM 3.4 mM

S-23
Figure S13. MALDI-MS of MC 1, synthesized at 12.5 mM, showing the desired [M+H]+ adduct (m/z=1771.67).
Figure S14. MALDI-MS of MC 1, synthesized at 8.5 mM, showing the desired [M+H]+ adduct (m/z=1771.74).
20x103
15
10
5
0
Inte
nsity
2500200015001000 m/z
20x103
15
10
5
0
Inte
nsity
2500200015001000 m/z

S-24
Figure S15. MALDI-MS of MC 1, synthesized at 6.4 mM, showing the desired [M+H]+ adduct (m/z=1771.64).
Figure S16. MALDI-MS of MC 1, synthesized at 5.1 mM, showing the desired [M+H]+ adduct (m/z=1771.68).
50x103
40
30
20
10
0
Inte
nsity
2500200015001000 m/z
70x103
60
50
40
30
20
10
0
Inte
nsity
2500200015001000 m/z

S-25
Figure S17. MALDI-MS of MC 1, synthesized at 3.4 mM, showing the desired [M+H]+ adduct (m/z=1771.66).
Figure S18. Atomic force microscopy image of a drop cast aliquot of from the MC 1 reaction at 3.4 mM showing a lack high-aspect ratio assemblies but rather ill-defined aggregates.
30x103
25
20
15
10
5
0
Inte
nsity
2500200015001000 m/z

S-26
Figure S19. Scanning electron microscopy images of a drop cast aliquot of from the MC 1 reaction at 3.4 mM showing no formation of high-aspect ratio assemblies but rather ill-defined aggregates.
Figure S20. Transmission electron microscopy images of a drop cast aliquot of from the MC 1 reaction at 25 mM showing the formation of low aspect ratio aggregates, like what has been previously reported in the literature.1
S-27
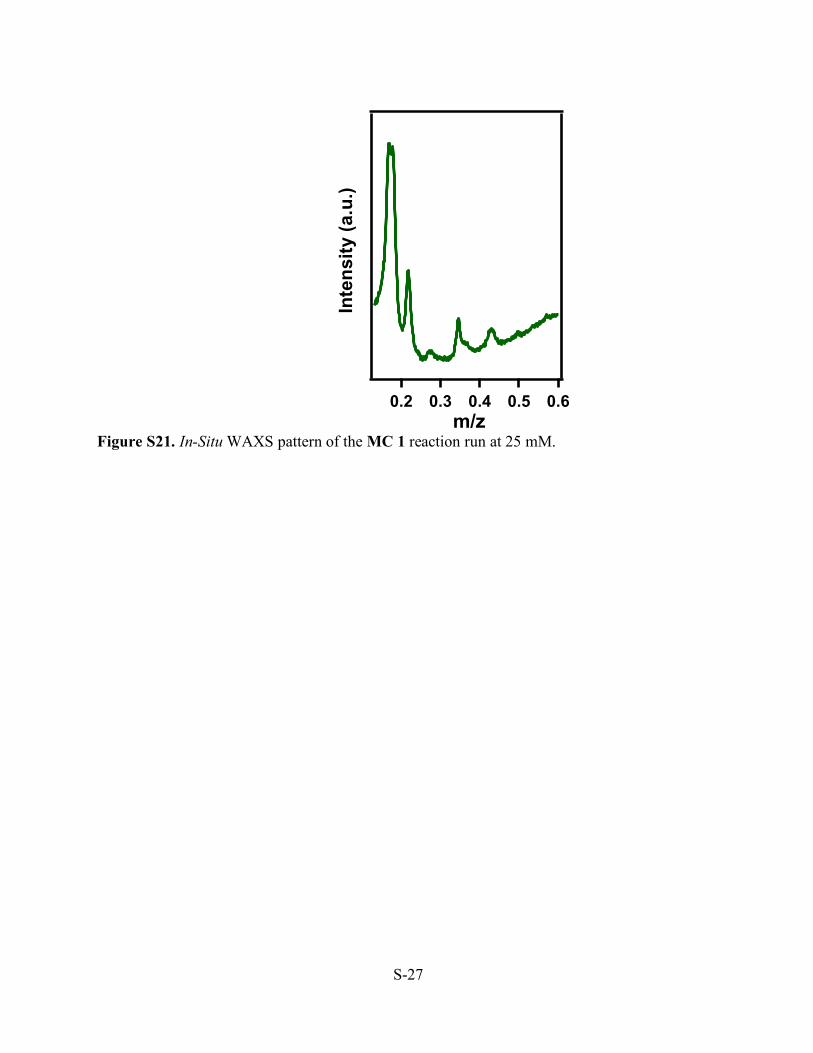
Figure S21. In-Situ WAXS pattern of the MC 1 reaction run at 25 mM.
Inte
nsity
(a.u
)
0.60.50.40.30.2 m/z
Inte
nsity
(a.u
.)

S-28
II. Characterization of MC 2
Figure S22. (Left) GPC of MC 2, synthesized at 25 mM, in THF showing a single narrow elution band corresponding to successful macrocyclization. was corroborated by rerunning the sample after washing the GPC column (Right) Furthermore, no resonances corresponding to smaller molecular weight species were observed via MALDI-MS or 1H NMR analysis of the sample.
Figure S23. MALDI-MS of MC 2, synthesized at 25 mM, showing the desired [M+H]+, [M+Na]+, and [M+K]+ adducts. (m/z=1774.61 [M+H]+; m/z= 1796.40 [M+Na]+; m/z= 1813.94 [M+K]+).
14x103
12
10
8
6
4
2
0
Inte
nsity
20001000 m/z
Nor
mal
ized
Inte
nsity
2826242220 Retention Time (min)
S-29
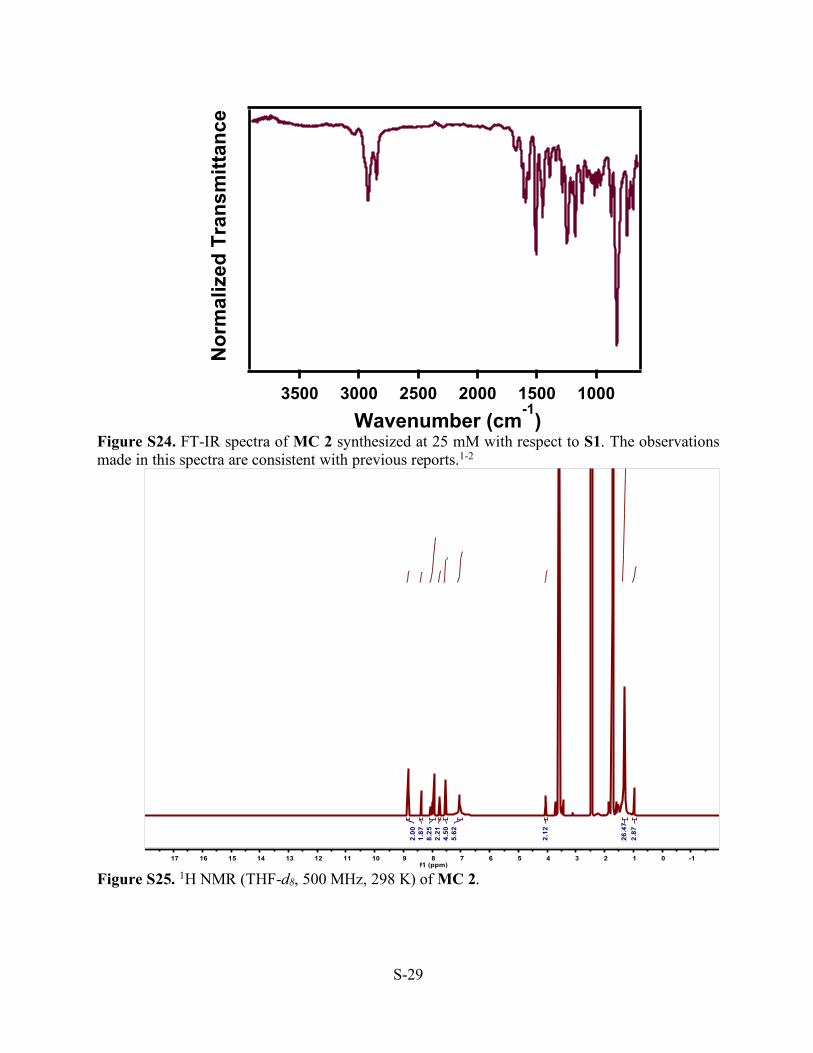
Figure S24. FT-IR spectra of MC 2 synthesized at 25 mM with respect to S1. The observations made in this spectra are consistent with previous reports.1-2
Figure S25. 1H NMR (THF-d8, 500 MHz, 298 K) of MC 2.
Nor
mal
ized
Tra
nsm
ittan
ce
3500 3000 2500 2000 1500 1000 Wavenumber (cm-1)

S-30
Figure S26. GPC of MC 2, synthesized at 12.5 mM, in THF showing a single narrow elution band corresponding to successful macrocyclization. was corroborated by rerunning a representative sample after washing the GPC column (Figure S23 Right) Furthermore, no resonances corresponding to smaller molecular weight species were observed via MALDI-MS or 1H NMR analysis of the sample.
Figure S27. GPC of MC 2, synthesized at 8.5 mM, in THF showing a single narrow elution band corresponding to successful macrocyclization. was corroborated by rerunning a representative sample after washing the GPC column (Figure S23 Right) Furthermore, no resonances corresponding to smaller molecular weight species were observed via MALDI-MS or 1H NMR analysis of the sample.
Nor
mal
ized
Inte
nsity
2826242220 Retention Time (min)
Nor
mal
ized
Inte
nsity
2826242220 Retention Time (min)

S-31
Figure S28. GPC of MC 2, synthesized at 6.4 mM, in THF showing a single narrow elution band corresponding to successful macrocyclization. was corroborated by rerunning a representative sample after washing the GPC column (Figure S23 Right) Furthermore, no resonances corresponding to smaller molecular weight species were observed via MALDI-MS or 1H NMR analysis of the sample.
Figure S29. GPC of MC 2, synthesized at 5.1 mM, in THF showing a single narrow elution band corresponding to successful macrocyclization. was corroborated by rerunning a representative sample after washing the GPC column (Figure S23 Right) Furthermore, no resonances corresponding to smaller molecular weight species were observed via MALDI-MS or 1H NMR analysis of the sample.
Nor
mal
ized
Inte
nsity
2826242220 Retention Time (min)
Nor
mal
ized
Inte
nsity
2826242220 Retention Time (min)

S-32
Figure S30. GPC of MC 2, synthesized at 3.4 mM, in THF showing a single narrow elution band corresponding to successful macrocyclization. was corroborated by rerunning a representative sample after washing the GPC column (Figure S23 Right) Furthermore, no resonances corresponding to smaller molecular weight species were observed via MALDI-MS or 1H NMR analysis of the sample.
Figure S31. Overlaid GPC traces from all diluted syntheses of MC 2, showing no concentration dependence on macrocycle formation.
Nor
mal
ized
Inte
nsity
2826242220 Retention Time (min)
Nor
mal
ized
Inte
nsity
2826242220 Retention Time (min)
25.0 mM 6.4 mM 12.5 mM 5.1 mM 8.5 mM 3.4 mM

S-33
Figure S32. MALDI-MS of MC 2, synthesized at 12.5 mM, showing the desired [M+H]+, [M+Na]+, and [M+K]+ adducts. (m/z=1774.61 [M+H]+; m/z= 1796.44 [M+Na]+; m/z= 1813.92 [M+K]+).
Figure S33. MALDI-MS of MC 2, synthesized at 8.5 mM, showing the desired [M+H]+, [M+Na]+, and [M+K]+ adducts. (m/z=1774.64 [M+H]+; m/z= 1796.72[M+Na]+; m/z= 1813.64 [M+K]+).
800
600
400
200
0
Inte
nsity
20001000 m/z
1200
1000
800
600
400
200
0
Inte
nsity
20001000 m/z
S-34
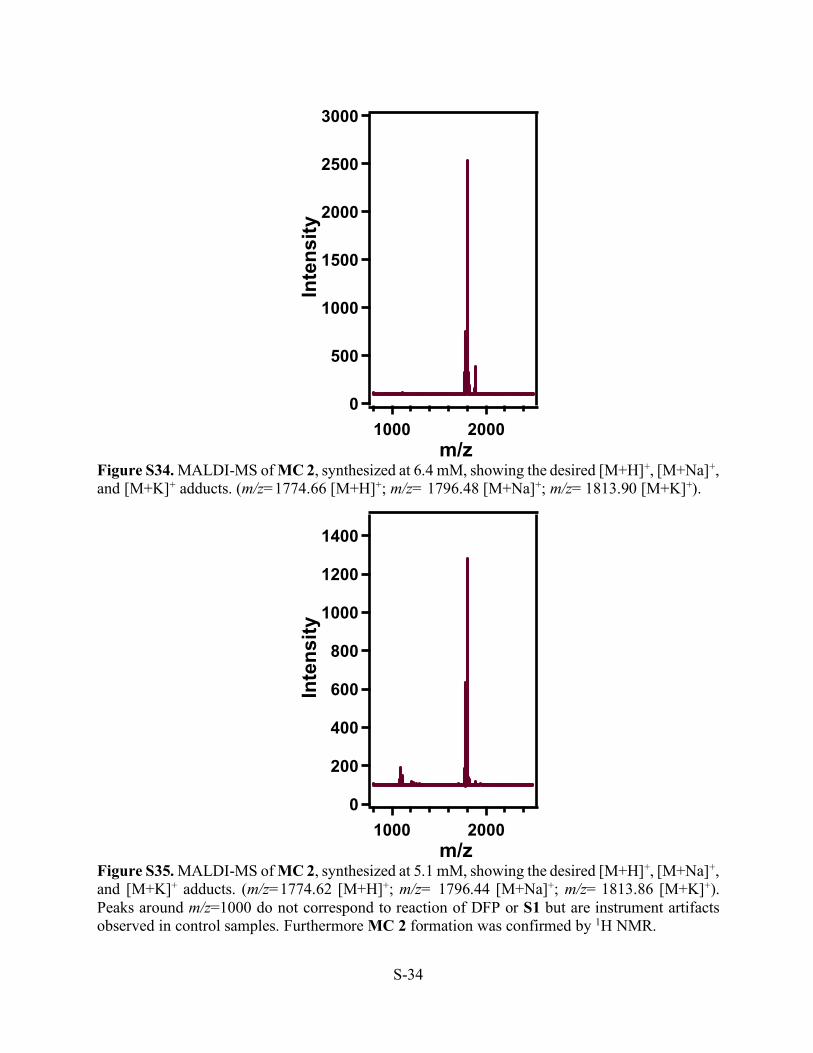
Figure S34. MALDI-MS of MC 2, synthesized at 6.4 mM, showing the desired [M+H]+, [M+Na]+, and [M+K]+ adducts. (m/z=1774.66 [M+H]+; m/z= 1796.48 [M+Na]+; m/z= 1813.90 [M+K]+).
Figure S35. MALDI-MS of MC 2, synthesized at 5.1 mM, showing the desired [M+H]+, [M+Na]+, and [M+K]+ adducts. (m/z=1774.62 [M+H]+; m/z= 1796.44 [M+Na]+; m/z= 1813.86 [M+K]+). Peaks around m/z=1000 do not correspond to reaction of DFP or S1 but are instrument artifacts observed in control samples. Furthermore MC 2 formation was confirmed by 1H NMR.
3000
2500
2000
1500
1000
500
0
Inte
nsity
20001000 m/z
1400
1200
1000
800
600
400
200
0
Inte
nsity
20001000 m/z

S-35
Figure S36. MALDI-MS of MC 2, synthesized at 3.4 mM, showing the desired [M+H]+, [M+Na]+, and [M+K]+ adducts. (m/z=1774.62 [M+H]+; m/z= 1796.50 [M+Na]+; m/z= 1813.86 [M+K]+).
Figure S37. Atomic force microscopy images of a drop cast aliquot of from the MC 2 reaction at 3.4 mM showing the formation of high-aspect ratio nanotubes.
1400
1200
1000
800
600
400
200
0
Inte
nsity
20001000 m/z
S-36
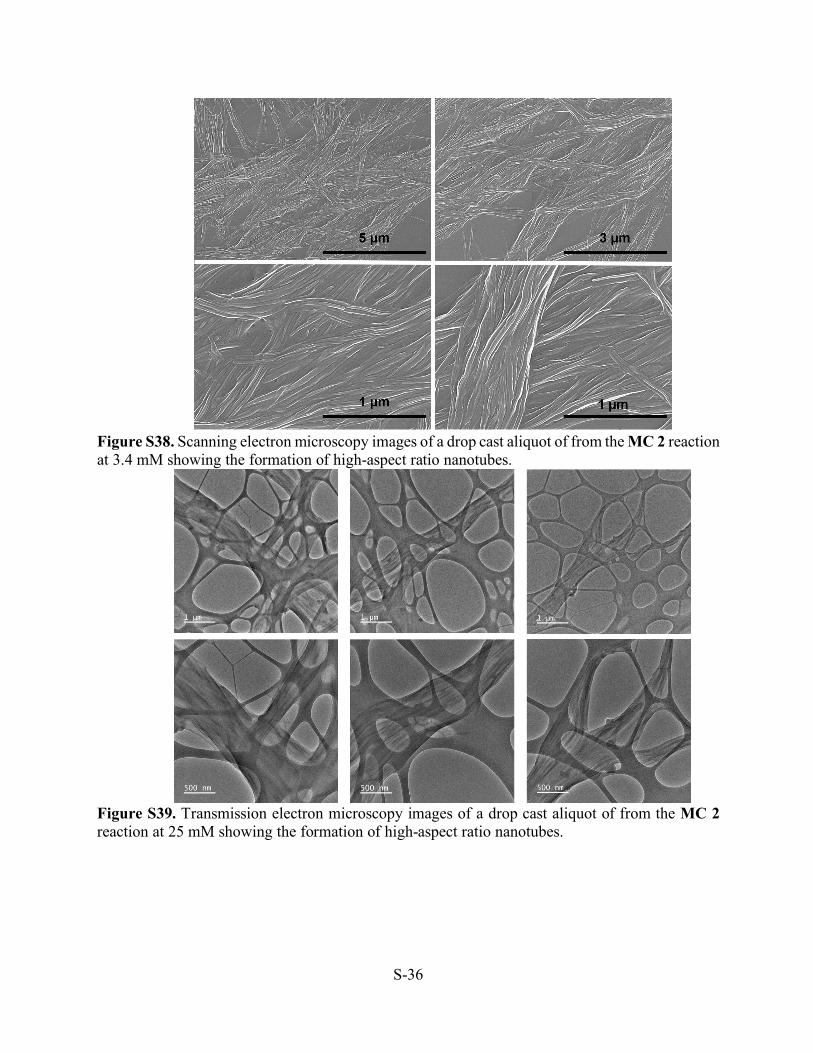
Figure S38. Scanning electron microscopy images of a drop cast aliquot of from the MC 2 reaction at 3.4 mM showing the formation of high-aspect ratio nanotubes.
Figure S39. Transmission electron microscopy images of a drop cast aliquot of from the MC 2 reaction at 25 mM showing the formation of high-aspect ratio nanotubes.
S-37
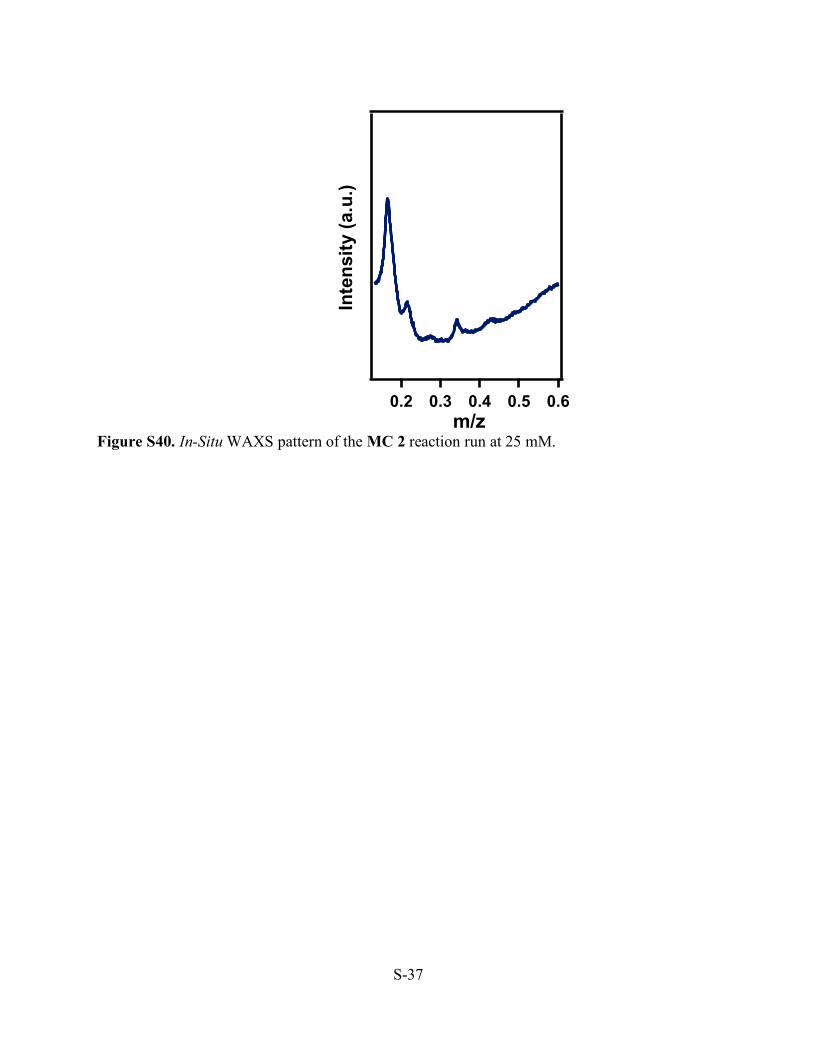
Figure S40. In-Situ WAXS pattern of the MC 2 reaction run at 25 mM.
Inte
nsity
(a.u
)
0.60.50.40.30.2 m/z
Inte
nsity
(a.u
.)
S-38
E. Kinetic Experiments Characterization I. Characterization of MC 1 Kinetics
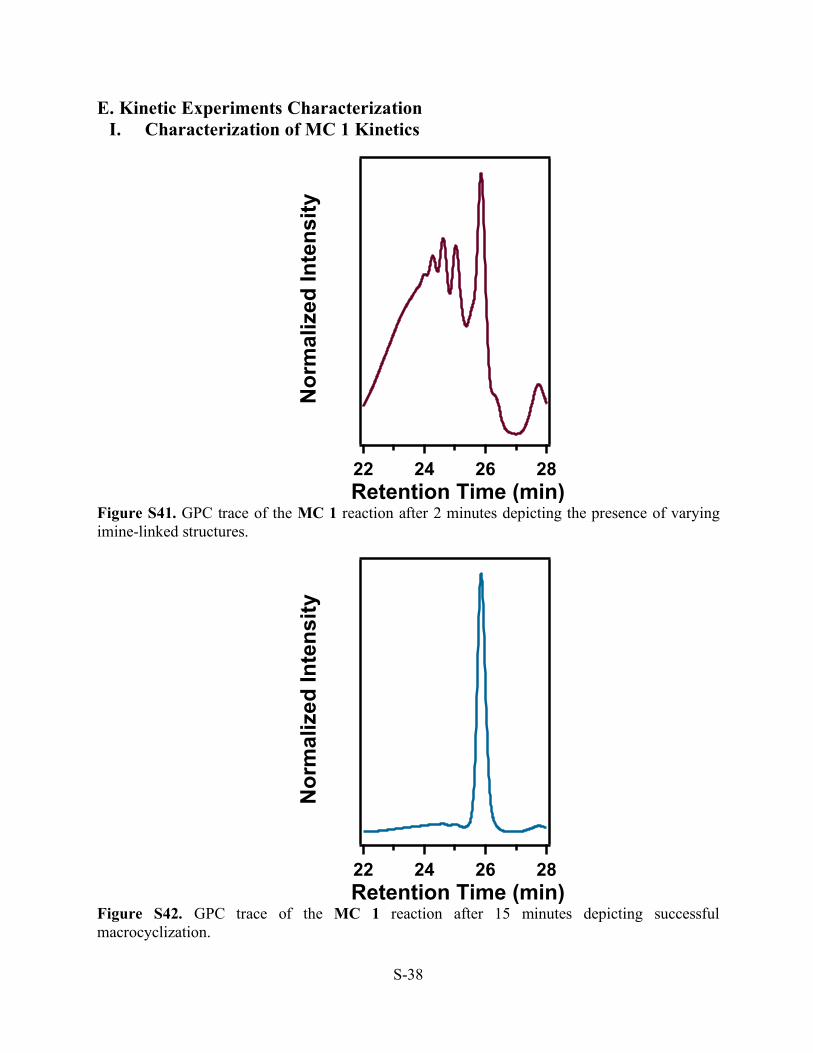
Figure S41. GPC trace of the MC 1 reaction after 2 minutes depicting the presence of varying imine-linked structures.
Figure S42. GPC trace of the MC 1 reaction after 15 minutes depicting successful macrocyclization.
Nor
mal
ized
Inte
nsity
28262422 Retention Time (min)
Nor
mal
ized
Inte
nsity
28262422 Retention Time (min)
S-39
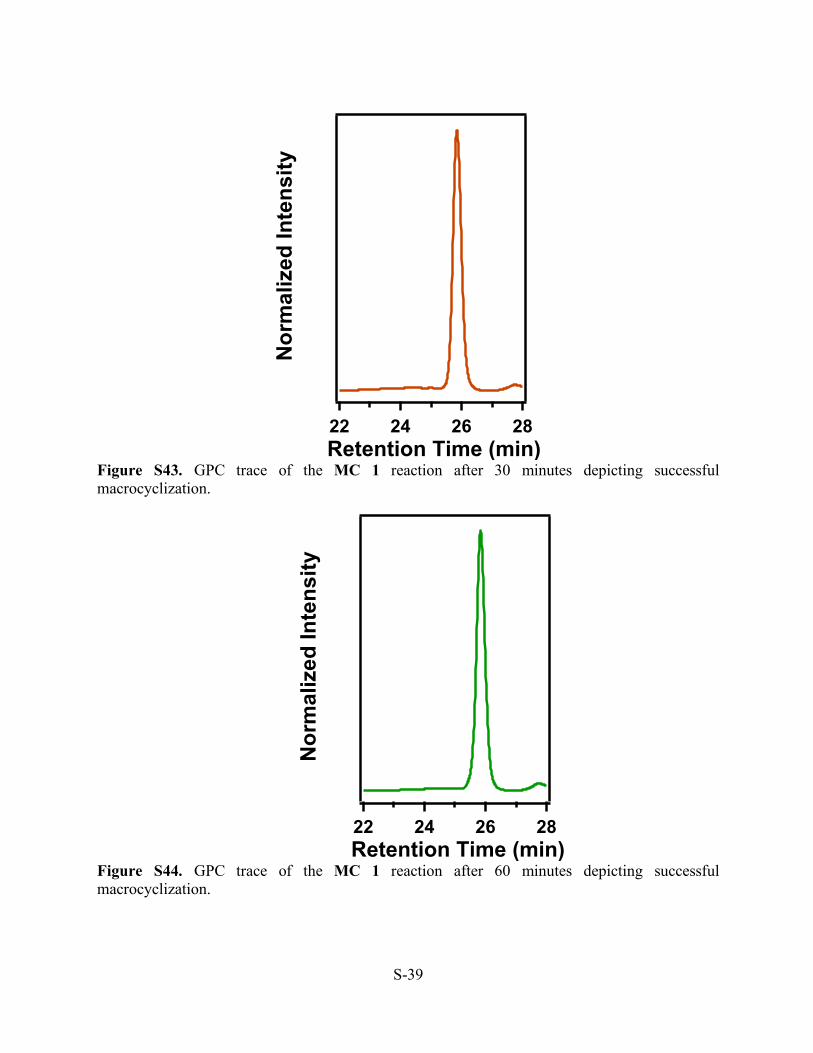
Figure S43. GPC trace of the MC 1 reaction after 30 minutes depicting successful macrocyclization.
Figure S44. GPC trace of the MC 1 reaction after 60 minutes depicting successful macrocyclization.
Nor
mal
ized
Inte
nsity
28262422 Retention Time (min)
Nor
mal
ized
Inte
nsity
28262422 Retention Time (min)

S-40
Figure S45. GPC trace of the MC 1 reaction after 120 minutes depicting successful macrocyclization.
Figure S46. GPC traces of all MC 1 reaction kinetic data. Overall, the GPC kinetic traces are consistent with previous reports of macrocycle formation,1 but shown different time dependences than the TR-XRD data due to having more catalyst added and being run at a higher concentration.
Nor
mal
ized
Inte
nsity
28262422 Retention Time (min)
Nor
mal
ized
Inte
nsity
28262422 Retention Time (min)

S-41
II. Characterization of MC 2 Kinetics
Figure S47. GPC trace of the MC 2 reaction after 2 minutes depicting successful macrocyclization.
Figure S48. GPC trace of the MC 2 reaction after 15 minutes depicting successful macrocyclization.
Nor
mal
ized
Inte
nsity
28262422 Retention Time (min)
Nor
mal
ized
Inte
nsity
28262422 Retention Time (min)

S-42
Figure S49. GPC trace of the MC 2 reaction after 30 minutes depicting successful macrocyclization.
Figure S50. GPC trace of the MC 2 reaction after 60 minutes depicting successful macrocyclization.
Nor
mal
ized
Inte
nsity
28262422 Retention Time (min)
Nor
mal
ized
Inte
nsity
28262422 Retention Time (min)
S-43
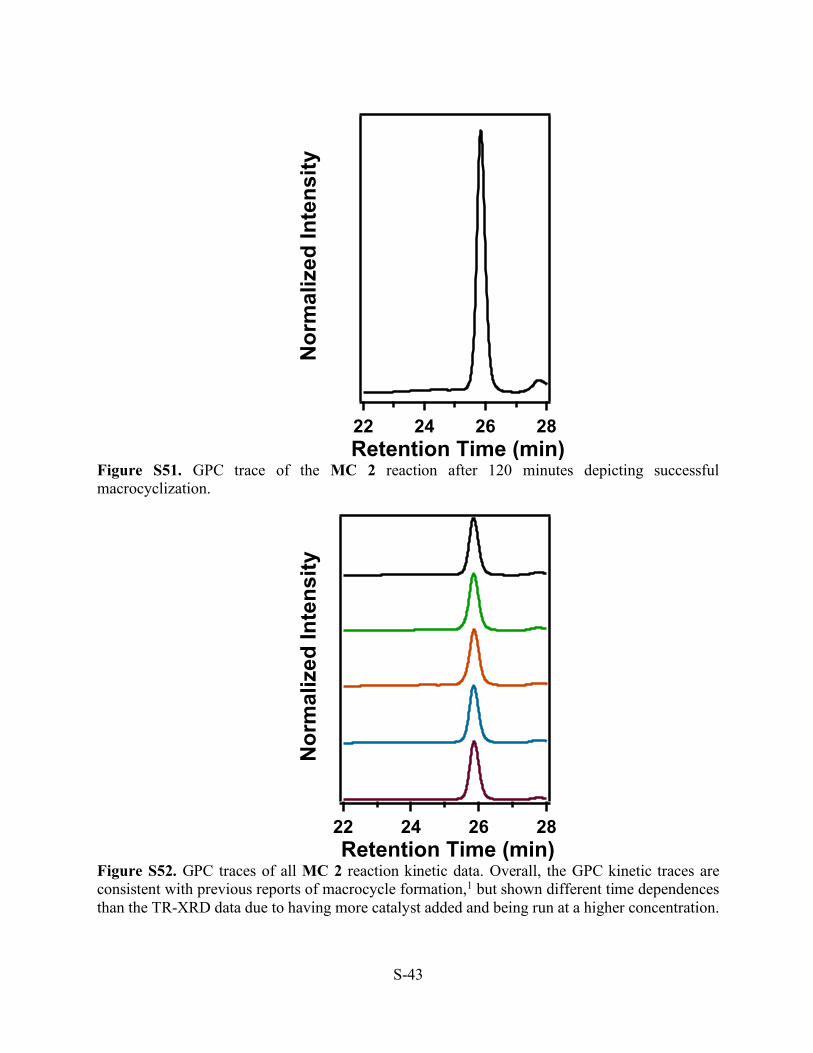
Figure S51. GPC trace of the MC 2 reaction after 120 minutes depicting successful macrocyclization.
Figure S52. GPC traces of all MC 2 reaction kinetic data. Overall, the GPC kinetic traces are consistent with previous reports of macrocycle formation,1 but shown different time dependences than the TR-XRD data due to having more catalyst added and being run at a higher concentration.
Nor
mal
ized
Inte
nsity
28262422 Retention Time (min)
Nor
mal
ized
Inte
nsity
28262422 Retention Time (min)

S-44
Figure S53. GPC trace of the MC 2 reaction at 3.4 mM, with 0.005 equivalents of CF3CO2H, after 2 minutes of reaction time, thereby highlighting the polymeric intermediate in the formation of the desired macrocycle.
Nor
mal
ized
Ref
ract
ive
Inde
x
28242016 Retention Time (min)
S-45
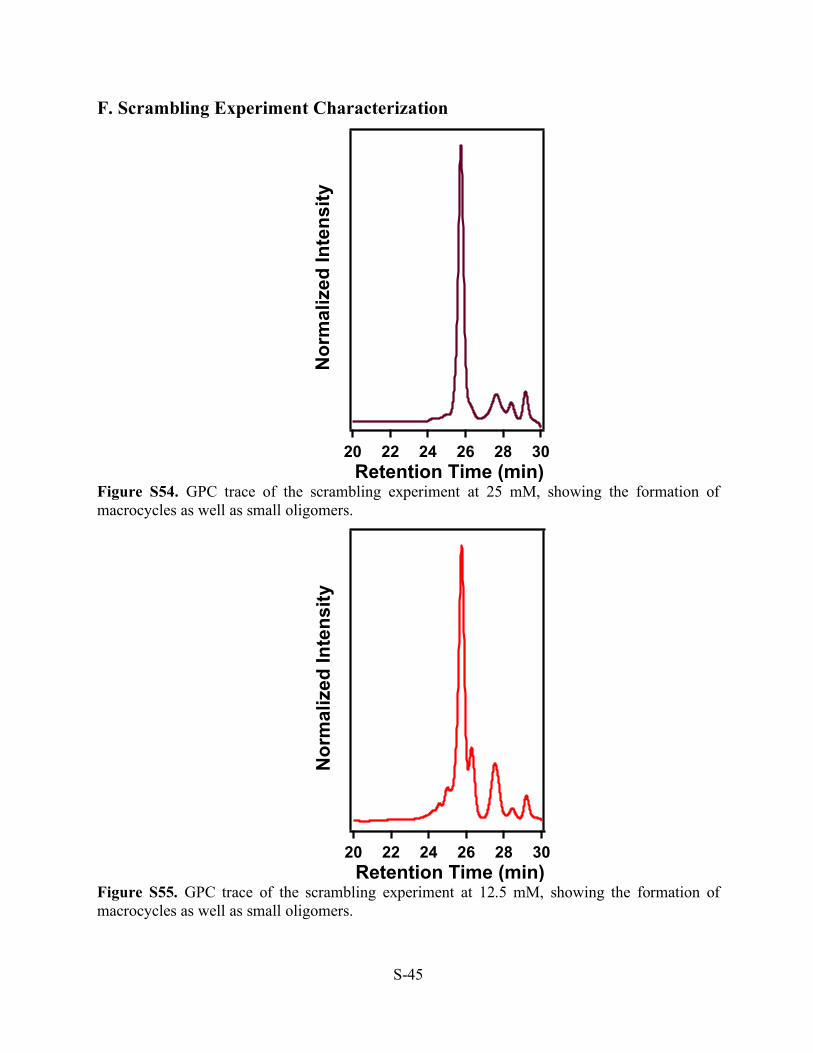
F. Scrambling Experiment Characterization
Figure S54. GPC trace of the scrambling experiment at 25 mM, showing the formation of macrocycles as well as small oligomers.
Figure S55. GPC trace of the scrambling experiment at 12.5 mM, showing the formation of macrocycles as well as small oligomers.
Nor
mal
ized
Inte
nsity
302826242220 Retention Time (min)
Nor
mal
ized
Inte
nsity
302826242220 Retention Time (min)
S-46
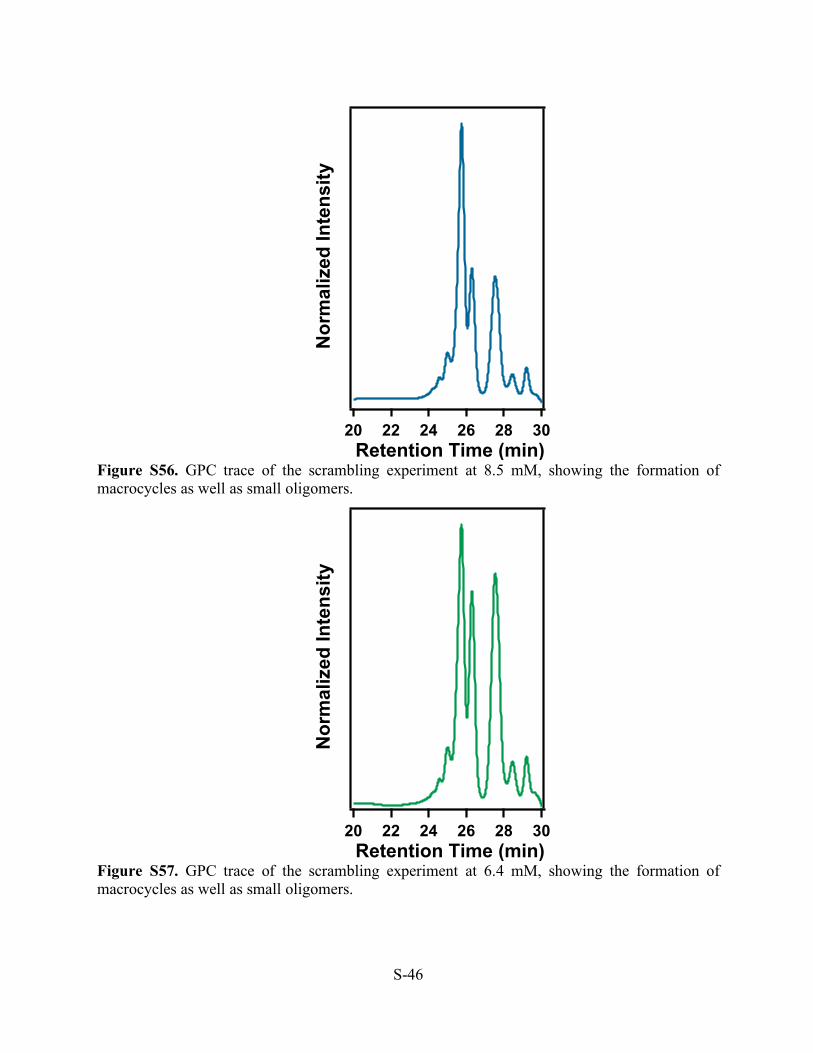
Figure S56. GPC trace of the scrambling experiment at 8.5 mM, showing the formation of macrocycles as well as small oligomers.
Figure S57. GPC trace of the scrambling experiment at 6.4 mM, showing the formation of macrocycles as well as small oligomers.
Nor
mal
ized
Inte
nsity
302826242220 Retention Time (min)
Nor
mal
ized
Inte
nsity
302826242220 Retention Time (min)

S-47
Figure S58. GPC trace of the scrambling experiment at 5.1 mM, showing the formation of macrocycles as well as small oligomers.
Figure S59. GPC of all scrambling experiments showing the formation of macrocycles as well as small oligomers regardless of reaction concentration.
Nor
mal
ized
Inte
nsity
302826242220 Retention Time (min)
Nor
mal
ized
Inte
nsity
302826242220 Retention Time (min)
25.0 mM 6.4 mM 12.5 mM 5.1 mM 8.5 mM

S-48
Figure S60. MALDI-MS of the scrambling reaction at 25 mM showing the formation of the MC 2 ([M+H]+ m/z=1774.24, [M+Na]+ m/z=1796.42, [M+K]+ m/z=1813.90), as well as oligomers corresponding to IDA monomer incorporation ([2•S1+ IDA+H]+ m/z=1083.64).
Figure S61. MALDI-MS of the scrambling reaction at 12.5 mM showing the formation of the MC 2 ([M+H]+ m/z=1774.28, [M+Na]+ m/z=1796.56, [M+K]+ m/z=1813.88).
6000
5000
4000
3000
2000
1000
0
Inte
nsity
20001000 m/z
5000
4000
3000
2000
1000
0
Inte
nsity
20001000 m/z
6000
5000
4000
3000
2000
1000
0
Inte
nsity
17801770 m/z
5000
4000
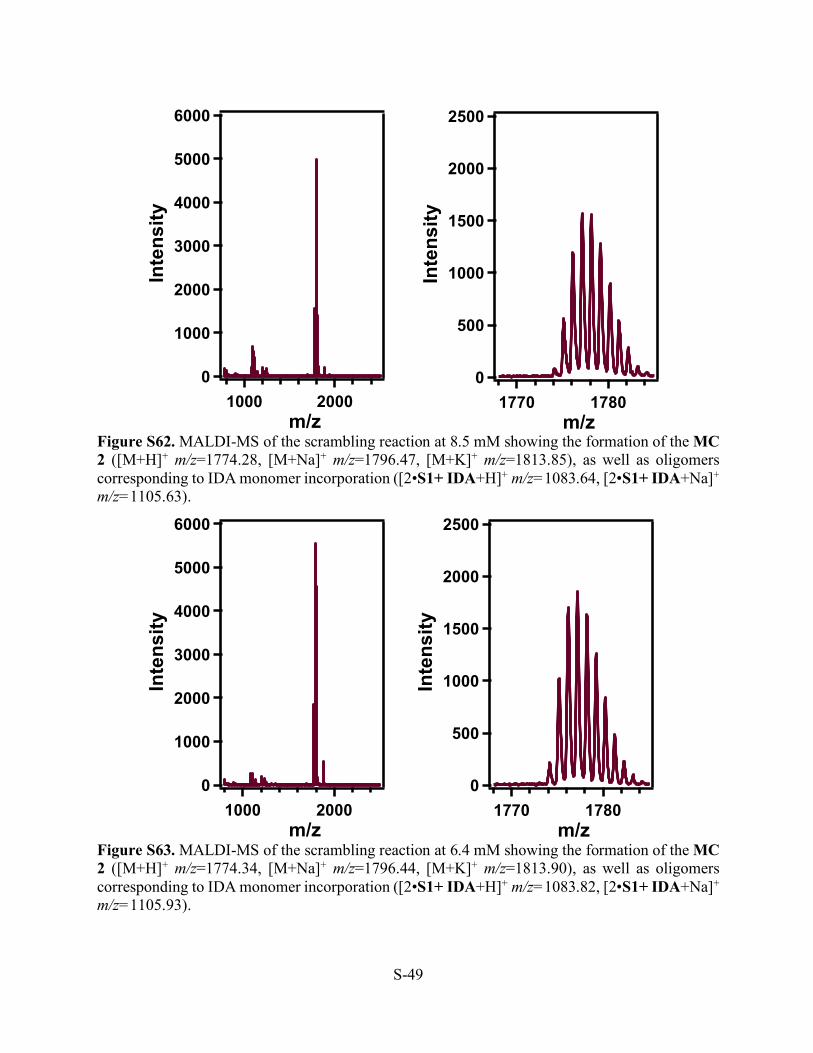
3000
2000
1000
0
Inte
nsity
17801770 m/z
S-49
Figure S62. MALDI-MS of the scrambling reaction at 8.5 mM showing the formation of the MC 2 ([M+H]+ m/z=1774.28, [M+Na]+ m/z=1796.47, [M+K]+ m/z=1813.85), as well as oligomers corresponding to IDA monomer incorporation ([2•S1+ IDA+H]+ m/z=1083.64, [2•S1+ IDA+Na]+ m/z=1105.63).
Figure S63. MALDI-MS of the scrambling reaction at 6.4 mM showing the formation of the MC 2 ([M+H]+ m/z=1774.34, [M+Na]+ m/z=1796.44, [M+K]+ m/z=1813.90), as well as oligomers corresponding to IDA monomer incorporation ([2•S1+ IDA+H]+ m/z=1083.82, [2•S1+ IDA+Na]+ m/z=1105.93).
6000
5000
4000
3000
2000
1000
0
Inte
nsity
20001000 m/z
6000
5000
4000
3000
2000
1000
0
Inte
nsity
20001000 m/z
2500
2000
1500
1000
500
0
Inte
nsity
17801770 m/z
2500
2000
1500
1000
500
0
Inte
nsity
17801770 m/z
S-50
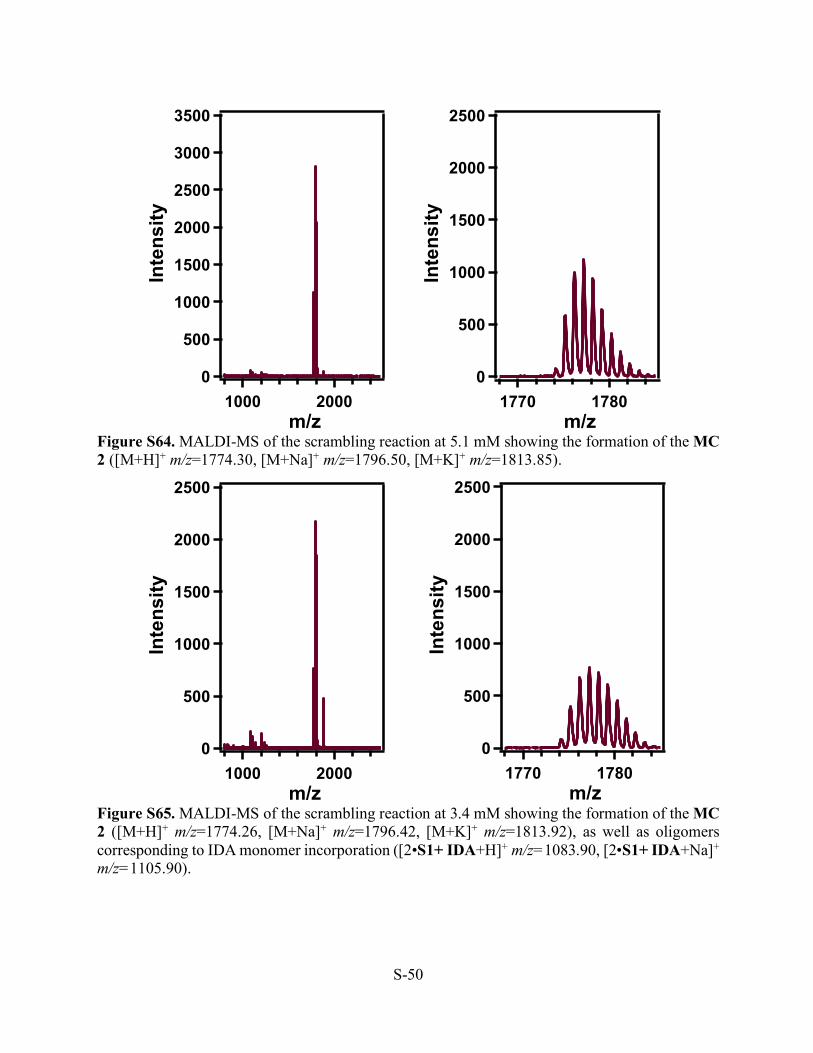
Figure S64. MALDI-MS of the scrambling reaction at 5.1 mM showing the formation of the MC 2 ([M+H]+ m/z=1774.30, [M+Na]+ m/z=1796.50, [M+K]+ m/z=1813.85).
Figure S65. MALDI-MS of the scrambling reaction at 3.4 mM showing the formation of the MC 2 ([M+H]+ m/z=1774.26, [M+Na]+ m/z=1796.42, [M+K]+ m/z=1813.92), as well as oligomers corresponding to IDA monomer incorporation ([2•S1+ IDA+H]+ m/z=1083.90, [2•S1+ IDA+Na]+ m/z=1105.90).
3500
3000
2500
2000
1500
1000
500
0
Inte
nsity
20001000 m/z
2500
2000
1500
1000
500
0
Inte
nsity
20001000 m/z
2500
2000
1500
1000
500
0
Inte
nsity
17801770 m/z
2500
2000
1500
1000
500
0
Inte
nsity
17801770 m/z
S-51
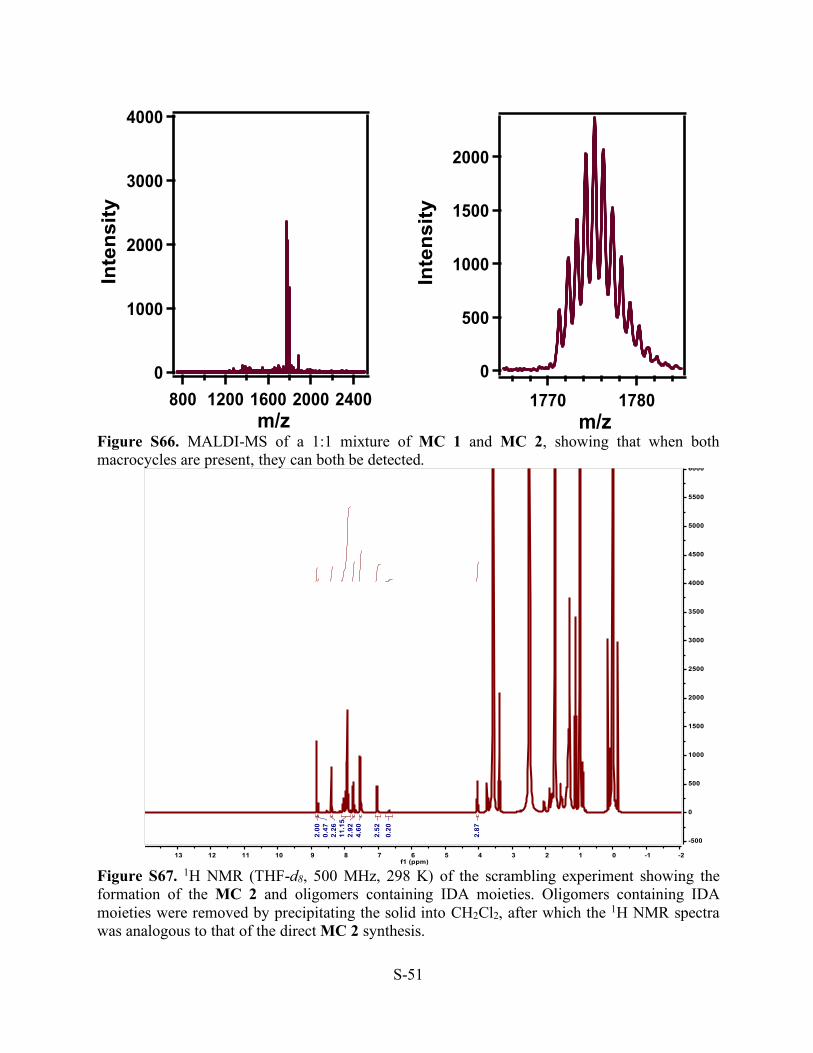
Figure S66. MALDI-MS of a 1:1 mixture of MC 1 and MC 2, showing that when both macrocycles are present, they can both be detected.
Figure S67. 1H NMR (THF-d8, 500 MHz, 298 K) of the scrambling experiment showing the formation of the MC 2 and oligomers containing IDA moieties. Oligomers containing IDA moieties were removed by precipitating the solid into CH2Cl2, after which the 1H NMR spectra was analogous to that of the direct MC 2 synthesis.
4000
3000
2000
1000
0
Inte
nsity
2400200016001200800 m/z
2000
1500
1000
500
0
Inte
nsity
17801770 m/z

S-52
Figure S68. Atomic force microscopy images of a drop cast aliquot of from the scrambling macrocyclization reaction at 3.4 mM showing the formation of high-aspect ratio nanotubes, further supporting the formation of MC 2 which have previously demonstrated self-assembly ability.
Figure S69. Scanning electron microscopy images of a drop cast aliquot of from the scrambling macrocyclization reaction at 3.4 mM showing the formation of high-aspect ratio nanotubes, further supporting the formation of MC 2 which have previously demonstrated self-assembly ability.
S-53
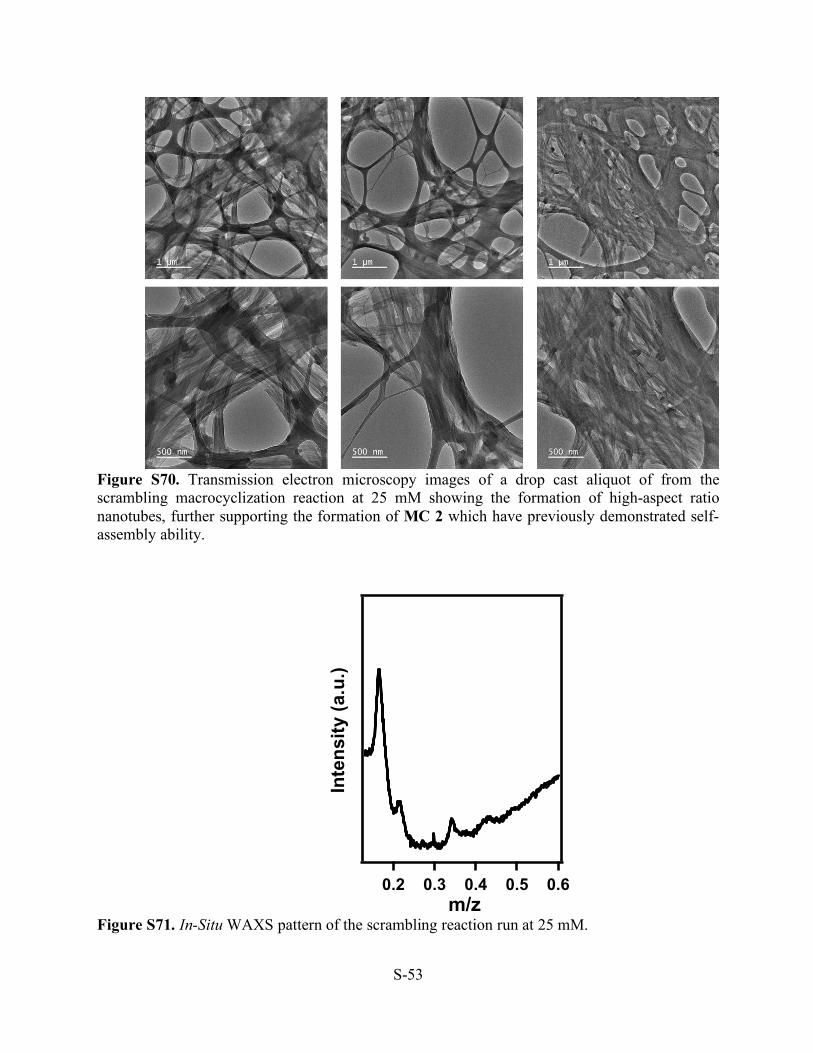
Figure S70. Transmission electron microscopy images of a drop cast aliquot of from the scrambling macrocyclization reaction at 25 mM showing the formation of high-aspect ratio nanotubes, further supporting the formation of MC 2 which have previously demonstrated self-assembly ability.
Figure S71. In-Situ WAXS pattern of the scrambling reaction run at 25 mM.
Inte
nsity
(a.u
)
0.60.50.40.30.2 m/z
Inte
nsity
(a.u
.)
S-54
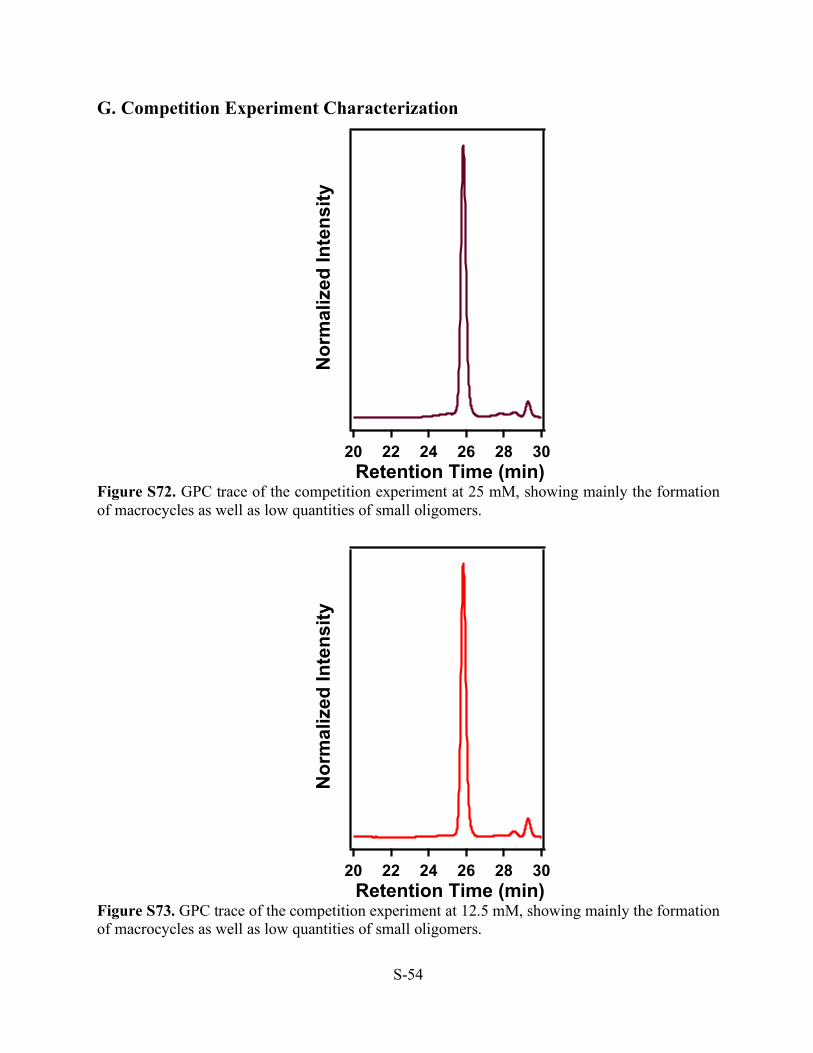
G. Competition Experiment Characterization
Figure S72. GPC trace of the competition experiment at 25 mM, showing mainly the formation of macrocycles as well as low quantities of small oligomers.
Figure S73. GPC trace of the competition experiment at 12.5 mM, showing mainly the formation of macrocycles as well as low quantities of small oligomers.
Nor
mal
ized
Inte
nsity
302826242220 Retention Time (min)
Nor
mal
ized
Inte
nsity
302826242220 Retention Time (min)
S-55
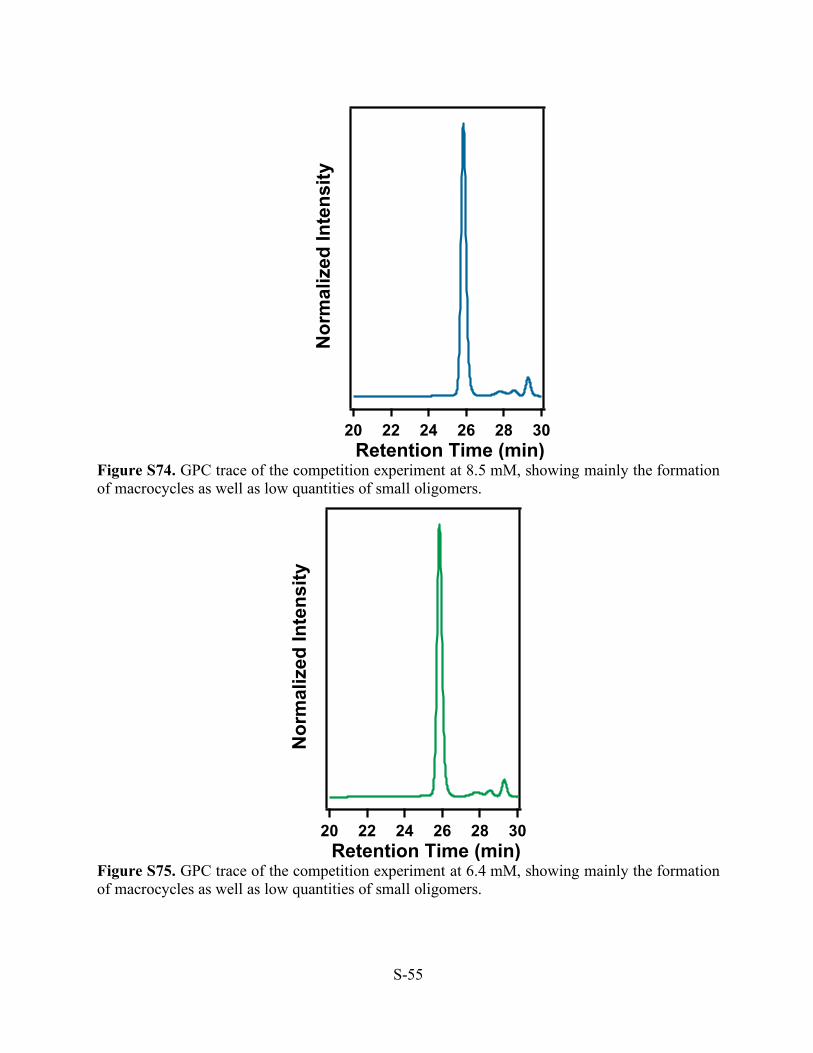
Figure S74. GPC trace of the competition experiment at 8.5 mM, showing mainly the formation of macrocycles as well as low quantities of small oligomers.
Figure S75. GPC trace of the competition experiment at 6.4 mM, showing mainly the formation of macrocycles as well as low quantities of small oligomers.
Nor
mal
ized
Inte
nsity
302826242220 Retention Time (min)
Nor
mal
ized
Inte
nsity
302826242220 Retention Time (min)
S-56
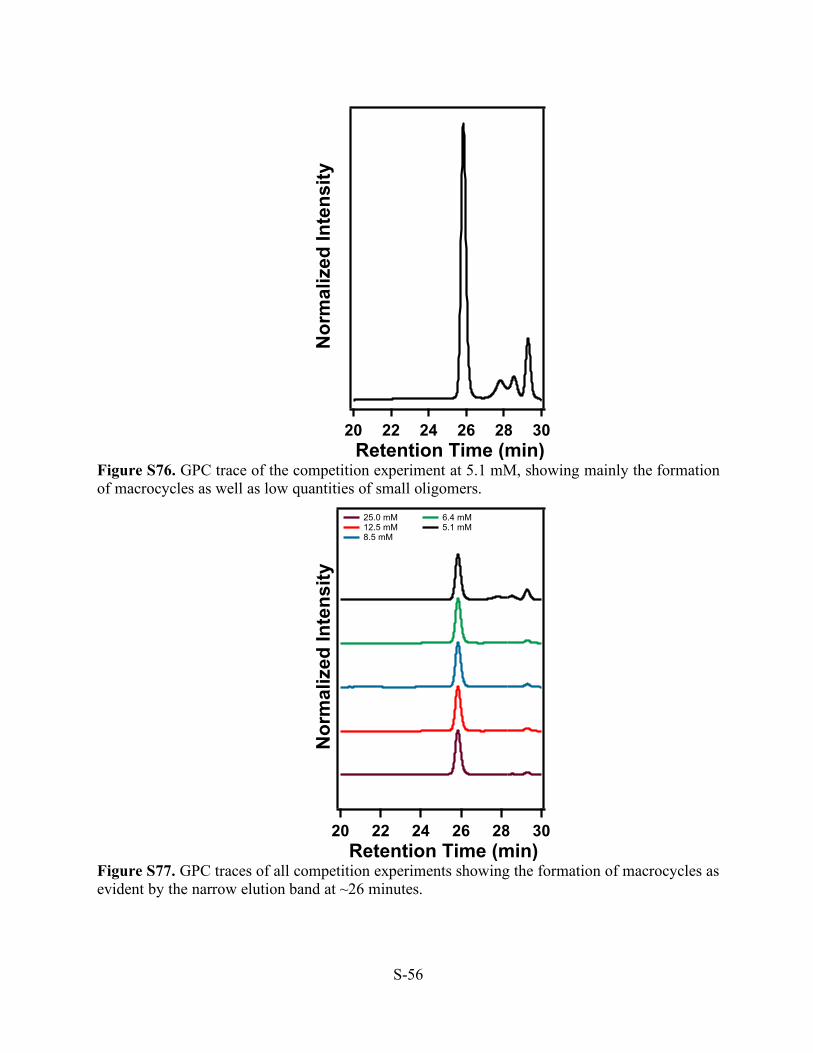
Figure S76. GPC trace of the competition experiment at 5.1 mM, showing mainly the formation of macrocycles as well as low quantities of small oligomers.
Figure S77. GPC traces of all competition experiments showing the formation of macrocycles as evident by the narrow elution band at ~26 minutes.
Nor
mal
ized
Inte
nsity
302826242220 Retention Time (min)
Nor
mal
ized
Inte
nsity
302826242220 Retention Time (min)
25.0 mM 6.4 mM 12.5 mM 5.1 mM 8.5 mM

S-57
Figure S78. MALDI-MS of the competition reaction at 25 mM showing the formation of the MC 2 ([M+H]+ m/z=1774.28, [M+Na]+ m/z=1796.52, [M+K]+ m/z=1813.81) as well as a small oligomer corresponding to the reaction of IDA monomers ([S1+2IDA+H]+ m/z=725.37).
Figure S79. MALDI-MS of the competition reaction at 12.5 mM showing the formation of the MC 2 ([M+H]+ m/z=1774.32, [M+Na]+ m/z=1796.50, [M+K]+ m/z=1813.92) as well as a small oligomer corresponding to the reaction of IDA monomers ([S1+2•IDA+H]+ m/z=725.35).
14x103
12
10
8
6
4
2
0
Inte
nsity
2500200015001000 m/z
3000
2500
2000
1500
1000
500
0
Inte
nsity
2500200015001000 m/z
14x103
12
10
8
6
4
2
0
Inte
nsity
17841780177617721768 m/z
6000
5000
4000
3000
2000
1000
0
Inte
nsity
17841780177617721768 m/z
S-58
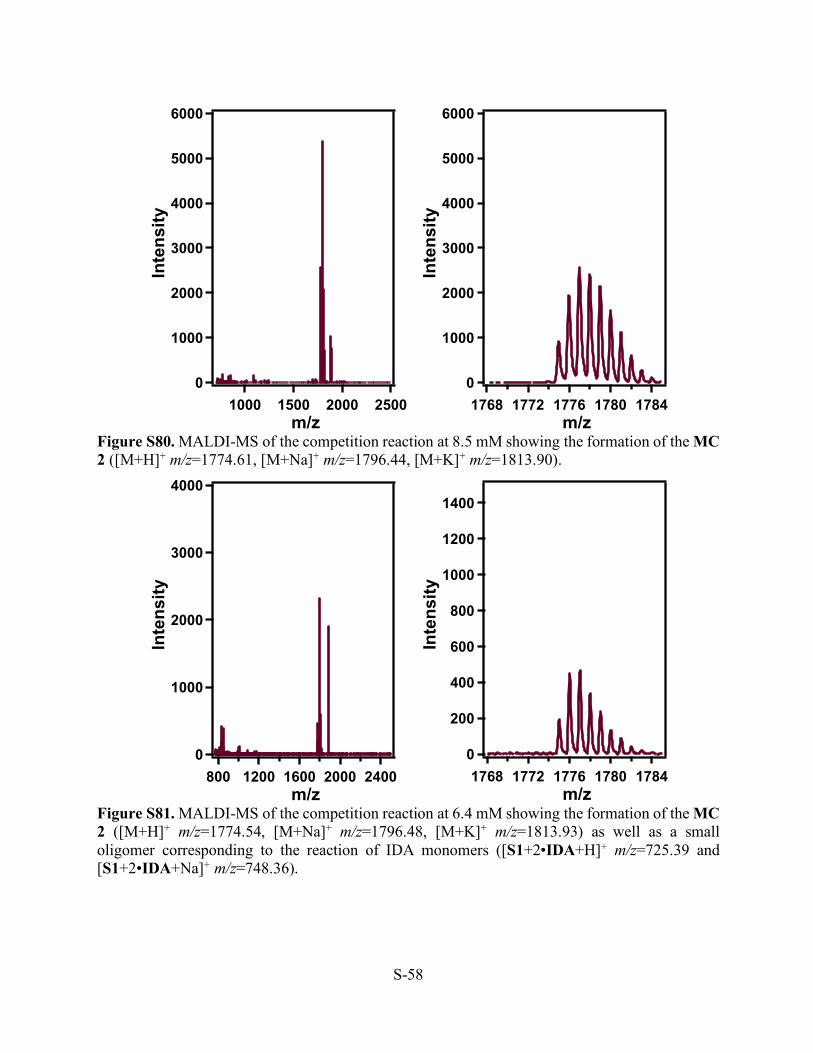
Figure S80. MALDI-MS of the competition reaction at 8.5 mM showing the formation of the MC 2 ([M+H]+ m/z=1774.61, [M+Na]+ m/z=1796.44, [M+K]+ m/z=1813.90).
Figure S81. MALDI-MS of the competition reaction at 6.4 mM showing the formation of the MC 2 ([M+H]+ m/z=1774.54, [M+Na]+ m/z=1796.48, [M+K]+ m/z=1813.93) as well as a small oligomer corresponding to the reaction of IDA monomers ([S1+2•IDA+H]+ m/z=725.39 and [S1+2•IDA+Na]+ m/z=748.36).
6000
5000
4000
3000
2000
1000
0
Inte
nsity
2500200015001000 m/z
4000
3000
2000
1000
0
Inte
nsity
2400200016001200800 m/z
6000
5000
4000
3000
2000
1000
0
Inte
nsity
17841780177617721768 m/z
1400
1200
1000
800
600
400
200
0
Inte
nsity
17841780177617721768 m/z
S-59
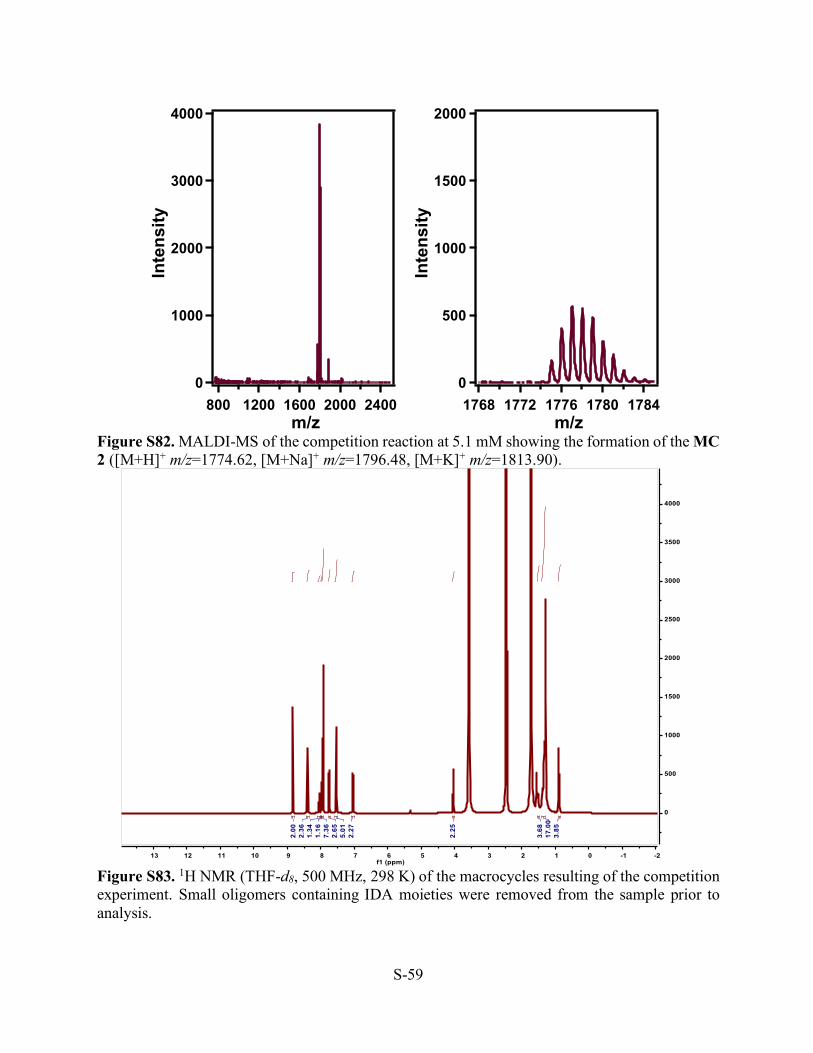
Figure S82. MALDI-MS of the competition reaction at 5.1 mM showing the formation of the MC 2 ([M+H]+ m/z=1774.62, [M+Na]+ m/z=1796.48, [M+K]+ m/z=1813.90).
Figure S83. 1H NMR (THF-d8, 500 MHz, 298 K) of the macrocycles resulting of the competition experiment. Small oligomers containing IDA moieties were removed from the sample prior to analysis.
4000
3000
2000
1000
0
Inte
nsity
2400200016001200800 m/z
2000
1500
1000
500
0
Inte
nsity
17841780177617721768 m/z
S-60
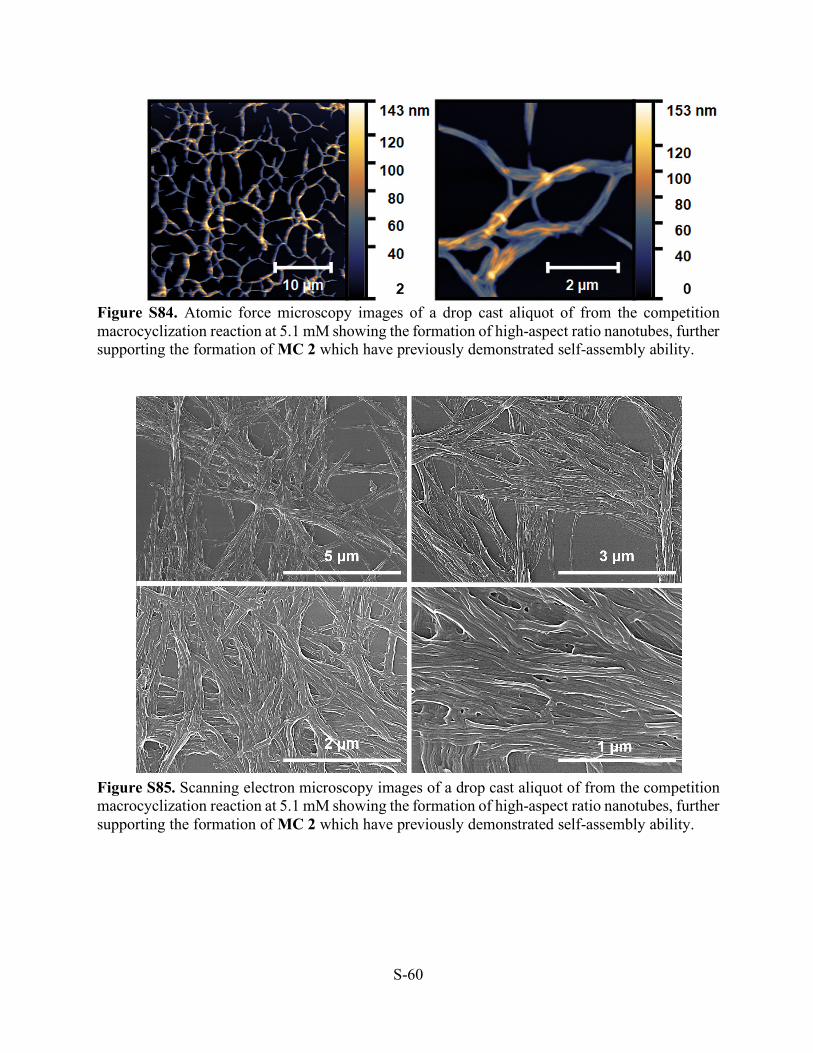
Figure S84. Atomic force microscopy images of a drop cast aliquot of from the competition macrocyclization reaction at 5.1 mM showing the formation of high-aspect ratio nanotubes, further supporting the formation of MC 2 which have previously demonstrated self-assembly ability.
Figure S85. Scanning electron microscopy images of a drop cast aliquot of from the competition macrocyclization reaction at 5.1 mM showing the formation of high-aspect ratio nanotubes, further supporting the formation of MC 2 which have previously demonstrated self-assembly ability.
S-61
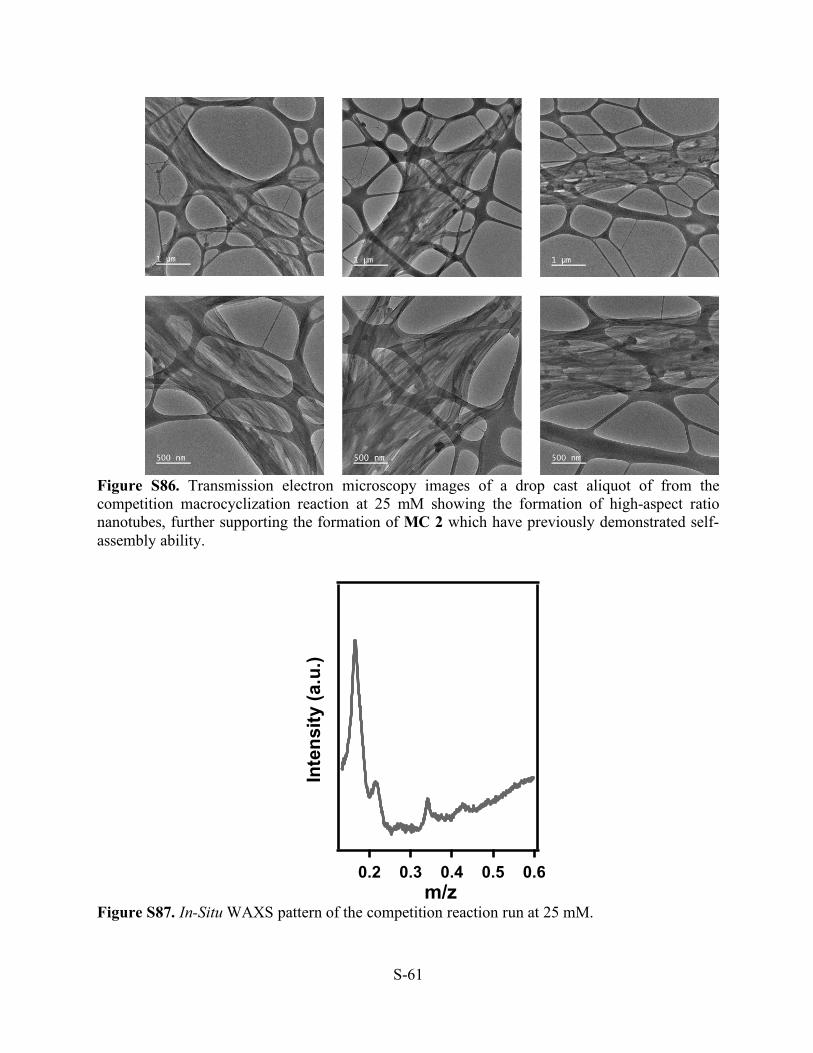
Figure S86. Transmission electron microscopy images of a drop cast aliquot of from the competition macrocyclization reaction at 25 mM showing the formation of high-aspect ratio nanotubes, further supporting the formation of MC 2 which have previously demonstrated self-assembly ability.
Figure S87. In-Situ WAXS pattern of the competition reaction run at 25 mM.
Inte
nsity
(a.u
)
0.60.50.40.30.2 m/z
Inte
nsity
(a.u
.)
S-62
H. Monomer Exchange Experiments Characterization I. Monomer Exchange of MC 2
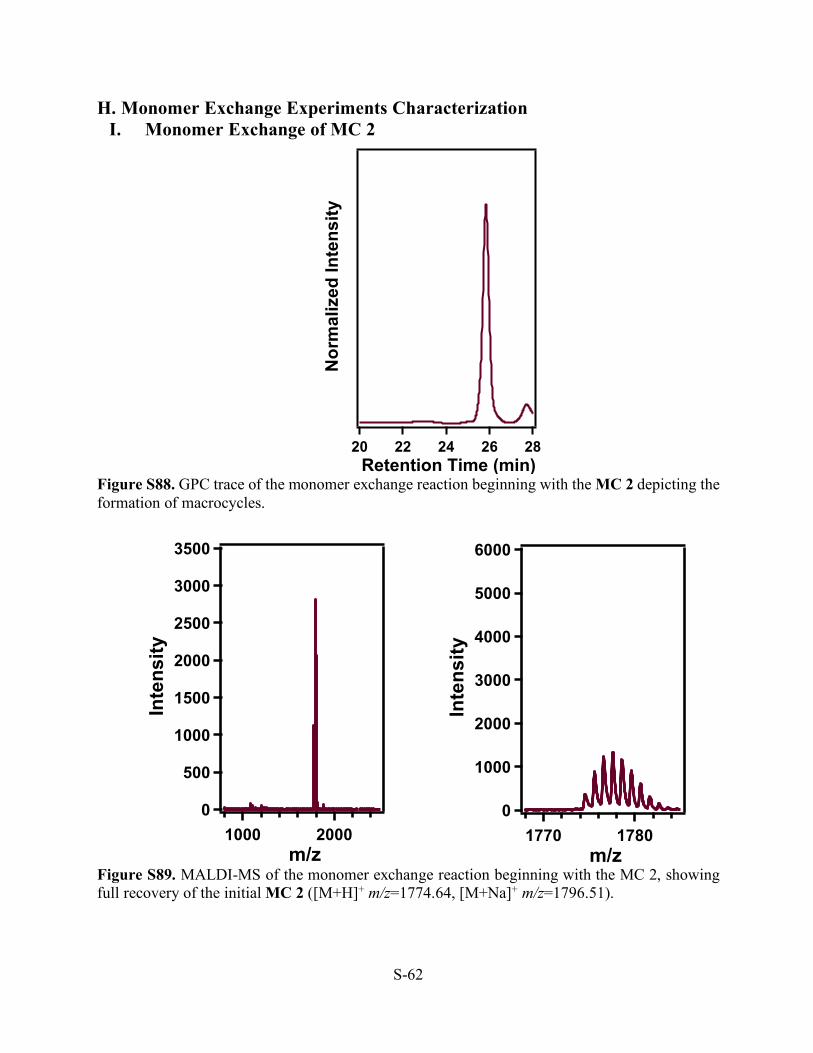
Figure S88. GPC trace of the monomer exchange reaction beginning with the MC 2 depicting the formation of macrocycles.
Figure S89. MALDI-MS of the monomer exchange reaction beginning with the MC 2, showing full recovery of the initial MC 2 ([M+H]+ m/z=1774.64, [M+Na]+ m/z=1796.51).
Nor
mal
ized
Inte
nsity
2826242220 Retention Time (min)
3500
3000
2500
2000
1500
1000
500
0
Inte
nsity
20001000 m/z
6000
5000
4000
3000
2000
1000
0
Inte
nsity
17801770 m/z
S-63
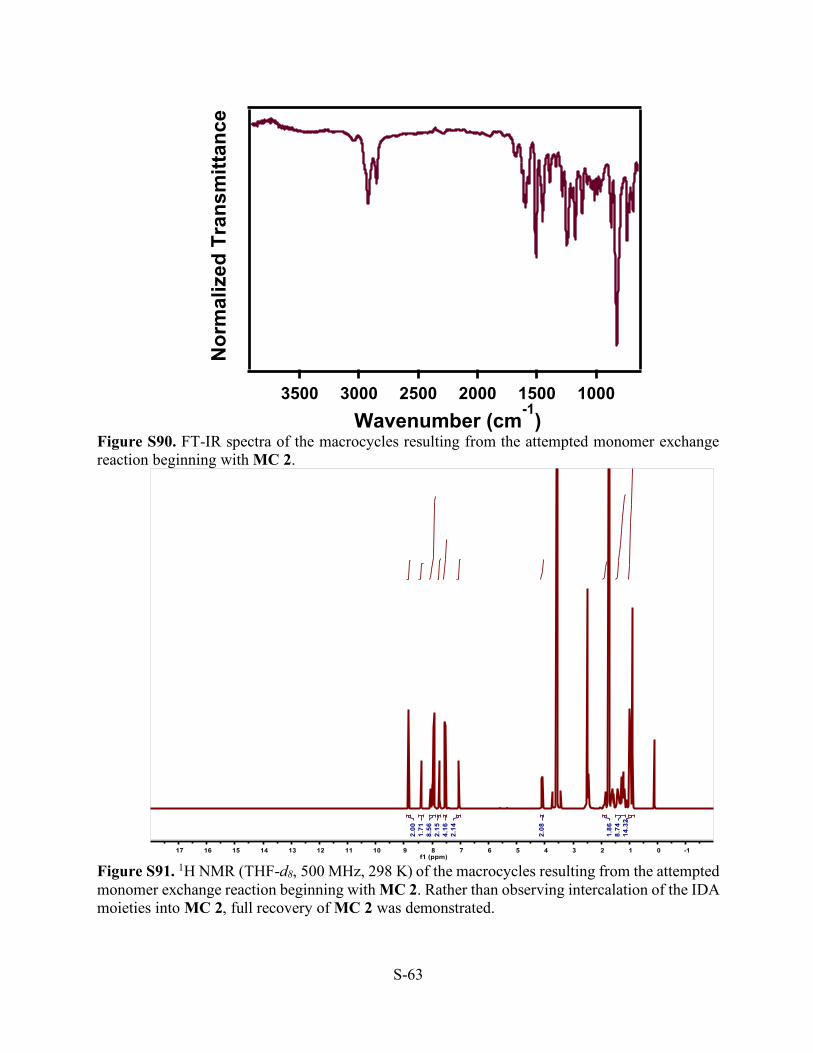
Figure S90. FT-IR spectra of the macrocycles resulting from the attempted monomer exchange reaction beginning with MC 2.
Figure S91. 1H NMR (THF-d8, 500 MHz, 298 K) of the macrocycles resulting from the attempted monomer exchange reaction beginning with MC 2. Rather than observing intercalation of the IDA moieties into MC 2, full recovery of MC 2 was demonstrated.
Nor
mal
ized
Tra
nsm
ittan
ce
3500 3000 2500 2000 1500 1000 Wavenumber (cm-1)

S-64
Figure S92. Atomic force microscopy images of a drop cast aliquot of from the monomer exchange reaction beginning with MC 2, showing the formation of high-aspect ratio nanotubes as seen in previous MC 2 samples.
Figure S93. Scanning electron microscopy images of a drop cast aliquot of from the monomer exchange reaction beginning with MC 2, showing the formation of high-aspect ratio nanotubes as seen in previous MC 2 samples.
S-65
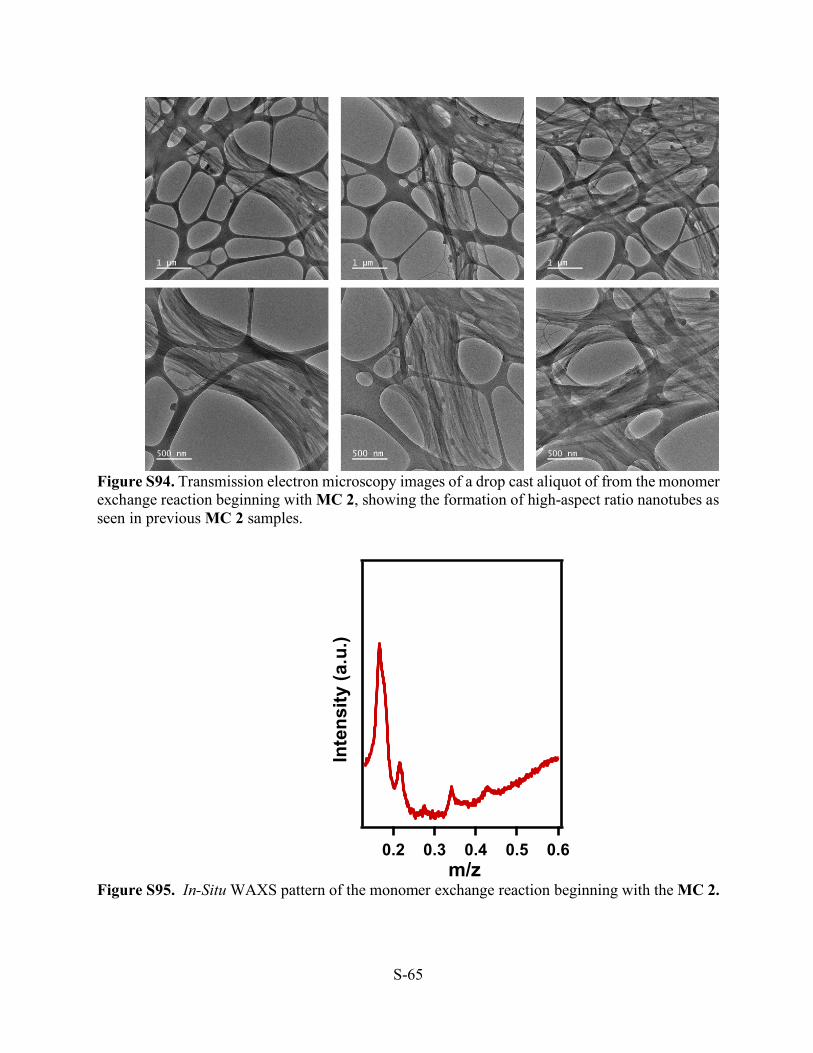
Figure S94. Transmission electron microscopy images of a drop cast aliquot of from the monomer exchange reaction beginning with MC 2, showing the formation of high-aspect ratio nanotubes as seen in previous MC 2 samples.
Figure S95. In-Situ WAXS pattern of the monomer exchange reaction beginning with the MC 2.
Inte
nsity
(a.u
)
0.60.50.40.30.2 m/z
Inte
nsity
(a.u
.)
S-66
II. Monomer Exchange of MC 1
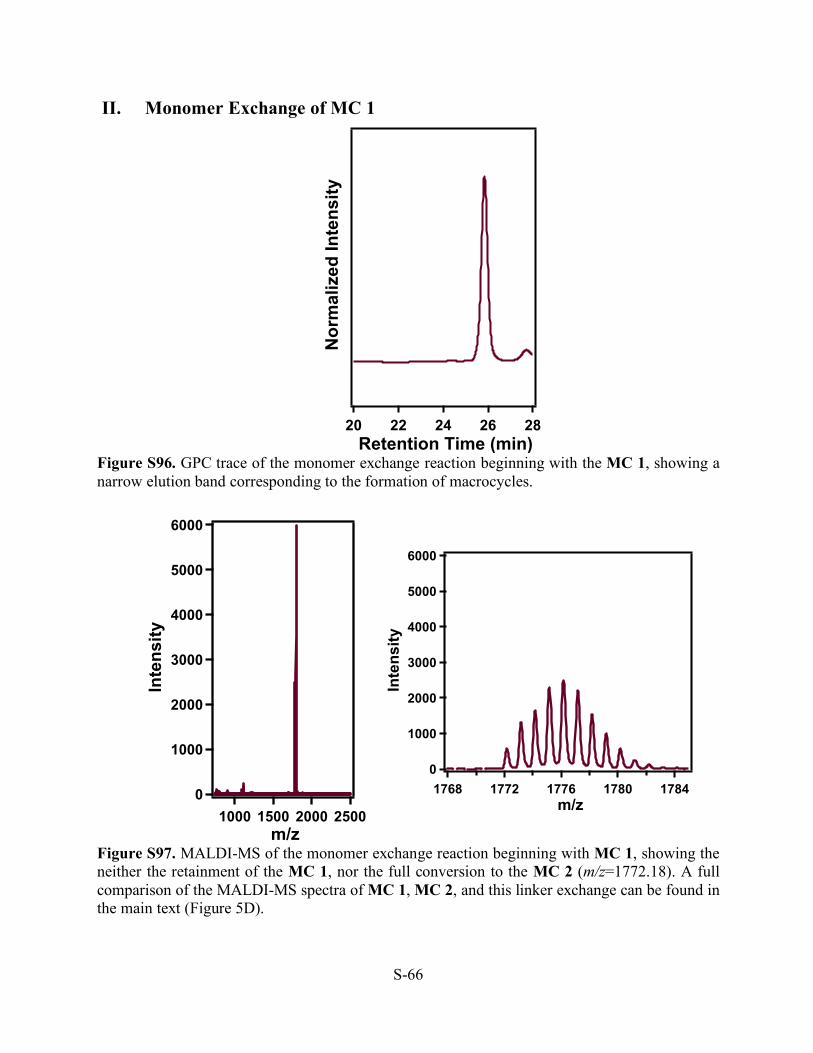
Figure S96. GPC trace of the monomer exchange reaction beginning with the MC 1, showing a narrow elution band corresponding to the formation of macrocycles.
Figure S97. MALDI-MS of the monomer exchange reaction beginning with MC 1, showing the neither the retainment of the MC 1, nor the full conversion to the MC 2 (m/z=1772.18). A full comparison of the MALDI-MS spectra of MC 1, MC 2, and this linker exchange can be found in the main text (Figure 5D).
Nor
mal
ized
Inte
nsity
2826242220 Retention Time (min)
6000
5000
4000
3000
2000
1000
0
Inte
nsity
2500200015001000 m/z
6000
5000
4000
3000
2000
1000
0
Inte
nsity
17841780177617721768 m/z
S-67
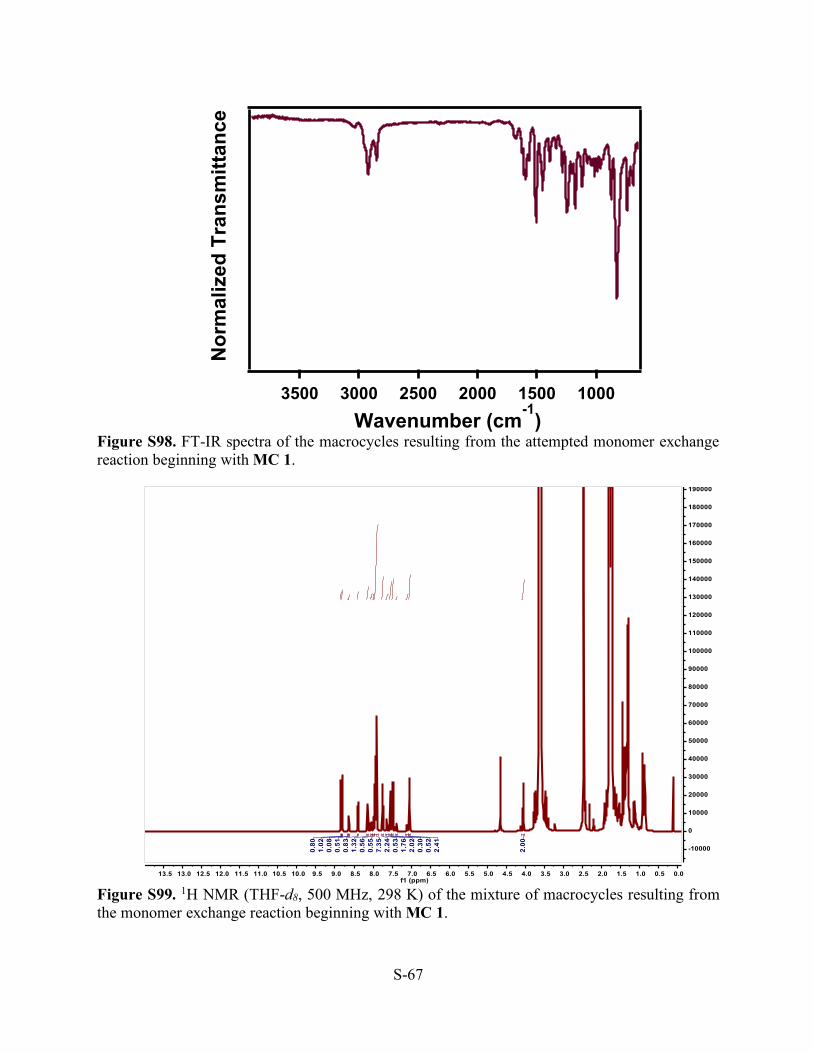
Figure S98. FT-IR spectra of the macrocycles resulting from the attempted monomer exchange reaction beginning with MC 1.
Figure S99. 1H NMR (THF-d8, 500 MHz, 298 K) of the mixture of macrocycles resulting from the monomer exchange reaction beginning with MC 1.
Nor
mal
ized
Tra
nsm
ittan
ce
3500 3000 2500 2000 1500 1000 Wavenumber (cm-1)
S-68
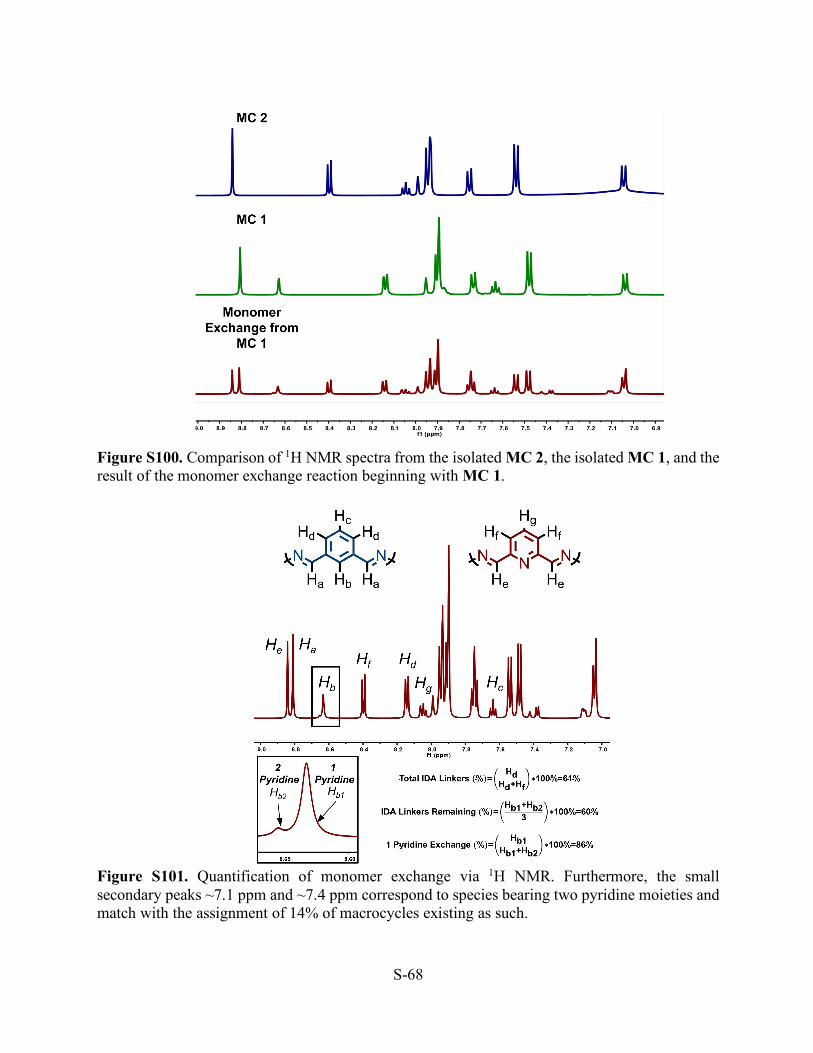
Figure S100. Comparison of 1H NMR spectra from the isolated MC 2, the isolated MC 1, and the result of the monomer exchange reaction beginning with MC 1.
Figure S101. Quantification of monomer exchange via 1H NMR. Furthermore, the small secondary peaks ~7.1 ppm and ~7.4 ppm correspond to species bearing two pyridine moieties and match with the assignment of 14% of macrocycles existing as such.
S-69
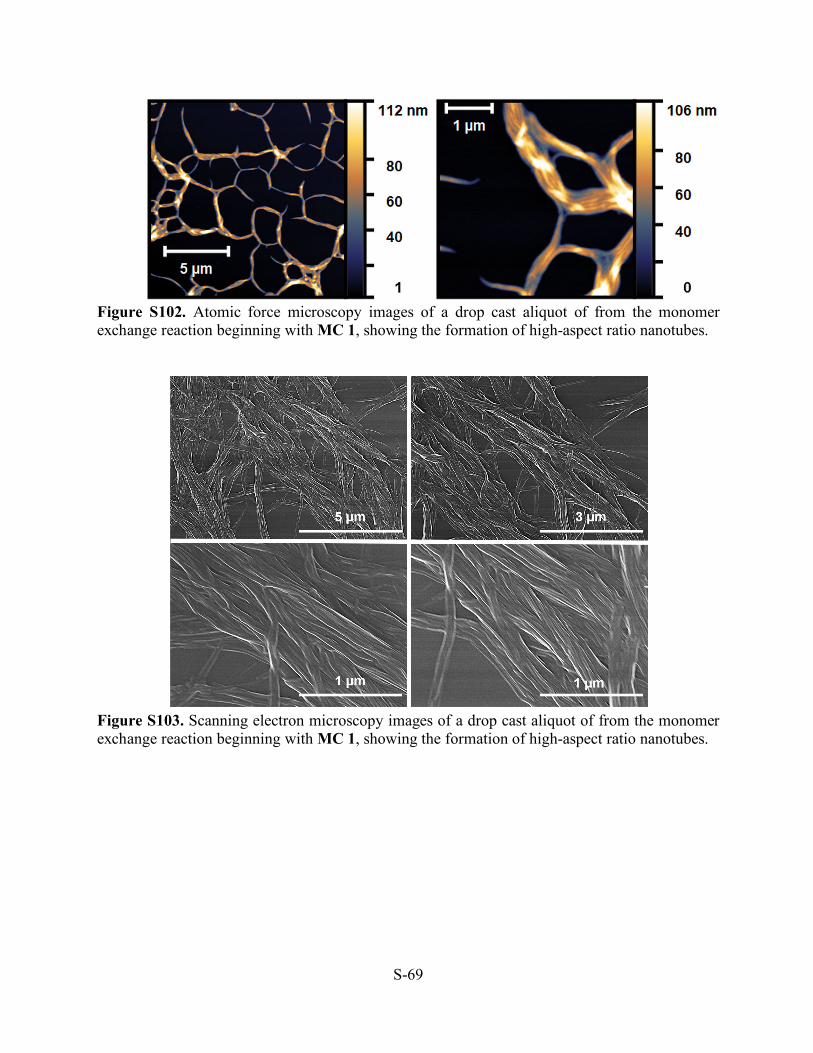
Figure S102. Atomic force microscopy images of a drop cast aliquot of from the monomer exchange reaction beginning with MC 1, showing the formation of high-aspect ratio nanotubes.
Figure S103. Scanning electron microscopy images of a drop cast aliquot of from the monomer exchange reaction beginning with MC 1, showing the formation of high-aspect ratio nanotubes.
S-70
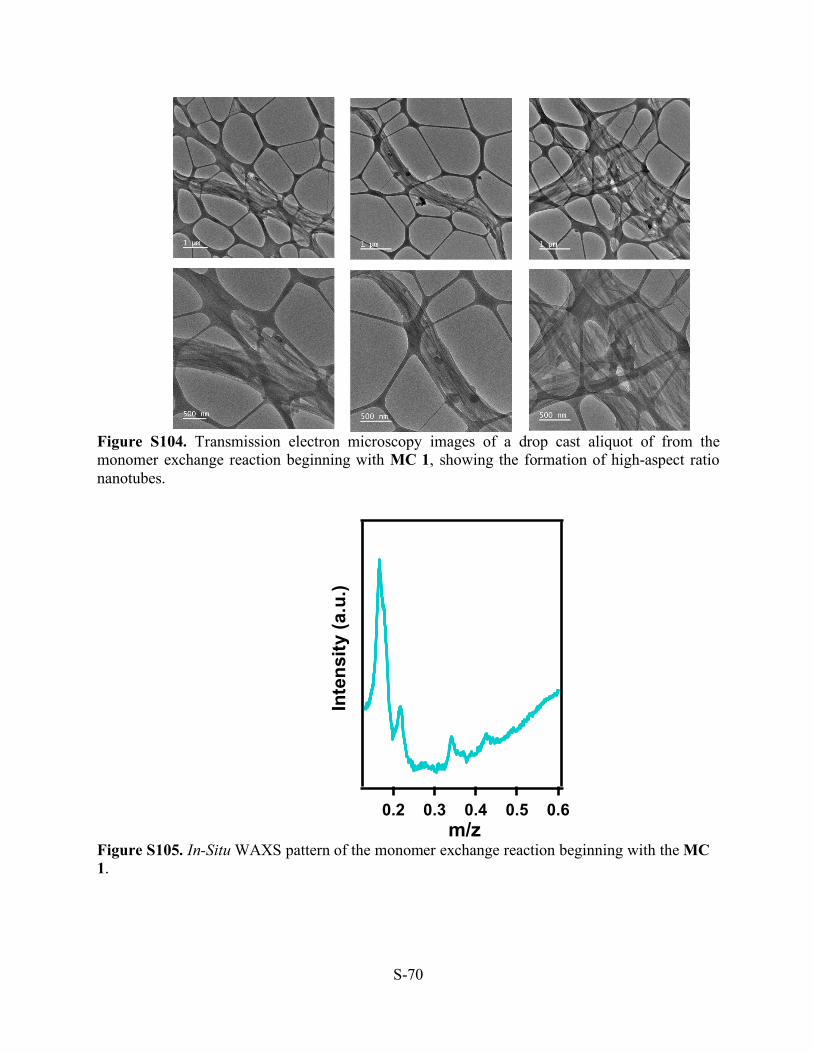
Figure S104. Transmission electron microscopy images of a drop cast aliquot of from the monomer exchange reaction beginning with MC 1, showing the formation of high-aspect ratio nanotubes.
Figure S105. In-Situ WAXS pattern of the monomer exchange reaction beginning with the MC 1.
Inte
nsity
(a.u
)
0.60.50.40.30.2 m/z
Inte
nsity
(a.u
.)
S-71
III. Synthesis and Monomer Exchange of 5-Br-MC 1
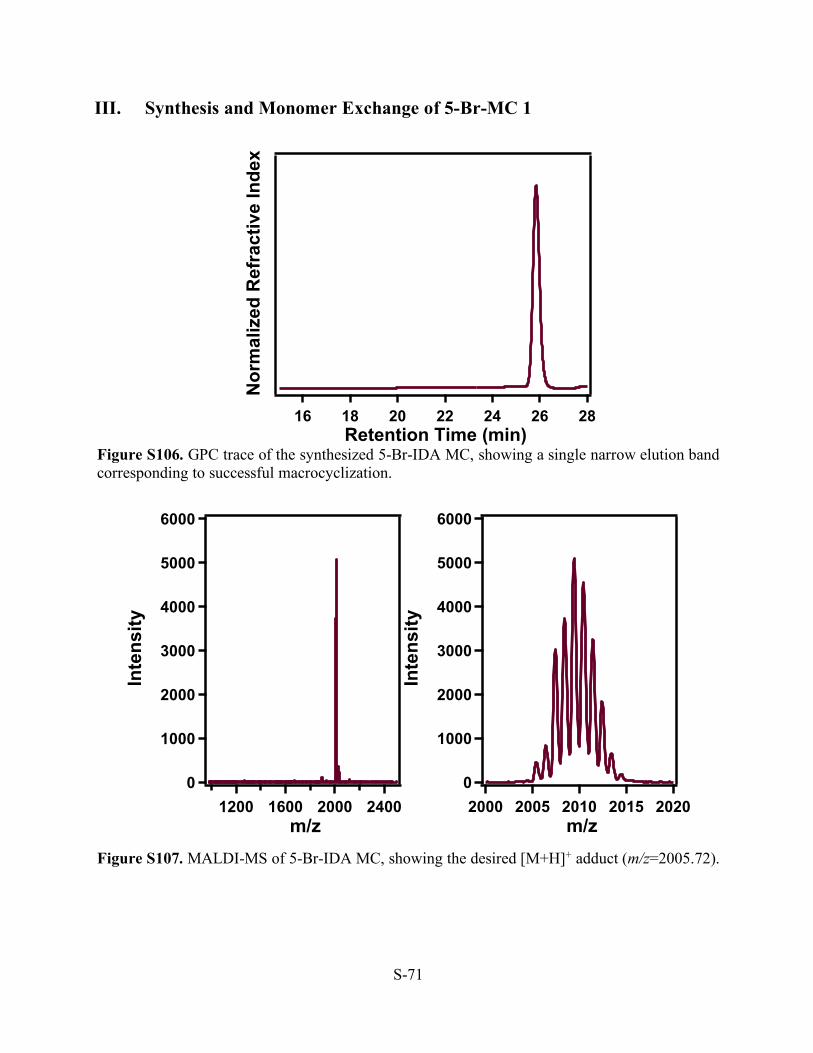
Figure S106. GPC trace of the synthesized 5-Br-IDA MC, showing a single narrow elution band corresponding to successful macrocyclization.
Figure S107. MALDI-MS of 5-Br-IDA MC, showing the desired [M+H]+ adduct (m/z=2005.72).
Nor
mal
ized
Ref
ract
ive
Inde
x
28262422201816 Retention Time (min)
6000
5000
4000
3000
2000
1000
0
Inte
nsity
20202015201020052000 m/z
6000
5000
4000
3000
2000
1000
0
Inte
nsity
2400200016001200 m/z

S-72
Figure S108. GPC trace of the macrocycles resulting from monomer exchange of the 5-Br-IDA MC with IDA. The narrow elution band corresponds to macrocycle products.
Figure S109. MALDI-MS of the monomer exchange reaction beginning with 5-Br-MC 1, showing the statistical incorporation of IDA monomers into the system ([3•S1+3•IDA+H]+ m/z=1771.74, [3•S1+3•IDA+Na]+ m/z=1794.86, [3•S1+2•IDA+1•5-Br-IDA+H]+ m/z=1848.92, [3•S1+2•IDA+1•5-Br-IDA+Na]+ m/z=1871.89, [3•S1+1•IDA+2•5-Br-IDA+H]+ m/z=1927.83, [3•S1+1•IDA+2•5-Br-IDA+Na]+ m/z=1950.82, [3•S1+3•5-Br-IDA+H]+ m/z=2005.75, [3•S1+3•5-Br-IDA+Na]+ m/z=2028.71).
Nor
mal
ized
Ref
ract
ive
Inde
x
28262422201816 Retention Time (min)
4000
3000
2000
1000
0
Inte
nsity
20001000 m/z
4000
3000
2000
1000
0
Inte
nsity
20001750 m/z

S-73
I. Small Molecule 1H NMR Studies I. Small Molecule Competition 1H NMR Study
Scheme S10. Scheme of small molecule competition study between IDA, DFP, and Aniline under conditions typical for macrocycle synthesis.
Small Molecule Competition Study: Aniline (0.025 g, 0.27 mmol), IDA (0.018 g, 0.13 mmol), and DFP (0.018 g, 0.13 mmol) were dissolved in previously dried CDCl3 to a final concentration of 20 mM with respect to aniline. A 1,4-dichlorobenzene (0.015 g) was added to the solution. CF3CO2H (34 uL of a 2M solution in CDCl3, 0.5 equiv) was added to the solution, a 1 mL aliquot was placed into an NMR tube and the tube was inverted 3-4 times to ensure proper mixing of the solution. The reaction mixture was then monitored over the course of two hours via 1H NMR spectrometry. HRMS of the reaction mixture after 120 minutes confirmed the presence of a pyridine-2,6-diimine species and unreacted isophthalaldehyde.
Figure S110. Stacked 1H NMR spectra (400 MHz, CDCl3, 298 K) of the small molecule competition study over the course of two hours. No appreciable changes in the spectra are observed from 5 min. to 2 h. of reaction time indicating that the rapidly formed pyridine-2,6-diimine species is both kinetically and thermodynamically favored.
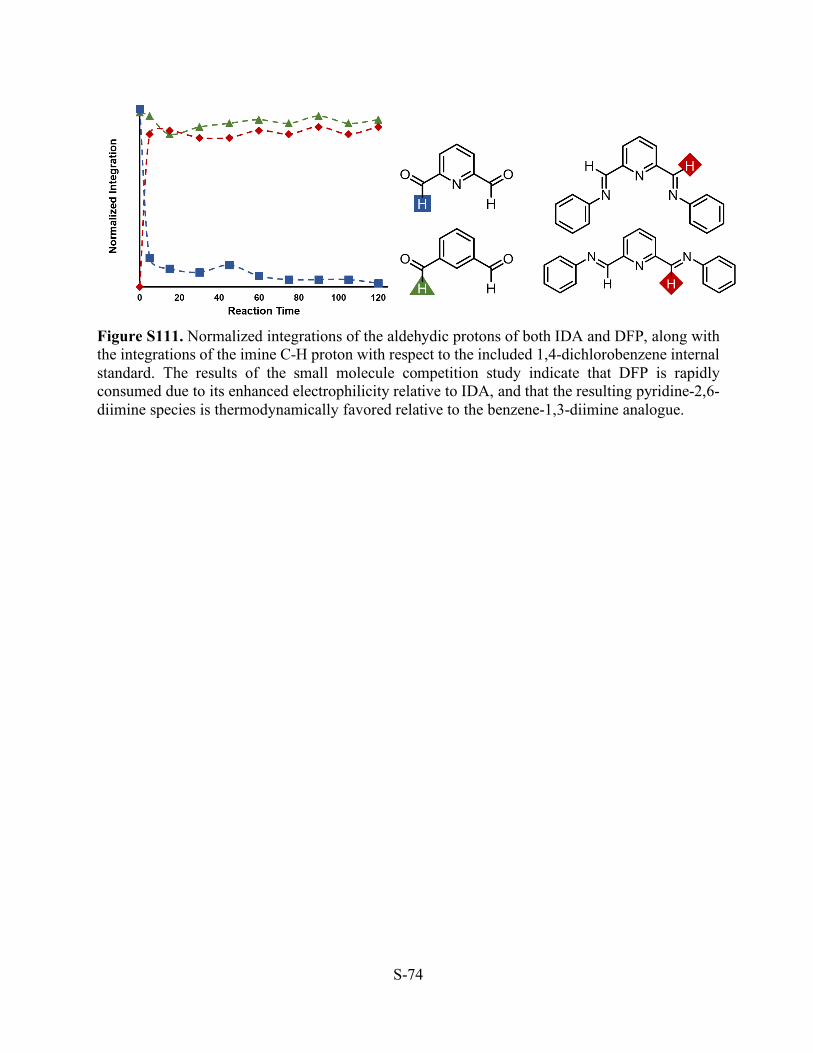
S-74
Figure S111. Normalized integrations of the aldehydic protons of both IDA and DFP, along with the integrations of the imine C-H proton with respect to the included 1,4-dichlorobenzene internal standard. The results of the small molecule competition study indicate that DFP is rapidly consumed due to its enhanced electrophilicity relative to IDA, and that the resulting pyridine-2,6-diimine species is thermodynamically favored relative to the benzene-1,3-diimine analogue.
S-75
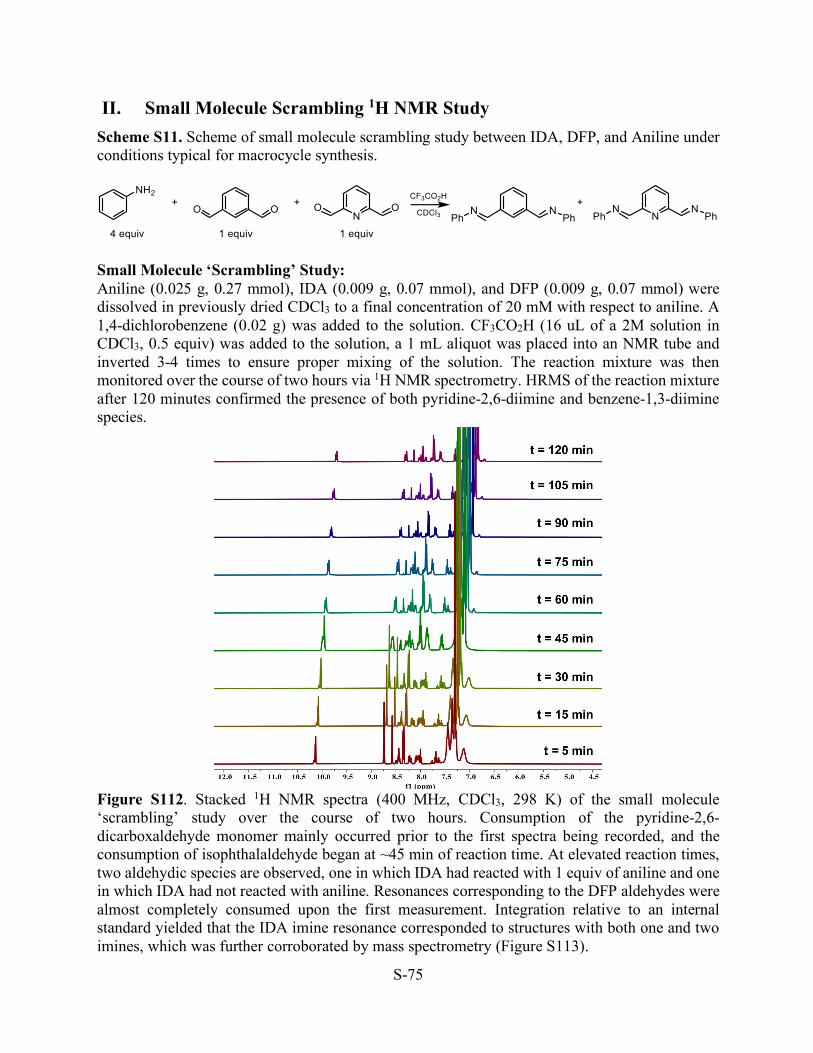
II. Small Molecule Scrambling 1H NMR Study Scheme S11. Scheme of small molecule scrambling study between IDA, DFP, and Aniline under conditions typical for macrocycle synthesis.
Small Molecule ‘Scrambling’ Study: Aniline (0.025 g, 0.27 mmol), IDA (0.009 g, 0.07 mmol), and DFP (0.009 g, 0.07 mmol) were dissolved in previously dried CDCl3 to a final concentration of 20 mM with respect to aniline. A 1,4-dichlorobenzene (0.02 g) was added to the solution. CF3CO2H (16 uL of a 2M solution in CDCl3, 0.5 equiv) was added to the solution, a 1 mL aliquot was placed into an NMR tube and inverted 3-4 times to ensure proper mixing of the solution. The reaction mixture was then monitored over the course of two hours via 1H NMR spectrometry. HRMS of the reaction mixture after 120 minutes confirmed the presence of both pyridine-2,6-diimine and benzene-1,3-diimine species.
Figure S112. Stacked 1H NMR spectra (400 MHz, CDCl3, 298 K) of the small molecule ‘scrambling’ study over the course of two hours. Consumption of the pyridine-2,6-dicarboxaldehyde monomer mainly occurred prior to the first spectra being recorded, and the consumption of isophthalaldehyde began at ~45 min of reaction time. At elevated reaction times, two aldehydic species are observed, one in which IDA had reacted with 1 equiv of aniline and one in which IDA had not reacted with aniline. Resonances corresponding to the DFP aldehydes were almost completely consumed upon the first measurement. Integration relative to an internal standard yielded that the IDA imine resonance corresponded to structures with both one and two imines, which was further corroborated by mass spectrometry (Figure S113).
S-76
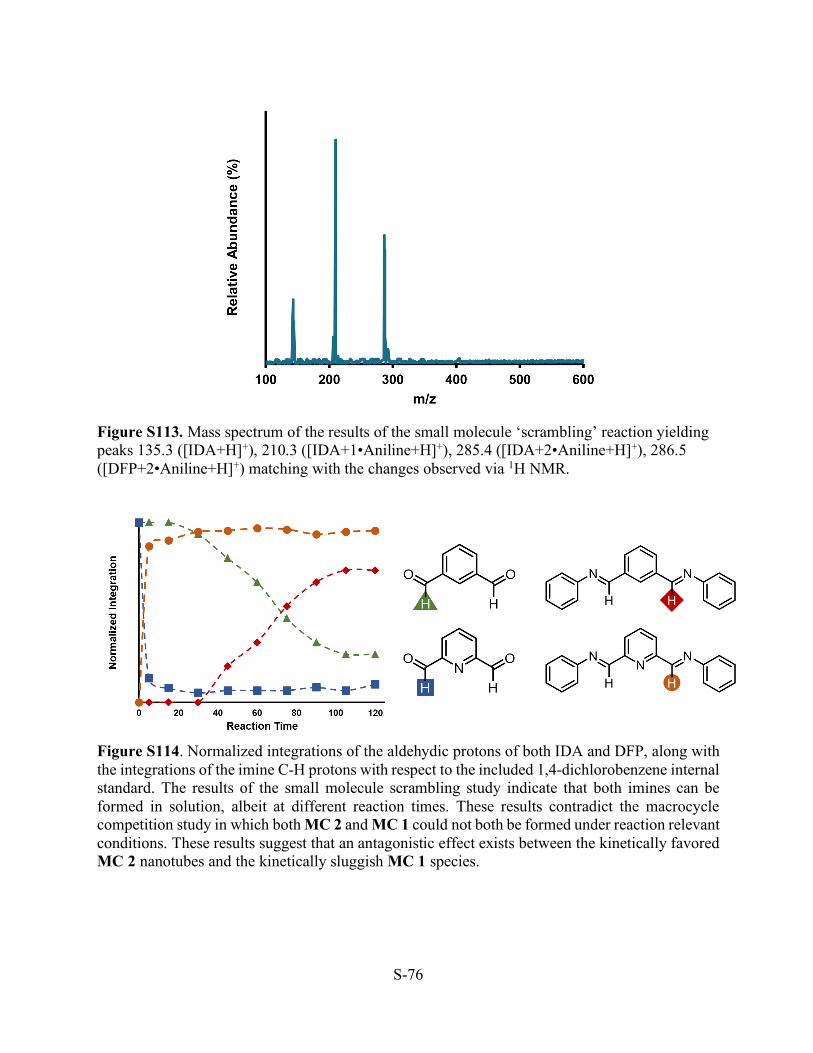
Figure S113. Mass spectrum of the results of the small molecule ‘scrambling’ reaction yielding peaks 135.3 ([IDA+H]+), 210.3 ([IDA+1•Aniline+H]+), 285.4 ([IDA+2•Aniline+H]+), 286.5 ([DFP+2•Aniline+H]+) matching with the changes observed via 1H NMR.
Figure S114. Normalized integrations of the aldehydic protons of both IDA and DFP, along with the integrations of the imine C-H protons with respect to the included 1,4-dichlorobenzene internal standard. The results of the small molecule scrambling study indicate that both imines can be formed in solution, albeit at different reaction times. These results contradict the macrocycle competition study in which both MC 2 and MC 1 could not both be formed under reaction relevant conditions. These results suggest that an antagonistic effect exists between the kinetically favored MC 2 nanotubes and the kinetically sluggish MC 1 species.

S-77
J. References 1. Chavez, A. D.; Evans, A. M.; Flanders, N. C.; Bisbey, R. P.; Vitaku, E.; Chen, L. X.;
Dichtel, W. R., Equilibration of Imine-Linked Polymers to Hexagonal Macrocycles Driven by Self-Assembly. Chem. Eur. J. 2018, 24 (16), 3989-3993.
2. Strauss, M. J.; Asheghali, D.; Evans, A. M.; Li, R. L.; Chavez, A. D.; Sun, C.; Becker, M. L.; Dichtel, W. R., Cooperative Self-Assembly of Pyridine-2,6-Diimine-Linked Macrocycles into Mechanically Robust Nanotubes. Angew. Chem. Int. Ed. 10.1002/anie.201907668.


![Supramolecular Polymerization of aPillar[5]arene Induced ... · drivingforce has been widely employed to fabricatemacrocy-cle-based supramolecular polymeric materials through multiple](https://static.fdocuments.us/doc/165x107/5f87fea3deb7bc556a555e86/supramolecular-polymerization-of-apillar5arene-induced-drivingforce-has-been.jpg)

![Supramolecular anion recognition in water: synthesis of ... · Supramolecular anion recognition in water: synthesis of hydrogen-bonded supramolecular frameworks ... (TP) 2] n taken](https://static.fdocuments.us/doc/165x107/5b9ce37509d3f2321b8d8473/supramolecular-anion-recognition-in-water-synthesis-of-supramolecular-anion.jpg)


