
Suppression of particle generation in a plasma process ...
24
Suppression of particle generation in a plasma process using a sine-wave modulated rf plasma Nobuki Kashihara 1,2 , Heru Setyawan 1,3 , Manabu Shimada 2,* , Yutaka Hayashi 2 , Chan Soo Kim 2 , Kikuo Okuyama 2 , and Sugeng Winardi 3 1 Innovation Plaza Hiroshima, Japan Science and Technology Agency, 3-10-23 Kagamiyama, Higashi-Hiroshima 739-0046, Japan 2 Department of Chemical Engineering, Graduate School of Engineering, Hiroshima University, 1-4-1 Kagamiyama, Higashi-Hiroshima 739-8527, Japan 3 Department of Chemical Engineering, Faculty of Industrial Technology, Sepuluh Nopember Institute of Technology (ITS), Kampus ITS Sukolilo, Surabaya 60111, Indonesia Submitted to: Journal of Nanoparticle Research on Sept. 15, 2004 revised on May. 9, 2005 * Corresponding author Tel.: +81-82-424-7717, fax.: +81-82-824-7850, e-mail: [email protected] 1
Transcript of Suppression of particle generation in a plasma process ...

Suppression of particle generation in a plasma process using a sine-wave modulated rf
plasma
Nobuki Kashihara1,2, Heru Setyawan1,3, Manabu Shimada2,*, Yutaka Hayashi2,
Chan Soo Kim2, Kikuo Okuyama2, and Sugeng Winardi3
1 Innovation Plaza Hiroshima, Japan Science and Technology Agency, 3-10-23 Kagamiyama,
Higashi-Hiroshima 739-0046, Japan
2 Department of Chemical Engineering, Graduate School of Engineering, Hiroshima
University, 1-4-1 Kagamiyama, Higashi-Hiroshima 739-8527, Japan
3 Department of Chemical Engineering, Faculty of Industrial Technology, Sepuluh Nopember
Institute of Technology (ITS), Kampus ITS Sukolilo, Surabaya 60111, Indonesia
Submitted to:
Journal of Nanoparticle Research
on Sept. 15, 2004
revised on May. 9, 2005
* Corresponding author Tel.: +81-82-424-7717, fax.: +81-82-824-7850, e-mail: [email protected]
1

Abstract
Sine-wave modulated rf plasma has been used to control particle generation and
growth in a plasma-enhanced chemical vapor deposition of silicon dioxide thin films using
TEOS/O2. The density and the size of particles generated in the plasma are greatly reduced
when the plasma is modulated with sine wave modulation at low modulation frequency (<
1000 Hz). In addition, particle contamination on the films is significantly reduced also for
nanoparticles, and the film growth rates at the range of modulation frequencies where particle
generation are greatly reduced do not decrease appreciably. Compared to its counterpart
pulse-wave modulation plasma, the sine-wave modulation plasma has demonstrated a better
performance in terms of reduction of particle generation and film contamination, and of film
growth rate. Thus, the sine-wave modulation plasma has shown as a promising method to be
applied in the production of thin film with a high deposition rate and a low particle
contamination.
Key words: plasma reactor, sine-wave modulation, particle generation control
2

Introduction
Plasma processes are extensively used in the processing of electronic materials,
especially for etching and deposition of thin films. The active species in these processes are
generated through many inelastic electron-induced collision phenomena such as excitation,
ionization, dissociation, attachment and so on. The plasma is generally not at a
thermodynamic equilibrium with the background gas and allows relatively low-temperature
processing. However, plasma processes are known to be a dirty process because of the
tendency of the plasma itself to generate dust particles through gas phase nucleation (Howling
et al., 1991). Dust particles generated in plasma are negatively charged and trapped around the
plasma/sheath boundary (Setyawan et al., 2003; 2004). The presence of dust particles in a
plasma reactor has negligible effects on the film properties as long as they are not deposited
on the film. However, without properly controlled, it may be difficult to ensure that dust
particles are not deposited onto the film.
Several methods have been proposed to control particle contamination. The basic
strategy of the proposed methods is generally based on the concept of reducing particle
generation and sweeping the generated particles from the trap region (Selwyn, 1991). The
strategy is chosen because complete elimination of particle generation is hardly feasible.
Therefore, reducing particle generation and simultaneously sweeping the generated particles
away from the trap region have become a preferable choice. Particle generation in plasma has
been shown to be reduced with increasing gas temperature (Jellum et al., 1991; Perrin et al.,
1994) and gas flow rate (Setyawan et al., 2004) and when the input power is modulated with
pulse wave (Watanabe et al., 1990; Bouchoule et al., 1991). Among the above methods, the
modulation of rf powers seems to be the most attractive method for dust-free processing
because it can be realized without any appreciable changes in the operating conditions. The
pulse-wave modulation plasma reduces particle generation by interrupting the nucleation and
3
growth of particles. However, since pulse-wave modulation is realized by switching the rf
power on-off at a high repetition rate, the plasma operation may become unstable and it may
lead to alter the process conditions (Viera et al., 1998). This is because the impedance
matching network cannot follow easily the oscillation of the plasma impedance due to the
much slower response time of the matching network. This makes the power reflection become
higher, which causes the control of rf power becomes difficult and inaccurate. In order to
overcome the instability in the operation of the pulse-wave modulation, we propose sine-wave
modulation of rf power for controlling particle generation, and hence contamination. This
type of modulation has small side bands due to the absence of rf-off period. Thus, sine-wave
modulation would provide a more stable operation with more accurate control of the rf power.
In this paper, we present a sine-wave modulated rf plasma approach to control
particle generation during the deposition of silicon dioxide thin films using
tetraethylorthosilicate (TEOS) and oxygen. The effects of sine-wave modulation plasma on
film growth rate are also discussed. The results are compared with those of continuous wave
and pulse-wave modulation plasma to discuss the performance of sine-wave modulation
plasma.
Experimental works
The schematic diagram of the experimental setup is shown in Fig. 1. The reactor
used was a parallel-plate type plasma-enhanced chemical vapor deposition (PECVD) reactor.
The PECVD reactor has been described in detail elsewhere (Setyawan et al., 2003; 2004).
Briefly, it consists of cylindrical plate electrodes 200 mm in diameter separated by a distance
of 35 mm. The lower plate is grounded and equipped with an electrical heater with a
temperature controller. The upper plate, which is in showerhead configuration where the gas
flows into the reactor, is coupled to a 13.56 MHz rf power supply (AX3000P, ADTEC Plasma
4

Technology, Japan). The output power of the rf generator was supplied to the reactor in the
forward direction whereas the reflected power was matched to approximately zero using a
matching controller (AMV-1000DES, ADTEC Plasma Technology, Japan). For the case of
modulation plasma, either pulse-wave or sine-wave, the output power of the rf generator was
modulated by an arbitrary waveform generator (Model 33120A, Agilent Technologies) and
the maximum power was set to 200 W for both cases.
A mixture of TEOS diluted in nitrogen as the carrier and oxygen with a controlled
flow rate and composition was introduced into the plasma reactor through the showerhead.
The following conditions were used in all experiments. TEOS concentration was 5.0 %. Total
gas flow rate was 100 sccm with the ratio of nitrogen to oxygen being 1:1. The substrate
temperature and the reactor pressure were set at 300 °C and 100 Pa, respectively. Particle
generation was observed by a laser light scattering (LLS) technique. A laser beam derived
from an Ar+ laser (Model 2017, Spectra Physics) was expanded into a sheet by a rod and
cylindrical lens to illuminate the space between the electrodes through one of the window in
the reactor. The light scattered by particles was detected by an image intensified charge
coupled device (ICCD) camera (IMAX 512, Princeton Instruments, Inc.) positioned
perpendicular to the light sheet. The signal was passed through a frame buffer and was
recorded by a PC.
In addition to the LLS technique, the particle size was measured by a laser particle
counter (Kondo et al., 2003). In this case, a sampling tube was inserted into the reactor and
the particles suspended in the plasma were sampled by means of a vacuum pump. The flow
rate of the outflowing gas was controlled in such a way that the drag force by gas flow can
overcome the potential barrier for the negatively charged particles due to the floating potential
of the sampling tube. The particles were then passed through a measuring cell and the number
was counted by a laser light scattering technique. Particles deposited on the wafer placed on
5

the grounded electrode were observed using scanning electron microscopy (SEM). Film
thickness was measured by a surface texture measuring instrument (Surfcom 1400D,
Accretech, Japan). The time-averaged growth rates were determined by dividing the average
film thickness by the deposition time used.
Results and discussion
Particle formation and growth
Figure 2 shows the spatial distribution of particles in the space between the
electrodes obtained using the LLS technique for various modulation frequencies when the rf
power is modulated with sine wave. As comparison, the spatial distribution for the case of
continuous wave, i.e., non-modulated plasma, at an rf power of 200 W is also presented. All
experimental data presented hereafter for continuous wave plasma are at an rf power of 200 W.
For each figure of the image, the upper part corresponds to the showerhead and the lower part
to the grounded electrode. The brighter image in the irradiating plane represents the presence
of particles, while the darker regions denote the absence of particles. It can be seen that the
effect of sine-wave modulation is not so significant in reducing particle generation at high
modulation frequencies whereas it is greatly reduced at low modulation frequencies. The
particles, which are trapped below the showerhead, become fewer at a modulation frequency
of 100 Hz and they are hardly detected by the LLS technique at a modulation frequency of 10
Hz.
In order to compare more quantitatively on the effects of sine-wave modulation
plasma on particle generation, the average intensity of the scattered light in the region around
the sheath near the powered electrode at various conditions was calculated. Figure 3 shows
the intensity of the light scattered by particles as a function of modulation frequency. For the
case of pulse-wave modulation, the duty ratio, i.e., the ratio of rf-on to one period, is 50 %.
6

All data presented hereafter for pulse-wave modulation are at the same duty ratio. The
scattered intensity for continuous wave is also displayed as comparison. As has been
discussed earlier, when the plasma is modulated with sine wave, particle generation is greatly
reduced at low modulation frequencies. The reduction of particle generation is very effective
in the range of modulation frequency up to 100 Hz. This also occurs when the plasma is
modulated with pulse wave. The reduction of particle generation based on the measurements
of the scattered intensity at a modulation frequency of 100 Hz or lower, both for sine-wave
and pulse-wave modulation, is about 75 %.
Since the LLS technique cannot provide us separate information on particle
concentration and size, the particle size and the relative amount of particles were measured by
the particle counter described above. The lower detectable limit of the particle counter is
approximately 0.1 μm and particles larger than 0.8 μm will be counted as 0.8 μm. Figure 4
shows the average particle size obtained by the particle counter at various frequencies when
the plasma is modulated with sine wave. The average particle size for the cases of continuous
wave and pulse-wave modulation is also presented. It can be seen that when the plasma is
modulated with sine wave, the particle size is greatly reduced over a broad range of
modulation frequencies. Even though the pulse-wave modulation also reduces the particle size,
it only occurs over a narrow range of modulation frequencies. While the sine-wave
modulation plasma reduces particle size up to a modulation frequency of 10,000 Hz, the
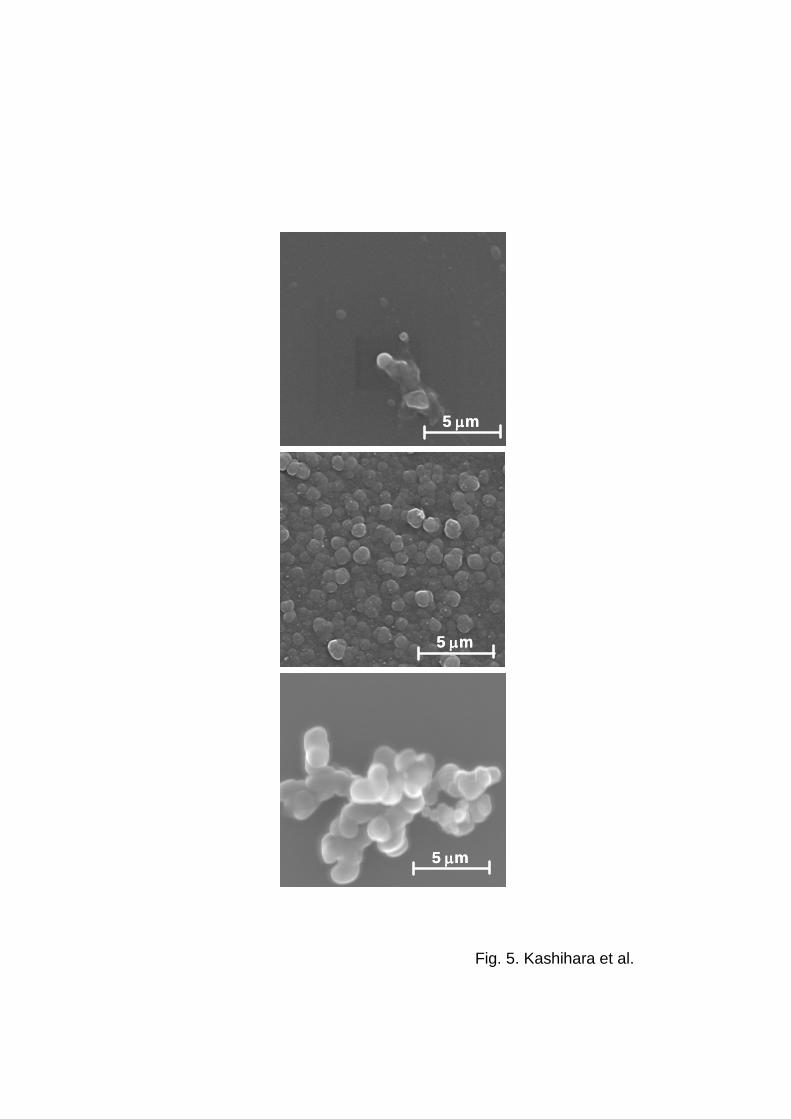
pulse-wave modulation only up to 100 Hz. Figure 5 shows SEM images of particles sampled
from the trap location below the powered electrode for the cases of sine-wave modulation (a)
and pulse-wave modulation (b), both at a modulation frequency of 50 Hz, and continuous
wave (c). The particles are nearly non-agglomerated when the plasma is modulated, either
with sine wave or pulse wave. On the other hand, the particles are agglomerated for the case
of continuous wave and the size is much larger.
7

Figure 6 shows the number of particles sampled from the trap location below the
powered electrode and counted by the particle counter with the sampling time of one minute.
The sampling was performed after stable clouds have been formed below the powered
electrode. Even though these measurements do not provide the absolute value of
concentration, the information is very useful to understand the relative amount of particles
generated in the plasma space. The particle number is greatly reduced at a modulation
frequency of 100 Hz or lower, both for sine-wave and pulse-wave modulation. The particle
number is only slightly reduced at a modulation frequency of 1,000 Hz or higher.
The absolute energy input in the plasma, one of the important parameters governing
particle generation, does not change theoretically with modulation frequency for the
pulse-wave modulation plasma at a fixed duty ratio. The mechanism of particle reduction in
pulse-wave modulation plasma has been discussed (Bertran et al., 2000; Shiratani et al., 2000).
The reduction of particle generation greatly depends on the duration of absolute rf-on and
rf-off periods. The radicals, which are responsible for particle generation, are produced during
the rf-on period. They diffuse to leave the production region during the subsequent rf-off
period. If the rf-off period is shorter than or comparable to the characteristic time of diffusion,
the radicals do not have sufficient time to diffuse from the production region and thus form a
region of high radical concentration. As the concentration of chemical species participating in
particle formation such as the radicals becomes larger, the rate of homogeneous nucleation
increases very rapidly (Friedlander, 1977). Nuclei and particles formed in plasma are
suggested to be grown mainly by coagulation (Bouchoule et al., 1991; Shiratani et al., 2000;
Setyawan et al., 2004). A larger rate of nucleation leads to formation of larger particles since
the rate of coagulation increases with particle concentration (Friedlander, 1977). As a result,
they contribute to particle generation and particle generation cannot be suppressed effectively.
Therefore, in order to reduce effectively particle generation in the plasma, the duration of
8

rf-off period must be long enough to ensure that all particles generated during the period of
rf-on leave the plasma and therefore, to restore the initial conditions of the gas in the new
cycle.
The mechanism of particle reduction in sine-wave modulation plasma seems to be
similar to that of pulse-wave modulation, namely interruption of particle nucleation and
growth. The absolute energy input in the plasma is independent of modulation frequency, as in
the case of the pulse-wave modulation. While the interruption in pulse-wave modulation
occurs during the rf-off period, it is considered to occur when the modulated power is
approaching the minimum value during the cycle for the case of sine-wave modulation. It can
be seen that the effect of sine-wave modulation on the reduction of particle generation is not
significant at high modulation frequencies. On the other hand, particle generation is greatly
reduced at low modulation frequencies. The duration of the rf power around its minimum
value is very short at high modulation frequencies. This very short time provides no sufficient
time for particles that have been generated to escape from the trap location. As a result, they
contribute to particle generation at the period of high power, and hence particle generation is
hardly reduced at high modulation frequencies. When the modulation frequency is low, there
is sufficient time for particles that have been generated to escape from the trap location during
the low period of rf power. Thus, there are two simultaneous events taking place when the
modulation wave is around the minimum value, interruption of particle generation and
escaping of particles that have been generated. Hence, the reduction of particle generation in
sine-wave modulation can be controlled by adjusting the modulation frequency.
Film growth rate
Figure 7 shows the dependence of film growth rate on modulation frequency. For
continuous wave operation, a film growth rate of approximately 0.125 μm/min is obtained.
9
The film growth rates do not change appreciably when the plasma is modulated with sine
wave over all ranges of modulation frequency being used. On the other hand, the pulse wave
modulation is shown to reduce significantly the film growth rate at low modulation
frequencies, i.e., ≤ 100 Hz, the range where particle generation is greatly reduced. The
reduction is about 40 %. The film growth rates are nearly the same as those of continuous
wave at high modulation frequencies. For the case of continuous wave plasma, it has been
shown experimentally that the film growth rate of silicon dioxide using TEOS/O2 plasma
increases with increasing rf power (Raupp & Cale, 1992). Theoretically, the time-averaged rf
power will be reduced when the plasma is modulated, either with sine wave or pulse wave.
The reduction in rf power will reduce the film growth rates as in the case of continuous wave.
Since the pulse-wave modulation is realized by switching the rf power on and off repeatedly,
the reduction in rf power is supposed to be higher than that of sine-wave modulation. This
may explain why the decrease in film growth rate is larger for pulse-wave modulation.
The mechanism of the reduction of film growth rate at low modulation frequencies is
discussed in the following. It has been shown that the film growth rates of silicon dioxide
using TEOS/O2 plasma in continuous wave operation are determined by ion-induced and
radical-induced depositions, which depends on the number of active species generated in the
plasma (Raupp & Cale, 1992). The concentration of radicals and ions generated in the plasma
increases with increasing rf power. The ion-induced deposition typically contributes about
30 % to the total film growth rate. We observed that the electron density, as measured by a
Langmuir probe (Smartprobe, Scientific Systems), does not change appreciably when the
plasma is modulated with sine wave over all ranges of modulation frequency used, as shown
in Fig. 8. On the other hand, for the case of pulse-wave modulation, the electron density tends
to decrease with decreasing modulation frequency when the modulation frequency is lower
than 10,000 Hz. It reaches a minimum value at a modulation frequency of 100 Hz, and then
10

takes a constant value by decreasing further the modulation frequency. The decrease in
electron density implies the decrease in ion density due to the quasi-neutrality properties of
the plasma. Moreover, it is presumably that radicals generated in the plasma also decreases
with the decrease in electron density since the excitation reactions to produce radicals depend
on the electron density. The decrease in ion and radical densities causes a decrease in film
growth rate since both ion-induced and radical-induced contribution to film growth rate
decreases.
The results suggest that sine-wave modulation plasma provides a better performance
in terms of both particle formation reduction and film growth rate compared to its counterpart
pulse-wave modulation. Next, we will discuss the effect of sine-wave modulation on film
contamination.
Film contamination
Figure 9 shows SEM images of particles deposited on the film surface for the cases
of sine-wave modulation (a), pulse-wave modulation (b), both at a modulation frequency of
50 Hz, and continuous wave (c). It can be seen that the sine-wave modulation plasma
produces a clean film, nearly free from particle contamination. Even though pulse-wave
modulation plasma reduces particle contamination compared to continuous wave, the
morphology of the film surface undergoes degradation. It has been shown previously that the
trapped particles would be attracted towards the electrode when the plasma was turned off due
to the retained self bias voltage of the electrode and particle charge (Setyawan et al., 2003).
Since the pulse-wave modulation plasma is operated in on-off mode, the trapped particles
undergo an oscillation about its equilibrium position as is observed using the LLS technique
(not shown). Thus, the probability of particles to deposit on the film during deposition process
becomes higher due to this oscillation. Therefore, from the point view of particle
11

contamination, sine-wave modulation plasma also shows a better performance compared to its
counterpart pulse-wave modulation plasma.
SEM observations with higher magnification showed that the number of deposited
particles of 0.01 - 0.1 μm in size was also reduced greatly for the modulated plasmas
compared with the continuous-wave plasma. Although the above-mentioned measurements of
particles suspended in plasma using the light scattering techniques did not provide
information on particles smaller than about 0.05 μm, the plasma modulations, especially the
sine-wave modulation, are concluded to be capable of thwarting the production of
nanoparticles since the characteristics of deposited particles reflect those of particles
suspended and trapped in the plasma.
Conclusions
It has been demonstrated that sine-wave modulation plasma greatly reduces particle
generation in a PECVD reactor for thin film deposition of silicon dioxide using TEOS/O2.
Particle contamination on the films is also significantly reduced and the film growth rates at
the range of modulation frequencies where particle generation are greatly reduced do not
decrease appreciably. Compared to its counterpart pulse-wave modulation plasma, the
sine-wave modulation plasma has demonstrated a better performance in terms of reduction of
particle generation and film contamination, and of film growth rate. Thus, the sine-wave
modulation plasma has been shown as a promising method to be applied in the production of
thin film with a high deposition rate and a low particle contamination.
Acknowledgements
This work was partly supported by Innovation Plaza Hiroshima of the Japan Science and
Technology Agency (JST) and a Grant-in-Aid from the Ministry of Education, Sports, Culture,
12

Science and Technology of Japan.
13

References
Bertran, E., Viera, G., Martinez, E., Esteve, J., Maniette, Y., Farjas, J. & Roura, P., 2000. Thin
Solid Films, 377-378, 495.
Bouchoule, A., Plain, A., Boufendi, L., Blondeau, J. Ph. & Laure, C., 1991. J. Appl. Phys. 70,
1991.
Friedlander, S. K., 1977. Smoke, dust and haze – fundamentals of aerosol behaviour. John
Wiley & Sons, New York.
Howling, A. A., Hollenstein, Ch. & P. -J. Paris, 1991. Appl. Phys. Lett. 59, 1409.
Jellum, G. M., Daugherty, J. E. & Graves, D. B., 1991. J. Appl. Phys. 69, 6923.
Kondo, K., Imajo, Y., Shimada, M., and Okuyama, K., 2003. Kagaku Kogaku Ronbunshu 29,
513.
Perrin, J., Bohm, C., Etemadi, R. & Lloret, A., 1994. Plasma Sources Sci. Technol. 3, 252.
Raupp, G. B. & Cale, T. S., 1992. J. Vac. Sci. Technol. B 10, 37.
Selwyn, G. S., 1991. J. Vac. Sci. Technol. B 9, 3487.
Setyawan, H., Shimada, M., Imajo, Y., Hayashi, Y. & Okuyama, K., 2003. J. Aerosol Sci. 34,
923.
Setyawan, H., Shimada, M., Hayashi, Y., Okuyama, K. & Yokoyama, S., 2004. Aerosol Sci.
Tech. 38, 120.
Shiratani, M., Maeda, S., Koga, K. & Watanabe, Y., 2000. Jpn. J. Appl. Phys. Part 1 39, 287.
Viera, G., Andújar, J. L., Sharma, S. N. & Bertran, E., 1998. Surf. Coat. Tech. 100-101, 55.
Watanabe, Y., Shiratani, M. & Makino, H., 1990. Appl. Phys. Lett. 57, 1616.
14

Figure Captions
Fig. 1. Schematic diagram of the experimental setup and the measuring system.Fig. 2. Spatial
distribution of particles suspended in the space between the electrodes observed using the
LLS technique: (a) continuous wave, (b) sine wave 10,000 Hz, (c) sine wave 100 Hz, and (d)
sine wave 10 Hz..Fig. 3. Effect of modulation frequency on particle formation for the cases of
sine-wave and pulse-wave modulation plasma as measured by the LLS technique. The
sine-wave and pulse-wave modulation almost give the same results.
Fig. 4. Effect of modulation frequency on particle size for the cases of sine-wave and
pulse-wave modulation as measured by the particle counter.Fig. 5. SEM images of particles
trapped in the sheath region below the showerhead at various modes of operation: (a)
sine-wave modulation at a modulation frequency of 50 Hz, (b) pulse-wave modulation at a
modulation frequency of 50 Hz, and (c) continuous wave.
Fig. 6. Effect of modulation frequency on particle number for the cases of sine-wave and
pulse-wave modulation as measured by the particle counter.
Fig. 7. Dependence of film growth rate on modulation frequency for the cases of sine-wave
and pulse-wave modulation.
Fig. 8. Dependence of plasma density on modulation frequency for the cases of sine-wave and
pulse-wave modulation.
Fig. 9. SEM images of film surface produced with (a) sine-wave modulation, (b) pulse-wave
modulation, and (c) continuous wave.
15

Fig. 1. Kashihara et al.
N2
Opticaldumper
Matchingboxrf generator
Ar+ laser(488nm)
ICCD camera
ShowerheadMass flow controller
Reactor
Interference filter(488 nm)
PC
Laser Particlecounter
Vacuum pump
Cylindrical glass lensRod glass lens
O2
N2
TEOS
Liquid mass flow controller
Si wafer
Function generator
N2
Opticaldumper
Matchingboxrf generator
Ar+ laser(488nm)
ICCD camera
ShowerheadMass flow controller
Reactor
Interference filter(488 nm)
PC
Laser Particlecounter
Vacuum pump
Cylindrical glass lensRod glass lens
O2
N2
TEOS
Liquid mass flow controller
Si wafer
Function generator
16

(a)
Fig. 2. Kashihara et al.
(b)
(c)
(d)
(a)(a)
(b)(b)
(c)(c)
(d)(d)
17

Fig. 3. Kashihara et al.
100 101 102 103 104 1050
200
400
600
800
1000
Continuous wave
Sine-wave modulation Pulse-wave modulationSc
atte
red
inte
nsity
[a.u
.]
Modulation frequency, f [Hz]
18

Fig. 4. Kashihara et al.
100 101 102 103 104 1050.0
0.5
1.0
1.5
Continuous wave
Sine-wave modulation Pulse-wave modulation
Aver
age
parti
cle
size
[μm
]
Modulation Frequency, f [Hz]
19
5 μm5 μm5 μm5 μm
5 μm5 μm5 μm5 μm
5 μm5 μm5 μm5 μm
Fig. 5. Kashihara et al.
20

Fig. 6. Kashihara et al.
100 101 102 103 104 1050
10000
20000
30000
40000
50000
Sine-wave modulation Pulse-wave modulation
Continuous wave
Par
ticle
num
ber [
-]
Modulation frequency, f [Hz]
21
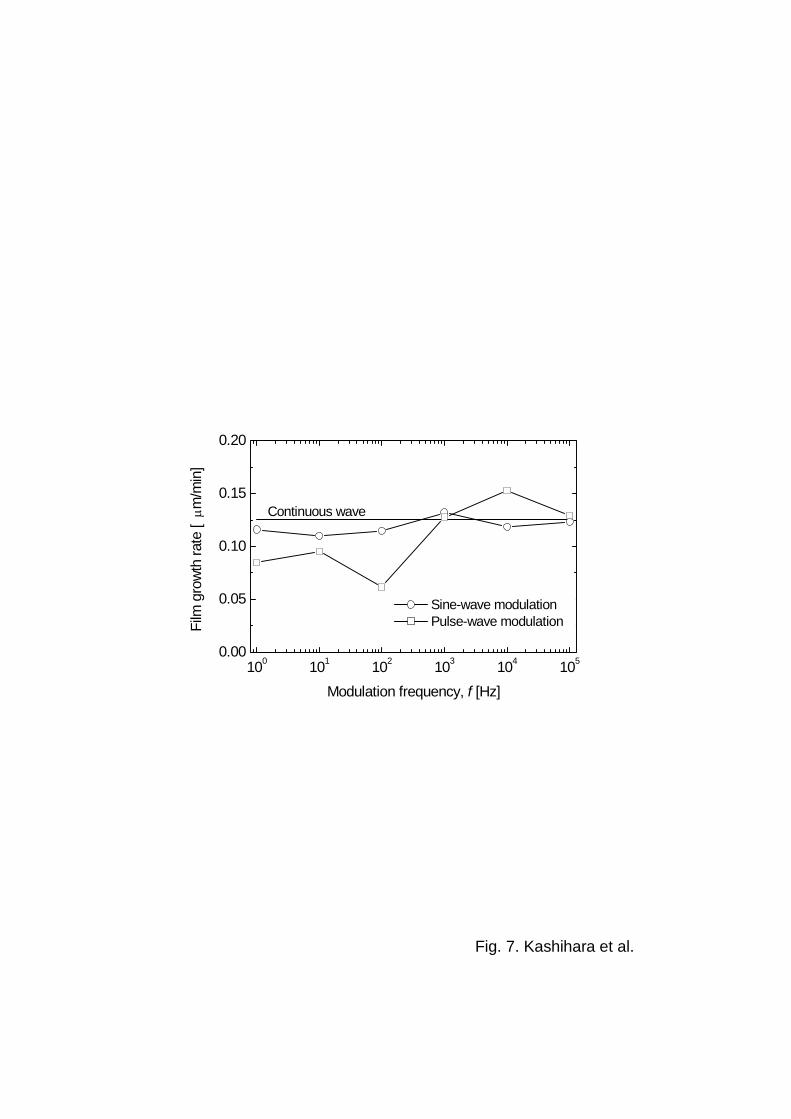
Fig. 7. Kashihara et al.
100 101 102 103 104 1050.00
0.05
0.10
0.15
0.20
Continuous wave
Sine-wave modulation Pulse-wave modulationFi
lm g
row
th ra
te [
μm/m
in]
Modulation frequency, f [Hz]
22
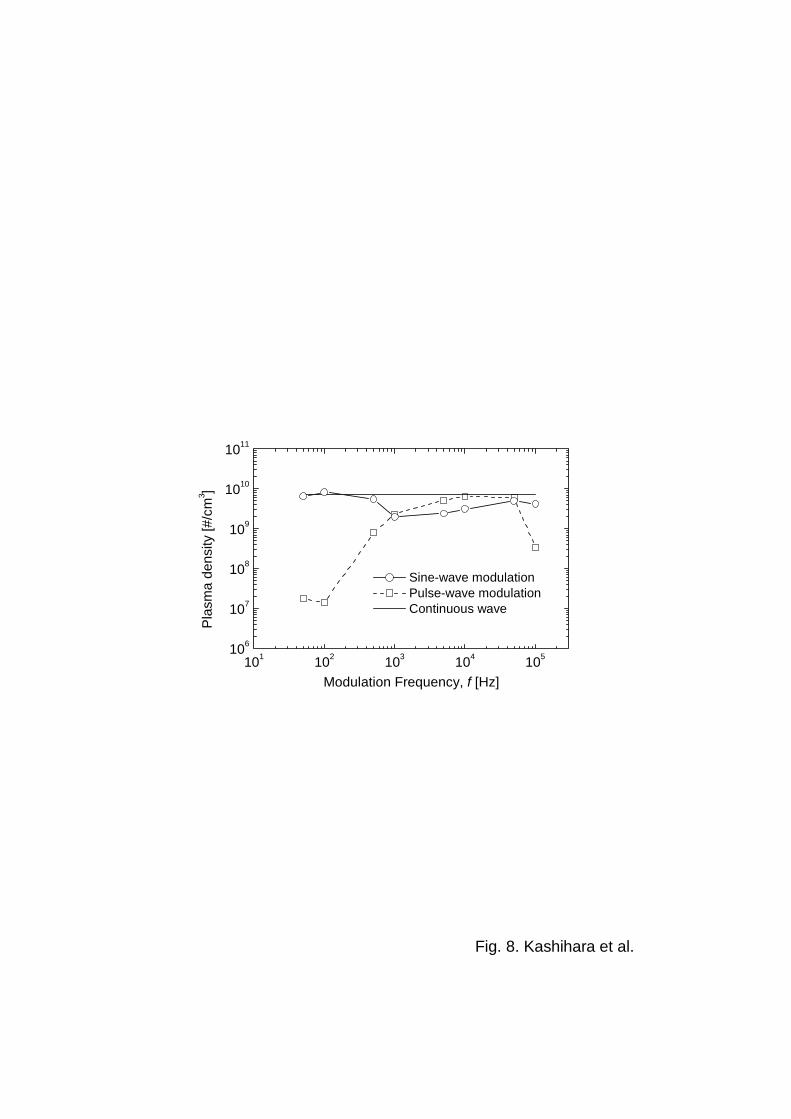
Fig. 8. Kashihara et al.
101 102 103 104 105106
107
108
109
1010
1011
Sine-wave modulation Pulse-wave modulation Continuous wave
Pla
sma
dens
ity [#
/cm
3 ]
Modulation Frequency, f [Hz]
23

2μm
2μm
2μm
(a)
(b)
(c)
Fig. 9. Kashihara et al.
24

![In situ characterization of small-particle plasma sprayed ...authors.library.caltech.edu/49386/1/art%3A10.1361%2F105996302770348970.pdfSmall-particle plasma spray (SPPS)[6] is a modified](https://static.fdocuments.us/doc/165x107/60e62131a9532871447d4722/in-situ-characterization-of-small-particle-plasma-sprayed-3a1013612f105996302770348970pdf.jpg)


