Supporting Self-Reflection in Everyday Life Self-Reflection in Everyday Life An exploratory review...
89
Supporting Self-Reflection in Everyday Life An exploratory review of physiological input methods for the Affective Health system Pedro Sanches Department of Computer and Systems Sciences Stockholm University / Royal Institute of Technology This thesis corresponds to 20 weeks of full-time work .
Transcript of Supporting Self-Reflection in Everyday Life Self-Reflection in Everyday Life An exploratory review...

Supporting Self-Reflection inEveryday Life
An exploratory review of physiological inputmethods for the Affective Health system
Pedro Sanches
Department of Computer and Systems SciencesStockholm University / Royal Institute of Technology
This thesis corresponds to 20 weeks of full-time work .

IV
Summary. Today’s fast-paced modern life motivates a need for tools and devices that supportpeople in dealing with stress by helping them to control their daily behaviours. There is a vari-ety of emerging applications that track physiological data from the body associated with stressover periods of time by using biosensors. However, most of them remain purely monitoringdevices made to diagnose or warn users when they become sressed. We are projecting Affec-tive Health, a mobile system designed to enable users to make a connection between the datafrom their body and their own subjective memories and experience, over the course of dailyactivities. To facilitate this connection, we propose a representation of the physiological datamapped on three common sense concepts: physical activity, arousal and adaptability. Whilethe first two were previously tested in a similar system developed by the research group,adaptability, which represents the ability of the body to cope and recover from stress, had yetto be mapped to consistent physiological input in order to have meaning both in terms of itsrelation to stress and to end-users.
The intended continuous usage of the system poses challenges in how the physiologicaldata from the body is to be collected. There is a wide range of physiological sensors varying indetection accuracy and degree of discomfort that people are willing to stand. Novel wearablesensor technologies minimize the discomfort by compromising the validity of the measureddata.
This thesis contributes an exploratory review of sensors and characteristics of physio-logical data suited to be measured during the course of everyday life. It is also shown asa proof-of-concept that both arousal and physical activity can be measured consistently insuch unconstrained setting but adaptability can only be estimated by assessing sleep quality.Besides supporting sensor input in Affective Health, these results provide insights and best-practices when sensing signals from the body in real-time.

Acknowledgments
I would like to express my gratitude to all the people in SICS and Mobile Life thatin so many different ways have made this research project possible. Special thanksgoes to my supervisor Kristina Hook, for being such an inspiration and for having anincredible ability to motivate when most needed, Markus Bylund, for never failingwith a helping hand, and Ana Paiva, because without her this experience in Swedenwould have never happened.
I extend my gratitude to all of those who have read and commented on my drafts.Without your contribution this thesis would have not been the same.
Thank you all of my friends (in Sweden, in Portugal and all around the world)who made the good times better and helped through the less good times. Specially,I would like to thank Pedro Ferreira not only because of all the work he put into thisthesis but also because life in Sweden would simply not be the same without him.
And to Alessandra Torregiani, a very special thanks for always being there, forbeing extremely supportive and keeping me sane specially through the last times. Itwould have been impossible without you.
Finally, I want to thank my family whose warmth made the long distance easierto bare and for always pushing me forward. Obrigado!


Contents
1 Introduction . . . . . . . . . . . . . . . . . . . . . . . . . . . . . . . . . . . . . . . . . . . . . . . . . . . . . 11.1 Background . . . . . . . . . . . . . . . . . . . . . . . . . . . . . . . . . . . . . . . . . . . . . . . . . . 11.2 Problem . . . . . . . . . . . . . . . . . . . . . . . . . . . . . . . . . . . . . . . . . . . . . . . . . . . . . 31.3 Contributions of this thesis . . . . . . . . . . . . . . . . . . . . . . . . . . . . . . . . . . . . . 31.4 Method . . . . . . . . . . . . . . . . . . . . . . . . . . . . . . . . . . . . . . . . . . . . . . . . . . . . . 41.5 Limitations . . . . . . . . . . . . . . . . . . . . . . . . . . . . . . . . . . . . . . . . . . . . . . . . . . 41.6 Outline . . . . . . . . . . . . . . . . . . . . . . . . . . . . . . . . . . . . . . . . . . . . . . . . . . . . . 5
2 Background . . . . . . . . . . . . . . . . . . . . . . . . . . . . . . . . . . . . . . . . . . . . . . . . . . . . . 72.1 Stress . . . . . . . . . . . . . . . . . . . . . . . . . . . . . . . . . . . . . . . . . . . . . . . . . . . . . . . 7
2.1.1 Body autonomic regulation . . . . . . . . . . . . . . . . . . . . . . . . . . . . . . 82.1.2 Allostasis and stress response . . . . . . . . . . . . . . . . . . . . . . . . . . . . 102.1.3 Long-term consequences . . . . . . . . . . . . . . . . . . . . . . . . . . . . . . . . 132.1.4 Stress management . . . . . . . . . . . . . . . . . . . . . . . . . . . . . . . . . . . . . 14
2.2 Biomedical sensors . . . . . . . . . . . . . . . . . . . . . . . . . . . . . . . . . . . . . . . . . . . 162.2.1 Microsensors . . . . . . . . . . . . . . . . . . . . . . . . . . . . . . . . . . . . . . . . . . . 162.2.2 Wearable sensors . . . . . . . . . . . . . . . . . . . . . . . . . . . . . . . . . . . . . . . 17
3 Affective Health . . . . . . . . . . . . . . . . . . . . . . . . . . . . . . . . . . . . . . . . . . . . . . . . . . 213.1 Evaluating emotion in Affective Interaction . . . . . . . . . . . . . . . . . . . . . . 213.2 Inspirational systems . . . . . . . . . . . . . . . . . . . . . . . . . . . . . . . . . . . . . . . . . . 23
3.2.1 Affective Diary . . . . . . . . . . . . . . . . . . . . . . . . . . . . . . . . . . . . . . . . . 233.2.2 Home Health Horoscope . . . . . . . . . . . . . . . . . . . . . . . . . . . . . . . . 243.2.3 Exmocare Watch . . . . . . . . . . . . . . . . . . . . . . . . . . . . . . . . . . . . . . . 243.2.4 SenseChair . . . . . . . . . . . . . . . . . . . . . . . . . . . . . . . . . . . . . . . . . . . . 253.2.5 Breakaway sculpture . . . . . . . . . . . . . . . . . . . . . . . . . . . . . . . . . . . . 26
3.3 Design Qualities . . . . . . . . . . . . . . . . . . . . . . . . . . . . . . . . . . . . . . . . . . . . . . 263.4 Requirements on the physiological input methods . . . . . . . . . . . . . . . . . 28

VIII Contents
4 Mapping the Concepts . . . . . . . . . . . . . . . . . . . . . . . . . . . . . . . . . . . . . . . . . . . . 314.1 Physical Activity . . . . . . . . . . . . . . . . . . . . . . . . . . . . . . . . . . . . . . . . . . . . . . 32
4.1.1 Relative Movement . . . . . . . . . . . . . . . . . . . . . . . . . . . . . . . . . . . . . 324.1.2 Steps . . . . . . . . . . . . . . . . . . . . . . . . . . . . . . . . . . . . . . . . . . . . . . . . . 344.1.3 Evaluation . . . . . . . . . . . . . . . . . . . . . . . . . . . . . . . . . . . . . . . . . . . . . 35
4.2 Arousal . . . . . . . . . . . . . . . . . . . . . . . . . . . . . . . . . . . . . . . . . . . . . . . . . . . . . 364.2.1 Electrodermal Activity . . . . . . . . . . . . . . . . . . . . . . . . . . . . . . . . . . . 374.2.2 Cardiovascular response . . . . . . . . . . . . . . . . . . . . . . . . . . . . . . . . . 394.2.3 Evaluation . . . . . . . . . . . . . . . . . . . . . . . . . . . . . . . . . . . . . . . . . . . . . 52
4.3 Adaptability . . . . . . . . . . . . . . . . . . . . . . . . . . . . . . . . . . . . . . . . . . . . . . . . . 544.3.1 Cardiovascular markers . . . . . . . . . . . . . . . . . . . . . . . . . . . . . . . . . 564.3.2 Sleep . . . . . . . . . . . . . . . . . . . . . . . . . . . . . . . . . . . . . . . . . . . . . . . . . 604.3.3 Evaluation . . . . . . . . . . . . . . . . . . . . . . . . . . . . . . . . . . . . . . . . . . . . . 62
5 Results . . . . . . . . . . . . . . . . . . . . . . . . . . . . . . . . . . . . . . . . . . . . . . . . . . . . . . . . . . 65
6 Discussion . . . . . . . . . . . . . . . . . . . . . . . . . . . . . . . . . . . . . . . . . . . . . . . . . . . . . . . 69
References . . . . . . . . . . . . . . . . . . . . . . . . . . . . . . . . . . . . . . . . . . . . . . . . . . . . . . . . . . 71

List of Figures
2.1 Scheme of the Sympathetic and parasympathetic systems . . . . . . . . . . . 92.2 Scheme of the HPA axis . . . . . . . . . . . . . . . . . . . . . . . . . . . . . . . . . . . . . . . . 102.3 Example of a stress response . . . . . . . . . . . . . . . . . . . . . . . . . . . . . . . . . . . . 112.4 Factors of allostatic load . . . . . . . . . . . . . . . . . . . . . . . . . . . . . . . . . . . . . . . . 112.5 Physiological stress responses leading to allostatic load . . . . . . . . . . . . . 122.6 Early prototype of a PPG ring . . . . . . . . . . . . . . . . . . . . . . . . . . . . . . . . . . . 172.7 Absortion of light by a PPG sensor. The AC part of the signal gives
information about the heartbeat . . . . . . . . . . . . . . . . . . . . . . . . . . . . . . . . . 182.8 Georgia Tech Wearable Motherboard . . . . . . . . . . . . . . . . . . . . . . . . . . . . . 192.9 Example of places in the body used to capture signals from wearable
sensors . . . . . . . . . . . . . . . . . . . . . . . . . . . . . . . . . . . . . . . . . . . . . . . . . . . . . . . 19
3.1 Interface of the Affective Diary . . . . . . . . . . . . . . . . . . . . . . . . . . . . . . . . . . 233.2 Scheme of the Home Health Horoscope . . . . . . . . . . . . . . . . . . . . . . . . . . . 243.3 Exmocare watch . . . . . . . . . . . . . . . . . . . . . . . . . . . . . . . . . . . . . . . . . . . . . . . 253.4 Sense Chair . . . . . . . . . . . . . . . . . . . . . . . . . . . . . . . . . . . . . . . . . . . . . . . . . . . 253.5 Breakaway sculpture shown in different positions. . . . . . . . . . . . . . . . . . 263.6 Russell’s model of emotion . . . . . . . . . . . . . . . . . . . . . . . . . . . . . . . . . . . . . . 27
4.1 Output of an accelerometer . . . . . . . . . . . . . . . . . . . . . . . . . . . . . . . . . . . . . 334.2 Actigraph, an example of an accelerometer . . . . . . . . . . . . . . . . . . . . . . . . 344.3 Pedometer and usage of pedometer on the waist . . . . . . . . . . . . . . . . . . . 354.4 Sensor requirement compliance in Physical Activity input methods . . . 364.5 Skin conductivity response . . . . . . . . . . . . . . . . . . . . . . . . . . . . . . . . . . . . . . 384.6 Habituation in skin conductivity response . . . . . . . . . . . . . . . . . . . . . . . . . 394.7 Example of skin conductivity sensors in the hand and in the foot . . . . . 404.8 Possible usage of PPG and Holter monitors and output of both sensors 414.9 Systolic and diastolic blood pressure . . . . . . . . . . . . . . . . . . . . . . . . . . . . . 424.10 Demonstration of the tonometric method to assess blood pressure . . . . 42

X List of Figures
4.11 Wearable sensor for measuring blood pressure . . . . . . . . . . . . . . . . . . . . . 434.12 Portapres, a device for measuring blood pressure . . . . . . . . . . . . . . . . . . 444.13 Training Zones for exercise . . . . . . . . . . . . . . . . . . . . . . . . . . . . . . . . . . . . . 464.14 Heart rate variability shown as the variation of the interval between
two heartbeats . . . . . . . . . . . . . . . . . . . . . . . . . . . . . . . . . . . . . . . . . . . . . . . . 474.15 Power spectral density distribution of HRV . . . . . . . . . . . . . . . . . . . . . . . . 504.16 Sensor requirement compliance in Arousal cardiovascular input
methods . . . . . . . . . . . . . . . . . . . . . . . . . . . . . . . . . . . . . . . . . . . . . . . . . . . . . 534.17 Heart rate correlation with skin conductivity . . . . . . . . . . . . . . . . . . . . . . 534.18 Sensor requirement compliance in heart rate and electrodermal
activity to measure Arousal . . . . . . . . . . . . . . . . . . . . . . . . . . . . . . . . . . . . . 544.19 Some figure . . . . . . . . . . . . . . . . . . . . . . . . . . . . . . . . . . . . . . . . . . . . . . . . . . 554.20 Changes in heart rate and rMSSD during the course of three days for
a high stressed group and a group of controls . . . . . . . . . . . . . . . . . . . . . 594.21 Relationship between stress with sleep related problems in Sweden . . 604.22 Graph of physical activity during a 24 hour period . . . . . . . . . . . . . . . . . 61
5.1 Scheme of a proposed wrist sensor . . . . . . . . . . . . . . . . . . . . . . . . . . . . . . . 66

! 1
Introduction
This thesis is part of a project at the Swedish Institute of Computer Science (SICS)called Affective Health. This project aims to build on a previous project named Af-fective Diary (Lindstrom et al. 2006), that produced a ’digital diary where users canscribble their notes as in a conventional paper-based diary, but where we also recordbodily memorabilia [. . . ] from body sensor data’. From the Affective Diary project,we learnt that it is possible for users to identify with and be influenced by the phys-iological readings 1 collected from the sensors. Affective Health has the objective ofproducing a similar system, but with real-time feedback and possibility of scrollingback to past events. The intent of Affective Health is to promote an increased focuson health, helping users to prevent stress and stress related disorders.
1.1 Background
Stress is a natural reaction of the body to changes in the environment. It preparesus to deal with the change, activating all the available resources to confront it andadapt. In itself, it does not carry any negative value as it as helped our ancestorsto survive until now, escaping wild animals or hunting for food. The most primitvestress reaction occuring in our bodies is called “fight or flight”, when we have tochoose between facing a danger or running away from it. Changes in environment,however, for people living in the modern society, occur on a more psychological leveland the causes of stress (called stressors) can nowadays be events such as tight workschedules, being stuck in the traffic or marital disagreements. Exposure to thesestressors is typically longer than in a simple “fight or flight” situation, giving rise tobody reactions that are characterized by lack of adaptation and tension release.
When the stress response lasts for a long period and people are unable to adaptto the requirements of the new environment, the human body starts to be damaged,1 Physiological readings are input “relating to the science of the functions of living organism”
(CancerWEB 1997). They can be readings from any organ in the human body (e.g. heart-beat, body temperature, etc.)

2 1 Introduction
compromising its ability to fight diseases, thus generating medical conditions likedepression, anxiety, infertility, ulcers, heart problems and diabetes, among others(e.g. Seeman et al. 1997).
The influence of stress on wellbeing is now widely accepted and has became apublic health concern (Cox 1993). Many companies have developed programmes orhired help to educate their employees in stress management (LGE 2007). Activitieslike yoga and meditation are increasingly common and people start to feel that theyneed to find tools and strategies to handle stress in order to live a good life.
Until not so long ago, the computer research community was practically obliv-ious to all this and only recently we start to see a growing interest in creatingtechnologies and applications that can help people deal with this problem in theirlives. Biomedical Computing is now a big field and produced a wide range of smallbiomedical sensors capable of capturing and processing accurately body signals withlittle human supervision. This enables the use of them not only in hospitals butalso in everyday life. Following this, a great number of home-based monitoring sys-tems for hospital patients were developed and are already being put to use (e.g.Exmocare 2007, Kiwok 2008). These systems often focus on presenting the patient’sbiodata in a raw or unprocessed format for further analysis by a doctor or an expert,thus limiting its use to professional contexts.
Affective Computing (Picard 1997) is a field withing Computer Science whichfocus on computing related with emotions and affective states. Affective Interac-tion is an emergent field of study that is similar to Affective Computing but with afundamental difference in goal (Sundstrom et al. 2005): instead of inferring user’saffective states and build computational models of emotion, Affective Interactiondevelops applications in which the user can feel emotionally involved by provid-ing mechanisms for communication of affective states. Affective Diary (Lindstromet al. 2006) was a research project conducted in this field. It records body signalsand present them to the user mapped in two easy to understand concepts: PhysicalActivity and Arousal. The idea is that end users should easily understand and relateto these accounts of their everyday bodily activities, inviting to introspection.
Following the steps and the success of Affective Diary, Affective Health will try toovercome the limitations of the current commercially avaliable health monitoringdevices for independent use by non-expert users. In order to achieve this, the rawinformation from the body signals must be processed and presented in a meaningfulway. Adding to Physical Activity and Arousal, the new system might also map a newconcept, Adaptability. This concept, described in detail later on this thesis, can nowbe briefly defined as: ‘How well the body adapts to changes in the environment’.It is the belief of this project that this three concepts together, with careful design,can provide a record of events that will help users reflect on their lives and therebyreducing stress.
1.3 Contributions of this thesis 3
1.2 Problem
This thesis will aim to give an answer to three questions. The first one is concernedwith the new high-level concept that we wish to represent in Affective Health: Adapt-ability. It is not clear if this concept can be mapped by body signals, so the firstquestion is:
‘Which physiological signals are related to Adaptability and how can the mappingbe done?’
To extract meaning from the complexity of body signals, it is necessary to pro-cess them after acquirement, identifying the parts of the signal or the changes thatcontain meaning. These parts are defined as features. The present thesis will addressthese problems focusing on the goals of Affective Health, so the second question is:
‘Which features in biodata capture the meaning of Physical Activity, Arousal andAdaptability?’
Following this problem, another practical problem arises. The previous project,Affective Diary, used biosensors to extract the concepts of Physical Activity andArousal. The results were very satisfactory but some of the limitations found in thisproject can be tracked down to an unadvised choice of sensors and use of not vali-dated methods for biodata acquisition. So the third question that will be addressedin this thesis is:
‘Which methods of physiological input are reliable and give high quality biodata?’
1.3 Contributions of this thesis
In this thesis, we will explore the current feasibility of mapping Physical Activity,Arousal and Adaptability to biodata, from a technical point of view. The aim is tomap these three concepts to a robust and reliable sensor input in an everyday lifesetting to provide Affective Health and future similar applications within AffectiveInteraction field with a good base for decisions.
The main contribution of this thesis is a supervised review of the state-of-the-artin sensors and extraction methods in physiological data. A configuration of biosen-sors and features capable of mapping Physical Activity, Arousal and Adaptability willbe proposed. These results will be used directly to support decisions in the AffectiveHealth project and also in future projects that make use of biosensors, either by jus-tifying sensor acquirement or by providing inspiration for building new biosensors.

4 1 Introduction
1.4 Method
Affective Health is a project being developed in two parallel threads: interface de-sign and sensor implementation. These threads have as a common starting pointthe three concepts. While the interface design starts from the concepts and tries torepresent them to the user, the sensor implementation will provide a sensor layerthat captures physiological input from the user and maps it to the concepts, for laterrepresentation.
This thesis is the result of one of the first steps in the sensor implementation. Toexplore the technical constraints of capturing biodata and the feasability of mappingit to the concepts, a literature survey was conducted under the supervision of Profes-sor Kristina Hook and Markus Bylund at SICS. Current practices on biodata analysiswere analysed and discussed, as well as the current state-of-the-art in biomedicalsensors.
During this exploratory review, we had expert advice from the medical doctorsYrsa Sverrisdottir from Sahlgren University Hospital and Inga Jonsdottir and GunnarAhlborg, from Institute of Stress Medicine, in Goteborg. This advice was taken underthe form of two separate visits to both the hospital and the Institute, as well as emailconsultation.
1.5 Limitations
The review and guidelines presented by this thesis can be used theoretically for anyapplication that intends to make use of biomedical sensors. However, this work wasundertaken to satisfy the requirements of Affective Health: the need to representPhysical Activity, Arousal and Adaptability under specific design conditions. So theresults and reflections presented here should be valid in this scope. We believe thatthis concepts are wide enough not to hinder the scientific usefulness of this work inother contexts as well.

1.6 Outline 5
1.6 Outline
On Chapter 2, we provide a background on stress and current practices on stressmanagement as well a general overview of biosensors. The Affective Health projectand its design requirements are on Chapter 3, concluding with a list of requirementsfor the physiological input methods. Chapter 4 discusses the three concepts that weaim to represent in the Affective Health system. We define of these concepts andreview the current biosensors and methods for input. Chapters 5 and 6 present theResults and Discussion.

! 2
Background
Before attempting to design a stress management support system, it is importantto understand what stress really is about. This Chapter will provide background onstress, a brief medical explanation and its long-term negative effects on our physi-cal health. Also, current statistics on stress in European countries as well as stressmanagement and reduction methods will be presented.
The Chapter will conclude with a short review on technical aspects and uses ofbiosensors, important for the understanding of the following chapters.
2.1 Stress
The first study on stress is attributed to Selye (1936). In this study he describesseveral laboratory experiments in which he exposes rats to diverse ”noxious agents”such as cold, surgical injury, spinal shocks, muscular exercise or intoxication withsub lethal drug doses. From this study he concluded that the rats would typicallygo through three behavior phases: alarm, adaptation and exhaustion. After the ini-tial alarm and body response (which involved severe transformations) several ratswould first adapt to the stressor, entering the second phase. As a consequence ofa period of time of continuous exposition to the stressor, depending on its sever-ity, their body would succumb and suffer effects equivalent to the first alarm stage,conducting ultimately to death. This interpretation model of stress, based on theresponse of the organism to the strain, or stressor, was coined General AdaptationSyndrome.
Another model of stress was the one developed later by Folkman et al. (1986)which identifies two processes: cognitive appraisal and coping. When faced with apossibly hazardous encounter with the environment, the person will go through theprocess of cognitive appraisal, evaluating the possible outcome of this encounter.Coping is defined here as the process of dealing with stress, in which the person
8 2 Background
changes the environment or her own internal expectations in order for these tomatch, or for the environment to exceed her expectations.
A recent relevant framework for studying stress is the Demand-Control-Supportmodel (Karasek & Theorell 1990). This model, created with a focus on work-relatedstress, examines the relationship between the individual and the environment, fromthe point of view of the individual. Karasek & Theorell propose three factors to definethe perception of the work environment: demand, control and support. Demand isthe amount of workload placed on the person. Control refers to autonomy; if theindividual is able to decide how to complete the work tasks. Support is definedas the amount of assistance that the worker gets from the manager or supervisor.Although the present thesis is not directly concerned with work-related stress, thismodel is important because it has dominated research in effects of long-term stressin the last years (SALTSA 2006). Individuals with high demand, low control and lowsupport usually experience prolonged periods of stress (Karasek & Theorell 1990).
Having low social support outside of the work setting is also associated withincreased stress and disease outcome. Individuals with low socio-economical statusare more prone to psychiatric diseases deriving from long-term exposure to stress(Rose 1994).
A stress experience can be measured using three methods: evaluating the stimuli;evaluating the subjective cognitive response (by asking the subject how he feels) orevaluating the physiological bodily responses. The first method can obviously onlybe applied with humans and can potentially be deceiving because it does not takeinto account the capabilities of the subject to deal with the stressor. The secondmeasurement method can be very subjective (Ursin & Eriksen 2004). Both are hardto measure in real-time.
In order to understand the third method, the physiological response to stress, itis important to take a look first on how the body is internally regulated.
2.1.1 Body autonomic regulation
The internal enviroment of the body is regulated by two control systems: neuronaland hormonal (Janig 2003).
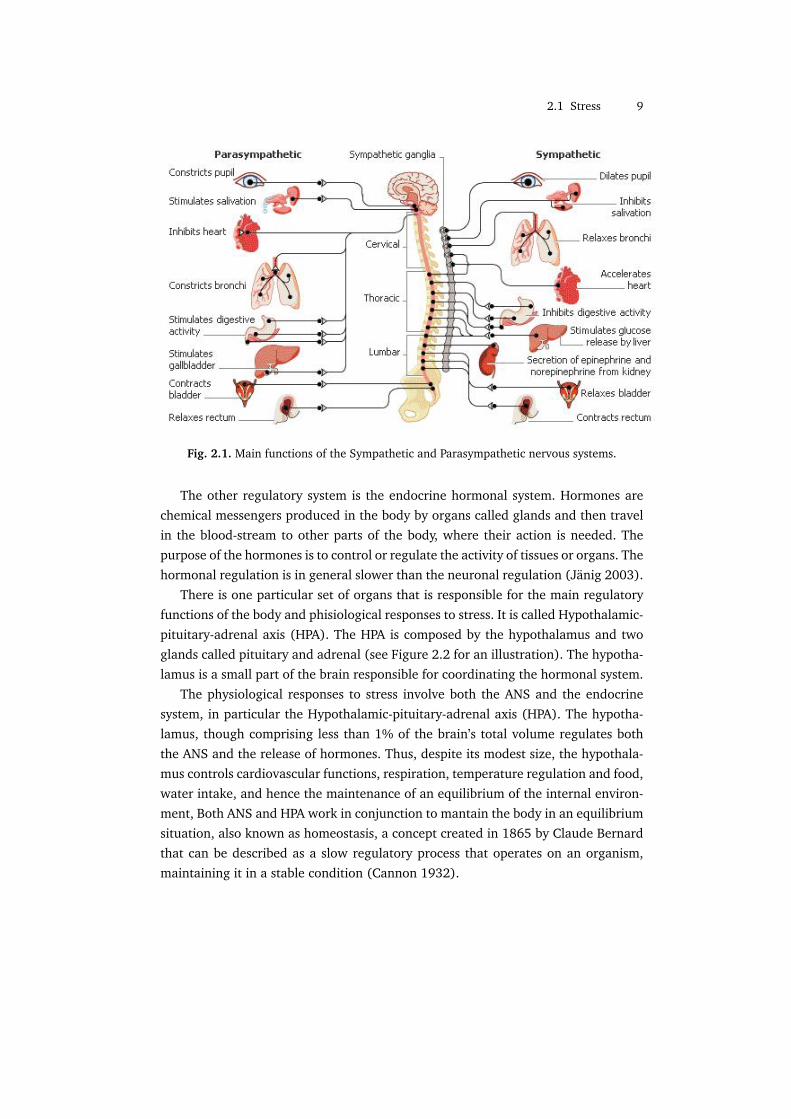
The neuronal regulation acts rapidly and is mediated by the Autonomic NervousSystem (ANS). ANS is a part of the nervous system composed by a complex net ofnerves that are distributed all over the body and control directly the function of mosttissues and organs. The ANS is mostly responsible for involuntary and non-consciousfunctions like regulating the heart rate, blood pressure, respiration. sweating, move-ment of the bowel, etc. There are two branches of the ANS, illustrated on the Figure2.1: the Sympathetic and Parasympathetic nervous systems. The Sympathetic systemmobilizes energy and resources from the body in situations of arousal whereas theParasympathetic system is primarily used in situations of rest.
2.1 Stress 9
Fig. 2.1. Main functions of the Sympathetic and Parasympathetic nervous systems.
The other regulatory system is the endocrine hormonal system. Hormones arechemical messengers produced in the body by organs called glands and then travelin the blood-stream to other parts of the body, where their action is needed. Thepurpose of the hormones is to control or regulate the activity of tissues or organs. Thehormonal regulation is in general slower than the neuronal regulation (Janig 2003).
There is one particular set of organs that is responsible for the main regulatoryfunctions of the body and phisiological responses to stress. It is called Hypothalamic-pituitary-adrenal axis (HPA). The HPA is composed by the hypothalamus and twoglands called pituitary and adrenal (see Figure 2.2 for an illustration). The hypotha-lamus is a small part of the brain responsible for coordinating the hormonal system.
The physiological responses to stress involve both the ANS and the endocrinesystem, in particular the Hypothalamic-pituitary-adrenal axis (HPA). The hypotha-lamus, though comprising less than 1% of the brain’s total volume regulates boththe ANS and the release of hormones. Thus, despite its modest size, the hypothala-mus controls cardiovascular functions, respiration, temperature regulation and food,water intake, and hence the maintenance of an equilibrium of the internal environ-ment, Both ANS and HPA work in conjunction to mantain the body in an equilibriumsituation, also known as homeostasis, a concept created in 1865 by Claude Bernardthat can be described as a slow regulatory process that operates on an organism,maintaining it in a stable condition (Cannon 1932).

10 2 Background
Fig. 2.2. Scheme of the HPA axis. Adapted from (Adinoff et al. 1998)
2.1.2 Allostasis and stress response
Following the development of different theories on stress, a new concept appeared,defined by Sterling & Eyer (1988) as allostasis. It is similar to homeostasis, definedin the previous section, but it works faster. It responds to fast changes in the envi-ronment, such as exposure to a pathogenic (e.g. virus or bacteria), or a prolonged“fight or flight” reaction.
Every time there is a stress response, the organism enters a state of arousaland each internal system responds to adapt to the change. This response starts inthe brain, with the activation of the Sympathetic system and deactivation of theParasympathetic system from the ANS occurring in paralel with a release of hor-mones in the HPA.
There are nerve endings and receptors for the hormones in cells and tissues allover the body so,immediately, the immune defences are strengthened, the heart rateis increased, skin conductivity rises or the pupil diameter widens, among others(Cannon 1914).
As an example, let us imagine a man walking in a forest. He is in a healthycondition and the process of homeostasis is occuring at every second, with his bodymaintaining a constant internal temperature by sweating and keeping the amountof sugar in the blood in equilibrium. At a certain instant, he spots a snake lyingin the middle of the road. His body reacts instantaneously and enters a “fight orflight” state, with all the changes described in the previous paragraph preparinghim to react quickly. He can choose to fight the snake or turn around and chooseanother way. Either one has the potential to solve the conflict but let us say thathe chooses to avoid the snake. As soon as the environmnet is considered safe, the

2.1 Stress 11
allostatic process stops and the body enters in a state of recovery, as exemplified bythe Figure 2.3. After this state, the body in a healthy condition should resume thenormal functioning and the homeostasis processes continue as before.
Fig. 2.3. Example of a stress response. Adapted from (McEwen 1998)
This response has short-term benefits as it adapts the organism to the environ-ment. However, it does not come without long-term consequences. Either becauseof inefficient responses or repeated exposure to stressors, allostasis has a long-termeffect on the body called allostatic load (see Figure2.4).
Fig. 2.4. Allostatic load comes from allostasis and is affected by a number of factors likeindividual differences, behaviour and past experiences. Extracted from (McEwen 1998)
McEwen & Wingfield (2003) define two types of allostatic load:
Type 1 allostatic overload occurs when energy demand exceeds supply, resulting inactivation of the emergency life history stage. This serves to direct the animal awayfrom normal life history stages into a survival mode that decreases allostatic load andregains positive energy balance. The normal life cycle can be resumed when the pertur-bation passes. Type 2 allostatic overload begins when there is sufficient or even excessenergy consumption accompanied by social conflict and other types of social dysfunc-
12 2 Background
tion. The latter is the case in human society and certain situations affecting animalsin captivity. (. . . ) If allostatic load is chronically high, then pathologies develop. Type2 allostatic overload does not trigger an escape response, and can only be counteractedthrough learning and changes in the social structure.
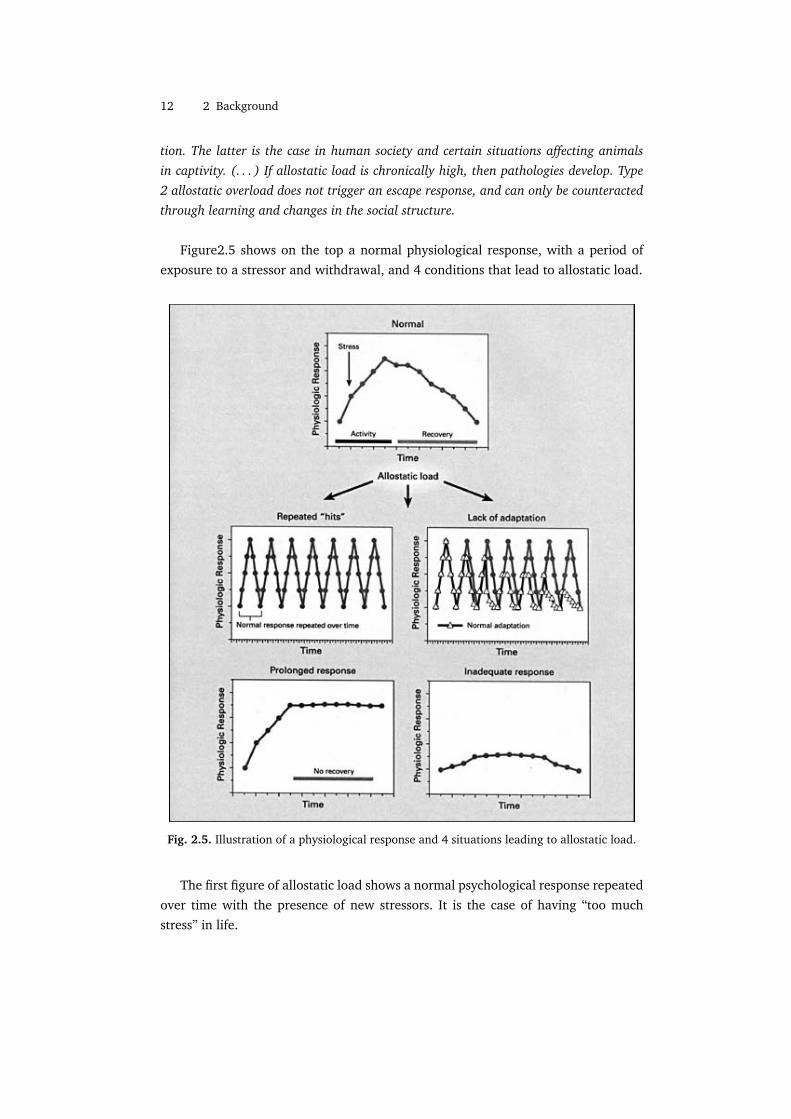
Figure2.5 shows on the top a normal physiological response, with a period ofexposure to a stressor and withdrawal, and 4 conditions that lead to allostatic load.
Fig. 2.5. Illustration of a physiological response and 4 situations leading to allostatic load.
The first figure of allostatic load shows a normal psychological response repeatedover time with the presence of new stressors. It is the case of having “too muchstress” in life.

2.1 Stress 13
In the second figure only one stressor is present repeatedly. The graph with tri-angles denotes a normal response in this case, occurring an habituation of the bodyand subsequent decrease on the response. The dotted line represents an abnormalresponse, similar to the one in the first figure, where the body does not adapt to thesame stressor and has always the same response. An example of this case is the fearof traveling by plane; some people have strong stress responses on the first time andthen adapt, causing less intense responses on the latter times. For other people, thefear remains the same, no matter how many times they are exposed to the stressor.For the latter, the cost of allostatic load is higher.
On the bottom left, on the third figure, a prolonged response is shown with norecovery after withdrawal of the stressor. Finally, the figure on the bottom rightshows a dampened physiological response during exposition to a stressor. This at-tenuated response allows other systems to take compensatory actions and becomehyperactive, usually with the cost of allostatic load.
The cumulative damage of allostatic load during our lives can lead to long-termconsequences.
2.1.3 Long-term consequences
Various studies point to the fact that allostatic load can lead to permanent changesin immunological, cardiovascular and neuronal systems. Stress has been associatedwith infections and inflammations, cardiovascular, pulmonary, dermatological andimmunitary diseases, atherosclerosis, infertility, diabetes, obesity, psychiatric condi-tions and progression to cancer (e.g. Seeman et al. 1997, McEwen 1998, McEwen &Wingfield 2003, Kaplan et al. 1991, Yun & Doux 2007) Stress leads also to unealthybehaviours (Everly & Lating 2002) such as smoking and/or low physical activity,which can independently weaken the body and accelerate progress towards diseases(Barengo et al. 2004, Lucini et al. 2005).
Increased cardiovascular risk seems to be related with overactivity of the Sympa-thetic nervous system (Julius 1993), due to frequent activation in stress responses. Ithas been shown that stress impairs the homeostatic regulations of the body, particu-larly the cardiovascular regulation (Mezzacappa et al. 2001, Lucini et al. 2005). Thereduced autonomic regulation of the heart makes it more vulnerable to acute stress(i.e. stress happening during short periods of time), where short term rises in heartrate and blood pressure can cause arrythmia and sudden death (Lucini et al. 2005).
The long-term effects of stress were also associated with premature aging, as re-ported in a pioneer study by Epel et al. (2004). This study was conducted with agroup of women who were caring for a child suffering chronic illnesses for severalyears. Self-reports from these women put them in a high stress category. Epel et al.found that the high stress group of women had suffered changes in the DNA level

14 2 Background
that prevent cells to multiply and regenerate the body, compared to a control group.These changes are characteristic of aging. The same result was also found by Dam-janovic et al. (2007) with highly stressed caregivers of Alzheimer patients. Theseresults point to the fact that long term stress accelerates aging, leaving the body in anaturaly vulnerable state. However, further research is needed in order to determineexactly in which systems of the body does premature aging occurs.
2.1.4 Stress management
The impact of stress, especially work related stress, in everyday life has become a ma-jor interest of researchers, companies and governments in the last years. Accordingto SCB (2005) and Marklund et al. (2004), stress related disorders in Sweden haveincreased substantially since the middle nineties as well as long-term sick leaves.In 2005, 24,4% of the Swedish workers suffered from work-related disorders, withstress and mental strain as one of the most important causes for both men andwomen (SCB 2005). Table 2.1 illustrates the growth of days lost at work from car-diovascular diseases and unspecified mental disorders as consequence of stress inthe middle 80s up to the 90s, in United Kingdom.
Work days lost (million) Mental Disorder Diseases of the Cardiovascular SystemYEAR Men Women Men Women
1985/86 35.6 20.1 67.6 8.11986/87 37.2 20.3 68.0 8.41987/88 39.3 23.1 73.6 10.11988/89 43.9 26.7 77.3 11.11989/90 48.0 31.7 81.4 12.5
Table 2.1. Days lost at work in United Kingdom, as a consequence of stress related disorders.Adapted from (Cox 1993)
Many people start seeing the need to combat stress in an effective way and, ingeneral, two types of stress combat approaches are discussed (Cox 1993, PEROSH2004):
Individual Approach Focus on reducing the risk of individual exposure to a stressorand management of the consequences of stress for each individual
Organizational Approach Focus on the characteristics of jobs and origins of stres-sors, with the goal of reducing or eliminating them.
A workshop, held in 2004, of Partnership for European Research in OccupationalSafety and Health (PEROSH) analysed how European countries are dealing withthe problem. There seems to be an increased focus on the Organizational Approach,

2.1 Stress 15
with steps taken from a company and governmental point of view to improve workenvironments and therefore eliminate work related sources of stress. It is still dif-ficult to compare the effectiveness of different programmes, as they differ a lot inmethodology and focus. But PEROSH (2004) is one of the first steps on this area, sothis is likely to change in the following years.
The Organizational Approach, however, is mostly concerned with work relatedstress. Though it can work towards a more healthy work environment, dealing withstress in personal life seems to be left out for each individual to handle.
Affective Health is more focused on the Individual Approach. At this level, mea-sures can either be taken towards stress reduction, by identifying specific stressorsand minimizing exposure, or stress management, which focus on individual trainingfor dealing with stress.
Two particular techniques of individual stress management are relevant to thisthesis: self-reflection and body awareness.
Self-reflection is the act of introspectively analyse oneself. One way to achievethis is through journaling. Keeping a journal or diary does not only keeps us intouch with ourselves, by providing an anchor to everyday life, but it is also a veryused tool recovery from traumatic events and in stress management programmes(Anderson & MacCurdy 2000). Houghton (2005) shows an example of how writinga diary can help to identify causes of stress and eliminate them:
A general practitioner thought his main source of stress was unrealistic patientdemands, but when he did his diary he found that the root of the problem lay inrushing to take the children to school and still trying to be ready to see his firstpatient at 9 am sharp. He always arrived breathless and frazzled, and by thetime he saw his first patient at 9 15 the next two patients had already arrived.While he thought the solution was to give up medicine in order to open a bookshop, it turned out to be a simple matter of scheduling his first patient for 9 15on the days he did the school run.
Besides journaling, other important aspect of stress management is body aware-ness. Yoga and meditation are two examples of activities that have the objective ofincreasing body awareness. Landsman-Dijkstra et al. (2004) describes a 3 day BodyAwareness Program. The first 2 days consist on three type of sessions:
• Working with the body, focusing on bodily sensations and feelings;• Working with the mind, focusing on the thoughts that come with the feelings;• A creative session, that focuses both on bodily sensations and thoughts.
The last day of the program is filled with “bodywork”, “mindwork” and makinga plan of change. This program has been tested with 122 participants with aspecific

16 2 Background
psychosomatic symptoms 1 and has shown to be effective, not only on short-termbut also on the long-term. The program changed their coping strategies with illnessand stress in general, resulting in a better quality of life (Landsman-Dijkstra et al.2004, Landsman-Dijkstra et al. 2006).
2.2 Biomedical sensors
As defined in Harsanyi’s (2000) book, a “sensor is a transducer that converts the mea-surand (a quantity and a parameter) into a signal carrying information”. In general,this signal can be electrical, mechanical or optical.
Biomedical sensors, or simply biosensors, are sensors for which the measurandis a biological component, such as a physiological response. The use of biosensorshas been increasing in the last years and they are being applied not only to monitorpatients in an hospital environment (the typical historical use), but also for patientsat home and even healthy people, for disease prevention and training. This democ-ratization of biosensor technology has generated a big market demand, resulting ina revenue, in 2001, of 5.2 billion dollars in this industry (Wilkinson 2002). Also, theneed for new and more accurate sensors represents in these days a huge researcharea.
Biosensors can be classified as intrusive, indwelling or non-intrusive, by the ex-tent on how much they invade the body. Intrusive biosensors are used under theskin, while non-intrusive sensors are used on the skin optically reading information.Indwelling sensors make their measurements from existing body cavities, withoutaltering any anatomical property (Neuman & Liu 1988).
Typical uses of this technology include microsensors and wearables (Lymberis2005).
2.2.1 Microsensors
According to, Lymberis (2005), during the last 10-15 years microsensor technologyhas developed come in terms of intelligence, speed, miniaturization, sophisticationand new materials at low cost. Microsensors can by used in vitro, helping on thediscovery of new drugs (sources) or in vivo 2.
Implantable in-vivo solutions are capable of monitoring glucose levels on diabet-ics, viruses and bacteria, etc. (Jaffari & Turner 1995). These systems are not beingstill widely used due to difficulties in finding right biocompatible materials to beused inside the body, power sources and communication (Lymberis 2005)1 Psychosomatic symptoms are “bodily symptoms of psychic, emotional or mental origin”
(CancerWEB 1997). They can be head or muscle aches, dizziness, etc.2 In vivo means “in a living organism” where as in vitro is defined as “performed in a glass or
plastic vessels in the laboratory” (CancerWEB 1997)
2.2 Biomedical sensors 17
2.2.2 Wearable sensors
Wearable biosensors are a kind of non-intrusive sensors. Bonato et al. (2006) definesthem as:
“Biomedical (including biological) wearable sensors/actuators and sensor- basedcommunicative systems that can monitor and/or stimulate, and/or treat,and/or replace biological and physical human functions.”
The largest part of the market demand and research is currently placed on themonitoring type of wearables. Wearable biosensors do not have the problems identi-fied in the microsensors and are already starting to be common. They can be used inmultiple domains like remote monitoring of health patients, astronauts or athletes.Their miniaturization offers now the possibility of integration with clothing or ac-cessories such as hats, belts, wrists, shoes or gloves. Although it brings advantages,this miniaturization limits their functionality by posing challenges on power sources,processing power, memory and range of collectible biological data. (Lymberis 2005).
Engin et al. (2005) gives a review of the current trends in wearable biomedi-cal sensors. Two types of wearables are described in particular: smart textiles andphotoplethysmographic (PPG) sensors.
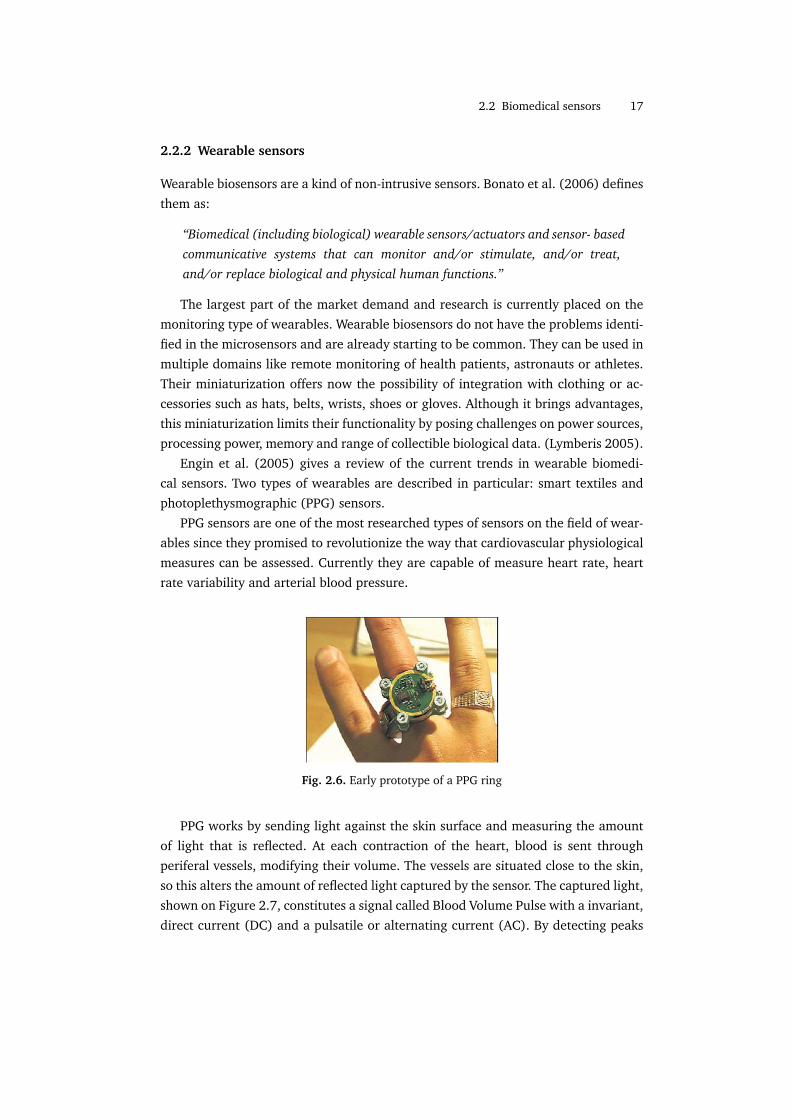
PPG sensors are one of the most researched types of sensors on the field of wear-ables since they promised to revolutionize the way that cardiovascular physiologicalmeasures can be assessed. Currently they are capable of measure heart rate, heartrate variability and arterial blood pressure.
Fig. 2.6. Early prototype of a PPG ring
PPG works by sending light against the skin surface and measuring the amountof light that is reflected. At each contraction of the heart, blood is sent throughperiferal vessels, modifying their volume. The vessels are situated close to the skin,so this alters the amount of reflected light captured by the sensor. The captured light,shown on Figure 2.7, constitutes a signal called Blood Volume Pulse with a invariant,direct current (DC) and a pulsatile or alternating current (AC). By detecting peaks

18 2 Background
in the AC portion of the signal, it is possible to detect cardiovascular measurementslike the heart rate (Asada et al. 2003).
Fig. 2.7. Absortion of light by a PPG sensor. The AC part of the signal gives information aboutthe heartbeat
Textiles also promise to see big development in the following years. Engin et al.(2005) defines smart textiles as “ context-aware textiles which are able to react andadapt to stimulus from their environment by integration of smart materials into itsstructure”. These type of wearables can be made by implementing the functionalityinto strongly integrated, yet non-textile electronic components or by following theparadigm “the fabrics is the computer”. Figure 2.8 shows the first wearable moth-erboard, an example of the latter case developed for use by soldiers in a combatsituation, where, embedded in the fabrics, there are optical fibers that detect bulletwounds and special flexible transmission fabrics that can transmit information likeheart rate, temperature, etc. from various sensors (Firoozbakhsh et al. 2000).
The current effort in research in biosensors provides us with a wide range ofpossibilities of getting insight about the internal functioning of our bodies.
Figure 2.9 ilustrates the main signals that can be captured and the usual placeswhere the sensors are placed.

2.2 Biomedical sensors 19
Fig. 2.8. Example of a smart textile called Georgia Tech Wearable MotherboardTM
Fig. 2.9. Examples of usual places in the body used to capture signals from wearable sensors.Some of this signals will be discussed along this thesis. Adapted from (Kim 2004)


! 3
Affective Health
Affective Health aims to encourage self-reflection on life experiences, focusing onstressful events, as well as allowing for biofeedback in real-time. The objectives ofthe project meet the requirements of the Individual Approach to stress combat, de-tailed on Section2.1.4: stress reduction and stress management. In the same Section,under stress management, two techniques were described in detail: self-reflectionand body awareness. Affective Health also aims to make the users more self-awareof their body and the events on their lives. This effect is achieved by the means ofa real-time on user’s mobile phones. The real-time feedback is shown together withclues from what has been happening in the context. These clues can be materialscollected from the mobile phone such as text or multimedia messages, bluetoothpresence, photos, sound recordings, etc.
It is not the purpose of this thesis to focus on the design aspects of creating sucha representation. However, understanding the design qualities is essential to guideand set constraints in the analysis of biosensors and biodata that follows in the nextChapters.
3.1 Evaluating emotion in Affective Interaction
Since Affective Health is a project conducted in the field of Affective Interaction, it isimportant to know first what is the vision behind the system. Affective Computing(Picard 1997) is a field of research that aims to bring emotions to the computerdomain. Briefly, the goal is to capture the user’s biodata, facial expressions or bodylanguage and translate that input to emotions, based on computational models, inorder for computers to take into account the user’s emotional state. This approachrarely takes into account social situations and context (Stahl 2005).
Schachter & Singer (1962) proposed a two-factor theory for evaluating emotion,suggesting that one needs to know two things to interpret an emotion: the phys-

22 3 Affective Health
iological arousal from the body and cognition about the context. Another author,Kagan (1984), points out:
The term emotion refers to relations among external incentives, thoughts, andchanges in internal feelings, as weather is a superordinate term for the chang-ing relations among wind velocity, humidity, temperature, barometric pressure,and form of precipitation. Occasionally, a unique combination of these meteo-rological qualities creates a storm, a tornado, a blizzard, or a hurricane - eventsthat are analogous to the temporary but intense emotions of fear, joy, excite-ment, disgust, or anger. But wind, temperature, and humidity vary continuallywithout producing such extreme combinations. Thus meteorologists do not askwhat weather means, but determine the relations among the measurable qual-ities and later name whatever coherences they discover.
Affective Interaction is similar to Affective Computing in the sense that emotionsplay a central role. However, instead of trying to create model to guess the emo-tional state of the user, affect is seen as interaction, where the user can construct themeaning of her own emotions (Boehner et al. 2005) by interacting with the system.In fact, relating this to the observation by Kagan, only the user can be the meteorolo-gist because only her can know the all variables (not only the physiological responsebut also social context) needed to correctly label an emotion, if that is at all possible.
Boehner et al. describe a set of guidelines for designing systems aiming to supportunderstanding and self-interpretation of the user’s own emotions. This set is calledInteractional Approach:
• The interactional approach recognizes affect as a social and cultural product. Emo-tions are rooted in the social situation we are in and can only be interpreted ifwe take that into account
• The interactional approach relies on and supports interpretive flexibility. Interpre-tation of emotion is left for the user
• The interactional approach avoids trying to formalize the unformalizable. Emotionsare not represented as discrete units of information
• The interactional approach supports an expanded range of communication acts. Therepresentation of emotion by the system can very rich. Emotions do not need torepresented by clear signs or verbal statements
• The interactional approach focuses on people using systems to experience and un-derstand emotions. It is not the purpose of these systems to read or label user’semotions but rather to let the user construct and experience the emotion
The Interactional Approach opens up for the design of systems that allow usersto experience an Affective Loop. In her licentiate thesis, Sundstrom (2005) describesthe Affective Loop as an interaction process with three steps:

3.2 Inspirational systems 23
1. the user first expresses her emotions through some physical interaction involvingthe body, for example, through gestures or manipulations of an artifact;
2. the system (or another user through the system) then responds through gener-ating affective expression, using for example, colors, animations, and haptics;
3. this in turn affects the user (both mind and body) making the user respond andstep-by-step feel more and more involved with the system
The design of Affective Health will be user-centered and follow the guidelinesstated by Boehner et al., aiming at involving the user in the system by producing anAffective Loop experience.
3.2 Inspirational systems
There is a fair amount of previous developed systems and research on the field ofAffective Interaction, health monitoring and intervention. The following ones wereselected because they contain some of the qualities that are expected to play a rolein Affective Health.
3.2.1 Affective Diary
Affective Diary is a project conducted at SICS in cooperation with Microsoft Researchwhich consists on a client on the mobile phone, a digital diary software and biosen-sors (Lindstrom et al. 2006). The system works by capturing sensor data from theuser and uploading it to the diary through the mobile phone, together with othermaterials from the phone such as text and multimedia messages, photographs, blue-tooth presence, etc. The sensor data captures some of the physiological expressionsof human emotions. An ambiguous colorful body shape is then formed from thesensor data and associated with the other collected materials.
Fig. 3.1. Interface of the Affective Diary

24 3 Affective Health
The aim of the diary is to invite reflection on the experiences of the day, makingbodily experiences available, while empowering the user to change them and createtheir own interpretation of the events.
3.2.2 Home Health Horoscope
Completely ambiguous, Home Health Horoscope is a system that uses sensors tomeasure the wellbeing state of the house, instead of the inhabitants (Gaver et al.2007). A sensor network is placed around the house in meaningful locals (known apriori by analyzing the habits of the inhabitants) such as the kitchen table, a sofa,etc. The presence or absence of people in these places is analyzed and interpretedby the system which then outputs a horoscope-like ambiguous affirmation such as“Thinking before you speak and act will keep you out of trouble. The real source of yourtrouble is a lack of self-control. . . ”. The horoscopes do not intend to be accurate butto provoke curiosity and reflection. It is also not aimed at inciting behaviour changebut rather to stimulate curiosity. In the end, the user’s subjective interpretation ofthe horoscope is the real output of the system.
Fig. 3.2. Scheme of the Home Health Horoscope. The ambiguous output of the system needsto be interpreted to make sense.
3.2.3 Exmocare Watch
The watch from Exmocare (2007) is a monitoring commercial system capable ofcapturing multiple physiological signals at once, from a wrist worn watch. The sen-sor data can be uploaded to a client software in the computer and shown in a rawform, either in real time or a posteriori. The software also has some algorithms thatcan be used to infer the emotional state of the user from the sensor data and presentit graphically. Other usage of the system is distance monitoring as it is capable ofsending pre-defined warnings to a caregiver, in case one or more signals fall belowor above a threshold.
3.2 Inspirational systems 25
Fig. 3.3. Exmocare watch
Exmocare Watch is a pure monitoring system with some extra processing andcan be used as a biofeedback device such as heart rate monitors from Polar USA(2007), mostly developed for sports. The capabilities of distance monitoring makeit similar to BodyKom a system developed by Kiwok (2008) which is intended forhospital patients staying at home, measuring an ECG signal and sending it via a se-cure connection to the hospital. Like these, there are many systems that can providemonitoring; some of them even specialized for stress management.
3.2.4 SenseChair
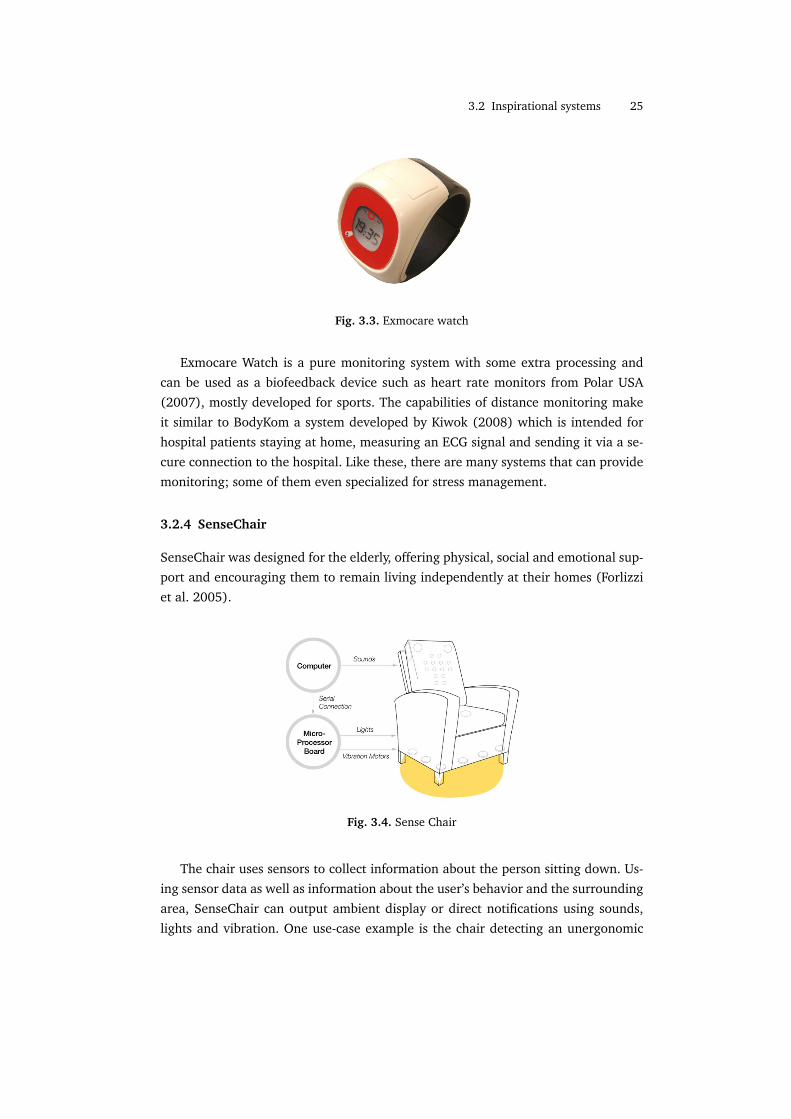
SenseChair was designed for the elderly, offering physical, social and emotional sup-port and encouraging them to remain living independently at their homes (Forlizziet al. 2005).
Fig. 3.4. Sense Chair
The chair uses sensors to collect information about the person sitting down. Us-ing sensor data as well as information about the user’s behavior and the surroundingarea, SenseChair can output ambient display or direct notifications using sounds,lights and vibration. One use-case example is the chair detecting an unergonomic

26 3 Affective Health
sleeping position and gently waking the user up using low frequency vibration, nat-ural sounds and soft blue lights.
Far from being a monitoring device, SenseChair nevertheless elicits behaviorchange in the user and supports it in her daily life with the help of naturally am-biguous cues like colour, sound or vibration.
3.2.5 Breakaway sculpture
Breakaway is an ambient display with aesthetic properties that intends to encouragepeople, whose job requires them to sit for long periods of time, to take breaks morefrequently (Jafarinaimi et al. 2005). It is represented by a small anthropomorphicsculpture (represented in Figure 3.5) that is to be placed on a desk where the usersits. The shape of the sculpture, mimicking the human body, is influenced by sensorsplaced on a chair measuring the amount of time that the user spent sitting: if theuser has been sitting for too long, the sculpture assumes a slouching position; if theuser gets up and goes for a walk, the sculpture returns to the upright position.
Fig. 3.5. Breakaway sculpture shown in different positions. (a) represents a slouching positionand (e) a relaxed position
This system was tested with users and positively evaluated. It uses body languageto communicate with the person in order to encourage behavior change.
3.3 Design Qualities
All these systems contain some qualities that we expect to be present in AffectiveHealth. Ambiguity of representation is present in all the systems except for the Ex-mocare Watch. This quality, although can be seen as undesirable by traditional viewsof human-computer interaction, was looked upon by Gaver et al. (2003) as a “a

3.3 Design Qualities 27
resource for design that can be used to encourage close personal engagement with sys-tems”. Ambiguity allows for open interpretation of the system and forces the user toget involved in order to decide what is the meaning of the system.
Another design quality, present in Affective Diary, is embodiment. Defined byDourish (2001) as “interaction with computer systems that occupy our world, a worldof physical and social reality, and that exploit this fact in how they interact with us”.Dourish says that an interaction is embodied not only because there exists physi-cal interaction (like the one occurring when biosensors are measuring physiologicaldata) but rather when that interaction is within a social setting and circumstancesthat give meaning and value to it.
Furthermore, the representation of biodata in Affective Health should be unva-lenced. Valence is a dimension used to represent positiveness or negativeness ofemotions. Russell (1980) represented emotions in a two-dimensional space withtwo axes: valence and arousal. Each emotion has a specific value of valence andarousal (e.g. “Excited” has high arousal and positive valence), as shown in Picture3.6. However, an everyday life setting is too complex to capture all the determinantsthat allow us to classify an emotion (social determinants, context, mood of the per-son, etc.). Therefore we opt to represent Physical Activity, Arousal and Adaptabilityin a complete unvalanced way using a design that should allow the users to maketheir own valence interpretation based on their everyday understanding.
Fig. 3.6. Russell’s model of emotion, where which emotion is represented along the axes ofvalence and arousal.
SenseChair and Breakaway aim to encourage behaviour changes toward health.Affective Diary and, in a certain sense, Home Health Horoscope encourage self-reflection; where the first does it by presenting user’s own biodata with contextclues, the latter presents ambiguous horoscopes. Affective Diary also provides the

28 3 Affective Health
possibility to look back in time and reflect on events that happened a long timeago. Although these are not design qualities, they are relevant functionalities for thedesign problem at hand.
Thus, we are designing for the user to relate to an ambiguous and embodied rep-resentation of her body status. The sense of embodiment is achieved by combining asmany clues as possible from the social context with the biodata representation. If thishappens, a kind of Affective Loop may then be achieved, creating a strong affectiverelationship with the system. This involvement with the system and increased bodyawareness may lead to reflection and subsequently to behaviour change. This is themain difference between Affective Health and conventional biofeedback applicationsand can be the key to the success of this system.
3.4 Requirements on the physiological input methods
From Exmocare Watch and similar simple biomonitoring systems we take the qual-ities of long-term reliable sensor data and the use of wireless unobtrusive sensors.Affective Health should be able to integrate into everyday life with minimum mainte-nance. As research in implantable sensors is far from being able to produce sensorswith these characteristics (Lymberis 2005), it becomes clear that the choice mustrely on Wearable Sensors.
From this, we can enumerate a set of requirements on the methods of input thatwill be part of Affective Health:
1. The method should rely on wearable sensors;2. The method should use lightweight and extremely non-invasive sensors that al-
low for a comfortable use;3. The sensors used in the method should be unobtrusive when it comes to appear-
ance, or highly customizable;4. The method should have a reliable output;5. The sensors used in the method should be robust and durable and require mini-
mal or no maintenance;
The third requisite narrows the choice of sensors to the ones that are smallenough to be almost invisible or integrated into clothing or accessories. The fourthrequisite, concerning reliability, is of crucial importance since we do not intend tomake a laboratory study or use sensors in a controlled setting. Therefore they shouldbe able to cope with wear and tear of everyday life and still be able to have areliable output. Feature selection on physiological data will also follow the sameprinciple; features that are too sensitive to errors from sensors or that can behaveunpredictably in similar conditions should be discarded.

3.4 Requirements on the physiological input methods 29
A design choice was also made before starting the literature review in biosen-sors: smart textiles would not be considered. The reason for this decision is twofold:(1) this kind of solutions is still in a research phase when it comes to monitoringphysiological signals (Engin et al. 2005); (2) textiles would require a great amountof maintenance because they would need to be washed with special care. For thisreason, smart textiles go against requirement 5 and do not qualify for long-termcontinuous everyday life usage.
Furthermore, the choice of the sensors will be limited to the commercial avail-ability or technical feasibility and also take into account the amount of trusted sci-entific background supporting the validity of the measurand of the sensor.


! 4
Mapping the Concepts
The next step in our process will be to map the biodata to concepts that end usersshould be able to understand - layman’s terms. The reason for using high-level con-cepts in Affective Health is that the system is intended to be used by users withoutany medical or technical knowledge. The following concepts will be analysed:
Physical Activity represents how much and how one person movesArousal is a measure of physiological response to stress and exerciseAdaptability represents the person’s capacity to adapt to changes in environment
Physical Activity and Arousal come directly from a previously developed system,Affective Diary. The use of Physical Activity in Affective Health is justified by researchshowing that exercise is a good way to relief stress, as well as many benefits forthe heart and overall state of the body (King et al. 1989, Barengo et al. 2004, U.S.Department of Health and Human Services 1996). Knowing how much one movesduring the day can be useful to assess lifestyle and motivate a change toward morephysical exercise and a healthier life. Another reason is that having a report of Phys-ical Activity during the day improves recall of when events happened and therebyfacilitates self-reflection.
Arousal is a concept directly related to stress. When faced with a stressor, anorganism reacts by inducing an aroused physiological response, preparing it to dealwith the situation. So Arousal can be used by the user to indentify stressors andanalyse her body response in situations of stress. Besides this, it is also possible touse representation of Arousal in real-time to help users to relax.
The concept of Adaptability was taken from medical background on stress (seeSection 2.1). An excess of allostatic load caused by stress disrupts the normal processof homeostasis (adaptation) and leads to diseases. There is a loss of Adaptabilitywhen homeostasis is compromised or the allostatic response is impaired, meaningthat the body has less autonomic regulation and is less able to cope with stress(Lucini et al. 2005).

32 4 Mapping the Concepts
A discussion based on literature is included for each one of the concepts in sep-arate Sections, focusing on the type of biosensors needed and the technical aspectsof the biodata acquisition. These discussions aim to select the best array of sensorsfor the needs of Affective Health, filtering the less adequate solutions.
Filtering was made simultaneously by:
1. Selection of physiological signals (such as heart rate or skin temperature) andfeatures (such as count, mean or slope) , based on their power to map to PhysicalActivity, Arousal and Adaptability;
2. Selection of measurement techniques based on their technical characteristicsand compliance to the considerations and requirements defined on the Sectionabove.
Because of the large variety of sensors and research available in this area, thefiltering was made in two steps: first we look at the literature panorama and selectonly the solutions that are most likely to satisfy the requirements; second, we analysein detail these solutions and compare them.
4.1 Physical Activity
The usual definition of Physical Activity is given by Caspersen et al. (1985) whichdescribes it as “as any bodily movement produced by skeletal muscles that results inenergy expenditure” 1. For the purposes of this thesis, we will lax this definition toany bodily movement, even if there was not any significant or measurable energyexpenditure. The reason for this is that we are not only interested in measuringexercise but also low intensity movements and body postures that can help the userremember and reflect on her life, when looking into her bodily data representationin retrospective.
Two types of features are available in general to monitor physical activity indaily life: relative movement and steps. These map directly to sensor solutions: ac-celerometers and pedometers. As modern pedometers usually consist internally ofaccelerometers, it matters, before looking with more detail into these solutions, tomake clear this distinction: accelerometers are defined as devices that have as outputrelative movement; pedometers simply output a number of steps.
4.1.1 Relative Movement
This feature represents the amount of movement the user does relative to herself andit is usually accessed by accelerometers. Accelerometers are capable of measuring1 Energy expenditure can be defined as the amount of energy, measured in calories, that a
person uses

4.1 Physical Activity 33
not only the quantity but also the intensity, frequency and duration of physical activ-ity. They can be classified by uniaxial, biaxial and triaxial, depending on the numberof movement planes that can capture. A uniaxial accelerometer measures movementin 1 plane, a biaxial can measure acceleration in 2 planes and a triaxial accelerome-ter measures in 3 planes, by combining the measurements of 3 different accelerome-ters disposed 90 degrees from one another. In general, triaxial accelerometers workbetter to measure normal day-to-day activity (Plasqui & Westerterp 1999).
Fig. 4.1. Post processing of accelerometer. 1) Raw counts; 2)Rectified counts; 3) Epochs.Extracted from (Chen & Basset 2005)
The output of an accelerometer is usually expressed as a dimensionless unitcalled “counts”. This unit needs post-processing in order to account for PhysicalActivity. Figure 4.1 shows two possible stages of this processing. The first illustrationshows a 60 second window of bidirectional raw output (including negative valuesfor movement), sampled at a fixed frequency (depending on the model of the ac-celerometer) and after going through a conversion from analog to a digital signal:“raw counts”. In the second illustration, the signal has gone through a full-wave rec-tification, in which the negative part of the signal has been converted to positive.The third and last illustration represents an integration of the signal over 15 secondwindows, creating an alternative output unit called epochs. Epochs, which representan average of movement during a specified time interval, can be processed efficientlyby computer algorithms (Chen & Basset 2005).

34 4 Mapping the Concepts
Fig. 4.2. Actigraph, an example of an accelerometer.
The small size of current accelerometers (see Figure 4.2) makes possible to po-sition them at virtually any part of the human body. The positioning is conditionedby the lifestyle of the person and the type of movement that we want to record.Measuring movement in children, young adults or elders can be very different. Thepreferred type of physical activity for a sedentary adult or elder is walking (Tudor-Locke & Myers 2001). Studies suggest that an accelerometer positioned on the waist(Berlin et al. 2006) or lower-back (Bouten et al. 1997), close to the center of gravity,is the best for such activity. This positioning, however usually fails to record accu-rately activities like cycling, swimming or fast running (Chen & Basset 2005, Boutenet al. 1997), as well as any movement occurring in the upper part of the body (armmovement, for example). Other possible positions include the wrist or ankle. To de-rive body posture, some solutions combine accelerometers in different body parts,mainly chest and thighs (Chen & Basset 2005).
4.1.2 Steps
Pedometers have been widely used as monitors of physical activity. They recordsteps, a simple measure of ambulatory (walking) activity. Although early-days me-chanical pedometers lacked in accuracy , the new digital ones are now capable ofsatisfactory results (Tudor-Locke 2002). A digital pedometer is constructed basedon accelerometers: the acceleration signal is processed by an algorithm that detectspatterns of acceleration that correspond to steps. Although a step detection algo-rithm could be implemented in the Affective Health client running on the mobilephone, based on the output of an accelerometer, it is still valid to explore the directextraction of steps from sensors as signal processing in mobile devices can be veryexpensive in CPU and battery lifetime.
A modern pedometer can give reliable results, with error below 5% (Vincent &Sidman 2003), in counting steps for people with a normal gait who walk at leastat 0.9m/s, underestimating steps for lower walking speeds or irregular gait (Berlinet al. 2006). The Step Activity Monitor is an advanced pedometer composed inter-nally of a triaxial accelerometer that has a reliability of 99% even with people with

4.1 Physical Activity 35
disabilities and irregular gaits (Coleman et al. 1999). The accuracy of a regular pe-dometer, however, varies with the brand and model. (Schneider et al. 2004, Crouteret al. 2003, Schneider et al. 2003, Melanson et al. 2004, Bassett et al. 1996)
(a) Pedometer (b) Use of pedometer
Fig. 4.3. Pedometer and usage of pedometer on the waist
The position of a pedometer should be the lower part of the body or the waist(Berlin et al. 2006), as shown in Figure 4.3(b).
As they simply record the number of steps, movement occurring only in the upperpart of the body or seated physical activity is not recorded. Furthermore, a pedome-ter cannot record the intensity of the movement, making impossible to distinguish ifa person is running or walking (Berlin et al. 2006). Furthermore, it is not possibleto know the direction and orientation of the movement.
4.1.3 Evaluation
Pedometers have been used with success in behaviour change programmes, promot-ing physical activity (Tudor-Locke 2002). Also, they do not require post processingbecause the output is a simple integer representing the number of steps. This isspecially important when considering that this processing will be done by a mobiledevice, with limited power, processing and memory resources.
As behaviour change is one of the main objectives of Affective Health, pedometerswith their simple design seem to be likely candidates.
It is clear, however, that the counts or epochs derived from accelerometers con-tain much more information than simply the amount of steps, from the pedometer.Even if ambulatory physical activity is the most common type of activity, a user ismore likely to relate to the representation of her bodily data with an accelerometer.With a tri-axial accelerometer to measure inclination or combining data from ac-celerometers placed in different positions, it is also possible to derive body posture(Hansson et al. 2001, Chen & Basset 2005), knowing when a person is standing orlying down, and very low intensity movement like the one occurring when driving a
36 4 Mapping the Concepts
car or going up in an elevator. This can be valuable input for the design as it providesmore clues about the context, improving the possibilities for users to make sense oftheir own data. That, in turn, enables a sense of embodiment and a potential forself-reflection.
Accelerometers have another important advantage. As motion artifacts are oneof the most common source of errors in ambulatory use biosensors, they can bevery useful for eliminating these artifacts. Several solutions exist that make use ofaccelerometers to detect and attenuate the effects of movement in the signal of otherbiosensors (e.g. Westeyn et al. 2006, Asada et al. 2004).
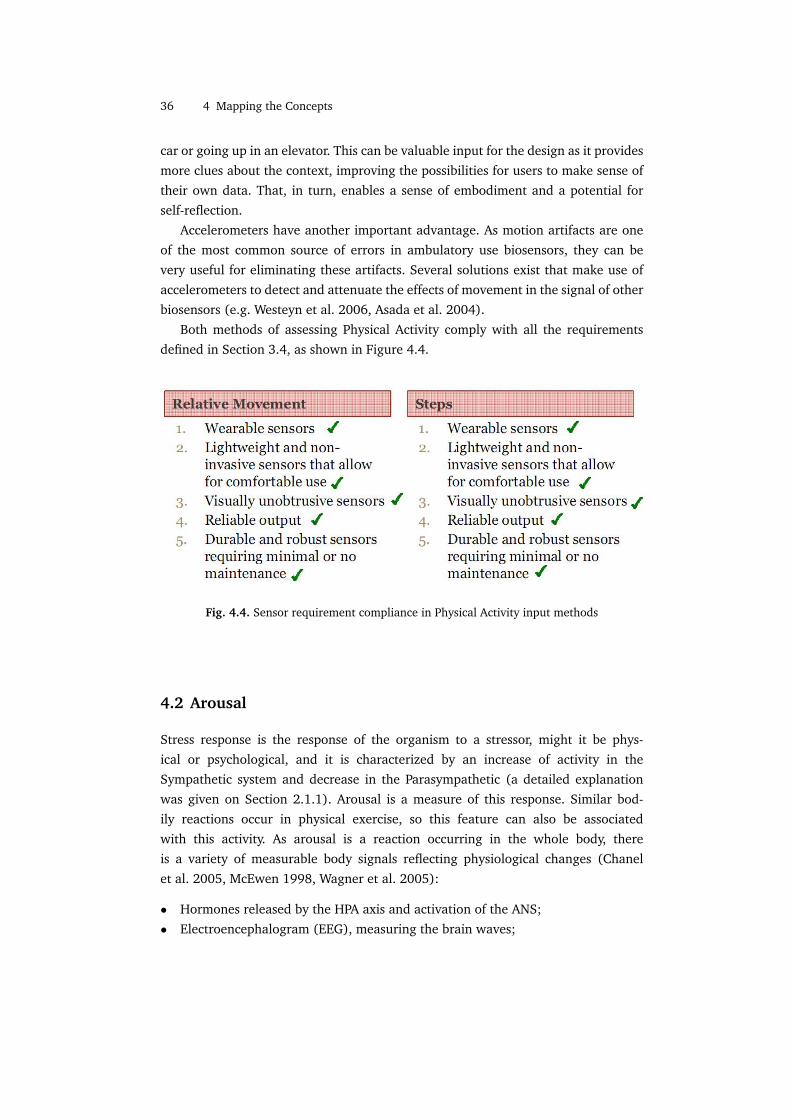
Both methods of assessing Physical Activity comply with all the requirementsdefined in Section 3.4, as shown in Figure 4.4.
Fig. 4.4. Sensor requirement compliance in Physical Activity input methods
4.2 Arousal
Stress response is the response of the organism to a stressor, might it be phys-ical or psychological, and it is characterized by an increase of activity in theSympathetic system and decrease in the Parasympathetic (a detailed explanationwas given on Section 2.1.1). Arousal is a measure of this response. Similar bod-ily reactions occur in physical exercise, so this feature can also be associatedwith this activity. As arousal is a reaction occurring in the whole body, thereis a variety of measurable body signals reflecting physiological changes (Chanelet al. 2005, McEwen 1998, Wagner et al. 2005):
• Hormones released by the HPA axis and activation of the ANS;• Electroencephalogram (EEG), measuring the brain waves;

4.2 Arousal 37
• Electrooculography (EOG), measuring the pupil diameter change;• Electromyography (EMG), a technique that measures levels of contraction in the
muscles, specially in facial muscles, in the case of arousal;• Respiration rate;• Skin Temperature;• Cardiovascular activity with a number of possible indices, including heart rate,
heart rate variability (HRV) and blood pressure and• Electrodermal activity, changes in the skin conductance of electricity.
From these, the only ones that are hard to be measured non-invasively are thehormones, so we discard them. EEG, EOG, EMG and respiration rate are good can-didates but the apparatus needed to correctly acquire these signals goes against thesensor requirements 2 and 3, defined on Section 3.4. In particular, respiration ratecan also be estimated by looking into cardiovascular activity, as will be explained inthe following sections.
Skin temperature can be used to discriminate arousal. During a “fight or flight”situation, the activity of the Sympathetic nervous system redirects the blood cir-culation from the periphery of the body to the interior, delivering more oxygen tothe heart and other internal organs. This reduces the skin temperature, as resultof less blood circulation in the surface. When the person is in a relaxed state, theopposite happens: the blood flows through the skin and rises the temperature. How-ever, besides a large inter-individual variability (Freedman et al. 1987, McGrady &Roberts 1992), the usage of a skin temperature sensor to measure arousal in aneveryday life setting has also the problem that, due to the constant homeostatic reg-ulation of the body, the ambient temperature, breeze and clothing affect the mea-surement. If the environment is cold, the body will naturally adapt to the exter-nal environment by trying to maintain the internal temperature and pull the bloodaway from the periphery, which may cause a drop in skin temperature identical tothe one happening in a stress response (Wainapel & Fast 2003). Furthermore, it hasbeen found that skin temperature has different responses for emotions with simi-lar arousal level (Oatley 1992). As an example, fear is associated with lower skintemperature and anger associated with high skin temperature. For these reasons, weexcluded skin temperature since it is an ambiguous physiological reaction when itcomes to represent Arousal.
Thus the ones that will be analysed in detail are the Electrodermal Activity andCardiovascular Response.
4.2.1 Electrodermal Activity
The human skin has its own electrical activity. When a constant voltage direct current(DC) is applied in two points of the skin, the result is a current flow that changes

38 4 Mapping the Concepts
over time. This phenomenon is explained by a variation on the skin conductance.Venables & Christie (1980), Fowles (1986) and Schmidt & Walach (2000) consti-tute comprehensive reviews of current practices on Electrodermal Activity (EDA)measurement.
Fig. 4.5. Skin conductivity response. (SCL = Skin conductivity level; SCR = Skin conductivityresponse). The graph shows different stages of the SCR, such as the rising time and return tobaseline. A SCR typically lasts a few seconds. Extracted from (Schmidt & Walach 2000)
Skin conductance is measured in Siemens or mho (Micromho), and it can bedivided in two distinct components: tonic and phasic. The tonic component changesslowly overtime and is related with the overall arousal level and natural day-to-nightvariations 2. The phasic component rides on top of the tonic and causes peaks on thesignal when a person is startled, feeling pain, sustaining breathing, etc. (see Fig-ure 4.5). These peaks, called skin conductance responses (SCR) 3 have been usedwidely as a measure of instantaneous arousal because the conductance of the skinchanges rapidly as a consequence of a dilatation in the eccrine sweat glands, directlyactivated by the Sympathetic system. Apart from the responses that result from ex-ternal stimuli, SCRs may occur spontaneously. Because of this, it is usually hard todetermine what caused a particular SCR. Inter-individual differences can also poseproblems when evaluating arousal based on SCR.
Figure 4.6 shows graphs of SCR from two different subjects exposed to similarrepeated stimuli. It is visible in the top graph that the SCRs repeat themselves, oc-curring no habituation to the stimulus, whereas in the bottom graph, the subject2 A study conducted by Hota et al. (1999) has shown that the tonic component of the skin
conductance rises during the day3 Skin conductance responses are the inverse of galvanic skin responses (GSR) which mea-
sure changes in the electrical resistance of the skin. According to (Lykken & Venables 1971),the GSR term should no longer be used because it does not describe the measurement pro-cess adequately

4.2 Arousal 39
Fig. 4.6. Differences in skin conductivity response between individuals exposed to the samestimuli. Extracted from (Healey & Picard 1998)
only suffers the first SCR and the next stimuli do not provoke any change on theskin conductivity. Besides this, the tonic component of the skin conductance is in-fluenced by ambiental variables like temperature (which can rise the overall sweatlevel, caused by homeostatic regulation) and humidity. These interferences can risethe tonic level because a moisturized skin has naturally a higher skin conductance.
Fake SCRs may also be caused by artifacts caused by movement, interferenceswith other electronic devices or differences in contact between electrodes and skin.One way to circumvent these is by post-processing the signal and eliminating all thevery high-frequency components by applying a filter. ActionGSR, from Westeyn et al.(2006), uses accelerometers to correct the skin conductance signal and eliminate theartifacts produced by movement.
The usual places to place the two electrodes destined to measure the conduc-tance of the skin are the forehead, palms of the hands and feet as these are thelocations in the body with the highest concentration of eccrine sweat glands. Figure4.7 illustrates two possible sensor configurations for measurement of skin conduc-tance.
4.2.2 Cardiovascular response
The role of the Autonomic Nervous System on cardiovascular control is well-knownand documented (Jalife & Michaels 1994, Grassi et al. 1998). Parasympathetic sys-tem acts upon the heart directly through a nerve called N. vagus, slowing it down,
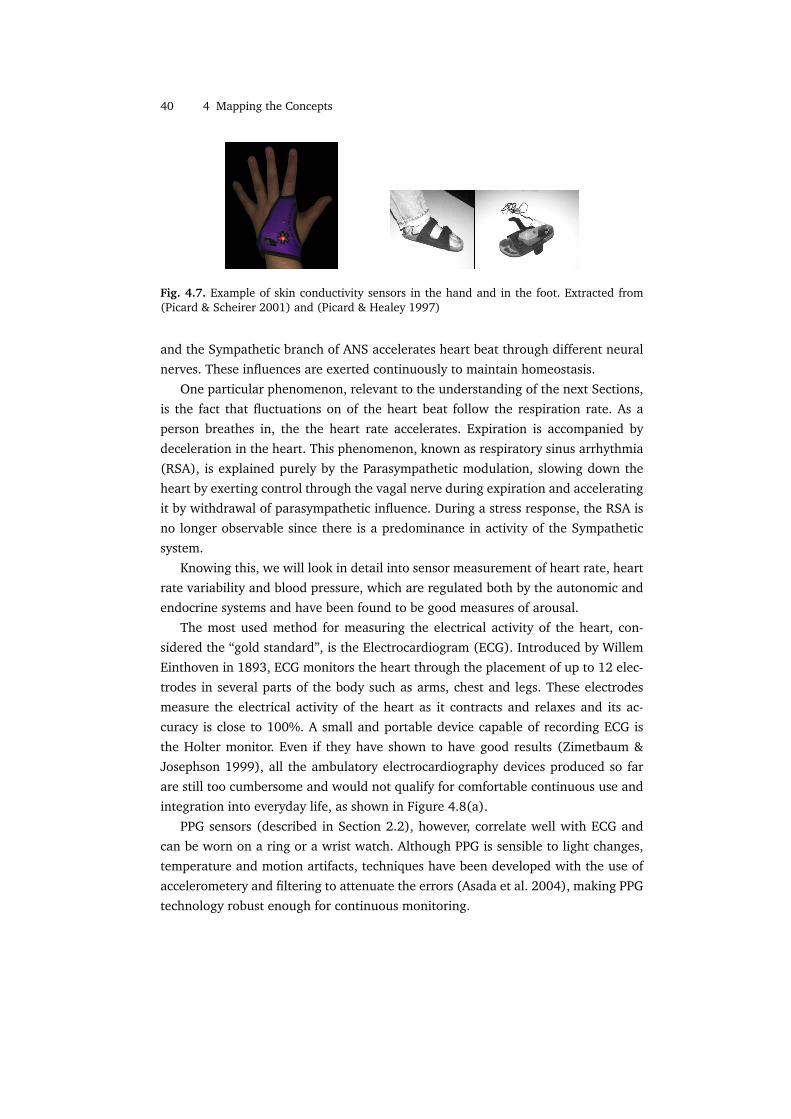
40 4 Mapping the Concepts
Fig. 4.7. Example of skin conductivity sensors in the hand and in the foot. Extracted from(Picard & Scheirer 2001) and (Picard & Healey 1997)
and the Sympathetic branch of ANS accelerates heart beat through different neuralnerves. These influences are exerted continuously to maintain homeostasis.
One particular phenomenon, relevant to the understanding of the next Sections,is the fact that fluctuations on of the heart beat follow the respiration rate. As aperson breathes in, the the heart rate accelerates. Expiration is accompanied bydeceleration in the heart. This phenomenon, known as respiratory sinus arrhythmia(RSA), is explained purely by the Parasympathetic modulation, slowing down theheart by exerting control through the vagal nerve during expiration and acceleratingit by withdrawal of parasympathetic influence. During a stress response, the RSA isno longer observable since there is a predominance in activity of the Sympatheticsystem.
Knowing this, we will look in detail into sensor measurement of heart rate, heartrate variability and blood pressure, which are regulated both by the autonomic andendocrine systems and have been found to be good measures of arousal.
The most used method for measuring the electrical activity of the heart, con-sidered the “gold standard”, is the Electrocardiogram (ECG). Introduced by WillemEinthoven in 1893, ECG monitors the heart through the placement of up to 12 elec-trodes in several parts of the body such as arms, chest and legs. These electrodesmeasure the electrical activity of the heart as it contracts and relaxes and its ac-curacy is close to 100%. A small and portable device capable of recording ECG isthe Holter monitor. Even if they have shown to have good results (Zimetbaum &Josephson 1999), all the ambulatory electrocardiography devices produced so farare still too cumbersome and would not qualify for comfortable continuous use andintegration into everyday life, as shown in Figure 4.8(a).
PPG sensors (described in Section 2.2), however, correlate well with ECG andcan be worn on a ring or a wrist watch. Although PPG is sensible to light changes,temperature and motion artifacts, techniques have been developed with the use ofaccelerometery and filtering to attenuate the errors (Asada et al. 2004), making PPGtechnology robust enough for continuous monitoring.
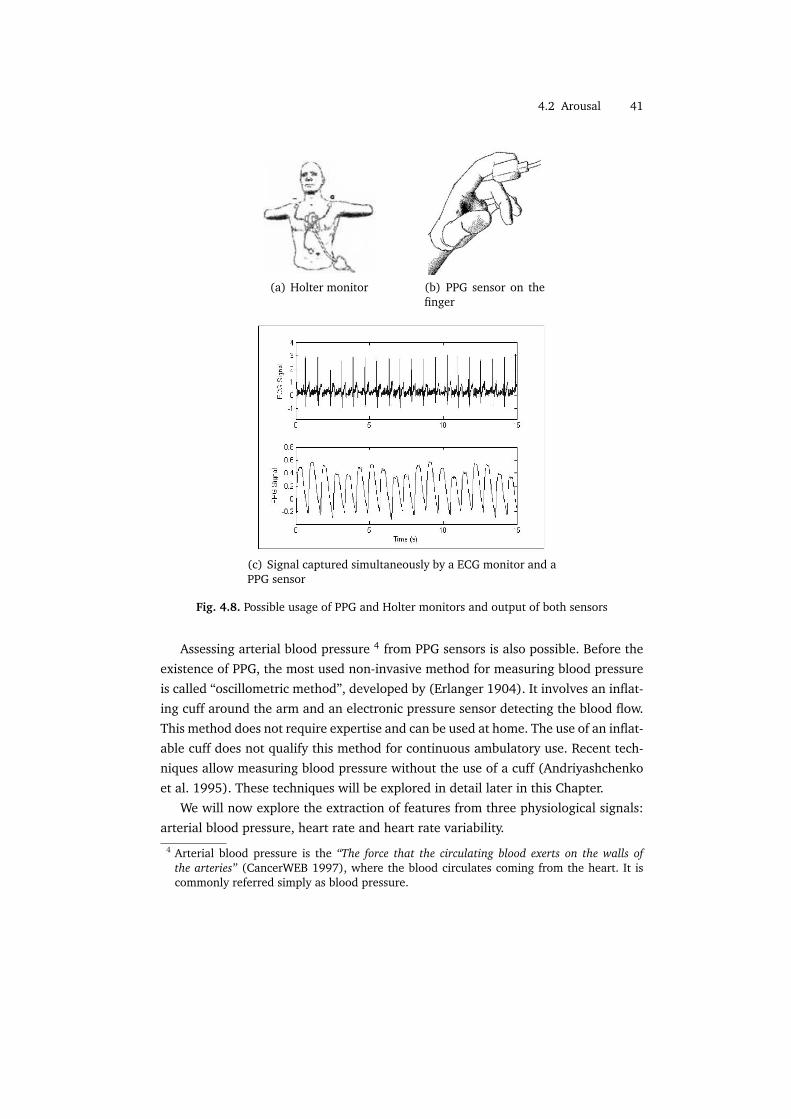
4.2 Arousal 41
(a) Holter monitor (b) PPG sensor on thefinger
(c) Signal captured simultaneously by a ECG monitor and aPPG sensor
Fig. 4.8. Possible usage of PPG and Holter monitors and output of both sensors
Assessing arterial blood pressure 4 from PPG sensors is also possible. Before theexistence of PPG, the most used non-invasive method for measuring blood pressureis called “oscillometric method”, developed by (Erlanger 1904). It involves an inflat-ing cuff around the arm and an electronic pressure sensor detecting the blood flow.This method does not require expertise and can be used at home. The use of an inflat-able cuff does not qualify this method for continuous ambulatory use. Recent tech-niques allow measuring blood pressure without the use of a cuff (Andriyashchenkoet al. 1995). These techniques will be explored in detail later in this Chapter.
We will now explore the extraction of features from three physiological signals:arterial blood pressure, heart rate and heart rate variability.4 Arterial blood pressure is the “The force that the circulating blood exerts on the walls of
the arteries” (CancerWEB 1997), where the blood circulates coming from the heart. It iscommonly referred simply as blood pressure.

42 4 Mapping the Concepts
Arterial blood pressure
Blood pressure measurement is divided into systolic and diastolic. Systolic bloodpressure is the pressure during the contraction of the heart. Diastolic blood pressureis the pressure during the relaxation phase. These are shown and explained in Figure4.9. The same figure (4.9(b)) refers also the mean blood pressure, which is a meancalculated during one heart cycle (contraction and relaxation).
Fig. 4.9. Variation of blood pressure as the heart contracts and relaxes
Blood pressure is measured in mmHg (millimeters of mercury), a unit of pres-sure. It has been shown to rise during aroused states due to the activity of the Sym-pathetic system (Bernardi et al. 2000).
Sorvoja (2006) provides a review of practices on non-invasive blood pressuremeasurement and gives emphasis to three techniques: Tonometry, Pulse Transit Time(PTT) and Volume Clamp.
Tonometry measures blood pressure by applying external pressure on the skinabove the artery. As the artery contracts and expands due to the passage of theblood, the sensor will measure the pressure applied on the skin and give a readingof blood pressure (see Figure 4.10 for an usage example of a tonometric sensor inthe wrist).
Fig. 4.10. Demonstration of the tonometric method to assess blood pressure

4.2 Arousal 43
A tonometric sensor can be easily integrated into a wrist watch. Salo et al. (2007)proposed a design of a small, portable and low-power consumption tonometric sen-sor. However, the construction of this sensor is still in process and there was novalidation of this new design by independent studies found in literature.
One other technique described is PTT. Pulse Transit Time is the time it takesthe pulse pressure waveform to propagate through a length of the arterial tree andit is inversely proportional to the blood pressure. Basically, if the blood pressure ishigher, the blood takes less time to propagate into the arteries. This technique canuse PPG to measure the changes in blood volume in 2 places, typically the wrist andfingertip. Briefly, the PPG sensors measure the exact time when the blood volumepeak (caused by a heartbeat) occurs; the time difference between peaks in the wristand in the fingertip represents the PTT, the time that the blood took to reach thefingertip from the wrist (see Figure 4.11).
Fig. 4.11. Wearable sensor for measuring blood pressure through PPT method. It is composedof two PPG sensors.
PTT is the technique that has seen more development in recent years. An-driyashchenko et al. (1995) compared PTT with tonometry for long-term measure-ment and concluded that PTT was less intrusive since it does not need to applyexternal pressure and is less prone to errors since tonometry requires that the sen-sor is positioned exactly on top of the artery. This makes PTT more attractive forlong-term monitoring. Hung et al. (2004) constructed a wireless measurement de-vice that uses a PPG ring communicating via bluetooth to a mobile device, with agood accuracy.
However, as promising as it looks, PTT seems to be yet confined to researchand lacks studies validating its use in an everyday life setting. The last techniquedescribed in this Section, Volume Clamp, has seen commercial application. VolumeClamp works by combining a PPG sensor and a small pressure cuff in the finger.

44 4 Mapping the Concepts
Briefly, the pressure cuff inflates to the same pressure of the artery. This pressur-ization of the cuff is controlled by the readings of the PPG sensor. FinapresTMis thefirst commercial application based on a prototype by Boehmer (1987). Finapres hasbeen validated by more than 150 studies and reviews and its accuracy is widely rec-ognized (Sorvoja 2006). PortapresTM, from Finapres Medical Systems, is a portableblood pressure monitor represented on Figure 4.12 that uses 2 PPG sensors toachieve better signal quality.
Fig. 4.12. Usage of Portapres. The sensors in the wrist and fingers communicate with the beltwhich has data storage capacity and a power source
Before attempting to determine an arousal level from blood pressure, the base-line for each individual must be determined. The standard procedure is for the per-son to stay relaxed for 5 minutes and move as little as possible (American HeartAssociation 2005). Once a baseline is determined, the arousal level can be deter-mined by measuring short-term rises. Nothing was found in literature concerningmethods for determining arousal levels from blood pressure but various studiesagree that there is a general rise in both systolic and diastolic blood pressure duringsituations of emotional arousal (e.g. Bernardi et al. 2000, Gerin et al. 2006).
Heart rate
Heart rate is measured in beats per minute (bpm). In a stress response, the heartis one of the first organs to react, with an increase in the bpm determined by awithdrawal of Parasympathetic influence and increased influence of the Sympatheticsystem. Extracting the heart rate from the PPG sensor is a matter of determiningexactly in which moment the ventricular contraction occurs (that is when the bloodis pumped out of the heart). This causes a peak in the PPG signal similar to theones observed in Figure 4.8(c) due to the fact that the blood volume in the arteriesincreases in this moment.
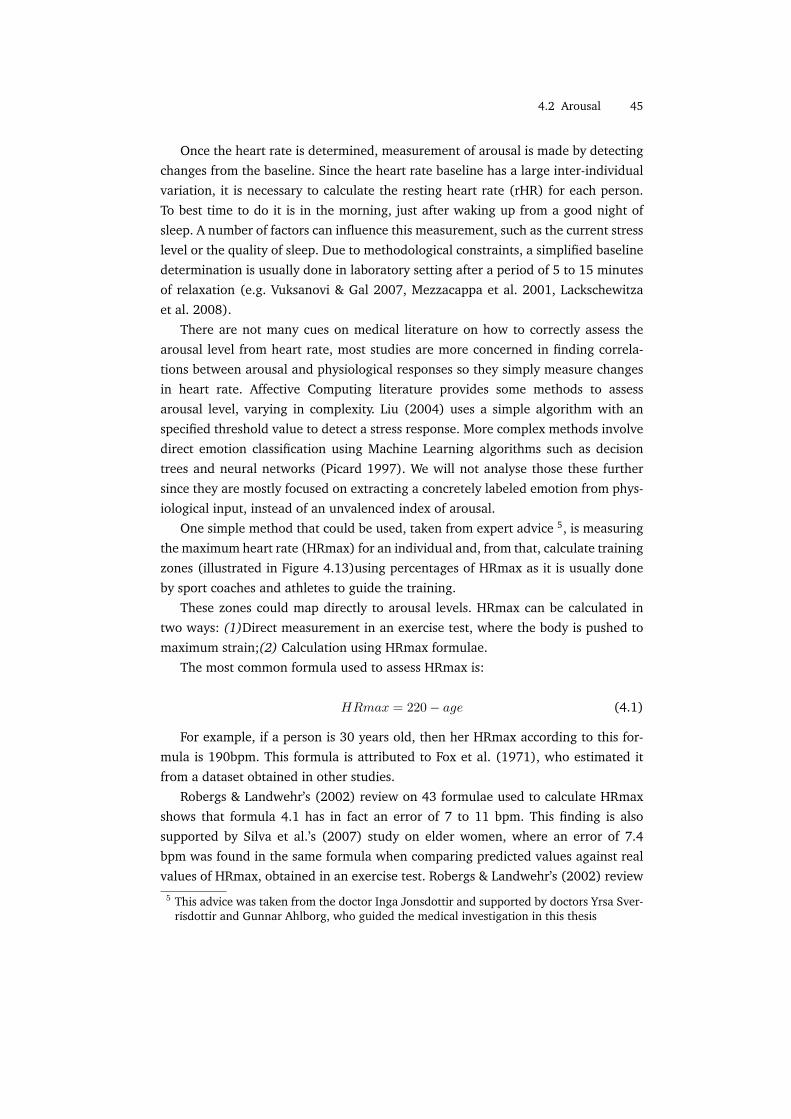
4.2 Arousal 45
Once the heart rate is determined, measurement of arousal is made by detectingchanges from the baseline. Since the heart rate baseline has a large inter-individualvariation, it is necessary to calculate the resting heart rate (rHR) for each person.To best time to do it is in the morning, just after waking up from a good night ofsleep. A number of factors can influence this measurement, such as the current stresslevel or the quality of sleep. Due to methodological constraints, a simplified baselinedetermination is usually done in laboratory setting after a period of 5 to 15 minutesof relaxation (e.g. Vuksanovi & Gal 2007, Mezzacappa et al. 2001, Lackschewitzaet al. 2008).
There are not many cues on medical literature on how to correctly assess thearousal level from heart rate, most studies are more concerned in finding correla-tions between arousal and physiological responses so they simply measure changesin heart rate. Affective Computing literature provides some methods to assessarousal level, varying in complexity. Liu (2004) uses a simple algorithm with anspecified threshold value to detect a stress response. More complex methods involvedirect emotion classification using Machine Learning algorithms such as decisiontrees and neural networks (Picard 1997). We will not analyse those these furthersince they are mostly focused on extracting a concretely labeled emotion from phys-iological input, instead of an unvalenced index of arousal.
One simple method that could be used, taken from expert advice 5, is measuringthe maximum heart rate (HRmax) for an individual and, from that, calculate trainingzones (illustrated in Figure 4.13)using percentages of HRmax as it is usually doneby sport coaches and athletes to guide the training.
These zones could map directly to arousal levels. HRmax can be calculated intwo ways: (1)Direct measurement in an exercise test, where the body is pushed tomaximum strain;(2) Calculation using HRmax formulae.
The most common formula used to assess HRmax is:
HRmax = 220! age (4.1)
For example, if a person is 30 years old, then her HRmax according to this for-mula is 190bpm. This formula is attributed to Fox et al. (1971), who estimated itfrom a dataset obtained in other studies.
Robergs & Landwehr’s (2002) review on 43 formulae used to calculate HRmaxshows that formula 4.1 has in fact an error of 7 to 11 bpm. This finding is alsosupported by Silva et al.’s (2007) study on elder women, where an error of 7.4bpm was found in the same formula when comparing predicted values against realvalues of HRmax, obtained in an exercise test. Robergs & Landwehr’s (2002) review5 This advice was taken from the doctor Inga Jonsdottir and supported by doctors Yrsa Sver-
risdottir and Gunnar Ahlborg, who guided the medical investigation in this thesis
46 4 Mapping the Concepts
Fig. 4.13. Training Zones for exercise estimated from the formula HRmax = 220 - age
concludes that there is currently no acceptable formula and points to the fact that, tocalculate a correct HRmax, an ideal formula should take into account more than justage; it should also consider physical fitness as well as mode of exercise 6 , as HRmaxcan be different depending on the type of activity. HRmax could also be possiblydifferent for emotional arousal, but there are currently no studies published on thismatter. From the reviewed formulae, the one with smaller error was published byInbar et al. (1994):
HRmax = 205.8! 0.685(age) (4.2)
This formula has an error of 6.4 bpm, which was considered unacceptable forscientific and clinical purposes (Robergs & Landwehr 2002) but might still be ac-ceptable for the Affective Health system, as it is not intended to make a diagnostictool but rather to give clues about the overall state of the body.
Heart rate variability
Heart rate variability is defined as the natural occurring variation in time betweentwo consecutive peaks in the ECG or PPG signals. The method for obtaining it fromPPG sensors is similar to heart rate, described in the previous section. According toChang et al. (2007), caution should be used when extracting HRV from a PPG signal,6 A mode of exercise is a type of exercise. Modes of exercise can be cycling, running, weight
training, among others.

4.2 Arousal 47
as differences were found when comparing the HRV results extracted from ECG andPPG recordings.
Each interval between two consecutive peaks is called normal-to-normal (NN)interval. HRV can be represented as a time series of NN intervals (all the analysismethods further described will assume this).
Fig. 4.14. Heart rate variability shown as the variation of the interval between two heartbeats.It can be represented in seconds or in beats-per-minute
Measures of HRV have been shown to correlate inversely with heart rate (Ungiet al. 1995, Mandanmohan et al. 2005), making HRV at least as reliable as heart rateto detect arousal. HRV contains more information than HR, which makes it possibleto discriminate between Sympathetic and Parasympathetic components of the ANSinfluence on the heart. There are several possible methods used when analysingHRV. The comprehensive review from the The Task Force of the European Societyof Cardiology (Electrophysiology 1996) divides these methods in three categories,explained later in detail:
Time Domain methods are the simplest category of methods. This category is fur-ther subdivided in statistical and geometrical methods
Frequency Domain methods which are obtained from analysing how the varianceof the NN intervals is distributed as a function of the frequency
Nonlinear methods uncover the nonlinear phenomena involved in the genesis ofHRV like the influence, on the heart, of complex homeostatic interactions be-tween different systems in the human body
The Task Force standardized the measurement of HRV, recommending 5 minuterecordings to analyse short-term variations and 24 hour recordings to measure long-term trends. Both Time Domain and Frequency Domain methods can be used forshort-term recordings but when recording in long-term, Time Domain is preferred.

48 4 Mapping the Concepts
No recommendations are done regarding Nonlinear methods. Measure of arousal istypically made in short-term recordings (Electrophysiology 1996).
Methods of Time Domain are typically averages, variations, histograms or geo-metrical methods like the calculation of density distribution of the NN intervals. Ta-ble 4.1 describes the methods recommended by (Electrophysiology 1996) to studyHRV in the time domain.
Variable Units DescriptionSDNN milliseconds Standard deviation of all NN in-
tervalsSDANN milliseconds Standard deviation of the aver-
ages of NN intervals in all 5-minute segments of the entirerecording
rMSSD milliseconds The square root of the mean ofthe sum of the squares of differ-ences between adjacent NN in-tervals
HRV Triangular Index no unit Total number of all NN intervalsdivided by the height of the his-togram of all NN intervals mea-sured on a discrete scale
Table 4.1. Time domain methods recommended by Task Force of the European Society ofCardiology
Ten studies were selected from literature to illustrate the role of HRV analysisin assessing physiological stress responses to different kinds of stressors. These aresummarized in Table 4.2. We are now going through the results from these studiesone by one.
A study by Montebugnoli et al. (2004) with 25 health men and women foundthat SDNN was a highly sensitive indicator of stress during dental extractions, be-coming lower during the extraction period. This index of HRV reflected changesduring arousal more accurately than heart rate (also measured), making it a betterindicator on arousal in this study. Another study (Lackschewitza et al. 2008) per-formed with hyperactive patients in a laboratory setting during a Trier Social StressTest 7, also found SDNN to be discriminative between stressful and relaxed situa-tions. SDNN is capable to measure longer periods of exposure to a stressor as shownin a study by Ushiyama et al. (2008) where this method was applied in 24 patientsbefore and during the recovery time from a non cardiac medical surgery. SDNN de-7 Trier Social Stress Test is a tool created by Kirschbaum et al. (1993) for inducing stress in
laboratory conditions. It contains periods of anticipatory stress, public speech and mentalarithmetic task.

4.2 Arousal 49
Study Stressor HRV feature and behaviourMontebugnoli et al. (2004) Dental extraction SDNN reduced (more sensitive
than heart rate)Lackschewitza et al. (2008) Trier Social Stress Test SDNN reduced, rMSSD reduced;
LF higher; HF reducedUshiyama et al. (2008) Surgery SDNNreduced and rises with re-
covery; HRV Triangular Index re-duced and rises with recovery
Mezzacappa et al. (2001) Mental Stress rMSSD reducedKomatsu et al. (2007) Interaction with an Agent HFpower reduced; LF power riseCastro et al. (2008) Arithmetic Stress HFpower reduced; LF power riseMoriguchi et al. (1992) Arithmetic Stress HFpower reduced; LFpower riseBernardi et al. (2000) Reading, free talking,
mental stressLF power increased with mentalstress and talking
Vuksanovi & Gal (2007) Mathematical task withvocalization
HF rises with half of the subjects;HF reduced for the rest; short-term scaling component and Sam-pEn associated with HF rise;LLEassociated with HF fall
Terkelsen et al. (2005) Mental stress and pain Pain rises LF and causes nochange in SDNN and HF; men-tal stress during pain causes nochange
Table 4.2. Summary of ten studies analysed concerning HRV and stress responses
creased significantly before the surgery and recovered gradually during the 7 daypostoperative period. HRV Triangular Index, usually used as a measure of overallHRV, was also calculated in this study with similar correlation with recovery (lowerbefore the operation and higher after 7 days of recovery). Ushiyama et al.’s (2008)study goes further by analysing the differences, on these indexes of HRV, in the lastday of recovery between patients that had a normal recuperation and patients withpostoperative complications; the ones who recovered normally had a significantlyhigher HRV Triangular Index. Another variable of the Time Domain, rMSSD, wasfound in different studies (e.g. Lackschewitza et al. 2008, Mezzacappa et al. 2001)to become lower during periods of exposure to a stressor and to rise during relax-ation periods. This variable has been seen as a direct measure of Parasympatheticinfluence on the heart (Electrophysiology 1996, Mezzacappa et al. 2001). No studieswere found in literature relating SDANN to arousal level.
Any time series can be seen as a composition of sines and cosines with distinctfrequencies. As we are assuming a time series representation of HRV, it is possiblealso to analyse the signal using Frequency Domain methods. Frequency Domain vari-ables are obtained by means of power spectral density (PSD) analysis, usually donein HRV with the application of an algorithm called Fast Fourier Transform (FFT).

50 4 Mapping the Concepts
FFT transforms the signal into sinusoidal oscillations with distinct frequencies andamplitudes. For each oscilation associated with a certain frequency, the amplitudedetermines its contribution (power) to the signal (Seely & Macklem 2004).
Fig. 4.15. Power spectral density distribution of HRV. Two frequency bands are distinguished:low frequency and high frequency.
The result, shown in Figure 4.15, is a power distribution in frequency of theHRV signal. Two distinct frequency bands in the power distribution are identifiedwith peaks in power. The high-frequency (HF) (0.18-0.4Hz) band is commonly asso-ciated with Parasympathetic activity and the low-frequency (LF) band (0.04-0.15Hz)is mediated by both Sympathetic and Parasympathetic nervous systems (Akselrodet al. 1981, Pomeranz et al. 1985), though the exact meaning is not yet determined.There are two other bands identified as very-low frequency (VLF) and ultra-low fre-quency (ULF) in the review from Electrophysiology (1996); however, as the phys-iological explanation for these bands is not yet established on short-term analysis(the one necessary for measurement of stress responses) we will ignore them in thisSection for simplicity.
From the LF and HF bands, it is possible to estimate autonomic regulation of theheart. HF has been found to be synchronous with respiration (Bernardi et al. 2000)and a good measure of RSA (the acceleration and deceleration of the heart ratefollowing respiration, explained in the beginning of this Section).
Komatsu et al. made a study (Komatsu et al. 2007) employing frequency methodsto monitor HRV in subjects during a planned stressful interaction with an artificialagent. They found that, when the interaction was reported stressful by the subjects,the HF would be lower than the LF power, denoting a loss of RSA and Parasympa-thetic activity. Lower HF power and higher LF power during aroused states is alsoreported by many studies (e.g. Castro et al. 2008, Moriguchi et al. 1992, Lacksche-witza et al. 2008). However, just looking at the power of these two bands can be

4.2 Arousal 51
deceiving as reported in a study by Bernardi et al. (2000), where it was found thattalking could affect the whole spectrum because it causes faster breathing and thusa big shift on the spectrum to the LF part. This was referred as well in (Vuksanovi &Gal 2007), where subjects were asked to perform a mathematical task with vocaliza-tion. In this study it was also found that the HF response to stress has inter-individualdifferences: in some of the people the power rises and in others the HF power islower. Besides this, Terkelsen et al. (2005) reported lack of change in the powerspectrum of HRV in pain when the subject is in mental stress, while still causing arise in heart rate.
Finally, Nonlinear analysis of HRV employ methods from nonlinear dynamics.Nonlinear dynamics, as defined in CancerWEB (1997), is the study of systemswho react nonlinearly to initial conditions or perturbing stimuli. Biological systemsusually display nonlinear dynamics and chaos 8 behaviour. Variation in heart ratealso exhibit this behaviour (Seely & Macklem 2004, Goldberger et al. 2002, Penget al. 1995) . There is great number of methods in this category but the Task Force(Electrophysiology 1996) concluded that research is still needed before these meth-ods can be safely used in physiological studies and clinical settings. More recentinvestigation associates these indexes with progression to heart diseases (as pre-dictors) and aging (e.g. Perkiomaki et al. 2000, Schumann et al. 2002). A studyfrom Vuksanovi & Gal (2007) found that 3 indexes were correlated with stress re-sponse: Sample Entropy (SampEn), a nonlinear index of entropy 9 ; Largest Lyapunovexponent (LLE), an index that measures amount of chaos (i.e. sensibility to initialconditions); and short-term scaling component. Unfortunately the behaviour of thisindexes was different between groups of individuals and it was not possible to es-tablish a baseline.
To map these features to an arousal level, the baseline for each one would have tobe determined in the same way that was described for heart rate. Extracting arousallevels from HRV would depend on which feature to use. If we use features fromthe Time Domain, then the individual maximum for each feature can be determinedfrom an exercise test, where the heart is pushed to the limit and, from that, calculatearousal level zones. For Frequency methods, the ratio LF/HF could be used since itseems to map to arousal level in most of the studies. There was not enough evidencein the literature supporting the use of nonlinear analysis of HRV to map to arousal.8 Chaos is defined as an extreme sensitivity to initial conditions. Chaotic systems often seem
random, but this is due to the interference from the initial conditions9 Entropy is defined in the dictionary (CancerWEB 1997) as “The amount of disorder in a
system”. It measures the randomness in a system.

52 4 Mapping the Concepts
4.2.3 Evaluation
All of the features analysed constitute validated measures of Arousal. EDA in par-ticular is very sensible to subtle changes in arousal and provides a measure of theactivity of the sympathetic system.
Measuring cardiovascular parameters differs in complexity. Heart rate and arte-rial blood pressure are the simplest. On the other side, HRV can discriminate be-tween different components of the ANS, containing more information about physio-logical arousal. Besides that, it was shown in the study by Montebugnoli et al. (2004)to be more sensitive to changes in arousal than heart rate. There are more features inHRV than the ones that were analysed in this Section (Electrophysiology 1996). Theselection of features to analyse further was based on recommendations of the TaskForce of the European Society of Cardiology, their representation in literature andproven correlation with arousal. In particular, features from the Time Domain, likeSDNN or rMSSD seem to be very good indicators of arousal. rMSSD was also shownto be a good direct indicator of parasympathetic activity in one everyday life setting(Goedhart et al. 2007) when compared to others like HF from frequency analysis.Frequency domain indexes, when used outside of a specific setting, behave some-times in unpredictable ways (Bernardi et al. 2000, Vuksanovi & Gal 2007). Furtherresearch might be needed to know exactly how the complex interplay between HFand LF works and what is the exact meaning of these bands.
From this analysis, we are left with four possible features: skin conductance re-sponses, blood pressure, heart rate and HRV in Time Domain. Figure 4.16 shows therequirement compliance of the input methods related with Arousal.
The only ambulatory blood pressure sensor that as seen application outside ofa laboratory setting, Portapres, also does not comply with requirements 2 and 3because it needs three points of measurement (wrist and two fingertips) with wiresconnecting them, which obstructs the free use of hands.
Heart rate and HRV can be measured from one PPG sensor in the wrist or ina ring. Both method and features comply with all the requirements enunciated inSection 3.4. However, even the simplest Time Domain methods of HRV analysis aremore sensitive to measurement errors than heart rate. This happens because heartrate is determined as an average of peaks in the PPG signal and HRV is characterizedby all the inter-beat intervals. Chang et al. (2007) reports differences in indexes ofHRV analysis in signals, from the same subject, collected simultaneously from ECGand PPG sensors. Even if the difference was not considered statistically significant,there were cases where it reached almost 20%. These facts make HRV indexes lessstrong compared to heart rate when it comes to satisfying requirement 4.
Heart rate has been shown to correlate significantly with skin conductance. Fig-ure 4.17 shows an example of that, where heart rate was calculated from an ECG

4.2 Arousal 53
Fig. 4.16. Sensor requirement compliance in Arousal cardiovascular input methods
signal by selecting peaks in 15 second intervals where the heart accelerates and thenrunning an average in each interval (Malmstrom et al. 1965).
Fig. 4.17. Heart rate correlation with skin conductivity after applying Malmstrom et al.’s(1965) method
The apparatus needed to correctly extract skin conductivity need to be placed,on the body, where most of the emotional sweat (caused by eccrine glands) occurs.This places, typically the forehead, palms and soles of the feet, require obtrusive andpossibly uncomfortable sensors. Research in Affective Computing produced artifactsthat minimize this discomfort, like a thin glove (Picard & Scheirer 2001). However,
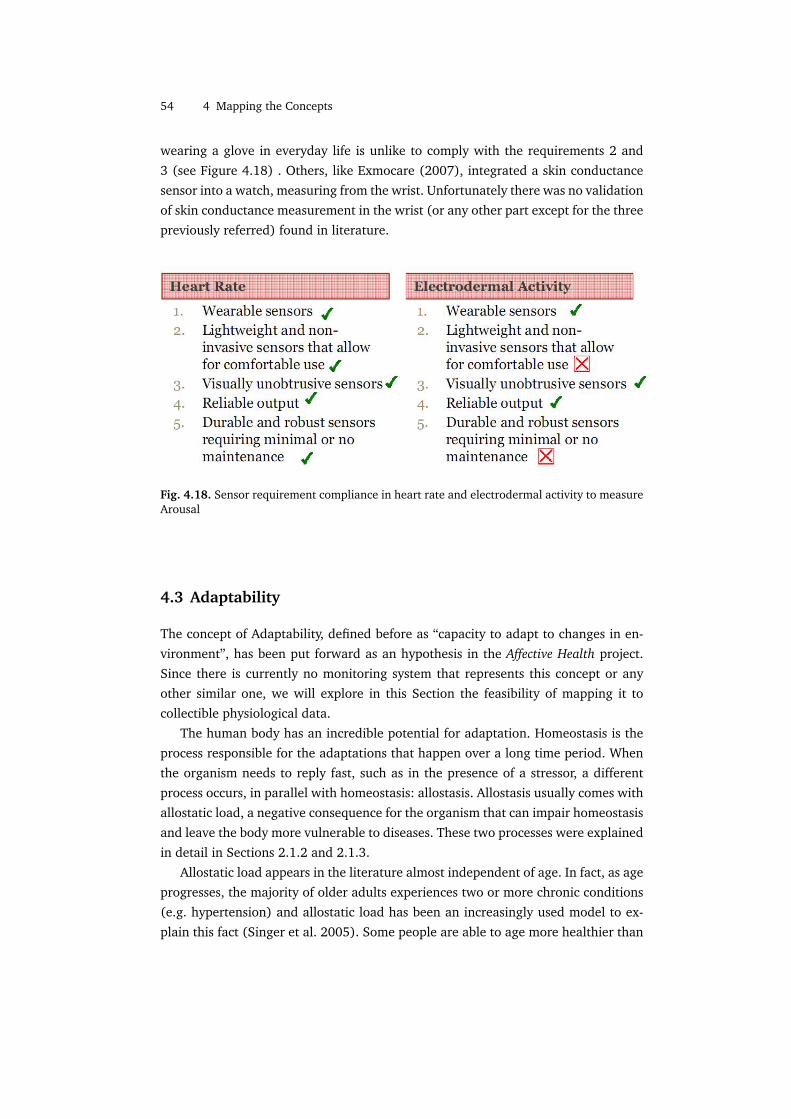
54 4 Mapping the Concepts
wearing a glove in everyday life is unlike to comply with the requirements 2 and3 (see Figure 4.18) . Others, like Exmocare (2007), integrated a skin conductancesensor into a watch, measuring from the wrist. Unfortunately there was no validationof skin conductance measurement in the wrist (or any other part except for the threepreviously referred) found in literature.
Fig. 4.18. Sensor requirement compliance in heart rate and electrodermal activity to measureArousal
4.3 Adaptability
The concept of Adaptability, defined before as “capacity to adapt to changes in en-vironment”, has been put forward as an hypothesis in the Affective Health project.Since there is currently no monitoring system that represents this concept or anyother similar one, we will explore in this Section the feasibility of mapping it tocollectible physiological data.
The human body has an incredible potential for adaptation. Homeostasis is theprocess responsible for the adaptations that happen over a long time period. Whenthe organism needs to reply fast, such as in the presence of a stressor, a differentprocess occurs, in parallel with homeostasis: allostasis. Allostasis usually comes withallostatic load, a negative consequence for the organism that can impair homeostasisand leave the body more vulnerable to diseases. These two processes were explainedin detail in Sections 2.1.2 and 2.1.3.
Allostatic load appears in the literature almost independent of age. In fact, as ageprogresses, the majority of older adults experiences two or more chronic conditions(e.g. hypertension) and allostatic load has been an increasingly used model to ex-plain this fact (Singer et al. 2005). Some people are able to age more healthier than

4.3 Adaptability 55
others and this fact appears to be associated with healthy habits (e.g. not smoking,exercise) and less exposure to stress. Nielsen et al. (2007) review current evidenceof allostatic load on literature and notice the large inter-individual differences whenit comes to healthy aging and response to stressors, based on personality, gender,social and cultural environments.
The investigation on how to measure allostatic load on acute stress responsesand discovery of biomarkers of accumulated damage from stress is currently on aearly stage, but with an increasing number of studies being published on the sub-ject (Loucksa et al. 2008). A biomarker can simply be a physiological index (e.g.blood pressure) that can measure the effects of allostatic load. Figure 4.19 showswhat would be the “perfect” biomarker (allostatic load, given as an example of abiomarker, can be estimated by a physiological index).
Fig. 4.19. Imperfection of biomarkers of allostatic load. Extracted from (Loucksa et al. 2008)
The perfect biomarker would predict entirely the outcome, shown by paths Aand B in Figure 4.19, that can be a predisposition to diseases. However, the currentreality is that we still do not have a perfect biomarker that can capture all the aspectsof exposure to stress (path C). In addition, all the biomarkers that can be capturedby current technology are merely approximations of the internal processes of thebody (path D).
Knowing this, if we consider mapping Adaptability to a marker of allostatic load,we should not aim to get a true value with clinical use potential, since the sensingtechnologies used in the research of allostatic load are still far away from being im-plementable in a wearable sensor (e.g. currently one the best biomarkers discoveredso far is the number of cells of the immune system (Loucksa et al. 2008), measur-able only by microsensors in a laboratory setting). Instead, the investigation will bedriven by a “best-effort” goal.
56 4 Mapping the Concepts
In a study conducted by Seeman et al. (1997), it was found that degeneration byallostatic load in ten physiological variables related with the activity of the ANS andHPA could predict cardiovascular risk and mortality in a 2.5 year follow up. Most ofthe data used in this study cannot be measured non-invasively as the variables usedwere mainly related with concentration in the blood of several hormones relatedwith autonomic regulation. Cardiovascular markers were, however, in the list ofpredictors.
Measurable cardiovascular markers that account for the cumulative damage ofallostatic load from stress were already explored in this thesis, associated withArousal (in Section 4.2): heart rate, HRV and arterial blood pressure (Lucini et al.2005, Brady & Matthews 2006). Lucini et al. found that individuals being exposedfor a long time to stress are characterized by having higher blood pressure and a pre-dominant sympathetic activity (assessed by heart rate of HRV analysis). High bloodpressure, not only is directly associated with stress, but also appears as a majorphysiological marker of increased cardiovascular risk (Alberti et al. 2005).
Besides cardiovascular markers, one other important marker that is affected byexposure to stress is sleep quality. Low sleep quality is both a marker of the conse-quences of stress (Morin et al. 2003, Winwood & Lushington 2006) and a generatorof allostatic load, since the body cannot recover during sleep (Cauter et al. 1997, Ek-stedt et al. 2003).
Sleep and cardiovascular markers will be analysed during this Section, testing iftheir validity and measurement techniques are qualifying enough to be included inAffective Health.
4.3.1 Cardiovascular markers
Besides arterial blood pressure and increased sympathetic activity, we can exploreone other possible marker: nonlinear indexes of HRV.
Nonlinear analysis of many biological systems reveals a complex behaviour char-acterized by multiple interconnected feedback loops. In presence of disease or aging(both characterized by accumulated allostatic load), these loops breakdown and thesystems usually reveal a less complex behaviour. For example, EEG signals have lessentropy in presence of anaesthesia and respiratory variability as well as the entropyof the concentration of growth hormone in the blood, both decline with age (Seely& Macklem 2004).
Many studies associate loss of complexity in HRV (given by different indexes)with loss of health and aging (e.g. Schumann et al. 2002, Bojorges-Valdez et al.2007, Goldberger et al. 2002, Peng et al. 1995, Seely & Macklem 2004). However,none of the articles reviewed in literature found a direct and independent correlationbetween nonlinear analysis of HRV and long term exposure to stress.

4.3 Adaptability 57
Arterial blood pressure
Blood pressure measurement was analysed previously in Section 4.2.2. In particular,it has been noted that the available methods of measurement did not comply withthe requirements defined for Affective Health. However, the amount of evidence inliterature supporting the use of this cardiovascular marker for measuring allostaticload deserves further analysis. In this section we will only explore the utility ofmeasuring blood pressure for Adaptability.
According to American Heart Association (2005), “Blood pressure is a powerful,consistent, and independent risk factor for cardiovascular disease and renal disease”,with more than a half of the United States population having average values of bloodpressure above the normal range (systolic blood pressure of 120 to 139 mm Hg ordiastolic blood pressure of 80 to 89 mm Hg). American Heart Association pointto three potential measures of blood pressure that are associated with increasedrisk: average level, diurnal variation and short-term variability. Average level is themost known and more related with allostatic load but it has also been referred thatsubjects whose blood pressure value does not go down during the night are at mostrisk than those who do, even if their average is the same. So diurnal variations shouldalso be taken into account. Short-term variability appears defined in literature inmany ways. One type of variability is the reactivity to stressors, and that will beexplored in the Section devoted to reactivity, later in this Chapter.
American Heart Association (2005) defined standard normal average values forambulatory (everyday life) blood pressure recording. These values are higher thanthe normal values usually defined for blood pressure, when the measurement ismade by a doctor and the subject is relaxed, because they have to account for normalarousal and physical activity that happens during the day. They are expressed in theTable 4.3.
Optimal Normal AbnormalDaytime <130/80 <135/85 >140/90Nighttime <115/65 <120/70 >125/7524-Hour <125/75 <130/80 >135/85
Table 4.3. Table of normal average ambulatory values (in mm Hg) of blood pressure duringdifferent time spans. The two values appearing in each cell are the systolic and diastolic bloodpressures, separated by a ’/’. Extracted from (American Heart Association 2005).
The association between blood pressure and long exposure to stress can be foundin several studies (e.g. O’Connor et al. 2001, Lucini et al. 2005). Guimont et al.(2006) analysed the progression of blood pressure of 6719 white-collar workers(men and women) during 7.5 years, compared with job strain. They have found

58 4 Mapping the Concepts
that having a high demand job with low social support (which is associated withstress) is correlated with significant, but modest, increases in systolic blood pressure.Lucini et al. also had similar results with a smaller group of subjects (126) whoreported symptoms of chronic stress. The measurements of blood pressure in boththese studies have been done in an laboratory setting.
Other studies (Schnall et al. 1998, Vrijkotte et al. 2000, Landsbergis et al. 2003)performed in an ambulatory setting also found a significant increase of approxi-mately 4 mm Hg in average systolic blood pressure for people that self-reportedlong-term exposure to stress. Diastolic blood pressure was also affected in all ofthem, but less significantly. Moreover, these changes are also present at night, de-noting that the increased blood pressure is not only a consequence of arousal andphysical activity during the day, but a chronic state directly associated with long-term exposure to stress and an incapacity to relax.
Sympathetic predominance
Julius (1993) reviewed literature evidence on hypertension (i.e. a chronic conditiondefined as having a blood pressure >140/90) and points to the fact that developinga chronically high blood pressure later in life is predictable by having an earlier in-creased activity of the Sympathetic nervous system. This is fundamented by longitu-dinal studies where healthy subjects with higher heart rate have a higher probabilityof developing, over the course of the years, hypertension or associated symptoms.A presumed hyperactivity of the Sympathetic nervous system may be explained byfrequent activation during responses to stressors (Julius 1993).
This is also independently confirmed by some of the studies previously anal-ysed when exploring blood pressure, also measuring other markers associated withthe activity of the Sympathetic and Parasympathetic nervous systems. Lucini et al.(2005) found that, besides an increased blood pressure, chronically stressed peoplehave higher LF power and lower HF power on the Frequency Domain analysis ofHRV. As explained before, the HF appears to be associated with the Parasympatheticsystem and the LF band has both Sympathetic and Parasympathetic influences. Thefindings that a decreased Parasympathetic activity is associated with chronic stressare supported also by other studies (e.g. Thayer & Sternberg 2006) Lucini et al. didnot report a higher heart rate for people suffering from chronic stress.
Vrijkotte et al. (2000) found an higher heart rate and lower influence of theParasympathetic influence on the heart assessed by an index of the Time Domainanalysis of HRV: rMSSD. These measurements were taken in an everyday life settingduring the course of three days. Figure 4.20 shows the variation of these variablesover the course of days.
Heart rate recovers almost totally in the stressed group and controls, but rMSSDcan be used to distinguish groups even during sleep. Vrijkotte et al. go further by

4.3 Adaptability 59
Fig. 4.20. Changes in heart rate and rMSSD during the course of three days for a high stressedgroup and a group of controls. The line with black dots represent the high stressed group andthe line with white dots represent the controls. Adapted from (Vrijkotte et al. 2000)
proposing the average value of rMSSD during sleep as a probability predictor formild hypertension, a state that occurs before hypertension. However, it has beennoticed that there are not still many studies regarding cardiovascular recuperationduring sleep as a direct consequence of stress, so this matter requires more extensivestudying (Myllymoki 2006).
Increased reactivity of cardiovascular indexes (heart rate, HRV and blood pres-sure) to stress and delayed recovery to baseline also is related with sympatheticpredominance. It has been shown that people who have been exposed to long peri-ods of stress react more vigorously to stressors (e.g. Lepore et al. 1997), exhibitingan exaggerated physiological response. Vrijkotte et al. also refers this association inthe same reported study. In a study with adolescents, Matthews et al. (2003) con-cludes that blood pressure reactivity predicts future blood pressure average in ado-lescents, with the high-reactive subjects developing high blood pressure later in life.However, there is also evidence in literature showing that cardiovascular reactivityin controlled settings depends on the kind of stressor (Nealey-Moore et al. 2007)and personality of the individual (Ivancevich 1987). One meta-review (Gump &Matthews 1999) analysed 19 studies related with reactivity and recovery in subjects
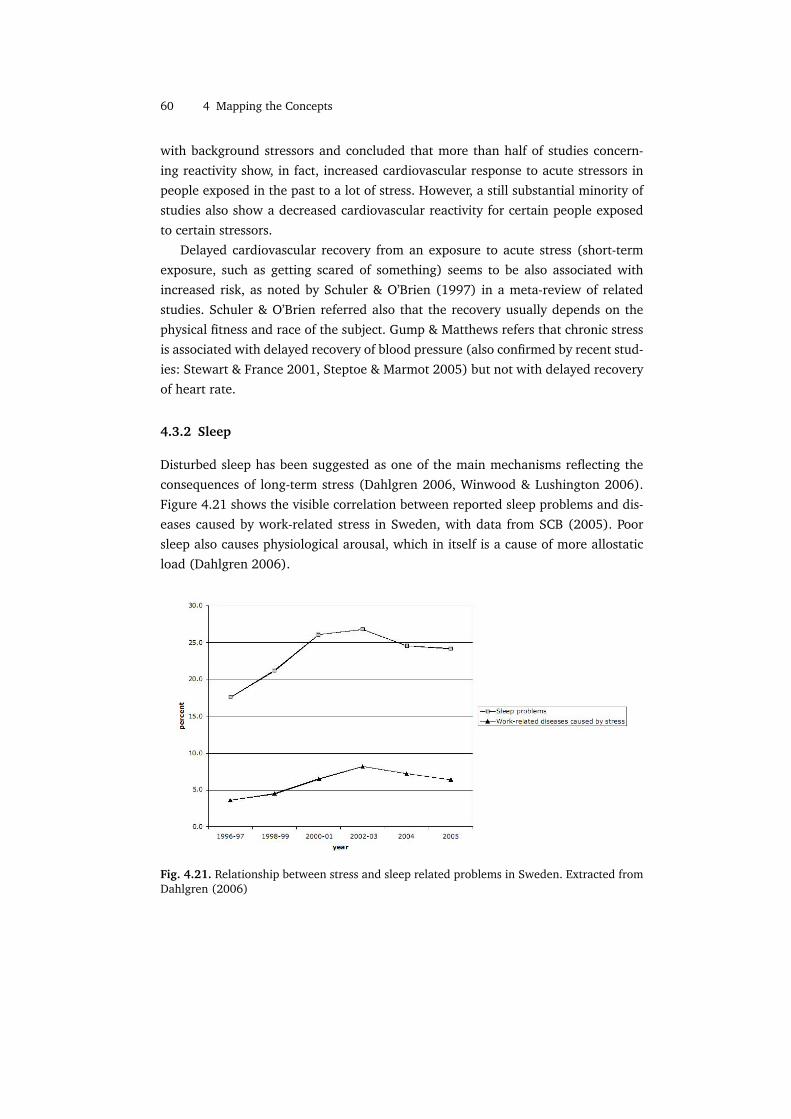
60 4 Mapping the Concepts
with background stressors and concluded that more than half of studies concern-ing reactivity show, in fact, increased cardiovascular response to acute stressors inpeople exposed in the past to a lot of stress. However, a still substantial minority ofstudies also show a decreased cardiovascular reactivity for certain people exposedto certain stressors.
Delayed cardiovascular recovery from an exposure to acute stress (short-termexposure, such as getting scared of something) seems to be also associated withincreased risk, as noted by Schuler & O’Brien (1997) in a meta-review of relatedstudies. Schuler & O’Brien referred also that the recovery usually depends on thephysical fitness and race of the subject. Gump & Matthews refers that chronic stressis associated with delayed recovery of blood pressure (also confirmed by recent stud-ies: Stewart & France 2001, Steptoe & Marmot 2005) but not with delayed recoveryof heart rate.
4.3.2 Sleep
Disturbed sleep has been suggested as one of the main mechanisms reflecting theconsequences of long-term stress (Dahlgren 2006, Winwood & Lushington 2006).Figure 4.21 shows the visible correlation between reported sleep problems and dis-eases caused by work-related stress in Sweden, with data from SCB (2005). Poorsleep also causes physiological arousal, which in itself is a cause of more allostaticload (Dahlgren 2006).
Fig. 4.21. Relationship between stress and sleep related problems in Sweden. Extracted fromDahlgren (2006)

4.3 Adaptability 61
Clinical assessment of sleep is usually done by a method called polysomnography,which measures brain waves, muscle tension and eye movement (Tryon 2004). Witha polysomnograph, it is possible to detect sleep stages and physiological activityduring sleep. This method, however, is expensive and time demanding (Dahlgren2006) and does not qualify for continuous sleep measurement in an everyday lifesetting. It is also possible to measure sleep by identifying periods of activity and restwith a wrist worn accelerometer (Tryon 2004, Jean-Louis et al. 2001). Tryon showedthat accelerometery and polysomnography have high correlations: 0.72 to 0.98 fortotal sleep period, 0.56 to 0.91 for sleep efficiency10 and 0.49 to 0.87 for beginningof waking up after sleep. Figure 4.22 shows a typical output from an accelerometerduring wake and sleep times.
Fig. 4.22. Graph of physical activity a 24 hour period. Adapted from (Jean-Louis et al. 2001)
As it may be difficult to detect sleep time automatically (because the outputof an accelerometer for periods of very low physical activity are similar to sleepperiods), Tryon proposes that the sensors have “lights-off” and “lights-on” buttonsin order to help the estimation of sleep time. The buttons should be pressed by theuser when she goes to sleep and when she wakes up. Even if this might result ina overestimation of sleep period, the method is normally used in sleep assessmentstudies (e.g. Garnier & Benefice 2006) and has been shown to improve substantiallythe reliability of the method (Tryon 2004).
Besides the determination of sleep time and sleep efficiency, one other methodused to assess sleep is measuring sleep fragmentation. Fragmentation is defined byshort-term increases in arousal during sleep time. Ekstedt et al. (2003) measuredbrain waves during sleep to detect arousal and found that subjects that exhibitedmore than 8 rises in arousal during deep sleep stages have increased blood pres-sure and other markers of allostatic load by chronic stress. It has been shown thatHRV analysis during sleep can detect sleep fragmentation periods, by assessing Sym-pathetic and Parasympathetic activities (Sforza et al. 2007). The authors proposefrequency analysis to derive features like LF and HF. During sleep fragmentation pe-10 Sleep efficiency is defined as the ratio of total sleep time to time in bed.

62 4 Mapping the Concepts
riods, LF is higher than HF. Slight increases in heart rate and blood pressure couldbe also observed. Other authors (e.g. Sforzaa et al. 2004, Hayward 2004) have alsofound short-term increases in heart rate and blood pressure during fragmentationperiods.
4.3.3 Evaluation
The most validated method for assessing the cumulative damage of allostatic loadis the measurement of blood pressure. From the analysis carried on in Section 4.2(Arousal) it was concluded that the only sufficiently validated biosensor capable ofmeasuring blood pressure in an everyday life setting without causing much discom-fort, Portapres, still does not comply with the requirements 2 and 3 defined in thisthesis for the input methods since obstructs the use of the hands.
Analysing the health implications of having a high blood pressure, however, pro-vided background to justify other cardiovascular markers like having a pronouncedSympathetic drive to the heart. A predominant Sympathetic activity seems to be cor-related with future high blood pressure (Julius 1993), which could mean that a fea-ture related with low Parasympathetic or high Sympathetic tone is an earlier predic-tor of future cardiovascular risk. Features produced from HRV analysis seem to havethis quality and have been shown to be related with long-term exposure to stress(Vrijkotte et al. 2000, Lucini et al. 2005). Frequency analysis indexes of HRV (likeLF and HF powers) seem however to be strongly influenced by respiration, talkingand body postures (e.g. Vuksanovi & Gal 2007, Electrophysiology 1996). Featuresfrom the Time Domain analysis of HRV are very sensitive to errors from sensors,especially when it is done in a large amount of data (Seely & Macklem 2004), andPPG sensors, though have been shown to be sufficiently good to derive heart rate,may not be good enough to provide high quality data needed for HRV analysis in anambulatory setting (Chang et al. 2007). So HRV analysis is against the requirement4, concerning reliability. This has been already pointed out in the Arousal section,but this statement is stronger when it concerns Adaptability, because a large amountof data is needed to derive meaningful features like the average of rMSSD during thenight period in the study by Vrijkotte et al. (2000).Alternatively, a chronically highheart rate can be used to assess continuous predominance of Sympathetic influenceon the heart.
Increased reactivity and delayed recovery from acute stress are not sufficientlysupported in the literature, as pointed out by Gump & Matthews (1999) and Schuler& O’Brien (1997). This is true also for long-term recovery, like the one happeningduring the night after a stressful day at work (Myllymoki 2006).
The relationship of poor sleep and chronic stress has a strong background in theliterature (e.g. Morin et al. 2003, Winwood & Lushington 2006, Dahlgren 2006).

4.3 Adaptability 63
Sleep quality and total sleep time can be measured by an accelerometer in the wrist,which complies with all the requirements. One other feature related to sleep mea-surement is fragmentation, which can be assessed by short-term increases in heartrate. Heart rate can also be measured with total compliance with the requirementsby PPG ring or a PPG wrist sensor.


! 5
Results
The analysis carried on in the previous Chapter provided various methods of inputand possible features with the potential to map to the concepts of Physical Activity,Arousal and Adaptability. The analysis was mostly based on literature but some so-lutions were filtered because of non compliance with the requirements defined inSection 3.4. Therefore, the results presented here are an integration of the evalua-tions made before. Table 5.1 resumes the biosensors and features in physiologicaldata that were found to have sufficient support in literature while satisfying therequirements of Affective Health.
Sensor FeaturePhysical Activity Accelerometer Counts / Epochs
Pedometer StepsArousal PPG Heart rate
HRV Time DomainAdaptability Accelerometer Sleep time
PPG Sleep qualitySleep fragmentationHeart rate
Table 5.1. Resume of the input methods that satisfy the requirements of Affective Health
Two methods of input were given as alternatives for Physical Activity: accelerom-etry and pedometry. As accelerometers can also be used to assess sleep quality forAdaptability, it is natural to choose accelerometers as well for Physical Activity, asthis will reduce the size and weight of the sensor array and improve comfort (re-quirements 2 and 3). Furthermore, accelerometers can be used to reduce errorsderived from movement in the PPG signal (Asada et al. 2004) and can also be con-figured to measure steps as well (Ying et al. 2007), thus making accelerometry amore flexible and reliable solution.

66 5 Results
As for Arousal, two different features are presented that can be derived from PPGsensors. Heart rate and HRV features have been shown to have a negative correla-tion (Ungi et al. 1995, Mandanmohan et al. 2005) and, in particular, HRV featuresseem to be more sensitive to acute stress responses (Montebugnoli et al. 2004).HRV is also sensitive to body postures and simple movements like a tilt in the head(Electrophysiology 1996). This extra sensitivity might overestimate Arousal for aneveryday life setting. Thus heart rate appears as a more stable feature. Heart ratehas also the advantage of having a standardized method for baseline calculation andan easy mapping to arousal levels, by calculating the maximum heart rate for eachuser.
Adaptability cannot be so clearly mapped to biodata. One “best-effort” measure-ment that can be done is sleep assessment, done by means of the features: sleeptime, sleep quality and sleep fragmentation. This requires that the sensors are com-fortable enough to be used during sleep. Besides this, having an increased heart ratethroughout the day can be a marker of Sympathetic predominance, so this shouldalso be taken into account. Figure 5.1 presents a proposal for a biosensor configura-tion to be used in Affective Health.
Fig. 5.1. Scheme of a proposed wrist sensor with a PPG sensor capable of measuring BloodVolume Pulse, a triaxial accelerometer and a “lights off” switch.
The sensor package can be used comfortably in the wrist which has literaturesupport regarding correct sensor positioning both for the accelerometer (Garnier &Benefice 2006, Jean-Louis et al. 2001) and PPG (Poon & Zhang 2005, Sorvoja 2006).PPG sensors are usually preferably used in the finger as a ring because the skinis thinner, improving the quality of the signal (Engin et al. 2005). But there wasno evidence found for correct measurement of Physical Activity and sleep relatedmeasurements from the finger. So, to keep the sensor array as compact as possible,

5 Results 67
the PPG sensor is positioned in the wrist. The “lights-off” button, recommendedby Tryon (2004), is used to help estimate sleep time and improve estimation ofAdaptability.
It should be noticed that only one accelerometer in the wrist cannot derive bodyposture, thus providing less input for design, when it concerns Physical Activity.

! 6
Discussion
In a reflection about Affective Wearables, Picard & Healey (1997) concluded thatthere is a need for novel biosensor design that is both accurate and unobtrusive forcontinuous use. It also refers that “a difficult challenge of affective computing researchis to determine which features of the sensor information should be considered salient,both to reduce the amount of data that is stored and transmitted, and to improve theanalysis of the data”. The present thesis gives a possible answer to these questionswith a compact and minimalistic sensor configuration and a set of features that mapto three concepts that are easy to understand and supported by medical backgroundon stress.
When designing a wearable device aimed to be used by healthy people, the issuesof comfort and unobtrusiveness are critical. People with cardiac problems mightaccept to carry an heavy ECG monitor during 24 hours but healthy users are unlikelyto burden themselves. Also, users are unlikely to bother too much with correct sensorplacement and calibration, which, combined with an unpredictable everyday lifesetting, may result in very noisy sensor data. These considerations are important tounderstand the restrictive requirements imposed on Affective Health’s physiologicalinput methods.
Many questions, however, were left unanswered. We left power source and com-munication requisites out of the scope of this thesis as we were mostly concernedwith the biodata and the methods themselves, more than the sensors. It is clearhowever that a sensor configuration for Affective Health must include some sort ofreal-time wireless communication in order to transmit the physiological features toa mobile device, where they can be visualized. It must also have lower power re-quirements, as it is intended to be used continuously. These questions are left forfuture work. Of course, future studies must also support the exploratory review inthis thesis with empirical data from a similar sensor configuration, with users in aneveryday life setting.

70 6 Discussion
Concerning Adaptability and its mapping to biodata, this literature review demon-strated an urgent need for future research in both the areas of Physiology/Medicineand Electronics. There is a need for better sensors that can measure blood pressurein an everyday life setting with minimal discomfort. This is especially importantwhen considering that hypertension affects thousands of people in the world and itssymptoms are not always expressed (American Heart Association 2005), though itcan still lead to cardiovascular diseases and diabetes. Further research is also neededto uncover the significance of cardiovascular markers of accumulated allostatic loadlike HRV analysis or cardiovascular reactivity/recovery. This can give support fornon-invasive measurement and give rise to new biofeedback devices that help peo-ple prevent diseases, instead of curing.
It is likely that, in the near future, wearable textile solutions become better andleave the research community to enter people’s homes, thus permitting new kindsof physiological input methods. Until then, we hope that the results here presentedwill serve to support self-reflection during the course of everyday life.

References
Adinoff, B., Iranmanesh, A., Veldhuis, J. & Fisher, L. (1998), ‘Disturbances of the stressresponse: the role of the hpa axis during alcohol withdrawal and abstinence.’, AlcoholHealth Res World. 22(1), 67–72.
Akselrod, S., Gordon, D., Ubel, F., Shannon, D., Barger, A. & Cohen, R. (1981), ‘Powerspectral analysis of heart rate fluctuation: a quantitative probe of beat-to-beatcardiovascular control’, Science 213, 220–222.
Alberti, K., Zimmet, P. & Shaw, J. (2005), ‘The metabolic syndrome a new worldwidedefinition’, Lancet 366, 1059–1062.
American Heart Association (2005), ‘Recommendations for blood pressure measurement inhumans and experimental animals’, Hypertension 45(142).
Anderson, C. & MacCurdy, M. (2000), Writing and Healing: Toward an Informed Practice,National Council of Teachers of English.
Andriyashchenko, P. L., Bolshov, V. M., Klochkov, V. A. & Yakovlev, V. T. (1995), ‘Selection ofadequate technique for measuring arterial blood pressure using cardiovascularmonitors’, Biomedical Engineering 29(4).
Appleby, M. (2007), ‘Target Heart Rate Chart [Picture]’,http://inch-aweigh.com/images2/targetheartrate_chart.gif.
Asada, H. H. (2007), ‘Wearable Sensors and Wearable Health Monitoring [Website]’.Asada, H., Hong-Hui, J. & Gibbs, P. (2004), ‘Active noise cancellation using mems
accelerometers for motion-tolerant wearable bio-sensors’, Engineering in Medicine andBiology Society .
Asada, H., Shaltis, P., Reisner, A., Rhee, S. & Hutchinson, R. (2003), ‘Mobile monitoring withwearable photoplethysmographic biosensors’, IEEE Eng Med Biol Mag 22(3), 28–40.
Author (Year), ‘Using noninvasive wearable computers to recognize human emotions fromphysiological signals’, Journal .
Barengo, N., Hu, G. & Lakka, T. (2004), ‘Low physical activity as predictor for total andcardiovascular disease mortality in middle-aged men and women in finland’, EurHeartJ25, 2204–211.
Bassett, D., Ainsworth, B., Leggett, S., Mathien, C., Main, J., Hunter, D. & Duncan, G. (1996),‘Accuracy of five electronic pedometers for measuring distance walked’, Medicine andScience in Sports and Exercise 28(8), 1701–1707.

72 References
Beckers, F., Verheyden, B. & Aubert, A. E. (2006), ‘Aging and nonlinear heart rate control ina healthy population’, AJP - Heart and Circulatory Physiology 290, 2560–2570.
Become Healthy Now [Website] (2008), ‘The sympathetic and parasympathetic divisions ofthe nervous system [picture]’, http://www.becomehealthynow.com/images/organs/nervous/sympth_parasymth.gif.
Berlin, J. E., Storti, K. L. & Brach, J. S. (2006), ‘Using activity monitors to measure physicalactivity in free-living conditions’, Physical Therapy 86(8), 1137–1145.
Bernardi, L., Wdowczyk-Szulc, J., Valenti, C., Castoldi, S., Passino, C., Spadacini, G. &Sleight, P. (2000), ‘Effects of controlled breathing, mental activity and mental stress withor without verbalization on heart rate variability’, J Am Coll Cardiol 35(6), 1462–1469.
Boehmer, R. (1987), ‘Continuous, real-time, noninvasive monitor of blood pressure: Penazmethodology applied to the finger’, J Clin Monit 3(4), 282287.
Boehner, K., DePaula, R., Dourish, P. & Sengers, P. (2005), ‘Affect: From information tointeraction’, Critical Computing Conference .
Bojorges-Valdez, E., Echeverria, J., Valdes-Cristerna, R. & Pena, M. (2007), ‘Scaling patternsof heart rate variability data’, Physiological Measurement 28, 721730.
Bonato, P., Rossi, D. D., Dittmar, A., Jayaraman, S. & Korhonen, I. (2006), Ieee embstechnical committee on wearable biomedical sensors and systems: Position paper, in‘Proceedings of the International Workshop on Wearable and Implantable Body SensorNetworks’.
Bouten, C., Sauren, A., Verduin, M. & Janssen, J. (1997), ‘Effects of placement andorientation of body-fixed accelerometers on the assessment of energy expenditureduring walking’, Medical and Biologic Engineering and Computing 35, 50–56.
Brady, S. & Matthews, K. A. (2006), ‘Chronic stress influences ambulatory blood pressure inadolescents’, Annals of Behavioral Medicine 31(1), 80–88.
Brennan, M., MPalaniswami & Kamen, P. (2001), ‘Do existing measures of poincare plotreflect non-linear features of heart rate variability?’, IEEE Transactions in BiomedicalEngineering 48(11).
CancerWEB (1997), ‘Online medical dictionary’, http://cancerweb.ncl.ac.uk/omd/.Cannon, W. B. (1914), ‘The emergency function of the adrenal medulla in pain and the
major emotions’, Am J Physiol 33(2), 356–72.Cannon, W. B. (1932), Wisdom of the Body, Norton, New York.Caspersen, C., Powell, K. & Christenson, G. (1985), ‘Physical activity, exercise, and physical
fitness: definitions and distinctions for health related research’, Public Health Reports100(2), 126–131.
Castro, M., Vigo, D., Weidema, H., Fahrer, R., Chu, E., de Achval, D., Nogus, M., Leiguarda,R., Cardinali, D. & Guinjoan, S. (2008), ‘Heart rate variability response to mentalarithmetic stress in patients with schizophrenia autonomic response to stress inschizophrenia.’, Schizophr Res 99(1-3), 294–303.
Cauter, E. V., Polonsky, K. S. & Scheen, A. J. (1997), ‘Roles of circadian rhythmicity and sleepin human glucose regulation’, Endocr.Rev. 18, 716–738.
Chanel, G., Kronegg, J., Grandjean, D. & Pun1, T. (2005), Emotion assessment: Arousalevaluation using eegs and peripheral physiological signals, Technical report, Universityof Geneva.

References 73
Chang, F., Chang, C., Chiu, C., Hsu, S. & Lin, Y. (2007), ‘Variations of hrv analysis indifferent approaches’, Computers in Cardiology 34, 17–20.
Chen, K. & Basset, D. (2005), ‘The technology of accelerometry-based activity monitors:Current and future’, Medicine and Science in Sports and Exercise .
Coleman, L., Smith, D., Boone, D., Joseph, A. & Aguila, M. D. (1999), ‘Step activity monitor :Long-term, continuous recording of ambulatory function’, Journal of rehabilitationresearch and development 36(1), 8–18.
Cote, G. L., Lec, R. M. & Pishko, M. V. (2003), ‘Emerging biomedical sensing technologiesand their applications’, IEEE Sensors Journal 3(3), 251–266.
Cox, T. (1993), Stress research and stress management: putting theory to work, Health andSafety Executive.
Crouter, S. E., P. L. Schneider, M. K. & Bassett, D. R. (2003), ‘Validity of 10 electronicpedometers for measuring steps, distance, and energy cost’, Medicine and Science inSports and Exercise 35(8), 14551460.
DAddio, G., Pinna, G., Maestri, R., Acanfora, D., Picone, C., Furgi, G. & Rengo, F. (1999),‘Correlation between power-law behaviour and poincare plots of heart rate variability’,Computers in Cardiology 26, 611–614.
Dahlgren, A. (2006), Work stress and overtime work - effects on cortisol, sleep, sleepinessand health, PhD thesis, Stockholm University.
Damjanovic, A., Yang, Y., Glaser, R., Kiecolt-Glaser, J., Nguyen, H., Laskowski, B., Zou, Y.,Beversdorf, D. & Weng, N. (2007), ‘Accelerated telomere erosion is associated with adeclining immune function of caregivers of alzheimer’s disease patients’, J Immunol.179()(6), 4249–54.
Dourish, P. (2001), Where the action is. The Foundations of embodied Interaction, MIT.Ekstedt, M., Soderstrom, M., Axelsson, J., Nilsson, J. & Akerstedt, T. (2003), ‘Stress-related
sleep arousals in nonpatients is related to changes in metabolic parameters’, Journal ofPsychosomatic Research 55, 147178.
Electrophysiology, T. (1996), ‘Heart Rate Variability : Standards of Measurement,Physiological Interpretation, and Clinical Use’, Circulation 93(5), 1043–1065.
Engin, M., Demirel, A., Engin, E. Z. & Fedakar, M. (2005), ‘Recent developments and trendsin biomedical sensors’, Measurement 37, 173–188.
Epel, E., Blackburn, E., Lin, J., Dhabhar, F., Adler, N., Morrow, J. & Cawthon, R. (2004),Accelerated telomere shortening in response to life stress, in ‘Proc Natl Acad Sci’, Vol.101, p. 1731217315.
Erlanger, J. (1904), ‘A new instrument for determining the minimum and maximumblood-pressure in man’, Johns Hopkings Hosp Rep 12, 53–110.
Ernst, E. (2003), ‘Systematic reviews of biofeedback’, Phys Rehab Kur Med 13, 321–324.Everly, G. & Lating, J. (2002), A Clinical Guide to the Treatment of the Human Stress Response,
Plenum Publishers.Exmocare (2007), http://www.exmocare.com/.Ferreira, P., Sanches, P. & Jaensson, T. (2008), ‘License to chill’, Nordichi2008 .Firoozbakhsh, B., Jayant, N., Park, S. & Jayaraman, S. (2000), ‘Wireless communication of
vital signs using the georgia tech wearable motherboard’, Multimedia and Expopp. 1253–1256.

74 References
Folkman, S., Lazarus, R. S., Dunkel-Schetter, C., DeLongis, A. & Gruen, R. J. (1986),‘Dynamics of a stressful encounter: cognitive appraisal, coping, and encounteroutcomes’, Journal of Personality and Social Psychology 50, 992–1003.
Forlizzi, J., Disalvo, C., Zimmerman, J., Mutlu, B. & Hurst, A. (2005), The sensechair: thelounge chair as an intelligent assistive device for elders, in ‘DUX ’05: Proceedings of the2005 conference on Designing for User eXperience’, AIGA: American Institute of GraphicArts, New York, NY, USA.
Fowles, D. (1986), Psychophisiology, Guilford Press, New York, chapter The eccrine systemand electrodermal activity, pp. 51–96.
Fox, S., Naughton, J. & Haskell, W. (1971), ‘Physical activity and the prevention of coronaryheart disease’, Ann Clin Res 3, 404–432.
Freedman, R., Sabharwal, S. & Desai, N. (1987), ‘Sex differences in peripheral vascularadrenergic receptors’, Circ Res 61(4), 581–585.
Garnier, D. & Benefice, E. (2006), ‘Reliable method to estimate characteristics of sleep andphysical inactivity in free-living conditions using accelerometry’, Annals of Epidemiology16(5), 364–369.
Gaver, W., Beaver, J. & Benford, S. (2003), ‘Ambiguity as a resource for design’, CHI .Gaver, W., Sengers, P., Kerridge, T., Kaye, J. & Bowers, J. (2007), ‘Enhancing ubiquitous
computing with user interpretation:field testing the home health horoscope’, CHI2007Proceedings .
Gerin, W., Davidson, K. W., Christenfeld, N. J. S., Goyal, T. & Schwartz, J. E. (2006), ‘Therole of angry rumination and distraction in blood pressure recovery from emotionalarousal’, Psychosomatic Medicine pp. 64–72.
Goedhart, A. D., van der Sluis, S., Houtveen, J. H., Willemsen, G. & de Geus, E. J. (2007),‘Comparison of time and frequency domain measures of rsa in ambulatory recordings’,Psychophysiology 44(2), 203–215.
Goldberger, A. L., Amaral, L. A. N., Hausdorff, J. M., Ivano, P. C., Peng, C. K. & Stanley, H. E.(2002), Fractal dynamics in physiology: Alterations with disease and aging, in‘Proceedings of the National Academy of Sciences of the United States of America’,Vol. 99, pp. 2466–2472.
Grassi, G., Vailati, S., Bertinieri, G., Seravalle, G., Stella, M. L., DellOro, R. & Mancia, G.(1998), ‘Heart rate as marker of sympathetic activity’, Journal of Hypertension16, 1635–639.
Guimont, C., Brisson, C., Dagenais, G., Milot, A., Vzina, M., Msse, B., Moisan, J., Laflamme,N. & Blanchette, C. (2006), ‘Effects of job strain on blood pressure: a prospective studyof male and female white-collar workers’, Am J Public Health 96(8), 1436–1443.
Gump, B. B. & Matthews, K. A. (1999), ‘Do background stressors influence reactivity to andrecovery from acute stressors?’, Journal of Applied Social Psychology 29(3), 469–494.
Hansson, G., Asterland, P., Holmer, N. & Skerfving, S. (2001), ‘Validity and reliability oftriaxial accelerometers for inclinometry in posture analysis’, Medical BiologicalEngineering Computing (39).
Harsanyi, G. (2000), Sensors in Biomedical Applications: Fundamentals, Technology andApplications, CRC.
Hayward, R., ed. (2004), The Clinical Management of Craniosynostosis, MacKeith Press.

References 75
Healey, J. & Picard, R. W. (1998), Startlecam: A cybernetic wearable camera, in ‘Proceedingsof the Second International Symposium on Wearable Computers’.
Hota, P., Naveteurb, J., Lecontea, P. & Sequeira, H. (1999), ‘Diurnal variations of tonicelectrodermal activity’, International Journal of Psychophysiology 33(3), 223–230.
Houghton, A. (2005), ‘Personal support 5: Stress and time management for people withmultiple responsibilities’, BMJ Career Focus 331(30).http://careerfocus.bmj.com/cgi/content/full/331/7509/30.
Hung, K., Zhang, Y. & Tai, B. (2004), ‘Wearable medical devices for tele-home healthcare’,Proceedings of the 26th Annual International Conference of the IEEE EMBS .
Inbar, O., Oten, A., Scheinowitz, M., Rotstein, A., Dlin, R. & Casaburi, R. (1994), ‘Normalcardiopulmonary responses during incremental exercise in 20- to 70-yr-old men’, MedSci Sports Exerc 26, 538–546.
Ivancevich, J. M. (1987), Job Stress: From Theory to Suggestions, Routledge.Jafarinaimi, N., Forlizzi, J., Hurst, A. & Zimmerman, J. (2005), ‘Breakaway: An ambient
display designed to change human behavior’, CHI .Jaffari, S. A. & Turner, A. P. F. (1995), ‘Recent advances in amperometric glucose biosensors
for in vivo monitoring’, Physiol. Meas. 16, 1–15.Jalife, J. & Michaels, D. (1994), Vagal Control of the Heart: Experimental Basis and Clinical
Implications, Armonk, chapter Neural control of sinoatrial pacemaker activity,pp. 173–205.
Janig, W. (2003), Handbook of Affective Sciences, Oxford University Press, New York, chapterThe Autonomic Nervous System and Its Coordination by the Brain, pp. 135,186.
Jean-Louis, G., Kripkea, D. F., Masona, W. J., Elliotta, J. A. & Youngstedt, S. D. (2001), ‘Sleepestimation from wrist movement quantified by different actigraphic modalities’, Journalof Neuroscience Methods 105(2), 185–191.
Johnston, W. & Mendelson, Y. (2005), Extracting heart rate variability from a wearablereflectance pulse oximeter.
Julius, S. (1993), ‘Sympathetic hyperactivity and coronary risk in hypertension’,Hypertension 21, 886893.
Kagan, J. (1984), The Nature of the Child, Basic Books, New York.Kaplan, J., Pettersson, K., Manuck, S. & G, O. (1991), ‘Role of sympathoadrenal medullary
activation in the initiation and progression of atherosclerosis’, Circulation 84.Karasek, R. & Theorell, T. (1990), Healthy Work: Stress, Productivity and the Reconstruction of
Working Life, New York: Basic Books.Kim, J. (2004), ‘Emotion recognition from physiological measurement [powerpoint
presentation]’, http://emotion-research.net/projects/humaine/ws/wp4/Biosignal_Jonghwa_Kim.ppt.
King, A., Taylor, C., Haskell, W. & DeBusk, R. (1989), ‘Influence of regular aerobic exerciseon psychological health: a randomized, controlled trial of healthy middle-aged adults’,Health Psychology 8, 305–324.
Kirschbaum, C., Pirke, K. & Hellhammer, D. (1993), ‘The ’trier social stress test’ - a tool forinvestigating psychobiological stress responses in a laboratory setting.’,Neuropsychobiology 28(1-2), 76–81.
Kiwok (2008), http://www.kiwok.se/index.php?id=35&hi=35.

76 References
Komatsu, T., Ohtsuka, S., Ueda, K. & Komeda, T. (2007), Affective Computing and IntelligentInteraction, Vol. 4738, Springer Berlin, chapter Comprehension of Users SubjectiveInteraction States During Their Interaction with an Artificial Agent by Means of HeartRate Variability Index, pp. 266–277.
Lackschewitza, H., , Hther, G. & Krner-Herwig, B. (2008), ‘Physiological and psychologicalstress responses in adults with attention-deficit/hyperactivity disorder (adhd)’,Psychoneuroendocrinology .
Landsbergis, P. A., Schnall, P. L., Pickering, T. G., Warren, K. & Schwartz, J. E. (2003),‘Life-course exposure to job strain and ambulatory blood pressure in men’, AmericanJournal of Epidemiology 57(11).
Landsman-Dijkstra, J., Wijc, R. & Groothoff, J. W. (2006), ‘Improvement of balance betweenwork stress and recovery after a body awareness program for chronic aspecificpsychosomatic symptoms’, Patient Education and Counseling pp. 125–135.
Landsman-Dijkstra, J., Wijc, R., Groothoff, J. W. & Rispens, P. (2004), ‘The short-term effectsof a body awareness program: better self-management of health problems forindividuals with chronic a-specific psychosomatic symptoms’, Patient Education andCounseling 55, 155–167.
Lepore, S., Miles, H. & Levy, J. (1997), ‘Relation of chronic and episodic stressors topsychological distress reactivity and health’, International Journal of Behavioral Medicine4(1), 39–59.
LGE (2007), ‘Stress management case studies’,http://www.lge.gov.uk/lge/core/page.do?pageId=59795.
Liden, C. B., Wolowicz, M., Stivoric, J., Teller, A. & Vishnubhatia, S. (n.d.), Characterizationand implications of the sensors incorporated into the. sensewear armband for energyexpenditure and activity detection. BodyMedia.
Lindstrom, M., Stahl, A., Hk, K., Sundstrom, P., Laaksolathi, J., Combetto, M., Taylor, A. &Bresin, R. (2006), ‘Affective diary: designing for bodily expressiveness andself-reflection’, Conference on Human Factors in Computing Systems .
Liu, K. K.-L. (2004), A personal, mobile system for understanding stress and interruptions,Master’s thesis, Massachusetts Institute of Technology.
Loucksa, E. B., Justerb, R. P. & Pruessner, J. C. (2008), ‘Neuroendocrine biomarkers,allostatic load, and the challenge of measurement: A commentary on gersten’, SocialScience Medicine 66(3), 525–530.
Lucini, D., Fede, G. D., Parati, G. & Pagani, M. (2005), ‘Impact of chronic psychosocial stresson autonomic cardiovascular regulation in otherwise healthy subjects’, Hypertension46, 1201–1206.
Lykken, D. T. & Venables, P. H. (1971), ‘Direct measurement of skin conductance: A proposalfor standardization’, Psychophysiology 8, 656–672.
Lymberis, A. (2005), Progress in rd on wearable and implantable biomedical sensors forbetter healthcare and medicine, in ‘Proceedings of the 3rd Annual International IEEEEMBS Conference on Microtecnologies in Medicine and Biology’, pp. 296–298.
Macfarlanez, D., Lee, C. C., Ho, E. Y., Chan, K. & Chan, D. (2006), ‘Convergent validity of sixmethods to assess physical activity in daily life’, Journal of Applied Physiology101, 1328–1334.

References 77
Malmstrom, E. J., Opton, E. & Lazarus, R. S. (1965), ‘Heart rate measurement and thecorrelation of indices of arousal’, Psychosomatic Medicine .
Mandanmohan, Prakash, E. S. & Bhavanani, A. B. (2005), ‘Correlation between short-termheart rate variability indices and heart rate, blood pressure indices, pressor reactivity toisometric handgrip in healthy young male subjects’, Indian J Physiol Pharmacol49(2), 132138.
Marklund, S., Palmer, E., Hogstedt, C., Bjurvald, M. & Theorell, T. (2004), ‘Den hogasjukfranvaron sanning och konsekvens [the high sick leave rates truth andconsequences]’, Statens Folkhalsoinstitut 15.
Masurier, G. L. & Tudor-Locke, C. (Year), ‘Comparison of pedometer and accelerometeraccuracy under controlled conditions.’, Medicine and Science in Sports and Exercise35(5), 867–71.
Matthews, K. A., Salomon, K., Brady, S. S. & Allen, M. T. (2003), ‘Cardiovascular reactivity tostress predicts future blood pressure in adolescence’, Psychosomatic Medicine65, 410–415.
McEwen, B. S. (1998), ‘Protective and damaging effects of stress mediators’, New EnglandJ.Med 338, 171–179.
McEwen, B. & Wingfield, J. C. (2003), ‘The concept of allostasis in biology and biomedicine’,Horm Behav 43(1), 2–15.
McGrady, A. & Roberts, G. (1992), ‘Racial differences in the relaxation response ofhypertensives’, Psychossomatic Medicine 54(1), 71–78.
Melanson, E., Knoll, J. R., Bell, M. L., Donahoo, W. T. & Hill, J. (2004), ‘Commerciallyavailable pedometers: considerations for accurate step counting’, Preventive Medicine39, 361368.
Mezzacappa, E. S., Kelsey, R. M., Katkin, E. S. & Sloan, R. P. (2001), ‘Vagal rebound andrecovery from psychological stress’, Psychosomatic Medicine 63, 650657.
Montebugnoli, L., Servidio, D., Miaton, R. A. & Prati, C. (2004), ‘Heart rate variability: Asensitive parameter for detecting abnormal cardiocirculatory changes during a stressfuldental procedure’, J Am Dent Assoc 135(12), 1718–1723.
Moriguchi, A., Otsuka, A., Kohara, K., Mikami, H., Katahira, K., Tsunetoshi, T., Higashimori,K., Ohishi, M., Yo, Y. & Ogihara, T. (1992), ‘Spectral change in heart rate variability inresponse to mental arithmetic before and after the beta-adrenoceptor blocker, carteolol’,Clinical Autonomic Research 2, 267–270.
Morin, C. M., Rodrigue, S. & Ivers, H. (2003), ‘Role of Stress, Arousal, and Coping Skills inPrimary Insomnia’, Psychosom Med 65(2), 259–267.
Muzalevskaya, N. & Uritski, V. (2005), Extra low frequency fluctuations of heart ratevariability as a signature of adaptation dynamics in human homeostasis, in ‘Proceedingsof SPIE’, Vol. 5841.
Myllymoki, T. (2006), Heart rate variabilitybased recovery during sleep compared tomovement analysis, subjective ratings and cortisol awakening responses, Master’s thesis,University of Jyvaskyla.
Nealey-Moore, J. B., Smith, T. W., Uchino, B. N., Hawkins, M. W. & Olson-Cerny, C. (2007),‘Cardiovascular reactivity during positive and negative marital interactions’, J Behav Med30, 505519.

78 References
Neuman, M. & Liu, C.-C. (1988), Biomedical sensors in interventional systems: Presentproblems and future strategies, in ‘Proceedings of the IEE’, Vol. 76, pp. 1218–25.
Nielsen, L., Seeman, T. & Hahn, A. (2007), ‘Nia exploratory workshop on allostatic load’,Background Materials and Statements, Washington DC.
Oatley, K. (1992), Best Laid Schemes: The Psychology of Emotions, Cambridge University Press.O’Connor, D. B., O’Connora, R. C., White, B. L. & Bundred, P. E. (2001), ‘Are occupational
stress levels predictive of ambulatory blood pressure in british gps? an exploratorystudy’, Family Practice 18(1), 92–94.
Peng, C. K., Havlin, S., Hausdorff, J. M., Mietus, J. E., Stanley, H. E. & Goldberger, A. L.(1995), ‘Fractal mechanisms and heart rate dynamics: Long range correlations and theirbreakdown with disease’, Journal of Electrocardiology 28.
Perkiomaki, J. S., Zareba, W., Kalaria, V. G., Couderc, J.-P., Huikuri, H. V. & Moss, A. J.(2000), ‘Comparability of nonlinear measures of heart rate variability between long- andshort-term electrocardiographic recordings’, The American Journal of Cardiology87, 905–908.
PEROSH (2004), ‘European ways to combat psychosocial risks related to work organisation:Towards organisational interventions?’, TNO Work and Employment.
Picard, R. (1997), Affective Computing, MIT Press.Picard, R. & Healey, J. (1997), Affective wearables, in ‘Proceedings of the First International
Symposium on Wearable Computers’.Picard, R. W. & Scheirer, J. (2001), The galvactivator: A glove that senses and communicates
skin conductivity, Technical report, MIT Media Laboratory.Plasqui, G. & Westerterp, K. R. (1999), ‘Physical activity assessment with accelerometers’,
International Journal of Obesity 23(3), 45–49.Polar USA (2007), http://www.polarusa.com/.Pomeranz, B., Macaulay, R., Caudill, M., Kutz, I., Adam, D., Gordon, D., Kilborn, K., Barger,
A., Shannon, D., Cohen, R. & Benson, H. (1985), ‘Assessment of autonomic function inhumans by heart rate spectral analysis’, Am J Physio 248, H151–H153.
Poon, C. & Zhang, Y. (2005), ‘Cuff-less and noninvasive measurements of arterial bloodpressure by pulse transit time’, Proceedings of the 2005 IEEE Engineering in Medicine andBiology .
Robergs, R. A. & Landwehr, R. (2002), ‘The surprising history of the ”hrmax=220-age”equation’, Journal of Exercise Physiology 5(2).
Rose, A. H. (1994), Human Stress and the Environment: Health Aspects, CRC, pp. 110–111.Russell, J. (1980), ‘A circumplex model of affect’, J Pers Soc Psychol 39(6), 11611178.Salo, T., Kirstein, K.-U., Vancura, T. & Baltes, H. (2007), ‘Cmos-based tactile microsensor for
medical instrumentation’, IEEE SENSORS JOURNAL 7(2).SALTSA, ed. (2006), Working life research in Europe, Arbetslivsinstitutet, chapter The Job
Demand-Control-Support Model applied to analysis of nursing work in ten Europeancountries.
SCB (2005), ‘Arbetsorsakade besvar 2005. work-related disorders 2005’, StatistikaCentralbyran. No AM 43 SM 0501.
Schachter, S. & Singer, J. (1962), ‘Cognitive social and physiological determinants ofemotional state’, Psychological Review 69, 379–399.

References 79
Schmidt, S. & Walach, H. (2000), ‘Electrodermal activity - state of the art measurement andtechniques for parapsychological purposes’, The Journal of Parapsychology 64, 139–163.
Schnall, P., Schwartz, J., Landsbergis, K., Warren, K. & Pickering, T. (1998), ‘A longitudinalstudy of job strain and ambulatory blood pressure: results from a three-year follow-up’,Psychosom Med 60, 697706.
Schneider, P., Crouter, S. & Bassett, D. (2004), ‘Pedometer measures of free-living physicalactivity: Comparison of 13 models’, Medicine and Science in Sports and Exercise36(2), 331–335.
Schneider, P. L., Crouter, S. E., Lukajic, O. & Bassett, D. R. (2003), ‘Accuracy and reliability of10 pedometers for measuring steps over a 400-m walk’, Medicine and Science in Sportsand Exercise 35(10), 17791784.
Schuler, J. H. & O’Brien, W. (1997), ‘Cardiovascular recovery from stress and hypertensionrisk factors: A meta-analytic review’, Psychophysiology 34(6), 649659.
Schumann, A., Wessel, N., Schirdewan, A., Osterziel, K. J. & Voss, A. (2002), ‘Potential offeature selection methods in heart rate variability analysis for the classifcation ofdiferent cardiovascular diseases’, Statist. Med. 21, 22252242.
Seely, A. & Macklem, P. (2004), ‘Complex systems and the technology of variability analysis’,Critical Care 8(6), R367–R384.
Seeman, T. E., Singer, B. H., Rowe, J. W., Horwitz, R. I. & McEwen, B. S. (1997), ‘Price ofadaptation: allostatic load and its health consequences. MacArthur studies of successfulaging’, Arch Intern Med 157(19), 2259–2268.
Selye, H. (1936), ‘A syndrome produced by diverse nocuous agents’, Nature 138, 32.Sforza, E., Pichot, V., Cervena, K., Barthlmy, J. C. & Roche, F. (2007), ‘Cardiac variability and
heart-rate increment as a marker of sleep fragmentation in patients with a sleepdisorder: a preliminary study’, Sleep .
Sforzaa, E., Chapotot, F., Lavoie, S., Roche, F., Pigeau, R. & Buguet, A. (2004), ‘Heart rateactivation during spontaneous arousals from sleep: effect of sleep deprivation’, ClinicalNeurophysiology 115, 24422451.
Silva, V. A. P. d., Bottaro, M., Justino, M. A., Ribeiro, M. M., Lima, R. M. & Oliveira, R. J. d.(2007), ‘Frequencia cardıaca maxima em idosas brasileiras: uma comparacao entrevalores medidos e previstos’, Arquivos Brasileiros de Cardiologia 88, 314 – 320.
Singer, B., Ryff, C. & Seeman, T. (2005), Allostasis, Homeostasis, and the Cost of PhysiologicalAdaptation, Cambridge, chapter Operationalizing Allostatic Load.
Sorvoja, H. (2006), NONINVASIVE BLOOD PRESSURE PULSE DETECTION AND BLOODPRESSURE DETERMINATION, PhD thesis, UNIVERSITY OF OULU.
Stahl, A. (2005), ‘Designing for emotional expressivity’.Steptoe, A. & Marmot, M. (2005), ‘Impaired cardiovascular recovery following stress predicts
3-year increases in blood pressure’, J Hypertens. 23(3), 529–36.Sterling, P. & Eyer, J. (1988), Hanbook of Life Stress, Cognition and Health, John Wiley and
Sons, New York, chapter Allostasis: A new paradigm to explain arousal pathology.Stewart, J. & France, C. (2001), ‘Cardiovascular recovery from stress predicts longitudinal
changes in blood pressure’, Biological Psychology 58(2), 105–120.Sundstrom, P. (2005), Exploring the Affective Loop, PhD thesis, Stockholm University.

80 References
Sundstrom, P., Stahl, A. & Hook, K. (2005), Affective Computing and Intelligent Interaction,Springer Berlin, chapter A User-Centered Approach to Affective Interaction,pp. 931–938.
T. Kawada, M. Kuroiwa, Y. S. S. S. & Tamura, Y. (2001), ‘Sleep time monitoring byaccelerometer in two subjects for 1 year’, Journal of Sound and Vibration 250(1), 75–82.
Terkelsen, J., Molgaard, H., Hansen, J., Andersen, K. & Jensen, S. (2005), ‘Acute painincreases heart rate: differential mechanisms during rest and mental stress’, AutonNeurosci 121, 101109.
Thayer, J. F. & Sternberg, E. (2006), ‘Beyond heart rate variability: Vagal regulation ofallostatic systems’, Neuroendocrine and Immune Crosstalk 1088, 361372.
Tryon, W. W. (2004), ‘Issues of validity in actigraphic sleep assessment.’, Sleep27(1), 158–165.
Tudor-Locke, C. (2002), ‘Taking steps toward increased physical activity: Using pedometersto measure and motivate’, President’s Council on Physical Fitness and Sports ResearchDigest 17(3).
Tudor-Locke, C., Burkett, L., Reis, J., Ainsworth, B., Macera, C. & Wilson, D. (2005), ‘Howmany days of pedometer monitoring predict weekly physical activity in adults?’,Preventive Medicine 40, 293–298.
Tudor-Locke, C. & Myers, A. (2001), ‘Challenges and opportunities for measuring physicalactivity in sedentary adults’, Sports Medicine 31(312), 91–100.
Ungi, I., Thury, A. & Csanady, M. (1995), ‘Investigation of the correlation between heart rateand heart rate variability’, Computers in Cardiology .
Ursin, H. & Eriksen, H. R. (2004), ‘The cognitive activation theory of stress’,Psychoneuroendocrinology 29, 567–592.
U.S. Department of Health and Human Services (1996), Physical Activity and Health: AReport of the Surgeon General, CDC, Atlanta.
Ushiyama, T., Mizushige, K., Wakabayashi, H., Nakatsu, T., Ishimura, K., Tsuboi, Y., Maeta,H. & Suzuki, Y. (2008), ‘Analysis of heart rate variability as an index of noncardiacsurgical stress’, Heart Vessels 23, 5359.
Venables, P. & Christie, M. (1980), Electrodermal Activity, John Wiley, New York, chapterTechniques in Psychophysiology, pp. 2–67.
Vincent, S. D. & Sidman, C. L. (2003), ‘Determining measurement error in digitalpedometers’, Measurement in Physical Education and Exercise Science 7(1), 19–24.
von Scheele, I., von Scheele, B., Hansson, G., Winman, A. & Theorell, T. (2005),‘Psychosocial factors and respiratory and cardiovascular parameters duringpsychophysiological stress profiling in working men and women’, AppliedPsychophysiology and Biofeedback 30(2), 125–136.
Vrijkotte, T. G. M., van Doornen, L. J. P. & de Geus, E. J. C. (2000), ‘Effects of work stress onambulatory blood pressure, heart rate, and heart rate variability’, Hypertension .
Vuksanovi, V. & Gal, V. (2007), ‘Heart rate variability in mental stress aloud’, MedicalEngineering and Physics 29, 344349.
Wagner, J., Kim, J. & Andre, E. (2005), ‘From physiological signals to emotions:Implementing and comparing selected methods for feature extraction and classification’,Multimedia and Expo 6(6), 940 – 943.

References 81
Wainapel, S. F. & Fast, A. (2003), Alternative Medicine and Rehabilitation, Demos MedicalPublishing, chapter Biofeedback as an Adjunct in Rehabilitation Medicine.
Westeyn, T., Presti, P. & Starner, T. (2006), Actiongsr: A combination galvanic skinresponse-accelerometer for physiological measurements in active environments, in‘Proceedings of the Tenth IEEE International Symposium on Wearable Computers’.
Wilkinson, M. (2002), ‘Medical market for microsystems’, MST NEWS 4(2), 37.Winwood, P. C. & Lushington, K. (2006), ‘Disentangling the effects of psychological and
physical work demands on sleep, recovery and maladaptive chronic stress outcomeswithin a large sample of australian nurses’, JOURNAL OF ADVANCED NURSING56(6), 679–689.
Ying, H., Silex, C., Schnitzer, A., Leonhardt, S. & Schiek, M. (2007), Automatic step detectionin the accelerometer signal, in ‘4th International Workshop on Wearable andImplantable Body Sensor Networks (BSN 2007)’, IFMBE Proceedings, pp. 80–85.
Yun, A. J. & Doux, J. D. (2007), ‘Stress dysfunctions as a unifying paradigm for illness:Repairing relationships instead of individuals as a new gateway for medicine’, MedicalHypotheses 68, 697704.
Zimetbaum, P. & Josephson, M. (1999), ‘The evolving role of ambulatory arrhythmiamonitoring in general clinical practice’, Ann. Intern. Med 130(10), 848–856.