SUPPORTING PAPER NO. 3 ROAD AND RAIL FREIGHT · 2 Inquiry into National Freight and Supply Chain...
32
SUPPORTING PAPER NO. 3 ROAD AND RAIL FREIGHT March 2018
Transcript of SUPPORTING PAPER NO. 3 ROAD AND RAIL FREIGHT · 2 Inquiry into National Freight and Supply Chain...

SUPPORTING PAPER NO. 3
ROAD AND RAIL FREIGHT
March 2018

ii Inquiry into National Freight and Supply Chain Priorities
© Commonwealth of Australia 2018
March 2018 / INFRA 3485 / ISBN: 978-1-925701-16-6
Ownership of intellectual property rights in this publication
Unless otherwise noted, copyright (and any other intellectual property rights, if any) in this publication is owned by the Commonwealth of
Australia (referred to below as the Commonwealth).
Disclaimer
The material contained in this publication is made available on the understanding that the Commonwealth is not providing professional
advice, and that users exercise their own skill and care with respect to its use, and seek independent advice if necessary.
The Commonwealth makes no representations or warranties as to the contents or accuracy of the information contained in this
publication. To the extent permitted by law, the Commonwealth disclaims liability to any person or organisation in respect of anything
done, or omitted to be done, in reliance upon information contained in this publication.
Creative Commons licence
With the exception of (a) the Coat of Arms and (b) the Department of Infrastructure,Regional Development and Cities’ photos and
graphics; copyright in this publication is licensed under a Creative Commons Attribution 3.0 Australia Licence.
Creative Commons Attribution 3.0 Australia Licence is a standard form licence agreement that allows you to copy, communicate and
adapt this publication provided that you attribute the work to the Commonwealth and abide by the other licence terms.
A summary of the licence terms is available from http://creativecommons.org/licenses/by/3.0/au/deed.en.
The full licence terms are available from http://creativecommons.org/licenses/by/3.0/au/legalcode.
This publication should be attributed in the following way: Inquiry into National Freight and Supply Chain Priorities, Supporting paper
No. 3, Road and rail freight, March 2018 © Commonwealth of Australia 2018.
Use of the Coat of Arms
The Department of the Prime Minister and Cabinet sets the terms under which the Coat of Arms is used. Please refer to the
Department’s Commonwealth Coat of Arms and Government Branding web page http://www.dpmc.gov.au/resource-
centre/government/australian-government-branding-guidelines-use-australian-government-logo-australian-government-departments-
and-agencies and in particular, the Commonwealth Coat of Arms - Information and Guidelines publication.
Contact us
This publication is available in hard copy or PDF format. All other rights are reserved, including in relation to any Departmental logos or
trade marks which may exist. For enquiries regarding the licence and any use of this publication, please contact:
Director - Publishing and Communications
Communications Branch
Department of Infrastructure, Regional Development and Cities
GPO Box 594
Canberra ACT 2601
Australia
Email: [email protected]
Website: www.infrastructure.gov.au
SUPPORTING PAPER NO. 3–ROAD AND RAIL FREIGHT 1
Contents
1. INTRODUCTION ........................................................................................................................ 3
2. OVERVIEW OF THE ROAD AND RAIL FREIGHT SECTORS ................................................... 4
Key importance of intermodal terminals in enabling freight transfer .................................................................. 6
3. ROAD AND RAIL IN AUSTRALIA TODAY ................................................................................ 7
Road ................................................................................................................................................................... 7
Rail .................................................................................................................................................................... 12
Road and rail productivity ................................................................................................................................. 16
Future technological trends .............................................................................................................................. 17
Challenges for regional and remote road and rail freight ................................................................................. 19
Challenges for urban road and rail freight ........................................................................................................ 19
4. CURRENT REFORMS UNDERWAY ........................................................................................ 20
National transport reforms ................................................................................................................................ 20
National rail safety law reform .......................................................................................................................... 20
National Heavy Vehicle Regulator .................................................................................................................... 21
National Road Safety Action Plan .................................................................................................................... 23
Heavy vehicle road reform ................................................................................................................................ 23
Urban rail plans ................................................................................................................................................. 25
National Rail Vision ........................................................................................................................................... 26
National Policy Framework for Land Transport Technology ............................................................................ 26
National key freight routes map ........................................................................................................................ 27
5. STAKEHOLDER PRIORITIES .................................................................................................. 28

2 Inquiry into National Freight and Supply Chain Priorities
Road and rail freight key facts
The domestic land based freight task totalled approximately 613 billion tonne kilometre from 2014-15. Of this, rail transported 65 per cent and road 35 per cent.
This freight task is expected to grow by 80 per cent between 2010 and 2030. Both road and rail will be needed to meet this growing freight task and avoid congestion at major ports.
Road freight is favoured for time sensitive and/or short distance freight; rail freight is more cost effective for long distance and/or bulk freight movements. In both sectors, governments typically own the underlying infrastructure (physical roads and rail lines) with the private sector competing to provide freight services through the operation of private truck and train fleets.
The road and rail freight sectors experienced significant productivity improvements during the 1970’s, 1980’s and 1990’s, due to reforms to national competition policy, introduction of high productivity vehicles in the road sector (e.g. B-doubles) and significant investment in physical infrastructure.
However, productivity growth has slowed more recently as the impacts of past reforms have been exhausted.
The National Heavy Vehicle Regulator and Office of the National Rail Safety Regulator were established in the early part of this decade to help drive productivity and safety improvements at a national level.
There is still progress to be made in respect to improving heavy vehicle access, charges reflecting funding for road use and harmonisation of national rail standards.
Technology, in particular automation of vehicles and train control systems, will potentially provide opportunities to industry to grow road and rail freight productivity levels again, but governments must be careful not to stifle innovation with regulation.

SUPPORTING PAPER NO. 3–ROAD AND RAIL FREIGHT 3
1. Introduction
Road and rail freight networks are crucial to Australia’s economic and social well-being. Supply chains that use these networks must navigate a complex series of nodes and links. Nodes may vary from a single household to an airport, port, intermodal terminal (where freight is transferred from one vehicle type to another), or a city. Links can vary from an unformed rural road or light rail link to a sealed, multi-lane freeway or major interstate rail or private resource sector rail network.
The domestic freight task, which moves across these networks and supply chains, has doubled in size over the past 20 years, averaging growth of 3.5 per cent per annum. Road and rail move the majority of this domestic freight (see Figure 1). The land freight task was 613 billion tonne kilometre from 2014 to 2015, of this, rail transported 65 per cent and road 35 per cent.1
Figure 1 – Domestic freight task by mode from 1960 projected to 20302
1 BITRE (2016), Australian infrastructure statistics: yearbook 2016, Statistical Report, https://bitre.gov.au/publications/2016/yearbook_2016.aspx, page 55 2 BITRE (2009), Road and Rail Freight: Competitors or Complements?, https://bitre.gov.au/publications/2009/is_034.aspx,page 2
4 Inquiry into National Freight and Supply Chain Priorities
2. Overview of the road and rail freight sectors
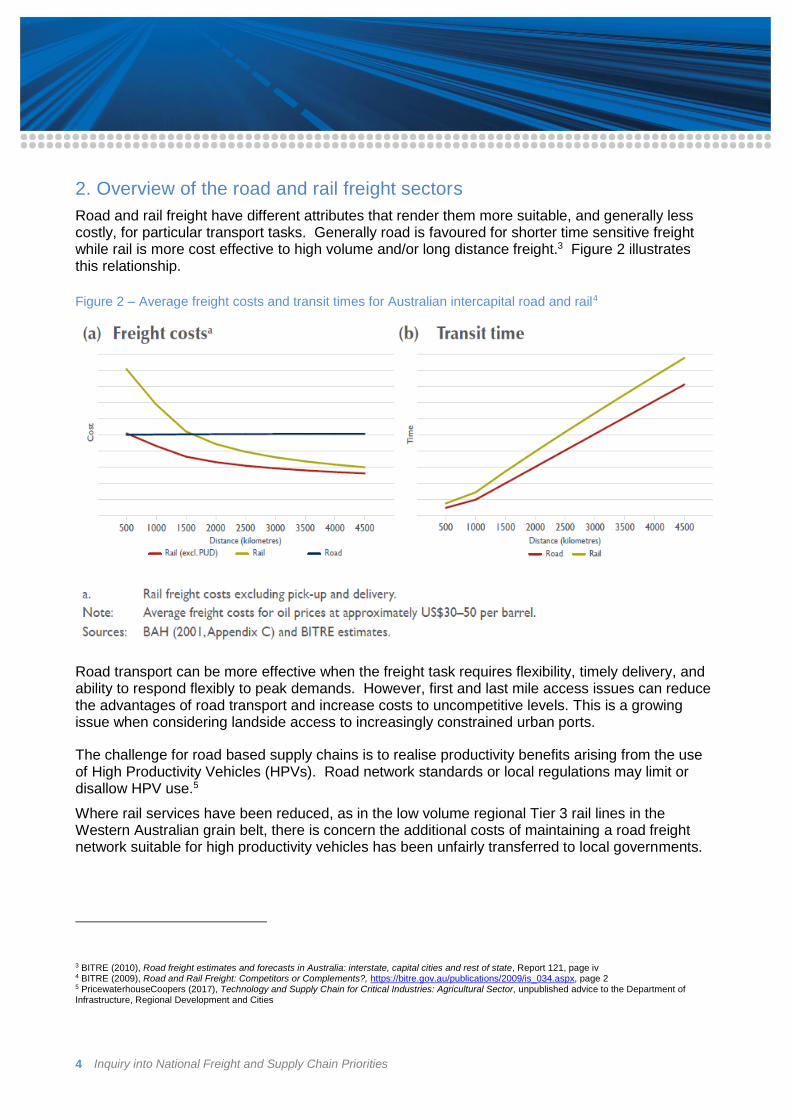
Road and rail freight have different attributes that render them more suitable, and generally less costly, for particular transport tasks. Generally road is favoured for shorter time sensitive freight while rail is more cost effective to high volume and/or long distance freight.3 Figure 2 illustrates this relationship.
Figure 2 – Average freight costs and transit times for Australian intercapital road and rail4
Road transport can be more effective when the freight task requires flexibility, timely delivery, and ability to respond flexibly to peak demands. However, first and last mile access issues can reduce the advantages of road transport and increase costs to uncompetitive levels. This is a growing issue when considering landside access to increasingly constrained urban ports.
The challenge for road based supply chains is to realise productivity benefits arising from the use of High Productivity Vehicles (HPVs). Road network standards or local regulations may limit or disallow HPV use.5
Where rail services have been reduced, as in the low volume regional Tier 3 rail lines in the Western Australian grain belt, there is concern the additional costs of maintaining a road freight network suitable for high productivity vehicles has been unfairly transferred to local governments.
3 BITRE (2010), Road freight estimates and forecasts in Australia: interstate, capital cities and rest of state, Report 121, page iv 4 BITRE (2009), Road and Rail Freight: Competitors or Complements?, https://bitre.gov.au/publications/2009/is_034.aspx, page 2 5 PricewaterhouseCoopers (2017), Technology and Supply Chain for Critical Industries: Agricultural Sector, unpublished advice to the Department of Infrastructure, Regional Development and Cities

SUPPORTING PAPER NO. 3–ROAD AND RAIL FREIGHT 5
In northern Australia, roads can be closed for months after a wet season and impassable for periods at other times of year. This is affecting newer industries such as the live cattle export and the tropical fruit industries, as well as the traditional agricultural industries in regional Australia. The differences in freight task by mode can be seen using NSW as in example in Figure 3.
Figure 3 – NSW freight mode share for selected commodities 20116
6 Transport for NSW (2013), NSW Freight and Ports Plan, https://www.transport.nsw.gov.au/projects/strategy/nsw-freight-and-ports-plan, page 23

6 Inquiry into National Freight and Supply Chain Priorities
Fundamentally almost all supply chains involve multiple transport modes, are complex and multi-faceted with a myriad of tasks spread over many origin destination routes. The supply chain needs of each end user are bespoke and reflect the specific circumstances of their individual operations and transport tasks. An example of supply chain transport options for urban freight in Sydney is presented at Figure 4.
Figure 4 – Sydney urban freight supply chain7
Key importance of intermodal terminals in enabling freight transfer
An intermodal facility is any site or facility along the supply chain that contributes to freight movement by providing efficient transfer of goods from one mode of transport to another. They also act as consolidation/deconsolidation sites and storage facilities. Facilities may range from transfer points that provide a limited set of services, to purpose-built terminals or hubs, designed for transfers, storage, distribution and a host of associated services.
7 PwC (2017), Sydney Urban Freight, Case Study, unpublished advice to the Department of Infrastructure, Regional Development and Cities

SUPPORTING PAPER NO. 3–ROAD AND RAIL FREIGHT 7
The intermodal terminal is where the commercial and operational needs of many parties to an individual cargo movement come together.8
Intermodal terminals matter because they play a key role in permitting the most appropriate mode of transport to be used for different elements of the transport task, combining the flexibility of road operations with the line-haul efficiency of rail transport9. There are three main types of intermodal terminal:
regional terminals, which generally facilitate point to point rail access to their destination market (intrastate/ Import-Export (IMEX)/interstate)
metropolitan intermodal terminals which focus on inter/intrastate freight and small amounts of IMEX
port terminals, which focus almost exclusively on IMEX.10
3. Road and rail in Australia today
Roads, together with rail, form the land transport network. Virtually all the physical infrastructure associated with road and rail freight transport is owned by government (whether that be local, state or Commonwealth), though sometimes operated by industry under lease.
Industry, and/or corporatised government entities like the Moorebank Intermodal Company, own and operate the freight vehicles and terminals that move freight across these networks. The notable exception to this being single use networks like those in the Pilbara, which are vertically integrated.11
Road
The structure of the road freight transport industry is highly complex. In 2002, there were approximately 47,000 businesses.12
Businesses involved range from a few large multinationals through to numerous sole traders (see Figure 5).
8 The Great Freight Task: Is Australia’s transport network up to the challenge?, House of Representatives Standing Committee on Transport and Regional Services, 13 August 2007, page 163 9 National Intermodal Terminal Study, Final Report, February 2006, Meyrick and Associates, Page 5 10 PwC (2017), Intermodal Terminals Guidance, prepared for the Department of Infrastructure, Regional Development and Cities, unpublished 11 Vertical integration for rail service and infrastructure is used to refer to the situation in which the owner of the track infrastructure is permitted to provide the rail service on that infrastructure. Rail structures, ownership and reform, briefing paper Number CBP 7992, 27 July 2017, by Andrew Haylen and Louise Butcher, page 5 12 Who Moves What Where, Freight and Passenger Transport in Australia, Final Report, https://www.ntc.gov.au/Media/Reports/(D62E6EFC-36C7-48B1-66A7-DDEF3B04CCAE).pdf, August 2016, National Transport Commission, page 24

8 Inquiry into National Freight and Supply Chain Priorities
Figure 5 – Profile of vehicle ownership13
Demand for road freight transport services can be met either through in-house provision of road freight services or out sourcing. This leads to the distinction between ancillary and ‘hire and reward’ sections of the road freight transport industry.
Ancillary operations involve the carriage of freight by vehicles owned by firms whose main business is normally non-transport related. Hire and reward operations involve the carriage of freight for another firm on a contractual basis. Ancillary operations tend to be less cost efficient than the hire and reward operations.14
Competition remains the dominant feature of the industry (the largest four firms have a combined market share of only 15 per cent) and profit margins are becoming much tighter over time. Owner drivers/small freight operators account for less than 12 per cent of the industry’s operating income, but they represent nearly two thirds of the total number of operating businesses (Figure 6).15
13 PwC (2013), Australian Trucking Association: A future strategy for road and supply and charging in Australia, Final Report, http://www.truck.net.au/system/files/industry-resources/Future%20strategy%20for%20road%20supply%20and%20charging%20FINAL%20FOR%20WEB.pdf 14 BITRE (2003), An Overview of the Australian Road Freight Transport Industry, https://bitre.gov.au/publications/2003/files/wp_060.pdf, pp. 3-4 15 BITRE (2003), An Overview of the Australian Road Freight Transport Industry, https://bitre.gov.au/publications/2003/files/wp_060.pdf, pp. 3-4

SUPPORTING PAPER NO. 3–ROAD AND RAIL FREIGHT 9
Figure 6 – Road freight transport businesses in operation (state, turnover)16
Road freight industry characteristics mean that there are relatively few individual road freight operators who have the capacity to invest in capital intensive upgrades to their fleets.17
When freight movements by state and territory are broken down by total tonnes carried and kilometres travelled, the importance of freight for capital cities can be seen (Figure 7).
In other states, such as Queensland and Western Australia, while freight movements are more decentralised capital city freight is still a significant part of the total freight task.
16 Bankwest (2014), Road Freight Transport Industry Report, p. 7 17 Allen Consulting Group (2010), Road Access Improvement Regime, http://infrastructureaustralia.gov.au/policy-publications/publications/files/Road_Access_Improvement_Regime_Final_Issues_Paper_06092010.pdf, p. 5

10 Inquiry into National Freight and Supply Chain Priorities
Figure 7 – Road freight carried by jurisdiction18
18 National Transport Commission (2017), Who Moves What Where, Freight and Passenger Transport in Australia, Final Report, page 82

SUPPORTING PAPER NO. 3–ROAD AND RAIL FREIGHT 11
Figure 8 shows the inter and intrastate road freight task.
Figure 8 – Road freight movement across Australia19
The road freight transport industry’s revenue is expected to grow by 2.9 per cent per annum from $51.9 billion in 2014-15 to $60.2 billion in 2020-21, with growth projections marginally higher than that of GDP, which is expected to grow by 2.5 per cent per annum over the same period.20
Rising fuel prices in 2017-18 are expected to be partially passed on to clients in the form of fuel surcharges, boosting industry revenue by 1.7 per cent in the current year. The comparatively low price of crude oil over much of the past five year period has supported industry profit margins, which have increased slightly over the period.21
The road transport industry accounts for 2 per cent of the Australian workforce, however it accounted for 17 per cent of work related fatalities in 2015 and 4 per cent of serious workers’ compensation claims in 2014-15.22
‘Roads’ as an infrastructure sector comprise: pavements; interchanges; ramps; overpasses and roundabouts; bridges and tunnels; parking; signage; signalling; and intelligent transport systems.
19 BITRE (2014) 20 Bankwest (2014), Road Freight Transport Industry Report, page 7 21 IBISWorld (2017), Road Freight Transport in Australia: Market Research Report, https://www.ibisworld.com.au/industry-trends/market-research-reports/transport-postal-warehousing/road/road-freight-transport.html 22 Safe Work Australia (2016), Road Transport Industry Profile, page 2

12 Inquiry into National Freight and Supply Chain Priorities
The key sub-sectors are:
public roads — urban/non-urban highways, arterials, local roads and busways
private roads.
Private roads are owned and maintained for access on private land or to public roads. This may include significant vehicle traffic such as at ports, airports, intermodal terminals and industrial sites, to much less heavily used private access for local businesses, communities and private residences.
Toll roads are the principal means for private operation of high volume, public roads where the private financing and operational characteristics support a commercial return. Toll roads in Australia only exist in the three largest capital cities: Sydney; Melbourne; and Brisbane. Most, but not all, toll roads are privately operated. The private operation of toll roads is generally by 25 to 30 year leases from the relevant state government.
The typical design of roads is broadly based across local and international sub-contractors. Australian-based pavement technology research expertise is maintained by joint roads agency ownership of the Australian Road Research Board.
Rail
The significance of the rail industry (and the critical contribution it makes to Australia's economy) has, over recent years been increasingly recognised. In 2015-16 freight rail carried 1.3 billion net tonnes of freight and contributed around $5.1 billion to the Australian economy in its own right.23 BITRE expects this volume will continue to grow by 3 per cent per annum until 2030.24
By 2030 the total national rail freight task is projected to be more than 1.9 times its 2010 level compared with roads and 1.8 times its 2010 level, predominantly due to continued growth in iron ore exports.25 In volume terms, around 98 per cent was bulk freight and 2 per cent was intermodal freight. While smaller in absolute size, intermodal traffic tends to be moved over comparatively longer distances.26
23 BITRE (2017), Trainline 5, Statistical Report, https://bitre.gov.au/publications/2017/train_005.aspx, page v, and advice provided by Ernst and Young to the Department of Infrastructure, Regional Development and Cities (2015) 24 BITRE (April 2009), Road and rail freight: competitors or complements?, Information Sheet 34, https://www.bitre.gov.au/publications/2009/files/is_034.pdf 25 BITRE (2014), Freightline 1 – Australian freight transport overview, http://www.bitre.gov.au/publications/2014/freightline_01.aspx 26 BITRE (2017), Trainline 5, Statistical Report, https://bitre.gov.au/publications/2017/train_005.aspx, page 5

SUPPORTING PAPER NO. 3–ROAD AND RAIL FREIGHT 13
As shown in Figure 9 there are two broad above rail freight markets in Australia:
resource networks moving predominately bulk freight which tend to be operated by the private sector with minimal government involvement and generate commercial returns
interstate and intrastate mixed use lines have greater government involvement and often do not have commercially profitable traffic volumes. These lines move both non-bulk and bulk freight, including containerised intermodal freight.
Figure 9 – National rail freight task, 2007-08 to 2015-1627
The Australian rail sector is mostly characterised by separation of above- and below-rail operations, with the exception of some private minerals networks (notably the Pilbara), some grain railways, the Tarcoola to Darwin line, TasRail in Tasmania and Aurizon in Queensland.28
Above-rail activities refer to train operating activities, while below-rail refers to railway activities relating to infrastructure, such as tracks, stations, signals, tunnels and bridges.29
27 BITRE (2017), Trainline 5, Statistical Report, https://bitre.gov.au/publications/2017/train_005.aspx, page 6 – Note data for 2010-11 and 2011-12 is not available 28 Vertical separation is the institutional separation of the entity responsible for owning and managing railway infrastructure from the companies who operate trains upon it - Amos (September 2006), Railway Reform: Vertical Integration and separation, Railway Seminar and Study Tour, World Bank 29 BITRE (2003), Rail Infrastructure Pricing: Principles and Practice, Report 109, https://www.bitre.gov.au/publications/2003/report_109.aspx

14 Inquiry into National Freight and Supply Chain Priorities
Freight train operators are highly consolidated compared to road operators. They can be broadly categorised into the following groups:
National operators: Aurizon and Pacific National operate in most states and haul a range of products. The companies core activities are coal haulage in Queensland and New South Wales. Both companies operate interstate intermodal services, though Aurizon is currently withdrawing from the intermodal market and will cease intermodal operations at the end of 2017.
Regional operators: Genesee & Wyoming Australia haul ores, grain, agricultural produce and intermodal in the Northern Territory, South Australia and New South Wales. Other significant regional operators include Southern Shorthaul Railroad (New South Wales and Victoria), TasRail (Tasmania) and Watco (Western Australia).
Logistics companies: SCT Logistics and Qube Holdings operate intermodal services that fit into their broader logistics chains. Qube also operates a limited number of bulk services and specialises in regional/short haul transport of freight for export.
Mining companies: A number of mining companies (including the aforementioned mining companies in the Pilbara; the Karara Mining Company in the Mid West Region (WA); and Mineral Resources in the Yilgarn Region (WA) operate their own trains.

SUPPORTING PAPER NO. 3–ROAD AND RAIL FREIGHT 15
Australian Rail Networks by infrastructure manager can be seen in Figure 10.
Figure 10 – Rail networks and owners30
Australia’s rail fleet comprises approximately 2,025 locomotives, of which 50 per cent are 13 years old or younger.31 In 2017, the total contribution of the rail industry to GDP (direct and indirect) was $26 billion and 142,288 full time equivalent workers, making up to 1.6 per cent of the Australian economy.32
30 BITRE (2017), Trainline 5, Statistical Report, https://www.bitre.gov.au/publications/2014/files/trainline_002.pdf 31 BITRE (2017), Trainline 5, Statistical Report, https://www.bitre.gov.au/publications/2014/files/trainline_002.pdf, pages 68-69 32 Deloitte Access Economics (2017), Value of rail: the contribution of rail in Australia, Report, https://www2.deloitte.com/au/en/pages/economics/articles/value-rail.html

16 Inquiry into National Freight and Supply Chain Priorities
Road and rail productivity
While road and rail transport productivity has stagnated more recently, the 1980s and 1990s saw a dramatic increase to both road and rail productivity performance. In rail this was caused by:
the introduction of longer trains and higher axle mass limits
increased utilisation of the network following major investments (such as longer passing loops)
completion of gauge standardisation of interstate network linking capital cities
structural and regulatory reforms that saw the downsizing of the rail workforce, corporatisation of previously government run below rail operations (i.e. through the creation of the Australian Rail Track Corporation) and privatisation of above rail operations (i.e. National Rail was privatised and became Pacific National).
These reforms resulted in rail freight productivity increases of nearly 10 per cent per year over the period 1990 to 1998.33
Key measures that drove the growth in road productivity included:
the introduction of and expanded network access for larger heavy vehicle combinations, particularly B-double articulated trucks
progressive increases in regulated heavy vehicle mass and dimension limits
strong growth in long distance freight
cumulative long term investment in major road infrastructure, particularly the realignment and duplication of parts of the inter-capital national highway network.34
Productivity growth of heavy freight vehicles, that is, rigid and articulated trucks, has increased almost six-fold since 1971. Articulated trucks alone have contributed over 90 per cent of the increase in total road freight vehicle productivity.35
The introduction of B-double articulated trucks in the late 1980s, in particular, revolutionised the freight task in Australia, making road freight transport cheaper as well as safer and more environmentally efficient.36
33 Productivity Commission (2006), Road and Rail Freight Infrastructure Pricing, Inquiry Report 41, https://www.pc.gov.au/inquiries/completed/freight/report/freight.pdf 34 BITRE (2011), Truck productivity: sources, trends and future prospects, Report 123, https://bitre.gov.au/publications/2011/files/report_123.pdf 35 BITRE (2011), Truck productivity: sources, trends and future prospects, Report 123, https://bitre.gov.au/publications/2011/files/report_123.pdf 36 NHVR (2017), About Performance-Based Standards, https://www.nhvr.gov.au/road-access/performance-based-standards/about-performance-based-standards

SUPPORTING PAPER NO. 3–ROAD AND RAIL FREIGHT 17
See Figure 11 for details on the safety outcomes of B-doubles compared with single semi-trailer and B-triple vehicles.
Figure 11 – Safety outcomes by heavy vehicle type37
Future technological trends
The rail sub-sector in Australia is starting to see the introduction of digital train management systems. These systems are expected to significantly upgrade the capabilities of the rail industry in Australia and improve:
rail network capacity
operational flexibility
train service availability
transit times
rail safety and system reliability.
37 Vicroads (2015), Moving more with less, https://www.nhvr.gov.au/files/vicroads-moving-more-with-less.pdf, page 3

18 Inquiry into National Freight and Supply Chain Priorities
Operators are preparing for driverless trains to be rolled out on the Sydney Metro North West passenger line, due to open in 2019, and on freight lines in the Pilbara. For the general freight network this process has commenced with the Australian Rail Track Corporation (ARTC, manager of the majority of the interstate standard gauge rail network) working with Lockheed Martin to develop the Advance Train Management System (ATMS) for use on the ARTC network.
The ATMS is a satellite digital safe working system that allows centralised train control from one location. ATMS has successfully been trialled with the first phase of the roll out currently underway. Digital train protection systems are also planned to be rolled out across many urban rail networks over the next decade.
States and territories are also looking to introduce similar types of digital train control systems for metro and regional systems, though theirs are radio based and compatibility issues with ATMS are emerging. Improvements in train productivity are also being driven by the introduction of new technologies such as regenerative braking in locomotives in the Central Queensland Coal Network.
The introduction of larger road vehicle configurations carrying heavier loads across permitted parts of the road network is also expected to continue. This should lead to decreases in the number of vehicle trips required for the freight task, improving safety and emissions outcomes and traffic congestion. Though data is not yet available, it is anticipated that in 2016-17, the weight of freight vehicle loads again increased.
Increased use of technology to monitor compliance, vehicle emissions, safe driving behaviours, location and route choice will continue to be developed by both government and private organisations, alongside the development of fully-automated vehicles for both freight and passenger transport.
For a range of reasons, notably the potential financial impact on small businesses operating in the transport industry, the Australian Government has not supported the mandatory introduction of so called ‘black box’ technologies.
Noting the pace of technological change, the ever-reducing costs, and growth of ‘there’s an app for that’, there is scope for governments to consider mandating the fitment or use of technologies which have the potential to improve productivity and/or save lives.
Further technological trends in the road sector which may impact on efficiency and/or productivity of freight services include:
platooning—heavy vehicle platooning, where a single driver is able to control two or more heavy vehicles in a convoy. This will reduce congestion by minimising the distance between the lead vehicle and trailing vehicles as braking, accelerating and speed are synchronised across the platoon
automation—particularly for road and rail vehicles, aerial drones and freight handling equipment. On-road vehicles are moving toward requiring little (or no) human monitoring
connected vehicles—wireless communications will allow vehicles to work cooperatively by sharing safety and other messages in real-tim;
network optimisation—including through approaches such as advanced data analysis for planning and operations, predictive maintenance and managed motorway deployments
changing nature of demand—consumers are increasingly expecting 24/7, same-day

SUPPORTING PAPER NO. 3–ROAD AND RAIL FREIGHT 19
delivery of their orders, directly to their homes or to nearby pick-up sites, potentially resulting in the need for new modes of delivery for freight transport
alternative fuels—falling costs and new storage options are likely to make vehicle electrification more popular in the future. Hydrogen fuel cells and less carbon intensive fuels (for example, LNG in the maritime sector) could also be significant trends.
Many of these technologies are complementary and could result in a more integrated transport system in the future. For example, a future road freight transport system could revolve around vehicles that are automated, connected, shared and electric.
Challenges for regional and remote road and rail freight
Regional and remote freight supply chains face multiple challenges including distance, dispersed population, poor or non-existent infrastructure and harsh climate. These impact on all aspects of life in regions. From resupplying spare parts to mining enterprises, getting crops and products to ports and markets, delivering fuel to isolated homesteads, and feeding the people who live in regional and remote communities.
Remoteness and uncertain access increases costs for business. Companies keep larger inventories than necessary to meet access contingencies, maintenance and repair costs are higher for transport operators, and in turn for the businesses they serve. In addition, remoteness means it is harder to access and use the most efficient road and rail vehicles, adding more cost to freight operations
The Northern Australia White Paper pointed to the potential of our northern areas and noted its connection with Australia’s key trading markets in Asia.38 However, to unlock this potential, the challenges need to be addressed and traditional methods of analysis of priorities and funding need to be re-examined. Proposals for new investment can fail traditional benefit cost analysis as the benefits are different to those achieved in other parts of the country and are often difficult to quantify in monetary terms.39
Where roads are closed, due to the wet season in the Northern Territory for example, transport by air is often the only viable alternative for inland locations. Funding for maintaining and upgrading airstrips is limited, with responsibility for this task divided between local and state governments.
Challenges for urban road and rail freight
The urban freight task has complex logistics with a myriad of freight originators and destinations. The task has changed in recent years, reflecting a major reduction in manufacturing in south east Australia, increased global sourcing of products and increased consumption of consumer goods.40
The decline in Australia’s manufacturing base has created a significant imbalance in trade with
38 Australian Government 2015. Our North, Our Future. White Paper on Developing Northern Australia, http://northernaustralia.gov.au/files/files/NAWP-Full Report.pdf 39 Transport and Infrastructure Council (2015), National Remote and Regional Transport Strategy, http://transportinfrastructurecouncil.gov.au/nrrts.aspx, page 8 40 PricewaterhouseCoopers 2017 Technology and Supply Chain for Critical Industries: Urban Freight, unpublished advice for the Department of Infrastructure, Regional Development and Cities

20 Inquiry into National Freight and Supply Chain Priorities
non-bulk imports exceeding exports, with most of the import volume destined for the urban areas adjacent to the port of import.41 In Brisbane, 93 per cent of import containers were unpacked and 74 per cent of exports were packed within 100 kilometres of the Port of Brisbane.42
Changes to retailing habits arising from on-line purchasing and rapid delivery are promoting many trips by smaller vehicles and vans, putting more vehicles on the road and reducing efficiency.
Changes in consumer preferences mean that retail stores require more frequent restocking, increasing traffic into loading areas and creating problems for truck parking. Increasing levels of consumer delivery driven by on-line purchasing results in many part loads in urban delivery vans. The development of urban consolidation centres could increase efficiency of the final delivery process by reducing travel distances and utilising smaller vehicles.
Clearer conversations with communities about the complexities and trade-offs for a truly liveable, efficient, affordable city are also critical, and need to be underpinned with better evidence and transparency. Integrated planning for the freight and logistics task, as cities grow, now needs to take its place alongside other important agendas such as urban renewal and affordable housing, efficient passenger transport networks, liveability and greening.
4. Current reforms underway
National transport reforms
In July 2009, the Council of Australian Governments (COAG) agreed to implement national regulatory systems for maritime safety, rail safety and heavy vehicles, with the aim of improving safety and reducing costs and regulatory burden for Australian transport companies. This agreement was backed by 2011 COAG Intergovernmental Agreements for each of the three transport reforms.43
The national transport reforms were predicted to deliver up to $30 billion dollars in benefits to the Australian economy over 20 years, whilst making business easier and cheaper for transport operators and enhancing safety across each sector.44 A post-implementation review of the national transport regulators is considered appropriate.
National rail safety law reform
The benefits of the national rail safety reforms were estimated at between $28 million and $71 million over 10 years.45
The Office of the National Rail Safety Regulator (ONRSR) commenced operations in January 2013 and as at July 2017, all states and territories have now passed enabling legislation for the application of the Rail Safety National Law.46
Also, in January 2013, the Australian Transport Safety Bureau expanded its role to be the national
41 National Transport Council (2016). Who Moves What Where, https://www.ntc.gov.au/Media/Reports/(D62E6EFC-36C7-48B1-66A7-DDEF3B04CCAE).pdf, page 77 42 ] Port of Brisbane P/L and the Queensland Transport and Logistics Council (2013), Import/Export Logistics Chain Study, https://www.portbris.com.au/PortBris/media/General-Files/Factsheets%20and%20brochures/1PoB-Logistics-Chain-Study_Sept-2013_web.pdf 43 Council of Australian Governments (2017), Agreements, https://www.coag.gov.au/agreements?page=1 44 Albanese (2012), Ports Australia Biennial Conference: Driving a National Focus on Ports and Shipping, Speech, http://parlinfo.aph.gov.au/parlInfo/search/display/display.w3p;query=Id%3A%22media%2Fpressrel%2F2197177%22 45 National Transport Commission (2012), Rail Safety National Law: Regulatory Impact Statement, https://www.ntc.gov.au/Media/Reports/(8A9C7950-C762-5162-E68F-B77C7EC8C624).pdf 46 Office of the National Rail Safety Regulator (2017), About ONRSR, https://www.onrsr.com.au/about-onrsr

SUPPORTING PAPER NO. 3–ROAD AND RAIL FREIGHT 21
‘no blame’ rail safety investigator.
The practical benefits of national rail safety regulation include national accreditation for rail transport operators, removing duplication of auditing, monitoring and inspection processes for interstate rail operators, and the improved availability of resources and specialist knowledge to inform decision making and safety investigations.
National Heavy Vehicle Regulator
Austroads research indicated that higher productivity vehicles could deliver $12.6 billion in real benefits to Australia by 2030, with a significant proportion of benefits to come from improving road access.47
The purpose of the National Heavy Vehicle Regulator (NHVR) is to administer a national system that delivers consistent and streamlined regulatory services and administration to the Australian heavy vehicle road transport sector, reducing regulatory burden whilst enabling greater safety and productivity. See Figure 12 for examples of heavy vehicles.
As at July 2017, the NHVR operates in all jurisdictions except the Northern Territory and Western Australia.
When considering whether to grant access to heavier vehicles, road managers (state and local governments) apply criteria including:
whether a heavy vehicle ‘fits’ on a given road
whether the road is strong enough to support it.48
However, despite the establishment of the NHVR and the National Harmonisation Project to facilitate access to the network, governments have been reluctant to grant increases in heavy vehicle access. When they have, they have mostly been associated with very limited road access. The last major increase to heavy vehicle dimensions was in the late 1980s, when B-double vehicles were granted broad access to Australian roads.49
In particular, local governments, which own and maintain some 650,000 kilometres of local roads,50 have to balance access applications with community concerns about bigger vehicles and expensive assessment processes in relation to gauging structural strength of bridges and other road infrastructure pieces.51
47 Austroads (2014), Quantifying the Benefits of High Productivity Vehicles, AP-R132-15, https://www.onlinepublications.austroads.com.au/items/AP-R465-14 48 National Transport Commission (2017), Increasing heavy vehicle volumetric load capacity without increasing mass limits, Policy Paper, https://www.ntc.gov.au/Media/Reports/(9803521D-149B-7061-837F-E368A4097325).pdf, p. 11 49 National Transport Commission (2016), Increasing heavy vehicle volumetric load capacity without increasing mass limits, Issues paper, https://www.ntc.gov.au/Media/Reports/(9803521D-149B-7061-837F-E368A4097325).pdf 50 Australian Local Government Association (2006), Roads and Transport Strategy 2006-2016, http://alga.asn.au/?ID=240 51 Dudgeon and Findlay (2016), High Productivity Vehicle Costs and Selected Freight Policy Implications, Australasian Transport Research Forum, http://atrf.info/papers/2016/files/ATRF2016_Full_papers_resubmission_143.pdf

22 Inquiry into National Freight and Supply Chain Priorities
Figure 12 – classes of heavy vehicles52
52 Marucchi (2006), Summary Table of Heavy Vehicle Types, http://www.marucchi.it/Replica/Table5.gif

SUPPORTING PAPER NO. 3–ROAD AND RAIL FREIGHT 23
National Road Safety Action Plan
Under the National Road Safety Action Plan 2018-2020, the Commonwealth is proposing that it and states and territories minimise regulatory barriers for modern heavy freight vehicles, to encourage the greater uptake of newer, safer, cleaner vehicles into the Australian fleet.
For example, to meet current Australian regulations, heavy freight vehicles must be 50 to 100mm (2-4%) less in width than vehicles in other major markets. This costs manufacturers $15-30 million per year to redesign their vehicles for Australia, reducing the availability of models. It can also mean the removal of safety equipment, for example side underrun barriers, to reduce width.
Better harmonising of dimensions and axle mass limits with major markets may also give an opportunity to increase productivity, by allowing for standardised loads to be carried. For example, side door shipping containers have an overall width, including hinges, of 2,530mm, complying with European heavy freight vehicle designs. By revising load limits in parallel with vehicle limits, efficiencies could be gained when transporting freight on Australian roads.
Heavy vehicle road reform
An issue with strong links to freight productivity and with increasing relevance for governments is the sustainability of road-related revenue. For industry, the importance of reform in this area is in better matching the cost of road use with the level of service provided.
Heavy vehicle road reform (HVRR) is the long term microeconomic reform process that the Transport and Infrastructure Council and COAG have agreed to progress in response to this challenge and other shortcomings of current road management arrangements. It aims to improve productivity for the heavy vehicle industry by establishing a clear link between the needs of users, the charges they pay and the services they receive.
Freight productivity
By better linking road use to expenditure, HVRR will provide the freight industry and governments with the option to improve access for large vehicles and oversize loads across the road network. This is because HVRR will in time provide mechanisms (such as a forward looking cost base and dedicated road infrastructure funding) to recoup the costs of heavy vehicle road use across the road network.
Businesses, could for example, be granted improved access to first and last mile connections. This has already been demonstrated in South Australia through the 90-Day Change@SA trial, which delivered improved access for oversize agricultural machinery.53 Benefits accrue through improved access because it can reduce the length and/or number of trips a vehicle has to take, and thus reduce vehicle operating costs and time. It also allows the use of higher productivity vehicles across a wider range of roads, resulting in a more efficient mix of heavy vehicles being used. Currently, if road providers (particularly local governments) provide access to larger heavy vehicles, it is unlikely they will receive the funding flows or economic benefits resulting from this access.
The benefits of HVRR would be realised across the economy, but particularly in freight intensive
53 Brock (2016), Night movement allowed for oversize agricultural vehicles, https://www.premier.sa.gov.au/index.php/geoff-brock-news-releases/987-night-movement-allowed-for-oversize-agricultural-vehicles

24 Inquiry into National Freight and Supply Chain Priorities
industries like agriculture, forestry, mining and manufacturing. Getting goods more efficiently into and out of transport hubs will improve the profitability of the industries reliant on these hubs and the economic welfare of surrounding areas. See Figure 13 for a full list of benefits expected once HVRR is fully implemented.
Figure 13 – Heavy vehicle infrastructure as an economic service with an integrated charging system54
54 Transport and Infrastructure Council (2016), Heavy Vehicle Road Reform – What we are doing and why we are doing it, http://transportinfrastructurecouncil.gov.au/publications/heavy_vehicle_road_reform.aspx
Advantages
Charges will reflect each user’s share of road costs.
Road owners have a direct incentive to invest in meeting heavy vehicle users' needs.
Usage data will support better planning and investment decision making.
Secure funding will help maximise efficient lifecycle management of road assets, reducing costs.
Independent economic regulation will ensure the 'right truck on the right road at the right time'.
Allows for transparent government funding on community service obligations.

SUPPORTING PAPER NO. 3–ROAD AND RAIL FREIGHT 25
Next steps
HVRR has been underway since late 2015. There are four phases to the reform which allow governments to take a deliberative, incremental approach. These are:
Phase 1: improve transparency of investment, expenditure and service delivery.
Phase 2: implement an independent price regulator and a forward-looking cost base.
Phase 3: return charges revenue to road owners based on use.
Phase 4: implement more direct user charging where appropriate.
Phase 1 of HVRR is largely complete, but subject to constant improvement and refinement. The Transport and Infrastructure Council website now includes detailed asset registers (showing heavy vehicle ratings for all key freight routes in Australia) and expenditure plans (showing state and territory planned investment on those same routes).55
Implementation of Phase 2 of HVRR is currently underway. In 2017, the Australian Government undertook a public consultation on independent price regulation of heavy vehicle charges, releasing a discussion paper in May 2017.
Work is also underway on the development of a forward looking cost base for roads. Moving to a forward looking (lifecycle) cost base and independent price regulation would bring heavy vehicle charges in line with other utility sectors and promote more optimal management of road infrastructure.
A number of design questions would need to be addressed before an independent regulator or a forward looking cost base could be implemented.
Consideration of other issues is beginning to take place, such as around community service obligations (CSOs) and how funding might be returned to road managers at state and local levels. Early analysis on CSOs has commenced across government through work such as the recent Austroads report, Community Service Obligations Framework for the Roads Sector.56
Urban rail plans
In November 2016, the Australian Government released its response to Infrastructure Australia’s Australian Infrastructure Plan. It included a commitment to working with the state governments to develop urban rail plans for Australia’s five largest cities (Sydney, Melbourne, Brisbane, Perth and Adelaide) and their surrounding regions.
The Department of Infrastructure, Regional Development and Cities has been engaging with the states, territories and stakeholders throughout 2017 on urban rail systems, challenges, opportunities and long-term policy options, as well as conducting internal and commissioned research.
The final urban rail plans are expected to be complete by the end of 2019.
55 Transport and Infrastructure Council (2016), Heavy Vehicle Road Reform – What we are doing and why we are doing it, http://transportinfrastructurecouncil.gov.au/publications/heavy_vehicle_road_reform.aspx 56 Austroads (2017), Community Service Obligations Framework for the Roads Sector, AP-R545-17, https://www.onlinepublications.austroads.com.au/items/AP-R545-17

26 Inquiry into National Freight and Supply Chain Priorities
National Rail Plan
The Transport and Infrastructure Council Senior Officials’ Committee (TISOC) agreed to update the existing National Rail Vision (NRV) and Work Program and to endorse a new governance structure for a National Rail Plan. The new National Rail Plan will help coordinate rail activities across multiple organisations to improve planning for rail industry reform priorities, minimise duplication, and target government activity where it can offer the best support to the rail industry. The National Rail Plan will encompass a range of work activities and reporting items to provide visibility to industry of work being undertaken across other areas of government activity.
Governments will consult with key industry stakeholders, which will include representatives from government and industry, to prepare the National Rail Plan and Work Program for endorsement at the next TISOC meeting.
The current NRV identified five broad areas of reform:
access, pricing and interoperability—including the possibility of a national access regulator
safety and incident regulation—completing the national adoption of the National Rail Safety Law
coordinated approaches to environmental regulation and corridor protection
funding and investment—collaboration on planning and investment across network interfaces
establishment of national rail performance measurement and management processes to allow a greater understanding of freight and dynamic system planning.57
National Policy Framework for Land Transport Technology
In August 2016, the Transport and Infrastructure Council agreed to the National Policy Framework for Land Transport Technology (the Framework), which outlines a principles-based approach to facilitate the efficient, effective and consistent implementation of transport technology across Australia. The Framework includes a focus on a range of technologies with the potential to deliver improvements to safety and productivity in the freight sector, such as connected and automated vehicles and intelligent transport systems.
The Framework outlines the following four roles for government:
policy leadership—providing a clear, nationally coordinated approach across different levels of government, being responsive to changes in the technological environment
enabling—ensuring that the private sector is able to bring beneficial new technologies to market
57 Transport and Infrastructure Council (2016), National Rail Vision, http://transportinfrastructurecouncil.gov.au/publications/files/National_rail_vision_and_work_program.pdf

SUPPORTING PAPER NO. 3–ROAD AND RAIL FREIGHT 27
supportive regulatory environment—ensuring that community expectations of safety, security and privacy are appropriately considered in new technology deployments
investment—investing in research, development and real-world trials that benefit the entire transport network customer base or provide a sound basis for government decision-making (including collaboration with the private sector).
The Framework is underpinned by a three-year action plan, which is currently being implemented by all jurisdictions and national transport bodies such as Austroads and the NTC. The Framework will help ensure Australia is an early adopter of beneficial technologies, increasing economic productivity and living standards and improving Australia’s international competitiveness.
National key freight routes map58
Australia is connected to the global economy through shipping and air movements which transport bulk commodities, containerised freight and general cargo. Australia's major ports, airports and intermodal terminals make up the freight nodes linked by road, rail, air and coastal shipping as a freight transport system.
The objective of the national key freight routes map is to represent the key freight routes in Australia that connect the nationally significant places for freight in Australia. High-level principles were developed for the nationally significant road and rail routes that connect:
existing and potential nationally significant places for freight such as:
o intermodal freight terminals
o industrial, mining and agricultural precincts
o significant freight destinations in regional centres
o interstate freight.
the road and rail routes that carry:
o high volumes of freight
o high value commodities
o a high frequency of heavy vehicles
o specific commodities of high economic significance for the region.
On its release in 2014, it was anticipated that in the longer term, the map would reflect improved information and the development of complementary freight-related initiatives.
58 The National Key Freight Routes Map can be accessed at http://maps.infrastructure.gov.au/KeyFreightRoute/
28 Inquiry into National Freight and Supply Chain Priorities
5. Stakeholder priorities
The Inquiry into National Freight and Supply Chain Priorities has undertaken extensive consultation with stakeholders and has received a number of suggestions for greater productivity in the road and rail freight sector. These include:
accelerating Heavy Vehicle Road Reform initiative
addressing access issues for HPV around key economic infrastructure
addressing rail freight conflicts with passenger rail
urban encroachment on operation of key freight routes (road and rail)
change of distribution flows, with intermediate consolidation centres in outer metro areas and rise of the ‘little white van’
rise of e-commerce and faster delivery
automation of freight road/rail and implications of different safety regimes on the ability of industry to adopt emerging technologies.

SUPPORTING PAPER NO. 3–ROAD AND RAIL FREIGHT 29

30 Inquiry into National Freight and Supply Chain Priorities