Supporting Online Material for - Science · Supporting Online Material ... shocks (unconditioned...
20
www.sciencemag.org/cgi/content/full/science.1195298/DC1 Supporting Online Material for Calcium-Permeable AMPA Receptor Dynamics Mediate Fear Memory Erasure Roger L. Clem and Richard L. Huganir* *To whom correspondence should be addressed. E-mail: [email protected] Published 28 October 2010 on Science Express DOI: 10.1126/science.1195298 This PDF file includes: Materials and Methods Figs. S1 to S11 References
Transcript of Supporting Online Material for - Science · Supporting Online Material ... shocks (unconditioned...

www.sciencemag.org/cgi/content/full/science.1195298/DC1
Supporting Online Material for Calcium-Permeable AMPA Receptor Dynamics Mediate Fear Memory
Erasure
Roger L. Clem and Richard L. Huganir*
*To whom correspondence should be addressed. E-mail: [email protected]
Published 28 October 2010 on Science Express DOI: 10.1126/science.1195298
This PDF file includes:
Materials and Methods Figs. S1 to S11 References
1
Supporting Online Material
Materials and Methods
Subjects
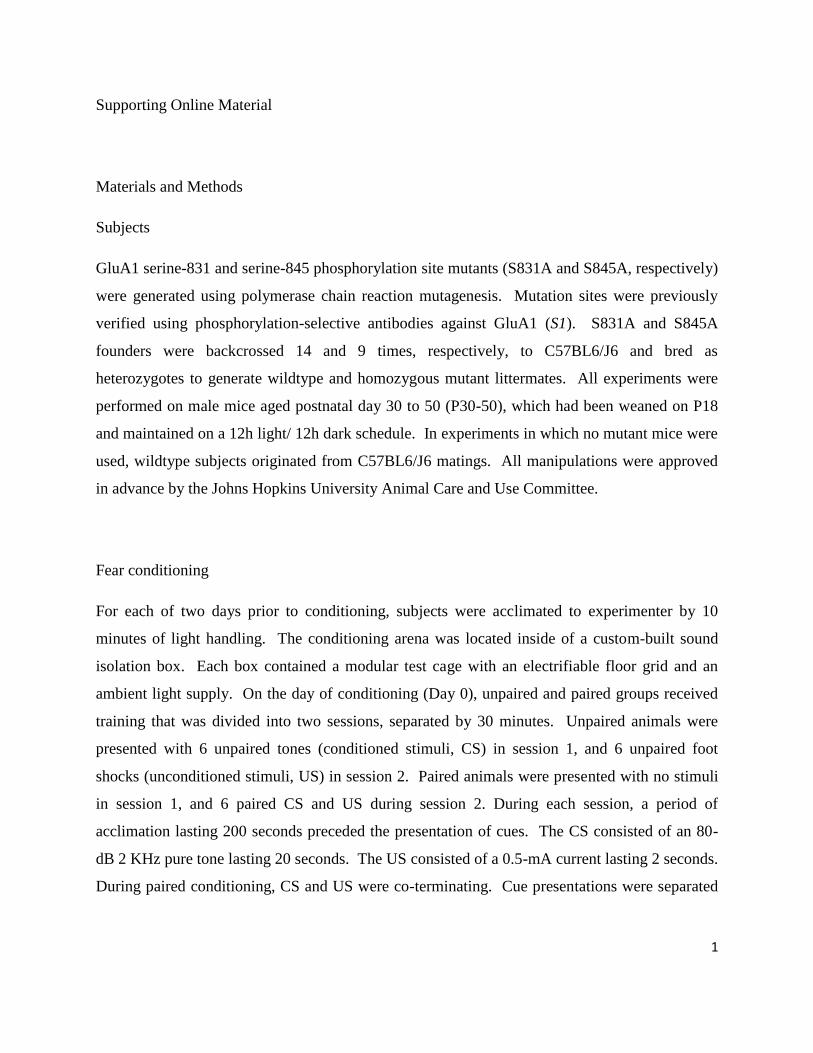
GluA1 serine-831 and serine-845 phosphorylation site mutants (S831A and S845A, respectively)
were generated using polymerase chain reaction mutagenesis. Mutation sites were previously
verified using phosphorylation-selective antibodies against GluA1 (S1). S831A and S845A
founders were backcrossed 14 and 9 times, respectively, to C57BL6/J6 and bred as
heterozygotes to generate wildtype and homozygous mutant littermates. All experiments were
performed on male mice aged postnatal day 30 to 50 (P30-50), which had been weaned on P18
and maintained on a 12h light/ 12h dark schedule. In experiments in which no mutant mice were
used, wildtype subjects originated from C57BL6/J6 matings. All manipulations were approved
in advance by the Johns Hopkins University Animal Care and Use Committee.
Fear conditioning
For each of two days prior to conditioning, subjects were acclimated to experimenter by 10
minutes of light handling. The conditioning arena was located inside of a custom-built sound
isolation box. Each box contained a modular test cage with an electrifiable floor grid and an
ambient light supply. On the day of conditioning (Day 0), unpaired and paired groups received
training that was divided into two sessions, separated by 30 minutes. Unpaired animals were
presented with 6 unpaired tones (conditioned stimuli, CS) in session 1, and 6 unpaired foot
shocks (unconditioned stimuli, US) in session 2. Paired animals were presented with no stimuli
in session 1, and 6 paired CS and US during session 2. During each session, a period of
acclimation lasting 200 seconds preceded the presentation of cues. The CS consisted of an 80-
dB 2 KHz pure tone lasting 20 seconds. The US consisted of a 0.5-mA current lasting 2 seconds.
During paired conditioning, CS and US were co-terminating. Cue presentations were separated
2
by 100 seconds. Following conditioning, mice were returned to their homecages until
preparation of brain slices or further behavioral examination.
Reconsolidation-update training
To develop a protocol for reconsolidation-update in mice, we relied on the initial descriptions of
this technique using rats (S2) and humans (S3) as subjects. In pilot experiments we determined
that adolescent mice required more CS trials to undergo robust extinction than were employed
during the reconsolidation period for rats (S2). Consequently, we modified the protocol of
Monfils et al. (S2) by increasing the number of CS during extinction, while maintaining the
defining feature of reconsolidation-update, the presentation of an isolated CS prior to extinction.
Extinction was divided into 2 blocks to minimize the confounding effect of increasing subject
inactivity on measurement of freezing after long periods of exposure to the extinction arena.
Reconsolidation-update was performed in a context distinct from that in which conditioning took
place. This arena consisted of a textured polymer box scented with acetic acid, vanilla or
pomegranate extract. A period of 100 seconds preceded the presentation of any CS. The
Retrieval group (those animals undergoing reconsolidation-update) were presented with 1 CS,
and then returned to their homecage. 30 minutes after the isolated CS, Retrieval animals
underwent extinction training divided into 2 blocks, which were separated by 30 minutes. Three
separate controls were used for physiological experiments. Unpaired controls were subjected to
unpaired fear conditioning and received no further manipulation until behavioral testing or brain
slice preparation. No-retrieval controls were treated identically to Retrieval animals, except that
the CS was omitted from the retrieval session and 1 additional CS was added to extinction block
1 to balance the total number of CS presented. Context-only controls received paired fear
conditioning and were exposed to the extinction context for an amount of time equivalent to
Retrieval and No-retrieval animals, but no CS were presented. CS consisted of 80-dB 2 KHz
pure tones lasting 20 seconds, separated by a 50-s interval during extinction. A total of 19 CS
were delivered during each extinction block, except in the case of block 1 for No-retrieval
controls, as stated above. After reconsolidation-update, mice were returned to their homecages

3
until sacrificed for preparation of brain slices, or until further behavioral examination was
conducted.
Spontaneous recovery and renewal tests
After reconsolidation-update training, mice were returned to the extinction arena and presented
with 4 CS to measure spontaneous recovery of fear. 30 minutes later, the same animals were
placed in the conditioning arena and presented with 4 CS to measure renewal. While
spontaneous recovery can in principle manifest at any point after extinction, our analysis
indicated that 6 days (but not 1 day) was sufficient time for freezing in No-retrieval controls to
recover to levels comparable to pre-extinction and to renewal. Furthermore, the level of freezing
observed on Day 7 in No-retrieval controls was not significantly different than Context-only
controls, suggesting 6 days is sufficient time for substantial spontaneous recovery.
Measurement and analysis of fear behavior
Percentage time freezing during CS presentation was quantified using automated motion
sensitive software. A single set of algorithmic parameters optimized to the age range of our
subjects were used for every experiment. For longitudinal studies of fear relapse, statistical
analysis of mean freezing values was conducted using two-way repeated measures ANOVA
(group x test interactions). Tukey’s post-hoc comparison was then used to detect significant
differences between groups. Non-longitudinal comparisons were conducted using 1-way
ANOVA, and significant group differences were established with Tukey’s post-hoc comparison.
When neither of these tests was appropriate, a Student’s 2-tailed t-test was used.
4
Brain slice electrophysiology
After sacrificing anesthetized mice, brains were dissected into ice-cold buffer containing the
following (in mM): 210.3 sucrose, 11 glucose, 2.5 KCl, 1 NaH2PO4, 26.2
NaHCO3, 0.5
ascorbate, 0.5 CaCl2, 4 MgCl2. Acute coronal slices were obtained at 350 µm thickness on a
vibratome and transferred to normal artificial cerebrospinal fluid (ACSF) composed of the
following (in mM): 119 NaCl, 2.5 KCl, 1 NaH2PO4, 26.2 NaHCO3, 11 glucose, 2 CaCl2, and 2
MgCl2. Following recovery at 35°C for 40 minutes, slices were maintained at 22–25°C. Whole-
cell recordings were performed using borosilicate electrodes (3–5 M ) on submerged slices
containing lateral amygdala (LA). All recordings were targeted to the upper portion of the lateral
nucleus, because this region receives the densest input from the auditory thalamus, which
conveys CS information to the LA. Presynaptic stimulation was delivered to thalamic fiber
bundles traversing the amygdalo-striatal transition area with a bipolar microelectrode.
Monosynaptic responses were judged on their latency, which was 3-4 ms on average and
constant across stimuli. In all recordings, fast GABAergic inhibition was blocked with
picrotoxin (100 M) to yield pure excitatory responses. Because we found that in a small
number of cases this resulted in polysynaptic bursting, all recordings were performed in solution
containing elevated divalent cations (4 mM Ca2+
and Mg2+
) to reduce network excitability,
except when action potentials were blocked with TTX. Recording electrode internal solution
contained (in mM): 130 cesium-methanesulfonate, 10 HEPES, 0.5 EGTA, 8 NaCl, 1 TEA, 4 Mg-
ATP, 1 QX-314, 10 Na-phosphocreatine, and 0.4 Na-GTP. All measurements of AMPAR
currents, including rectification, AMPAR-mEPSC amplitude, and NASPM sensitivity, were
performed in ACSF containing D,L-APV (100 M). To quantify rectification, internal solution
was supplemented
with 100 M spermine to compensate for the dialysis of endogenous
polyamines by the patch pipette. Spontaneous mEPSCs were collected in the presence of 1 M
tetrodotoxin (TTX). Data were acquired at 10 KHz using Multiclamp 700B and pCLAMP 10
and analyzed offline in pCLAMP. AMPA:NMDA ratios were calculated as the ratio of peak
current at –70 mV to the current at 100 ms after stimulus onset at +40 mV (since we determined
from synaptic responses in D,L-APV that AMPAR currents make a negligible contribution
at this
interval). There were no effects of conditioning or extinction on the kinetics of NMDAR
currents (data not shown). Rectification index was calculated as a ratio of slopes of a linear fit of

5
I–V points, in which the index = slope at negative holding potentials (–70 to 0
mV) divided by
the slope at positive holding potentials (0 to +50 mV). Accordingly, an index of 1 represents
perfect linearity,
while values >1 indicate inward rectification. Naphthylacetyl spermine
(NASPM, 50 M) was used to block CP-AMPARs in the presence of D,L-APV (100 M). To
determine the contribution of CP-AMPAR trafficking to LTD, NASPM was applied 20 minutes
after LTD induction for a duration (>20 minutes) sufficient for saturation of NASPM block. In
these experiments, comparisons of EPSC amplitude were performed prior to (15-20 minutes after
LTD) and after the application of NASPM (45-50 minutes after LTD) to determine both the
amount of LTD (1st timepoint) as well as the residual contribution of CP-AMPARs (2
nd
timepoint). AMPAR-mEPSCs were detected at 5 pA threshold (>2x RMS noise)
and analyzed
using MiniAnalysis. To obtain decay times, mean mEPSCs were fitted with a single exponential.
Significance for all group comparisons was assessed by one-way ANOVA followed
by a Tukey’s
post-hoc comparison or, when appropriate, a Student’s 2-tailed t-test.
References
S1. H. S. Crombag et al., Behav Brain Res 191, 178 (Aug 22, 2008).
S2. M. H. Monfils, K. K. Cowansage, E. Klann, J. E. LeDoux, Science 324, 951 (May 15,
2009).
S3. D. Schiller et al., Nature 463, 49 (Jan 7).

6
Supplemental Figure Legends
Fig. S1. Pathway-specific analysis of AMPAR transmission at thalamo-amygdala synapses.
EPSCs were evoked by stimulation of separate thalamic axon bundles terminating onto the same
postsynaptic cell. (A) Representative EPSCs at membrane holding potential (Vh) = -70, 0 and
+40 mV during stimulation of separate pathways (A and B) from mice that were subjected to
unpaired (N = 9) or paired (N = 11) fear conditioning 24 hrs prior to slice preparation. Scale bars
= unpaired A 200 pA, B 200 pA, paired cell 1 A 200 pA, cell 1 B 200 pA, cell 2 A 100 pA, cell 2
B 100 pA x 200 ms. (B) Mean AMPA:NMDA ratio. * P < 0.00001 Student’s t-test. (C)
AMPA:NMDA ratio as a function of pathway within each cell. Blue line indicates group mean.
(D) Distribution of individual AMPA:NMDA ratios from all pathways. Dotted line indicates 2
standard deviations above unpaired mean. 50% of recorded pathways, and 63.6% of recorded
cells in paired slices had AMPA:NMDA ratios more than 2 standard deviations above the
unpaired mean.
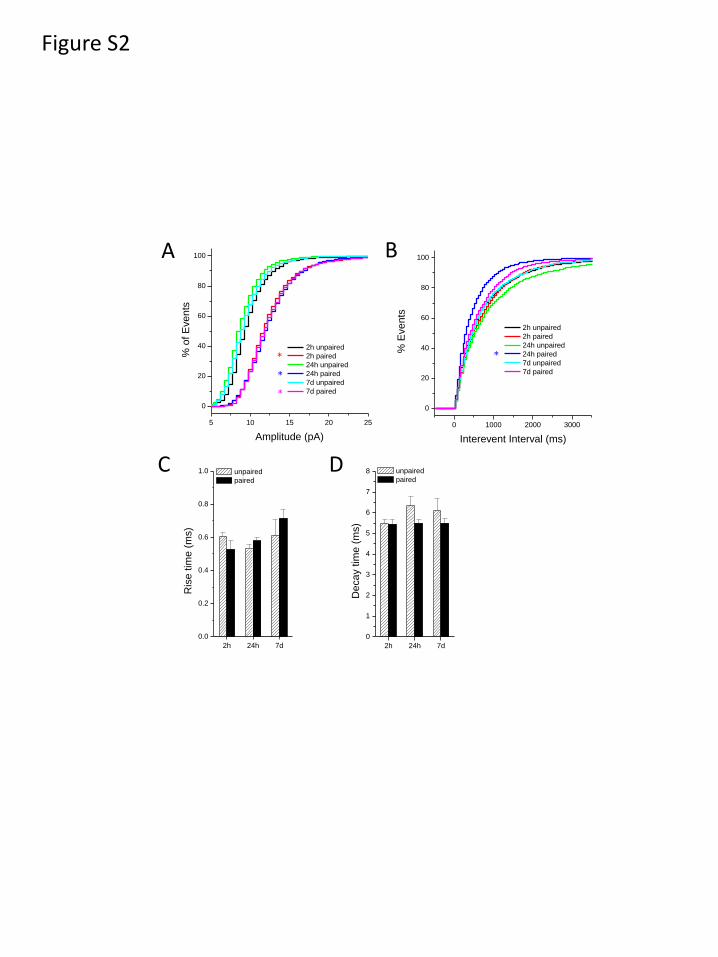
Fig. S2. Fear conditioning potentiates AMPAR-mEPSCs. (A) Cumulative histogram of
AMPAR-mEPSC amplitudes. * P < 0.0001 ANOVA followed by Tukey’s post-hoc comparison
with unpaired. (B) Cumulative histogram of AMPAR-mEPSC interevent intervals. * P < 0.001
ANOVA followed by Tukey’s post-hoc comparison with unpaired. A significant increase in
frequency was present at 24 hours after fear conditioning in paired animals. (C) Mean AMPAR-
mEPSC rise time (20-80%). (D) Mean AMPAR-mEPSC decay time ( decay). No significant
differences in the kinetics of mean AMPAR-mEPSCs were detected. Paired, N = 9-22 cells;
unpaired, N = 9-18 cells per timepoint.
Fig. S3. Expression of CP-AMPARs at thalamic inputs to LA in naïve mice. (A) Inhibition of
AMPAR-EPSCs by the CP-AMPAR antagonist NASPM (50 M, N = 6). (B) Rectification of
AMPAR-EPSCs in naïve mice (baseline, N = 17), and elimination by pre-incubation in NASPM
(post-NASPM, N = 6). Representative AMPAR-EPSCs at Vh = -70, -60, -40, -20, 0, +20, +40,
and +50 mV. Scale bar = 50 pA x 30 ms. * P < 0.01 Student’s 2-tailed t-test.
Fig. S4. Analysis of AMPAR-EPSC rectification after fear conditioning. Normalized current-
voltage (I-V) plots were constructed from peak amplitude of AMPAR-EPSCs at varying

7
intervals after fear conditioning. Paired, N = 6-9; unpaired, N = 5-7 per timepoint. * P < 0.01
Student’s 2-tailed t-test.
Fig. S5. Pathway-specific analysis of AMPAR-EPSC rectification at thalamo-amygdala
synapses. AMPAR-EPSCs were evoked by stimulation of separate thalamic axon bundles
terminating onto the same postsynaptic cell. (A) Representative AMPAR-EPSCs at membrane
holding potential (Vh) = -70, -60, -40, -20, 0, +20, +40 and +50 mV during stimulation of
separate pathways (A and B) from mice that were subjected to unpaired (N = 9) or paired (N =
14) fear conditioning 24 hrs prior to slice preparation. Scale bars = unpaired A 100 pA, B 100
pA, paired cell 1 A 200 pA, cell 1 B 100 pA, cell 2 A 100 pA, cell 2 B 100 pA x 50 ms. (B)
Mean rectification index. * P < 0.001 Student’s t-test. (C) Rectification index as a function of
pathway within each cell. Blue line indicates group mean. (D) Distribution of individual
rectification indices from all pathways. Dotted line indicates 2 standard deviations above
unpaired mean. 67.8% of recorded pathways, and 78.6% of recorded cells in paired slices had
rectification indices more than 2 standard deviations above the unpaired mean.
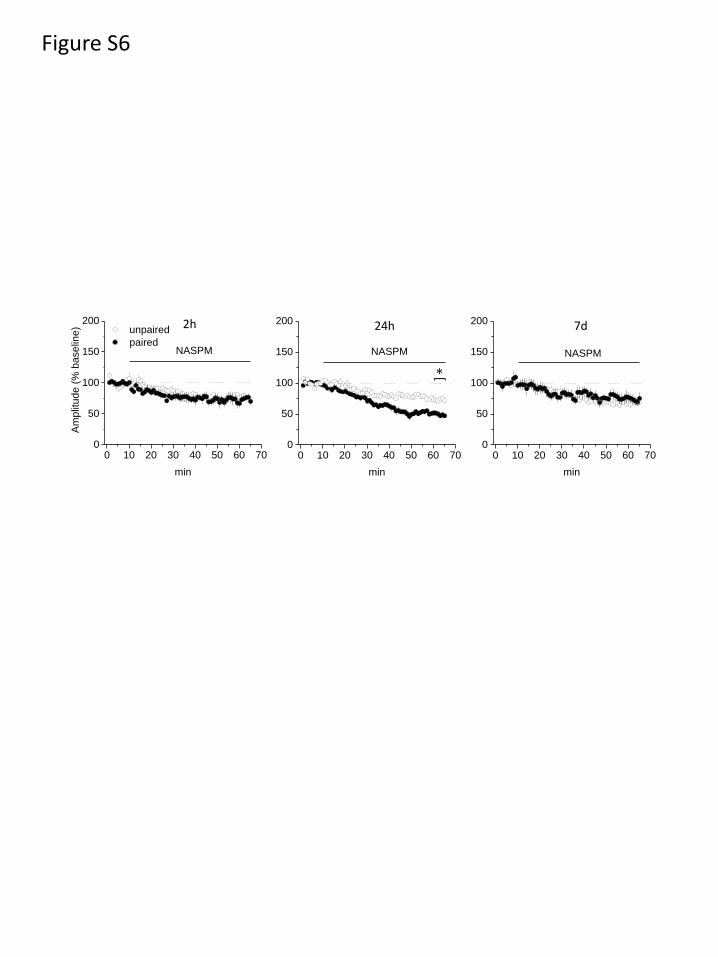
Fig. S6. Inhibitory effect of NASPM on AMPAR-EPSCs as a function of time since training.
NASPM (50 M) was applied to acute slices from unpaired (N = 4-5) and paired (N = 5 each)
subjects following fear conditioning, in the continuous presence of APV (50 M). * P < 0.001
Student’s t-test for the final 5 min of recording.
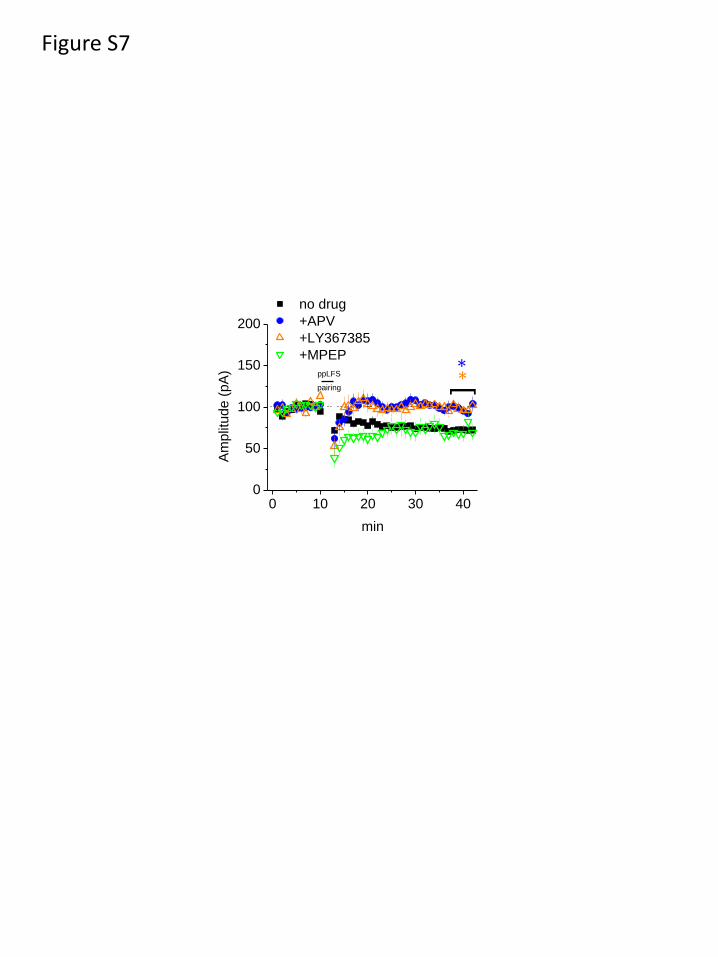
Fig. S7. Pharmacological requirements for LTD resulting from ppLFS-pairing. ppLFS-pairing
was delivered at thalamo-LA inputs in slices from naïve animals, in the absence of any drug (N =
10), or in the continuous presence of DL-APV (100 M, N =6), LY367385 (100 M, N = 5), or
MPEP (10 M, N =6). * P < 0.01 Student’s t-test versus no drug.
Fig. S8. Reversal of increased AMPAR rectification after fear conditioning by LTD or NASPM.
EPSCs were evoked at thalamo-amygdala synapses in slices prepared 24 hrs after fear
conditioning. (A) Induction of LTD by ppLFS-pairing (3 Hz stimulation, 50-ms interpulse
interval, for 3 min at -50 mV), followed by blockade of NMDARs (100 M DL-APV) for
construction of AMPAR-EPSC current-voltage plots (N = 6). (B) Timecourse of effect of
NASPM (50 M) on AMPAR-EPSCs. (C) Representative AMPAR-EPSCs following LTD (N =

8
6) or NASPM (N = 4) alongside interleaved control experiments in unpaired (N = 6) or paired (N
= 6) cells. Scale bars = unpaired 100 pA, paired 150 pA, paired LTD 100 pA and paired
NASPM 50 pA x 50 ms. (D) Mean rectification index. * P < 0.01 ANOVA, Tukey’s post-hoc.
Fig. S9. Long-term attenuation of fear relapse and AMPA transmission by reconsolidation-
update. Reconsolidation-update was performed on Day 1 after conditioning on Day 0, as
described in Fig. 3. (A) Comparison of freezing in spontaneous recovery and renewal tests on
Day 7. * P < 0.01 ANOVA, Tukey’s post-hoc (N = 6-8). (B) AMPA:NMDA ratio at thalamo-
LA synapses on Day 7 after reconsolidation-update on Day 1. Scale bars = No-retrieval 150 pA,
Retrieval 100 pA x 50 ms. * P < 0.01 ANOVA, Tukey’s post-hoc (N = 7-10).
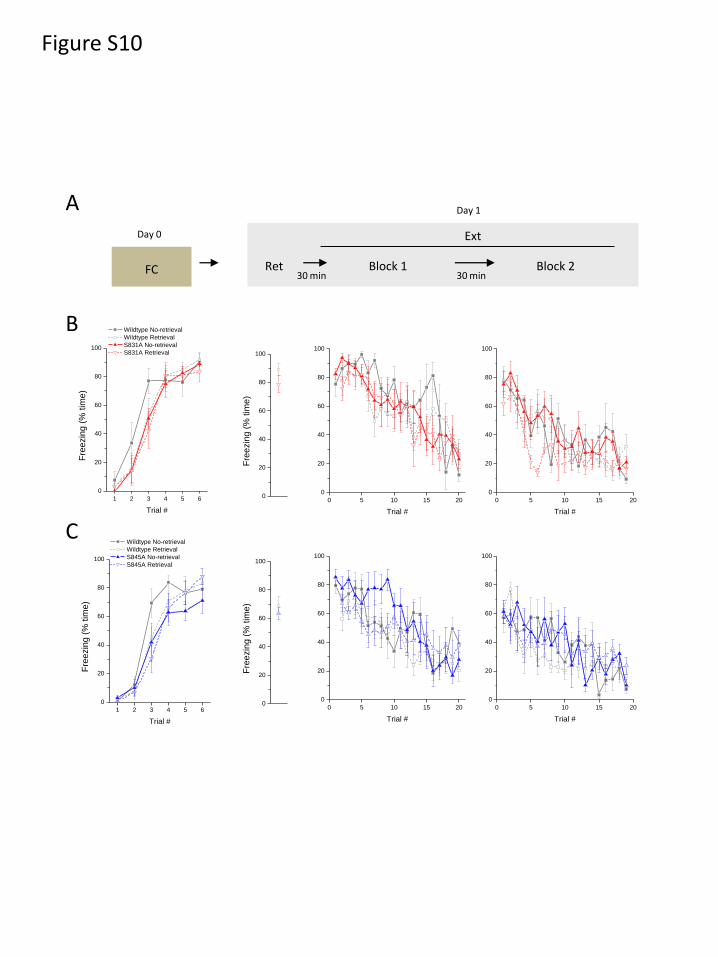
Fig. S10. Unaltered fear behavior during conditioning and extinction in S831A and S845A
mutants. (A) Timeline for fear conditioning and reconsolidation-update training in GluA1
S831A (N = 7) and S845A mutants (N = 8), examined alongside their wildtype littermates (N =
7-8) in interleaved experiments. CS-evoked freezing was measured during fear conditioning and
subsequent reconsolidation-update training in S831A (B) and S845A mutants (C).
Fig. S11. S831A knockin mutation does not disrupt fear erasure. S831A knockins and their
wildtype littermates were subjected to reconsolidation-update, as described in Fig. 2 and fig.
S10. Freezing was averaged for the first and last 4 trials of extinction, and relapse was measured
by comparison to the last 4 trials. Spontaneous recovery and renewal tests were performed on
Day 7 after reconsolidation-update on Day 1. Repeated measures ANOVA, group x test:
wildtype F(3,30) = 4.16, P < 0.05; S831A knockins F(3,36) = 3.48, P < 0.05. * P < 0.01
Tukey’s post-hoc comparison with last 4 trials. # P < 0.01.

A B0
1
2
3
4
5
6
7
AM
PA
:NM
DA
Ra
tio
Pathway
A B0
1
2
3
4
5
6
7
AM
PA
:NM
DA
Ratio
Pathway
0
1
2
3
4
5
6 unpaired
paired
AM
PA
:NM
DA
Ratio *
unpa
ired
paire
d
0
1
2
3
4
5
6
7
AM
PA
:NM
DA
Ra
tio
A
B C D
unpaired paired
A
B
A
B
A
B
cell 1 cell 2
unpaired paired
Figure S1
A
5 10 15 20 25
0
20
40
60
80
100
*
*
2h unpaired
2h paired
24h unpaired
24h paired
7d unpaired
7d paired
% o
f E
vents
Amplitude (pA)
*
B
0 1000 2000 3000
0
20
40
60
80
100
2h unpaired
2h paired
24h unpaired
24h paired
7d unpaired
7d paired
% E
ve
nts
Interevent Interval (ms)
*
C
2h 24h 7d
0.0
0.2
0.4
0.6
0.8
1.0
Ris
e t
ime
(m
s)
unpaired
paired
2h 24h 7d
0
1
2
3
4
5
6
7
8
Decay tim
e (
ms)
unpaired
paired
D
Figure S2
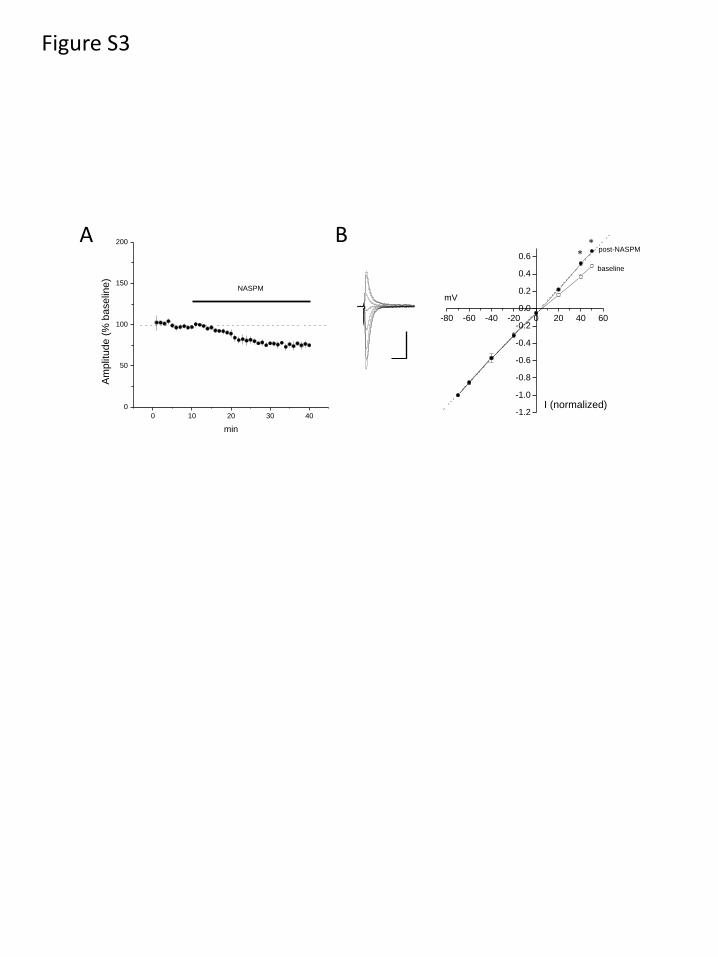
Figure S3
-80 -60 -40 -20 0 20 40 60
-1.2
-1.0
-0.8
-0.6
-0.4
-0.2
0.0
0.2
0.4
0.6
*post-NASPM
I (normalized)
mV
baseline
*
0 10 20 30 40
0
50
100
150
200
Am
plit
ud
e (
% b
ase
line
)
min
NASPM
A B

Figure S4
-80 -60 -40 -20 0 20 40 60
-1.0
-0.8
-0.6
-0.4
-0.2
0.0
0.2
0.4
0.6
**
-80 -60 -40 -20 0 20 40 60
-1.0
-0.8
-0.6
-0.4
-0.2
0.0
0.2
0.4
0.6
**
-80 -60 -40 -20 0 20 40 60
-1.0
-0.8
-0.6
-0.4
-0.2
0.0
0.2
0.4
0.6
I (normalized)
unpaired
paired
mV
-80 -60 -40 -20 0 20 40 60
-1.0
-0.8
-0.6
-0.4
-0.2
0.0
0.2
0.4
0.6
-80 -60 -40 -20 0 20 40 60
-1.0
-0.8
-0.6
-0.4
-0.2
0.0
0.2
0.4
0.6
*
2h 12h 24h
48h 7d

C
A B0
1
2
3
4
5
6
Re
ctificatio
n Ind
ex
Pathway
0
1
2
3
4 unpaired
paired
Rectification Index
*
A B0
1
2
3
4
5
6
Rectification Index
Pathway
unpa
ired
paire
d
0
1
2
3
4
5
6
Re
ctifica
tio
n I
nd
ex
A
B D
unpaired paired
cell 1 cell 2
A B B A BA
Figure S5
0 10 20 30 40 50 60 700
50
100
150
200
min
NASPM
0 10 20 30 40 50 60 700
50
100
150
200
min
NASPM
[*
0 10 20 30 40 50 60 700
50
100
150
200
Am
plit
ud
e (
% b
ase
line
) unpaired
paired
min
NASPM
2h 24h 7d
Figure S6
0 10 20 30 400
50
100
150
200
*pairing
Am
plit
ud
e (
pA
)
min
no drug
+APV
+LY367385
+MPEP
ppLFS [*
Figure S7

0 10 20 30 400
50
100
150
200
APV
pairing
Am
plit
ude (
% b
aselin
e)
min
ppLFS
0 10 20 30 40 50 600
50
100
150
200
Am
plit
ud
e (
% b
ase
line
)min
NASPM
unpa
ired
paire
d
paire
d LT
D
paire
d NASPM
0.0
0.5
1.0
1.5
2.0
2.5
3.0
Re
ctifica
tio
n I
nd
ex
*
A B
C D
unpaired paired paired LTD
paired NASPM
Figure S8

A
0
20
40
60
80
100
Fre
ezin
g (
% tim
e)
*
0
20
40
60
80
100
Unpaired
Context-only
No-retrieval
Retrieval
Fre
ezin
g (
% t
ime
)
*
SpontRec Renewal
Day 7
B
0
1
2
3
4
5
AM
PA
:NM
DA
Ra
tio
*
RetrievalNo-retrieval
Figure S9
1 2 3 4 5 6
0
20
40
60
80
100
Fre
ezin
g (
% t
ime
)
Trial #
Wildtype No-retrieval
Wildtype Retrieval
S831A No-retrieval
S831A Retrieval
0 5 10 15 20
0
20
40
60
80
100
Trial #
0
20
40
60
80
100
Fre
ezin
g (
% t
ime
)
0 5 10 15 20
0
20
40
60
80
100
Trial #
1 2 3 4 5 6
0
20
40
60
80
100
Fre
ezin
g (
% tim
e)
Trial #
Wildtype No-retrieval
Wildtype Retrieval
S845A No-retrieval
S845A Retrieval
0 5 10 15 20
0
20
40
60
80
100
Trial #
0 5 10 15 20
0
20
40
60
80
100
Trial #
FC
ExtDay 0
Day 1
Ret Block 130 min 30 min
Block 2
B
A
C
Figure S10
0
20
40
60
80
100
Fre
ezin
g (
% t
ime
)

First 4
Tria
ls
Last 4
Tria
ls
Spo
nt R
ec
Ren
ewal
0
20
40
60
80
100
No-retrieval
Retrieval#
*
Fre
ezin
g (
% tim
e)
*
#
First 4
Tria
ls
Last 4
Tria
ls
Spo
nt R
ec
Ren
ewal
0
20
40
60
80
100
#
**
#
Wildtype S831A
Day 0
FC
Day 1
Ext
Day 7
Test
Figure S11