Supporting Online Material for -...
47
www.sciencemag.org/cgi/content/full/312/5777/1183/DC1 Supporting Online Material for Regulatory Blueprint for a Chordate Embryo Kaoru S. Imai, Michael Levine, Nori Satoh, Yutaka Satou* *To whom correspondence should be addressed. E-mail: [email protected] Published 26 May 2006, Science 312, 1183 (2006). DOI: 10.1126/science.1123404 The main PDF file includes Materials and Methods SOM Text Figs. S1 to S9 Tables S1 to S7 References Other Supporting Online Material for this manuscript includes the following: (available at www.sciencemag.org/cgi/content/full/312/5777/1183/DC1) Database S1 as a zipped archive: The Ciona Integrated Database, GHOST
Transcript of Supporting Online Material for -...
www.sciencemag.org/cgi/content/full/312/5777/1183/DC1
Supporting Online Material for
Regulatory Blueprint for a Chordate Embryo Kaoru S. Imai, Michael Levine, Nori Satoh, Yutaka Satou*
*To whom correspondence should be addressed.
E-mail: [email protected]
Published 26 May 2006, Science 312, 1183 (2006). DOI: 10.1126/science.1123404
The main PDF file includes
Materials and Methods SOM Text Figs. S1 to S9 Tables S1 to S7 References
Other Supporting Online Material for this manuscript includes the following: (available at www.sciencemag.org/cgi/content/full/312/5777/1183/DC1)
Database S1 as a zipped archive: The Ciona Integrated Database, GHOST
1
Supporting Online Materials
Materials and Methods
Ascidian eggs and embryos
C. intestinalis adults, obtained from the Maizuru Fisheries Research Station of Kyoto
University, were maintained in aquaria in our laboratory under constant light to induce
oocyte maturation. Eggs and sperm were obtained surgically from gonoducts. Following
insemination, eggs were reared at 18°C in Millipore-filtered seawater (MFSW)
containing 50 μg/ml streptomycin sulfate.
cDNA clones and whole-mount in situ hybridization
Most cDNA clones were obtained from our EST collection (S1). These cDNAs were
basically the same as those examined in our previous study (S2). DIG-RNA probes for
whole-mount in situ hybridization (WMISH) were synthesized by in vitro transcription
with T7 RNA polymerase. The detailed procedure for WMISH has been described (S3).
Hierarchical clustering of blastomeres based on gene expression profiles
The expression of each gene in individual cells was converted into a binary code; if the
gene was expressed, a value of 1 was assigned, while if the gene was not expressed, 0
was assigned. Based on this binary matrix, correlation distance was used for hierarchical
clustering by the UPGMA method.
Gene knockdowns and reconstructing gene regulatory networks
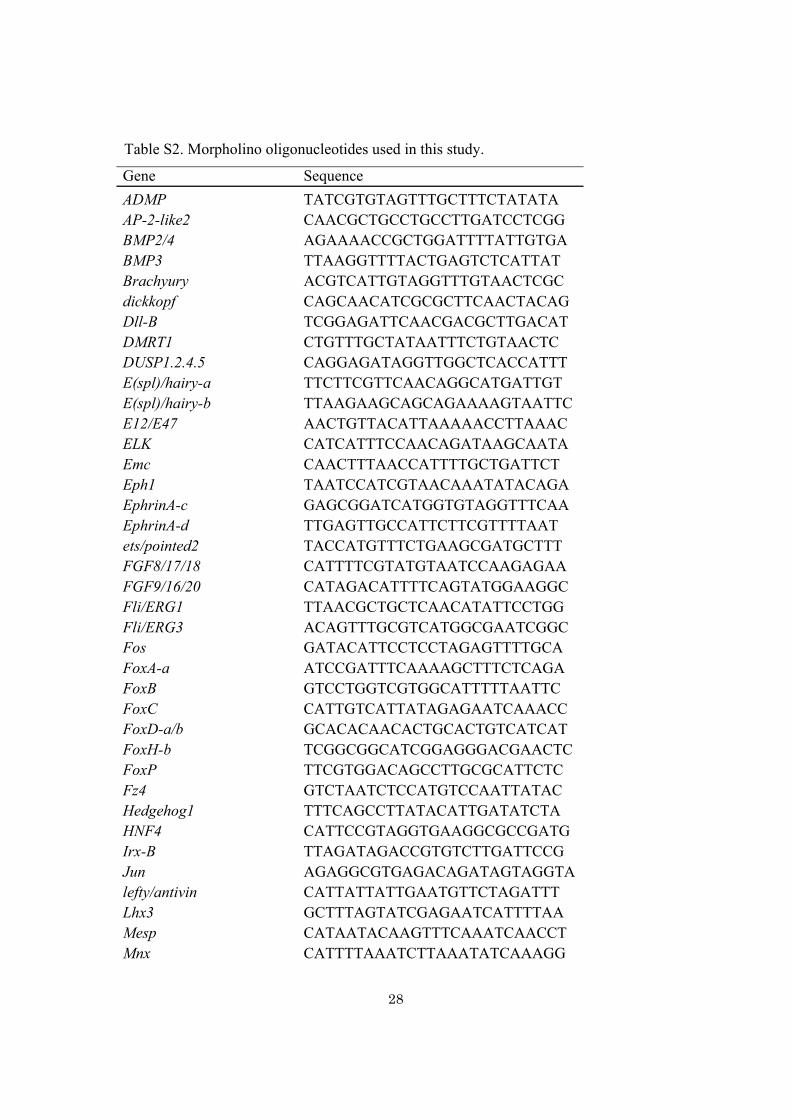
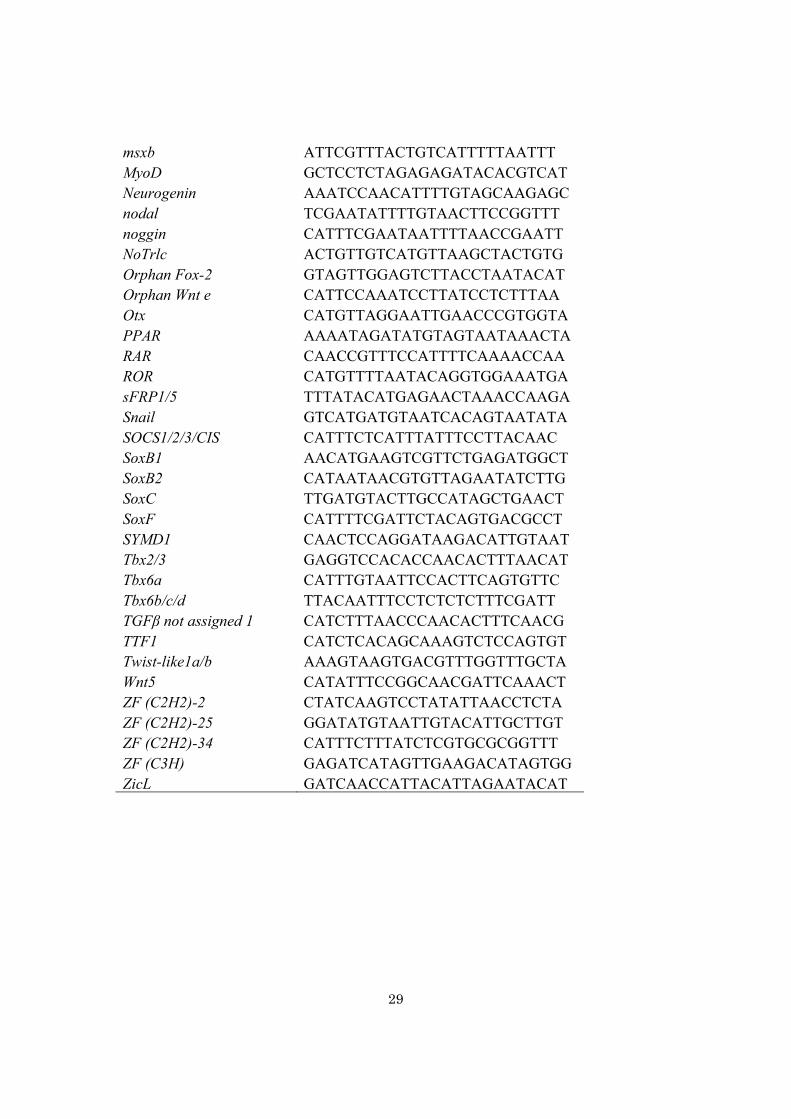
Sequences of the morpholino oligonucleotides (Gene Tools, LLC) are shown in Table S2.
Microinjections were performed as described (S4). Relative quantification of mRNA
levels (qRT-PCR) was performed as described (S2). The majority of the primers used for
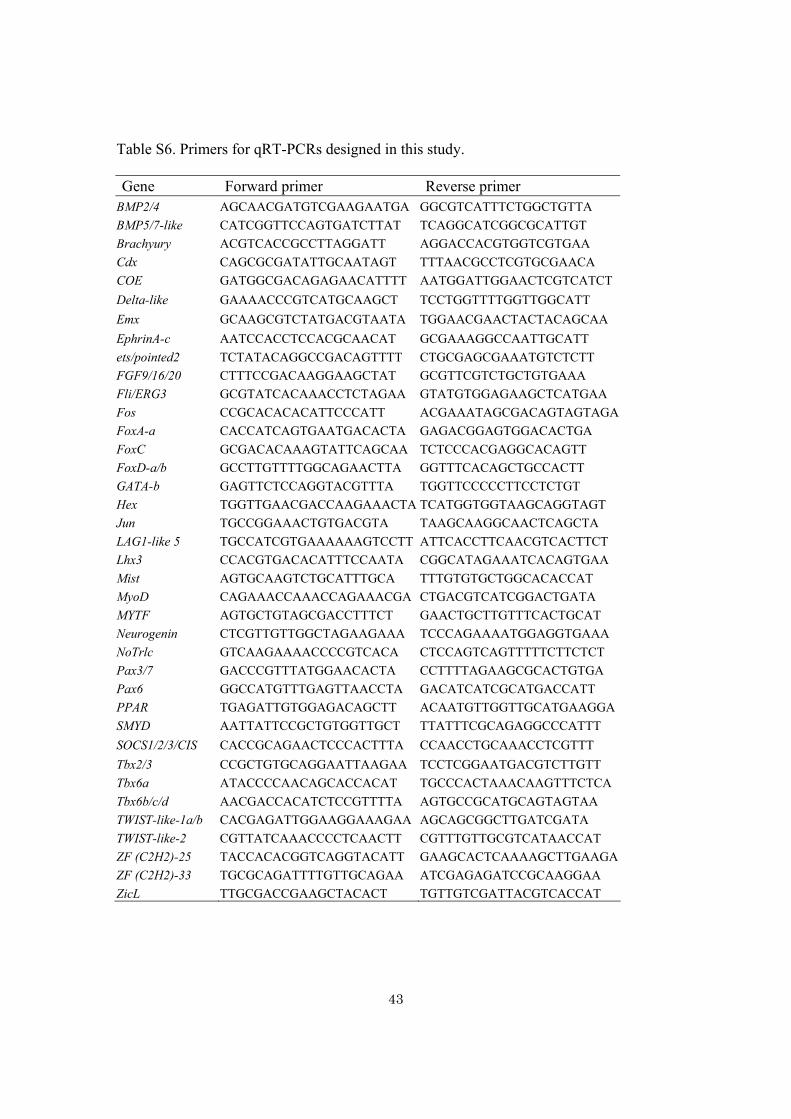
quantification were the same as those used previously (S2). Newly designed primers are
listed in Table S6.
The results of qRT-PCR examining the expression of SoxF, BMP3, and EphrinA-d were
not reproducible. Thus, these three genes were not listed in the study. In the qRT-PCR
analyses, genes with greater than a two-fold increase or decrease in mRNA quantity were
2
regarded as exhibiting significant changes in expression. These genes were determined to
be downstream genes in transcriptional networks. Genes with complex expression
patterns were also examined by WMISH (Table S4; Fig. S5; Fig. S6 for controls).
To present biochemical networks, several software packages have been developed. One
such program, Biotapestry, is designed to represent transcriptional networks (S5). Such
programs, however, are not intended for assays performed at the single-cell level.
Therefore, we have expressed our data in a novel fashion in a world-wide-web-based
database illustrating the expression patterns of genes and their regulative relationships at
a single cell level until the early gastrula stage and at a region/tissue level thereafter
(Database S1 or http://ghost.zool.kyoto-u.ac.jp/network/TFSTgenes.html).
3
Supporting Text
Regulatory codes define a pre-pattern in 16-cell embryo
As described in the main text, there are 5 distinct regulatory codes seen for the 8
different blastomeres (paired blastomeres are identical across the left-right axis) in
16-cell embryos (Fig. 1B): anterior animal blastomeres (a-line blastomeres), posterior
animal blastomeres (b-line blastomeres), anterior vegetal blastomeres (A-line
blastomeres; not identical to each other, but very similar), the posterior vegetal
blastomere (B5.1 blastomeres), and the posterior-most blastomere (B5.2). FoxA-a, FoxD,
Tbx6a and Tbx6b display restricted patterns of zygotic expression in 16-cell embryos (Fig.
S1). A signaling gene Fgf9/16/20 also displays a restricted pattern at this stage. These
restricted patterns depend on two localized maternal determinants, β-catenin and macho1,
which define vegetal and posterior fates by activating localized expression of these key
genes, respectively, (S6-S11). The combination of these two molecules could define four
distinct fates (antero-animal, antero-vegetal, postero-animal, and postero-vegetal). The
fifth regulatory code, seen for the posterior-most blastomere, is defined by the absence of
these factors at the 16-cell and 32-cell stages. This blastomere ultimately forms the germ
line, and the general absence of zygotic transcription might be mediated by a number of
localized maternal products encoded by the posterior-end-mark (pem) genes (S3, S12,
S13), or other components of the germ plasm. The regulatory codes seen in the 16-cell
embryo set the stage for inductive interactions that establish the major cell types of the
tadpole: gut, tail muscles, notochord, skin, and CNS. This was also supported by a
previous comprehensive screen showing that all or most localized maternal transcripts are
in the posterior pole like the pem gene transcripts (S13). Altogether, the regulatory codes
seen in the 16-cell embryo set the stage for inductive interactions that establish the major
cell types of the tadpole: gut, tail muscles, notochord, skin, and CNS.
Morpholino Oligonucleotide-based Gene Knockdowns
MOs can produce variable reductions in gene activity, sometimes resulting in
hypomorphic mutations rather than null phenotypes. Brachyury regulation has been
characterized in considerable detail, and thereby provides an opportunity to assess the
4
efficacy of Morpholino Oligonucleotide (MO)-mediated gene disruption. The MOs for
FoxA-a, FoxD, ZicL, and Fgf9/16/20, which are know activators of Brachyury (S6, S9,
S14), abolish Brachyury expression, suggesting a severe reduction in the activities of
these genes. Twist-like1 was also examined in detail in the previous study of a closely
related species, C. savignyi (S15), and the MO for Twist-like1 in C. intestinalis also gave
a similar effect. The Nodal MO we used were designed in the different position from the
MO used in the recent study (S16), and both of the MOs gave a similar result. This
“random” sampling of genes which were previously examined suggest that the MOs are
specific and effective in reducing or eliminating gene function.
We did not find any inconsistent phenotypes among two or more knockdowns
(inconsistent phenotypes mean that Gene A activates B, and B activates C but A
represses C, for example). This means that genes in a common pathway were found to be
related and consistent functions. This fact also supports the specificity of the MOs we
used.
Circuit diagrams for larval tissues
Endoderm (Fig. S8A)
FoxA-a is one of the earliest genes expressed in both the A-line and B-line lineages,
from which all endodermal cells are derived. MO-mediated suppression of FoxA-a
resulted in the complete loss of endoderm-specific alkaline phosphatase (AP) activity
(data not shown) and endodermal expression of GATA-a, SoxB1, and sFRP3/4-b (Fig.
S5A). The synthesis of the current study and earlier work suggests that FoxA-a
coordinates the expression of two regulatory pathways of endoderm differentiation,
through the regulation of Otx and Lhx3 (Fig. S8A). As it is required for AP activity (S17),
Lhx3 likely activates target genes essential for the differentiation of the larval endoderm,
including SoxB1 and sFRP3/4-b, which are downstream of FoxA-a (Fig. S5A) but not of
Otx (Fig. S5H). Lhx3 also works together with FoxA-a to activate Otx, which in turn
regulates GATA-a (Fig. S5A). It is possible that an ensuing cascade of GATA genes
controls the differentiation of the adult endoderm.
FoxA and GATA are used for endoderm differentiation in a broad spectrum of animals,
from C. elegans to vertebrates (S18). In addition, endoderm specification begins with a
5
localized source of β-catenin in nematodes, sea urchins and ascidians. The
Lhx3-dependent pathway seen in ascidian embryos is less well conserved, possibly due to
its specialized role in the differentiation of larval endoderm. Additional variations in the
Fox-GATA core network endow the endoderm with distinctive properties in different
systems. For example, Nodal signaling appears to be essential for initiating endoderm
specification in zebrafish and Xenopus, and possibly other vertebrates.
Tail Muscles (Fig. S8B)
The analysis of the 76 TF and ST genes and 27 MO-induced mutants suggests that
Ciona is the simplest metazoan to employ MyoD as a central myogenic agent, as seen in
vertebrate systems. Ciona has only one myogenic bHLH factor gene related to vertebrate
MyoD, Myf5, myogenin and MRF4 (S19, S20). In Ciona, MyoD coordinates the
expression of target genes required for the differentiation of the tail muscles, including
Otp, SYMD, Mox and a muscle actin gene (Fig. S8B). In contrast, the MyoD homologue
in Drosophila —nautilus—(S21), sea urchin —sum1—(S22) and Caenorhabditis
—hlh1—(S23) are not required for the differentiation of the major muscle groups. Thus,
the use of MyoD-like myogenic factors may be a chordate-specific innovation. There are
other localized regulatory factors present in the early muscle lineages (Fig. S1), but they
do not participate in the regulation of MyoD and myogenesis. For example, snail may be
activated prior to MyoD, but it functions as a transcriptional repressor that prevents the
differentiation of presumptive muscle cells into notochord (S24).
The anterior-most cells appear to develop at least partly in MyoD MO-injected embryos
(Fig. S5O). These cells appeared to arise from the B7.5 blastomeres, which also form the
cardiac mesoderm. The anterior lineage forms the heart primordium, or trunk ventral cells
(TVCs), while the posterior lineage forms the anterior-most tail muscles. It is conceivable
that myogenic agents controlling heart differentiation are able to mask the loss of MyoD
in the anterior tail muscles. Or, the MyoD MO we used might produce a hypomorphic
phenotype rather than a null phenotype.
Heart (Fig. S8C)
6
Cardiomyocyte differentiation is controlled by a highly conserved, interlocking cassette
of regulatory genes that include Nkx2.5 and Gata-4. The deployment of this network has
not been clearly elucidated in vertebrates. The analysis of early heart specification in
Ciona suggests that a bHLH regulatory gene, Mesp, plays an early role in the
specification of the heart field, prior to the onset of Nkx2.5 expression (Fig. S8C) (S25).
The function of Mesp is conserved in vertebrates (S26), but not in flies (S27), suggesting
that the establishment of the heart field may be different in flies and chordates.
B7.5 arises from the posterior-most blastomere, B6.3, of the 32-cell embryo. This cell is
unusual in that it is transcriptionally silent at the 16-cell and 32-cell stages when there is
intense zygotic expression of different patterning genes in all other blastomeres (Fig. S1).
After the division of B6.3 into B7.5 and B7.6, the B7.5 blastomere begins to express
Mesp at the time when it is specified to form cardiac mesoderm (or the heart field) and
the anterior-most tail muscles. Injection of a Mesp MO resulted in the loss of expression
of Nk4 (Nkx2.5), Hand, NoTrlc (Hand-like bHLH gene), FoxF, and tolloid in the TVCs
(Fig. S5U).
Knockdown of Fgf9/16/20 eliminated the expression of NoTrlc, FoxF, and Tolloid, and
caused diminished expression of Mesp (Fig. S5D). Fgf9/16/20 may be required to
maintain proper levels of Mesp, but not for initial activation. Indeed, there is evidence
that Tbx6b (and Tbx6c) are essential activators of Mesp expression (S28). It is possible
that the loss of NoTrlc, FoxF, and tolloid expression in FGF9/16/20 MO-injected
embryos might result from “sub-threshold” levels of the Mesp activator. This hypothesis
is supported by the fact that knockdown of β-catenin also reduced, but did not eliminate,
the expression of Mesp (S25), because Fgf9/16/20 is controlled by β-catenin.
Alternatively, Mesp and FGF9/16/20 work in parallel to co-regulate certain target genes
like FoxF and Tolloid.
Notochord
A-line (Fig. S8D): As described in the main text in detail, the prepattern seen in 16-cell
embryos establishes the presumptive notochord through the activation of Brachyury
expression.

7
B-line (Fig. S8E): Brachyury is also activated in the B8.6 blastomere, which generates the
secondary notochord cells located in posterior regions of the tail. This activation depends
on FoxA-a and FGF9/16/20 signaling (Fig. S5A, D), as seen for expression in A-line
blastomeres. However, ZicL is required only for activation in the A-line (S14, S29). It
appears that Notch signaling takes the place of the ZicL activator in B8.6 (S9, S30). This
blastomere arises from B7.3, which undergoes an asymmetric division to form B8.6 and
B8.5. B8.6 is in direct physical contact with the A7.6 mesenchyme cells. A7.6
specifically expresses a Delta-like Notch ligand gene, which might induce B8.6, but not
B8.5 (supporting online text), to express Brachyury through Suppressor of Hairless
{Su(H)} binding sites present in the Brachyury enhancer (S30).
Nerve cord (Fig. S8F)
Nerve cord cells are specified dorsoventrally by the Nodal network as described in the
main text. Nodal activates TF and ST regulatory genes within the dorsal-most ependymal
cells, the roof cells, including Msxb, Pax3/7, snail and Chordin and also induces TF and
ST genes within lateral ependymal cells (A8.15 and A8.16 lineages), including Snail,
Delta-like, Neurogenin and E(spl)/Hairy-b (Fig. S5G). Among the latter genes,
Neurogenin and E(spl)/Hairy-b might require peak thresholds of Nodal signaling, and
consequently they are restricted to the A8.16 lineage due to sustained contact with the
Nodal-expressing b-line cells. Localized repressors help maintain distinct patterns of
gene expression in the floor plate and lateral ependymal cells (Fig. S8F). For example,
Snail keeps Mnx expression off in lateral ependymal cells (Fig. S5R), thereby restricting
expression to the floor plate. Conversely, FGF8/17/18, Cdx, and Pax6 are restricted to
lateral ependymal cells through the action of the FoxB repressor in the floor plate (Fig.
S5L).
Brain (Fig. S8F)
The brain, or cerebral vesicle, is located in a dorsal position of the larval trunk or head. It
receives sensory inputs from the associated otolith (gravity) and ocellus (light). Brain
specification begins with the localized activation of the Otx gene by FGF9/16/20
signaling at the 44-cell stage (S31). Otx participates in the activation of downstream TF
8
genes, together with DMRT1, which is independently activated by Fgf9/16/20 signaling
and FoxA-a. Otx and DMRT1 constitute a feed-forward regulatory circuit, leading to
localized expression of TF genes including Six1/2 and Six3/6 (Fig. S5H, J).
Mesenchyme
B-line (Fig. S8G): B-line mesenchyme cells are derived from B7.7 and B8.5 blastomeres
of the early gastrula. In these cells, Fgf9/16/20 induces expression of Twist-like1, which
triggers the specification of mesenchyme (S14). In concert with FGF signaling, Otx was
also required cell-autonomously for the activation of Twist-like1 (Figs S4 and S5H). Otx
is autonomously expressed in presumptive mesenchyme cells and/or their ancestral
blastomeres in a manner independent on FGF signaling (S31; Table S3). Although B7.7
and B8.5 exhibited very different TF-codes, both developed the expression of Otx; the
mechanism of Otx activation appeared to be similar in these cells. The expression of Otx
is under the control of β-catenin (S17) and macho1 (S32). Detailed analysis of the Otx
promoter (S31, S33) suggests the involvement of a T-box protein as well.
A-line (trunk lateral cells; TLCs) (Fig. S8H): Twist-like1 also plays a critical role in the
differentiation of the A-line mesenchyme. A previous study demonstrated that the
upstream regulatory mechanisms, however, are different from those functioning in B-line
mesenchyme (S15). In addition to FGF9/16/20 signaling and Otx activation, FoxD and
NoTrlc were both required for the activation of Twist-like1 in this lineage. The expression
of Otx and NoTrlc was under the regulation of FoxA-a. NoTrlc is also regulated by Nodal
(Fig S5G), which is likely the molecular foundation for an observation in Halocynthia
that TLC differentiation requires induction by cells in the animal hemisphere (S34). In
this cell lineage, the combination of Otx, NoTrlc, and FoxD appears to establish the
competence for response to FGF signaling by adopting the mesenchymal fate.
Fgf8/17/18 and MYTF were specifically expressed in A7.6 blastomeres at the 64-cell
and early gastrula stages. Expression of these genes is controlled by FoxD and
Neurogenin (Figs S4, S5B, S5Q). Delta-like is also expressed in these cells under the
control of FoxD and Neurogenin (Figs S4, S5B, S5Q), although this gene is also
expressed in A-line lateral nerve cord cells (A8.15 and A8.16) and b-line cells expressing
9
Nodal (b8.17, b8.18, b8.19 and b8.20). Expression of Delta-like in these cells was
regulated by Nodal (Figs S4, S5G), which may instruct neighboring B8.6 blastomeres to
become notochord.
Epidermis (Fig S8F)
Non-neuronal a- and b-line cells differentiated into the anterior and posterior epidermis,
respectively. Dll-B regulates the expression of most genes expressed in the epidermis,
although the upstream gene regulating Dll-B has not been identified. FoxA-a is important
in the determination of the antero-posterior boundary in the epidermis; MO knockdown
of FoxA-a resulted in the up-regulation of Emx, which is normally expressed in b-line. It
also causes and the down-regulation of sFRP1/5, which is normally expressed in a-line
epidermal cells. Epidermal cells are regionalized by distinct TF-codes into at least six
territories at the tailbud stage (Fig 2C). At least three of these territories, the
anterior-most epidermis surrounding the palp, the dorsal midline epidermis, and the
posterior ventral epidermis, contain developmentally distinct cell populations. Specific
peripheral neuronal cell types are derived from each territory. Differential gene
expression in the epidermal territories is first detected in 64-cell embryos, and later
stages.
The epidermis along the dorsal midline is derived from b8.18 and b8.20 blastomeres at
the early gastrula stage, and a part of these cells give rise to the dorsal epidermal tail
sensory neurons. Nodal activates Msxb within the dorsal midline (Fig S5G), and Msxb is
essential for the differentiation of the midline since MO disruption caused the
down-regulation of genes that are normally expressed in the dorsal midline (ash2,
CAGF9, Dll-C, and ZF-(C2H2)-24) and the up-regulation of SoxB2, which is not
normally expressed in these cells (Fig S5T).
The epidermis along the ventral midline is derived from a-line and b-line epidermal
cells of early embryos (compare Fig 1A with Fig 2B). A portion of the b-line ventral
epidermal cells also give rise to the ventral epidermal sensory neurons. ADMP is
expressed in a subset of B-line vegetal cells near the midline of early embryos and in the
a-line epidermal cells of later embryos. ADMP expressed in vegetal cells may induce the
differentiation of animal cells (at least in b-line) along the midline of early embryos.
10
Figure Legends
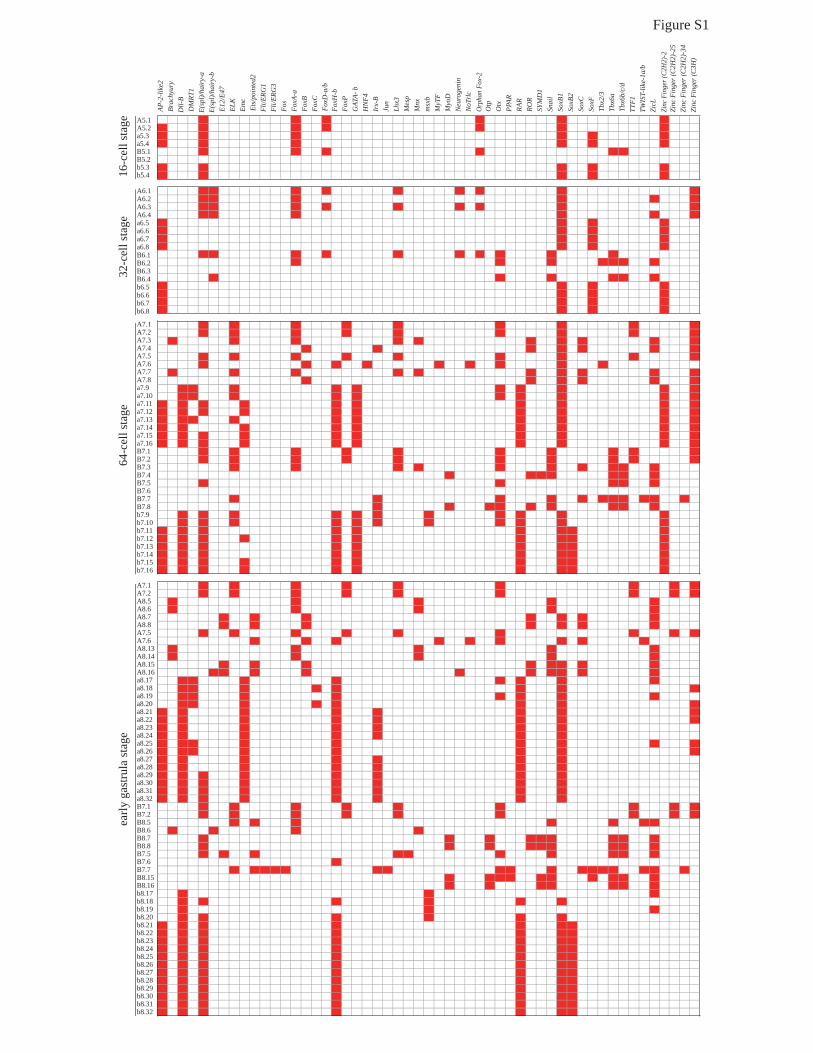
Fig. S1. Expression profiles of transcription factor genes in each blastomere at the 16-cell,
32-cell, 64-cell, and early gastrula stages. Expression of each gene is represented by a red
rectangle.
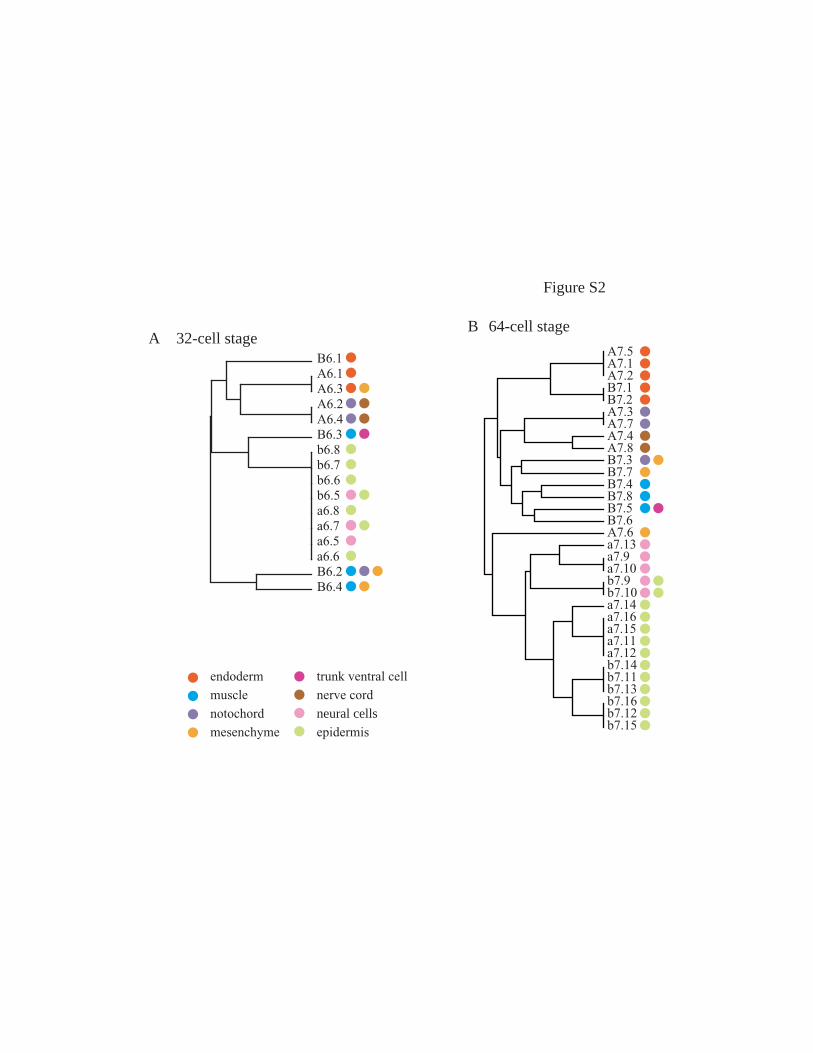
Fig. S2. Hierarchical clusterings of blastomeres based on regulatory-codes at (A) the
32-cell stage and (C) 64-cell stage. The developmental potentials of each cell are shown
with the same color codes as in Fig. 1.
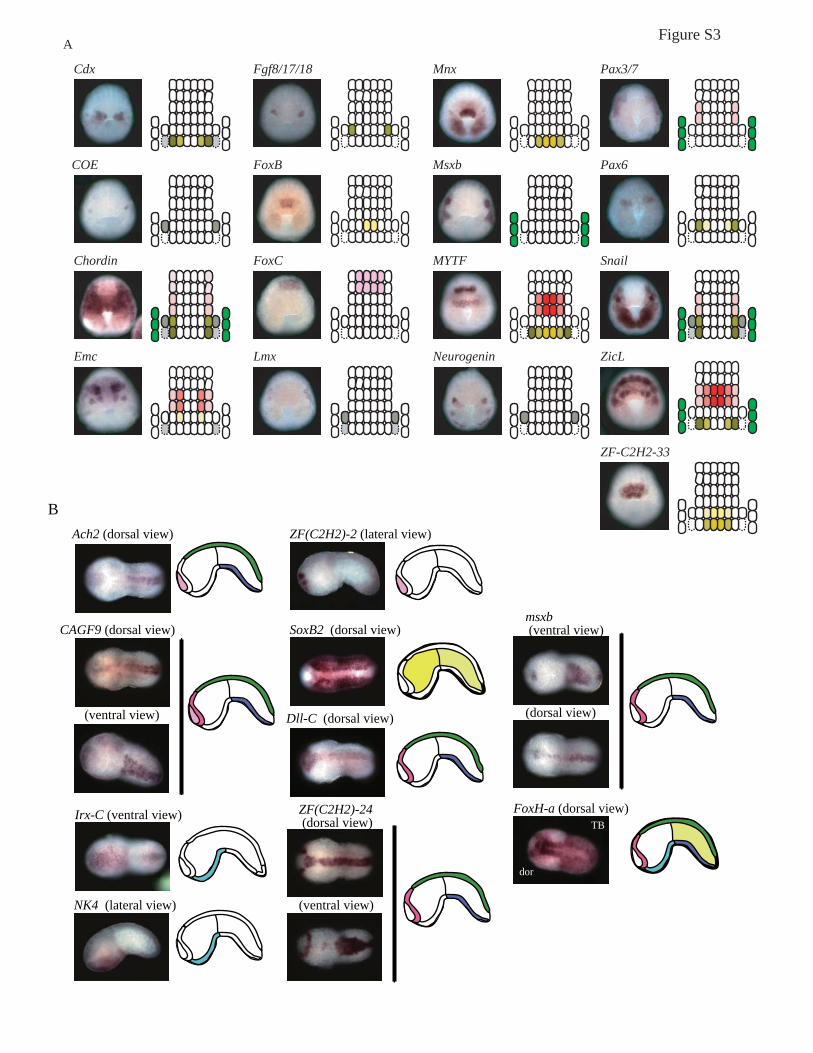
Fig. S3. The expression pattern of transcription factor and signaling molecule genes (A)
at the late gastrula stage and (B) at the tailbud stage. In each panel, a photograph detailing
the results of the in situ hybridization is shown at the left. A schematic representation of
expression is shown at the right.
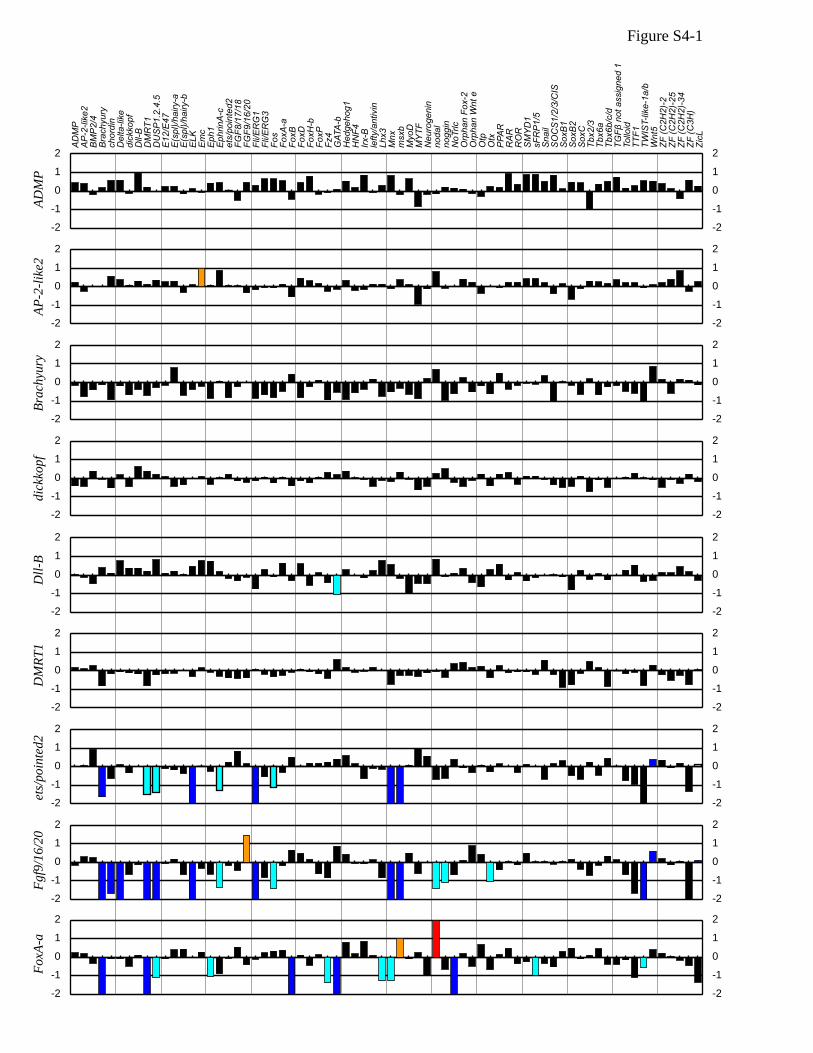
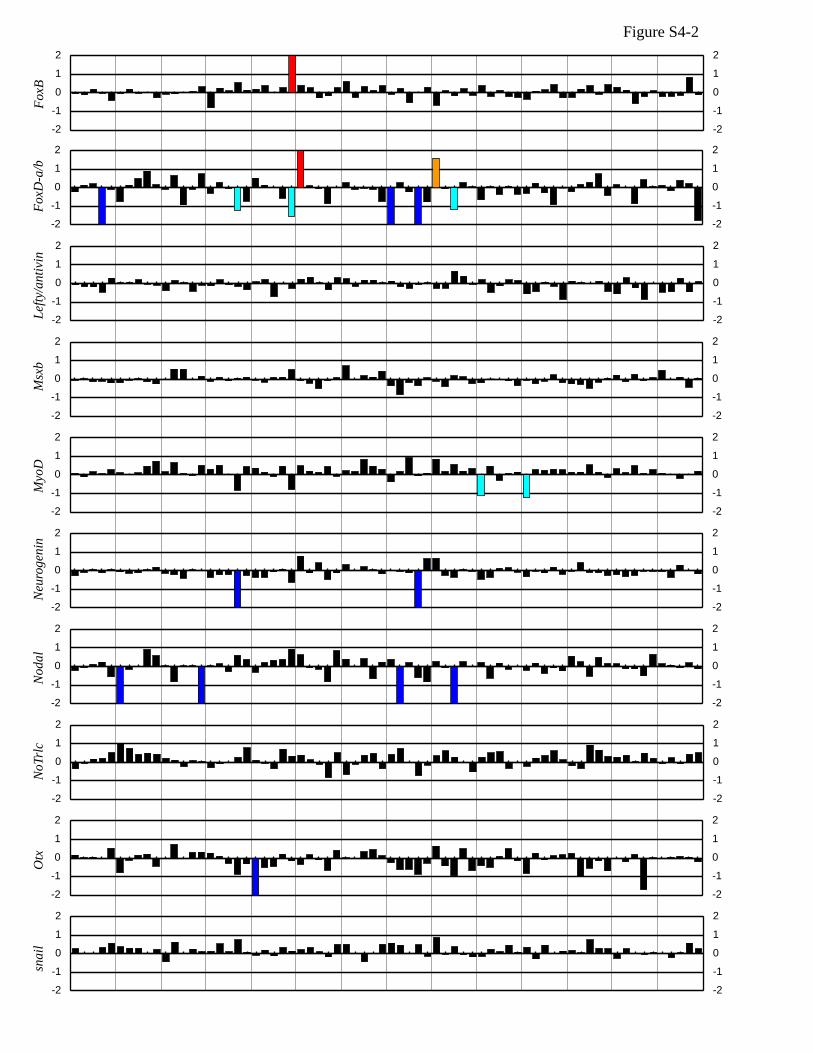
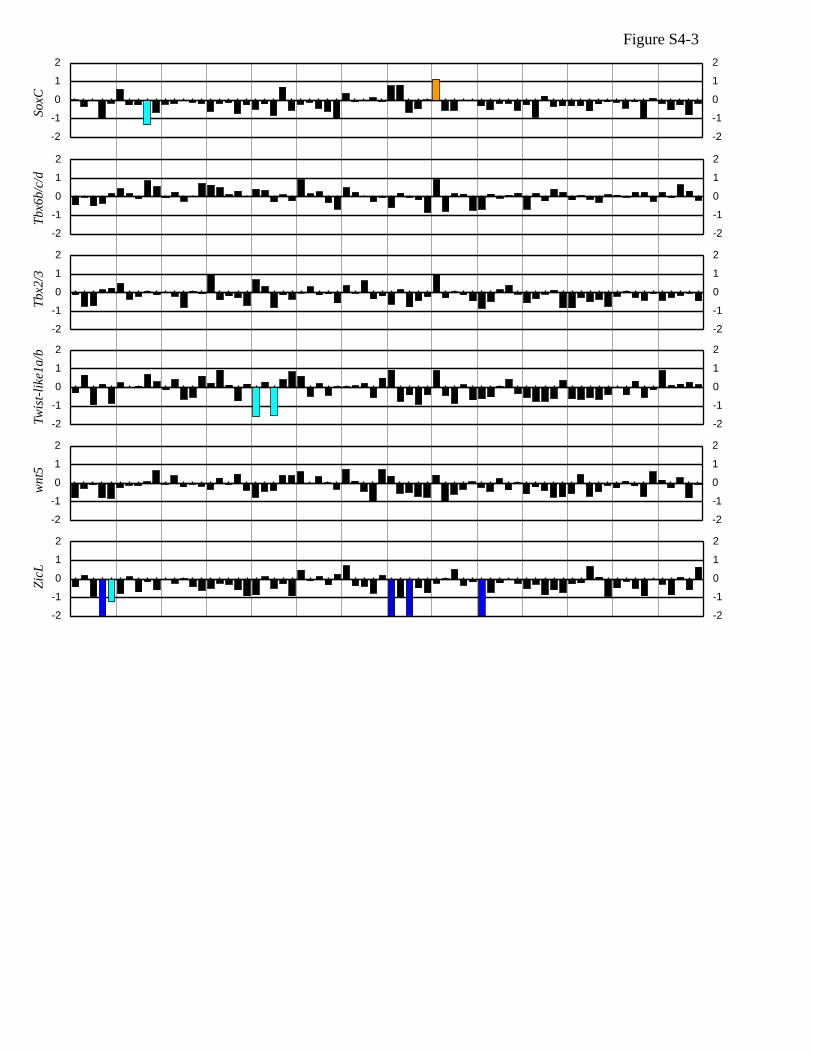
Fig. S4. Graphs representing the results of qRT-PCR analyses at the early gastrula.
Above each panel, the knocked-down genes are indicated. The bar in each graph
represents the change in the amount of gene transcript with a logarithm assuming two as
the bottom. Values exhibiting a greater than two-fold change, either an increase or
decrease, are shown in orange and light blue bars, respectively. Values exhibiting a
greater than four-fold change, either an increase or decrease, are shown as four-fold
change for simplicity and in red and blue bars, respectively. Each bar in each panel
represents transcription factor and signaling molecule genes as shown in the top.
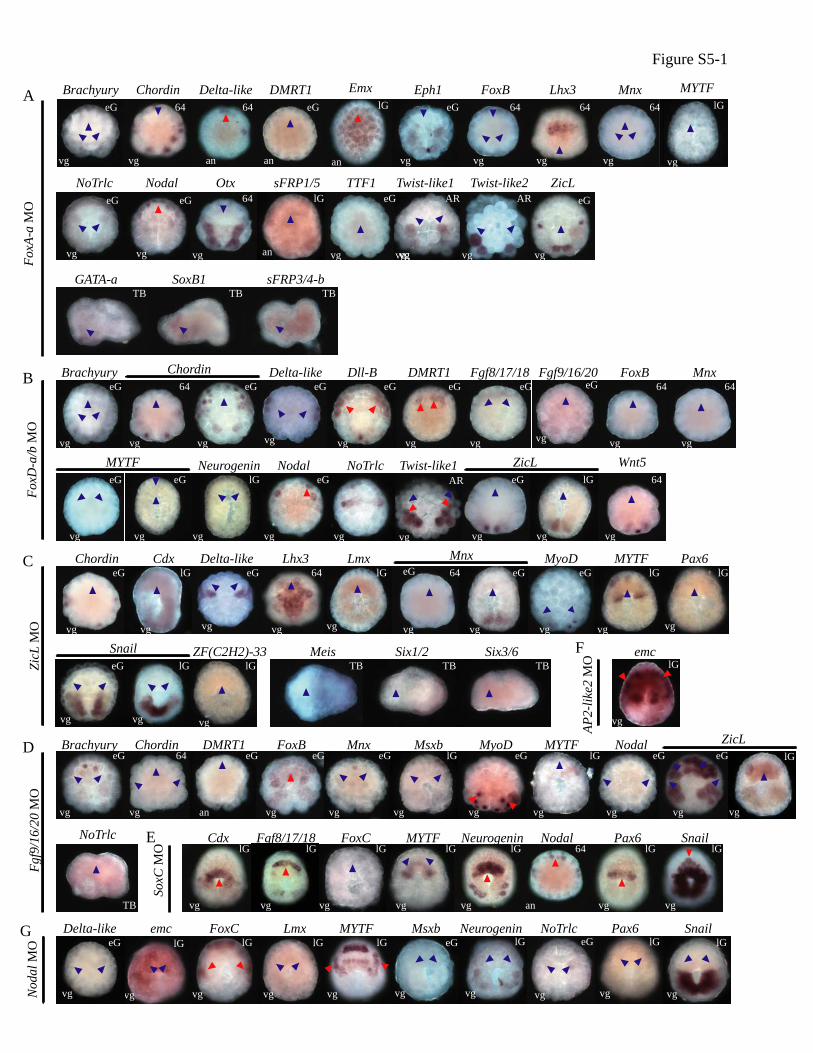
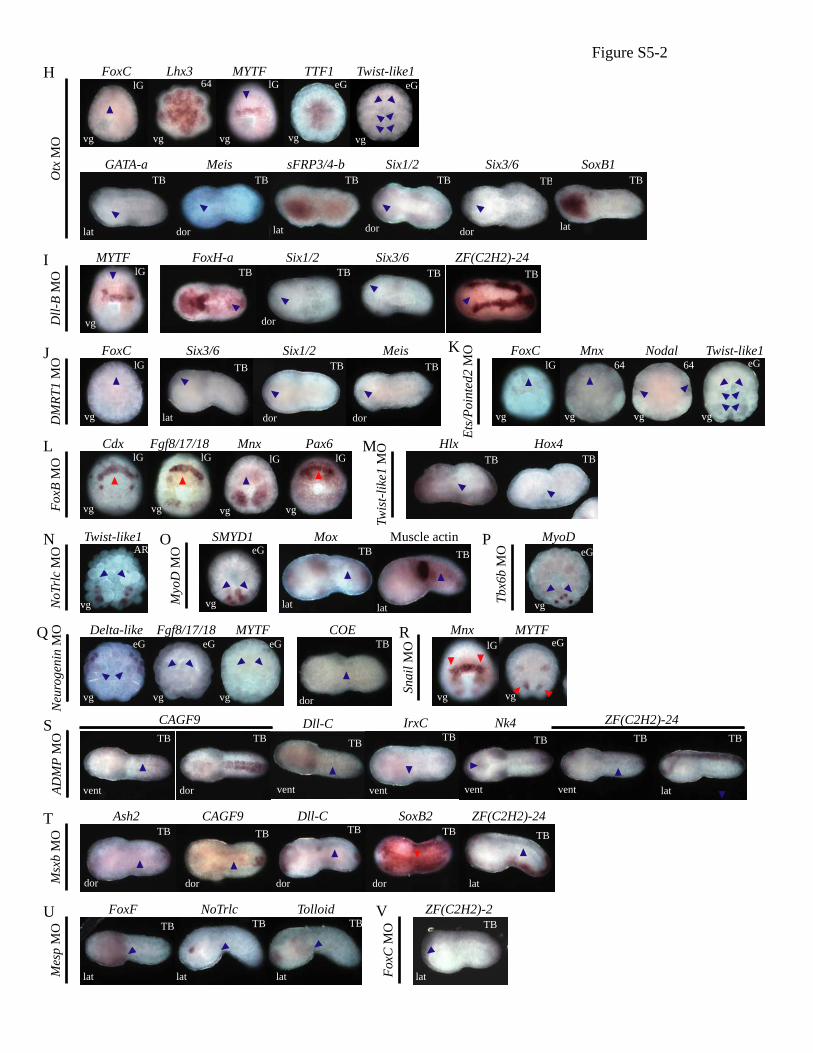
Fig. S5. Effects of gene knockdown. Knocked-down genes are indicated at the left of
each panel. The genes examined by WMISH are designated above each photograph. The
amount of expression lost in each experimental embryo is shown by blue arrowheads,
while ectopic expression is indicated by red arrows. The examined developmental stages
are shown at the top right of each photograph; 64, 64-cell stage; eG, early gastrula stage;
lG, late gastrula stage; TB, tailbud stage; AR, arrested at the 110-cell stage with
cytochalasin B and fixed at a point equivalent to the late gastrula stage. The orientation of
11
each embryo is shown in the left bottom of each photograph; vg, vegetal view; an, animal
view; dor, dorsal view; lat, lateral view; vent, ventral view.
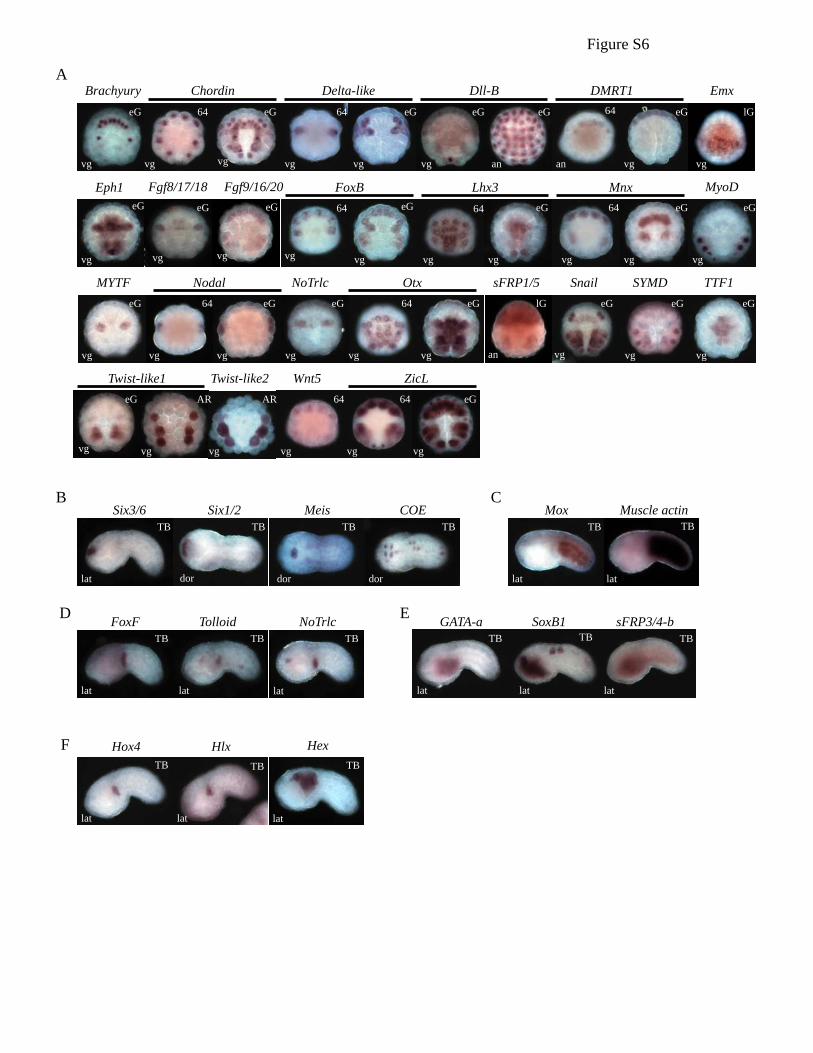
Fig. S6. Controls for whole-mount in situ hybridization experiments. The examined
developmental stages are shown at the right top of each photograph; 64, 64-cell stage; eG,
early gastrula stage; lG, late gastrula stage; TB, tailbud stage; AR, arrested at the 110-cell
stage with cytochalasin B and fixed at a point equivalent to the late gastrula stage. The
orientation of each embryo is shown at the bottom left of each photograph; vg, vegetal
view; an, animal view; dor, dorsal view; lat, lateral view; vent, ventral view.
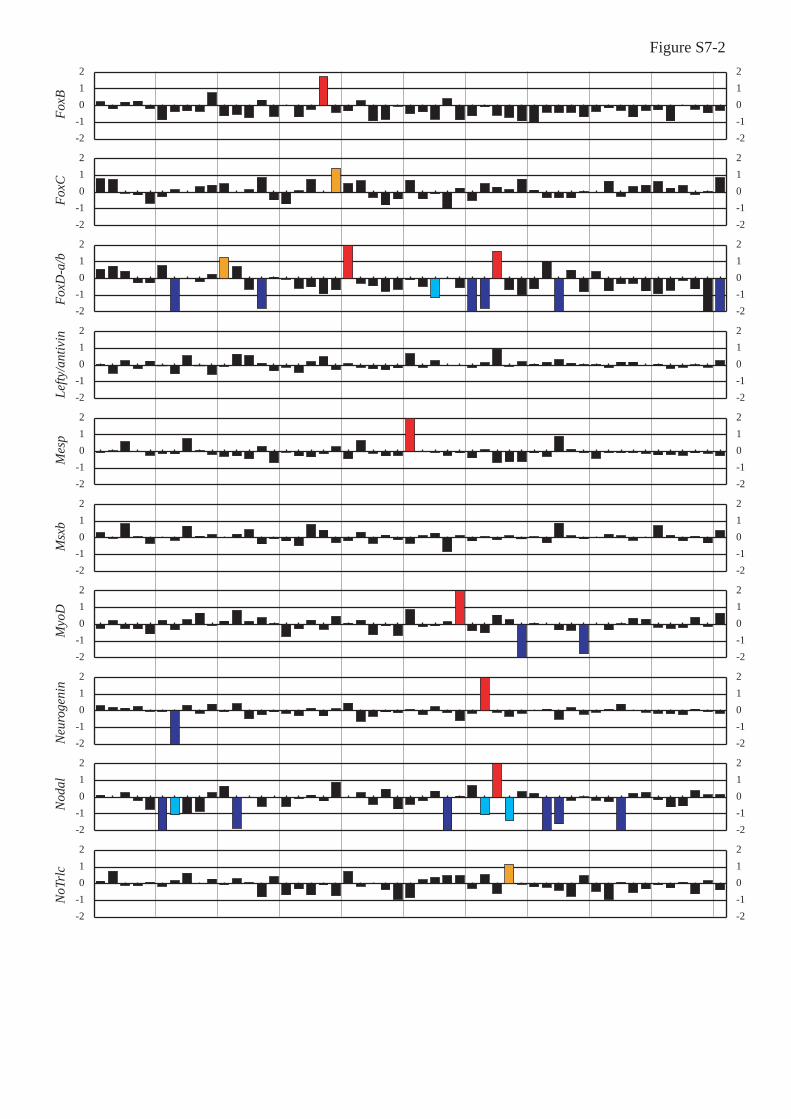
Fig. S7. Graphs representing the results of qRT-PCR analyses at the late gastrula. Above
each panel, the knocked-down genes are indicated. The bar in each graph represents the
change in the amount of gene transcript with a logarithm assuming two as the bottom.
Values exhibiting a greater than two-fold change, either an increase or decrease, are
shown in orange and light blue bars, respectively. Values exhibiting a greater than
four-fold change, either an increase or decrease, are shown in red and blue bars,
respectively and as four-fold change for simplicity. Each bar in each panel represents
transcription factor and signaling molecule genes as shown in the top.
Fig. S8. Simplified schematic representations of epistatic relationships among
transcription factor and signaling molecule genes in differentiation of Ciona larval tissues.
Genes are represented in the order of their expressions from the left (eggs) to the right
(tailbud embryos). Arrows indicate transcriptionally regulatory interactions. Black and
light blue arrows indicate regulatory interactions by transcription factor and signaling
molecule genes. The flat-head arrows indicate repression and the dotted arrows indicate
possible interactions that have not yet been proven definitely. Genes enclosed by red lines
are expressed in the differentiated tissues, and genes other than transcription factor and
signaling molecule genes are included among these genes enclosed by red lines. In (A),
(C) and (F), gene regulatory networks in other animals indicated are shown in grey boxes
for comparison. Yellow lines in (F) show cell boundaries. Note that these representations
12
are simplified for better understanding and include results previously published. See the
text for the details.
Fig. S9. Expression patterns of (A) Delta-like and (B) Pax3/7 during embryogenesis. (A)
Delta-like was not expressed maternally. Expressed began in b7.9 and b7.10 at the 64-cell
stage. At the early gastrula stage, Delta-like was expressed in b8.17, b8.19, A7.6, A8.15,
and A8.16 blastomeres. This gene continues to be expressed in the nerve cord lineage at
the late gastrula, neurula, and tailbud stages. (B) Pax3/7-like is first expressed in
decendents of b8.17, b8.18, b8.19, and b8.20 at the late gastrula stage. This gene is also
expressed in A9.32 and a9.49 blastomeres. Neural expression continues until the tailbud
stage.
Database S1. Unzip the archive file named 1123404DatabaseS1.zip and place the
unzipped files in your local hard disk. Open the file named as ‘TFSTgenes.html’ using a
web browser. This database is best browsed with Netscape ver6 or later or Firefox but
can be browsed with Internet explorer. The same database can be browsed in
http://ghost.zool.kyoto-u.ac.jp/network/TFSTgenes.html.
AP-2
-like
2Br
achy
ury
Dll-
BD
MRT
1E(
spl)/
hair
y-a
E(sp
l)/ha
iry-
bE1
2/E4
7EL
KEm
cEt
s/po
inte
d2Fl
i/ERG
1Fl
i/ERG
3Fo
sFo
xA-a
FoxB
FoxC
FoxD
-a/b
FoxH
-bFo
xPG
ATA-
bH
NF4
Irx-
BJu
nLh
x3M
esp
Mnx
msx
bM
yTF
Myo
DN
euro
geni
nN
oTrl
cO
rpha
n Fo
x-2
Otp
Otx
PPAR
RAR
ROR
SYM
D1
Snai
lSo
xB1
SoxB
2So
xCSo
xFTb
x2/3
Tbx6
aTb
x6b/
c/d
TTF1
TWIS
T-lik
e-1a
/bZi
cL
Zinc
Fin
ger (
C2H
2)-2
5Zi
nc F
inge
r (C2
H2)
-2
Zinc
Fin
ger (
C2H
2)-3
4Zi
nc F
inge
r (C
3H)
A5.1A5.2a5.3a5.4B5.1B5.2b5.3b5.4
A6.1A6.2A6.3A6.4a6.5a6.6a6.7a6.8B6.1B6.2B6.3B6.4b6.5b6.6b6.7b6.8
A7.1A7.2A7.3A7.4A7.5A7.6A7.7A7.8a7.9a7.10a7.11a7.12a7.13a7.14a7.15a7.16B7.1B7.2B7.3B7.4B7.5B7.6B7.7B7.8b7.9b7.10b7.11b7.12b7.13b7.14b7.15b7.16
16-c
ell s
tage
32-c
ell s
tage
64-c
ell s
tage
A7.1A7.2A8.5A8.6A8.7A8.8A7.5A7.6A8.13A8.14A8.15A8.16a8.17a8.18a8.19a8.20a8.21a8.22a8.23a8.24a8.25a8.26a8.27a8.28a8.29a8.30a8.31a8.32B7.1B7.2B8.5B8.6B8.7B8.8B7.5B7.6B7.7B8.15B8.16b8.17b8.18b8.19b8.20b8.21b8.22b8.23b8.24b8.25b8.26b8.27b8.28b8.29b8.30b8.31b8.32
early
gas
trula
stag
e
Figure S1
B7.6
A7.5A7.1A7.2B7.1B7.2A7.3A7.7A7.4A7.8B7.3B7.7B7.4B7.8B7.5
b7.9b7.10
A7.6a7.13a7.9a7.10
a7.14a7.16a7.15a7.11a7.12b7.14b7.11b7.13b7.16b7.12b7.15
B6.1A6.1A6.3A6.2A6.4B6.3b6.8b6.7b6.6b6.5a6.8a6.7a6.5a6.6B6.2B6.4
AB
32-cell stage64-cell stage
Figure S2
endoderm
notochordmuscle
mesenchyme
trunk ventral cell
neural cellsepidermis
nerve cord
MYTF
Fgf8/17/18
FoxC
Lmx
Pax6
Cdx
Neurogenin
COE
Snail
Mnx
FoxB
ZF-C2H2-33
A
ZicL
Pax3/7
Emc
Msxb
Chordin
NK4 (lateral view)
SoxB2 (dorsal view)
ZF(C2H2)-2 (lateral view)Ach2 (dorsal view)
Irx-C (ventral view) ZF(C2H2)-24 (dorsal view)
(ventral view)
msxb (ventral view)
(dorsal view)
CAGF9 (dorsal view)
(ventral view) Dll-C (dorsal view)
B
FoxH-a (dorsal view)TB
dor
Figure S3
FoxA
-aAD
MP
AP-2
-like
2Br
achy
ury
dick
kopf
Dll-
BD
MRT
1et
s/po
inte
d2Fg
f9/1
6/20
Figure S4-1
-2
-1
0
1
2
-2
-1
0
1
2
-2
-1
0
1
2
-2
-1
0
1
2
-2
-1
0
1
2
-2
-1
0
1
2
-2
-1
0
1
2
-2
-1
0
1
2
-2
-1
0
1
2
-2
-1
0
1
2
-2
-1
0
1
2
-2
-1
0
1
2
-2
-1
0
1
2
-2
-1
0
1
2
-2
-1
0
1
2
-2
-1
0
1
2
-2
-1
0
1
2
-2
-1
0
1
2
AD
MP
AP
-2-li
ke2
BM
P2/
4B
rach
yury
chor
din
Del
ta-li
kedi
ckko
pfD
ll-B
DM
RT1
DU
SP
1.2.
4.5
E12
/E47
E(s
pl)/h
airy
-aE
(spl
)/hai
ry-b
ELK
Em
cE
ph1
Eph
rinA
-cet
s/po
inte
d2FG
F8/1
7/18
FGF9
/16/
20Fl
i/ER
G1
Fli/E
RG
3Fo
sFo
xA-a
FoxB
FoxD
FoxH
-bFo
xPFz
4G
ATA
-bH
edge
hog1
HN
F4Irx
-Ble
fty/a
ntiv
inLh
x3M
nxm
sxb
Myo
DM
YTF
Neu
roge
nin
noda
lno
ggin
NoT
rlcO
rpha
n Fo
x-2
Orp
han
Wnt
eO
tpO
txP
PAR
RA
RR
OR
SM
YD
1sF
RP
1/5
Sna
ilS
OC
S1/
2/3/
CIS
Sox
B1
Sox
B2
Sox
CTb
x2/3
Tbx6
aTb
x6b/
c/d
TGFβ
not
ass
igne
d 1
Tollo
idTT
F1TW
IST-
like-
1a/b
Wnt
5ZF
(C2H
2)-2
ZF (C
2H2)
-25
ZF (C
2H2)
-34
ZF (C
3H)
ZicL
snai
lFo
xBFo
xD-a
/bLe
fty/a
ntiv
inM
sxb
Myo
DN
euro
geni
nN
odal
Otx
NoT
rlc
-2
-1
0
1
2
-2
-1
0
1
2
-2
-1
0
1
2
-2
-1
0
1
2
-2
-1
0
1
2
-2
-1
0
1
2
-2
-1
0
1
2
-2
-1
0
1
2
-2
-1
0
1
2
-2
-1
0
1
2
-2
-1
0
1
2
-2
-1
0
1
2
-2
-1
0
1
2
-2
-1
0
1
2
-2
-1
0
1
2
-2
-1
0
1
2
-2
-1
0
1
2
-2
-1
0
1
2
-2
-1
0
1
2
-2
-1
0
1
2
Figure S4-2
SoxC
Tbx6
b/c/
dTb
x2/3
Twis
t-lik
e1a/
bw
nt5
ZicL
-2
-1
0
1
2
-2
-1
0
1
2
-2
-1
0
1
2
-2
-1
0
1
2
-2
-1
0
1
2
-2
-1
0
1
2
-2
-1
0
1
2
-2
-1
0
1
2
-2
-1
0
1
2
-2
-1
0
1
2
-2
-1
0
1
2
-2
-1
0
1
2
Figure S4-3
Brachyury Chordin DMRT1 Eph1 FoxB Lhx3 Mnx
NoTrlc Nodal
Brachyury Chordin DMRT1Dll-B Fgf8/17/18 FoxB Mnx
NoTrlc
Chordin Lhx3 MyoDMnx
Snail
Cdx Lmx
Brachyury Chordin DMRT1 FoxB Mnx MyoD Nodal ZicLMsxb MYTF
NoTrlc
Otx TTF1 ZicL
Emx MYTF
Twist-like1 Twist-like2sFRP1/5
GATA-a SoxB1 sFRP3/4-b
Nodal Wnt5MYTF Neurogenin Twist-like1 ZicL
MYTF Pax6
ZF(C2H2)-33 Meis Six1/2 Six3/6
NodalCdx FoxCFgf8/17/18 MYTF Neurogenin Pax6 Snail
AP2-
like2
MO
SoxC
MO
Fgf9
/16/
20 M
OZi
cL M
OFo
xD-a
/b M
OFo
xA-a
MO
emc
eG 64
64
64 6464
64
64
64
64 64
64eG
eGeG
eG eG
eGeG
eG lG lG lG
lG lGlG lG lG lG lG
lG
eG eG eG eG eG eG
eG
eG
eG
eG
eG
eG
lG
eG
eG
eG
TB
TB
TB
TB TB
TB TB
eG 64 64
eG eG lG
lG
lG
lG lG lG
lG lG
lG
lG
AR
AR
vg vg an vg
vg vg vgvg vg vg
vg
vg
vg
vg vg vg vg vg
vg vg
vg
vg
vg vg vg
vg vg an vg vg vg vg vg vgvg vg
anvg vg vg vg vg vg vg
vg
vg vg vg
vg
vg vgvgvg
vg vg vg
vg vg vgvgvgvg
vgan
vgvgvg
Delta-like
Delta-like Fgf9/16/20
Delta-like
eG
eG
64
eG
AR
an
an
eG
vg
vg vg
Figure S5-1
A
E
F
D
C
B
Msxb
Nod
al M
O eG
vg
MYTFlG
vg
NeurogeninlG
vg
SnaillG
vg
Pax6lG
vg
emclG
vg
LmxlG
vg
FoxClG
vg
NoTrlceG
vg
Delta-likeeG
vg
G
TB
dor
Mnx
Twis
t-lik
e1 M
O
Snai
l MO
FoxB
MO
NoT
rlc
MO
Myo
D M
O
Tbx6
b M
O
Neu
roge
nin
MO
ADM
P M
OM
sxb
MO
Mes
p M
O
FoxC
MO
Ets/
Poin
ted2
MO
DM
RT1
MO
Dll-
B M
OO
tx M
O
NoTrlc TolloidFoxF ZF(C2H2)-2
MYTF
FoxClG
vg
Lhx364
vg
MYTFlG
vg
Twist-like1eG
vg
SMYD1eG
vg
MyoDeG
vg
eG
vg
MYTFeG
vg
Fgf8/17/18eG
vg
Nodal64
vg
Mnx64
vg
FoxClG
vg
FoxClG
vg
lG
vg
MnxlG
vg
Fgf8/17/18lG
vg
Pax6lG
vg
CdxlG
vg
Twist-like1AR
vg
TTF1eG
vg
FoxH-aTB
Six3/6TB
ZF(C2H2)-24TB
MYTFlG
vg
HlxTB
Hox4TB
TBTBTB TB
ZF(C2H2)-24TB
vent
IrxCTB
vent
dor
SoxB2TB
dor
Nk4TB
vent
TB
vent
Dll-CCAGF9TB
vent
COETB
dor
MoxTB
lat
Muscle actinTB
lat
TB
lat
Ash2TB
dor
Dll-CTB
dor
CAGF9TB
dor
ZF(C2H2)-24TB
lat
lat latlatlat
Six3/6TB
lat
Six1/2TB
dor
MeisTB
dor
Six1/2TB
dor
Six1/2TB
dor
MeisTB
dor
Six3/6TB
dor
GATA-aTB
lat
SoxB1TB
lat
sFRP3/4-bTB
lat
eG
vg
Delta-like
Twist-like1eG
vg
Figure S5-2
K
VU
T
S
RQ
PON
ML
J
I
H
Brachyury Dll-B DMRT1
Eph1 Fgf8/17/18 Lhx3 Mnx MyoD
Nodal Otx
Twist-like2 Wnt5
Emx
sFRP1/5
FoxB
NoTrlcMYTF
ZicL
Chordin Delta-like
Fgf9/16/20
Snail SYMD TTF1
Twist-like1
eG
vg
64
vg
64
vg
64
vg
64
vg
64
vg
64
vg
64
vg
64 64
vg vg
64
an
eG
vg
eG
vg
eG
vg
eG
vg
eG
vg
eG
vg
eG
vg
eG
vg
lG
lG
an
eG
vg
eG
vg
eG
vg
eG
vg
eG
vg
eG
vg
eG
vg
eG
vg
eG
vg
eG
vg
eG eG
vgvg
eG
an
vg vg
AR AR
Six3/6 Six1/2 Meis COE Mox Muscle actin
FoxF Tolloid NoTrlc GATA-a SoxB1 sFRP3/4-b
Hox4 Hlx
TB
lat
TB
lat
TB
lat
TB
lat
TB
lat
TB
lat
TB
lat
TB
lat lat
TB
lat
TB
lat
HexTB
lat
TB
dor
TB
dor dor
TB
TB
A
B C
D E
F
Figure S6
vg

-2-1012
-2-1012
-2-1012
-2-1012
Figure S7-1AD
MP
AP-2
-like
2Br
achy
ury
dick
kopf
Dll-
BD
MRT
1et
s/po
inte
d2Fo
xA-a
Fgf9
/16/
20
-2-1012
-2-1012
-2-1012
-2-1012
-2-1012
-2-1012
-2-1012
-2-1012
-2-1012
-2-1012
-2-1012
-2-1012
-2-1012
-2-1012
AD
MP
AP
-2-li
ke2
BM
P2/
4B
MP
5/7-
like
Cdx
chor
din
CO
ED
elta
-like
dick
kopf
Dll-
BD
MR
T1E
mc
Em
xFG
F8/1
7/18
FGF9
/16/
20Fl
i/ER
G1
Fos
FoxA
-aFo
xBFo
xCFo
xD-a
/bG
ATA
-bH
exJu
nLA
G1-
like
5M
esp
Mis
tM
nxm
sxb
Myo
DM
YTF
Neu
roge
nin
noda
lN
oTrlc
Otp
Otx
Pax
3/7
Pax
6R
AR
SM
YD
1sF
RP
1/5
Sna
ilS
OC
S1/
2/3/
CIS
Sox
CTb
x6a
Tbx6
b/c/
dTW
IST-
like-
1a/b
TWIS
T-lik
e-2
Wnt
5ZF
(C2H
2)-3
3Zi
cL
FoxB
FoxD
-a/b
FoxC
Lefty
/ant
ivin
Mes
pM
sxb
Myo
DN
euro
geni
nN
odal
NoT
rlc
-2-1012
-2-1012
-2-1012
-2-1012
-2-1012
-2-1012
-2-1012
-2-1012
-2-1012
-2-1012
-2-1012
-2-1012
-2-1012
-2-1012
-2-1012
-2-1012
-2-1012
-2-1012
-2-1012
-2-1012
Figure S7-2

SoxC
Tbx6
b/c/
dTb
x2/3
Twis
t-lik
e1a/
bw
nt5
ZicL
Otx
snai
l
-2-1012
-2-1012
-2-1012
-2-1012
-2-1012
-2-1012
-2-1012
-2-1012
-2-1012
-2-1012
-2-1012
-2-1012
-2-1012
-2-1012
-2-1012
-2-1012
Figure S7-3
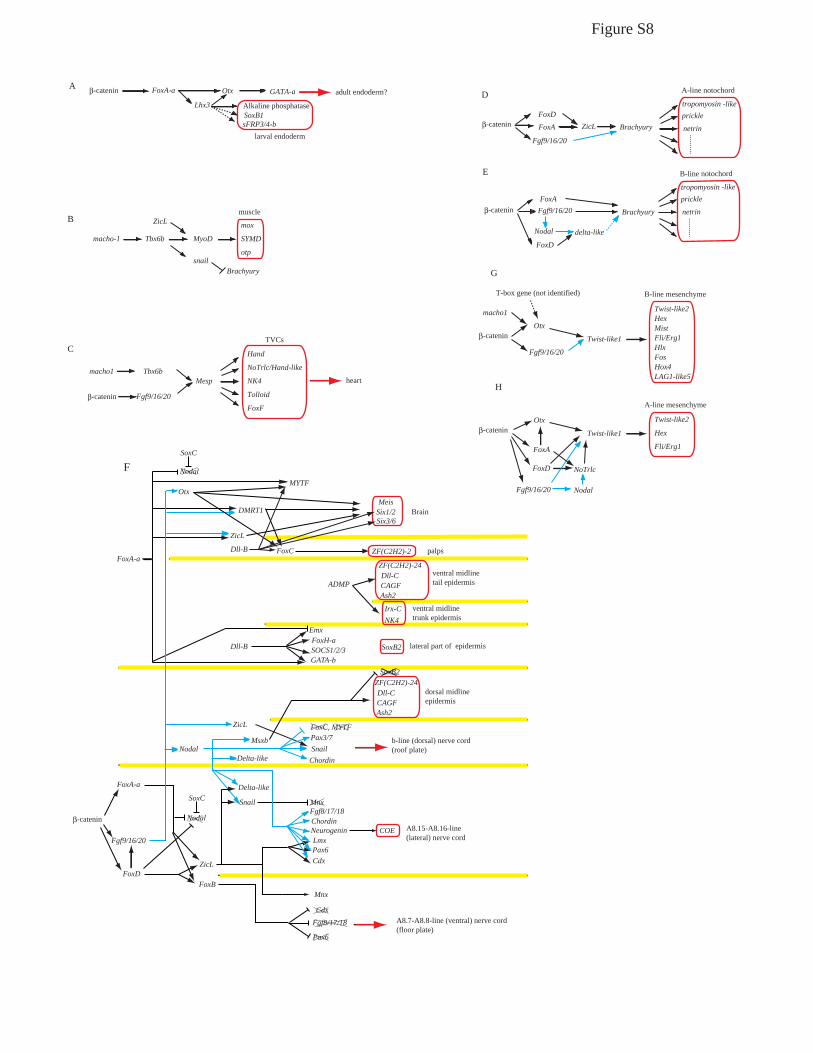
Figure S8
G
β-catenin
macho1
T-box gene (not identified)
Fgf9/16/20
Otx
Twist-like1
Twist-like2HexMistFli/Erg1HlxFosHox4LAG1-like5
B-line mesenchyme
H
β-catenin
Fgf9/16/20
Otx
Twist-like1
Twist-like2
Hex
Fli/Erg1
A-line mesenchyme
FoxA
FoxD NoTrlc
Nodal
Dll-B
Dll-B
SoxB2
EmxFoxH-aSOCS1/2/3GATA-b
ADMP
ZF(C2H2)-24Dll-CCAGFAsh2
Irx-CNK4
ventral midlinetail epidermis
ventral midlinetrunk epidermis
lateral part of epidermis
FoxC
Otx
DMRT1
ZF(C2H2)-2
Six1/2Six3/6
Meis
palps
Brain
ZicL
MYTF
COE
ZicL
Fgf9/16/20
Delta-like
Chordin
Fgf8/17/18
LmxNeurogenin
Snail
SoxC
Mnx
A8.15-A8.16-line (lateral) nerve cord
A8.7-A8.8-line (ventral) nerve cord(floor plate)
Pax6
Pax6
FoxA-a
FoxA-a
FoxDFoxB
Fgf8/17/18
Mnx
Cdx
Cdx
FoxC, MYTF
Nodal
Nodal
SnailPax3/7
Nodal
b-line (dorsal) nerve cord (roof plate)
Delta-like Chordin
dorsal midline epidermis
ZF(C2H2)-24Dll-CCAGFAsh2
Msxb
ZicL
SoxB2
β-catenin
F
SoxC
muscle
macho-1 Tbx6b
ZicL
MyoD
mox
SYMD
otpsnail
Brachyury
B
β-catenin FoxA-a Otx GATA-a
Lhx3 Alkaline phosphataseSoxB1sFRP3/4-b
larval endoderm
adult endoderm?A
TVCs
β-catenin
heartmacho1 Tbx6b
Fgf9/16/20
Mesp
Hand
NoTrlc/Hand-like
NK4
Tolloid
FoxF
C
FoxAβ-catenin
Fgf9/16/20
FoxD
BrachyuryZicL
tropomyosin -likeprickle
netrin..........
A-line notochordD
Nodal
FoxAβ-catenin Fgf9/16/20
FoxD
Brachyury
delta-like
tropomyosin -likeprickle
netrin..........
B-line notochordE

Figure S9
tailbud(dosal view)
tailbud(lateral view)
lategastrula
earlygastrula
64-cellstage
32-cellstageA
B
Del
ta-li
kePa
x3/7
27
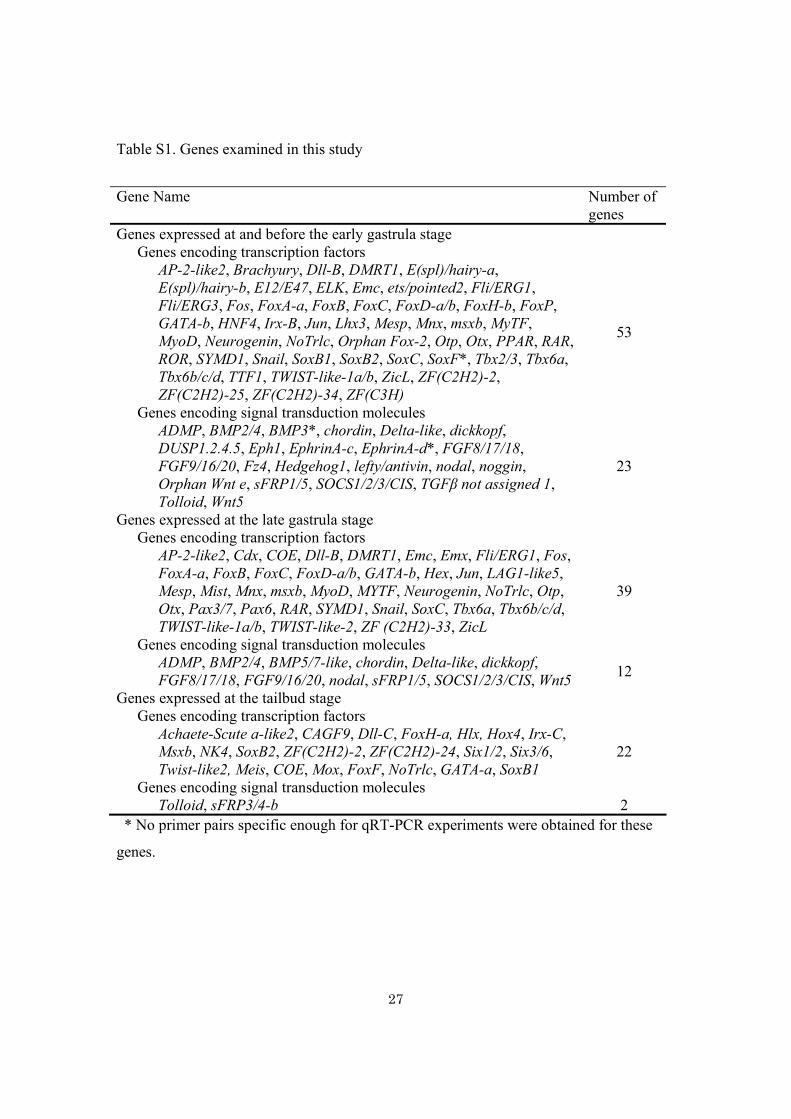
Table S1. Genes examined in this study
* No primer pairs specific enough for qRT-PCR experiments were obtained for these
genes.
Gene Name Number of genes
Genes expressed at and before the early gastrula stage Genes encoding transcription factors
AP-2-like2, Brachyury, Dll-B, DMRT1, E(spl)/hairy-a, E(spl)/hairy-b, E12/E47, ELK, Emc, ets/pointed2, Fli/ERG1, Fli/ERG3, Fos, FoxA-a, FoxB, FoxC, FoxD-a/b, FoxH-b, FoxP, GATA-b, HNF4, Irx-B, Jun, Lhx3, Mesp, Mnx, msxb, MyTF, MyoD, Neurogenin, NoTrlc, Orphan Fox-2, Otp, Otx, PPAR, RAR, ROR, SYMD1, Snail, SoxB1, SoxB2, SoxC, SoxF*, Tbx2/3, Tbx6a, Tbx6b/c/d, TTF1, TWIST-like-1a/b, ZicL, ZF(C2H2)-2, ZF(C2H2)-25, ZF(C2H2)-34, ZF(C3H)
53
Genes encoding signal transduction molecules ADMP, BMP2/4, BMP3*, chordin, Delta-like, dickkopf, DUSP1.2.4.5, Eph1, EphrinA-c, EphrinA-d*, FGF8/17/18, FGF9/16/20, Fz4, Hedgehog1, lefty/antivin, nodal, noggin, Orphan Wnt e, sFRP1/5, SOCS1/2/3/CIS, TGFβ not assigned 1, Tolloid, Wnt5
23
Genes expressed at the late gastrula stage Genes encoding transcription factors
AP-2-like2, Cdx, COE, Dll-B, DMRT1, Emc, Emx, Fli/ERG1, Fos, FoxA-a, FoxB, FoxC, FoxD-a/b, GATA-b, Hex, Jun, LAG1-like5, Mesp, Mist, Mnx, msxb, MyoD, MYTF, Neurogenin, NoTrlc, Otp, Otx, Pax3/7, Pax6, RAR, SYMD1, Snail, SoxC, Tbx6a, Tbx6b/c/d, TWIST-like-1a/b, TWIST-like-2, ZF (C2H2)-33, ZicL
39
Genes encoding signal transduction molecules ADMP, BMP2/4, BMP5/7-like, chordin, Delta-like, dickkopf, FGF8/17/18, FGF9/16/20, nodal, sFRP1/5, SOCS1/2/3/CIS, Wnt5 12
Genes expressed at the tailbud stage Genes encoding transcription factors
Achaete-Scute a-like2, CAGF9, Dll-C, FoxH-a, Hlx, Hox4, Irx-C, Msxb, NK4, SoxB2, ZF(C2H2)-2, ZF(C2H2)-24, Six1/2, Six3/6, Twist-like2, Meis, COE, Mox, FoxF, NoTrlc, GATA-a, SoxB1
22
Genes encoding signal transduction molecules Tolloid, sFRP3/4-b 2
28
Table S2. Morpholino oligonucleotides used in this study.
Gene Sequence ADMP TATCGTGTAGTTTGCTTTCTATATA AP-2-like2 CAACGCTGCCTGCCTTGATCCTCGG BMP2/4 AGAAAACCGCTGGATTTTATTGTGA BMP3 TTAAGGTTTTACTGAGTCTCATTAT Brachyury ACGTCATTGTAGGTTTGTAACTCGC dickkopf CAGCAACATCGCGCTTCAACTACAG Dll-B TCGGAGATTCAACGACGCTTGACAT DMRT1 CTGTTTGCTATAATTTCTGTAACTC DUSP1.2.4.5 CAGGAGATAGGTTGGCTCACCATTT E(spl)/hairy-a TTCTTCGTTCAACAGGCATGATTGT E(spl)/hairy-b TTAAGAAGCAGCAGAAAAGTAATTC E12/E47 AACTGTTACATTAAAAACCTTAAAC ELK CATCATTTCCAACAGATAAGCAATA Emc CAACTTTAACCATTTTGCTGATTCT Eph1 TAATCCATCGTAACAAATATACAGA EphrinA-c GAGCGGATCATGGTGTAGGTTTCAA EphrinA-d TTGAGTTGCCATTCTTCGTTTTAAT ets/pointed2 TACCATGTTTCTGAAGCGATGCTTT FGF8/17/18 CATTTTCGTATGTAATCCAAGAGAA FGF9/16/20 CATAGACATTTTCAGTATGGAAGGC Fli/ERG1 TTAACGCTGCTCAACATATTCCTGG Fli/ERG3 ACAGTTTGCGTCATGGCGAATCGGC Fos GATACATTCCTCCTAGAGTTTTGCA FoxA-a ATCCGATTTCAAAAGCTTTCTCAGA FoxB GTCCTGGTCGTGGCATTTTTAATTC FoxC CATTGTCATTATAGAGAATCAAACC FoxD-a/b GCACACAACACTGCACTGTCATCAT FoxH-b TCGGCGGCATCGGAGGGACGAACTC FoxP TTCGTGGACAGCCTTGCGCATTCTC Fz4 GTCTAATCTCCATGTCCAATTATAC Hedgehog1 TTTCAGCCTTATACATTGATATCTA HNF4 CATTCCGTAGGTGAAGGCGCCGATG Irx-B TTAGATAGACCGTGTCTTGATTCCG Jun AGAGGCGTGAGACAGATAGTAGGTA lefty/antivin CATTATTATTGAATGTTCTAGATTT Lhx3 GCTTTAGTATCGAGAATCATTTTAA Mesp CATAATACAAGTTTCAAATCAACCT Mnx CATTTTAAATCTTAAATATCAAAGG
29
msxb ATTCGTTTACTGTCATTTTTAATTT MyoD GCTCCTCTAGAGAGATACACGTCAT Neurogenin AAATCCAACATTTTGTAGCAAGAGC nodal TCGAATATTTTGTAACTTCCGGTTT noggin CATTTCGAATAATTTTAACCGAATT NoTrlc ACTGTTGTCATGTTAAGCTACTGTG Orphan Fox-2 GTAGTTGGAGTCTTACCTAATACAT Orphan Wnt e CATTCCAAATCCTTATCCTCTTTAA Otx CATGTTAGGAATTGAACCCGTGGTA PPAR AAAATAGATATGTAGTAATAAACTA RAR CAACCGTTTCCATTTTCAAAACCAA ROR CATGTTTTAATACAGGTGGAAATGA sFRP1/5 TTTATACATGAGAACTAAACCAAGA Snail GTCATGATGTAATCACAGTAATATA SOCS1/2/3/CIS CATTTCTCATTTATTTCCTTACAAC SoxB1 AACATGAAGTCGTTCTGAGATGGCT SoxB2 CATAATAACGTGTTAGAATATCTTG SoxC TTGATGTACTTGCCATAGCTGAACT SoxF CATTTTCGATTCTACAGTGACGCCT SYMD1 CAACTCCAGGATAAGACATTGTAAT Tbx2/3 GAGGTCCACACCAACACTTTAACAT Tbx6a CATTTGTAATTCCACTTCAGTGTTC Tbx6b/c/d TTACAATTTCCTCTCTCTTTCGATT TGFβ not assigned 1 CATCTTTAACCCAACACTTTCAACG TTF1 CATCTCACAGCAAAGTCTCCAGTGT Twist-like1a/b AAAGTAAGTGACGTTTGGTTTGCTA Wnt5 CATATTTCCGGCAACGATTCAAACT ZF (C2H2)-2 CTATCAAGTCCTATATTAACCTCTA ZF (C2H2)-25 GGATATGTAATTGTACATTGCTTGT ZF (C2H2)-34 CATTTCTTTATCTCGTGCGCGGTTT ZF (C3H) GAGATCATAGTTGAAGACATAGTGG ZicL GATCAACCATTACATTAGAATACAT
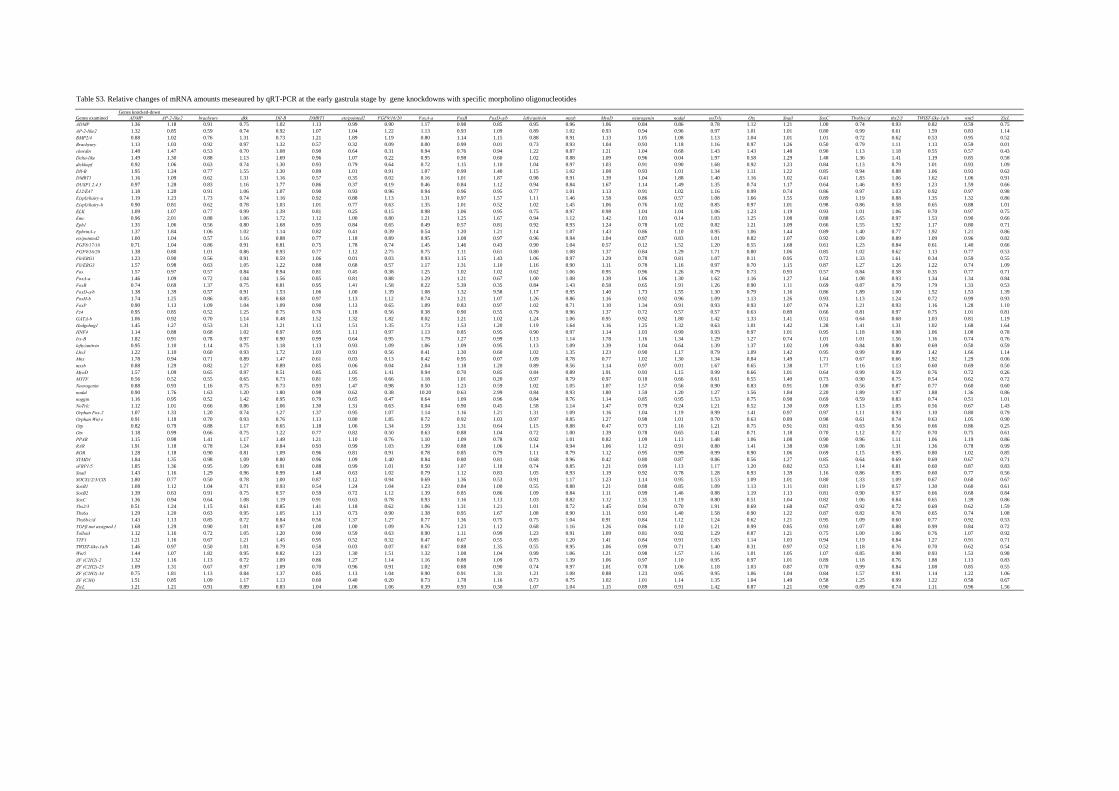
Table S3. Relative changes of mRNA amounts meseaured by qRT-PCR at the early gastrula stage by gene knockdowns with specific morpholino oligonucleotidesGenes knocked-down
Genes examined ADMP AP-2-like2 brachyury dkk Dll-B DMRT1 ets/pointed2 FGF9/16/20 FoxA-a FoxB FoxD-a/b lefty/antivin msxb MyoD neurogenin nodal noTrlc Otx Snail SoxC Tbx6b/c/d tbx2/3 TWIST-like-1a/b wnt5 ZicLADMP 1.36 1.18 0.91 0.75 1.02 1.13 0.99 0.90 1.17 0.98 0.85 0.95 0.96 1.06 0.84 0.86 0.78 1.12 1.21 1.00 0.74 0.93 0.82 0.59 0.75AP-2-like2 1.32 0.85 0.59 0.74 0.92 1.07 1.04 1.22 1.13 0.93 1.09 0.89 1.02 0.93 0.94 0.96 0.97 1.01 1.01 0.80 0.99 0.61 1.59 0.83 1.14BMP2/4 0.88 1.02 0.76 1.31 0.73 1.21 1.89 1.19 0.80 1.14 1.15 0.88 0.91 1.13 1.05 1.08 1.13 1.04 1.01 1.01 0.72 0.62 0.53 0.95 0.52Brachyury 1.13 1.03 0.92 0.97 1.32 0.57 0.32 0.09 0.00 0.99 0.01 0.73 0.93 1.04 0.93 1.18 1.16 0.97 1.26 0.50 0.79 1.11 1.13 0.59 0.01chordin 1.48 1.47 0.53 0.70 1.08 0.90 0.64 0.31 0.94 0.76 0.94 1.22 0.87 1.21 1.04 0.68 1.43 1.43 1.48 0.90 1.13 1.18 0.55 0.57 0.43Delta-like 1.49 1.30 0.88 1.13 1.69 0.96 1.07 0.22 0.95 0.98 0.60 1.02 0.88 1.09 0.96 0.04 1.97 0.58 1.29 1.48 1.36 1.41 1.19 0.85 0.58dickkopf 0.92 1.06 0.63 0.74 1.30 0.93 0.79 0.64 0.72 1.15 1.10 1.04 0.97 1.03 0.91 0.90 1.68 0.92 1.23 0.84 1.13 0.79 1.01 0.93 1.09Dll-B 1.95 1.24 0.77 1.55 1.30 0.89 1.01 0.91 1.07 0.99 1.40 1.15 1.02 1.08 0.93 1.01 1.34 1.11 1.22 0.85 0.94 0.88 1.06 0.93 0.62DMRT1 1.16 1.09 0.62 1.31 1.16 0.57 0.35 0.02 0.16 1.01 1.87 0.98 0.91 1.39 1.04 1.88 1.40 1.16 1.02 0.41 1.83 1.06 1.62 1.06 0.91DUSP1.2.4.5 0.97 1.28 0.83 1.16 1.77 0.86 0.37 0.19 0.46 0.84 1.12 0.94 0.84 1.67 1.14 1.49 1.35 0.74 1.17 0.64 1.46 0.93 1.23 1.59 0.66E12/E47 1.18 1.20 0.91 1.06 1.07 0.90 0.93 0.96 0.94 0.96 0.95 0.77 1.01 1.13 0.91 1.02 1.16 0.99 0.74 0.86 0.97 1.03 0.92 0.97 0.98E(spl)/hairy-a 1.19 1.23 1.73 0.74 1.16 0.92 0.88 1.13 1.31 0.97 1.57 1.11 1.46 1.58 0.86 0.57 1.08 1.66 1.55 0.89 1.19 0.88 1.35 1.32 0.86E(spl)/hairy-b 0.90 0.81 0.62 0.78 1.03 1.01 0.77 0.63 1.35 1.01 0.52 1.02 1.45 1.06 0.76 1.02 0.85 0.97 1.01 0.98 0.86 0.58 0.65 0.88 1.01ELK 1.09 1.07 0.77 0.99 1.39 0.81 0.25 0.15 0.98 1.06 0.95 0.75 0.97 0.98 1.04 1.04 1.06 1.23 1.19 0.93 1.01 1.06 0.70 0.97 0.75Emc 0.96 2.01 0.88 1.06 1.72 1.12 1.00 0.80 1.21 1.25 1.67 0.94 1.12 1.42 1.03 0.14 1.03 1.25 1.08 0.88 1.65 0.97 1.53 0.90 0.66Eph1 1.35 1.06 0.56 0.80 1.68 0.95 0.84 0.65 0.49 0.57 0.81 0.92 0.93 1.24 0.78 1.02 0.82 1.21 1.09 0.66 1.55 1.92 1.17 0.80 0.71EphrinA-c 1.37 1.84 1.06 1.02 1.14 0.82 0.41 0.39 0.54 1.20 1.21 1.14 1.07 1.43 0.86 1.10 0.95 1.06 1.44 0.89 1.40 0.77 1.92 1.21 0.86ets/pointed2 1.00 1.04 0.57 1.16 0.88 0.77 1.18 0.89 0.95 1.08 0.97 0.96 0.94 1.04 0.87 0.83 1.01 0.82 1.07 0.92 1.09 0.89 1.09 0.96 0.82FGF8/17/18 0.71 1.04 0.86 0.91 0.81 0.75 1.78 0.74 1.45 1.46 0.43 0.90 1.04 0.57 0.12 1.52 1.20 0.55 1.68 0.61 1.23 0.84 0.61 1.40 0.66FGF9/16/20 1.38 0.80 1.01 0.86 0.93 0.77 1.12 2.75 0.75 1.11 0.61 0.80 1.08 1.37 0.84 1.29 1.71 0.80 1.06 0.85 1.02 0.62 1.13 0.77 0.53Fli/ERG1 1.23 0.90 0.56 0.91 0.59 1.06 0.01 0.03 0.93 1.15 1.43 1.06 0.97 1.29 0.78 0.81 1.07 0.11 0.95 0.72 1.33 1.61 0.34 0.59 0.55Fli/ERG3 1.57 0.98 0.63 1.05 1.22 0.88 0.68 0.57 1.17 1.31 1.10 1.16 0.90 1.11 0.78 1.16 0.97 0.70 1.15 0.87 1.27 1.26 1.22 0.74 1.09Fos 1.57 0.97 0.57 0.84 0.94 0.81 0.45 0.38 1.25 1.02 1.02 0.62 1.06 0.95 0.96 1.26 0.79 0.73 0.93 0.57 0.84 0.58 0.35 0.77 0.71FoxA-a 1.46 1.09 0.72 1.04 1.56 0.85 0.81 0.88 1.29 1.21 0.67 1.00 1.08 1.39 1.06 1.30 1.62 1.16 1.27 1.64 1.08 0.93 1.34 1.34 0.84FoxB 0.74 0.69 1.37 0.75 0.81 0.95 1.41 1.58 0.22 5.39 0.35 0.84 1.43 0.58 0.65 1.91 1.26 0.90 1.11 0.69 0.87 0.79 1.79 1.33 0.53FoxD-a/b 1.38 1.39 0.57 0.91 1.53 1.06 1.00 1.39 1.08 1.32 9.58 1.17 0.95 1.40 1.73 1.55 1.30 0.79 1.16 0.86 1.89 1.00 1.52 1.53 1.39FoxH-b 1.74 1.25 0.86 0.85 0.68 0.97 1.13 1.12 0.74 1.21 1.07 1.26 0.86 1.16 0.92 0.96 1.09 1.13 1.26 0.93 1.13 1.24 0.72 0.99 0.93FoxP 0.90 1.13 1.09 1.04 1.09 0.90 1.13 0.65 1.09 0.83 0.97 1.02 0.71 1.10 1.34 0.91 0.93 0.93 1.07 0.74 1.21 0.93 1.16 1.28 1.10Fz4 0.95 0.85 0.52 1.25 0.75 0.76 1.18 0.56 0.38 0.90 0.55 0.79 0.96 1.37 0.72 0.57 0.57 0.63 0.89 0.66 0.81 0.97 0.75 1.01 0.81GATA-b 1.06 0.92 0.70 1.14 0.48 1.52 1.32 1.82 0.02 1.21 1.02 1.24 1.06 0.95 0.92 1.80 1.42 1.33 1.41 0.51 0.64 0.68 1.03 0.81 1.19Hedgehog1 1.45 1.27 0.53 1.31 1.21 1.13 1.51 1.35 1.73 1.53 1.20 1.19 1.64 1.16 1.25 1.32 0.63 1.01 1.42 1.28 1.41 1.31 1.02 1.68 1.64HNF4 1.14 0.88 0.68 1.02 0.97 0.95 1.11 0.97 1.13 0.85 0.95 0.90 0.97 1.14 1.03 0.99 0.93 0.97 1.01 0.95 1.18 0.98 1.06 1.08 0.78Irx-B 1.82 0.91 0.78 0.97 0.90 0.99 0.64 0.95 1.79 1.27 0.99 1.13 1.14 1.78 1.16 1.34 1.29 1.27 0.74 1.01 1.01 1.56 1.16 0.74 0.76lefty/antivin 0.95 1.10 1.14 0.75 1.18 1.13 0.93 1.09 1.06 1.09 0.95 1.13 1.09 1.39 1.04 0.64 1.39 1.37 1.02 1.09 0.84 0.80 0.69 0.50 0.59Lhx3 1.22 1.10 0.60 0.93 1.72 1.03 0.91 0.56 0.41 1.30 0.60 1.02 1.35 1.23 0.90 1.17 0.79 1.09 1.42 0.95 0.99 0.89 1.42 1.66 1.14Mnx 1.78 0.94 0.71 0.89 1.47 0.61 0.03 0.13 0.42 0.95 0.07 1.09 0.78 0.77 1.02 1.30 1.34 0.84 1.49 1.71 0.67 0.66 1.92 1.29 0.06msxb 0.88 1.29 0.82 1.27 0.89 0.85 0.06 0.04 2.04 1.18 1.20 0.89 0.56 1.14 0.97 0.01 1.67 0.65 1.38 1.77 1.16 1.13 0.60 0.69 0.50MyoD 1.57 1.09 0.65 0.97 0.51 0.85 1.05 1.41 0.94 0.70 0.85 0.84 0.89 1.91 0.93 1.15 0.99 0.66 1.01 0.64 0.99 0.59 0.76 0.72 0.26MYTF 0.56 0.52 0.55 0.65 0.73 0.81 1.95 0.66 1.18 1.01 0.20 0.97 0.79 0.97 0.18 0.66 0.61 0.55 1.40 0.73 0.90 0.75 0.54 0.62 0.72Neurogenin 0.88 0.93 1.16 0.75 0.73 0.93 1.47 0.98 0.50 1.23 0.59 1.02 1.05 1.07 1.57 0.56 0.90 0.83 0.91 1.00 0.56 0.87 0.77 0.60 0.60nodal 0.90 1.76 1.63 1.20 1.80 0.98 0.62 0.38 10.20 0.63 2.99 0.84 0.93 1.80 1.59 1.20 1.27 1.56 1.84 2.20 1.89 1.97 1.88 1.36 0.86noggin 1.16 0.95 0.52 1.42 0.95 0.79 0.65 0.47 0.64 1.09 0.96 0.84 0.76 1.14 0.85 0.95 1.53 0.75 0.98 0.69 0.59 0.83 0.74 0.51 1.01NoTrlc 1.12 1.01 0.66 0.86 1.06 1.30 1.31 0.63 0.04 0.90 0.45 1.58 1.14 1.47 0.79 0.24 1.21 0.52 1.30 0.69 1.13 1.05 0.56 0.67 1.43Orphan Fox-2 1.07 1.33 1.20 0.74 1.27 1.37 0.95 1.07 1.14 1.16 1.21 1.31 1.09 1.16 1.04 1.19 0.99 1.41 0.97 0.97 1.11 0.93 1.10 0.80 0.79Orphan Wnt e 0.91 1.18 0.70 0.93 0.76 1.13 0.80 1.85 0.72 0.92 1.03 0.97 0.85 1.27 0.98 1.01 0.70 0.63 0.89 0.98 0.61 0.74 0.63 1.05 0.90Otp 0.82 0.79 0.88 1.17 0.65 1.18 1.06 1.34 1.59 1.31 0.64 1.15 0.88 0.47 0.73 1.16 1.21 0.75 0.91 0.81 0.63 0.56 0.66 0.86 0.25Otx 1.18 0.99 0.66 0.75 1.22 0.77 0.82 0.50 0.63 0.88 1.04 0.72 1.00 1.39 0.78 0.65 1.41 0.71 1.18 0.70 1.12 0.72 0.70 0.75 0.61PPAR 1.15 0.98 1.41 1.17 1.49 1.21 1.10 0.76 1.10 1.09 0.78 0.92 1.01 0.82 1.09 1.13 1.48 1.06 1.08 0.90 0.96 1.11 1.06 1.19 0.86RAR 1.91 1.18 0.78 1.24 0.84 0.93 0.99 1.03 1.39 0.88 1.06 1.14 0.94 1.06 1.12 0.91 0.80 1.41 1.38 0.90 1.06 1.31 1.36 0.78 0.99ROR 1.28 1.18 0.90 0.81 1.09 0.96 0.81 0.91 0.78 0.85 0.79 1.11 0.79 1.12 0.95 0.99 0.99 0.90 1.06 0.69 1.15 0.95 0.80 1.02 0.85SYMD1 1.84 1.35 0.98 1.09 0.80 0.96 1.09 1.40 0.84 0.80 0.81 0.68 0.96 0.42 0.80 0.87 0.86 0.56 1.27 0.85 0.64 0.69 0.69 0.67 0.71sFRP1/5 1.85 1.36 0.95 1.09 0.91 0.88 0.99 1.01 0.50 1.07 1.18 0.74 0.85 1.21 0.99 1.13 1.17 1.20 0.82 0.53 1.14 0.81 0.60 0.87 0.83Snail 1.43 1.16 1.29 0.96 0.99 1.48 0.63 1.02 0.79 1.12 0.83 1.05 0.93 1.19 0.92 0.78 1.28 0.93 1.39 1.16 0.86 0.95 0.60 0.77 0.56SOCS1/2/3/CIS 1.80 0.77 0.50 0.78 1.00 0.87 1.12 0.94 0.69 1.36 0.53 0.91 1.17 1.23 1.14 0.95 1.53 1.09 1.01 0.80 1.33 1.09 0.67 0.60 0.67SoxB1 1.08 1.12 1.04 0.71 0.93 0.54 1.24 1.04 1.23 0.84 1.00 0.55 0.88 1.21 0.88 0.85 1.09 1.13 1.11 0.81 1.19 0.57 1.30 0.60 0.61SoxB2 1.39 0.63 0.91 0.75 0.57 0.59 0.72 1.12 1.39 0.85 0.86 1.09 0.84 1.11 0.99 1.46 0.88 1.19 1.13 0.81 0.90 0.57 0.66 0.68 0.84SoxC 1.36 0.94 0.64 1.08 1.19 0.91 0.63 0.78 0.93 1.16 1.13 1.03 0.82 1.12 1.35 1.19 0.80 0.51 1.04 0.82 1.06 0.84 0.65 1.39 0.86Tbx2/3 0.51 1.24 1.15 0.61 0.85 1.41 1.18 0.62 1.06 1.31 1.21 1.01 0.72 1.45 0.94 0.70 1.91 0.69 1.68 0.67 0.92 0.72 0.69 0.62 1.59Tbx6a 1.29 1.20 0.63 0.95 1.05 1.13 0.73 0.90 1.38 0.95 1.67 1.08 0.90 1.11 0.93 1.40 1.58 0.90 1.22 0.87 0.82 0.78 0.65 0.74 1.08Tbx6b/c/d 1.43 1.13 0.85 0.72 0.84 0.56 1.37 1.27 0.77 1.36 0.75 0.75 1.04 0.91 0.84 1.12 1.24 0.62 1.21 0.95 1.09 0.60 0.77 0.92 0.53TGFβ not assigned 1 1.68 1.29 0.90 1.01 0.97 1.00 1.00 1.09 0.76 1.23 1.12 0.68 1.16 1.26 0.86 1.10 1.21 0.99 0.85 0.93 1.07 0.88 0.99 0.84 0.72Tolloid 1.12 1.16 0.72 1.05 1.20 0.90 0.59 0.63 0.90 1.11 0.99 1.23 0.91 1.09 0.81 0.92 1.29 0.87 1.21 0.75 1.00 1.06 0.76 1.07 0.92TTF1 1.21 1.16 0.67 1.21 1.45 0.95 0.52 0.32 0.47 0.67 0.55 0.85 1.20 1.41 0.84 0.91 1.03 1.14 1.03 0.94 1.19 0.84 1.27 0.91 0.71TWIST-like-1a/b 1.46 0.97 0.50 1.01 0.79 0.58 0.03 0.07 0.67 0.88 1.35 0.55 0.95 1.06 0.99 0.71 1.40 0.31 0.97 0.52 1.18 0.76 0.70 0.62 0.54Wnt5 1.44 1.07 1.82 0.95 0.82 1.23 1.30 1.51 1.32 1.08 1.04 0.99 1.06 1.21 0.98 1.57 1.16 1.01 1.05 1.07 0.85 0.98 0.93 1.53 0.98ZF (C2H2)-2 1.32 1.16 1.13 0.72 1.09 0.86 1.27 1.14 1.16 0.88 1.09 0.73 1.39 1.06 0.97 1.10 0.95 0.97 1.01 0.89 1.18 0.76 1.88 1.13 0.83ZF (C2H2)-25 1.09 1.31 0.67 0.97 1.09 0.70 0.96 0.91 1.02 0.88 0.90 0.74 0.97 1.01 0.78 1.06 1.18 1.03 0.87 0.70 0.99 0.84 1.08 0.85 0.55ZF (C2H2)-34 0.75 1.81 1.13 0.84 1.37 0.85 1.13 1.04 0.90 0.91 1.31 1.21 1.08 0.88 1.23 0.95 0.95 1.06 1.04 0.84 1.57 0.91 1.14 1.22 1.06ZF (C3H) 1.51 0.85 1.09 1.17 1.13 0.60 0.40 0.20 0.73 1.78 1.16 0.73 0.75 1.02 1.01 1.14 1.35 1.04 1.49 0.58 1.25 0.99 1.22 0.58 0.67ZicL 1.21 1.21 0.91 0.89 0.83 1.04 1.06 1.06 0.39 0.93 0.30 1.07 1.04 1.15 0.89 0.91 1.42 0.87 1.21 0.90 0.89 0.74 1.11 0.96 1.56
31
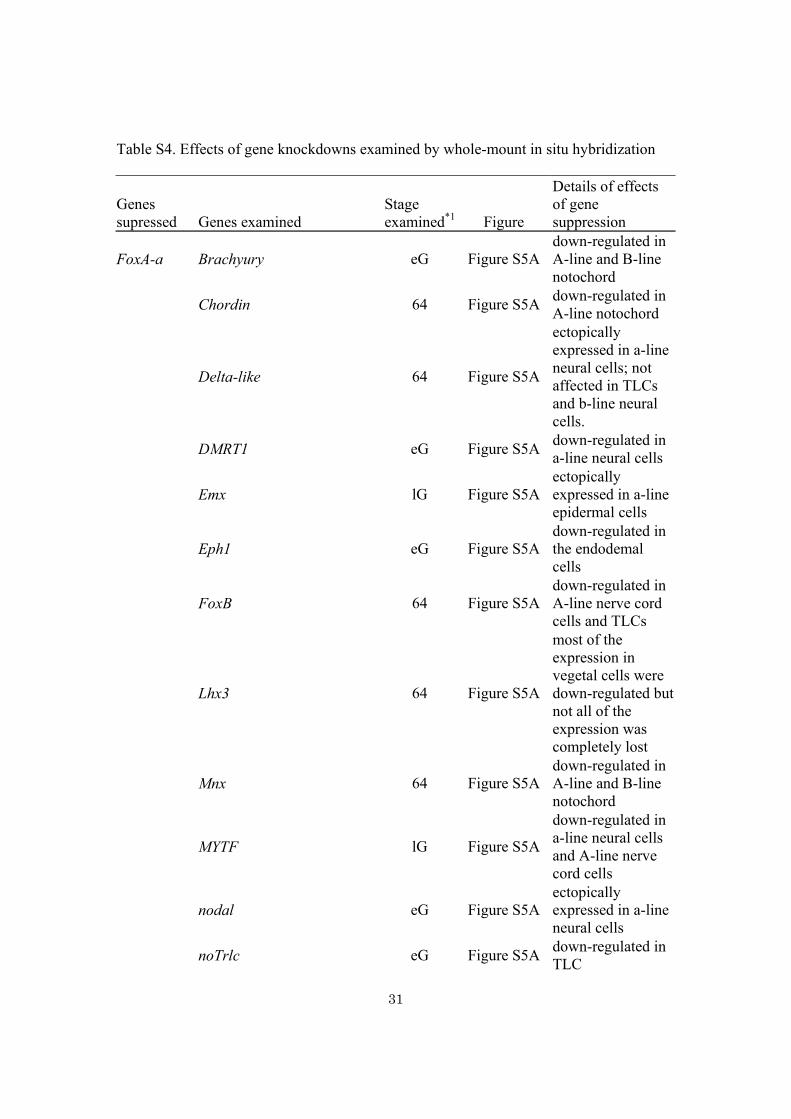
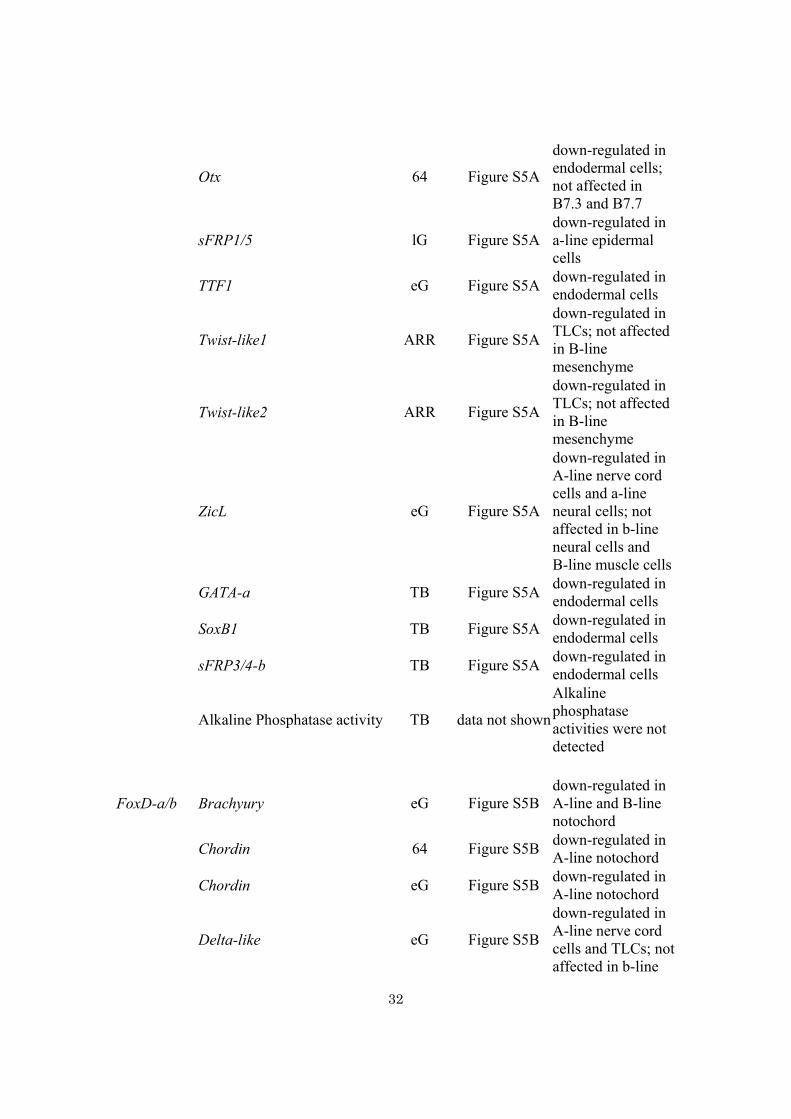
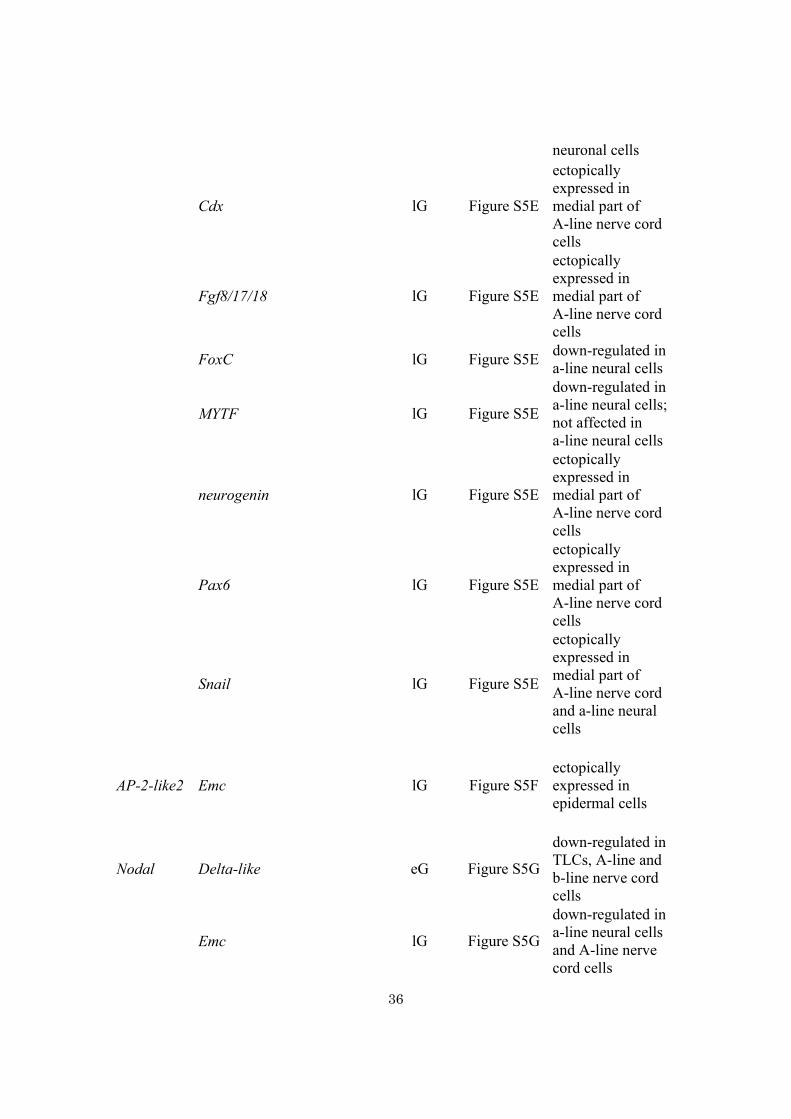
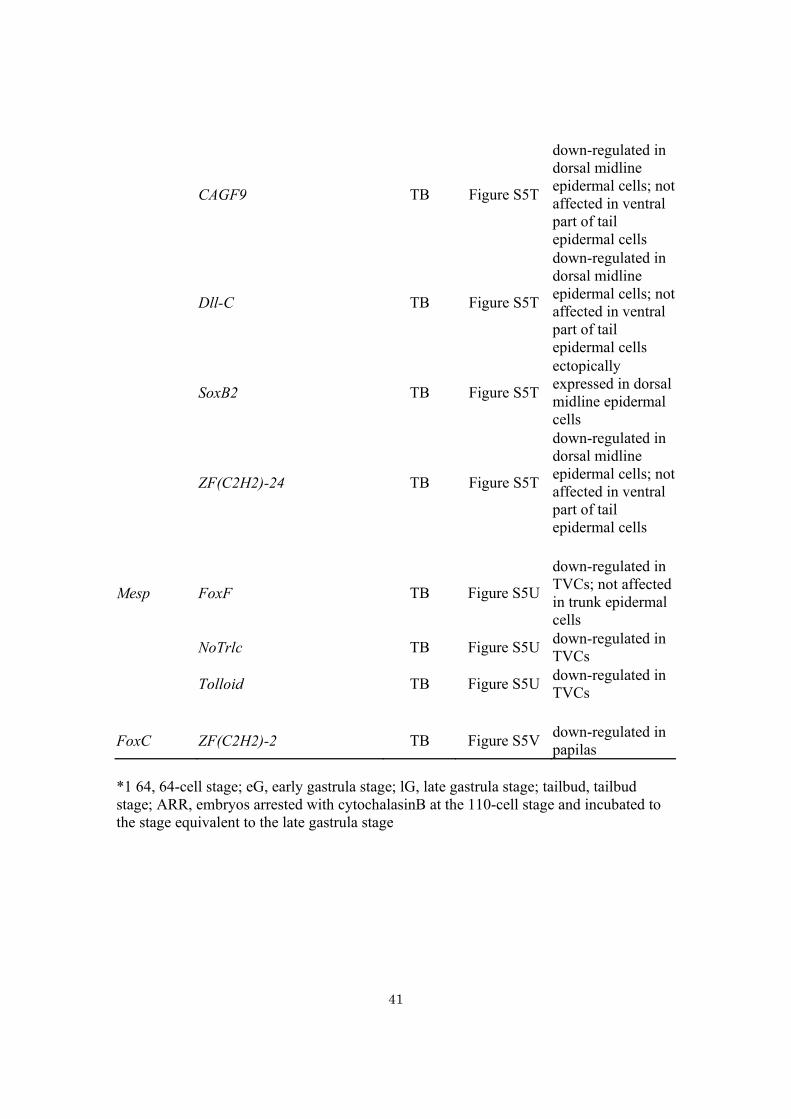
Table S4. Effects of gene knockdowns examined by whole-mount in situ hybridization
Genes supressed Genes examined
Stage examined*1 Figure
Details of effects of gene suppression
FoxA-a Brachyury eG Figure S5A down-regulated in A-line and B-line notochord
Chordin 64 Figure S5A down-regulated in A-line notochord
Delta-like 64 Figure S5A
ectopically expressed in a-line neural cells; not affected in TLCs and b-line neural cells.
DMRT1 eG Figure S5A down-regulated in a-line neural cells
Emx lG Figure S5A ectopically expressed in a-line epidermal cells
Eph1 eG Figure S5A down-regulated in the endodemal cells
FoxB 64 Figure S5A down-regulated in A-line nerve cord cells and TLCs
Lhx3 64 Figure S5A
most of the expression in vegetal cells were down-regulated but not all of the expression was completely lost
Mnx 64 Figure S5A down-regulated in A-line and B-line notochord
MYTF lG Figure S5A
down-regulated in a-line neural cells and A-line nerve cord cells
nodal eG Figure S5A ectopically expressed in a-line neural cells
noTrlc eG Figure S5A down-regulated in TLC
32
Otx 64 Figure S5A
down-regulated in endodermal cells; not affected in B7.3 and B7.7
sFRP1/5 lG Figure S5A down-regulated in a-line epidermal cells
TTF1 eG Figure S5A down-regulated in endodermal cells
Twist-like1 ARR Figure S5A
down-regulated in TLCs; not affected in B-line mesenchyme
Twist-like2 ARR Figure S5A
down-regulated in TLCs; not affected in B-line mesenchyme
ZicL eG Figure S5A
down-regulated in A-line nerve cord cells and a-line neural cells; not affected in b-line neural cells and B-line muscle cells
GATA-a TB Figure S5A down-regulated in endodermal cells
SoxB1 TB Figure S5A down-regulated in endodermal cells
sFRP3/4-b TB Figure S5A down-regulated in endodermal cells
Alkaline Phosphatase activity TB data not shown
Alkaline phosphatase activities were not detected
FoxD-a/b Brachyury eG Figure S5B down-regulated in A-line and B-line notochord
Chordin 64 Figure S5B down-regulated in A-line notochord
Chordin eG Figure S5B down-regulated in A-line notochord
Delta-like eG Figure S5B
down-regulated in A-line nerve cord cells and TLCs; not affected in b-line
33
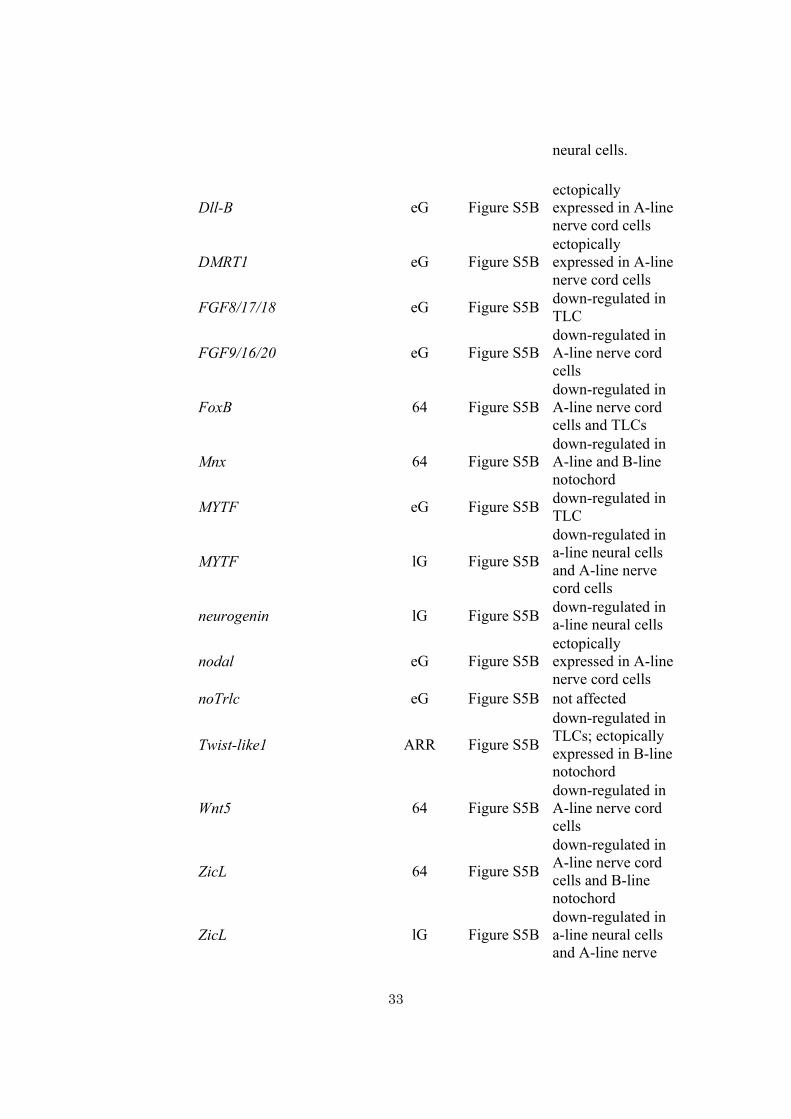
neural cells.
Dll-B eG Figure S5B ectopically expressed in A-line nerve cord cells
DMRT1 eG Figure S5B ectopically expressed in A-line nerve cord cells
FGF8/17/18 eG Figure S5B down-regulated in TLC
FGF9/16/20 eG Figure S5B down-regulated in A-line nerve cord cells
FoxB 64 Figure S5B down-regulated in A-line nerve cord cells and TLCs
Mnx 64 Figure S5B down-regulated in A-line and B-line notochord
MYTF eG Figure S5B down-regulated in TLC
MYTF lG Figure S5B
down-regulated in a-line neural cells and A-line nerve cord cells
neurogenin lG Figure S5B down-regulated in a-line neural cells
nodal eG Figure S5B ectopically expressed in A-line nerve cord cells
noTrlc eG Figure S5B not affected
Twist-like1 ARR Figure S5B
down-regulated in TLCs; ectopically expressed in B-line notochord
Wnt5 64 Figure S5B down-regulated in A-line nerve cord cells
ZicL 64 Figure S5B
down-regulated in A-line nerve cord cells and B-line notochord
ZicL lG Figure S5B down-regulated in a-line neural cells and A-line nerve
34
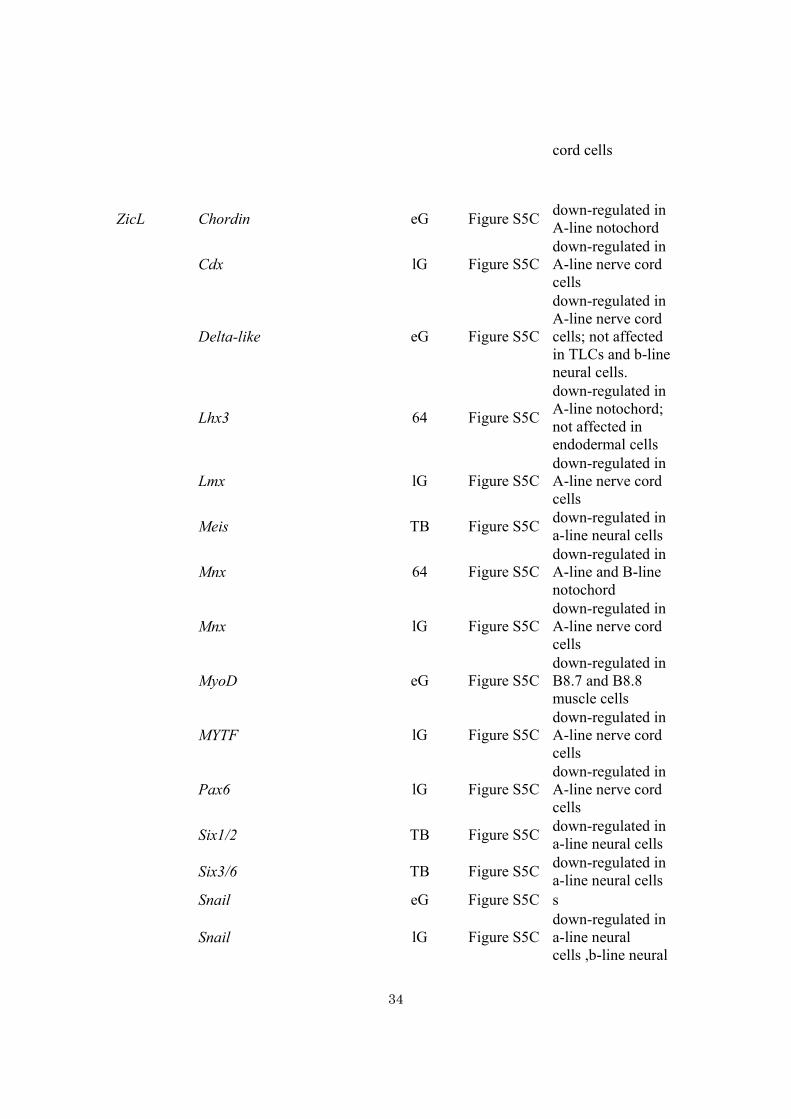
cord cells
ZicL Chordin eG Figure S5C down-regulated in A-line notochord
Cdx lG Figure S5C down-regulated in A-line nerve cord cells
Delta-like eG Figure S5C
down-regulated in A-line nerve cord cells; not affected in TLCs and b-line neural cells.
Lhx3 64 Figure S5C
down-regulated in A-line notochord; not affected in endodermal cells
Lmx lG Figure S5C down-regulated in A-line nerve cord cells
Meis TB Figure S5C down-regulated in a-line neural cells
Mnx 64 Figure S5C down-regulated in A-line and B-line notochord
Mnx lG Figure S5C down-regulated in A-line nerve cord cells
MyoD eG Figure S5C down-regulated in B8.7 and B8.8 muscle cells
MYTF lG Figure S5C down-regulated in A-line nerve cord cells
Pax6 lG Figure S5C down-regulated in A-line nerve cord cells
Six1/2 TB Figure S5C down-regulated in a-line neural cells
Six3/6 TB Figure S5C down-regulated in a-line neural cells
Snail eG Figure S5C s
Snail lG Figure S5C down-regulated in a-line neural cells ,b-line neural
35
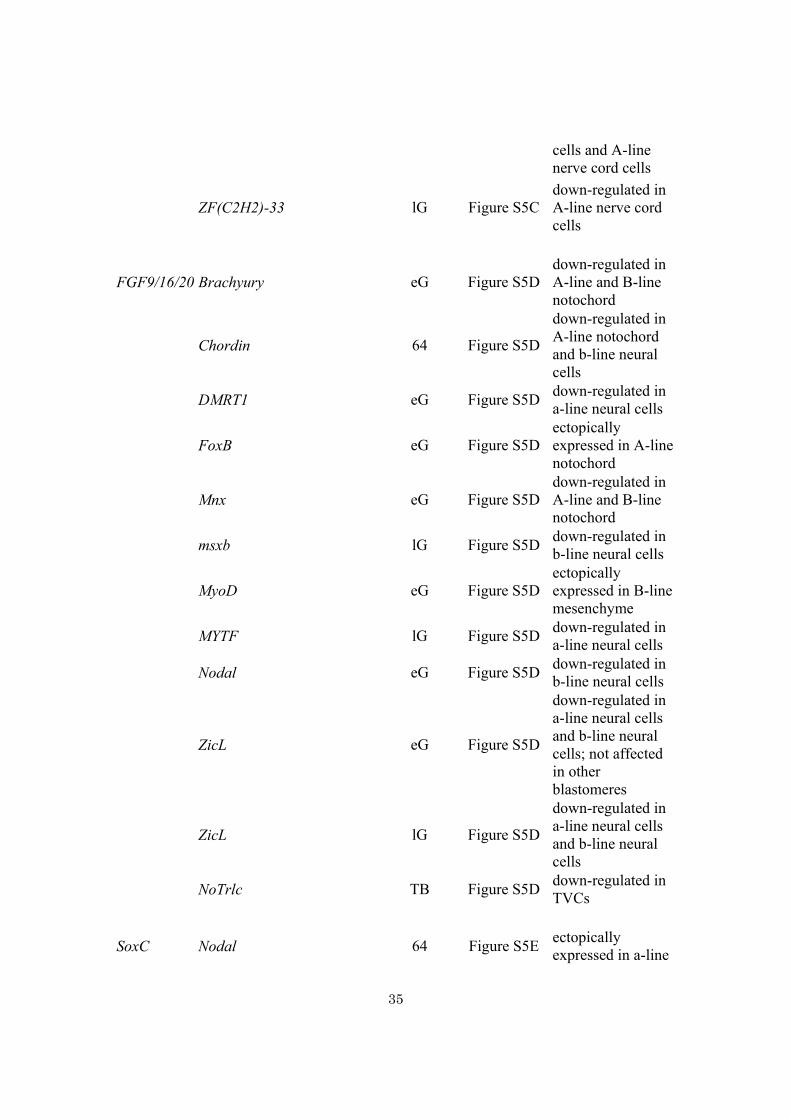
cells and A-line nerve cord cells
ZF(C2H2)-33 lG Figure S5C down-regulated in A-line nerve cord cells
FGF9/16/20 Brachyury eG Figure S5D down-regulated in A-line and B-line notochord
Chordin 64 Figure S5D
down-regulated in A-line notochord and b-line neural cells
DMRT1 eG Figure S5D down-regulated in a-line neural cells
FoxB eG Figure S5D ectopically expressed in A-line notochord
Mnx eG Figure S5D down-regulated in A-line and B-line notochord
msxb lG Figure S5D down-regulated in b-line neural cells
MyoD eG Figure S5D ectopically expressed in B-line mesenchyme
MYTF lG Figure S5D down-regulated in a-line neural cells
Nodal eG Figure S5D down-regulated in b-line neural cells
ZicL eG Figure S5D
down-regulated in a-line neural cells and b-line neural cells; not affected in other blastomeres
ZicL lG Figure S5D
down-regulated in a-line neural cells and b-line neural cells
NoTrlc TB Figure S5D down-regulated in TVCs
SoxC Nodal 64 Figure S5E ectopically expressed in a-line
36
neuronal cells
Cdx lG Figure S5E
ectopically expressed in medial part of A-line nerve cord cells
Fgf8/17/18 lG Figure S5E
ectopically expressed in medial part of A-line nerve cord cells
FoxC lG Figure S5E down-regulated in a-line neural cells
MYTF lG Figure S5E
down-regulated in a-line neural cells; not affected in a-line neural cells
neurogenin lG Figure S5E
ectopically expressed in medial part of A-line nerve cord cells
Pax6 lG Figure S5E
ectopically expressed in medial part of A-line nerve cord cells
Snail lG Figure S5E
ectopically expressed in medial part of A-line nerve cord and a-line neural cells
AP-2-like2 Emc lG Figure S5F ectopically expressed in epidermal cells
Nodal Delta-like eG Figure S5G
down-regulated in TLCs, A-line and b-line nerve cord cells
Emc lG Figure S5G
down-regulated in a-line neural cells and A-line nerve cord cells
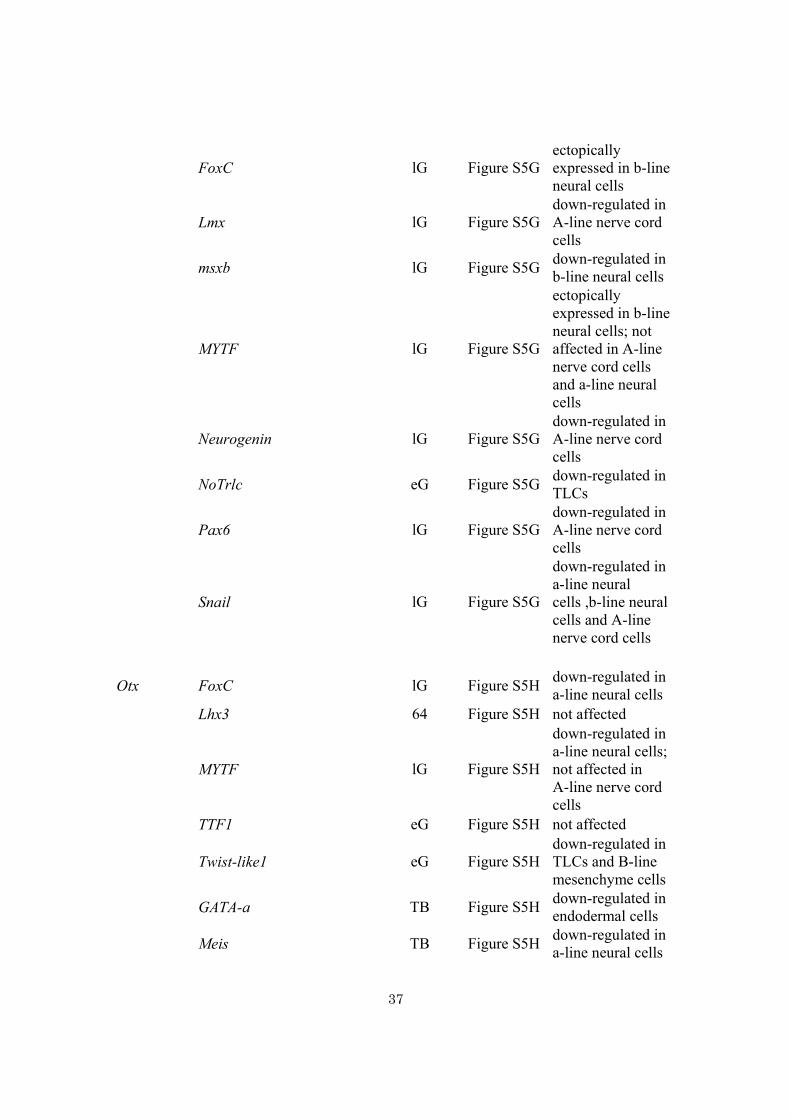
37
FoxC lG Figure S5G ectopically expressed in b-line neural cells
Lmx lG Figure S5G down-regulated in A-line nerve cord cells
msxb lG Figure S5G down-regulated in b-line neural cells
MYTF lG Figure S5G
ectopically expressed in b-line neural cells; not affected in A-line nerve cord cells and a-line neural cells
Neurogenin lG Figure S5G down-regulated in A-line nerve cord cells
NoTrlc eG Figure S5G down-regulated in TLCs
Pax6 lG Figure S5G down-regulated in A-line nerve cord cells
Snail lG Figure S5G
down-regulated in a-line neural cells ,b-line neural cells and A-line nerve cord cells
Otx FoxC lG Figure S5H down-regulated in a-line neural cells
Lhx3 64 Figure S5H not affected
MYTF lG Figure S5H
down-regulated in a-line neural cells; not affected in A-line nerve cord cells
TTF1 eG Figure S5H not affected
Twist-like1 eG Figure S5H down-regulated in TLCs and B-line mesenchyme cells
GATA-a TB Figure S5H down-regulated in endodermal cells
Meis TB Figure S5H down-regulated in a-line neural cells
38
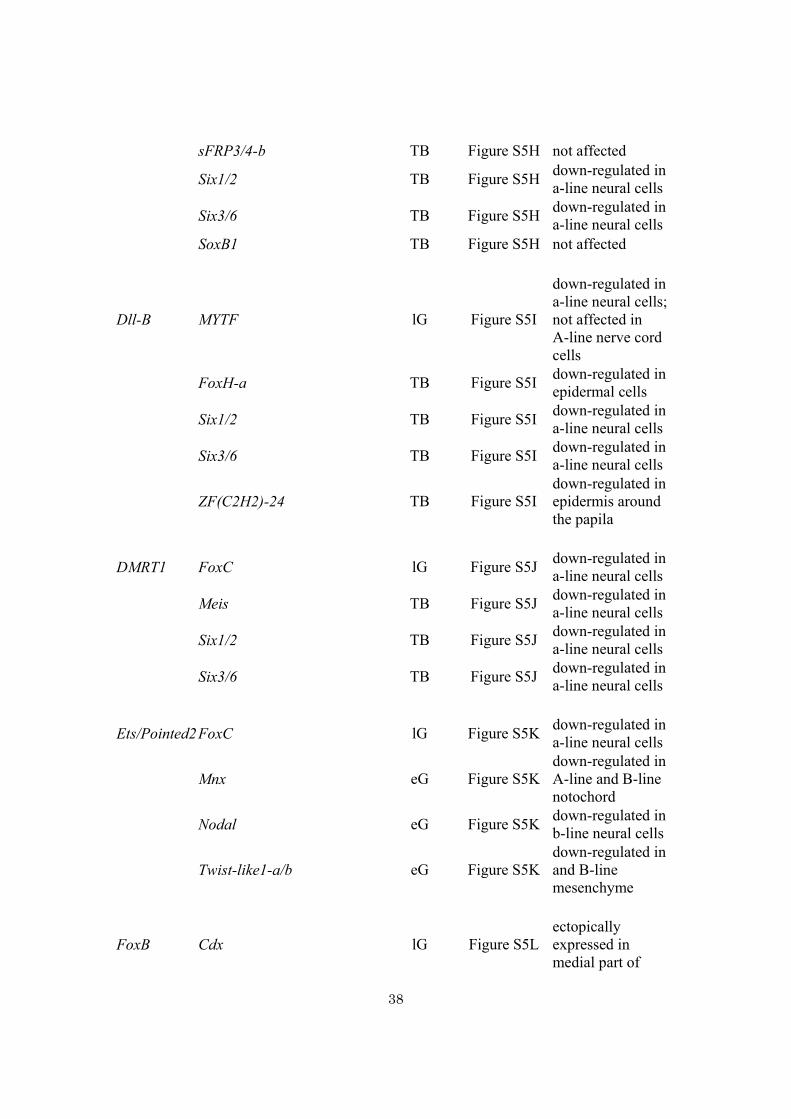
sFRP3/4-b TB Figure S5H not affected
Six1/2 TB Figure S5H down-regulated in a-line neural cells
Six3/6 TB Figure S5H down-regulated in a-line neural cells
SoxB1 TB Figure S5H not affected
Dll-B MYTF lG Figure S5I
down-regulated in a-line neural cells; not affected in A-line nerve cord cells
FoxH-a TB Figure S5I down-regulated in epidermal cells
Six1/2 TB Figure S5I down-regulated in a-line neural cells
Six3/6 TB Figure S5I down-regulated in a-line neural cells
ZF(C2H2)-24 TB Figure S5I down-regulated in epidermis around the papila
DMRT1 FoxC lG Figure S5J down-regulated in a-line neural cells
Meis TB Figure S5J down-regulated in a-line neural cells
Six1/2 TB Figure S5J down-regulated in a-line neural cells
Six3/6 TB Figure S5J down-regulated in a-line neural cells
Ets/Pointed2 FoxC lG Figure S5K down-regulated in a-line neural cells
Mnx eG Figure S5K down-regulated in A-line and B-line notochord
Nodal eG Figure S5K down-regulated in b-line neural cells
Twist-like1-a/b eG Figure S5K down-regulated in and B-line mesenchyme
FoxB Cdx lG Figure S5L ectopically expressed in medial part of
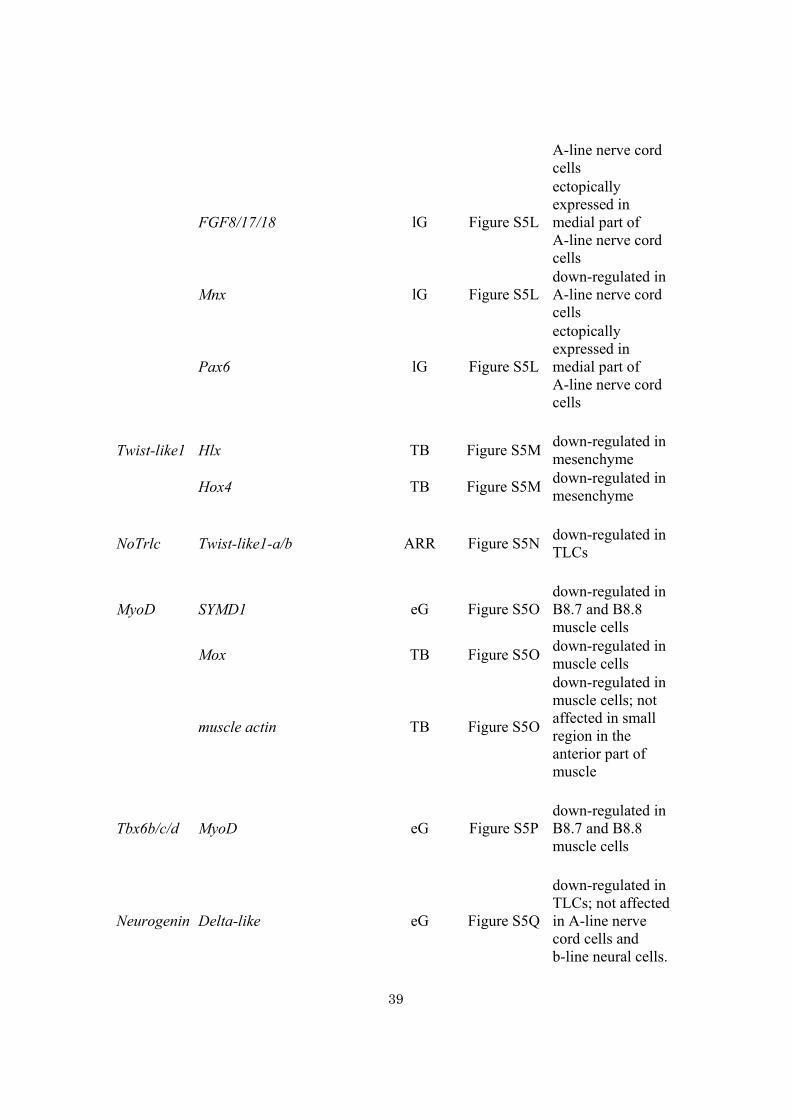
39
A-line nerve cord cells
FGF8/17/18 lG Figure S5L
ectopically expressed in medial part of A-line nerve cord cells
Mnx lG Figure S5L down-regulated in A-line nerve cord cells
Pax6 lG Figure S5L
ectopically expressed in medial part of A-line nerve cord cells
Twist-like1 Hlx TB Figure S5M down-regulated in mesenchyme
Hox4 TB Figure S5M down-regulated in mesenchyme
NoTrlc Twist-like1-a/b ARR Figure S5N down-regulated in TLCs
MyoD SYMD1 eG Figure S5O down-regulated in B8.7 and B8.8 muscle cells
Mox TB Figure S5O down-regulated in muscle cells
muscle actin TB Figure S5O
down-regulated in muscle cells; not affected in small region in the anterior part of muscle
Tbx6b/c/d MyoD eG Figure S5P down-regulated in B8.7 and B8.8 muscle cells
Neurogenin Delta-like eG Figure S5Q
down-regulated in TLCs; not affected in A-line nerve cord cells and b-line neural cells.
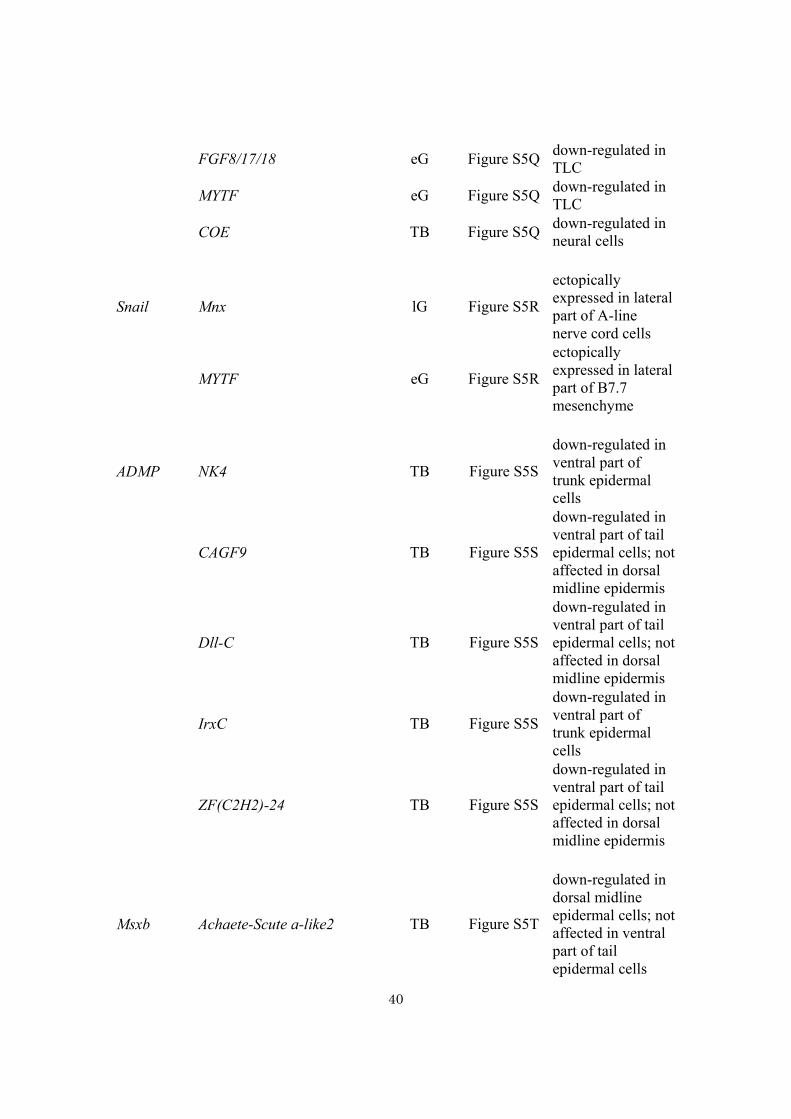
40
FGF8/17/18 eG Figure S5Q down-regulated in TLC
MYTF eG Figure S5Q down-regulated in TLC
COE TB Figure S5Q down-regulated in neural cells
Snail Mnx lG Figure S5R
ectopically expressed in lateral part of A-line nerve cord cells
MYTF eG Figure S5R
ectopically expressed in lateral part of B7.7 mesenchyme
ADMP NK4 TB Figure S5S
down-regulated in ventral part of trunk epidermal cells
CAGF9 TB Figure S5S
down-regulated in ventral part of tail epidermal cells; not affected in dorsal midline epidermis
Dll-C TB Figure S5S
down-regulated in ventral part of tail epidermal cells; not affected in dorsal midline epidermis
IrxC TB Figure S5S
down-regulated in ventral part of trunk epidermal cells
ZF(C2H2)-24 TB Figure S5S
down-regulated in ventral part of tail epidermal cells; not affected in dorsal midline epidermis
Msxb Achaete-Scute a-like2 TB Figure S5T
down-regulated in dorsal midline epidermal cells; not affected in ventral part of tail epidermal cells
41
CAGF9 TB Figure S5T
down-regulated in dorsal midline epidermal cells; not affected in ventral part of tail epidermal cells
Dll-C TB Figure S5T
down-regulated in dorsal midline epidermal cells; not affected in ventral part of tail epidermal cells
SoxB2 TB Figure S5T
ectopically expressed in dorsal midline epidermal cells
ZF(C2H2)-24 TB Figure S5T
down-regulated in dorsal midline epidermal cells; not affected in ventral part of tail epidermal cells
Mesp FoxF TB Figure S5U
down-regulated in TVCs; not affected in trunk epidermal cells
NoTrlc TB Figure S5U down-regulated in TVCs
Tolloid TB Figure S5U down-regulated in TVCs
FoxC ZF(C2H2)-2 TB Figure S5V down-regulated in papilas
*1 64, 64-cell stage; eG, early gastrula stage; lG, late gastrula stage; tailbud, tailbud stage; ARR, embryos arrested with cytochalasinB at the 110-cell stage and incubated to the stage equivalent to the late gastrula stage
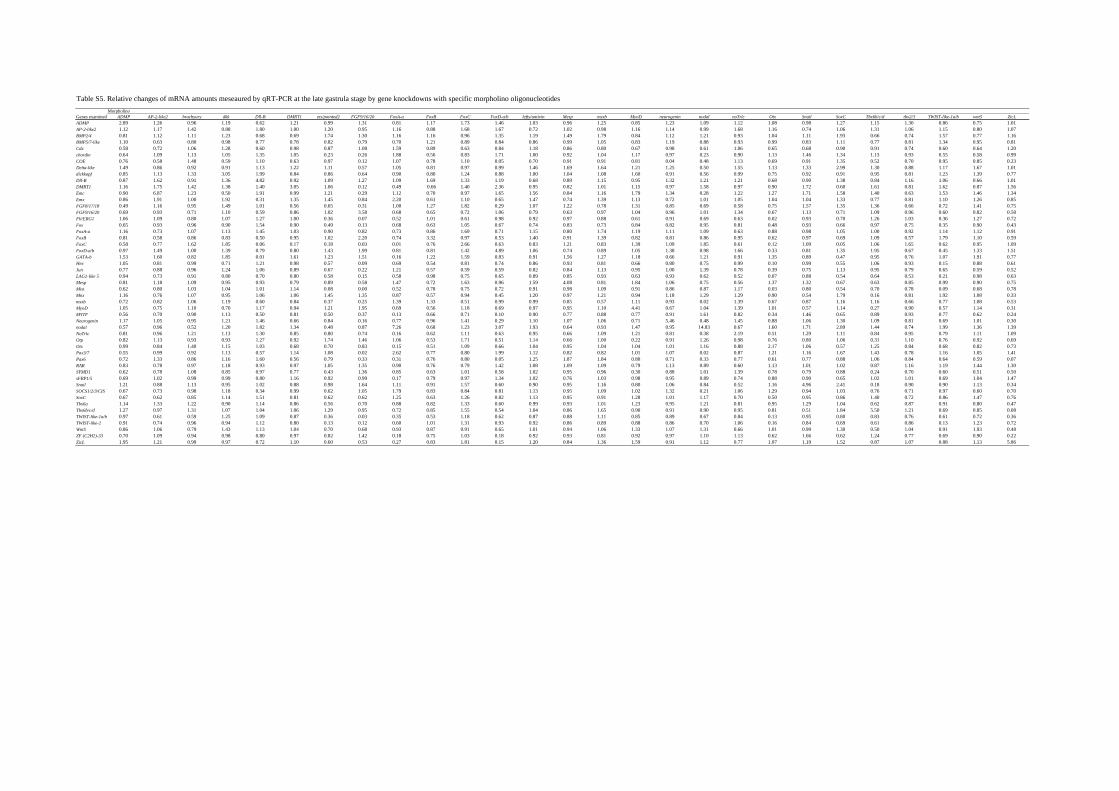
Table S5. Relative changes of mRNA amounts meseaured by qRT-PCR at the late gastrula stage by gene knockdowns with specific morpholino oligonucleotidesMorpholino
Genes examined ADMP AP-2-like2 brachyury dkk Dll-B DMRT1 ets/pointed2 FGF9/16/20 FoxA-a FoxB FoxC FoxD-a/b lefty/antivin Mesp msxb MyoD neurogenin nodal noTrlc Otx Snail SoxC Tbx6b/c/d tbx2/3 TWIST-like-1a/b wnt5 ZicLADMP 2.89 1.26 0.96 1.19 0.62 1.21 0.99 1.31 0.81 1.17 1.73 1.46 1.03 0.96 1.25 0.85 1.23 1.09 1.12 1.08 0.98 1.27 1.15 1.30 0.86 0.75 1.01AP-2-like2 1.12 1.17 1.42 0.88 1.80 1.00 1.20 0.95 1.16 0.88 1.68 1.67 0.72 1.02 0.98 1.16 1.14 0.99 1.68 1.16 0.74 1.06 1.31 1.06 1.15 0.80 1.07BMP2/4 0.81 1.12 1.11 1.23 0.68 0.69 1.74 1.30 1.16 1.16 0.96 1.35 1.19 1.49 1.79 0.84 1.12 1.21 0.93 1.04 1.11 1.93 0.66 0.74 1.57 0.77 1.16BMP5/7-like 1.10 0.63 0.80 0.98 0.77 0.78 0.82 0.79 0.70 1.21 0.89 0.84 0.86 0.99 1.05 0.83 1.19 0.88 0.93 0.99 0.83 1.11 0.77 0.81 1.34 0.95 0.81Cdx 0.58 0.72 1.06 1.28 0.60 0.98 0.87 1.08 1.59 0.89 0.63 0.84 1.18 0.86 0.80 0.67 0.98 0.61 1.06 0.65 0.68 0.90 0.91 0.74 0.60 0.64 1.20chordin 0.64 1.09 1.13 1.05 1.35 1.05 0.23 0.26 1.88 0.56 0.83 1.71 1.00 0.92 1.04 1.17 0.97 0.23 0.90 1.13 1.46 1.34 1.13 0.93 0.55 0.58 0.99COE 0.76 0.58 1.48 0.59 1.10 0.63 0.97 0.12 1.07 0.78 1.10 0.05 0.70 0.91 0.91 0.81 0.04 0.48 1.13 0.69 0.91 1.35 0.52 0.70 0.95 0.85 0.23Delta-like 1.49 0.86 0.92 0.91 1.13 1.22 1.11 0.57 1.05 0.81 0.97 0.99 1.46 1.69 1.64 1.21 1.25 0.50 1.55 1.13 1.33 2.99 1.30 0.88 1.17 1.67 1.01dickkopf 0.85 1.13 1.33 3.05 1.99 0.84 0.86 0.64 0.90 0.80 1.24 0.88 1.00 1.04 1.08 1.60 0.91 0.56 0.99 0.75 0.92 0.91 0.95 0.81 1.23 1.39 0.77Dll-B 0.87 1.62 0.91 1.36 4.82 0.92 1.09 1.27 1.09 1.69 1.33 1.19 0.68 0.89 1.15 0.95 1.32 1.21 1.21 0.68 0.90 1.38 0.84 1.16 1.06 0.66 1.01DMRT1 1.16 1.75 1.42 1.38 1.40 3.05 1.06 0.12 0.49 0.66 1.40 2.36 0.95 0.82 1.01 1.15 0.97 1.58 0.97 0.90 1.72 0.60 1.61 0.81 1.62 0.87 1.56Emc 0.90 6.87 1.23 0.50 1.91 0.99 1.21 0.29 1.12 0.70 0.97 1.65 1.56 0.84 1.16 1.79 1.34 0.28 1.22 1.27 1.71 1.58 1.40 0.63 1.53 1.46 1.34Emx 0.86 1.91 1.00 1.92 0.31 1.35 1.45 0.84 2.20 0.61 1.10 0.65 1.47 0.74 1.39 1.13 0.72 1.01 1.05 1.04 1.04 1.33 0.77 0.81 1.10 1.26 0.85FGF8/17/18 0.49 1.16 0.95 1.49 1.01 0.56 0.65 0.31 1.00 1.27 1.82 0.29 1.07 1.22 0.78 1.31 0.85 0.69 0.58 0.75 1.57 1.35 1.36 0.66 0.72 1.41 0.75FGF9/16/20 0.69 0.93 0.71 1.10 0.59 0.86 1.02 3.58 0.68 0.65 0.72 1.06 0.79 0.63 0.97 1.04 0.96 1.01 1.34 0.67 1.13 0.71 1.09 0.96 0.60 0.82 0.58Fli/ERG1 1.06 1.09 0.80 1.07 1.27 1.00 0.36 0.07 0.52 1.01 0.61 0.98 0.92 0.97 0.88 0.61 0.91 0.69 0.63 0.02 0.93 0.70 1.26 1.03 0.36 1.27 0.72Fos 0.65 0.93 0.96 0.90 1.54 0.90 0.49 0.13 0.68 0.63 1.05 0.67 0.74 0.83 0.73 0.84 0.82 0.95 0.81 0.48 0.93 0.66 0.97 0.75 0.35 0.90 0.43FoxA-a 1.16 0.73 1.07 1.13 1.45 1.03 0.90 0.82 0.73 0.86 1.69 0.71 1.15 0.80 1.74 1.19 1.11 1.09 0.63 0.88 0.98 1.05 1.00 0.92 1.14 1.12 0.91FoxB 0.81 0.58 0.86 0.83 0.50 0.95 1.02 2.20 0.74 3.32 0.97 0.53 1.40 0.91 1.39 0.82 0.81 0.86 0.95 0.62 0.97 0.69 1.09 0.57 1.79 1.10 0.59FoxC 0.58 0.77 1.62 1.85 0.06 0.17 0.18 0.03 0.01 0.76 2.66 0.63 0.83 1.21 0.83 1.39 1.09 1.85 0.61 0.12 1.09 0.05 1.06 1.65 0.62 0.95 1.09FoxD-a/b 0.97 1.49 1.00 1.39 0.79 0.80 1.43 1.99 0.81 0.81 1.42 4.89 1.06 0.74 0.89 1.05 1.38 0.98 1.66 0.33 0.81 1.35 1.95 0.67 0.45 1.33 1.51GATA-b 1.53 1.60 0.82 1.85 0.01 1.61 1.23 1.51 0.16 1.22 1.59 0.83 0.91 1.56 1.27 1.18 0.66 1.21 0.91 1.35 0.89 0.47 0.95 0.76 1.07 1.91 0.77Hex 1.05 0.81 0.99 0.71 1.21 0.98 0.57 0.09 0.69 0.54 0.81 0.74 0.86 0.93 0.81 0.66 0.80 0.75 0.99 0.10 0.99 0.55 1.06 0.93 0.15 0.88 0.61Jun 0.77 0.88 0.96 1.24 1.06 0.89 0.67 0.22 1.21 0.57 0.59 0.59 0.82 0.84 1.13 0.95 1.00 1.39 0.78 0.39 0.75 1.13 0.95 0.79 0.65 0.59 0.52LAG1-like 5 0.94 0.73 0.91 0.80 0.70 0.80 0.58 0.15 0.58 0.98 0.75 0.65 0.89 0.85 0.93 0.63 0.93 0.62 0.52 0.07 0.88 0.54 0.64 0.53 0.21 0.98 0.63Mesp 0.81 1.18 1.09 0.95 0.93 0.79 0.89 0.58 1.47 0.72 1.63 0.96 1.59 4.08 0.81 1.84 1.06 0.75 0.56 1.37 1.32 0.67 0.63 0.85 0.99 0.90 0.75Mist 0.62 0.80 1.03 1.04 1.01 1.14 0.08 0.00 0.52 0.78 0.75 0.72 0.91 0.98 1.09 0.91 0.86 0.87 1.17 0.03 0.80 0.54 0.70 0.78 0.09 0.68 0.78Mnx 1.16 0.76 1.07 0.95 1.06 1.06 1.45 1.35 0.87 0.57 0.94 0.45 1.20 0.97 1.21 0.94 1.18 1.29 1.29 0.90 0.54 1.79 0.16 0.81 1.92 1.08 0.33msxb 0.72 0.82 1.06 1.19 0.60 0.84 0.37 0.25 1.39 1.33 0.51 0.99 0.99 0.85 0.57 1.11 0.93 0.02 1.39 0.67 0.87 1.16 1.16 0.66 0.77 1.08 0.53MyoD 1.05 0.75 1.10 0.70 1.17 0.94 1.21 1.95 0.69 0.56 1.18 0.69 0.97 0.95 1.10 4.41 0.67 1.04 1.39 1.01 0.57 1.14 0.27 0.90 0.57 1.14 0.31MYTF 0.56 0.70 0.90 1.13 0.50 0.81 0.50 0.37 0.13 0.66 0.71 0.10 0.90 0.77 0.88 0.77 0.91 1.61 0.82 0.34 1.46 0.65 0.89 0.93 0.77 0.62 0.24Neurogenin 1.17 1.05 0.95 1.21 1.46 0.66 0.84 0.16 0.77 0.96 1.41 0.29 1.10 1.07 1.06 0.71 5.46 0.48 1.45 0.88 1.06 1.30 1.09 0.81 0.69 1.01 0.30nodal 0.57 0.96 0.52 1.20 1.82 1.34 0.48 0.87 7.26 0.68 1.23 3.07 1.93 0.64 0.93 1.47 0.95 14.83 0.67 1.60 1.71 2.89 1.44 0.74 1.99 1.36 1.39NoTrlc 0.81 0.96 1.21 1.13 1.30 0.85 0.80 0.74 0.16 0.62 1.11 0.63 0.95 0.66 1.09 1.21 0.81 0.38 2.19 0.51 1.29 1.11 0.84 0.95 0.79 1.11 1.09Otp 0.82 1.13 0.93 0.93 1.27 0.92 1.74 1.46 1.06 0.53 1.71 0.51 1.14 0.66 1.00 0.22 0.91 1.26 0.98 0.76 0.80 1.06 0.31 1.10 0.76 0.92 0.69Otx 0.99 0.84 1.40 1.15 1.03 0.68 0.70 0.83 0.15 0.51 1.09 0.66 1.04 0.95 1.04 1.04 1.01 1.16 0.88 2.17 1.06 0.57 1.25 0.84 0.68 0.82 0.73Pax3/7 0.55 0.99 0.92 1.13 0.57 1.14 1.08 0.02 2.62 0.77 0.80 1.99 1.12 0.82 0.82 1.01 1.07 0.02 0.87 1.21 1.16 1.67 1.43 0.78 1.16 1.05 1.41Pax6 0.72 1.33 0.86 1.16 1.60 0.56 0.79 0.33 0.31 0.76 0.80 0.05 1.25 1.87 1.84 0.80 0.71 0.33 0.77 0.61 0.77 0.88 1.06 0.84 0.64 0.59 0.07RAR 0.83 0.78 0.97 1.18 0.93 0.97 1.05 1.35 0.90 0.76 0.79 1.42 1.08 1.09 1.09 0.79 1.13 0.89 0.60 1.13 1.01 1.02 0.87 1.16 1.19 1.44 1.30SYMD1 0.62 0.78 1.08 0.85 0.97 0.77 0.43 1.36 0.85 0.63 1.01 0.58 1.02 0.95 0.96 0.30 0.88 1.01 1.39 0.78 0.79 0.88 0.24 0.70 0.60 0.51 0.50sFRP1/5 0.69 1.02 0.99 0.99 0.80 1.16 0.92 0.99 0.17 0.79 0.97 1.34 1.02 0.76 1.03 0.98 0.95 0.89 0.74 0.88 0.90 0.65 1.02 1.01 0.69 1.04 1.47Snail 1.21 0.88 1.13 0.95 1.02 0.88 0.98 1.64 1.11 0.91 1.57 0.60 0.90 0.95 1.16 0.80 1.06 0.84 0.52 1.16 4.96 2.41 0.18 0.90 0.90 1.13 0.34SOCS1/2/3/CIS 0.67 0.73 0.98 1.18 0.34 0.99 0.62 1.05 1.79 0.83 0.84 0.81 1.13 0.95 1.09 1.02 1.32 0.21 1.06 1.29 0.94 1.03 0.76 0.71 0.97 0.60 0.70SoxC 0.67 0.62 0.85 1.14 1.51 0.81 0.62 0.62 1.25 0.63 1.26 0.82 1.13 0.95 0.91 1.28 1.01 1.17 0.70 0.50 0.95 0.86 1.40 0.72 0.86 1.47 0.76Tbx6a 1.14 1.33 1.22 0.90 1.14 0.86 0.56 0.70 0.88 0.82 1.33 0.60 0.99 0.93 1.01 1.23 0.95 1.21 0.81 0.95 1.29 1.04 0.62 0.87 0.91 0.80 0.47Tbx6b/c/d 1.27 0.97 1.31 1.07 1.04 1.06 1.29 0.95 0.72 0.85 1.55 0.54 1.04 0.86 1.65 0.90 0.91 0.90 0.95 0.81 0.51 1.84 5.50 1.21 0.69 0.85 0.08TWIST-like-1a/b 0.97 0.61 0.59 1.25 1.09 0.87 0.36 0.03 0.35 0.53 1.18 0.62 0.87 0.88 1.11 0.85 0.89 0.67 0.84 0.13 0.95 0.80 0.83 0.76 0.61 0.72 0.36TWIST-like-2 0.91 0.74 0.96 0.94 1.12 0.80 0.13 0.12 0.60 1.01 1.31 0.93 0.92 0.86 0.89 0.88 0.86 0.70 1.06 0.16 0.84 0.69 0.61 0.86 0.13 1.23 0.72Wnt5 0.86 1.06 0.79 1.43 1.13 1.04 0.70 0.68 0.93 0.87 0.91 0.65 1.01 0.94 1.06 1.33 1.07 1.31 0.66 1.01 0.99 1.30 0.50 1.04 0.91 1.93 0.48ZF (C2H2)-33 0.70 1.09 0.94 0.98 0.80 0.97 0.82 1.42 0.18 0.75 1.03 0.18 0.92 0.93 0.81 0.92 0.97 1.10 1.13 0.62 1.66 0.62 1.24 0.77 0.69 0.90 0.22ZicL 1.95 1.21 0.99 0.97 0.72 1.10 0.60 0.53 0.27 0.83 1.81 0.15 1.20 0.84 1.36 1.59 0.91 1.12 0.77 1.07 1.19 1.52 0.87 1.07 0.88 1.13 5.86
43
Table S6. Primers for qRT-PCRs designed in this study. Gene Forward primer Reverse primer
BMP2/4 AGCAACGATGTCGAAGAATGA GGCGTCATTTCTGGCTGTTA BMP5/7-like CATCGGTTCCAGTGATCTTAT TCAGGCATCGGCGCATTGT Brachyury ACGTCACCGCCTTAGGATT AGGACCACGTGGTCGTGAA Cdx CAGCGCGATATTGCAATAGT TTTAACGCCTCGTGCGAACA COE GATGGCGACAGAGAACATTTT AATGGATTGGAACTCGTCATCT Delta-like GAAAACCCGTCATGCAAGCT TCCTGGTTTTGGTTGGCATT Emx GCAAGCGTCTATGACGTAATA TGGAACGAACTACTACAGCAA EphrinA-c AATCCACCTCCACGCAACAT GCGAAAGGCCAATTGCATT ets/pointed2 TCTATACAGGCCGACAGTTTT CTGCGAGCGAAATGTCTCTT FGF9/16/20 CTTTCCGACAAGGAAGCTAT GCGTTCGTCTGCTGTGAAA Fli/ERG3 GCGTATCACAAACCTCTAGAA GTATGTGGAGAAGCTCATGAA Fos CCGCACACACATTCCCATT ACGAAATAGCGACAGTAGTAGA FoxA-a CACCATCAGTGAATGACACTA GAGACGGAGTGGACACTGA FoxC GCGACACAAAGTATTCAGCAA TCTCCCACGAGGCACAGTT FoxD-a/b GCCTTGTTTTGGCAGAACTTA GGTTTCACAGCTGCCACTT GATA-b GAGTTCTCCAGGTACGTTTA TGGTTCCCCCTTCCTCTGT Hex TGGTTGAACGACCAAGAAACTA TCATGGTGGTAAGCAGGTAGT Jun TGCCGGAAACTGTGACGTA TAAGCAAGGCAACTCAGCTA LAG1-like 5 TGCCATCGTGAAAAAAGTCCTT ATTCACCTTCAACGTCACTTCT Lhx3 CCACGTGACACATTTCCAATA CGGCATAGAAATCACAGTGAA Mist AGTGCAAGTCTGCATTTGCA TTTGTGTGCTGGCACACCAT MyoD CAGAAACCAAACCAGAAACGA CTGACGTCATCGGACTGATA MYTF AGTGCTGTAGCGACCTTTCT GAACTGCTTGTTTCACTGCAT Neurogenin CTCGTTGTTGGCTAGAAGAAA TCCCAGAAAATGGAGGTGAAA NoTrlc GTCAAGAAAACCCCGTCACA CTCCAGTCAGTTTTTCTTCTCT Pax3/7 GACCCGTTTATGGAACACTA CCTTTTAGAAGCGCACTGTGA Pax6 GGCCATGTTTGAGTTAACCTA GACATCATCGCATGACCATT PPAR TGAGATTGTGGAGACAGCTT ACAATGTTGGTTGCATGAAGGA SMYD AATTATTCCGCTGTGGTTGCT TTATTTCGCAGAGGCCCATTT SOCS1/2/3/CIS CACCGCAGAACTCCCACTTTA CCAACCTGCAAACCTCGTTT Tbx2/3 CCGCTGTGCAGGAATTAAGAA TCCTCGGAATGACGTCTTGTT Tbx6a ATACCCCAACAGCACCACAT TGCCCACTAAACAAGTTTCTCA Tbx6b/c/d AACGACCACATCTCCGTTTTA AGTGCCGCATGCAGTAGTAA TWIST-like-1a/b CACGAGATTGGAAGGAAAGAA AGCAGCGGCTTGATCGATA TWIST-like-2 CGTTATCAAACCCCTCAACTT CGTTTGTTGCGTCATAACCAT ZF (C2H2)-25 TACCACACGGTCAGGTACATT GAAGCACTCAAAAGCTTGAAGA ZF (C2H2)-33 TGCGCAGATTTTGTTGCAGAA ATCGAGAGATCCGCAAGGAA ZicL TTGCGACCGAAGCTACACT TGTTGTCGATTACGTCACCAT
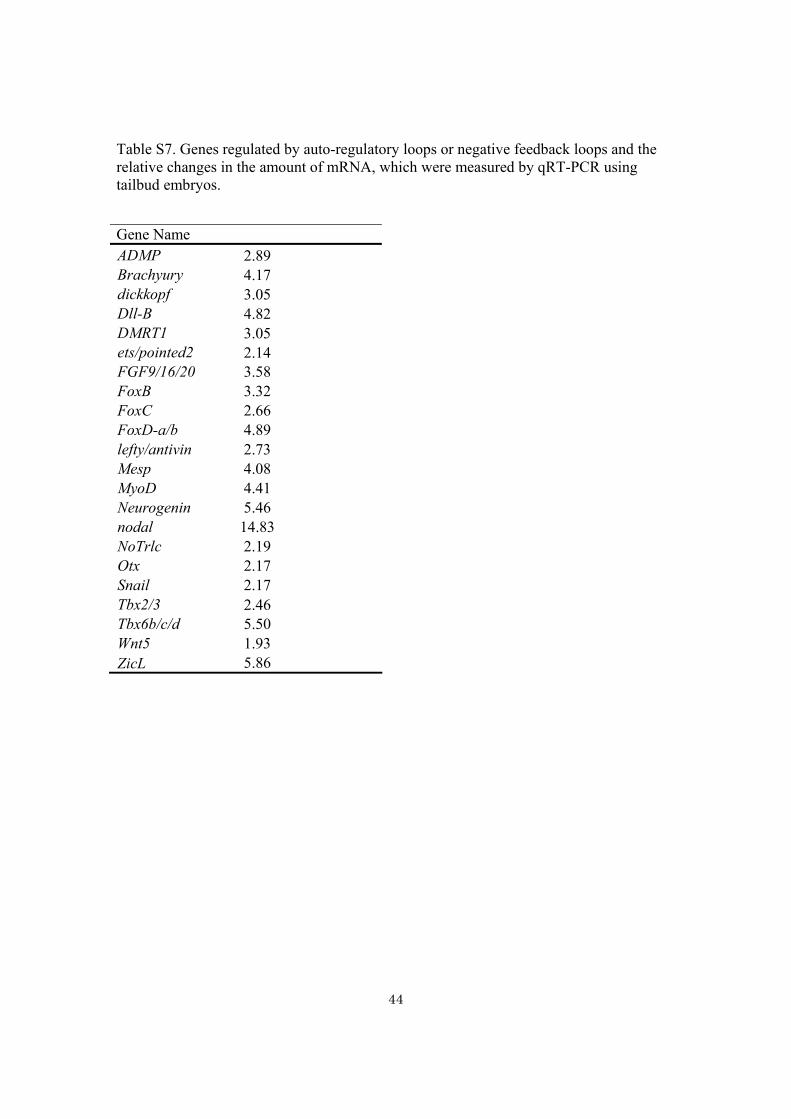
44
Table S7. Genes regulated by auto-regulatory loops or negative feedback loops and the relative changes in the amount of mRNA, which were measured by qRT-PCR using tailbud embryos.
Gene Name ADMP 2.89 Brachyury 4.17 dickkopf 3.05 Dll-B 4.82 DMRT1 3.05 ets/pointed2 2.14 FGF9/16/20 3.58 FoxB 3.32 FoxC 2.66 FoxD-a/b 4.89 lefty/antivin 2.73 Mesp 4.08 MyoD 4.41 Neurogenin 5.46 nodal 14.83 NoTrlc 2.19 Otx 2.17 Snail 2.17 Tbx2/3 2.46 Tbx6b/c/d 5.50 Wnt5 1.93 ZicL 5.86
45
Supporting References
S1. Y. Satou et al., Genesis 33, 153 (2002).
S2. K. S. Imai, K. Hino, K. Yagi, N. Satoh, Y. Satou, Development 131, 4047 (2004).
S3. Y. Satou, N. Satoh, Dev. Biol. 192, 467 (1997).
S4. K. Imai, N. Takada, N. Satoh, Y. Satou, Development 127, 3009 (2000).
S5. W. J. Longabaugh, E. H. Davidson, H. Bolouri, Dev. Biol. 283, 1 (2005).
S6. K.S. Imai, N. Satoh, Y. Satou, Development 129, 1729 (2002).
S7. H. Nishida, K. Sawada, Nature 409, 724 (2001).
S8. Y. Satou et al., Dev. Genes Evol. 212, 87 (2002).
S9. K. S. Imai, N. Satoh, Y. Satou, Development 129, 3441 (2002).
S10. K. Yagi, N. Takatori, Y. Satou, N. Satoh, Dev. Biol. 282, 535 (2005).
S11. K. Kobayashi et al., Development 130, 5179 (2003).
S12. S. Yoshida, Y. Marikawa, N. Satoh, Development 122, 2005 (1996).
S13. L. Yamada, K. Kobayashi, Y. Satou, N. Satoh, Dev. Biol. 284, 536 (2005).
S14. K. S. Imai, Y. Satou, N. Satoh, Development 129, 2723 (2002).
S15. K. S. Imai, N. Satoh, Y. Satou, Development 130, 4461 (2003).
S16. C. Hudson, H. Yasuo, Development 132, 1199 (2005).
S17. Y. Satou, K. S. Imai, N. Satoh, Development 128, 3559 (2001).
S18. D. Y. Stainier, Genes Dev. 16, 893 (2002).
S19. T. H. Meedel, S. C. Farmer, J. J. Lee, Development 124, 1711 (1997).
S20. Y. Satou et al., Dev. Genes Evol. 213, 213 (2003).
S21. L. Balagopalan, C. A. Keller, S. M. Abmayr, Dev. Biol. 231, 374 (2001).
S22. J. M. Venuti, L. Gan, M. T. Kozlowski, W. H. Klein, Mech. Dev. 41, 3 (1993).
S23. L. Chen, M. Krause, M. Sepanski, A. Fire, Development 120, 1631 (1994).
S24. S. Fujiwara, J. C. Corbo, M. Levine, Development 125, 2511 (1998).
S25. Y. Satou, K. S. Imai, N. Satoh, Development 131, 2533 (2004).
S26. Y. Saga et al., Development 126, 3437 (1999).
S27. A. W. Moore, S. Barbel, L. Y. Jan, Y. N. Jan, Proc. Natl. Acad. Sci. U. S. A. 97,
10436 (2000).
S28. B. Davidson, W. Shi, M. Levine, Development 132, 4811 (2005).
S29. K. Yagi, Y. Satou, N. Satoh, Development 131, 1279 (2004).

46
S30. J. C. Corbo, S. Fujiwara, M. Levine, A. Di Gregorio, Dev. Biol. 203, 358 (1998).
S31. V. Bertrand, C. Hudson, D. Caillol, C. Popovici, P. Lemaire, Cell 115, 615 (2003).
S32. K. Yagi, N. Satoh, Y. Satou, Dev. Biol. 274, 478 (2004).
S33. I. Oda-Ishii, V. Bertrand, I. Matsuo, P. Lemaire, H. Saiga, Development 132, 1663
(2005).
S34. S. Kawaminani, H. Nishida, Dev. Biol. 181, 14 (1997).