Supporting Information - Royal Society of Chemistry · Supporting Information Diaryldichalcogenide...
25
* Correspondence to Jens Beckmann (E-mail: [email protected]) Supporting Information Diaryldichalcogenide Radical Cations Ole Mallow, a Monther A. Khanfar, b,c Moritz Malischewski, b Pamela Finke, a Malte Hesse, a Enno Lork, a Timo Augenstein, d Frank Breher, d Jeffrey R. Harmer, e Nadezhda V. Vasilieva, f Andrey Zibarev, f,g Artem S. Bogomyakov, h Konrad Seppelt b and Jens Beckmann a Electronic Supplementary Material (ESI) for Chemical Science. This journal is © The Royal Society of Chemistry 2014
Transcript of Supporting Information - Royal Society of Chemistry · Supporting Information Diaryldichalcogenide...

* Correspondence to Jens Beckmann (E-mail: [email protected])
Supporting Information
Diaryldichalcogenide Radical CationsOle Mallow,a Monther A. Khanfar,b,c Moritz Malischewski,b Pamela Finke,a Malte Hesse,a Enno Lork,a Timo
Augenstein,d Frank Breher,d Jeffrey R. Harmer,e Nadezhda V. Vasilieva,f Andrey Zibarev,f,g Artem S. Bogomyakov,h Konrad Seppeltb and Jens Beckmanna
Electronic Supplementary Material (ESI) for Chemical Science.This journal is © The Royal Society of Chemistry 2014
2
Experimental
All reactions and manipulations were carried out under an atmosphere of dry argon using standard Schlenk techniques and glove boxes. All solvents were dried over the appropriate desiccants and freshly distilled prior to use.
Materials and Reagents
The starting materials (C6F5S)2 (13a),S1 (C6F5Se)2 (13b),S2 (C6F5Te)2 (13c),S3 (2,6-Mes2C6H3Te)2 (16a)21 were prepared according to literature procedures, whereas AsF5 was obtained by fluorination of elemental As. The SbF5 was purchased from commercial suppliers and distilled once prior to use. The [NO][SbF6] was obtained from Sigma-Aldrich and used as received.
Instrumentation and Measurement
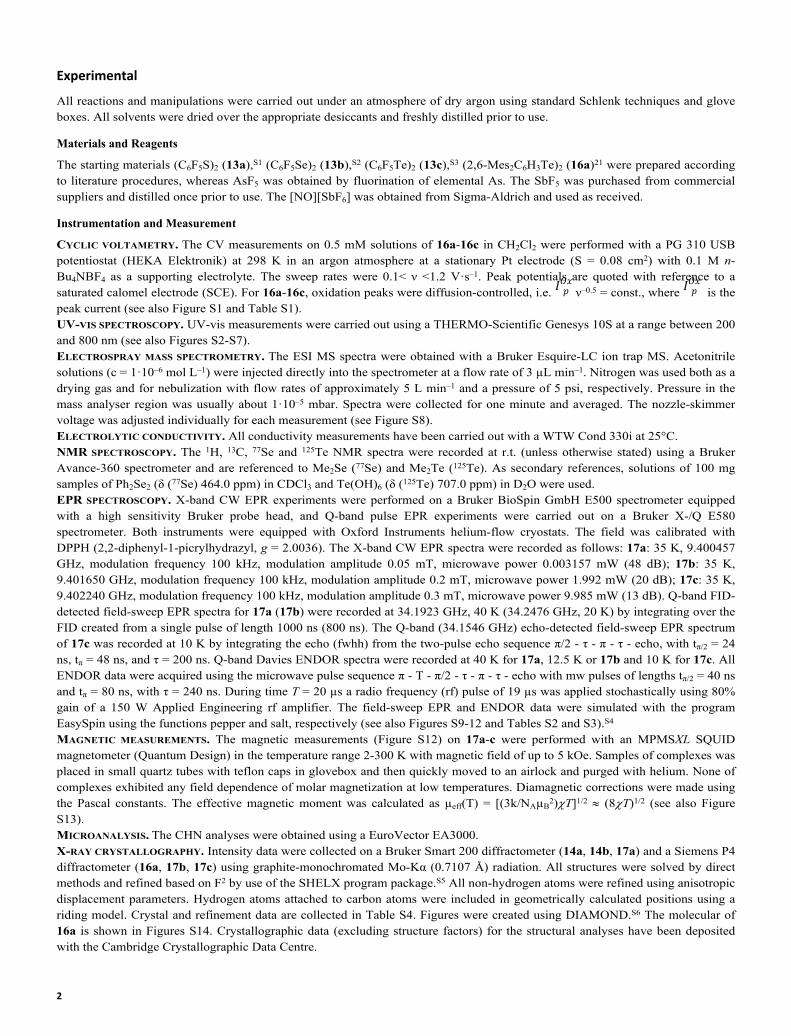
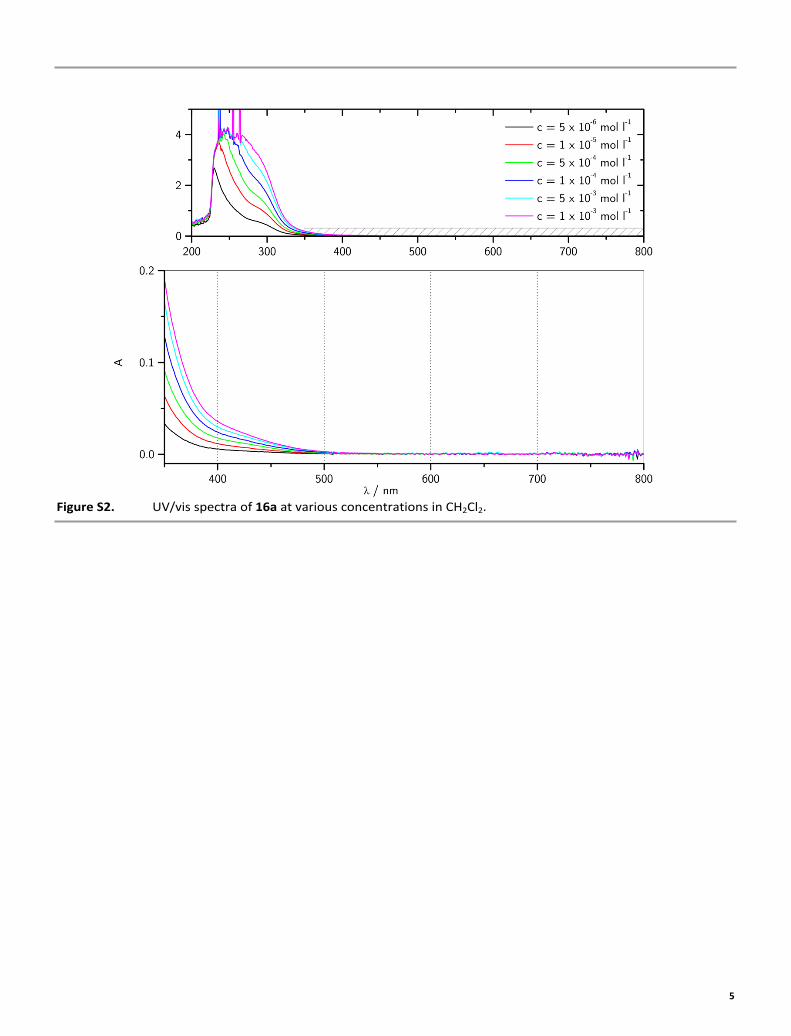
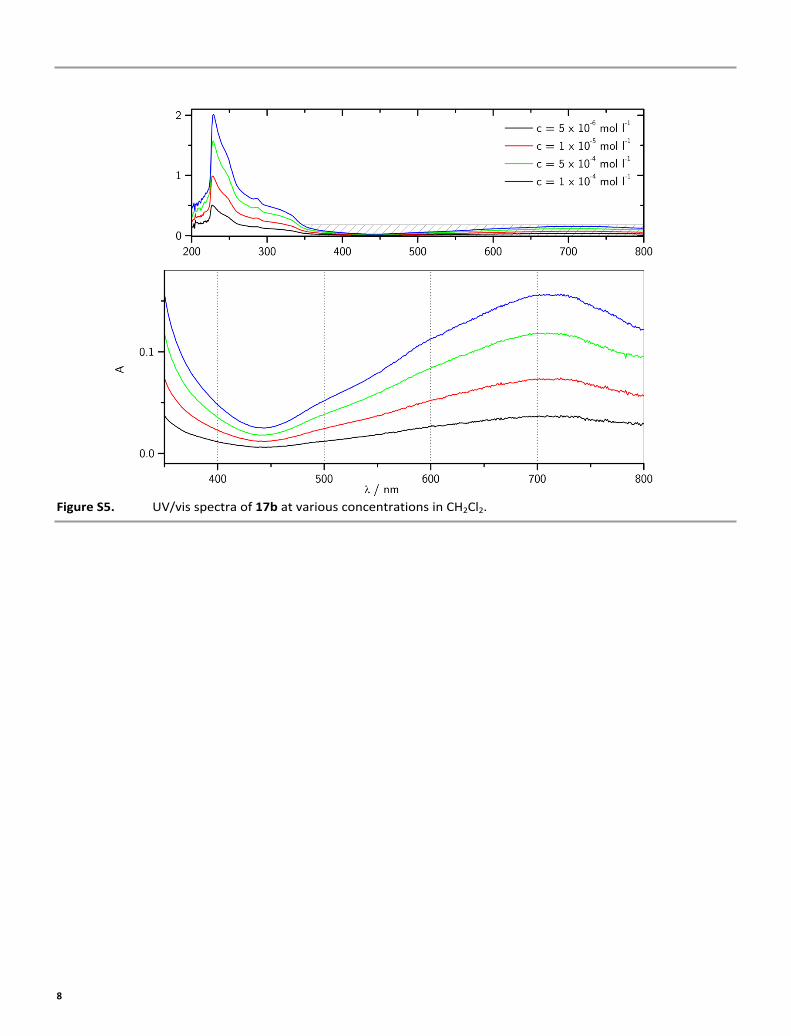
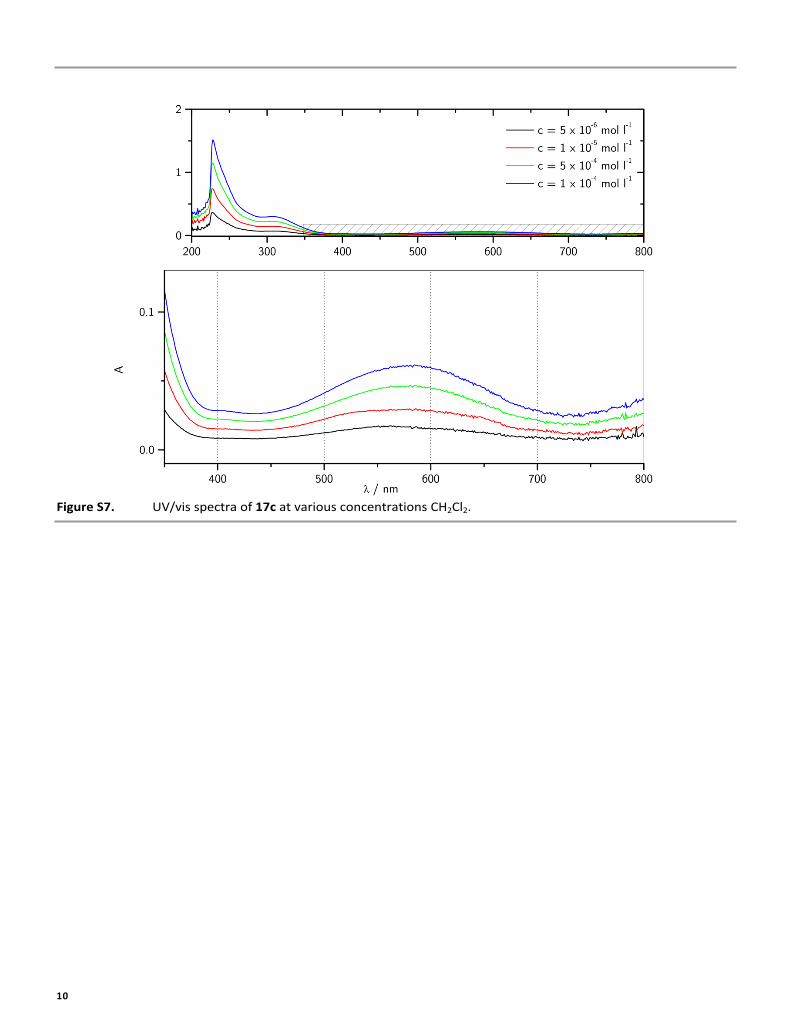
CYCLIC VOLTAMETRY. The CV measurements on 0.5 mM solutions of 16a-16c in CH2Cl2 were performed with a PG 310 USB potentiostat (HEKA Elektronik) at 298 K in an argon atmosphere at a stationary Pt electrode (S = 0.08 cm2) with 0.1 M n-Bu4NBF4 as a supporting electrolyte. The sweep rates were 0.1< ν <1.2 V·s–1. Peak potentials are quoted with reference to a saturated calomel electrode (SCE). For 16a-16c, oxidation peaks were diffusion-controlled, i.e. ν–0.5 = const., where is the 𝐼𝑂𝑥𝑝 𝐼𝑂𝑥𝑝peak current (see also Figure S1 and Table S1).UV-VIS SPECTROSCOPY. UV-vis measurements were carried out using a THERMO-Scientific Genesys 10S at a range between 200 and 800 nm (see also Figures S2-S7).ELECTROSPRAY MASS SPECTROMETRY. The ESI MS spectra were obtained with a Bruker Esquire-LC ion trap MS. Acetonitrile solutions (c = 1·10–6 mol L–1) were injected directly into the spectrometer at a flow rate of 3 µL min–1. Nitrogen was used both as a drying gas and for nebulization with flow rates of approximately 5 L min–1 and a pressure of 5 psi, respectively. Pressure in the mass analyser region was usually about 1·10–5 mbar. Spectra were collected for one minute and averaged. The nozzle-skimmer voltage was adjusted individually for each measurement (see Figure S8).ELECTROLYTIC CONDUCTIVITY. All conductivity measurements have been carried out with a WTW Cond 330i at 25°C.NMR SPECTROSCOPY. The 1H, 13C, 77Se and 125Te NMR spectra were recorded at r.t. (unless otherwise stated) using a Bruker Avance-360 spectrometer and are referenced to Me2Se (77Se) and Me2Te (125Te). As secondary references, solutions of 100 mg samples of Ph2Se2 (δ (77Se) 464.0 ppm) in CDCl3 and Te(OH)6 (δ (125Te) 707.0 ppm) in D2O were used.EPR SPECTROSCOPY. X-band CW EPR experiments were performed on a Bruker BioSpin GmbH E500 spectrometer equipped with a high sensitivity Bruker probe head, and Q-band pulse EPR experiments were carried out on a Bruker X-/Q E580 spectrometer. Both instruments were equipped with Oxford Instruments helium-flow cryostats. The field was calibrated with DPPH (2,2-diphenyl-1-picrylhydrazyl, g = 2.0036). The X-band CW EPR spectra were recorded as follows: 17a: 35 K, 9.400457 GHz, modulation frequency 100 kHz, modulation amplitude 0.05 mT, microwave power 0.003157 mW (48 dB); 17b: 35 K, 9.401650 GHz, modulation frequency 100 kHz, modulation amplitude 0.2 mT, microwave power 1.992 mW (20 dB); 17c: 35 K, 9.402240 GHz, modulation frequency 100 kHz, modulation amplitude 0.3 mT, microwave power 9.985 mW (13 dB). Q-band FID-detected field-sweep EPR spectra for 17a (17b) were recorded at 34.1923 GHz, 40 K (34.2476 GHz, 20 K) by integrating over the FID created from a single pulse of length 1000 ns (800 ns). The Q-band (34.1546 GHz) echo-detected field-sweep EPR spectrum of 17c was recorded at 10 K by integrating the echo (fwhh) from the two-pulse echo sequence π/2 - τ - π - τ - echo, with tπ/2 = 24 ns, tπ = 48 ns, and τ = 200 ns. Q-band Davies ENDOR spectra were recorded at 40 K for 17a, 12.5 K or 17b and 10 K for 17c. All ENDOR data were acquired using the microwave pulse sequence π - T - π/2 - τ - π - τ - echo with mw pulses of lengths tπ/2 = 40 ns and tπ = 80 ns, with τ = 240 ns. During time T = 20 µs a radio frequency (rf) pulse of 19 µs was applied stochastically using 80% gain of a 150 W Applied Engineering rf amplifier. The field-sweep EPR and ENDOR data were simulated with the program EasySpin using the functions pepper and salt, respectively (see also Figures S9-12 and Tables S2 and S3).S4
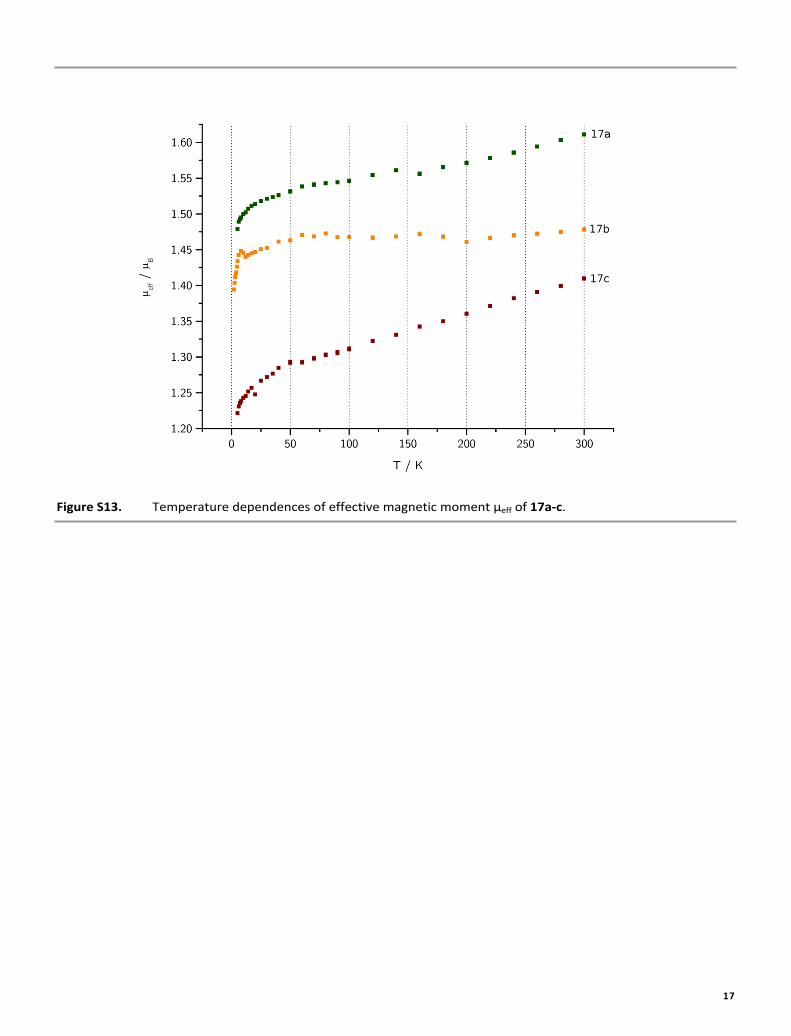
MAGNETIC MEASUREMENTS. The magnetic measurements (Figure S12) on 17a-c were performed with an MPMSXL SQUID magnetometer (Quantum Design) in the temperature range 2-300 K with magnetic field of up to 5 kOe. Samples of complexes was placed in small quartz tubes with teflon caps in glovebox and then quickly moved to an airlock and purged with helium. None of complexes exhibited any field dependence of molar magnetization at low temperatures. Diamagnetic corrections were made using the Pascal constants. The effective magnetic moment was calculated as µeff(T) = [(3k/NAµB
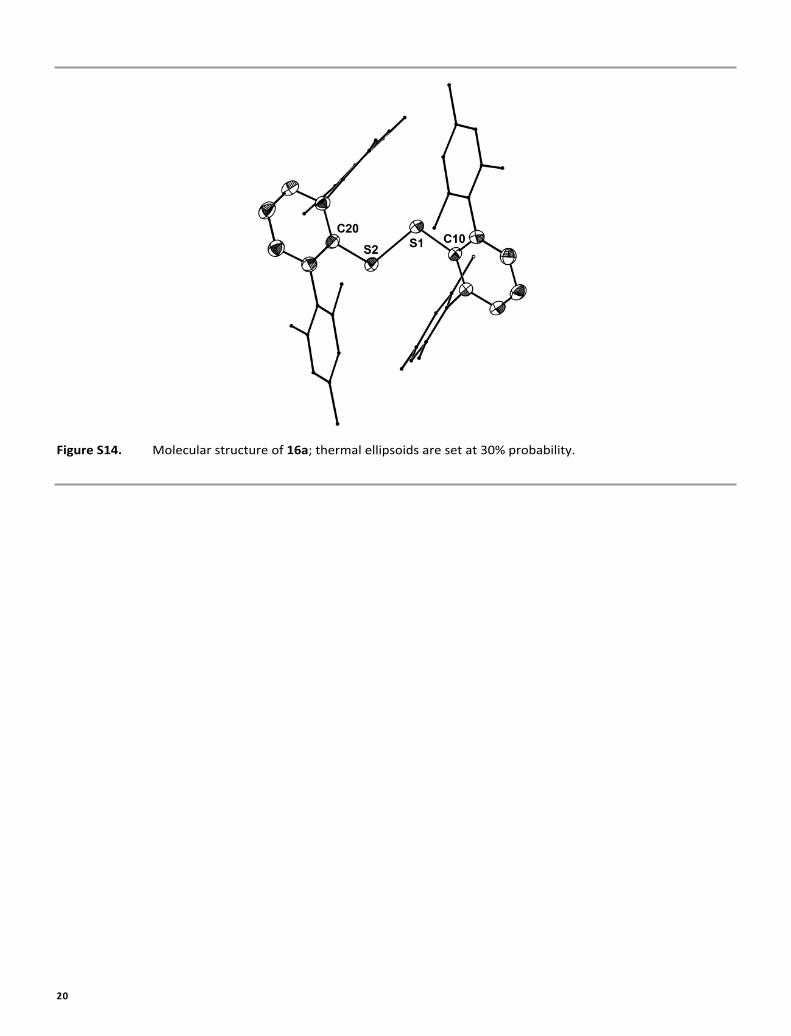
2)T]1/2 (8T)1/2 (see also Figure S13).MICROANALYSIS. The CHN analyses were obtained using a EuroVector EA3000.X-RAY CRYSTALLOGRAPHY. Intensity data were collected on a Bruker Smart 200 diffractometer (14a, 14b, 17a) and a Siemens P4 diffractometer (16a, 17b, 17c) using graphite-monochromated Mo-Kα (0.7107 Å) radiation. All structures were solved by direct methods and refined based on F2 by use of the SHELX program package.S5 All non-hydrogen atoms were refined using anisotropic displacement parameters. Hydrogen atoms attached to carbon atoms were included in geometrically calculated positions using a riding model. Crystal and refinement data are collected in Table S4. Figures were created using DIAMOND.S6 The molecular of 16a is shown in Figures S14. Crystallographic data (excluding structure factors) for the structural analyses have been deposited with the Cambridge Crystallographic Data Centre.

3
Copies of this information may be obtained free of charge from The Director, CCDC, 12 Union Road, Cambridge CB2 1EZ, UK (Fax: +44-1223-336033; e-mail: [email protected] or http://www.ccdc.cam.ac.uk).COMPUTATIONAL CHEMISTRY. Several sets of computations were performed. Calculation of the EPR parameters were performed using the ORCA program package at the BP86/def2-TZVP level including the ZORA approximation.S7 The calculations were performed on previously optimized structures using the TURBOMOLE program package.S8 The geometries were optimized at the (RI)-B3LYP level in the def2-TZVP basis.S9 The coordinates of the solid state structures were chosen as starting geometry. Since for these calculations the whole, i.e. non-simplified molecules have been taken into account, the optimized structures were not checked for minima by 2nd derivative (frequency) calculations due to the large number of atoms. The conformational analysis was carried out with the Gaussian09 program.S10 The methylated m-terphenyl-substituents have been simplified to phenyl groups in order to reduce the number of electrons, but also to reduce the number of rotational isomers of the methyl groups which would complicate the finding of the ground state configuration. The pentafluorophenyl compounds have been calculated as such. At first some well-established methods have been tested. It turned out that the MP2 ab initio method was too time consuming, frequency calculations took months or did not converge. The DFT Becke3LYP method worked reliably. Alternatively user defined models as proposed for radicals has been tested by using a mixed ratio of exact and DFT energy terms of 4.428:0.572 with the MPW1PW91 hybrid functional.S11 The energy separation and overall geometry of the dichalcogenide radical cations in C2 and Cs symmetry did not change, so that all further calculations have been performed with the Becke3LYP functional. On the neutral diaryl dichalcogenides the choice of the basis sets has been tested, since their molecular structures are known from X-ray crystallography. The cc-pvTZ basis set is superior to 6-311+G(d,p) in reproducing bond distances. Remaining large differences between experimental and calculated structure are found only for the C-S-S-C and C-Se-Se-C dihedral angles of the fluorinated phenyl derivatives. Basis sets used for selenium are all electron 6-311+G(d,p) and cc-pvTZ, and also a core potential for 28 electron and a 14s10p2d1f[3s3d2p1f] basis set. Te has been represented by a 46 electron core potential and a 15s11p3d1f[3s3p2d1f] basis set.S12 Wiberg bond indices (WBIs) were calculated with NBO 5.9 as implemented in Gaussian09.37 The 77Se and 125Te NMR chemical shifts were computed with the GIAO method using the cc-pVTZ basis set for C and H atoms as well as an IGLO-II type basis set for Se and Te (see also Figure S15 and S16 as well as Tables S5-9).S13

4
Figure S1. Cyclic voltammograms of 16a-c at Pt anode in CH2Cl2 / 0.1 M n-Bu4NBF4 at = 0.1 V s–1 and c = 5·10-4 mol l–1.
Table S1. Results of the cyclic voltammetry investigations of 16a-c ( = 0.1 V s–1, c = 5·10-4 mol l–1).
Compound / VOxpE / VRed
pE / μAOx
pI / μARedpI
16a 1.22 1.15 13.2 –11.816b 1.09 1.01 9.8 –8.416c 0.79 0.71 4.4 –3.6
5
Figure S2. UV/vis spectra of 16a at various concentrations in CH2Cl2.

6
Figure S3. UV/vis spectra of 17a at various concentrations in CH2Cl2.

7
Figure S4. UV/vis spectra of 16b at various concentrations in CH2Cl2.
8
Figure S5. UV/vis spectra of 17b at various concentrations in CH2Cl2.

9
Figure S6. UV/vis spectra of 16c at various concentrations in CH2Cl2.
10
Figure S7. UV/vis spectra of 17c at various concentrations CH2Cl2.

11
Figure S8. ESI MS spectra (positive mode, MeCN) of 17a-c showing the experimental (above) and simulated (below) mass clusters of the radical cations.

12
Table S2: Experimental and DFT (in parentheses) EPR parameters for 17a-c.
Parameter Principal values / MHz Euler angles / deg. s p total
17ag 2.0014, 2.0115, 2.0285
(2.0022, 2.0107, 2.0213) (0,0,0)- - -
A(1H) -3.0, -7.2, -11.0(-1.8, -5.8, -8.5) (3.1, 93.1,92.8) (-0.00131)
n.a.(-0.00131)
L 7.5, 7.5, 10 (X-band) / 9, 9, 22 (Q-band) - - -17b
g 1.9956, 2.0438, 2.1543(2.0021, 2.0452, 2.1165) (0,0,0)
- - -
A(77Se) -50, -100, 465(-106, -116, 306) (-2.0,88.5,0.2) (0.00259) (0.33175) (0.33228)
A(77Se) -80, -115, 610(-135, -140, 407) (4.0,91.0,-0.2) (0.00332) (0.39967) (0.40193)
A(1H) -1.8, -4.3, -6.4(-1.2, -4.2, -6.1) (-1.3,85.0,85.3) (-0.00080)
n.a.(-0.00080)
L 15, 18, 40 (X-band) / 15, 30, 120 (Q-band) - - -17c
g 1.9542, 2.0411, 2.4566(2.0021, 2.0876, 2.3688) (0,0,0)
- - -
A(127Te) 300, 350, -1000(350, 370, -720)(352, 372, -724)
(-179.6,82.2,-179.0) (-179.6,97.7,179.0)
(0.00085)(0.00089)
(0.39122)(0.39312)
(0.38784)(0.38970)
A(1H) - , - , -3.8(-0.6, -2.6, -3.8) (-174.9,94.8,-110.3) (-0.00042)
n.a.(-0.00042)
L 30, 30, 90 (X-band) / 120, 120, 220 (Q-band) - - -
Listed are the principal g-values g, principal hyperfine values A (MHz) and their corresponding Euler angles (degrees), X- and Q-band linewidths L (MHz) for the EPR simulations, and the spin densities in s-type s and p-type p orbitals and their sum. All simulations used Euler angles from the DFT calculations, and the sign of the experimental hyperfine couplings are assigned to be consistent with the DFT results (experiment data provide only absolute values).

13
Figure S9. Orientation of the g-matrix axes in the Molecular frame for radicals 17a, 17b and 17c (see also Table S3).
Table S3. g-matrix principal axis vectors g1, g2, g3 for the radicals 17a, 17b and 17c in the molecular frame (defined by the selected atom coordinates below) from the DFT calculations (see also Figure S9).
17a 17b 17cg1 -0.186 -0.9471 -0.2616 g1 -0.081 -0.8945 -0.4396 g1 0.737 0.6759 0.0049g2 0.9753 -0.2103 0.0681 g2 0.9745 -0.1637 0.1536 g2 0.6608 -0.722 0.205g3 -0.1195 -0.2424 0.9628 g3 -0.2094 -0.416 0.885 g3 0.1421 -0.1479 -0.9787
C 0.2095 2.3735 -3.6619 C 3.0536 1.6446 -3.4331 C 0.7929 -0.3842 -3.2613C 0.5682 1.9271 -2.3727 C 2.6871 1.0312 -2.2222 C 0.7976 -0.6965 -4.6407C -0.2313 1.4675 -4.6391 C 2.071 2.0847 -4.3338 Te -0.6381 1.0407 -0.7277C 0.448 0.5399 -2.1028 C 1.3021 0.8698 -1.9341 C -0.3361 0.3089 -2.7521S 1.0087 -0.0664 -0.4977 Se 1.0865 -0.0122 -0.2234 Te 0.9712 -0.729 0.6702C -0.3123 0.0951 -4.3543 C 0.7119 1.9123 -4.03 C -0.2648 -0.3357 -5.4815C 0.0362 -0.4019 -3.0813 C -1.3451 -0.5724 4.3938 C -0.3115 0.8156 3.2128C 0.5197 -0.8801 2.838 C -1.1353 -1.9505 4.557 C -1.4203 0.6883 -3.5901S -0.8745 0.0188 0.4768 C -1.3387 0.0071 3.1079 C -1.3682 0.3535 -4.9582C 0.4362 -1.1476 4.2202 C 0.2881 1.301 -2.8292 C 0.2636 -0.3737 2.6947C -0.665 -0.4247 2.1928 C -0.9301 -2.7751 3.4403 C -0.6125 0.8455 4.5943C -0.7612 -0.988 4.9354 C -1.1067 -0.8439 1.9986 C 0.5338 -1.4959 3.5248C -1.8971 -0.2632 2.9001 C -0.9201 -2.245 2.1318 C -0.353 -0.251 5.4286C -1.9207 -0.5512 4.2745 Se -1.2503 -0.0166 0.2375 C 0.2164 -1.4161 4.8956

14
Figure S10. 1H Q-band (34.1922 GHz) Davies ENDOR spectra recorded at 40 K of 17a (black) and simulations (red) for the largest proton hyperfine coupling (the one resolved in the EPR spectra). Spectra have been centred around the 1H Larmor frequency 1H. The measurement field positions from bottom (g3) to top (g1) are: 1204.7 (g3), 1205.7, 1207.7, 1209.7, 1211.7, 1213.7, 1214.5 (g2), 1215.6, 1217.2, 1218.9, 1220.6 (g1), 1221.0 mT.

15
Figure S11. 1H Q-band (34.2443 GHz) Davies ENDOR spectra recorded at 12.5 K for 17b (black) and simulations (red) for the largest proton hyperfine coupling. Spectra have been centred around the 1H Larmor frequency 1H. The measurement field positions from bottom (g3) to top (g1) are: 1139.2 (g3), 1158.3, 1177.4, 1197.2 (g2), 1207.2, 1223.7, 1228.7 mT (g1).

16
Figure S12. 1H Q-band (34.1545 GHz) Davies ENDOR spectrum recorded at 10 K of 17c (black) and simulation (red) for the largest proton coupling. The observer position was close to g2 (B0 = 1195.1 mT) and shows the largest coupling is |Amax| = 3.8 MHz.
17
Figure S13. Temperature dependences of effective magnetic moment μeff of 17a-c.

18
Table S4. Crystal data and structure refinement of [14b][As2F11], 16a, [17a-c][SbF6],
[14a][Sb2F11] [14b][As2F11] 16aFormula C12F21S2Sb2 C12As2F21Se2 C48H50S2
Formula weight, g mol–1 850.74 850.88 691.00Crystal system monoclinic triclinic monoclinic
Crystal size, mm 0.20.050.02 0.60.40.02 0.90.80.6Space group P21/n P-1 P21/n
a, Å 12.029(4) 8.5406(18) 15.695(3)b, Å 12.276(6) 8.5891(18) 15.264(2)c, Å 14.440(7) 14.093(3) 16.274(2), º 90.00 84.900(5) 90, º 97.662(14) 84.781(5) 93.450(10), º 90.00 88.091(5) 90
V, Å3 2113.3(16) 1025.1(4) 3892(1)Z 4 2 4
calcd, Mg m–3 2.674 2.757 1.179 (Mo Kα), mm–1 2.938 7.000 0.169
F(000) 1580 790 1480 range, deg 2.07 to 26.13 2.38 to 30.60 2.51 to 27.50Index ranges –14 h 14 –11 h 12 –19 h 20
–15 k 16 –12 k 12 –19 k 13–1 l 17 –20 l 17 –21 l 21
No. of reflns collected 4165 16040 10766Completeness to max 99.0% 96.8% 99.7%
No. indep. Reflns 4165 6115 8906No. obsd reflns with (I>2(I)) 2858 4844 5949
No. refined params 335 334 463GooF (F2) 1.037 1.020 1.013
R1 (F) (I > 2(I)) 0.0469 0.0264 0.0609wR2 (F2) (all data) 0.1395 0.0660 0.1663
Largest diff peak/hole, e Å–3 1.229 / –1.138 1.379 / –0.579 0.378 / –0.433CCDC number 1028017 999869 999870
19
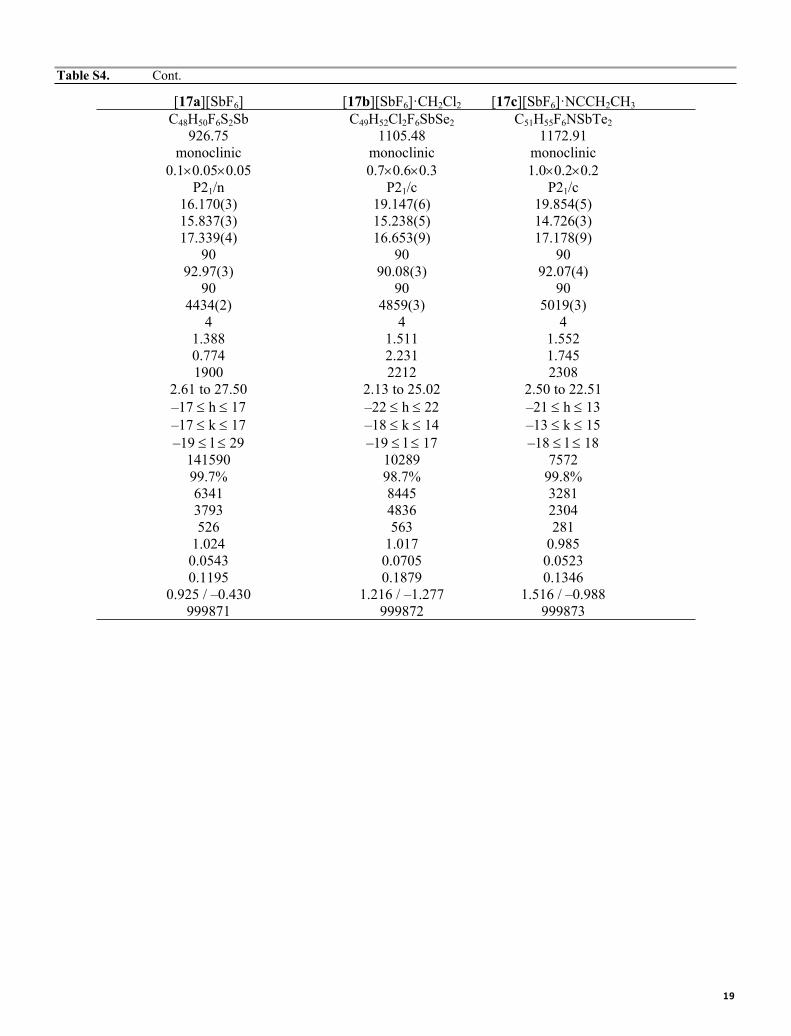
Table S4. Cont.
[17a][SbF6] [17b][SbF6]·CH2Cl2 [17c][SbF6]·NCCH2CH3
C48H50F6S2Sb C49H52Cl2F6SbSe2 C51H55F6NSbTe2926.75 1105.48 1172.91
monoclinic monoclinic monoclinic0.10.050.05 0.70.60.3 1.00.20.2
P21/n P21/c P21/c16.170(3) 19.147(6) 19.854(5)15.837(3) 15.238(5) 14.726(3)17.339(4) 16.653(9) 17.178(9)
90 90 9092.97(3) 90.08(3) 92.07(4)
90 90 904434(2) 4859(3) 5019(3)
4 4 41.388 1.511 1.5520.774 2.231 1.7451900 2212 2308
2.61 to 27.50 2.13 to 25.02 2.50 to 22.51–17 h 17 –22 h 22 –21 h 13–17 k 17 –18 k 14 –13 k 15–19 l 29 –19 l 17 –18 l 18
141590 10289 757299.7% 98.7% 99.8%6341 8445 32813793 4836 2304526 563 281
1.024 1.017 0.9850.0543 0.0705 0.05230.1195 0.1879 0.1346
0.925 / –0.430 1.216 / –1.277 1.516 / –0.988999871 999872 999873
20
Figure S14. Molecular structure of 16a; thermal ellipsoids are set at 30% probability.
21
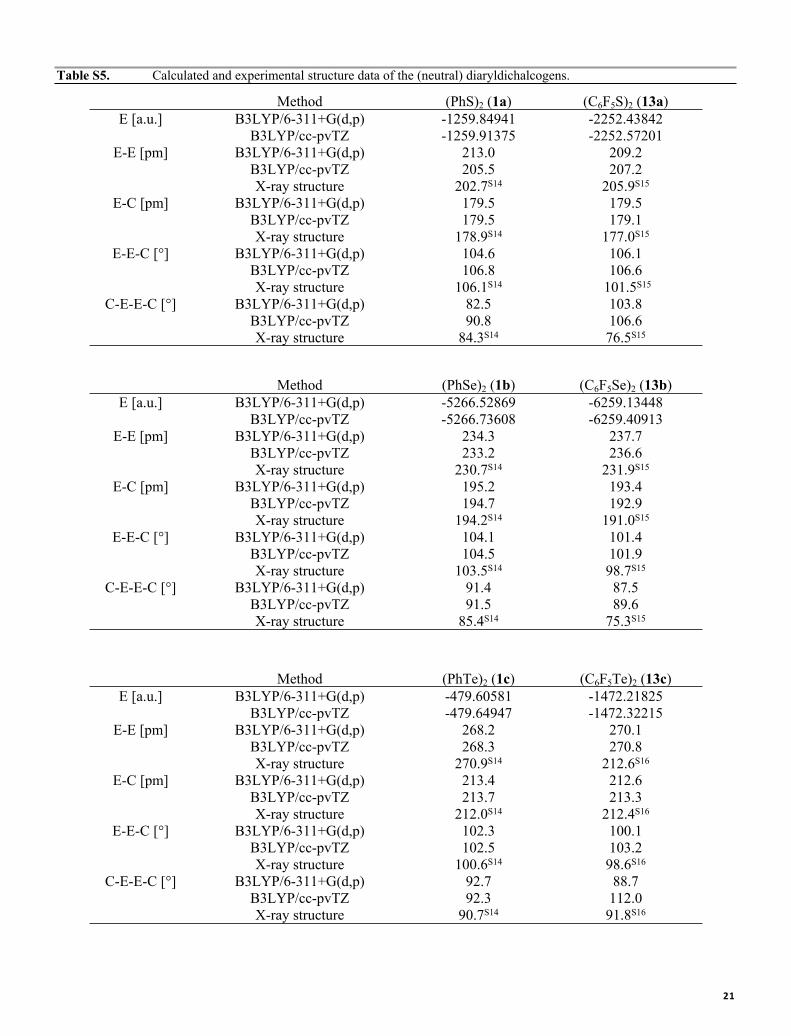
Table S5. Calculated and experimental structure data of the (neutral) diaryldichalcogens.
Method (PhS)2 (1a) (C6F5S)2 (13a)E [a.u.] B3LYP/6-311+G(d,p) -1259.84941 -2252.43842
B3LYP/cc-pvTZ -1259.91375 -2252.57201E-E [pm] B3LYP/6-311+G(d,p) 213.0 209.2
B3LYP/cc-pvTZ 205.5 207.2X-ray structure 202.7S14 205.9S15
E-C [pm] B3LYP/6-311+G(d,p) 179.5 179.5B3LYP/cc-pvTZ 179.5 179.1X-ray structure 178.9S14 177.0S15
E-E-C [°] B3LYP/6-311+G(d,p) 104.6 106.1B3LYP/cc-pvTZ 106.8 106.6X-ray structure 106.1S14 101.5S15
C-E-E-C [°] B3LYP/6-311+G(d,p) 82.5 103.8B3LYP/cc-pvTZ 90.8 106.6X-ray structure 84.3S14 76.5S15
Method (PhSe)2 (1b) (C6F5Se)2 (13b)E [a.u.] B3LYP/6-311+G(d,p) -5266.52869 -6259.13448
B3LYP/cc-pvTZ -5266.73608 -6259.40913E-E [pm] B3LYP/6-311+G(d,p) 234.3 237.7
B3LYP/cc-pvTZ 233.2 236.6X-ray structure 230.7S14 231.9S15
E-C [pm] B3LYP/6-311+G(d,p) 195.2 193.4B3LYP/cc-pvTZ 194.7 192.9X-ray structure 194.2S14 191.0S15
E-E-C [°] B3LYP/6-311+G(d,p) 104.1 101.4B3LYP/cc-pvTZ 104.5 101.9X-ray structure 103.5S14 98.7S15
C-E-E-C [°] B3LYP/6-311+G(d,p) 91.4 87.5B3LYP/cc-pvTZ 91.5 89.6X-ray structure 85.4S14 75.3S15
Method (PhTe)2 (1c) (C6F5Te)2 (13c)E [a.u.] B3LYP/6-311+G(d,p) -479.60581 -1472.21825
B3LYP/cc-pvTZ -479.64947 -1472.32215E-E [pm] B3LYP/6-311+G(d,p) 268.2 270.1
B3LYP/cc-pvTZ 268.3 270.8X-ray structure 270.9S14 212.6S16
E-C [pm] B3LYP/6-311+G(d,p) 213.4 212.6B3LYP/cc-pvTZ 213.7 213.3X-ray structure 212.0S14 212.4S16
E-E-C [°] B3LYP/6-311+G(d,p) 102.3 100.1B3LYP/cc-pvTZ 102.5 103.2X-ray structure 100.6S14 98.6S16
C-E-E-C [°] B3LYP/6-311+G(d,p) 92.7 88.7B3LYP/cc-pvTZ 92.3 112.0X-ray structure 90.7S14 91.8S16
22
180 175 170 165 160 155 150 145 140 135 1300
0.5
1
1.5
2
2.5
3
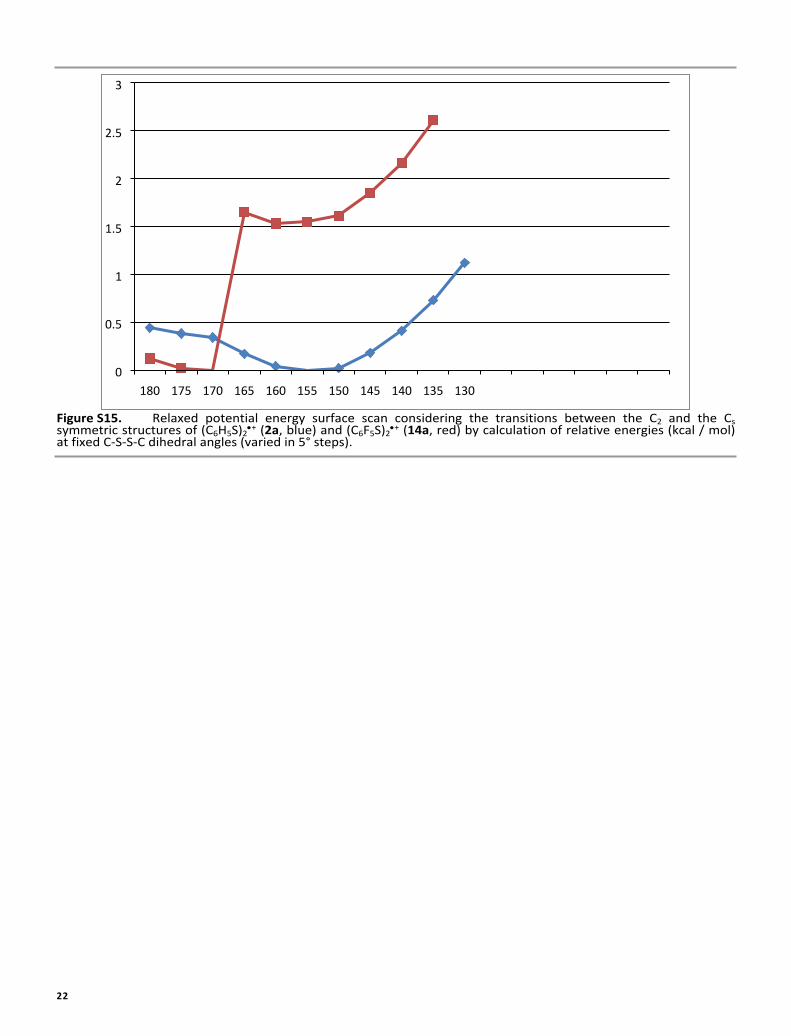
Figure S15. Relaxed potential energy surface scan considering the transitions between the C2 and the Cs symmetric structures of (C6H5S)2
+ (2a, blue) and (C6F5S)2+ (14a, red) by calculation of relative energies (kcal / mol)
at fixed C-S-S-C dihedral angles (varied in 5° steps).
23
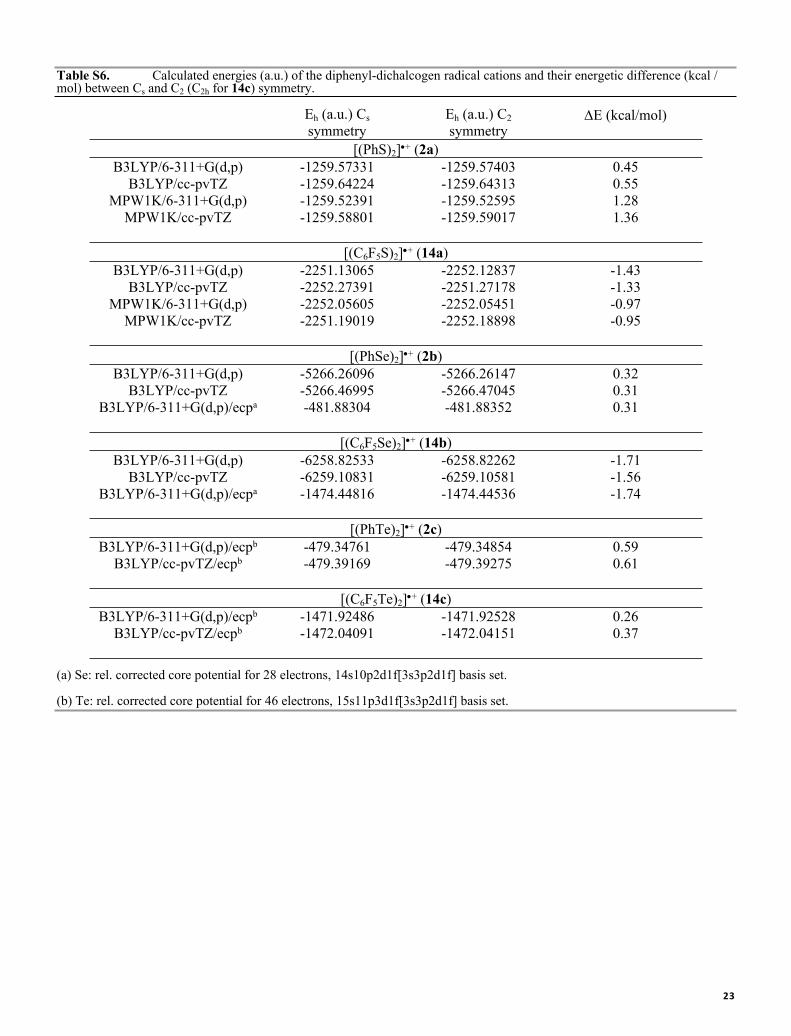
Table S6. Calculated energies (a.u.) of the diphenyl-dichalcogen radical cations and their energetic difference (kcal / mol) between Cs and C2 (C2h for 14c) symmetry.
Eh (a.u.) Cs symmetry
Eh (a.u.) C2 symmetry
E (kcal/mol)
[(PhS)2]+ (2a)B3LYP/6-311+G(d,p) -1259.57331 -1259.57403 0.45
B3LYP/cc-pvTZ -1259.64224 -1259.64313 0.55MPW1K/6-311+G(d,p) -1259.52391 -1259.52595 1.28
MPW1K/cc-pvTZ -1259.58801 -1259.59017 1.36
[(C6F5S)2]+ (14a)B3LYP/6-311+G(d,p) -2251.13065 -2252.12837 -1.43
B3LYP/cc-pvTZ -2252.27391 -2251.27178 -1.33MPW1K/6-311+G(d,p) -2252.05605 -2252.05451 -0.97
MPW1K/cc-pvTZ -2251.19019 -2252.18898 -0.95
[(PhSe)2]+ (2b)B3LYP/6-311+G(d,p) -5266.26096 -5266.26147 0.32
B3LYP/cc-pvTZ -5266.46995 -5266.47045 0.31B3LYP/6-311+G(d,p)/ecpa -481.88304 -481.88352 0.31
[(C6F5Se)2]+ (14b)B3LYP/6-311+G(d,p) -6258.82533 -6258.82262 -1.71
B3LYP/cc-pvTZ -6259.10831 -6259.10581 -1.56B3LYP/6-311+G(d,p)/ecpa -1474.44816 -1474.44536 -1.74
[(PhTe)2]+ (2c)B3LYP/6-311+G(d,p)/ecpb -479.34761 -479.34854 0.59
B3LYP/cc-pvTZ/ecpb -479.39169 -479.39275 0.61
[(C6F5Te)2]+ (14c) B3LYP/6-311+G(d,p)/ecpb -1471.92486 -1471.92528 0.26
B3LYP/cc-pvTZ/ecpb -1472.04091 -1472.04151 0.37
(a) Se: rel. corrected core potential for 28 electrons, 14s10p2d1f[3s3p2d1f] basis set.
(b) Te: rel. corrected core potential for 46 electrons, 15s11p3d1f[3s3p2d1f] basis set.
24
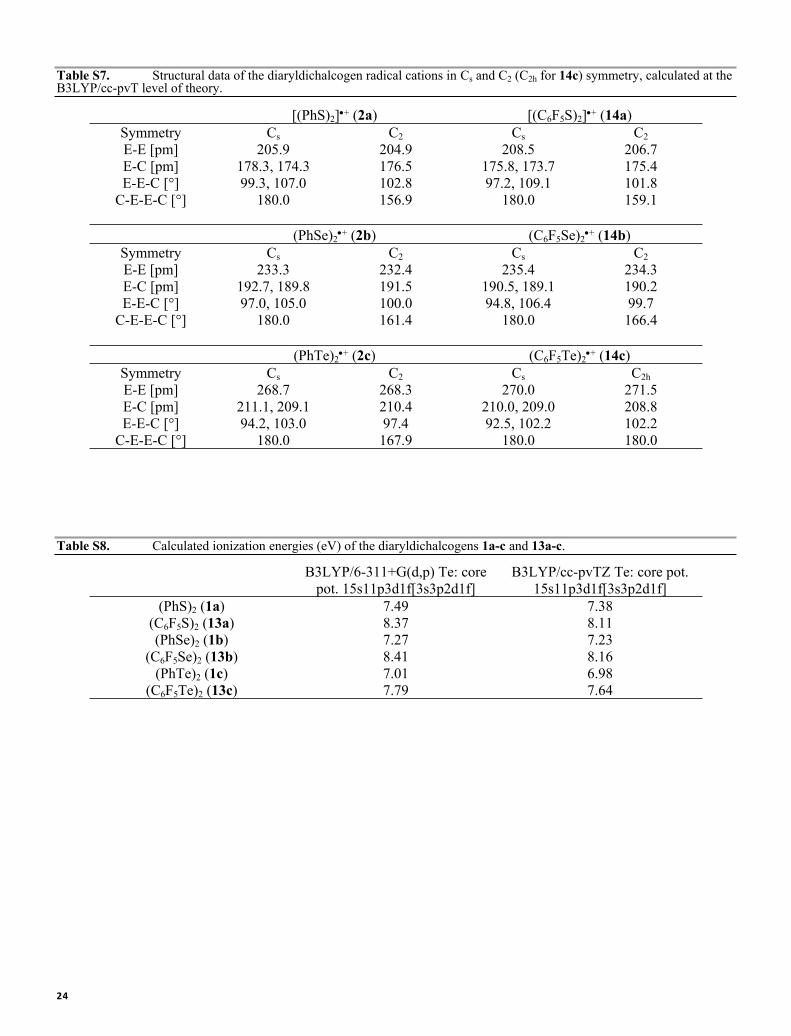
Table S7. Structural data of the diaryldichalcogen radical cations in Cs and C2 (C2h for 14c) symmetry, calculated at the B3LYP/cc-pvT level of theory.
[(PhS)2]+ (2a) [(C6F5S)2]+ (14a)Symmetry Cs C2 Cs C2E-E [pm] 205.9 204.9 208.5 206.7E-C [pm] 178.3, 174.3 176.5 175.8, 173.7 175.4E-E-C [°] 99.3, 107.0 102.8 97.2, 109.1 101.8
C-E-E-C [°] 180.0 156.9 180.0 159.1
(PhSe)2+ (2b) (C6F5Se)2
+ (14b)Symmetry Cs C2 Cs C2E-E [pm] 233.3 232.4 235.4 234.3E-C [pm] 192.7, 189.8 191.5 190.5, 189.1 190.2E-E-C [°] 97.0, 105.0 100.0 94.8, 106.4 99.7
C-E-E-C [°] 180.0 161.4 180.0 166.4
(PhTe)2+ (2c) (C6F5Te)2
+ (14c)Symmetry Cs C2 Cs C2hE-E [pm] 268.7 268.3 270.0 271.5E-C [pm] 211.1, 209.1 210.4 210.0, 209.0 208.8E-E-C [°] 94.2, 103.0 97.4 92.5, 102.2 102.2
C-E-E-C [°] 180.0 167.9 180.0 180.0
Table S8. Calculated ionization energies (eV) of the diaryldichalcogens 1a-c and 13a-c.
B3LYP/6-311+G(d,p) Te: core pot. 15s11p3d1f[3s3p2d1f]
B3LYP/cc-pvTZ Te: core pot. 15s11p3d1f[3s3p2d1f]
(PhS)2 (1a) 7.49 7.38(C6F5S)2 (13a) 8.37 8.11(PhSe)2 (1b) 7.27 7.23
(C6F5Se)2 (13b) 8.41 8.16(PhTe)2 (1c) 7.01 6.98
(C6F5Te)2 (13c) 7.79 7.64
25
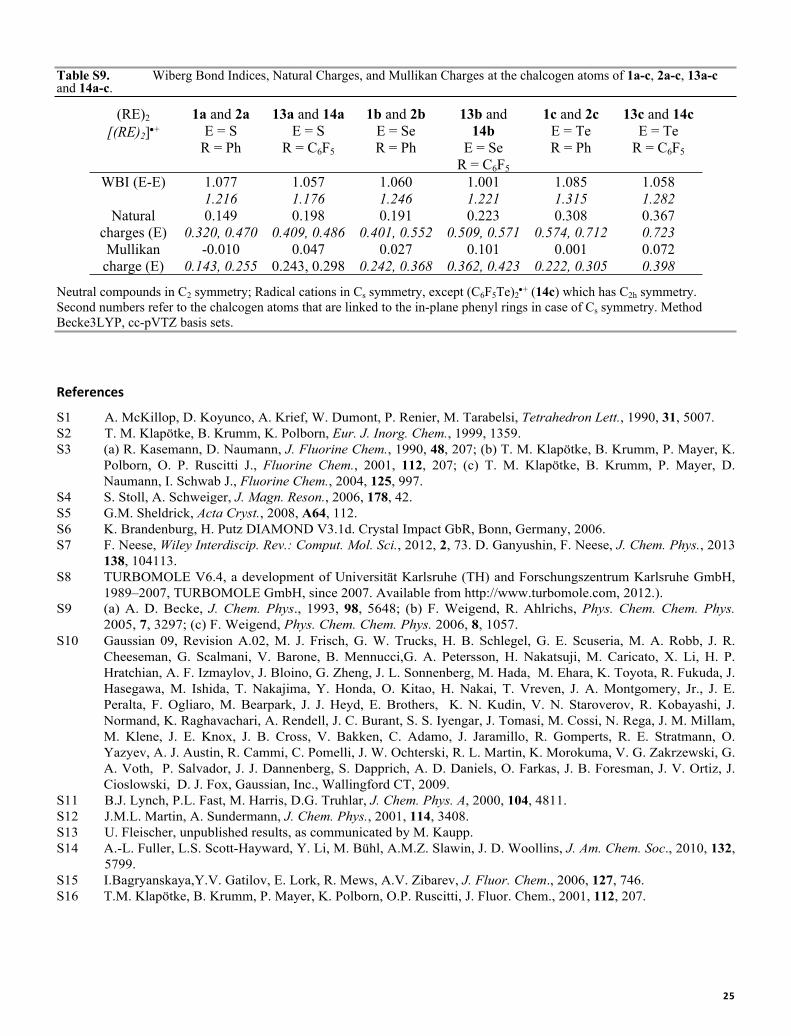
Table S9. Wiberg Bond Indices, Natural Charges, and Mullikan Charges at the chalcogen atoms of 1a-c, 2a-c, 13a-c and 14a-c.
(RE)2 [(RE)2]+
1a and 2aE = S
R = Ph
13a and 14aE = S
R = C6F5
1b and 2bE = SeR = Ph
13b and 14b
E = SeR = C6F5
1c and 2cE = TeR = Ph
13c and 14cE = Te
R = C6F5
WBI (E-E) 1.0771.216
1.057 1.176
1.060 1.246
1.001 1.221
1.085 1.315
1.058 1.282
Natural charges (E)
0.1490.320, 0.470
0.1980.409, 0.486
0.1910.401, 0.552
0.2230.509, 0.571
0.3080.574, 0.712
0.3670.723
Mullikan charge (E)
-0.0100.143, 0.255
0.0470.243, 0.298
0.0270.242, 0.368
0.1010.362, 0.423
0.0010.222, 0.305
0.0720.398
Neutral compounds in C2 symmetry; Radical cations in Cs symmetry, except (C6F5Te)2+ (14c) which has C2h symmetry.
Second numbers refer to the chalcogen atoms that are linked to the in-plane phenyl rings in case of Cs symmetry. Method Becke3LYP, cc-pVTZ basis sets.
References
S1 A. McKillop, D. Koyunco, A. Krief, W. Dumont, P. Renier, M. Tarabelsi, Tetrahedron Lett., 1990, 31, 5007.S2 T. M. Klapötke, B. Krumm, K. Polborn, Eur. J. Inorg. Chem., 1999, 1359.S3 (a) R. Kasemann, D. Naumann, J. Fluorine Chem., 1990, 48, 207; (b) T. M. Klapötke, B. Krumm, P. Mayer, K.
Polborn, O. P. Ruscitti J., Fluorine Chem., 2001, 112, 207; (c) T. M. Klapötke, B. Krumm, P. Mayer, D. Naumann, I. Schwab J., Fluorine Chem., 2004, 125, 997.
S4 S. Stoll, A. Schweiger, J. Magn. Reson., 2006, 178, 42.S5 G.M. Sheldrick, Acta Cryst., 2008, A64, 112.S6 K. Brandenburg, H. Putz DIAMOND V3.1d. Crystal Impact GbR, Bonn, Germany, 2006.S7 F. Neese, Wiley Interdiscip. Rev.: Comput. Mol. Sci., 2012, 2, 73. D. Ganyushin, F. Neese, J. Chem. Phys., 2013
138, 104113.S8 TURBOMOLE V6.4, a development of Universität Karlsruhe (TH) and Forschungszentrum Karlsruhe GmbH,
1989–2007, TURBOMOLE GmbH, since 2007. Available from http://www.turbomole.com, 2012.).S9 (a) A. D. Becke, J. Chem. Phys., 1993, 98, 5648; (b) F. Weigend, R. Ahlrichs, Phys. Chem. Chem. Phys.
2005, 7, 3297; (c) F. Weigend, Phys. Chem. Chem. Phys. 2006, 8, 1057. S10 Gaussian 09, Revision A.02, M. J. Frisch, G. W. Trucks, H. B. Schlegel, G. E. Scuseria, M. A. Robb, J. R.
Cheeseman, G. Scalmani, V. Barone, B. Mennucci,G. A. Petersson, H. Nakatsuji, M. Caricato, X. Li, H. P. Hratchian, A. F. Izmaylov, J. Bloino, G. Zheng, J. L. Sonnenberg, M. Hada, M. Ehara, K. Toyota, R. Fukuda, J. Hasegawa, M. Ishida, T. Nakajima, Y. Honda, O. Kitao, H. Nakai, T. Vreven, J. A. Montgomery, Jr., J. E. Peralta, F. Ogliaro, M. Bearpark, J. J. Heyd, E. Brothers, K. N. Kudin, V. N. Staroverov, R. Kobayashi, J. Normand, K. Raghavachari, A. Rendell, J. C. Burant, S. S. Iyengar, J. Tomasi, M. Cossi, N. Rega, J. M. Millam, M. Klene, J. E. Knox, J. B. Cross, V. Bakken, C. Adamo, J. Jaramillo, R. Gomperts, R. E. Stratmann, O. Yazyev, A. J. Austin, R. Cammi, C. Pomelli, J. W. Ochterski, R. L. Martin, K. Morokuma, V. G. Zakrzewski, G. A. Voth, P. Salvador, J. J. Dannenberg, S. Dapprich, A. D. Daniels, O. Farkas, J. B. Foresman, J. V. Ortiz, J. Cioslowski, D. J. Fox, Gaussian, Inc., Wallingford CT, 2009.
S11 B.J. Lynch, P.L. Fast, M. Harris, D.G. Truhlar, J. Chem. Phys. A, 2000, 104, 4811.S12 J.M.L. Martin, A. Sundermann, J. Chem. Phys., 2001, 114, 3408.S13 U. Fleischer, unpublished results, as communicated by M. Kaupp.S14 A.-L. Fuller, L.S. Scott-Hayward, Y. Li, M. Bühl, A.M.Z. Slawin, J. D. Woollins, J. Am. Chem. Soc., 2010, 132,
5799.S15 I.Bagryanskaya,Y.V. Gatilov, E. Lork, R. Mews, A.V. Zibarev, J. Fluor. Chem., 2006, 127, 746.S16 T.M. Klapötke, B. Krumm, P. Mayer, K. Polborn, O.P. Ruscitti, J. Fluor. Chem., 2001, 112, 207.