Graphene Enabled Low-Control Quantum Gates between Static ...

1
Supporting Information for
Graphene Surface-Enabled Lithium Ion-Exchanging Cells: Next- Generation High-Power Energy Storage Devices
Bor Z. Jang,*,‡ Chenguang Liu,‡ David Neff,‡ Zhenning Yu,§ Ming C. Wang,§ Wei Xiong,§ and Aruna Zhamu‡,§
‡ Nanotek Instruments, Inc., and §Angstron Materials, Inc., 1242 McCook Ave., Dayton, Ohio 45404
* Corresponding Authors: [email protected] or
Additional Background Information
Graphene for Supercapacitor Application A single-layer graphene sheet provides a specific external surface area of up to
approximately 2,675 m2/g (that is potentially accessible by liquid electrolyte), as opposed to the exterior surface area of approximately 1,300 m2/g provided by a corresponding single-wall CNT (interior surface not readily accessible by electrolyte)1. In 2006, our research group reported graphene-based electrodes for both EDL and redox supercapacitors2, which has since become a topic of intensive research3-9. Significant progress has been made using pseudo-capacitance (e.g. redox pairs between graphene or graphene oxide and either polyaniline7,8 or MnO2
6) and ionic liquid electrolyte with a high operating voltage3,9 for improved energy density. However, these supercapacitors do not operate on the exchange of lithium ions between the two electrodes and have yet to exhibit a sufficiently high energy density or power density for EV and renewable energy applications.
Graphene for Battery Applications In prior investigations10-17, non-functionalized graphene was used as either an anode active
material or a supporting material for an anode active material (e.g., Si particles) or cathode active material (e.g., LiFePO4, also a lithium intercalation compound). In these earlier studies10-17, lithium ions are intercalated into the interior crystal structure of a lithium intercalation compound and the insertion or extraction procedure is slow (solid-state diffusion coefficients being excessively low). Most recently, Bhardwaj et al.18 reported an anode material based on un-zipped multi-walled ribbons, which stores lithium by intercalating lithium ions into inter-graphene spaces. Bhardwaj et al. believe that the oxygen-containing groups at the exposed ribbon edges serve to form permanent, non-reversible solid-electrolyte interface (SEI) layer to protect and stabilize this anode active material. None of these devices rely on surface active sites that readily capture lithium ions from electrolyte in a reversible manner. Due to this slow process of lithium diffusion in and out of these intercalation compounds, these conventional lithium ion batteries do not exhibit a high power density and the batteries require a long re-charge time.
Herein reported is a strategy that obviates the need for lithium ions to enter the interior of cathode active materials by enabling the surfaces of graphene and several other carbon nano materials to capture and store lithium ions thereon through a reversible redox reaction between

2
surface-borne functional groups and lithium ions. The concentration of functional groups dictates the energy density and, to a great extent, the power density as well.
Experimental Details Oxidized NGP or graphene oxide (GO) was prepared with a modified Hummers’ method that
involved exposing the starting graphitic materials to a mixture of sulfuric acid, sodium nitrate, and potassium permanganate at a ratio of 4:1:0.1 for 72 hours. The resulting GO was then thoroughly rinsed with water to obtain GO suspension, which was followed by two different routes of material preparation. One route involved subjecting the GO suspension to ultrasonication and chemical reduction to obtain isolated graphene sheets suspended in water (for Cell-N). The other route involved spray-drying GO suspension to obtain graphite intercalation compound (GIC) or GO powder. The GIC or GO powder was then thermally exfoliated at 1,050°C for 45 seconds (Cell-G). Artificial mesophase graphite and carbon fibers were also oxidized and exfoliated to separate oxidized graphene sheets (Cell-M and Cell-C, respectively). Carbon black (CB) was subjected to a chemical treatment similar to the Hummers’ method to open up nano-gates, enabling electrolyte access to the interior (Cell t-CB).
Each electrode, composed of 85% graphene, 5% Super-P (AB-based conductive additive), and 10% PTFE, was coated on a 1.54 cm2 Al foil disk. The thickness of the electrode was typically around 150-200 µm, but an additional series of samples with thicknesses of approximately 80, 100, 150 µm was prepared to evaluate the effect of electrode size on the power and energy densities of the resulting supercapacitor-battery cells. Electrodes as thin as 20 µm were also made for comparison. The electrode was dried in a vacuum oven at 120oC for 12 hours before use. The negative electrode was Li metal supportd on a layer of graphene sheets. Coin-size cells were assembled in a glove box using 1M LiPF6/EC+DMC as electrolyte.
The capacity was measured with galvanostatic experiments using an Arbin SCTS electrochemical testing instrument. Cyclic voltammetry (CV) was conducted on a CH Instruments 660 electrochemical workstation. Scanning electron microscopy (SEM, Hitachi S-4800), transmission electron microscopy (TEM, Hitachi H-7600), FTIR (PerkinElmer GX FT-IR), Raman spectroscopy (Renishaw inVia Reflex Micro-Raman), and atomic force microscopy were used to characterize the chemical compositions and microstructure of the NGP and exfoliated graphite samples. The electrode materials are characterized and their properties are summarized in Table S1 below: Table S1 Cathode weight, thickness, oxygen content, and specific surface area of SMC cells.
Cell Composition Cathode mass in a button cell
Oxygen content
surface area
Cathode thickness
mg Wt.% m2/g µm
G Thermally exfoliated natural graphite 7.1 12.9 340 205
M Exfoliated Mesophase carbon (artificial graphite) 3 28.76 382 150‐250
C Exfoliated carbon fiber 3.2 20.83 310 155
N Chemically reduced graphene from oxidized natural graphite
0.4‐2.3, multiple cells 2‐ 7 600‐900 70‐280
CB carbon black 9.6 11.5 122 180
t‐CB treated carbon black 4.3 12.5 300 140
AC activated carbon 5.5 19.83 1200 140

3
Calculations Galvanostatic charge/discharge tests were used to evaluate electrochemical performance of various supercapacitor-batteries. Optionally, the cells were held at a constant voltage of 1.5 V for ten minutes before each charge step and at 4.5 V before each discharge step to ensure the previous discharge or charge stage had been completed. The results obtained are expressed as capacitance, capacity, energy, and power per unit mass of total cathode material (active material, conductive filler, and binder) or per unit mass of the cell (total weights of electrodes, separator-1.2mg/cm2, electrolyte, and current collectors-7.2mg/cm2 combined; using subscript cell). For the coin cells with very thin electrodes (< 50 µm), it would have been improper to use the total cell weight by simply adding all the experimental component weights together since the same current collectors used for thicker electrodes would occupy weights that are out-of-proportion (with active material amounts being too little). To fairly approximate the total cell weight, the cathode active material weight was multiplied by a factor of 5.
For the galvanostatic tests, the specific capacity (q) is calculated according to: mtIq / (S1)
where I is the constant current in mA, t is the time in hours, and m is the cell mass in grams as defined above. With voltage V, the specific energy (E) is calculated as,
VdqE (S2)
The specific power (P) can be calculated as tEP / (S3)
where t is the total charge or discharge step time. The specific capacitance (C) of the cell is proportional to the slope at each point of the voltage- vs.-specific capacity plot. Values reported in this paper use the slope near the center of the discharge curve.
Additional Research Results and Discussion
Electrochemical performance of different types of surface-enabled cells
Figure S1 Charge/discharge curves of a) Cell G, b) Cell M, and c) Cell C at various current densities.

4
Figure S2 Cyclic voltammetry plots of a) Cell G, b) Cell M, and c) Cell C at scan rates of 5, 25 and 100 mV/s.
0
20
40
60
80
100
120
0 200 400 600 800 1000
Cap
acit
y R
eten
tio
n (
%)
Cycle Number
Cell NCell ACCell M
Figure S3 Cycle performance of Cell N, Cell AC, and Cell M. Measurements were taken once every 100 cycles during a 0.1 A/g charge and discharge. A 30 minute constant voltage hold step was used before each charge and discharge. All other cycles, were run directly at an accelerated rate of 1 A/g. This procedure was used to compare our data with those of Lee, et al34. After 1,000 cycles, the retention of capacity remains over 95%, which illustrates the good stability of the electrode. With cells N and AC, the capacity actually increased. A possible explanation for this is that during the test, the lithium ions gradually penetrated into more nanopores and space between graphene sheets to access surface area that was not initially avaliable.
Effect of chemical reduction of graphite oxide FTIR spectroscopy provided evidence of the presence of different types of oxygen functionalities on the oxidized graphene materials. The structure change is further supported by the Raman spectroscopic analysis. Figure S4 shows the Raman spectra obtained for original graphite, oxidized graphite, and reduced graphene oxide material. Raman spectroscopy was used to further investigate the possible change in structure after oxidation (and possible further change due to reduction) as it is a powerful tool for characterizing the structure of carbon materials. The Raman spectra of the graphene before and after reduction were compared with the starting material; all three samples were excited by a laser with a wavelength of 514 nm. As shown in

5
Figure S4, the Raman spectra of the graphene before and after reduction exhibit well defined D and G peaks, as well as the disappearance of the peak at about 2600 cm-1. This result suggests that the symmetry of the oxidized and reduced graphene has been broken and that the structure of graphitic material has been changed after an oxidation treatment to generate functional groups on its surface. The behavior is very similar to the results observed for GO and reduced GO with a broadened G band (1594 cm-1) after oxidation along with the appearance of the D band at 1363 cm-1. This means the reduction in size of the in-plane sp2-carbon domains due to the oxidation. The intensity ratio of the ID/IG increases as the level of oxidation increases. After reduction, both G and D bands are still prominent with an increased ID/IG intensity ratio comparable to that of the oxidized form, in agreement with previously reported results18-20. This is expected and is caused by a decrease in the average size of the sp2 domains upon oxidation relative to the pristine material.
500 1000 1500 2000 2500
Original graphite Oxidized graphite reduced graphene
Inte
nsi
ty (
a.u
.)
Raman Shift (cm-1) Figure S4 Raman spectra obtained for original graphite, oxidized graphite, and reduced graphene oxide material.
Kinetics in Surface-Enabled Lithium Ion-Exchanging Cells (Some Theoretical
Considerations)
Within the liquid electrolyte of either a conventional lithium-ion battery or the new surface-enabled cell, the migration rate of Li+ ions is determined by the ion mobility driven by an electrochemical potential difference and diffusion of ions against concentration gradients between an anode and a cathode. For a conventional lithium-ion cell (Figure S5a), one must consider electron mobility, ion mobility, and diffusion of ions against concentration gradients within the solid particles. For a surface-enabled cell (Figure S5b), the surface functional group-Li reaction rate (e.g. to form a surface redox pair) or Li+ ion adsorption rate on a functional material surface must be considered.

6
anode currentcollector
cathode currentcollector
ion migration inliquid electrolyte
surface de-sorptionor redox pair breakup
surface adsorption orredox pair formation
nano-structured cathodenano-structured anode
de-intercalation(solid-state diffusion/migration)
intercalation (solid-state diffusion/migration)
ion migration inliquid electrolyte(A)
(B)
porousseparator
Figure S5 a) The discharge process of a conventional lithium-ion cell requires de-intercalation of Li ions out of an anode particle (e.g., graphite), migrating through liquid electrolyte, and intercalation into the bulk of a solid cathode particle, and b) only liquid electrolyte is required in a surface-mediated, ion-exchanging cell.
For describing the ion transport in an electrochemical cell, the Nernst–Planck (NP) equation may be more accurate than the Fick’s law alone, which is for concentration-driven diffusion only. This NP equation describes the flux of ions under the influence of both an ion concentration gradient c and an electric field E . The NP equation given below extends Fick's law of diffusion for the case where the diffusing particles are also moved with respect to the fluid by electrostatic forces21-23:
cTk
DzeuccD
t
c
B
(S4)
Where t is time, D is the diffusivity of the chemical species, c is the concentration of the species, and u is the velocity of the fluid, z is the valence of ionic species, e is the elementary charge, KB is the Boltzmann constant and T is the absolute temperature. If the diffusing particles are themselves charged they influence the electric field on moving. Hence the NP equation can be applied to describe the ion flow kinetics. With no net fluid velocity inside a cell (u = 0), the Nernst-Planck flux of the ions in the electrolyte may be expressed as:
)]/()/([ xCxCDJtotal = )]/)(/()/([ xRTCDFxCD
(S5)
Where C = ion concentration and Φ = electric potential. In this problem, the combined effects of diffusion and migration of charge carriers should be additive.
For lithium ion migration, we have:
11 X
CX
CDJ
LiLiLi
LiLi (S6)
where the diffusion coefficient DLi+ and the mobility µLi+ are assumed to be constant. With the Nernst-Einstein relation, the mobility of species i can be expressed in terms of its diffusivity µi = ziFDi/RT. Here, R denotes the universal gas constant, and F the Faraday’s constant. Since lithium is of mono-valance, z = 1.

7
A more useful version of this equation from the perspective of electrochemistry can be obtained by multiplying molar flux by z and F, which changes flux of material to flux of charges, which is (by definition) electric current, I = zF(Jtotal):
)]/()/()/([)]/()/([ 22 xCRTDFzxCzFDxCFzxCRTI (S7) where I is defined as current density in units of A/cm2. The electrolyte in a surface-mediated cell permeates into the interior of both the cathode and the anode. If both the charging and discharging processes are not surface reaction-limited, the sweeping of lithium ions from one electrode to another is dictated by Eq. (S7). With the electrode being typically very thin (20-200 µm), the electric field strength (∂Φ/∂x) can be very high. With a high lithium ion mobility in liquid electrolyte (significantly higher than the mobility of essentially all other anions or cations commonly encountered in supercapacitors) and an extra source of Li ions (yielding a high C value), the second term in Eq. (S7) provides a high flux during discharge or charge.
Diffusion in and out of a solid particle (intercalation and de-intercalation): Lithium ion flux in a solid intercalation compound electrode of a conventional lithium-ion battery may be reasonably described by Fick’s first law of diffusion24. Within a particle of micron or nanometer in size in a particular electrode (say, cathode), the electrochemical potential is relatively uniform from the particle surface to the center (The potential gradient largely exists between the anode and the cathode). Hence, the second term in Eq. (S7) may be assumed to be zero. Conservation of mass and the assumption of a constant diffusion coefficient lead to Fick’s 2nd Law of Diffusion: (∂C/∂t) =D (∂2C/∂x2). Although electrons for intercalated lithium are dislocated, we may think of intercalated lithium ions as formally neutral particles. During the discharge cycle of a lithium-ion battery, lithium ions must diffuse out of an anode active material particle (diameter = da and the average diffusion distance = da/2) and then migrate across the anode layer thickness in liquid electrolyte (anode layer thickness = La and the average migration distance = La/2). Subsequently, lithium ions must move across a porous separator (thickness = Lc), migrate across part of the cathode thickness (Lc) to reach a particular cathode active material particle (average migration distance = Lc/2), and then diffuse into the particle (diameter = dc and the average diffusion distance required = dc/2). During re-charge, the lithium ions move in the opposite direction, but must travel approximately the same distances. Although electric filed-driven migration of Li ions in liquid electrolyte is fast, the solid-state intercalation/de-intercalation processes are very slow. In order to gain some understanding of the diffusion rates of metal ions into and out of a solid particle, for simplicity, we may assume a semi-infinite diffusion case where the ion concentration on the particle surface is maintained at a value of Cs and the concentration at the center is zero initially for a particle being intercalated. Then, the concentration profile may be given as: C(x,t)/Cs = 1 – erf [x/(2√Dt)] (S8) Where erf[z] = error function of z, and the required travel distance, x may be taken as the particle radius (dc/2 or da/2). If we desire to estimate the required diffusion time for the particle center to reach a concentration that is 80% of the surface concentration, i.e., C(x,t)/Cs = 0.8, then Eq.(5) yields t ~ 2.8·x2/D. If C(x,t)/Cs = 0.5 is desired, we have t ~ x2/D. In general, the required characteristic diffusion time inside a solid particle may be given as t ~ y·x2/D (y ~ 1.0 – 3.0, as a first-order of approximation assuming Fick’s Law dictating intercalation). Then, the total required time scale for a lithium ion to complete a charge or discharge process may be given as (taking y ~ 1.0): ccaaeelectrolyttotal DdDdtt /)2/(/)2/( 22 (S9)

8
where telectrolyte = the total Li ion migration time in liquid electrolyte, Da = Li ion diffusion coefficient in an anode active material particle, and Dc = Li ion diffusion coefficient in a cathode active material particle. The first term in Eq. (S9) is normally very small, orders of magnitude smaller than the second and third terms. The upper limit of telectrolyte can be estimated by using telectrolyte ~ y·xe
2/De (y ~ 3.0) with xe = the distance between the anode center and the cathode center and De = Li ion diffusion coefficient in liquid electrolyte. The real value of telectrolyte is expected to be smaller than (y· xe
2/De) since the electric field strength-induced flux provides additional and often dominating contribution to the lithium ion migration between the two electrodes. This is further illustrated below:
Li ion diffusion in liquid electrolyte: Equation (S5) is not the usual form of the Nernst-Planck equation because it does not deal with singly charged species. The concentration c in the first term on the right-hand side of Eq. (S5) represents a composite concentration of mobile charge carriers. If we regard c as a function of x and t and take the negative gradient of Eq. (S5) with respect to x, we obtain a generalization of Fick’s second law:
)/(/),( RTCDFttxC ∂2CΦ/∂x2 )/)(/)(/( xxCRTFD +D∂2C/∂x2 (S10)
If we assume no net charge within the electrolyte (excluding the interfaces), according to the Poisson equation, the first term on the right of Eq. (S10) will be zero. Under these conditions the potential gradient will be uniform and we can also set ∂Φ/∂x = ΔΦ/xe (xe = anode center-to-cathode center separation) to obtain:
ttxC /),( )/)(/)(/( xxCRTFD + D∂2C/∂x2 (S11) With the boundary conditions of C(x,0)x=0 = Cs, C(xe,0) = 0, and [∂C(x,t)/∂x]x=xe = 0, and using Laplace transformation of Eq.(S11), one obtains a solution to the above equation for the current density at the anode center during discharge:
I/Atotal = (2 noFD/xe2) exp{-(De/xe
2)[(π2/4) + (FΔΦ/RT)(FΔΦ/4RT- 1)] t} (S12) Where no = initial number of moles of metal ions to be exchanged between electrodes, Atotal = total surface area of an electrode, and ΔΦ is a negative value during discharge. It may be noted that ΔΦ can vary with time, but was assume to be a constant in the present calculations to simplify the procedures of derivations and computations. For the surface-enabled cells, the electrochemical potential difference is typically varied between 1.5 and 4.5 volts. An average of 3.0 volts can be assumed. For convenience, Eq. (S12) may be re-written as:
I/Io = exp{-(De/xe2)[(π2/4) + (FΔΦ/RT)(FΔΦ/4RT- 1)] t} (S12a)
One may reasonably state that migration of cations (Li+) from the anode to the cathode has been completed if and when the current density at the anode side is reduced to 1% of its initial value; i.e. I/Io < 0.01. This condition leads to (De/xe
2)[(π2/4) + (FΔΦ/RT)(FΔΦ/4RT- 1)] t = 4.6, or: t = 4.6 (xe
2/De)[(π2/4) + (FΔΦ/RT)(FΔΦ/4RT- 1)]-1. (S13)
Numerical examples Representative diffusion coefficients of Li+ in or through various liquid mediums or solid particles are given below (based on open literature data): liquid electrolyte (2 x 10⁻⁶ cm2/s)25-27;
LiFePO4 cathode (10-13 cm2/s)28,29; Li3V2(PO4)3 cathode (10−13 to 10−9 cm2/s)30; nano-Si anode (10−12 cm2/s)31; graphite anode (1-4 x 10⁻¹⁰ cm2/s)32; and Li4Ti5O12 anode (1.3 x 10⁻¹¹ cm2/s)33.
This implies that, for a conventional lithium-ion battery cell wherein LiFePO4 particles (as an example) are used as a cathode active material, the last term, (dc/2)2/Dc, in equation (S9) dominates the required total diffusion time due to its excessively low diffusion coefficient.

9
In contrast, in a surface-enabled device containing nano-structured electrodes, Li ions do not have to diffuse through a solid-state electrode particle and, hence, are not subject to the limitation of a low solid-state diffusion coefficient (e.g. 10-13 cm2/s in a LiFePO4 particle). Instead, both the cathode and anode in the new device are highly porous, having liquid electrolyte reaching the interior of the pores where the functional groups are present to readily and reversibly react with lithium ions that migrate into these pores through a liquid medium (not solid) with a high diffusion coefficient (e.g., 2 x 10⁻⁶ cm2/s). In such a device, the second and third terms in equation (4) are non-existing. The required total diffusion time is now dictated by the first term, which is closely related to the thicknesses of the electrodes and the separator. The above discussion is based on the premise that the reversible reaction between a functional group and a lithium ion in the electrolyte is fast, and the whole charge-discharge process is not surface reaction-controlled. By plugging representative values of the various parameters in Eq. (S9), we obtain the total lithium diffusion time required of a cell charge or discharge process for several conventional lithium-ion battery types and several surface-enabled cells. The calculation results are shown in Figure S6-S8.
Conventional Li-ion battery (graphite anode and LiFePO4 cathode) Conventional lithium ion batteries featuring a micron-sized graphite anode (diameter = 10 µm) and a micron-sized LiFePO4 (particle diameter = 1 µm) would require several hours (e.g. 7.29 h) to complete the required processes of intercalation in one electrode and de-intercalation in the other electrode (Figure S6a). This serves to explain why conventional lithium ion batteries exhibit very low power densities (typically 100-1,000 W/Kg). This problem of a long diffusion time can be partially alleviated by using nano-scaled particles (e.g., 25 minutes if the particle LiFePO4 diameter is reduced to 100 nm). Similar phenomena were observed with conventional Li4Ti5O12/LiFePO4 cell (Figure S6b). The total intercalation/de-intercalation time of the cell can be reduced from 7 hours to 4 minutes if the diameter of both Li4Ti5O12 and LiFePO4 particles is reduced from 1 µm to 100 nm.
a) b)
Figure S6 a) The required solid-state intercalation/de-intercalation times of Li ions in the anode active material (graphite, particle diameter = 10 µm) and the cathode active material (LiFePO4) plotted as a function of the LiFePO4 particle diameter, and b) the required solid-state intercalation/de-intercalation times of Li ions in the anode active material (Li4Ti5O12) and the cathode active material (LiFePO4) plotted as a function of the particle diameters of LiFePO4 and Li4Ti5O12. Lithium-ion capacitor cells In contrast, for a lithium-ion capacitor (LIC) featuring a functionalized nano carbon cathode (e.g. f-CNT, f-NGP, or f-AC) and a Li4Ti5O12 (LTO) anode, the required intercalation/de-

10
intercalation times are calculated to be between 192 sec (< 3.5 minutes) for a cathode thickness of 100 µm and an anode particle diameter of 1 µm, and 1.92 sec for an anode diameter of 100 nm (Figure S7). This is 2 orders of magnitude faster than the conventional lithium-ion batteries even when both their anode and cathode particles have a diameter of 100 nm.
Figure S7 The required solid-state intercalation/de-intercalation times of Li ions in the anode active material (Li4Ti5O12) of a partially surface-enabled cell plotted as a function of the anode particle diameter.
Fully surface-enabled, Li ion-exchanging cells For the fully surface-mediated cells, the electrode thickness is a dominating factor. For instance, in the case of using f-NGP as the electrodes (Figure S8a), the total migration time of Li ions in liquid electrolyte (driven both by concentration gradient and electrochemical potential differential) is 1.27 seconds if the cathode and anode are each 200 µm thick, and separator is 100 µm thick (anode center-to-cathode center = 300 µm). The migration time is reduced to 0.318 sec if the anode = cathode thickness = 100 µm and separator thickness = 50 µm. The migration time would be reduced to 0.035 sec if the electrode center-to-center distance is made to be 50 µm for an ultra-thin cell, which is very achievable. Figure S8b indicates that the electrochemical potential differential between the anode and the cathode can have a significant effect on the ion migration time in liquid electrolyte. a) b)
Figure S8 a) The estimated migration time of Li ions in the liquid electrolyte of a fully surface-mediated cell plotted as a function of the separation between the anode center and the cathode center (½ anode + separator + ½ cathode thickness), indicating that with the electrode thickness of 100 µm each and separator thickness 50 µm, the liquid diffusion time can be less than 1 sec (using Nernst-Planck Eq.), and b) the effect of electrode potential differential between the anode and the cathode on the ion migration time in liquid electrolyte.
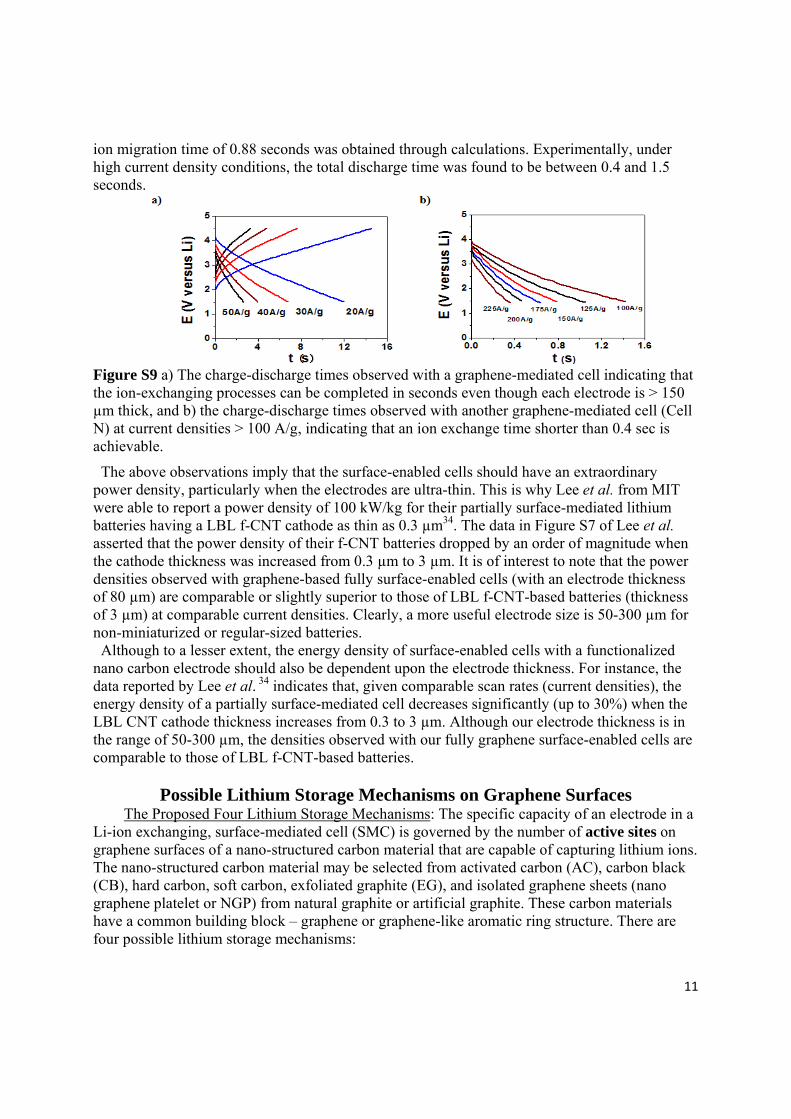
The experimental charge and discharge time data shown in FigureS9a and b are consistent with the calculation results. For a cell with an anode center-to-cathode center distance of 250 µm, an
11
ion migration time of 0.88 seconds was obtained through calculations. Experimentally, under high current density conditions, the total discharge time was found to be between 0.4 and 1.5 seconds.
Figure S9 a) The charge-discharge times observed with a graphene-mediated cell indicating that the ion-exchanging processes can be completed in seconds even though each electrode is > 150 µm thick, and b) the charge-discharge times observed with another graphene-mediated cell (Cell N) at current densities > 100 A/g, indicating that an ion exchange time shorter than 0.4 sec is achievable.
The above observations imply that the surface-enabled cells should have an extraordinary power density, particularly when the electrodes are ultra-thin. This is why Lee et al. from MIT were able to report a power density of 100 kW/kg for their partially surface-mediated lithium batteries having a LBL f-CNT cathode as thin as 0.3 µm34. The data in Figure S7 of Lee et al. asserted that the power density of their f-CNT batteries dropped by an order of magnitude when the cathode thickness was increased from 0.3 µm to 3 µm. It is of interest to note that the power densities observed with graphene-based fully surface-enabled cells (with an electrode thickness of 80 µm) are comparable or slightly superior to those of LBL f-CNT-based batteries (thickness of 3 µm) at comparable current densities. Clearly, a more useful electrode size is 50-300 µm for non-miniaturized or regular-sized batteries. Although to a lesser extent, the energy density of surface-enabled cells with a functionalized nano carbon electrode should also be dependent upon the electrode thickness. For instance, the data reported by Lee et al. 34 indicates that, given comparable scan rates (current densities), the energy density of a partially surface-mediated cell decreases significantly (up to 30%) when the LBL CNT cathode thickness increases from 0.3 to 3 µm. Although our electrode thickness is in the range of 50-300 µm, the densities observed with our fully graphene surface-enabled cells are comparable to those of LBL f-CNT-based batteries.
Possible Lithium Storage Mechanisms on Graphene Surfaces The Proposed Four Lithium Storage Mechanisms: The specific capacity of an electrode in a
Li-ion exchanging, surface-mediated cell (SMC) is governed by the number of active sites on graphene surfaces of a nano-structured carbon material that are capable of capturing lithium ions. The nano-structured carbon material may be selected from activated carbon (AC), carbon black (CB), hard carbon, soft carbon, exfoliated graphite (EG), and isolated graphene sheets (nano graphene platelet or NGP) from natural graphite or artificial graphite. These carbon materials have a common building block – graphene or graphene-like aromatic ring structure. There are four possible lithium storage mechanisms:

12
Mechanism 1: The geometric center of a benzene ring in a graphene plane is an active site for a lithium atom to adsorb onto;
Mechanism 2: The defect site on a graphene sheet is capable of trapping a lithium ion; Mechanism 3: The cations (Li+) and anions (from a Li salt) in the liquid electrolyte are
capable of forming electric double layers of charges near the electrode material surfaces; Mechanism 4: A functional group on a graphene surface/edge can form a redox pair with
a lithium ion. Surface Adsorption Mechanism (Mechanism 1): Based on first principle density functional
theory calculations1,2, lithium atoms are capable of forming stable interactions with C atoms on a graphene plane. The results indicate that the Li–C bond in such a layer (without a functional group) would not result in an sp2 to an sp3 transition of carbon orbitals, but being more indicative of some ionic character for the covalent bond and with lithium acting as an electron acceptor in a bridging environment. Energy calculations indicate the possible stability of such Li atom-adsorbed graphene layers. The calculations also show that the Li-adsorbed graphene layer can be spontaneously formed. However, the two studies35,36 did not set an upper limit on the lithium atom-storing capacity of a graphene plane.
In this context, traditional intercalation-type graphite anode materials in a lithium-ion cell show a Li storage capacity of 372 mAh/g (x = 1 in LixC6) due to limited Li ion storage sites within sp2 hexagonal carbon structure. To surpass the “ion” site limitation, Sato, et al.37 proposed a Li2 covalent molecule model where each Li atom is trapped in one benzene ring (called a “covalent” site) and predicted Li storage capacity of 1,116 mA h/g (LiC2 or Li3C6) in disordered carbon. Various disordered carbon materials can be produced by pyrolysis of a carbon precursor, and enhancement of storage capacities (400-700 mAh/g) over graphite has been reported38. According to this somewhat controversial Li2 molecule model, the realization of 1,116 mAh/g is possible when the interlayer spacing of carbon materials is large enough (~ 0.4 nm). Nano graphene sheets with a large enough interlayer spacing induced by using a carbon nanotube or C60 spacer approach were found to show high Li storage capacities of 740-780 mAh/g39. Exfoliated graphite flakes and fully separated graphene sheets (NGPs) in the present study have inter-layer spacings far greater than 0.4 nm.
Lithium Ion Trapping at Defect Sites (Mechanism 2): Active defects such as edges and vacancies in carbonaceous materials have been suggested as capable of accommodating additional Li38. There are a large number of these defects or disorder sites in NGPs inevitably induced by the oxidation and reduction processes commonly used for graphene production. Pan et al.40 reported a high reversible capacity of 794-1054 mAh/g for heavily defected NGPs obtained by reduction of highly oxidized graphene oxide (GO).
Electric Double Layer (EDL) (Mechanism 3): The SMC electrolyte is typically composed of a lithium ion salt dissolved in a solvent. The electrolytic salts can be selected from lithium perchlorate (LiClO4), lithium hexafluorophosphate (LiPF6), lithium borofluoride (LiBF4), lithium hexafluoroarsenide (LiAsF6), and lithium trifluoro-metasulfonate (LiCF3SO3), etc. In principle, electric double layers (EDL) may be formed by cations (e.g. Li+) and their counter ions (e.g. PF6 - and BF4
- anions) and this EDL contribution to the energy storage capacity of a SMC cell is governed by the electrolytic salt concentration in solvent.
Formation of Redox Pairs (Mechanism 4): A surface redox reaction can occur between a lithium ion and a functional group, such as carbonyl (>C=O) or carboxylic group (-COOH). Carbonyl groups (>C=O) in organic and polymeric electrodes were found to be capable of readily reacting with lithium ions to form redox pairs41-44. According to Lee, et al.34, -COOH

13
groups on CNT surfaces are also capable of reversibly and rapidly forming a redox pair with a lithium ion (one lithium ion pairing up with one –COOH group) during the charge and discharge cycles of a battery.
The presence of functional groups, such as –COOH and >C=O, in chemically prepared graphene oxide have been well documented45,46. The formation of these functional groups is a natural result of the oxidizing reactions of graphite by sulfuric acid and strong oxidizing agents (e.g. nitric acid and potassium permanganate commonly used in the preparation of graphene oxide). Both un-separated graphite worms (exfoliated graphite) and the separated graphene sheets (NGPs) have surface- or edge-borne functional groups.
Our elemental analysis has indicated that the oxygen content in single-layer graphene oxide sheets is up to 46% by weight or 40 atomic %, implying that there are up to approximately four (4) O atoms for every six (6) C atoms. Since each of >C=O (containing 1 O atom) and –COOH (containing 2 O atoms) can react with one Li+ ion, and assuming equal numbers of >C=O and –COOH groups in GO sheets, only 2/3 of the O atoms are effective sites for a redox reaction. Hence, we could have a compound of Li8/3C6 = Li2.66C6, which corresponds to 992 mAh/g. (As a point of reference, the theoretical specific capacity of a conventional graphite anode is 372 mAh/g, corresponding to an intercalation compound Li1C6.) This implies that single-layer graphene oxide sheets, when used in a nano-structured electrode of a surface-mediated cell, can provide a lithium storage capacity of up to 992 mAh/g. Presumably, when the O-containing functional groups are removed by chemical reduction of GO sheets or EG worms, the original sites of these functional groups could become defect sites, remaining capable of trapping Li ions.
Given a sufficient amount of electrode surface areas, the maximum contribution of Mechanism 4 to the overall charge storage capacity is dictated by the concentration of cations or anions. The EDL mechanism typically contributes to 10-25% of the total lithium ion storage capacity of a SMC, explained below: We have prepared and tested several symmetric supercapacitors each composed of two identical graphene- or other nano-structured electrodes (anode and cathode having identical compositions), but with the anode having no Li metal foil/power and no pre-lithiation. The specific capacitance values of these EDL supercapacitors are only equivalent to approximately 10-25% of the total lithium ion storage capacity of their corresponding surface-mediated cells (SMCs) herein reported. For instance, shown below are CV diagrams of a graphene-based supercapacitor and its corresponding SMC. In both cells, the electrolyte is 1M LiPF6/EC+DMC and the scan rate is 25 mV/s. It is of interest to note that this organic electrolyte can only operate from 0 to < 2.7 volts in a symmetric supercapacitor configuration, but 1.5-4.5 volts in the SMC configuration. 0 1 2 3 4
-200
-100
0
100
200
Ca
pa
cit
an
ce
(F
/g)
Voltage (V)

14
Figure S10 CV diagrams of a graphene-based symmetric supercapacitor (blue) and its corresponding SMC (black curve).
The contributions from the other 3 mechanisms are more difficult to differentiate. Further, Mechanisms 1, 2, and 4 can be mutually exclusive. In other words, as an example, when the concentration of oxygen-containing functional groups is increased (to increase the proportion of the contribution of the redox mechanism), the number of Li atom adsorption sites is decreased. Their combined contributions to the overall energy storage capacity are dictated by the total surface areas or the number of graphene carbon atoms directly accessible to liquid electrolyte.
A major research effort is currently in progress with the objectives of identifying the most important graphene material parameters that govern the overall Li storage capacity, and developing the ability to differentiate various Li storage mechanisms. The results will be reported later. a) b)
Figure S11 Representative SEM images of graphene electrode a) before cycling, and (b) after 1,000 charge-discharge cycles.
1 10 100 1000
1
10
100
1000
10000
100000
1000000 N
AC
t-CB
CB
Po
wer
den
sity
(W
/kg
cath
ode)
Energy density (Wh/kgcathode)

15
Figure S12 Ragone plots of CB, t-CB, AC and N cells based on cathode weight.
Figure S13 The Ragone plots of graphene surface-enabled Li ion-exchanging cells (based on the cathode weight) with different electrode thicknesses.

16
References
1. Jang, B. Z.; Aruna, Z. J. Mater. Sci. 2008, 43, 5092. 2. Song, L. L.; Aruna, Z.; Guo, J. S.; Jang, B. Z. U.S. Patent Application 11/499,861,
August 7, 2006 and U.S. Patent 7,623,340, November 24, 2009. 3. Vivekchand, S. R.; Chandra, S. R.; Subrahmanyam, K. S.; Govindaraj, A.; Rao, C. N. J.
Chem. Sci. 2008, 120, 9. 4. Stoller, M. D.; Park, S.; Zhu, Y.; An, J. H.; Ruoff, R. S. Nano Lett. 2008, 8, 3498. 5. Xia, J.; Chen, F.; Li, J.; Tao, N. Nature Nanotech. 2009, 4, 505. 6. Chen, S.; Zhu, J.; Wu, X.; Han, Q.; Wang, X. ACS Nano 2010, 4, 2822. 7. Yan, J.; Wei, T.; Shao, B.; Fan, Z. J.; Qian, W. Z.; Zhang M. L.; Wei, F. Carbon 2010,
48, 487. 8. Zhang, K.; Zhang, L. L.; Zhao, X. S.; Wu, J. S. Chem. Mater. 2010, 22, 1392. 9. Liu, C. G.; Yu, Z. N.; Neff, D.; Aruna, Z.; Jang, B. Z. Nano Lett. 2010, 10, 4863. 10. Aruna, Z.; Jang, B. Z. U.S. Patent Application 12/220,651, July 28, 2008. 11. Aruna, Z.; Jang, B. Z. U.S. Patent Application 11/982,672, November 5, 2007. 12. Wang, D.; Choi, D.; Li, J.; Yang, Z.; Nie, Z.; Kou, R.; Hu, D.; Wang, C.; Saraf, L. V.;
Zhang, J.; Aksay, L. A.; Liu, J. ACS Nano 2009, 3, 907. 13. Paek, S. M.; Yoo, E. J.; Honma, I. Nano Lett. 2009, 9, 72. 14. Yao, J.; Shen, X.; Wang, B.; Liu, H.; Wang, G. Electrochem. Comm. 2009, 11, 1849. 15. Wang, G.; Wang, B.; Wang, X.; Park, J.; Dou, S.; Ahn, H.; Kim, K. J. Mater. Chem.
2009, 19, 8378. 16. Wu, Z. S.; Ren, W. C.; Wen, L.; Gao, L. B.; Zhao, J. P.; Chen, Z. P.; Zhou, G. M.; Li, F.;
Cheng, H. M. ACS Nano 2010, 4, 3187. 17. Chou, S.; Wang, J.; Choucair, M.; Liu, H.; Stride, J. A.; Dou, S. Electrochem. Comm.
2010, 12, 303. 18. Bhardwaj, T.; Antic, A.; Pavan, B.; Barone, V.; Fahlman, B. D. J. Am. Chem. Soc. 2010,
132, 12556. 19. Pech, D.; Brunet, M.; Durou, H.; Huang, P.; Mochalin, V.; Gogotsi, Y.; Taberna, P.;
Simon, P. Nature Nanotech. 2010, 5, 651. 20. Xu, Y.; Bai, H.; Lu, G.; Li, C.; Shi, G. J. Am. Chem. Soc. 2008, 130, 5856. 21. Kirby, B. J. Micro- and Nanoscale Fluid Mechanics: Transport in Microfluidic Devices,
Cambridge University Press, 2010. 22. Probstein, R. Physicochemical Hydrodynamics, Wiley-Interscience, 1994. 23. Sparks, D. L. Kinetics of Soil Chemical Processes, Academic Press, New York, 1988. 24. Becker-Steinberger, K.; Funken, S.; Landstorfer, M.; Urban, K. An institute of numerical
mathematics report, University of Ulm, Germany, 2009. 25. Lee, S. Y.; Yong, H. H.; Lee, Y. J.; Kim, S. K.; Ahn, S. J. Phys. Chem. B 2005, 109,
13663. 26. Videa, M.; Wu, X.; Geil, B.; Marzke, R.; Angell, C. A. J. Electrochem. Soc. 2001, 148,
A1352. 27. Walls, H. J.; Fedkiw, P. S.; Zawodzinski, T. A.; Khan, S. A. J. Electrochem. Soc. 2003,
150, E165. 28. Djian, D.; Alloin, F.; Martinet, S.; Lignier, H. J. Power Sources 2009, 187, 575. 29. Nitash, B. Energy and Environmental Technologies Division Batteries for Advanced
Transportation Technologies Program, 2010. www1.eere.energy.gov/vehiclesandfuels/.../es088_balsara_2010_p.pdf.
17
30. Prosini, P.; Lisi, M.; Zane, D.; Pasquali, M. Solid State Ionics 2002, 148, 45. 31. Churikov, A. V.; Ivanishchev, A. V.; Ivanishcheva, I. A.; Sycheva, V. O.; Khasanova, N.
R.; Antipov, E. V. Electrochim. Acta 2010, 55, 2939. 32. Rui, X. H.; Ding, N.; Liu, J.; Li, C.; Chen, C. H. Electrochim. Acta 2010, 55, 2384. 33. Ding, N.; Xu, J.; Yao, Y. X.; Wegner, G.; Fang, X.; Chen, C. H.; Lieberwirth, I. Solid
State Ionics 2009, 180, 222. 34. Lee, S. W.; Yabuuchi, N.; Gallant, B. M.; Chen, S.; Kim, B. S.; Hammond, P. T.; Yang,
S. H. Nature Nanotech. 2010, 5, 531. 35. Khantha, M.; Cordero, N. A.; Molina, L. M.; Alonso, J. A.; Girifalco, L. A. Physical
Review B 2004, 70, 125422. 36. Medeiros, P. V C; de BritoMota F.; Mascarenhas, A. J. S.; de Castilho, C. M C.
Nanotechnology 2010, 21, 115701. 37. Sato, K.; Noguchi, M.; Demachi, A.; Oki, N.; Endo, M. Science 1994, 264, 556. 38. Dahn, J. R.; Zheng, T.; Liu, Y. H.; Xue, J. S. Science 1995, 270, 590. 39. Yoo, E.; Kim, J.; Hosono, E.; Zhou, H.; Kudo, T.; Honma, I. Nano Lett. 2008, 8, 2277. 40. Pan, D.; Wang, S.; Zhao, B.; Wu, M.; Zhang, H.; Wang, Y.; Jiao, Z. Chem. Mater. 2009,
21, 3136. 41. Le Gall, T. L.; Reiman, K. H.; Grossel, M. C.; Owen, J. R. J. Power Sources 2003, 119,
316. 42. Chen, H.; Armand, M.; Demailly, G.; Dolhem, F.; Poizot, P.; Tarascon, J. M.
ChemSusChem, 2008, 1, 348. 43. Han, X. Y.; Chang, C. X.; Yuan, L. J.; Sun, T. L.; Sun, J. T. Adv. Mater. 2007, 19, 1616. 44. Xiang, J. F.; Chang, C. X.; Li, M.; Wu, S. M.; Yuan, L. J.; Sun, J. T. Crystal Growth &
Design 2008, 8, 280. 45. McAllister, M. J.; Li, J.; Adamson, D. H.; Schniepp, H. C.; Abdala, A. A.; Liu, J.;
Herrera-Alonso, M.; Milius, D. L.; Car, R.; Prudhomme, R. K.; Aksay, I. A. Chem. Mater. 2007, 19, 4396.
46. Gilje, S.; Han, S.; Wang, M.; Wang, K. L.; Kaner, R. B. Nano Lett. 2007, 7, 3494.