Supporting Information for - Amazon S3 Supporting Information for “Bull’s Eye” Janus Particles...
13
S1 Supporting Information for “Bull’s Eye” Janus Particles as Artificial Antigen-Presenting Cells for T Cell Activation Bo Chen, ‡ Yilong Jia, ‡ Yuan Gao, ‡ Lucero Sanchez, Stephen M. Anthony, † and Yan Yu * Department of Chemistry, Indiana University, Bloomington, Indiana 47405, United States [†] Present Address: Department of Bioenergy and Defense Technology, Sandia National Laboratories, Albuquerque, New Mexico 87123, United States [‡] These authors contributed equally. *Corresponding author: [email protected] Contents Experimental Section Supplementary Figures S1-S7
Transcript of Supporting Information for - Amazon S3 Supporting Information for “Bull’s Eye” Janus Particles...

S1
Supporting Information for
“Bull’s Eye” Janus Particles as Artificial Antigen-Presenting Cells for T Cell Activation
Bo Chen,‡ Yilong Jia,
‡ Yuan Gao,
‡ Lucero Sanchez, Stephen M. Anthony,
† and Yan Yu
*
Department of Chemistry, Indiana University, Bloomington, Indiana 47405, United States
[†] Present Address: Department of Bioenergy and Defense Technology, Sandia National
Laboratories, Albuquerque, New Mexico 87123, United States
[‡] These authors contributed equally.
*Corresponding author: [email protected]
Contents
Experimental Section
Supplementary Figures S1-S7
S2
Experimental Section
1. Reagents and cells
Silica particles (3 µm in diameter, 5% w/v) were purchased from Spherotech Inc (Lake Forest,
IL). Bovine serum albumin (BSA) and biotinylated BSA (BSA-biotin) were purchased from
Thermo Scientific (Waltham, MA). Biotin N-hydroxysuccinimide ester (biotin-NHS) was
purchased from Sigma-Aldrich (St. Louis, MO). Anti-human CD3 (anti-CD3) OKT antibody
was purchased from eBioscience (San Diego, CA) and conjugated with biotin-NHS. Phalloidin
Alexa Fluor-647 conjugate was purchased from Cell Signaling Technology (Danvers, MA).
Fibronectin (human) was obtained from BD Biosciences (San Jose, CA) and further conjugated
with Alexa Fluor-488 carboxylic acid, succinimidyl ester from Life Technologies (Grand Island,
NY). Protein kinase C (PKC)-θ antibody was purchased from Santa Cruz Biotech (Dallas, Texas).
Fluo-4 AM and Alexa Fluor-647 chicken anti-goat IgG (H+L) were purchased from Life
Technologies (Grand Island, NY). Polydimethylsiloxane (PDMS; Sylgard 184) was obtained
from Dow Corning (Midland, MI) and used at 2:1 (w:w) base-to-curing-agent ratio. Jurkat T
cells (clone E6-1) were a gift from Prof. Jay T. Groves (University of California, Berkeley) and
originally purchased from ATCC (Manassas, VA). Jurkat T cells were cultured in RPMI 1640
complete growth media supplemented with 10 % fetal bovine serum (FBS), 1 mM sodium
pyruvate, 100 units/mL penicillin, and 100 µg/mL streptomycin. Ultrapure water (resistivity of
18.2 MΩ·cm) was used. Calcium-containing imaging buffer (121 mM NaCl, 6 mM NaHCO3, 5.4
mM KCl, 5.5 mM D-glucose, 0.8 mM MgCl2, 25 mM HEPES, 1.8 mM CaCl2, pH 7.4) was used
for live-cell imaging experiments. Live-cell imaging chambers and temperature controller were
purchased from Bioptechs (Butler, PA).

S3
2. Microcontact printing of Janus particles
Silica particles and glass microscope slides were treated with piranha solution (H2SO4:30% H2O2
3:1) at 75 °C for 15 minutes (Caution: Piranha solution is extremely corrosive) and rinsed with
ultrapure water. Monolayers of particles were made on the glass miscroslide sides via a solution
evaporation method.1 Sylgard 184 base and curing agent were mixed at 2:1 (w:w) ratio in a
plastic cup, poured into a flat petridish, degassed in vacuum until no more bubbles were visible,
and cured at 65 °C for 12 hours. Small sections of the PDMS stamp (1 cm × 1 cm) were cut out
and treated with piranha solution to make the surface hydrophilic. To generate the reverse “bull’s
eye” pattern in which a fibronectin patch is surrounded by anti-CD3 molecules, the top surface of
a PDMS stamp was incubated with fibronectin Alexa Fluor-488 conjugate solution (2 µg/mL) for
at least 20 minutes, dried under a stream of filtered air, and immediately pressed against a
monolayer of silica particles at a pressure of 1.5×10⁴
Pa. After 3 minutes, the stamp with
embedded silica particles was peeled off from the substrate and incubated with BSA-biotin
Alexa Fluor-568 conjugate solution (16.5 µg/mL) for 1.5 hours. Particles were sonicated off the
PDMS stamp and harvested in 1× PBS buffer containing BSA (0.005 %, w/v). Janus particles
with the native “bull’s eye” pattern were prepared through the same procedure using a PDMS
stamp inked with BSA-biotin Alexa Fluor-568 conjugate. We noticed that many native “bull’s
eye” particles exhibited a gap between the BSA-biotin patch and fibronectin-covered surface
after incubation with fibronectin, likely because fibronectin molecules were prevented from
adsorbing onto the particle surface near the PDMS stamp due to the large size. The gap was
filled by an additional step of incubation in a diluted fibronectin solution (1 µg/mL in 1× PBS
buffer) for 2 hours. The Janus particles were further functionalized with streptavidin (100 nM)
and then biotinylated anti-CD3 (20 nM).

S4
3. Calcium imaging and analysis
Jurkat T cells were serum starved in serum-free cell media at 37 °C for 2 hours before imaging.
To load cells with the intracellular calcium indicator Fluo-4 AM, 1 million cells were incubated
with 5 µg/mL Fluo-4 in serum-free cell media at 37 °C for 30 minutes, washed, and then
incubated in serum-containing cell media at 37 °C for another 30 minutes to allow complete de-
esterification of Fluo-4. The Fluo-4 loaded T cells were suspended in 1× imaging buffer and
added into an imaging chamber at 37 ⁰C after the addition of Janus particles. Concentrations of
Janus particles and cells were kept the same in all experiments. Time-lapse multi-channel epi-
fluorescence images were immediately acquired on a Nikon Eclipse Ti microscope system
equipped with an Andor iXon3 EMCCD Camera and a Nikon Plan Apo 40×/0.95 N.A objective
or a Nikon Plan Apo 100×/1.49 N.A TIRF objective. Images were acquired with 100-millisecond
exposure time, 2-second interval time and a total duration of 1000 seconds. Imaging parameters
such as laser intensity, EMCCD gain and exposure, were all kept exactly the same for each set of
imaging experiments. Imaging chambers were maintained at 37 °C with a temperature controller.
A Matlab script was used to quantify the fluorescence intensity of individual cells as a function
of time. The algorithm detects the outlines of individual cells and calculates the integrated
fluorescence intensity for each cell. Cells not in contact with any particles were removed
manually. T cell calcium response was quantified based on a previously reported method.2 Due
to uneven loading of dyes, cells had different basal fluorescent intensity at resting state. A basal
intensity for each cell was obtained by averaging the fluorescence intensities of the first 25
imaging frames before the first calcium peaks. The fluorescence intensity of each cell was then
normalized against the basal intensity to enable comparison of the calcium signaling between
S5
different samples. For a T cell to be considered activated, its calcium response must meet two
criteria: peak intensity of the calcium elevation must be at least 5 times higher than the basal
intensity, and each calcium peak must persist longer than 1 minute. The activation percentage (%
activation) is the percentage of T cells that are activated. Average fluorescence amplitude was
obtained by averaging normalized fluorescence intensities of all frames for each cell. Response
fraction was calculated as the fraction of time during which a T cell remained activated.
4. Immunofluorescence staining and confocal fluorescence imaging
Jurkat T cells were serum starved at 37 °C for 2 hours before mixing with particles. 5 million
cells were mixed with Janus particles in 1× imaging buffer solution for 4 minutes before fixation.
Cells were fixed with 2 % (w/v) paraformaldehyde (PFA) on ice for 15 minutes, permeabilized
with 0.01 % Triton X-100 for a few seconds, and blocked with 1 % BSA for 1 hour. To label
actin, permeabilized cells were incubated with 0.32 µg/mL phalloidin Alexa Fluor-647 for 30
minutes at room temperature. To label PKC-θ, permeabilized cells were incubated with 1 µg/mL
PKC-θ antibody at room temperature for 2 hours, washed with 1× PBS solution for 3 times,
blocked with 1% BSA for 30 minutes, and incubated with 1 µg/mL chicken anti-goat IgG (H+L)
Alexa Fluor-647 conjugate at room temperature for 1 hour.
Laser scanning confocal fluorescence imaging was done on a Nikon A1R-A1 confocal
microscope system equipped with a Nikon 100× oil-immersed objective and a Hamamatsu
C11440 camera (Light Microscopy Imaging Center, Indiana University). Alternative scanning
mode was used to avoid possible crosstalk between channels. Z-scan stacks were acquired with a
0.15 µm stepsize on Z axis. Images were analyzed with ImageJ software.

S6
Supplementary Figures
Figure S1. Size distribution of (a) anti-CD3 and (b) fibronectin patches.

S7
Figure S2. Intracellular calcium elevation in Jurkat T cells that are stimulated by particles coated
uniformly with (a) anti-CD3, (b) fibronectin and (c) BSA. Jurkat T cells were loaded with
calcium-sensitive dye, Fluo-4, whose fluorescence intensity increases with intracellular [Ca2+
].
Normalized fluorescence intensities of individual cells are shown on a color scale. Cells are
sorted based on the fluorescence intensity of the first peak. Time zero is defined as the time when
T cells are flown into imaging chambers.

S8
Figure S3. Calcium response of T cells that are in direct contact with the “bull’s eye” patterns.
Normalized fluorescence intensities of individual cells are shown on a color scale. Cells are
sorted based on the fluorescence intensity of the first peak. Time zero is defined as the time when
T cells are flown into imaging chambers.

S9
Figure S4. Fluorescence confocal images show diffusive localization of actin in T cells that are
stimulated by “bull’s eye” particles. The images are representative of 41 cells for the native
“bull’s eye” particles and 26 for the reverse type particles. Scale bars: 5 µm.
S10
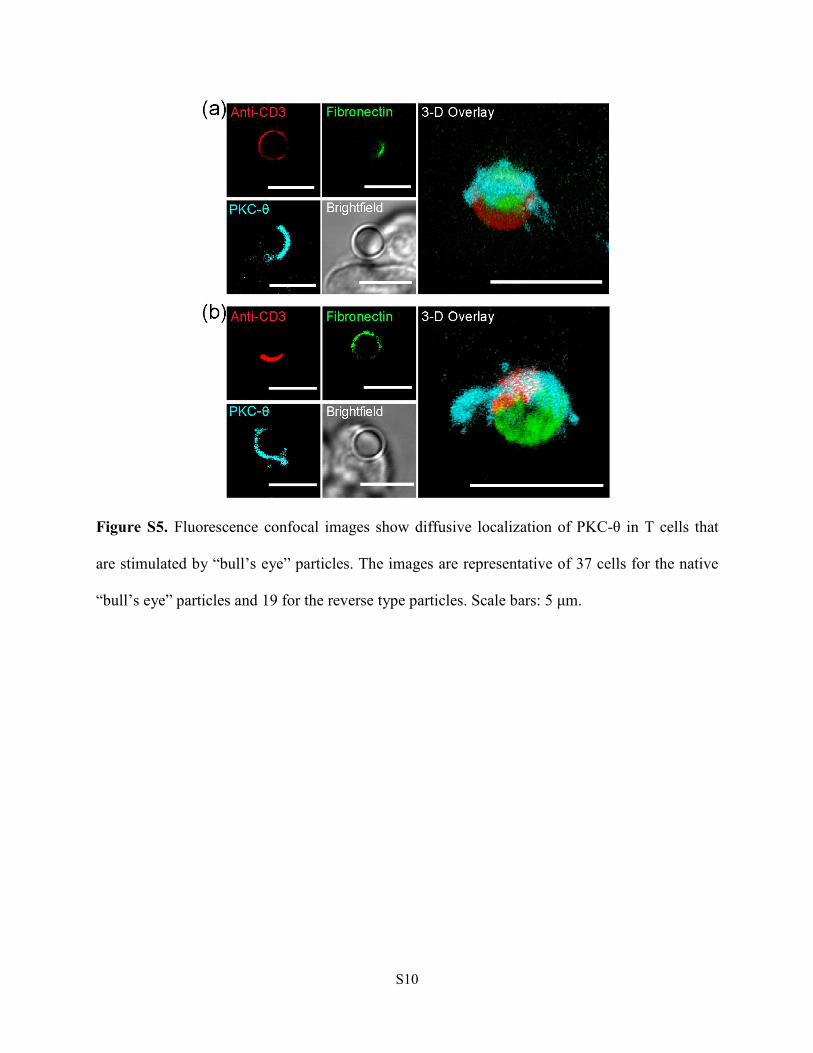
Figure S5. Fluorescence confocal images show diffusive localization of PKC-θ in T cells that
are stimulated by “bull’s eye” particles. The images are representative of 37 cells for the native
“bull’s eye” particles and 19 for the reverse type particles. Scale bars: 5 µm.

S11
Figure S6. Fluorescence confocal images show intracellular clustering of actin in a T cell
stimulated by a control particle that is uniformly coated with anti-CD3 and fibronectin. The
images are representative of 36 cells. Scale bars: 5 µm.

S12
Figure S7. Fluorescence confocal images show intracellular clustering of PKC-θ in a T cell
stimulated by a control particle that was uniformly coated with anti-CD3 and fibronectin. The
images are representative of 30 cells. Scale bars: 5 µm.

S13
References
(1) Jiang, S.; Granick, S. A Simple Method to Produce Trivalent Colloidal Particles. Langmuir
2009, 25, 8915-8918.
(2) Salles, A.; Billaudeau, C.; Sergé, A.; Bernard, A.-M.; Phélipot, M.-C.; Bertaux, N.; Fallet,
M.; Grenot, P.; Marguet, D.; He, H.-T.; Hamon, Y. Barcoding T Cell Calcium Response
Diversity with Methods for Automated and Accurate Analysis of Cell Signals (MAAACS).
PLoS Comput. Biol. 2013, 9, e1003245.