Supporting Information -...
20
Supporting Information # Wiley-VCH 2012 69451 Weinheim, Germany Reactive and Bioactive Cationic a-Helical Polypeptide Template for Nonviral Gene Delivery** NathanP. Gabrielson, Hua Lu, Lichen Yin, Dong Li, Fei Wang,* and Jianjun Cheng* anie_201104262_sm_miscellaneous_information.pdf
Transcript of Supporting Information -...

Supporting Information
� Wiley-VCH 2012
69451 Weinheim, Germany
Reactive and Bioactive Cationic a-Helical Polypeptide Template forNonviral Gene Delivery**Nathan P. Gabrielson, Hua Lu, Lichen Yin, Dong Li, Fei Wang,* and Jianjun Cheng*
anie_201104262_sm_miscellaneous_information.pdf

S1
Supporting Information
Materials.
All chemicals were purchased from Sigma-Aldrich (St. Louis, MO, USA) and used as received
unless otherwise specified. VB-Glu-NCA was prepared and polymerized according to published
procedures.1 Pierce BCA assay kits were purchased from ThermoFisher Scientific (Rockford, IL,
USA). Luciferase assay reagent was purchased from Promega (Madison, WI, USA).
Lipofectamine 2000 (LFA) and the fluorescent dye YOYO-1 were purchased from Invitrogen
(Carlsbad, CA, USA).
Instrumentation.
NMR spectra were recorded on a Varian UI400 MHz, a UI500NB MHz or a VXR-500 MHz
spectrometer. Tandem gel permeation chromatography (GPC) experiments were performed on a
system equipped with an isocratic pump (Model 1100, Agilent Technology, Santa Clara, CA,
USA), a DAWN HELEOS 18-angle laser light scattering detector (also known as multi-angle
laser light scattering (MALLS) detector, Wyatt Technology, Santa Barbara, CA, USA) and an
Optilab rEX refractive index detector (Wyatt Technology, Santa Barbara, CA, USA). The
detection wavelength of HELEOS was set at 658 nm. Separations were performed using serially
connected size exclusion columns (100 Å, 500 Å, 103Å and 10
4 Å Phenogel columns, 5 µm, 300
× 7.8 mm, Phenomenex, Torrance, CA) at 60°C using DMF containing 0.1 M LiBr as the mobile
phase. The MALLS detector was calibrated using pure toluene with no need for external polymer
standards and was used for the determination of the absolute molecular weights. The molecular
weights (MWs) of all polymers were determined based on the dn/dc value of each sample

S2
calculated offline by using the internal calibration system processed by the ASTRA V software
(version 5.1.7.3, Wyatt Technology, Santa Barbara, CA, USA). Circular dichroism (CD)
measurements were carried out on a JASCO 720 CD Spectrometer. Ozone was produced by an
OZV-8S ozone generator manufactured by Ozone Solutions Inc (Hull, IA, USA). Lyophilization
was performed on a FreeZone lyophilizer (Labconco, Kansas City, MO, USA).
Cells and Plasmids.
COS-7, HEK293, MDA-MB-231 and HeLa cells were obtained from ATCC. The cells were
cultured according to their ATCC protocols at 37°C and 5% CO2 in Dulbecco’s modified Eagle’s
medium (DMEM). The growth medium was supplemented with 10% fetal bovine serum and 1%
penicillin-streptomycin. Federally registered hESC line H9 was purchased from WiCell Research
Institute and routinely maintained under feeder conditions. The expression vectors pCMV-Luc
coding for the luciferase gene and pEGFP-N1 coding for green fluorescent protein were obtained
from Elim Biopharmaceuticals (Hayward, CA, USA).
Synthesis of PVBLG-X (X = 1-31).
Method 1: Poly(γ-(4-aldehydebenzyl-L-glutamate) (20 mg), amine (3-5 molar equivalents
relative to the Glu repeating unit) and the reducing agent NaBH(OAc)3 (5-10 molar equivalents)
were mixed in DMF (2 mL). The reaction mixtures were stirred at 50-60oC for 24-48 h. The
solution was then poured into 3 M HCl (3 mL), followed by dialysis against water and
lyophilization (X = 1-5).
Method 2: Poly(γ-(4-aldehydebenzyl-L-glutamate) (20 mg) and amine (3-5 molar equivalents
relative to the Glu repeating unit) were stirred in DMF (2 mL) at 50-60oC for 24h, followed by
the addition of the reducing agent NaBH4 (5-10 molar equivalents). The resulting solutions were
stirred at room temperature for another 24 h. The mixture were then poured into 3 M HCl (3 mL),
followed by dialysis against water and lyophilization (X = 6-7).

S3
Method 3: Poly(γ-(4-aldehydebenzyl-L-glutamate) (20 mg) and amine (3-5 molar equivalents
relative to the Glu repeating unit) were stirred in DMF (2 mL) at 50-60oC for 24h, followed by
the addition of the reducing agent borane pyridine (5-10 molar equivalents). The resulting
solutions were stirred at 50-60oC for another 24 h. The mixtures were then poured into 3 M HCl
(3 mL), followed by dialysis against water and lyophilization (X = 8-31).
The yields of the products PVBLG-X (X = 1-31) were around 50-75% after dialysis. Grafting
efficiencies were analyzed by 1H-NMR integration and all of the polymers have grafting efficient
around 90% except for PVBLG-7 (70 % grafting density).
General procedure for the analysis of polymer by circular dichroism (CD).
Circular dichroism experiments were performed on a J-720 CD spectrometer. Polymer samples
were prepared at concentrations of 0.05 mg/mL in DI water unless otherwise specified. The
solution was placed in a quartz cell with a light path of 0.5 cm. The mean residue molar
ellipticity of each polymer was calculated based on the measured apparent ellipticity by
following equations reported in literature: Ellipticity ([θ] in deg·cm2·dmol
-1) = (millidegrees ×
mean residue weight)/(pathlength in millimeters × concentration of polypeptide in mg ml-1
).[2, 3]
Experiments were carried out at room temperature. For pH-dependency studies, polymers were
dissolved in buffer solutions at specific pH values. The background of the buffer was subtracted
from each spectrum. Sample CD spectra for the top-performing PVBLGn-8 polymer as well as
the random coil PVB-DL-Gn-8 can be seen in Figure 3c. The data indicates that PVBLGn-8
helicity is maintained over pH values ranging from pH 2 to pH 7.4. Figure S1 indicates there
was no detectable helicity change of the PVBLGn-8 before and after the formation of the
polyplex with DNA, as elicited by comparing the θ (mdeg) value of “pDNA + PVBDLG150-8”
and the “polyplex” at 222 nm. A more complete analysis of the pH and temperature stability of
PVBLGn-X helicity can be found elsewhere.1

S4
Figure S1. Circular dichroism spectra of free plasmid DNA (0.05 mg/mL), free PVBLG150-8 (0.05 mg/mL), the
numerical addition of the free DNA and PVBLG150-8 curves as well as the actual polyplex formed by mixing
plasmid DNA and PVBLG150-8 at a 1:1 weight ratio (concentration of DNA and PVBLG150-8 were 0.05 mg/mL and
0.05 mg/mL after mixing). For comparison and simplicity reasons, the raw data instead of normalized spectra are
shown.
Gel Retardation Studies.
A solution of DNA (1 μg/10 μL) was prepared in doubled distilled water. Appropriate amounts
of select PVBLGn-X polymers (X = 1-9) dissolved in double distilled water were added to the
DNA solution (10 μl) to achieve the desired PVBLGn-X:DNA weight ratio. Complexes were
incubated at room temperature for 15 min, after which loading dye was added and the solution
(10 μl) was run on a 1% agarose gel (70 V, 70 min). DNA was stained with ethidium bromide
and visualized on a Gel Doc imaging system (Biorad, Herclues, CA, USA).
Figure S2. Gel retardation evaluating the ability of various PVBLGn-X polymers to bind and condense DNA at
various weight ratios. The numbers above the lanes correspond to the polypeptide:DNA weight ratio tested. Of the
polymers tested, only PVBLG40-5 was unable to bind and condense DNA at weight ratios up to 9:1

S5
Complex Formation and Transfection.
DNA/polymer complexes were prepared at room temperature by dissolving DNA (0.35 μg) in
150 mM NaCl, 20 mM HEPES (175 μl). An equal volume of PLL, 25-kDa branched PEI or
PVBLGn-X in 150 mM NaCl, 20 mM HEPES was added to achieve the desired
polypeptide:DNA weight ratio (typically ranging from 1:1 to 35:1). The final complexes were
incubated at room temperature for 15 min before further use. Cells (COS-7, HEK293, MDA-
MB-231 or HeLa) were cultured in DMEM supplemented with 10% horse serum and 1%
penicillin-streptomycin according to ATCC protocols and plated in 96-well plates at 1×10⁴
cells/well 24 h prior to transfection. Immediately before transfection, the growth medium was
replaced with fresh serum-free DMEM and polyplex solution (50 μl) was added to each well
(0.05 μg DNA/well). The transfection medium was replaced with fresh serum-supplemented
growth medium 4 h post-transfection. For studies involving drug treatment (methyl- -
cyclodextrin at 10 mg/ml, chlorpromazine at 5 g/ml, bafilomycin A1 at 5 nM, nocodazole at 20
M), cells were incubated with serum-free DMEM containing the drug 30 min prior to
transfection. Luciferase expression was quantified 24 h post-transfection using the Promega
Bright-Glo luciferase assay system (Promega, Madison, WI, USA). Luciferase activity was
measured in relative light units (RLU) using a PerkinElmer plate reader with luminescence
capabilities (Waltham, MA, USA). Results were normalized to total cell protein using the Pierce
BCA protein assay kit (Rockford, IL, USA). Transfections were performed in triplicate.
Figure S3. a) In vitro transfection of HeLa, MDA-MB-231 and HEK293 cells with 25-kDa branched PEI and the
top-performing PVBLG267-8 polymer. b) In vitro transfection of HEK293 cells transfected with complexes of 25-
kDa PEI or PVBLG267-8 in the presence of intracellular processing inhibitors. In both experiments, a PVBLG267-
8:DNA weight ratio of 30:1 was used, corresponding to a final PVBLG267-8 concentration of 10 µg/ml.
HeLa M DA-M B-231 HEK293
RL
U/m
g P
rote
in
10 3
10 4
10 5
10 6
10 7
PEI
PVBLG 267-8
D M EM Bafilom ycin N ocodazole
No
rma
liz
ed
RL
U/m
g P
rote
in
0
1
2
3
4
PEI
PVBLG 267-8
a b HEK293

S6
Transfection in Serum.
DNA/polymer complexes were prepared at room temperature by dissolving DNA (0.35 μg) in
150 mM NaCl, 20 mM HEPES (175 μl). An equal volume of PVBLG150-8 in 150 mM NaCl, 20
mM HEPES was added to a 25:1 polypeptide:DNA weight ratio. The final complexes were
incubated at room temperature for 15 min before further use. Cells (COS-7) were cultured in
DMEM supplemented with 10% horse serum and 1% penicillin-streptomycin according to
ATCC protocols and plated in 96-well plates at 1×10⁴ cells/well 24 h prior to transfection.
Immediately before transfection, the growth medium was replaced with fresh serum-free DMEM
or fresh DMEM containing 10% serum and polyplex solution (50 μl) was added to each well
(0.05 μg DNA/well). The transfection medium was replaced with fresh serum-supplemented
growth medium 4 h post-transfection. Luciferase expression was quantified 24 h post-
transfection using the Promega Bright-Glo luciferase assay system (Promega, Madison, WI,
USA). Luciferase activity was measured in relative light units (RLU) using a PerkinElmer plate
reader with luminescence capabilities (Waltham, MA, USA). Results were normalized to total
cell protein using the Pierce BCA protein assay kit (Rockford, IL, USA). Transfections were
performed in triplicate.
Figure S4. In vitro transfection of COS-7 cells with either PEI or PVBLG150-8 polymer in the absence and presence
of 10% fetal bovine serum. A PVBLG150-8:DNA weight ratio of 25:1 was used, corresponding to a final PVBLG150-
8 concentration of 8.25 µg/ml.
Uptake.
DNA complexes were formed at their respective optimum transfection weight ratios as described
above. The intercalating dye YOYO-1 was added at the ratio 15 nl YOYO-1 per 1 μg of DNA.
Cells (COS-7 or HEK293) were cultured in DMEM supplemented with 10% horse serum and

S7
1% penicillin-streptomycin according to ATCC protocols and plated in 24-well plates at 5 × 10⁴
cells/well 24 h prior to transfection. Immediately before transfection, the growth medium was
replaced with fresh serum-free medium and polyplex solution (50 μl) was added to each well
(0.25 μg DNA/well). For studies involving drug treatment (methyl- -cyclodextrin at 10 mg/ml,
chlorpromazine at 5 g/ml, bafilomycin A1 at 5 nM or nocodazole at 20 M), cells were
incubated with DMEM containing the drug 30 min prior to transfection. Four hours post-
transfection, the cells were rinsed with PBS (0.5 mL × 2) to remove surface-bound complexes.
Next, trypsin in PBS (0.05%, 100 μl) was added to each well. The cells and trypsin were
incubated for approximately ten minutes before formaldehyde (4%, 400 μl) was added to each
well. The cells were then collected and FACS analyses were performed on a BD Biosciences
LSR II flow cytometer (Franklin Lakes, NJ, USA). Data were analyzed using the FCS Express
software package (De Novo Software, Los Angeles, CA, USA). Transfections and uptake
measurements were performed in triplicate.
Figure S5. COS-7 cell uptake of YOYO-1 labeled complexes formed with either 25-kDa PEI or PVBLG10-1 or
PVBLG60-1. The observation that both PVBLG10-1 and PVBLG60-1 show enhanced uptake compared to PEI while
only PVBLG60-1 has comparable transfection efficiency compared to PEI (see Figure 2a) suggests that the increased
performance of the PVBLGn-X polymers is likely not due solely to enhanced uptake.
Flu
ore
sc
en
ce
In
ten
sit
y (
a.u
.)
0
10
20
30
40
50
60
PVBLG10-1 PVBLG60-1 PEI

S8
Figure S6. a) COS-7 cell uptake of YOYO-1 labeled complexes formed with either 25-kDa PEI or PVBLG267-8 in
the presence of endocytic inhibitors (m CD = caveolae-mediated uptake inhibition, chlorpromazine = clathrin-
mediated uptake inhibition). b) Normalized COS-7 cell uptake of YOYO-1 labeled complexes formed with either
25-kDa PEI or PVBLG267-8 in the presence of intracellular processing inhibitors (bafilomycin A1 = endosome
acidification inhibitor, nocodazole = microtubule depolymerizer). c) HEK293 cell uptake of YOYO-1 labeled
complexes formed with either 25-kDa PEI or PVBLG267-8 in the presence of endocytic inhibitors. c) Normalized
HEK293 cell uptake of YOYO-1 labeled complexes formed with either 25-kDa PEI or PVBLG267-8 in the presence
of intracellular processing inhibitors. In all experiments, a PVBLG267-8:DNA weight ratio of 30:1 was used,
corresponding to a final PVBLG267-8 concentration of 15 µg/ml.
Dynamic Light Scattering.
DNA complexes were formed in double distilled water at various PVBLG267-8 to DNA weight
ratios as indicated above. Following incubation at room temperature for 15 minutes, the
complexes were diluted in water or PBS (1.8 mL) and subjected to size measurement on a
Brookhaven Instruments Corporation 90 Plus Particle Size Analyzer Holtsville, NY). Five sets
of measurements were performed for each sample.
Me
dia
n F
luo
res
ce
nc
e (
a.u
.)
0
20
40
60
80
100
120
D M EM
m C D
C hlorprom azine
D M EM Bafilom ycin N ocodazole
No
rma
liz
ed
Up
tak
e
0 .0
0.5
1.0
1.5
2.0
PEI
PVBLG267
-8
D M EM Bafilom ycin N ocodazole
No
rma
liz
ed
Up
tak
e
0 .0
0.5
1.0
1.5
2.0
PEI
PVBLG267
-8
b
c
Me
dia
n F
luo
res
ce
nc
e (
a.u
.)
0
20
40
60
80
100
120
D M EM
m C D
C hlorprom azine
a
d
PEI PVBLG267-8
PEI PVBLG267-8
COS-7 COS-7
HEK293 HEK293

S9
Figure S7. a) Measured diameter of PVBLG267-8/DNA complexes at various polypeptide:DNA weight ratios. b)
Diameter of PVBLG267-8/DNA complexes (30:1 polypeptide:DNA ratio) over time in PBS.
Cytotoxicity Measurements.
The cytotoxicity of the PVBLG-X polymers was characterized using the MTT cell viability
assay (Sigma-Aldrich, St. Louis, MO). Cells (COS-7) were seeded in 96-wells plates at 1 × 10⁴
cells/well and grown overnight at 37 °C, 5% CO2 in medium containing 10% horse serum and
1% penicillin-streptomycin. Approximately 24 h after seeding the medium was replaced with
serum-supplemented DMEM and the uncomplexed material was added to the cells at final
concentrations between 0 and 50 g/ml. After four hours of incubation, the medium was
replaced with serum-containing medium and grown for another 20 h, after which reconstituted 3-
[4,5-dimethylthiazol-2-yl]-2,5-diphenyl tetrazolium bromide (MTT, 10 l) was added. The
plates were then incubated for another four hours and MTT solubilization solution (100 μl,
Sigma-Aldrich, St. Louis, MO, USA) was added and the absorbance at 570 nm was read using a
PerkinElmer plate reader (Waltham, MA, USA). The background absorbance of cells killed with
ethanol was subtracted from the viable cell absorbance and normalized to cells grown in DMEM.
Each experiment was repeated four times at each concentration.
PVBLG 267-8 : D N A
(w eight ratio)
5 : 1 10 : 1 15 : 1 20 : 1 25 : 1 30 : 1
Dia
me
ter
(nm
)
100
150
200
250
300
350
400
450
500a
Tim e (m in)
0 10 20 30 40 50 60 70
Dia
me
ter
(nm
)
0
50
100
150
200
250
300b

S10
Figure S8. Toxicity of PEI and the top-performing PVBLG267-8 polymers in (a) COS-7, (b) HeLa and (c) HEK293
cells as well as toxicity of PEI/DNA and PVBLG267-8/DNA complexes in (d) COS-7 cells.
Fluorescence Microscopy.
DNA complexes were formed at the previously determined optimum transfection weight ratio as
described above. COS-7 and HEK293 cells were cultured in DMEM supplemented with 10%
horse serum and 1% penicillin-streptomycin according to ATCC protocols and plated in 6-well
plates containing coverslips at 20 × 104 cells/well 24 h prior to transfection. Immediately before
transfection, the growth medium was replaced with fresh serum-free medium containing 250 nM
calcein. PVBLG267-8 was added to cells at 0, 15 or 50 g/ml. Sixty minutes post-transfection,
the cells were rinsed with PBS (2 mL × 2) to remove surface-bound complexes and
formaldehyde (4%, 1 mL) was added to each well. Following a 10-min incubation, the cells
were rinsed with PBS (2 mL × 2) and mounted on glass slides. Cells were visualized with a
Zeiss Axiovert 40 CFL fluorescence microscope equipped with a 40x objective.
C oncentration
( g/m l)
0 20 40 60 80 100 120 140
No
rma
liz
ed
Via
bilit
y
0.0
0.5
1.0
1.5
2.0
PVLG 267-8
PEI
C oncentration
( g/m l)
0 20 40 60 80 100 120 140
No
rma
liz
ed
Via
bilit
y
0.0
0.5
1.0
1.5
2.0
PVLG 267-8
PEI
C oncentration
( g/m l)
0 20 40 60 80 100 120 140
No
rma
liz
ed
Via
bilit
y
0.0
0.5
1.0
1.5
2.0
PVLG 267-8
PEI
C oncentration
( g/m l)
0 20 40 60 80 100 120 140
No
rma
liz
ed
Via
bilit
y
0.0
0.5
1.0
1.5
2.0
PVBLG 267-8/D N A
PEI/D N A
a b
c d
COS-7 HeLa
HEK293 COS-7
S11
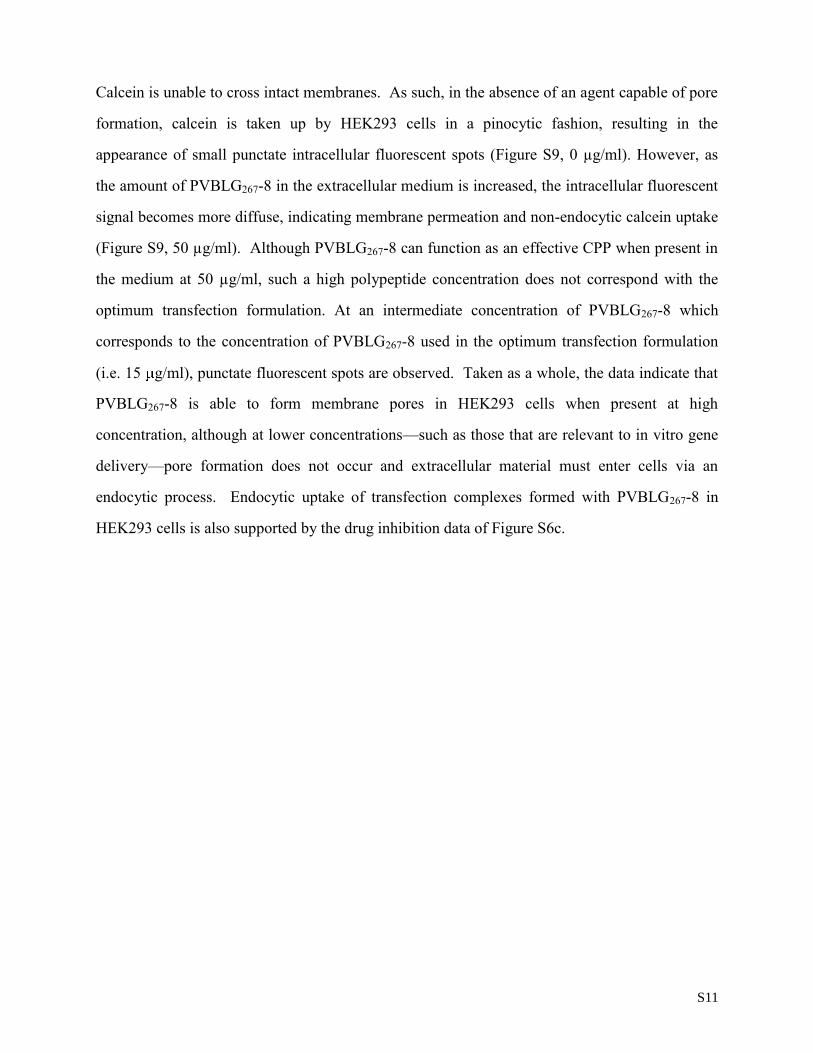
Calcein is unable to cross intact membranes. As such, in the absence of an agent capable of pore
formation, calcein is taken up by HEK293 cells in a pinocytic fashion, resulting in the
appearance of small punctate intracellular fluorescent spots (Figure S9, 0 µg/ml). However, as
the amount of PVBLG267-8 in the extracellular medium is increased, the intracellular fluorescent
signal becomes more diffuse, indicating membrane permeation and non-endocytic calcein uptake
(Figure S9, 50 µg/ml). Although PVBLG267-8 can function as an effective CPP when present in
the medium at 50 µg/ml, such a high polypeptide concentration does not correspond with the
optimum transfection formulation. At an intermediate concentration of PVBLG267-8 which
corresponds to the concentration of PVBLG267-8 used in the optimum transfection formulation
(i.e. 15 g/ml), punctate fluorescent spots are observed. Taken as a whole, the data indicate that
PVBLG267-8 is able to form membrane pores in HEK293 cells when present at high
concentration, although at lower concentrations—such as those that are relevant to in vitro gene
delivery—pore formation does not occur and extracellular material must enter cells via an
endocytic process. Endocytic uptake of transfection complexes formed with PVBLG267-8 in
HEK293 cells is also supported by the drug inhibition data of Figure S6c.

S12
Figure S9. Clacein uptake in HEK293 cells treated with various concentrations of PVBLG267-8. Punctate
fluorescence observed in cells incubated with 0 and 15 g/ml PVBLG267-8 indicates pinocytic uptake. Diffuse
fluorescence observed in cells treated with 50 g/ml PVBLG267-8 indicates cell membrane permeation and
transmembrane uptake.
Transfection and Analysis of H9 hESCs.
DNA complexes were formed at PVBLG267-8:DNA weight ratios between 15:1 and 30:1 as
described above save for the use of pEGFP-N1 instead of pCMV-Luc. DNA complexes with
Lipofectamine 2000 were prepared according to manufacturer recommendations. H9 hESCs
were cultured in DMEM/F12 with 20% knockout serum replacement (KSR), 1 mM glutamine,
1% non-essential amino acid, 0.1 mM_mercaptoethanol, and 4 ng/ml bFGF and plated in 24-well
plates at 5 × 10⁴ cells/well 24 h prior to transfection. Immediately before transfection, the growth
medium was replaced with fresh serum-free medium and polyplex solution (50 μl) was added to
each well (0.25 μg DNA/well). For studies involving nocodazole treatment (10 μM), drug was
added immediately prior to transfection. Four hours post-transfection, the cells were rinsed with
PBS (0.5 mL) to remove surface-bound complexes and the media was replaced with growth
media and incubated for 48 hours. After 48 hours, the cells were imaged under a fluorescent
microscope to evaluate cell phenotype. The cells were then subjected to flow cytometry. First,
trypsin in PBS (0.05%, 100 μl) was added to each well. Then cells and trypsin were incubated
0 g/ml 15 g/ml 50 g/ml
Bright
Field
Calcein

S13
for approximately ten minutes before formaldehyde (4%, 400 μl) was added to each well. The
cells were then collected and FACS analyses were performed on a BD Biosciences LSR II flow
cytometer (Franklin Lakes, NJ, USA). Data were analyzed using the FCS Express software
package (De Novo Software, Los Angeles, CA, USA). Transfections and uptake measurements
were performed in triplicate.
Figure S10. Phenotype of transfected and drug-treated H9 cells 48 hours post-transfection.
Confocal Microscopy.
DNA complexes were formed at the previously determined optimum transfection weight ratio as
described above. The intercalating dye YOYO-1 was added at the ratio 15 nl YOYO-1 per 1 μg
of DNA. COS-7 were cultured in DMEM supplemented with 10% horse serum and 1%
penicillin-streptomycin according to ATCC protocols and plated in 6-well plates containing
coverslips at 20 × 104 cells/well 24 h prior to transfection. Approximately 30 minutes before
transfection, the growth medium was replaced with fresh serum-free medium containing 20 M
nocodazole. At transfection time, PVBLG267-8/DNA complexes were added to the cells. Sixty
minutes post-transfection, the cells were rinsed with PBS (2 mL × 2) to remove surface-bound
complexes and formaldehyde (4%, 1 mL) was added to each well. Following a 10-min
incubation, the cells were rinsed with PBS (2 mL × 2) and mounted on glass slides. Cells were

S14
visualized with an Olympus BX60 confocal microscope equipped with a 100x oil immersion lens
with an Argon laser for visualizing YOYO-1 (λex=488).
The images obtained below in Figure S11 reveal that cells transfected in the presence of
nocodazole appear to show larger fluorescent aggregates as compared with cells transfected in
the absence of nocodazole. We believe this observation supports our assertion that nocodazole
treatment causes material to accumulate in endocytic vesicles.
Figure S11. Confocal micrograph of COS-7 cells transfected with YOYO-1 labeled DNA/ PVBLG267-8 complexes
in the presence or absence of nocodazole. The appearance of smaller and more diffuse punctate fluorescence in the
untreated cells (left column) as compared with the cells treated with nocodazole (right column) suggest that
nocodazole is causing complexes to accumulate in endocytic vesicles.
NMR Spectra of Select PVBLGn-X Polymers.
NMR spectra were recorded on a Varian UI400 MHz, a UI500NB MHz or a VXR-500 MHz
spectrometer. The 1H-NMR spectra for PVBLGn-1 through PVBLGn-9 are shown below. The
entire set of 31 side chains is not included for for the sake of brevity. However, this selection
presented below does include the spectra for the top 3 side chains.

S15
ppm (f1)0.01.02.03.04.05.06.07.08.0
0
50
100
a
b c
d
ef
k
h i&jm
a&f
g
h
i
j
k
m
b&cde
g
8 7 6 5 4 3 2 1ppm
D2O
0
Figure S12.
1H NMR of PVBLG40-1 in D2O.
Figure S13.
1H NMR of PVBLG40-2 in D2O.
ppm (f1) 1.02.03.04.05.06.07.08.09.0
0
500
1000
a&f c&b
k
e id h g
8 7 6 5 4 3 2 1ppm
D2O

S16
Figure S14. 1H NMR of PVBLG40-3 in D2O.
ppm (f1) 0.05.010.0
0
50
100
150
200
250
a&f&g c&be di h
8 7 6 5 4 3 2 1ppm 9
D2O
Figure S15.
1H NMR of PVBLG40-4 in D2O.
a&f&hc&b
e i
d g
ppm (f1) 1.02.03.04.05.06.07.08.0
0
100
200
300
400
500
600
700
800
8 7 6 5 4 3 2 1ppm
D2O
S17
ppm (f1) 5.010.0
0
50
100
150
a&fc&b
e
dg&hi
8 7 6 5 4 3 2 1ppm 9
D2O
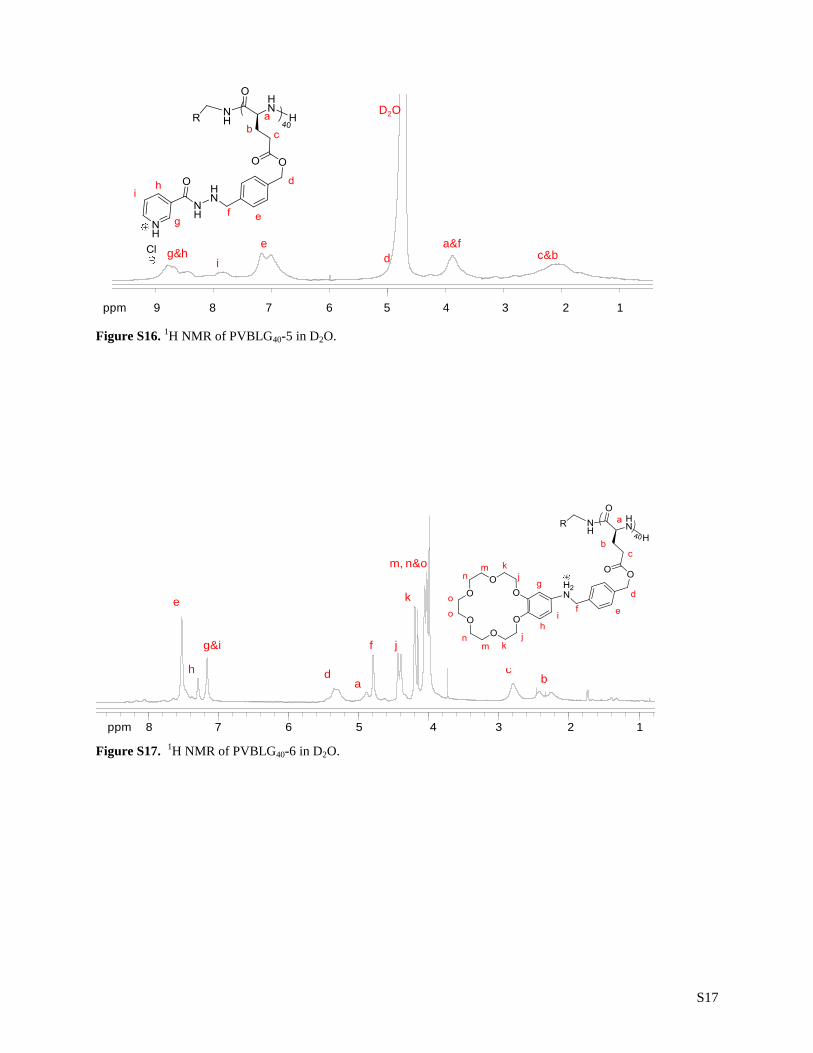
Figure S16. 1H NMR of PVBLG40-5 in D2O.
Figure S17. 1H NMR of PVBLG40-6 in D2O.
ppm (f1) 1.02.03.04.05.06.07.08.0
0
100
200
300
400
500
600
700
800
900
m, n&o
k
jg&i
h
e
c
f
ad b
8 7 6 5 4 3 2 1ppm

S18
ppm (f1) 1.02.03.04.05.06.07.08.09.0
0
500
1000
i, j, m&k
h
g
e
c
fa&f’d
be’
8 7 6 5 4 3 2 19ppm
Figure S18. 1H NMR of PVBLG40-7 in D2O.
Figure S19 1H NMR of PVBLG267-8 in TFA-d.

S19
Figure S20. 1H NMR of PVBLG267-9 in D2O.
References
(1) H. Lu, J. Wang, Y. Bai, J.W. Lang, S. Liu, Y. Lin, J. Cheng, Nat. Commun., 2011, 2, 206.
(2) A. J. Adler, N. J. Greenfield, G. D. Fasman, Methods Enzymol., 1973, 27, 675.
(3) N. J. Greenfield, Nat. Prot. 2006, 1, 2876.